
Economic and Environmental Aspects of Agriculture in the EU Countries


Institute of Economics and Finance, Warsaw University of Life Sciences, 166 Nowoursynowska St., 02-787 Warsaw, Poland
Energies 2021, 14(22), 7826; https://doi.org/10.3390/en14227826
Submission received: 22 October 2021
/
Revised: 15 November 2021
/
Accepted: 17 November 2021
/
Published: 22 November 2021
(This article belongs to the Special Issue Advances in Energy and Environmental Economics)
Abstract
:The analysis of the economic efficiency of agriculture has been the subject of numerous studies. An economically efficient agricultural sector is not always environmentally efficient. Agriculture is a large emitter of greenhouse gases. The Intergovernmental Panel on Climate Change states that food production and agriculture are responsible for 21–37% of total global CO2 emissions. Due to the comprehensive assessment of the agricultural efficiency, it is worthwhile to apply to its measurement an integrated approach based on economic, energy and environmental aspects. These aspects were the main reasons for undertaking this research. The purpose of the study was to determine the economic, energy and environmental efficiency of agriculture in the EU Member States in 2019. The environmental analyses relate to the period 1990–2019. A total of 26 member states of the European Union (excluding Malta and Luxembourg) were selected for research. The sources of materials were Eurostat and the European Environmental Agency. This study was based on the Data Envelopment Analysis method, and used the DEA model focused on minimizing inputs. The research also adopts energy productivity and greenhouse gas emission efficiency indicators. The DEA model features the following variables: one effect (value of agricultural production) and four inputs (land, labour, use of fertilizers and use of energy). It was found that seven out of the 26 studied EU countries have efficient agriculture. The efficient agriculture group included The Netherlands, Denmark, Greece, Cyprus, the United Kingdom, Italy and Ireland. Based on the DEA method, benchmarks have been defined for countries with inefficient agriculture. On the basis of these benchmarks for inefficient agricultural sectors, it was possible to determine how they could improve efficiency to achieve the same results with fewer inputs. This issue is particularly important in the context of sustainable agricultural development. In the next stage of the research, the analysis of economic and energy efficiency was combined with the analysis of GHG emission efficiency in agriculture. Four groups of countries have been distinguished: eco-efficiency leaders, eco-efficiency followers, environmental slackers, eco-efficiency laggards. The leaders of the classification were The Netherlands, Italy, Greece, Cyprus and Portugal.
1. Introduction
Agriculture is one of the most important sectors of the economy, as it plays a key role in food production and the conservation of natural resources. The economic and financial efficiency of farms, or agricultural sectors [1,2,3,4,5,6,7], has been a central focus of research to date. The World Bank [8] estimates indicate that cereal and meat production will increase by 50% and 85%, respectively, in response to increasing demand between 2000 and 2030. It can be expected that the growing agricultural production will increase energy intensity as well as the use of nitrogen, phosphorus and pesticides, which will cause numerous environmental problems, such as the loss of biodiversity, soil degradation and ecosystem pollution [9,10]. The Special Report on Climate Change and Land prepared by The Intergovernmental Panel on Climate Change states that food production and agriculture are responsible for emissions of 10.8 to 19.1 billion tonnes of CO2-equivalent, which is between 21% and 37% of total global CO2 emissions [11]. CO2 emissions from food production occur at various stages of the process. Crippa et al. [12] indicates that the land use generates 5.7 billion tonnes of CO2 equivalent, agricultural production emits 7.1 billion tonnes, the supply chain generates 3.1 billion tonnes, and post-retail processes (including consumer food preparation and garbage management) account for 2.1 billion tonnes. On the other hand, greenhouse gas (GHG) emissions causing climate change are also a growing problem for most areas of the world in providing adequate food production for the ever increasing world population, due to declining crop yields [13] and rising food prices [14].
Taking the above into account, not including environmental aspects in the economic calculation of agriculture leads to results contradictory to the rationality of management. Therefore, the economic-environmental effectiveness becomes more and more often the determinant of the directions of agricultural policy in the EU. Indeed, one of the main objectives of the Common Agricultural Policy (CAP) is to maintain a compromise between environmental and economic aspects of agricultural production [15]. The integration of environmental issues into agricultural practices has been reflected, among others, in the General Union Environment Action Programme to 2020 ‘Living well within the limits of our planet’ [16]. Decision makers, in order to make the right decisions and apply appropriate instruments in agriculture, report the need for new concepts and methodologies that will enable an integrated and comprehensive assessment of the economic and environmental performance of agriculture [17].
Therefore, there is a need for a new approach to the issues of efficiency in agriculture. Such an approach to the topic is in line with the global trend towards ecological economics and the conflict between the growing needs of the world’s population and dwindling natural resources. The efficiency of resource use will be decisive for meeting the needs of future generations. Therefore, there is a need for a comprehensive assessment of the effectiveness and environmental responsibility of the owners of economic units (enterprises and farms) in relation to the economic results obtained. One of the elements of the balance which must be taken into account is the effectiveness of resource use (including energy), as well as the emission of greenhouse gases and the effectiveness of this emission. The analysis of the relationship between the environment and economic performance makes it possible to formulate scientifically justified directives for development policies, public finance management and the issuance of decisions and permits [18].
The main objective of the paper is to determine the efficiency of agriculture in EU countries in a comprehensive and multidimensional way, i.e., taking into account economic, energy and environmental aspects by using a non-parametric Data Envelopment Analysis (DEA) method. The specific objectives include, (1) indicating which methods/techniques are used to assess the eco-efficiency of agriculture, (2) proposing changes in the level of inputs for inefficient agriculture in accordance with the idea of benchmarking, which could contribute to the improvement of efficiency. The research will verify the hypothesis that agriculture in EU countries with a higher level of economic and energy efficiency is characterised by a higher environmental efficiency.
The paper is structured as follows: Section 1 contains the introduction, Section 2 presents a literature review in the field of eco-efficiency measurement with a focus on studies of agriculture, and Section 3 expounds the main insights of the methodology. Section 4 provides the results of the empirical analysis and explains in detail the evolution of economic, energy and environmental efficiency of EU agriculture, Section 5 covers the discussion of the main findings, and Section 6 contains conclusions.
2. Literature Review
The analysis of economic and financial efficiency of agriculture has long been the subject of numerous studies. Efficiency was studied at the level of the whole agricultural sector [19,20], as well as at the level of plant and animal production holdings [2,6,21,22,23,24]. In the above-mentioned studies, technical and scale efficiency or inefficiency of the researched objects were determined, the sizes of production gaps were determined and rankings of the researched objects were made according to the efficiency. The economic-environmental efficiency, commonly known as eco-efficiency, emerged in the 1990s as a concept that allows a practical approach to sustainable development [25]. The concept was adopted and popularised by the World Business Council for Sustainable Development [26,27] as a way to encourage companies to be more responsible and environmentally friendly. The Organisation for Economic Co-operation and Development (OECD) [28] defines eco-efficiency as the efficiency of using ecological resources to meet human needs, which can be measured by indicators that link the value of the output of companies, industries or economies to the environmental impact caused by that output [29]. Accordingly, an increase in output for a given level of input, or a decrease in input use to produce a given level of output, leads to improved eco-efficiency.
Reinhard et al. [30], Greene [31], Simar and Wilson [32], Lauwers [33], studied the economic efficiency of agriculture in relation to environmental performance. The justification for the importance of the eco-efficiency research is the EU GHG emissions from agriculture. Between 1990 and 2019, the 28 member states of the European Union taken together recorded a significant (about 30%) overall decrease in GHG emissions (from 5,469,112 thousand tons to 3,816,107 thousand tons in CO2 equivalents)—Figure 1. The reduction in emissions of GHG was the result of, among others, increasing the use of renewable energy sources, implementing new, more efficient technologies, improving efficiency of productions and structural changes.
In turn, taking into account the agricultural sector in the EU, it was noted that GHG emissions decreased by 20% between 1990 and 2019 (74.3 million tons of CO2 equivalent).
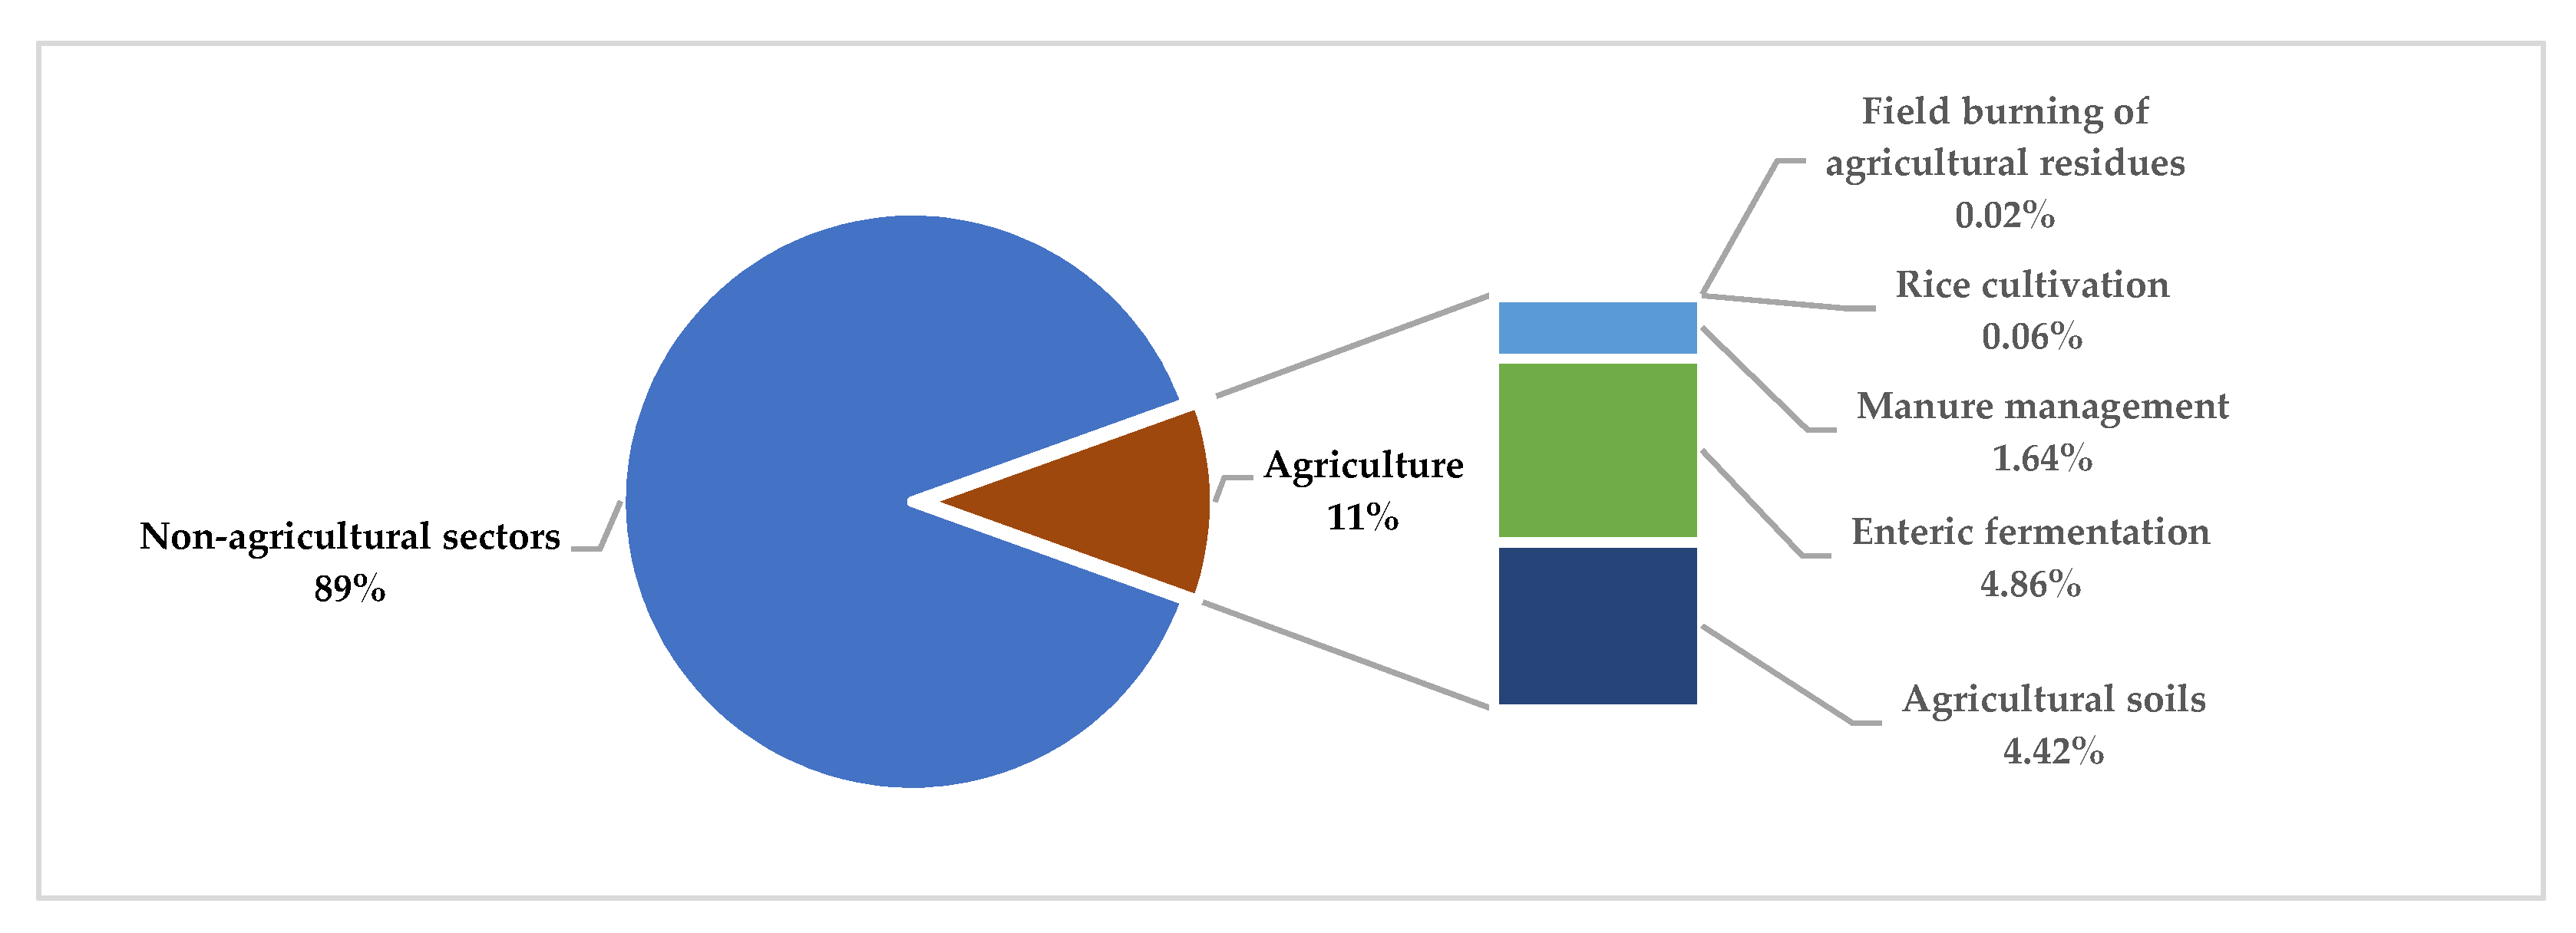
The reduction in agricultural emissions of GHG may, at least in part, be attributed to an overall reduction in livestock numbers, more efficient farming practices and reduced fertilization [34]. However, the main decrease in emissions occurred until 2012, after which GHG emissions started to increase slightly, amounting in 2019 to 427,602 thousand tons, which was caused by a significant increase in GHG contribution from fuels (Table 1). GHG emissions from agriculture include: CO2, N2O and CH4. These are the result of biological processes occurring on arable land, permanent grasslands and in animal digestive systems. The vast majority of the EU-28’s GHG emissions from agriculture came from one of three sources: enteric fermentation (accounting for about 1/2 of agricultural emissions), agricultural soils (about 40%) and manure management (about one seventh). The other sources of agricultural GHG—field burning of agricultural residues and rice cultivation—were only minor contributors at the EU-28 level (Figure 2).
Three approaches are most commonly used to monitor eco-efficiency. The first approach is the indicator approach that considers one indicator as the ratio of the production value to its environmental impact, or a more comprehensive approach that considers several indicators to which weights are assigned [35,36,37]. In practice, the most commonly used eco-efficiency indicators covering environmental and economic variables include, e.g., water consumption per unit of output in a given period, energy consumption per unit of output in a given period, CO2 or all greenhouse gas emissions converted into CO2 equivalent per unit of output in a given period, or the amount of waste generated per unit of output. The added value is also frequently used instead of value or volume of production [38]. Simple indicators based on the relationship of environmental variables are most often used in the process of monitoring certain phenomena, while more complex measures are used in the case of seeking and selecting optimal solutions from available alternatives [39]. The aggregation of simple indicators measured using different physical, chemical or biological measurement units requires, among other things, their normalisation and/or standardisation [40].
The second approach to determining eco-efficiency is based on the LCA method (Life Cycle Assessment). The assessment of environmental impacts carried out with the use of LCA is more comprehensive but also more complex, which significantly limits the possibilities of its application. The origin of the use of LCA elements in the assessment of eco-efficiency is connected with the methodology proposed in 1996 by the BASF company [41,42]. Moreover, the LCA method was widely used in the normalisation of environmental management systems [43]. The LCA method is characterised by great flexibility in terms of possible areas of application: it can be a tool used both on a macro scale (sectoral analyses, the use in the sphere of shaping public policies) and on a micro scale (analyses at the level of a single production unit) [44]. One of the stages of LCA analysis is the Life Cycle Inventory—LCI, which consists of recording all the inputs and outputs arising in the production cycle (products and the accompanying pollution). Thus, LCA analyses are aimed at identifying and assessing the environmental impact of a given product at all stages of its life cycle, including the acquisition of raw materials, production, transport, consumption and recycling [45]. The LCA is a quantitative method involving the analysis of inputs and externalities generated throughout the life cycle of a product or production process, often referred to as cradle-to-grave analysis. The environmental impacts considered in the assessment may include, for example, the impact of the product (process) on climate change, acidification, eutrophication, dust, etc., which result from the consumption (processing) of energy and raw materials [46]. A limitation of this method is that it does not include an assessment of economic efficiency [47].
For practical reasons, numerous studies have sought a synthetic index for the assessment of eco-efficiency. Non-parametric methods, including Stochastic Frontier Analysis (SFA) and Data Envelopment Analysis (DEA) [29,38,48,49,50,51,52,53,54,55], are an alternative or supplement to the indicator analysis methods or LCA. The DEA method allows the study of the relationship of multiple inputs and outputs without first assigning weights to them [48,49]. The conventionally applied DEA method allows evaluation of the efficiency of individual economic units by taking into account only market inputs and production effects; however, the growing popularity of this approach has led to its modification by including environmental variables in the analysis [29]. The DEA method makes it possible to determine the productivity frontier, which enables the relationship between economic effects and inputs to be examined under the assumption that pollution emissions are perceived as undesirable inputs. This productivity frontier is used to model the relationship between economic and ecological outcomes in order to achieve environmental performance [29,33,55,56,57]. LCA focuses on assessing the environmental impacts of agricultural products and practices. In contrast, the DEA method is mainly used to measure the eco-efficiency of decision-making units, such as farms, agricultural sectors or countries [58]. DEA and SFA methods have been used in researchers works include Reinhard et al. [30], Kuosmanen and Kortelainen [38], Callens and Tyteca [55], Pacini et al. [59], Reinhard and Thijssen [60], Vand der Werf and Petit [61], Abay and Assefa [62], Alene et al. [21], Hoang and Alauddin [63], Hoang and Coelli [64] Asmild and Hougaard [65].
It is worth noting that the DEA method is often used to measure the eco-efficiency of agricultural production in combination with LCA [15,66,67,68,69,70,71,72,73]. Based on the LCA and DEA approach, Iribarren et al. [67] analysed dairy farms in Spain and confirmed that eco-efficient farms achieve up to 40% higher profits. Dairy farms were also studied by Basset-Mens C. et al. [74]. The authors found that the dairy farm intensification in New Zealand worsened the eco-efficiency of milk production. Eco-efficiency in dairying was also analysed by Jan et al. [52]. The authors confirmed a significant positive relationship between economic and environmental performance of dairy farms in Switzerland.
Mouron et al. [75] studied apple orchards in Switzerland and found a significant correlation between apple variety choice and pre-harvest labour inputs, as well as eco-efficiency and high farm income. Gomez-Limoni et al. [51] analysed olive cultivation in Andalusia. They confirmed that the most ecologically efficient production system is the traditional cultivation system. Climatic conditions significantly influence the eco-efficiency of management. Viticulture in northwestern Spain was studied by Vazquez-Rowe et al. [68]. Efficient (according to the LCA + DEA method) viticulture practices save €0.14 per 1.1 kg of grapes that produce a 0.75 L bottle of wine. In turn, grape cultivation in Iran was analyzed by Mohsemi et al. [69]. According to the authors’ study, more than 20% of the studied vineyards operate eco-efficiently (according to LCA + DEA methodology). Reducing farmers’ input consumption leads to higher operational efficiency, lower costs and less environmental impact. Masuda [70], on the other hand, showed that eco-efficient wheat production in Japan can occur under both good and bad conditions through appropriate application of nitrogen fertilizer. To improve the eco-efficiency of production, the excessive use of nitrogen fertilizers should be reduced. In contrast, the research by Ullah et al. [71] found that the production of 1 kg of cotton in Pakistan generates a greenhouse effect potential of 3–3.4 kg CO2 equivalents and requires 5–6 L of water. Forleo et al. [76] compared the eco-efficiency of rapeseed and sunflower production. The results of the eco-efficiency analysis indicated a better relationship of added value per kg of GHG emitted to the atmosphere for rapeseed than for sunflower.
Mohammadi et al. [72] analysed 94 soybean farms in Iran. A Global Warming Potential reduction of 11% was estimated for the entire study sample. The results also confirmed that farms that burned crop residues in the field generated significantly more GHG than other farms. Mohammadi et al. [73] also analysed the eco-efficiency of rice cultivation.
There are also eco-efficiency studies that take into account approaches other than those mentioned above, these include: Carbon Footprint (CF), Balance Scorecard (BSC), Cost-Benefit Analysis (CBA), Contingent Valuation (CV) [58], material balance [29,33,56,64,77,78,79,80,81], Material Intensity Analysis (MAIA), Material Flow Analysis (MFA), Product Sustainability Index (PSI), Factor X [82].
Most studies analyse eco-efficiency for single crops or production processes at the level of farms, e.g., dairy [52,68,74,83,84], cereal [9,70,72,85,86,87] or pig farms [77,88]. Some studies analyze eco-efficiency depending on the production scale of farms [89,90] or farm ownership [91]. A smaller number of publications concern studies at the level of regions or countries [92,93,94,95,96,97]. Thus, a lack of studies evaluating eco-efficiency of agriculture at regional or national level is observed.
This article therefore fills a research gap. Firstly, the conducted research concerns the whole agricultural sector in individual EU countries. Secondly, the DEA method takes into account the energy consumption on the input side, therefore it was concluded that the DEA method assesses the economic and energy efficiency of agriculture in the EU countries. In the last stage of the research, the economic and energy efficiency was compared with the indicator of the environmental performance of agriculture (GVA/GHG emissions). This approach allowed a comprehensive and multidimensional assessment of the agriculture efficiency of the EU countries, taking into account the economic, energy and environmental aspects, which was not found in the literature review studies. Moreover, on the basis of the obtained research results, a recommendation is made as to how much each country should reduce the consumption of inputs (labour, land, fertilisers, energy) in order to be recognised as efficient. This guidance can be important for policy makers at the national and the EU level.
3. Materials and Methods
The source material for the research was data on agriculture in individual EU member states. A total of 26 member states of the European Union were selected for research. The sources of materials were the literature on the subject and data from the Economic Accounts for Agriculture in the Eurostat and European Environmental Agency (EEA). Economic data was from 2019 and environmental data from 1990–2019. The set of diagnostic variables is as follows:
- value of agricultural production (million EUR)—the value of everything that the EU’s agricultural industry produced;
- gross value added of agriculture (million EUR)—variable is the net output of a sector after adding up all outputs and subtracting intermediate inputs;
- an area of agricultural land (thousand ha);
- employment in agriculture (thousand Annual Work Unit);
- NPK fertilizers consumption by agriculture (t);
- energy consumption by agriculture (thousand toe)—variable relates only to the direct use of energy (solid fuels, petroleum products, gas, electricity, renewables, heat) by agriculture. The variable does not include indirect energy consumption;
- greenhouse gas emissions by agriculture (emissions are expressed in terms of carbon dioxide equivalents—thousand tonnes of CO2 equivalents)—each country estimates greenhouse gas emissions by measuring the volume of specific activities (for example, livestock numbers or agricultural practices) and multiplying these by associated emission factors. Agricultural emissions of greenhouse gases do not include those from fossil fuel combustion arising from agricultural-related processes such as transport, greenhouse heating or grain drying; these sources are inventoried under the energy section of the Intergovernmental Panel on Climate Change (IPCC).
The objects for the research were selected in a purposive manner. The research sample consisted of agricultural sectors from individual European Union countries, taking into account criterion 1, that the country was a member of the EU in 2019, and criterion 2, that the data on agriculture in the country were complete. As a result of the adopted criteria, 26 of the 28 member states remained. Malta and Luxembourg were eliminated from the research sample after applying the criterion of data completeness. It is worth noting that the share of Malta’s and Luxembourg’s agricultural output value in the total EU agricultural output is 0.13% together, which means that they are countries of negligible importance for the EU agriculture.
The Pearson correlation coefficient was used in the study. For a correlation between variables x and y, the formula for calculating the sample Pearson’s correlation coefficient is given by:
where: xi and yi are the values of x and y for the i-th individual.
Indicator and non-parametric approaches were used to evaluate agriculture efficiency. Labor productivity, land productivity, energy productivity and greenhouse gas emission efficiency of agriculture were calculated. Energy productivity in agriculture was calculated as [98]:
where:
Productivity of energy consumption = GVA/E
- GVA—gross value added of agriculture (million EUR),
- E—energy consumption in agriculture (thousand toe).
The greenhouse gas emission efficiency was calculated according to the definition of Schmidheiny and Zorraquin [99] as:
where:
Efficiency of GHG emission = GVA/GHG emission
- GVA—gross value added of agriculture (million EUR),
- GHG emission—greenhouse gas emissions by agriculture (thousand tonnes).
The Data Envelopment Analysis (DEA) method was used to measure agricultural efficiency. For calculating the DEA method, DEA ProSolver 14 was used. The Data Envelopment Analysis method is classified as a non-parametric efficiency research method, where, having s-effects and m-inputs, the efficiency can be calculated from the formula [100]:
where:
- s—number of effects,
- m—number of inputs,
- yr—the size of the rth effect,
- xi—the size of the ith input,
- μr—weights determining the importance of individual effects,
- υi—weights determining the importance of individual inputs.
In the DEA method, the objects of analysis are the so-called Decision Making Units (DMUs). In this paper, the decision-making units are the agricultural sectors in particular EU countries. In the above-mentioned linear programming task, the optimised variables are weights μr and vi of effects and inputs, and the values of effects and inputs are empirical data. An object is considered efficient if the effectiveness indicator is 1, which means that there is no more favourable combination of inputs that would allow the object to achieve the same results. On the other hand, if the efficiency ratio is <1, it means that there is a more efficient combination of inputs which allows the achievement of the same effects, therefore the given object is inefficient.
In standard DEA models, the efficiency index of objects is limited to 1. However, the number of efficient objects identified by DEA can be relatively high, especially if a small number of DMUs are studied. For this purpose, super-efficiency DEA models are used to diversify and rank effective units. In these models, the index of efficient units can be higher than 1.
In the DEA method, two objective functions can be distinguished: maximization of effects for the given inputs or minimization of inputs for the given effects [101]. The objective of the effect-oriented model (output-oriented model) is to maximise the effects while keeping the inputs unchanged. The objective of the input-oriented DEA model (input-oriented model) is to minimise the input of the object while keeping at least the same amount of the obtained effects. Taking into account the type of scale effects, the following are distinguished: the Charnes–Cooper–Rhodes (CCR) model with constant returns to scale (CRS) and the Banker–Charnes–Cooper (BCC) model with variable returns to scale (VRS) [102,103].
In the DEA method, the optimum technology can be determined for an inefficient object, which is determined on the basis of the technology of objects with the highest relative efficiency in the studied group. The optimal technology is determined based on the formula [104]:
where:
- —the optimal technology for the o-th object,
- tj—the empirical technology of the j-th object,
- λoj—the share of the technology of the j-th object in the optimal technology for the o-th object.
4. Results
4.1. Economic and Energy Efficiency of Agriculture in EU Countries
The economic accounts for agriculture show that the average value added in the agricultural sector based on 27 countries was 2.09% of GDP in the EU in 2019. The highest value was in Romania (4.13%) and the lowest value was in Luxembourg (0.23%). Employment in agriculture was 4.67% of total employment in the EU. The highest value was in Romania (21.24%) and the lowest value was in Luxembourg (0.68%) (Table 2). When analysing the value of EU agricultural production, it can be concluded that 80% of it is generated by the agriculture of ten countries: France, Germany, Italy, Spain, The Netherlands, Poland, Romania, Greece and Denmark. From the point of view of a country’s economy, as well as individual farmers, it is important how efficiently the factors of production are used to generate the agricultural output of a given country or a given farm. Are the countries and/or farms that generate the highest production also the most efficient in terms of converting inputs into outputs?
In order to evaluate and compare economic sectors including agriculture in various countries, traditional indicators are often used, i.e., labour productivity or land productivity [7,20,105] (Table 3). Attention is also more and more often paid to the efficiency of energy use [98,106]. EU agriculture is characterised by substantial variation in labour productivity and land productivity. The highest labour productivity in 2019 was achieved by agriculture in Denmark, The Netherlands, Belgium and Germany. Taking land productivity into account, in turn, countries such as Cyprus and Italy, would also join the group of leaders. The ranking according to energy productivity in agriculture looks completely different (Table 3). The first positions are held by Greece, Romania and Ireland. This indicates that agriculture in these countries is more energy-efficient than the agriculture of the EU as a whole, which may be related to a more extensive agricultural production and lower production costs, which leads to the higher GVA.
Productivity and efficiency indicators are therefore simple to apply; however, they are one-dimensional, i.e., they capture the relationship of only one output (e.g., sales revenues, income) and only one input (e.g., labour force, utilised agricultural area, energy consumed), and therefore assess only a part of the area of activity of a given economic sector. In order to assess the economic sectors comprehensively, it is necessary to compile several one-dimensional indicators or combine them into groups. However, the large number of indicators may hinder the overall assessment of the agricultural sector. In addition, these indicators may give divergent information about the efficiency of the sector. For example, when comparing the agriculture of EU countries by labour productivity, land productivity and energy productivity (Table 3), the agriculture of some countries is characterised by an average land productivity, although it has a better labour factor productivity and energy productivity than others (see, e.g., France, Table 3). On the other hand, the agriculture of Romania, for instance, has a low labour and land productivity but a high energy productivity. This raises the problem of assessing which of the examined countries has higher efficiency of agriculture: does a higher labour productivity or a higher energy productivity compensate for a lower land productivity?
Taking into account that the effectiveness of the agricultural sector is a complex economic phenomenon, it is worthwhile to apply to its assessment an integrated approach based on various methods which complement each other and help to better understand and explain the situation of agricultural productivity. Additionally, it is advisable to use multidimensional methods that take into account more than just the relationship of one effect and one input. To this end, the DEA method, an input-oriented CCR model and super-efficiency model, was used to determine the efficiency of agriculture in individual member states, in addition to traditional indices of efficiency and productivity. The model orientation towards input minimization was adopted, as in the light of the environmental policy legislation in force in the EU and the propagated principles of sustainable development, it is assumed, among other things, that the only current development option for EU agriculture is an increase in agricultural production through innovation and input deintensification. The following variables were assumed for the calculated model, based on the literature review:
- output y1—value of agricultural production (million EUR);
- input x1—an area of agricultural land (thousand ha);
- input x2—employment in agriculture (thousand AWU);
- input x3—NPK fertilizers consumption by agriculture (t);
- input x4—energy consumption by agriculture (thousand toe).
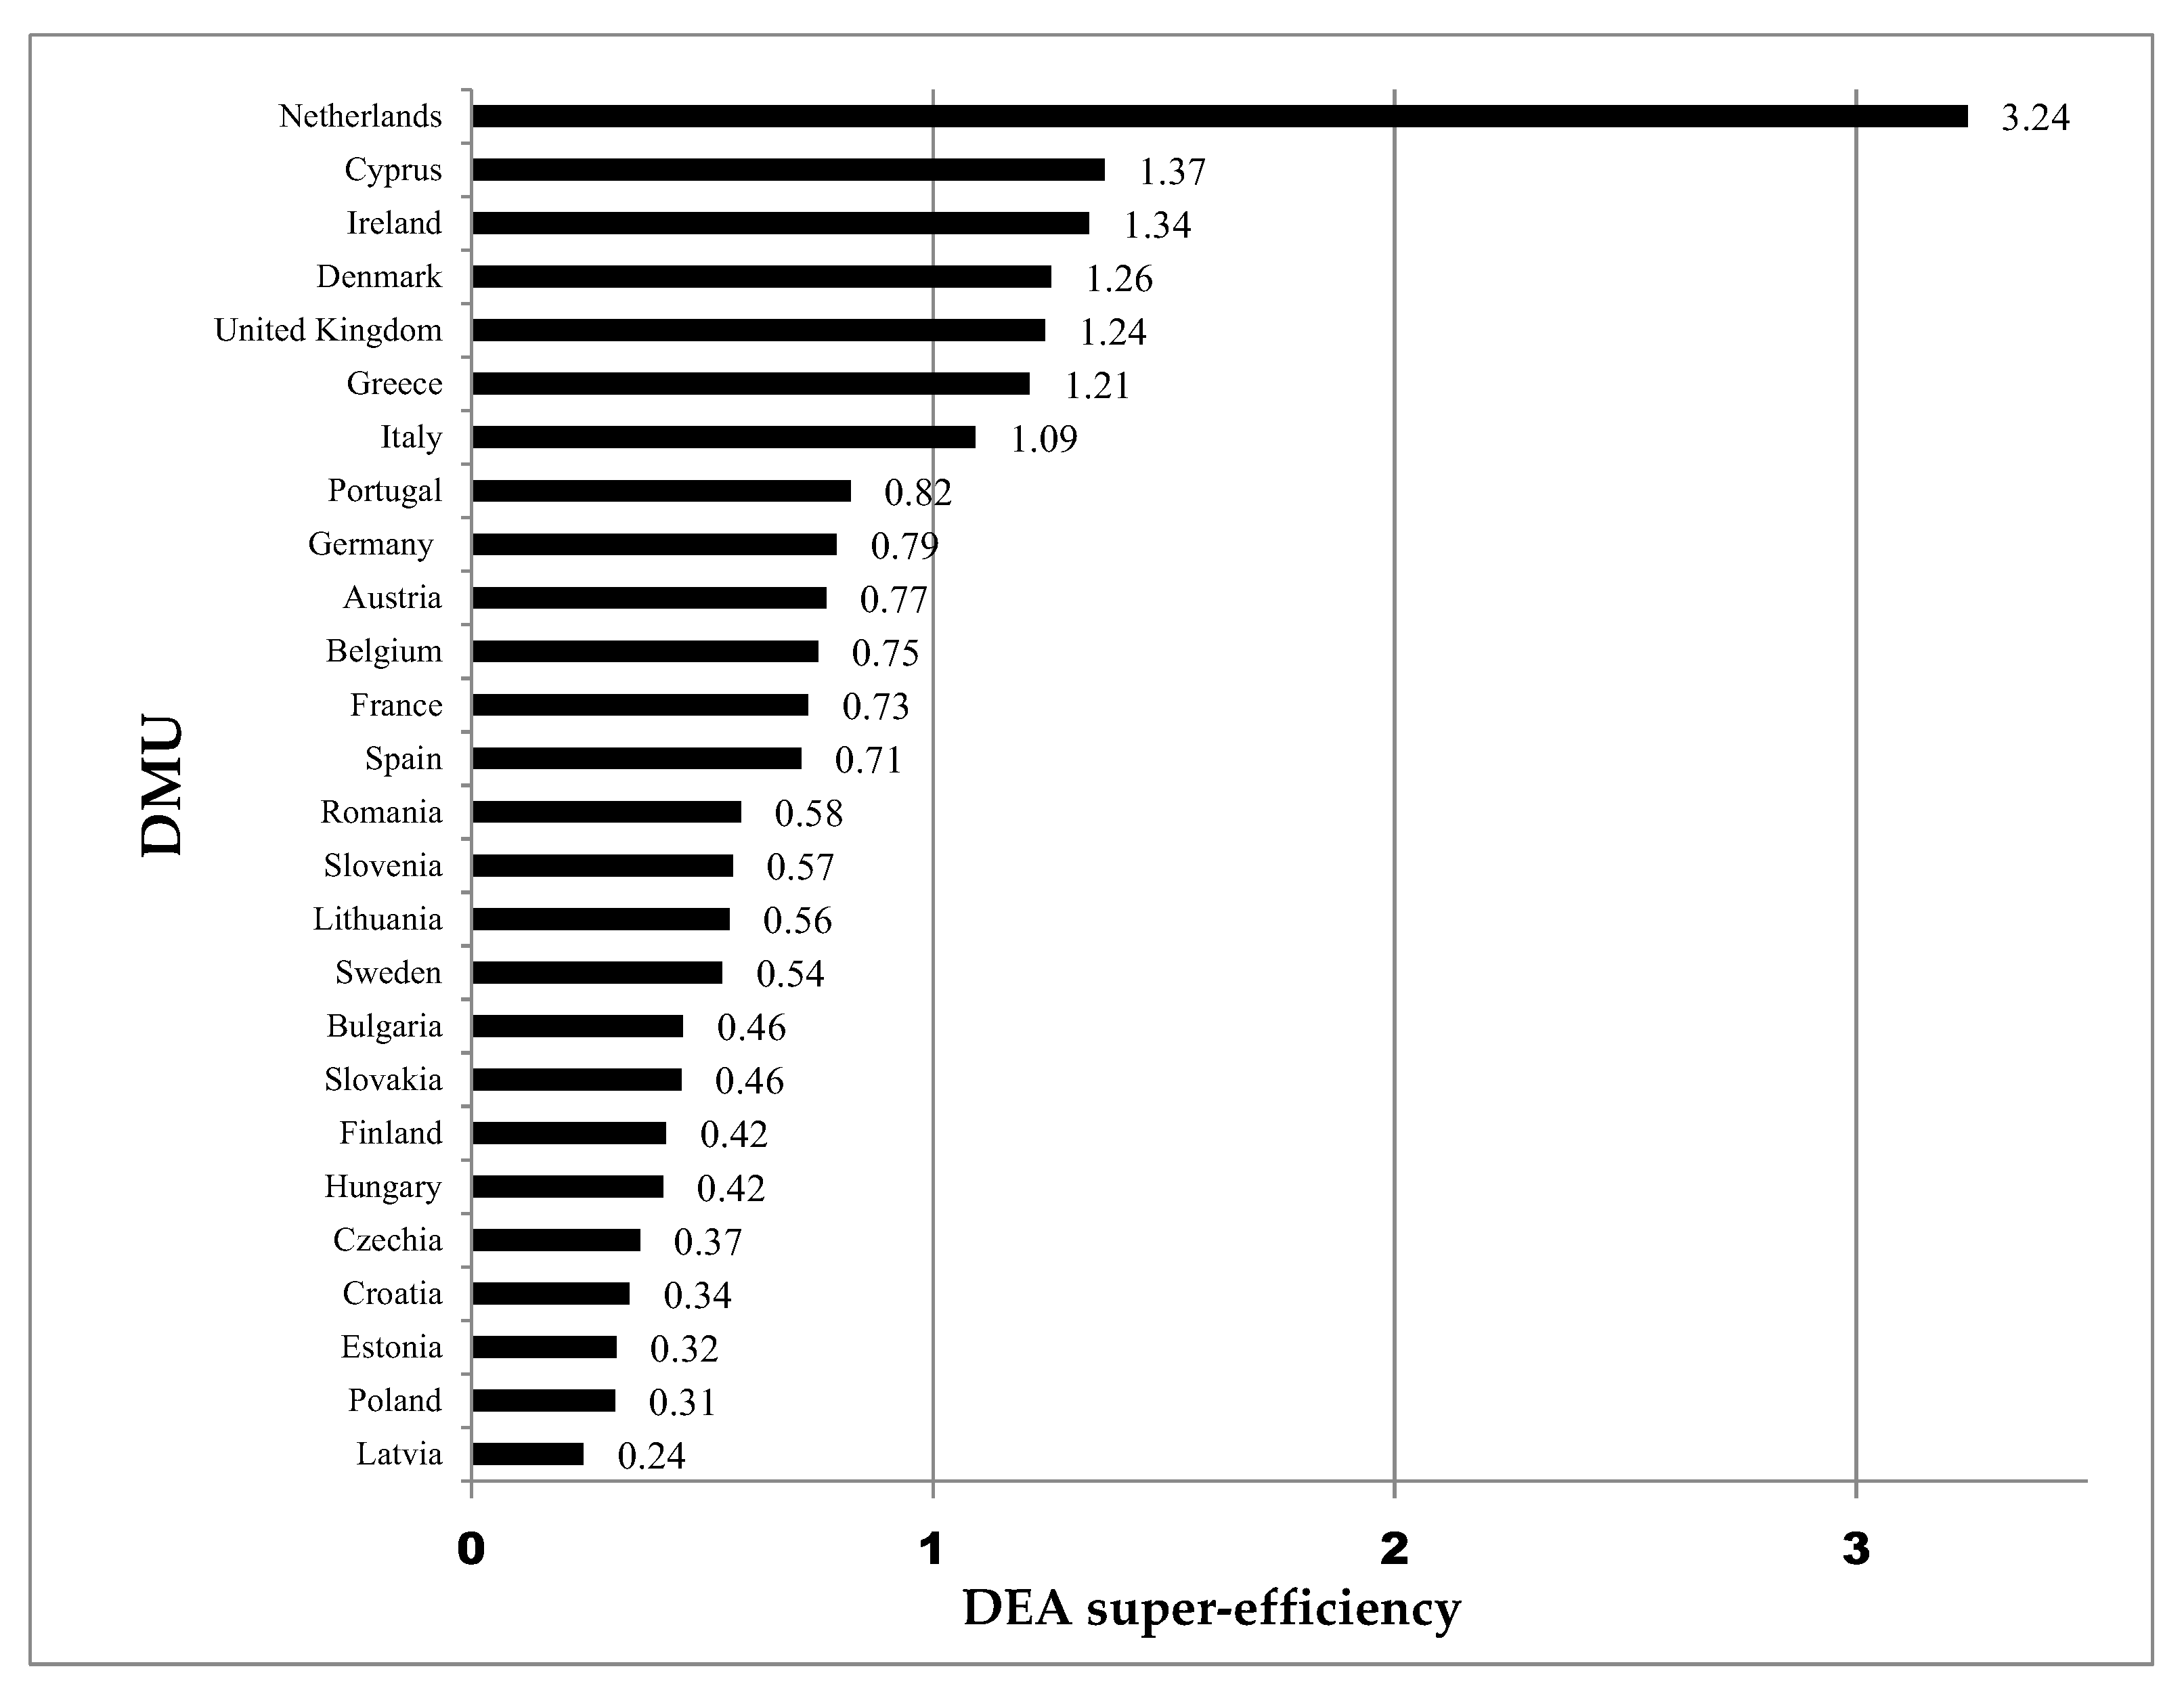
Thus, this stage of the research determined the level of economic-energy efficiency of agriculture in each country in 2019, and created a ranking of countries according to this synthetic indicator of efficiency of agriculture. The average economic-energy efficiency of agriculture in the EU in 2019 was at a fairly high level, with a DEA efficiency index of 0.76. Seven agricultural sectors out of the twenty-six surveyed were considered fully efficient, as their efficiency index was 1. The group of efficient objects included agricultural sectors from: The Netherlands, Denmark, Greece, Cyprus, the United Kingdom, Italy and Ireland (Figure 3).
In the second stage of research, the super-efficiency DEA model was applied for efficient objects, and it was indicated in which countries recognised as leaders the agriculture most efficiently converted inputs into outputs. As a result of these calculations, agricultural effectiveness indices for seven countries (leaders) were in the range from 1.09 to 3.24. Dutch agriculture had a definite advantage over the remaining EU states (super-efficiency DEA index amounted to 3.24—see Figure 3).
Next, based on the DEA method, optimal technologies were identified for inefficient agricultural sectors in particular countries, which would enable an improvement in efficiency. In line with the idea of benchmarking, efficiency benchmarks were identified for countries with inefficient agriculture. On the basis of these benchmarks for inefficient countries, a combination of technologies was determined, which would allow the same effects to be achieved with fewer inputs. The calculations were based on the values of the coefficients of the linear combination of common technologies, λ (Table 4).
For example, for Belgian agriculture, a combination of 36% Danish agricultural technology, 43% Cypriot agricultural technology and 15% Dutch agricultural technology is optimal. The agricultural sectors in Denmark, Cyprus and The Netherlands (fully efficient) became the benchmarks for inefficient agriculture in Belgium. In other words, for Belgian agriculture to become efficient, it should construct its technology along the lines of agriculture in the benchmark regions. Belgian agriculture would be considered efficient if it achieved the 2019 value of agricultural output by making changes in the inputs used: it should reduce the labour and energy resources used, and the area of agricultural land by 7%, while the use of fertilisers should decrease by 62%. Potential changes that should take place in terms of agricultural inputs in individual EU countries are presented in Table 5. The results in Table 5 suggest that inefficient agriculture in individual EU countries should achieve the current size of its effects (agricultural output value) using less inputs (less utilised agricultural area, number of people working in agriculture, fertiliser and energy consumption), which would allow them to improve their economic and energy efficiencies and position in ranking. However, the limitations of the DEA method should be taken into account when we analyze the obtained results.
The DEA method has the following limitations:
- It is a deterministic technique that is particularly sensitive to measurement error (input and output specification and sample size).
- It only measures efficiency relative to best practices within a particular sample, and so comparisons of scores between different studies are not meaningful.
- It can be successfully used to estimate the relative efficiency of a DMU, but it converges very slowly to absolute efficiency.
- Being nonparametric, it is difficult to apply it to test statistical hypotheses, which is the focus of ongoing research.
- The DEA model ignores the influence of environmental factors. Efficiency estimation of DMU is applied to a closed system.
4.2. The Eco-Efficiency of EU Agriculture
Assuming a comprehensive approach to studying the efficiency of agriculture, taking into account economic, energy and environmental aspects, in the next stage of the research we calculated the efficiency of greenhouse gas emissions from agriculture in individual countries in 2010 and 2019 (Table 6). The average emission efficiency of EU agriculture was 358 EUR GVA per 1 ton of GHG emissions in 2019. Countries such as Italy, Greece and Cyprus had the highest efficiency. The worst results in this respect were from Ireland, Latvia and the Czech Republic, with the latter having a result almost seven times lower than the leaders. Moreover, only seven countries (Italy, Greece, Cyprus, Croatia, France, Germany, Belgium) saw an improvement in their emission performance index between 2 and 12% from 2010 to 2019. It was also noted that countries with high GHG emission efficiency were characterised by high energy productivity indicators (Table 3). These included Greece, Italy and Spain.
Correlation analysis confirmed that there is a statistically significant correlation between energy productivity and emission efficiency (Pearson correlation coefficient = 0.46). The obtained results indicate a correlation between the efficiency of the use of inputs, including energy, and the effectiveness of GHG emissions. This is also confirmed by the positive correlation between the economic and energy efficiency calculated with the DEA method and the GHG efficiency, where the correlation index was at the level of 0.41 (Table 7). This confirms the research hypothesis that agriculture in EU countries with a higher level of economic and energy efficiency is characterised by a higher environmental efficiency.
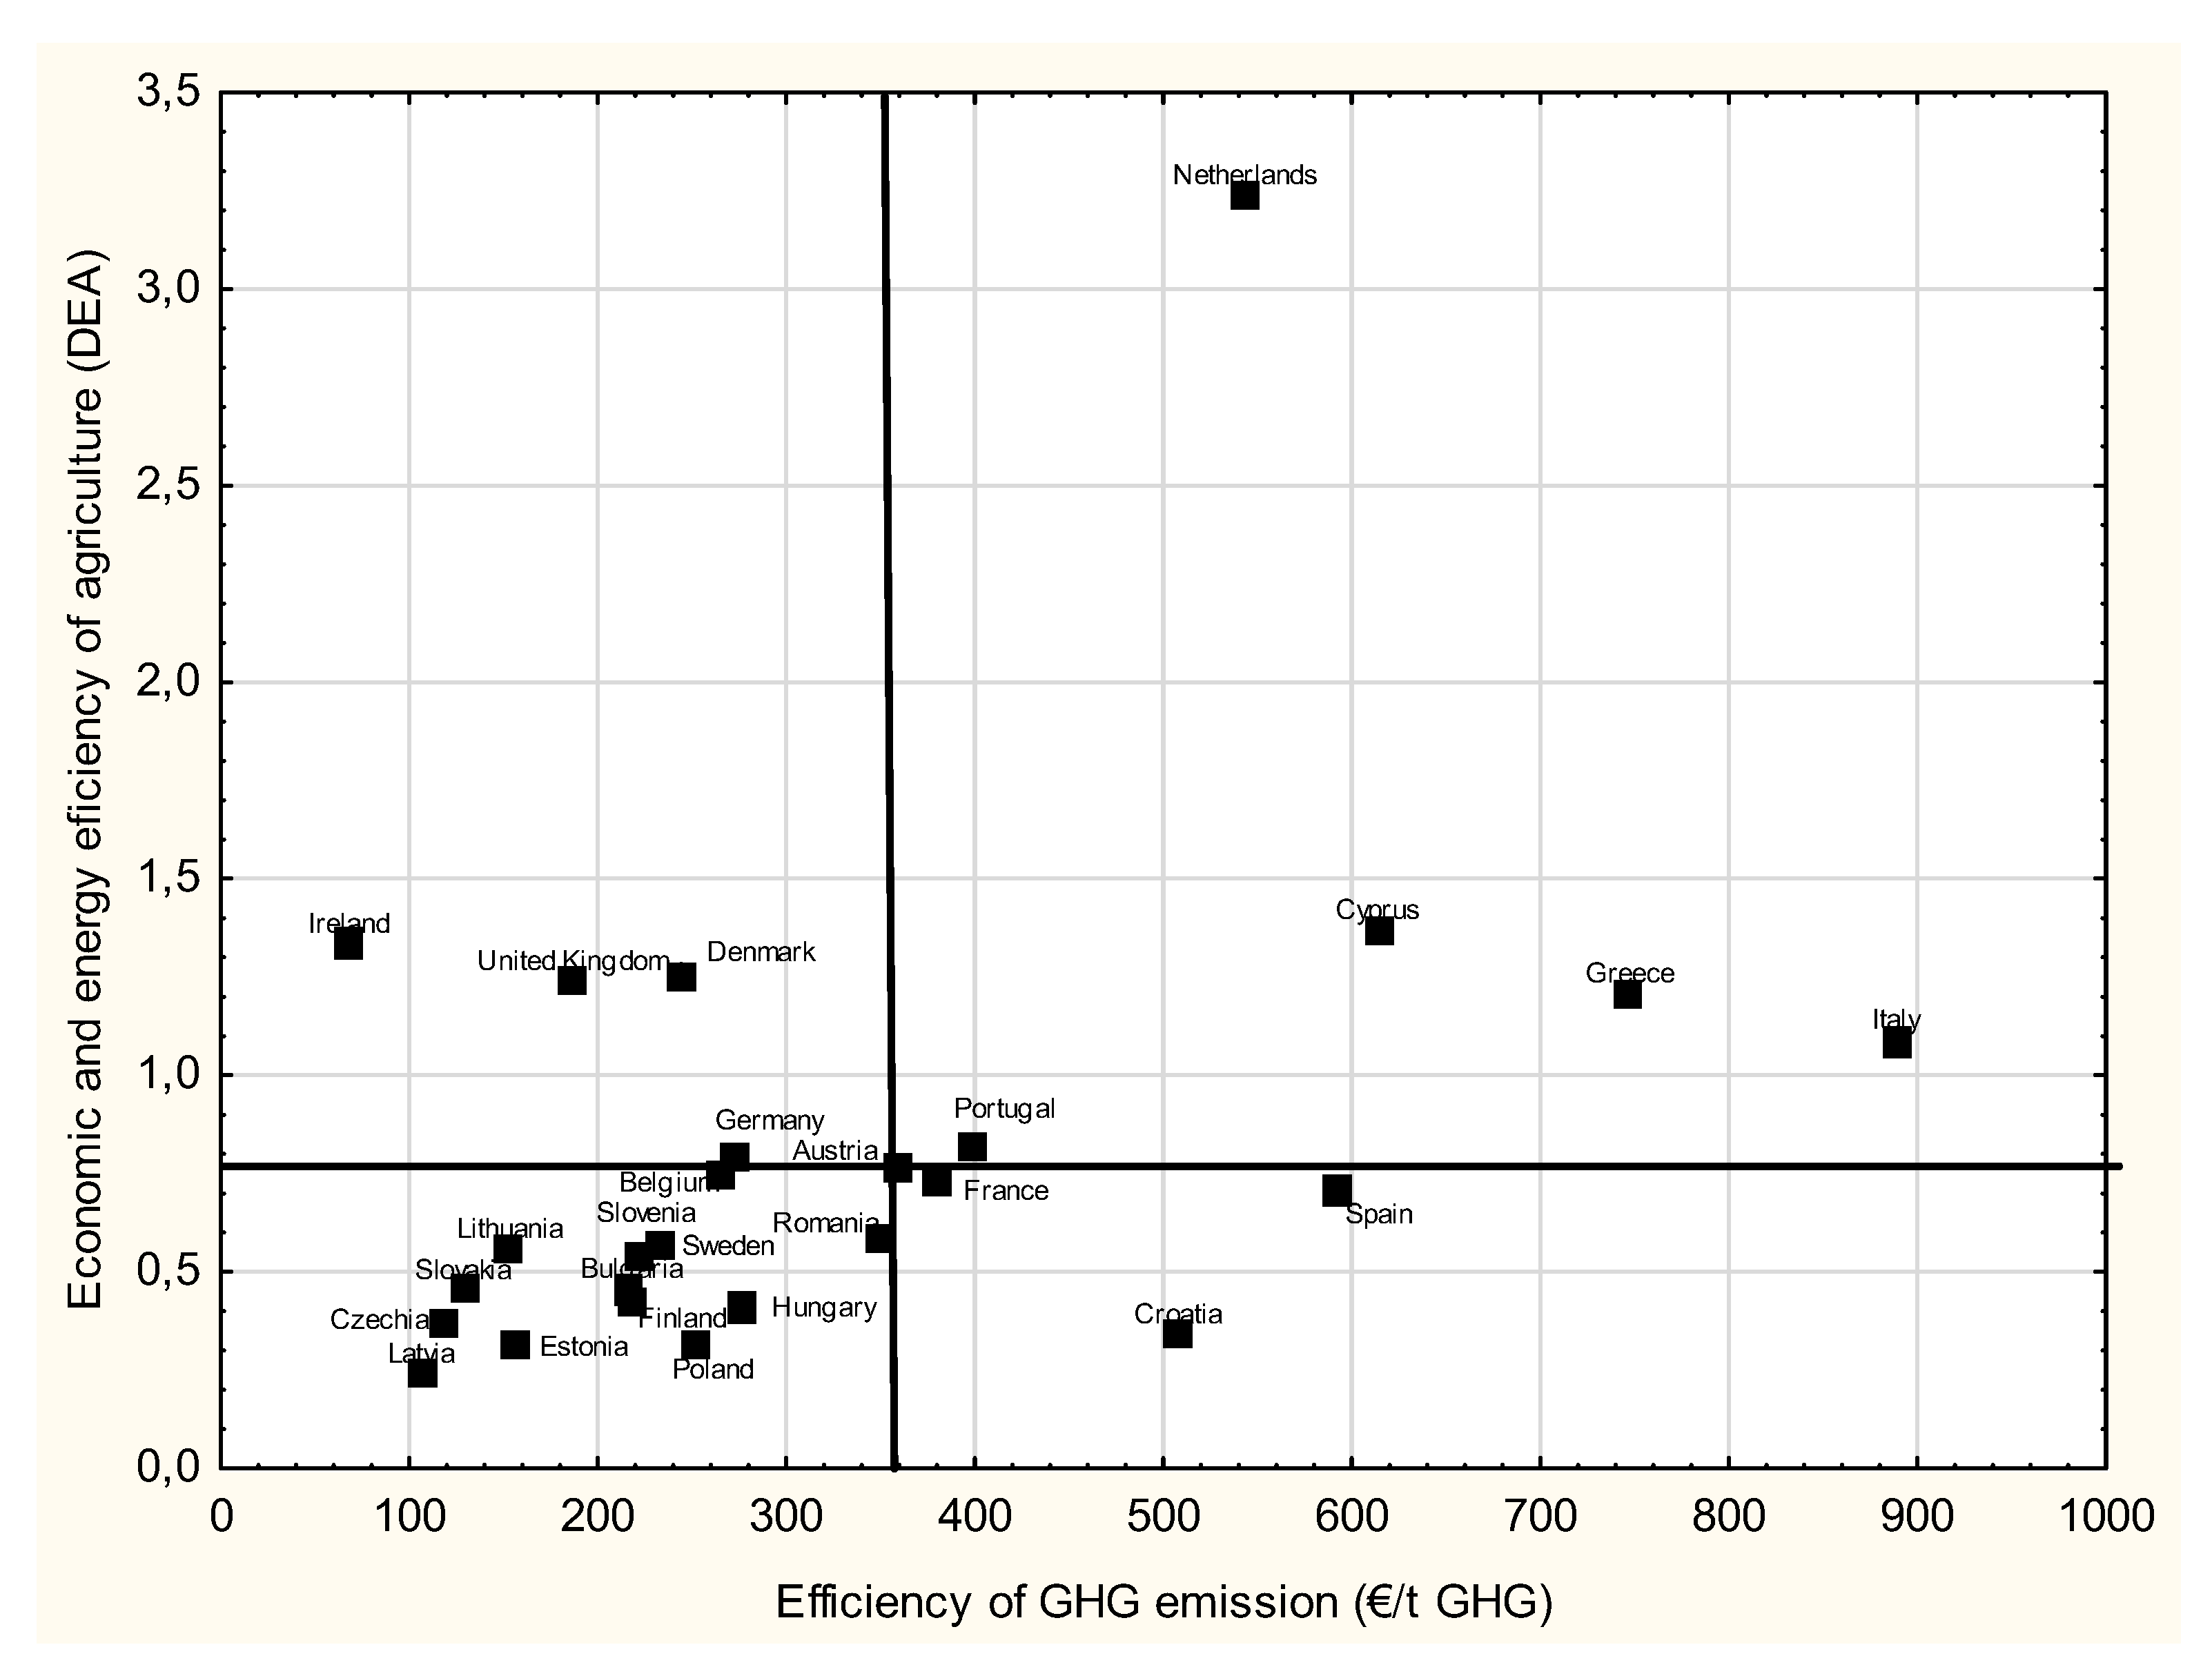
The analysis shows that there is a diversity in eco-efficiency among the agriculture of EU countries. In order to comprehensively capture the economic-energy-environmental aspects of agricultural efficiency, the studied agricultural sectors were categorised into four groups according to economic and energy efficiency based on the DEA method and efficiency of GHG emissions (Figure 4 and Figure 5):
- Eco-efficiency leaders—a group that includes countries with economic and energy efficiency of agriculture higher than the EU average, and higher than average greenhouse gas emission efficiency (Italy, Greece, Cyprus, The Netherlands, Portugal);
- Eco-efficiency followers—countries distinguished by greenhouse gas emission efficiency higher than the EU average but economic and energy efficiency of agriculture slightly lower than the EU average (Spain, Croatia, France, Austria);
- Environmental slackers—a group of countries distinguished by economic and energy efficiency of agriculture higher than the EU average, but greenhouse gas emission efficiency lower than EU average (Ireland, United Kingdom, Denmark, Germany);
- Eco-efficiency laggards—a group of countries with economic and energy efficiency of agriculture lower than the EU average and greenhouse gas emission efficiency lower than average (Poland, Latvia, Estonia, Czechia, Hungary, Finland, Slovakia, Bulgaria, Sweden, Lithuania, Slovenia, Belgium, Romania).
Figure 4.
Economic, energy and environmental efficiency of agriculture in EU (2019). Source: author’s own calculations.
Figure 4.
Economic, energy and environmental efficiency of agriculture in EU (2019). Source: author’s own calculations.

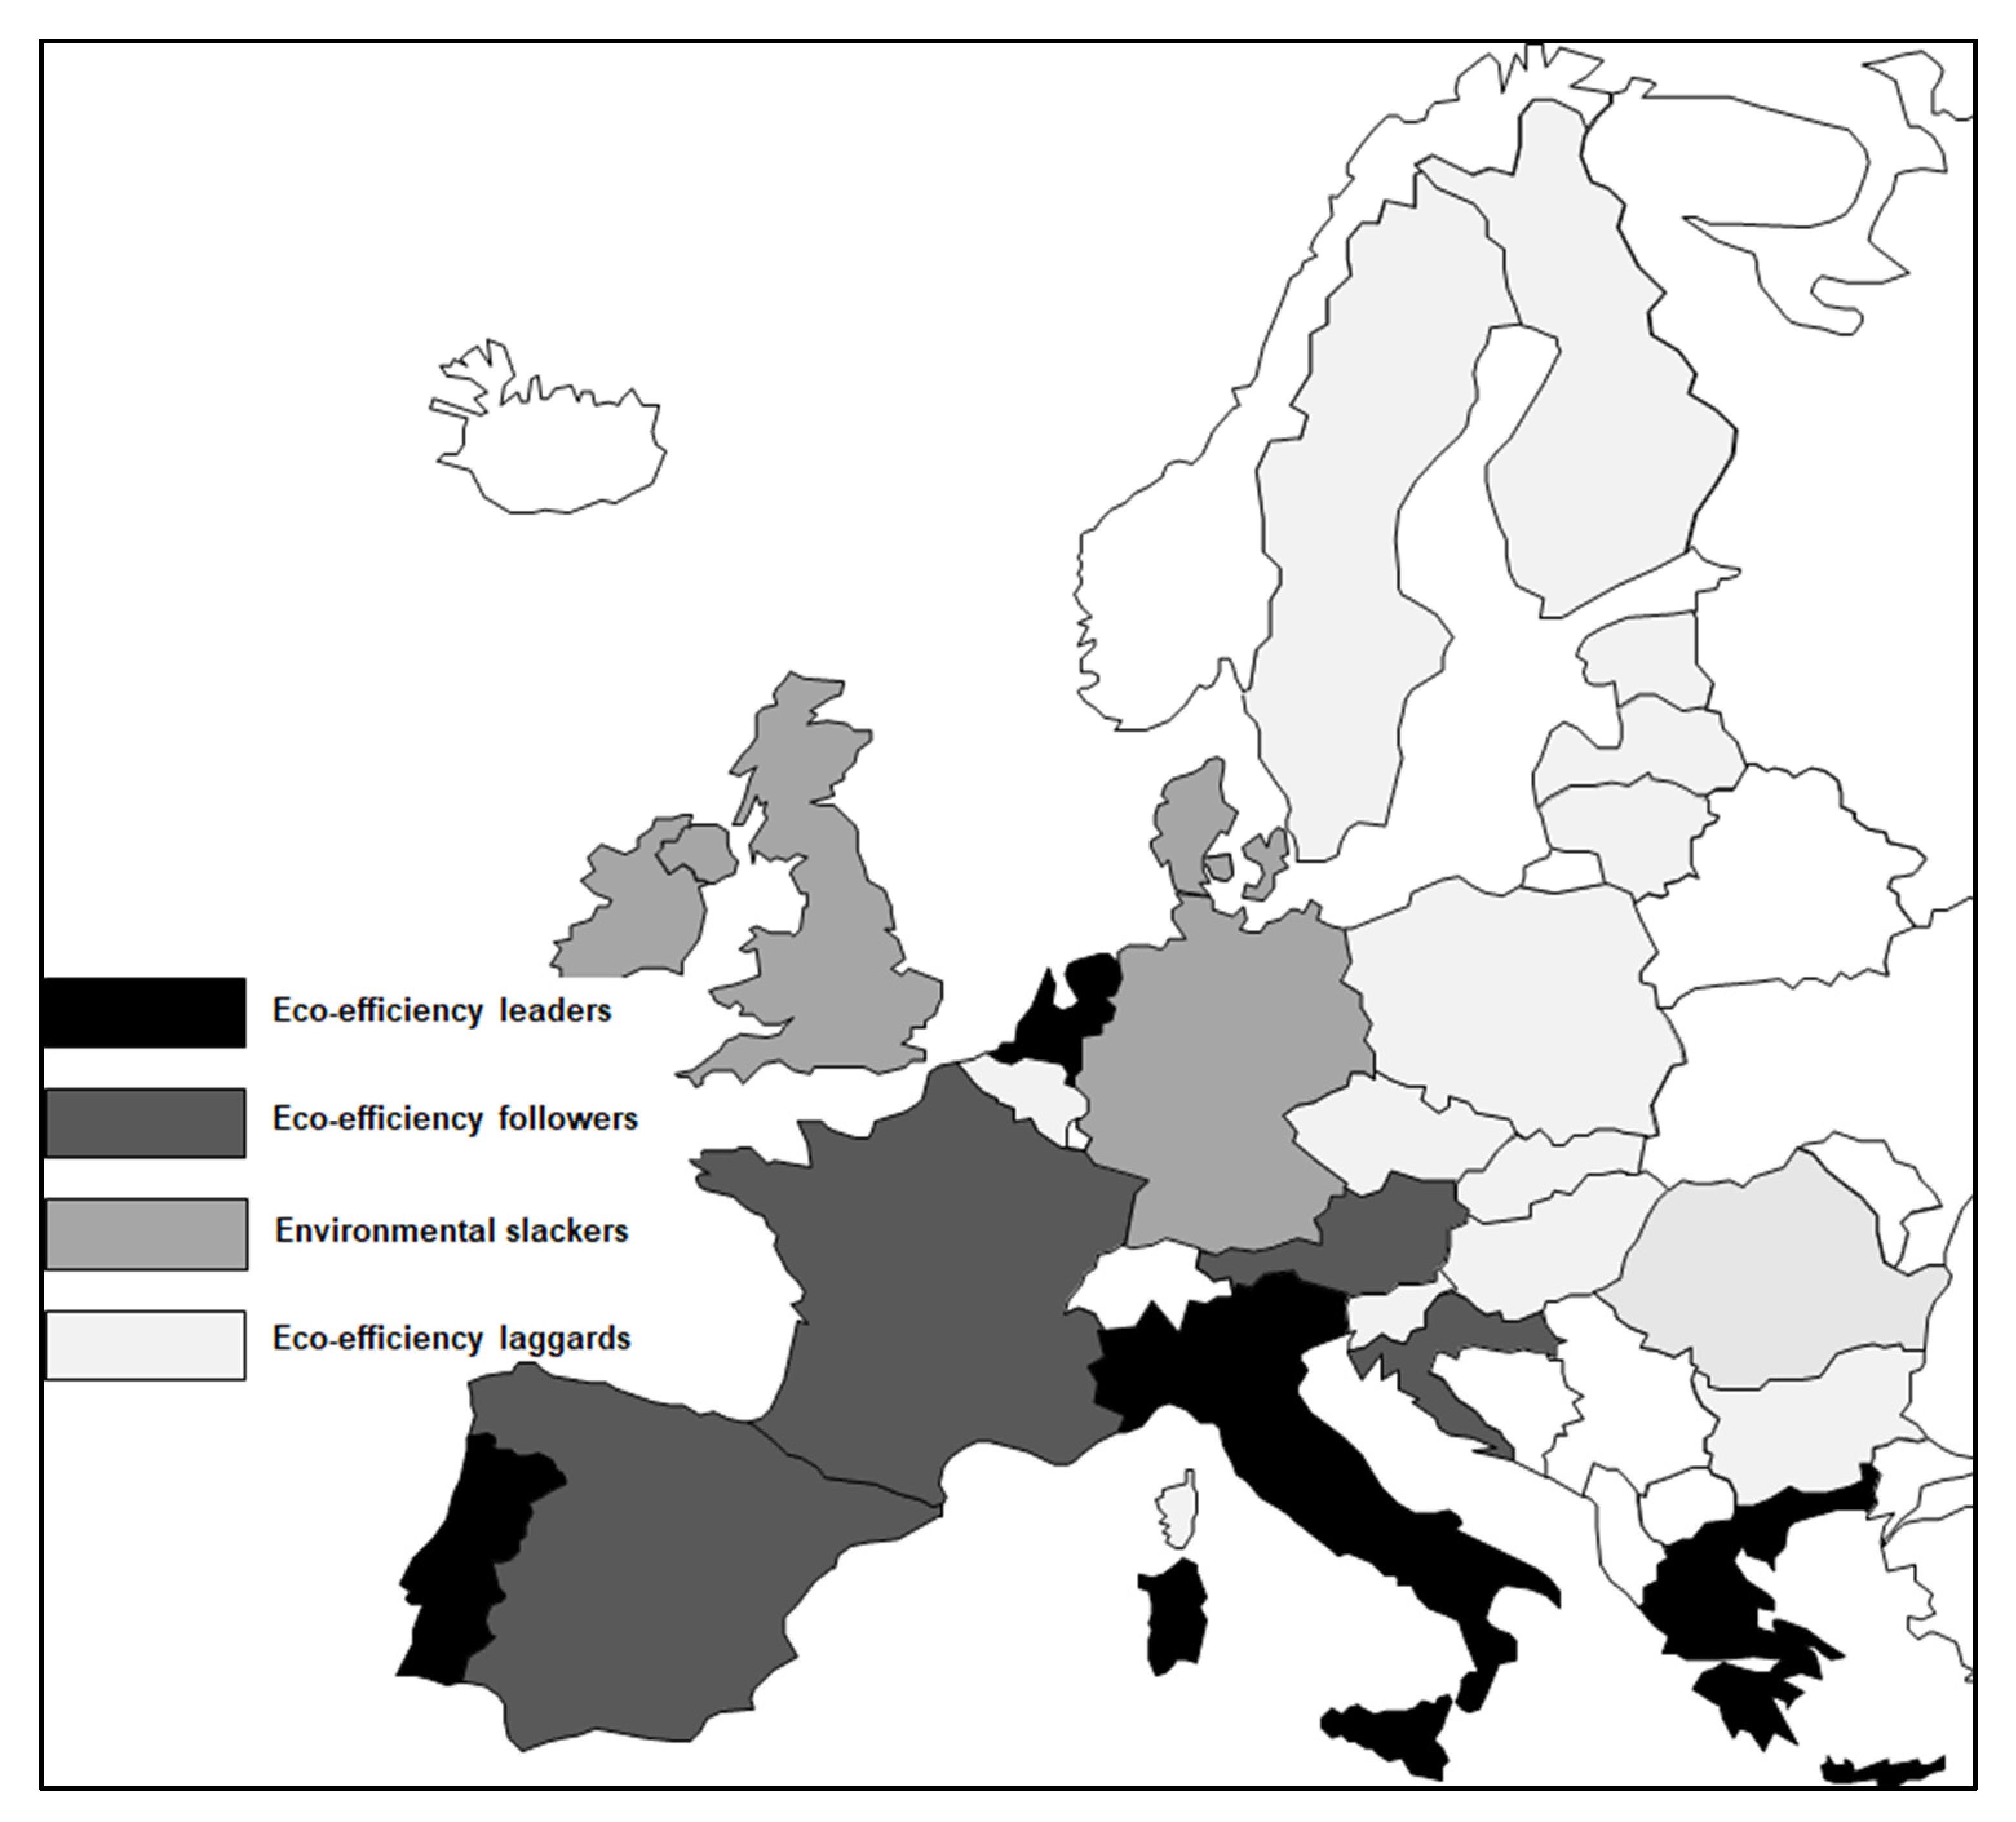
Figure 5.
Eco-efficiency of agriculture in EU (2019). Source: own study.

5. Discussion
The study of eco-efficiency as indicated in the literature review does not find a single universal approach in economic studies. Therefore, due to the complexity of the phenomenon, it is worth using different methods and approaches that complement each other and allow more reliable conclusions to be drawn. In this empirical study, one-dimensional indices of input use productivity (land, labour, energy) as well as GHG emission efficiency of EU agriculture were applied. These indicators were easy to calculate, although it was difficult to make a comprehensive and unambiguous assessment of the efficiency of agricultural sectors based on them. Therefore, based on the multidimensional DEA method, which allows several inputs and several outputs to be taken into account, a ranking was created according to the synthetic index of economic and energy efficiency of agricultural sectors. Seven EU countries out of the twenty-six surveyed were found to have economically efficient agriculture, i.e., one which optimally uses its inputs (including energy) to achieve a given volume of agricultural production. The group of efficient sectors included agricultural sectors from: The Netherlands, Denmark, Greece, Cyprus, the United Kingdom, Italy and Ireland. In the latter part of the research, in accordance with the idea of benchmarking, efficiency benchmarks were defined for countries characterised by inefficient agriculture. On the basis of these benchmarks for inefficient agricultural sectors, a combination of inputs was proposed for inefficient agricultural sectors that would allow new technology to achieve the same effects with lower inputs, and thus, on this basis, individual countries could improve the economic and energy efficiency of their agriculture. In the next stage of the research, the aspects of GHG emission from agriculture were taken into consideration.
The study identifies countries with the highest (Italy, Greece, Cyprus, The Netherlands) and the lowest eco-efficiency (Ireland, Latvia, Czech Republic, Lithuania and Slovakia). Comparing the results obtained with the study of Vlontzos et al. [93], although the approach used is different, there is confirmation that only Italy and The Netherlands show a high level of eco-efficiency and confirmation that the countries showing the lowest levels of eco-efficiency are the Eastern European countries, such as Slovakia, Lithuania and Latvia. Confronting in turn this study with the Hoang and Rao study [92], it is confirmed that the most eco-efficient European farming system was in The Netherlands.
6. Conclusions
Overall, it can be concluded that the environmental performance of the agricultural sector in the EU over the period 2010–2019 remained at a similar level, although it improved slightly in some countries and deteriorated a little in others. It should be noted that significant changes in energy and environmental efficiency in the EU occurred after the introduction of the new CAP [107]. It can be assumed that subsidies had a significant impact on the level of energy and environmental efficiency of some new member states (e.g., Croatia and Romania) compared to older member states, as confirmed by Hoang and Rao [92] and Vlontzos et al. [93]. Furthermore, many CAP reforms aimed to promote sustainable agricultural development, including changes in production systems and practices, in particular, extensification and reduction of nitrogen fertilizer use. In addition, the modernization of farms allowed on-farm work to be performed with new, less energy-intensive machinery and equipment. Moreover, the RES support policy, developed after the Kyoto Protocol, was aimed at supporting RES projects in agriculture as well as promoting ecological products for consumers, which reduced fuel and fertilizer consumption and the resulting environmental pollution. On the other hand, Figure 5 shows that mainly CEE countries are characterised by a lower eco-efficiency, which can be also explained by the lower technological level of production processes in agriculture in these regions compared to Western European countries [93].
It should also be borne in mind that the structure of agricultural production varies between EU countries. Decisions on where and how to carry out a given crop or livestock production depend to a large extent on local conditions, such as soil type, climate and infrastructure, and this also affects the efficiency and profitability of production. Moreover, there are differences in government support to farms/agriculture sector in different EU countries. Therefore, there may be various reasons for economic or environmental inefficiency of agriculture in particular EU countries. For example, Ireland’s agriculture scored very high in terms of economic and energy efficiency, although it ranked last in terms of environmental efficiency (GHG emissions). The reasons for Ireland’s low eco-efficiency can be attributed, firstly, to the high fragmentation of farms and the fact that most farms do not achieve economies of scale. Secondly, the substantial environmental pollution caused by agriculture in Ireland (32% of GHG emissions in the country) is linked to the large scale of livestock farming, which results in higher GHG emissions from agriculture than from other sectors, e.g., energy production or transport. In addition, the low eco-efficiency of Irish farms is affected by high labour and energy costs, the carbon tax on green diesel and the high dependence on EU subsidies.
Ongoing research on the relationship between economic and environmental efficiency seems important for two reasons. Firstly, the research results can be used to increase environmental awareness among managers or owners of farms. Secondly, the research results may be of interest to decision makers in terms of granting appropriate permits as well as financial support decisions, and also to mitigate or tighten environmental regulations. The high carbon intensity of agriculture is becoming a topic of policy discussion in the context of achieving EU-zero net emissions climate neutrality by 2050, as included in the European Green Deal [108]. Policy makers should therefore spread awareness of the positive impact of environmental efficiency on the economy, and intensify efforts to reduce GHG emissions in all sectors, including agriculture.
Emission reduction methods can be divided into two groups: those that influence changes in consumers’ eating habits, and those related to production technology. Assuming that livestock production is particularly carbon-intensive, there is a growing body of research showing the benefits of going vegan or vegetarian [109]. The change in eating habits will be shaped mainly by economic tools such as taxes and charges. The European Parliament is considering taxing meat so that its price covers environmental costs [110]. Edjabou and Smed [111] conducted a study which showed that the introduction of charges in the amount of DKK 150–1730 per 1 ton of CO2-equivalent emissions in Denmark could reduce the footprint from food production by 2.3–8.8%.
In addition to changing dietary habits, it is also proposed to reduce GHG emissions by reducing emissions from nitrogen fertilizers through the reduction of their use, the use of inhibitors and ensuring an adequate soil pH [112]. Technological changes aimed at reducing the level of GHG emissions also include breeding progress. Breeding progress, which consists of increasing the area of legume crops and introducing more fats into the diet of ruminants [113], is also recommended. Another way may be the genetic improvement of animals and the use of animal manure for biogas production, which prevents the release of nitrogen compounds into the atmosphere [113,114].
By contrast, when considering the increasing nutritional needs associated with global population growth, one can expect a higher intensity of agricultural production, and thus higher energy intensity and carbon intensity associated with it. The literature review provides various examples of reducing fossil fuel energy consumption in agriculture and associated GHG emissions. This mainly concerns changes in the production technology, including no-till farming [115], the introduction of precision agriculture (PAT) [116], agricultural tractors with electric drive [117], and technical progress in the construction of traditional combustion engines [118]. Another method of reducing GHG emissions from energy consumption may be the use of renewable energy sources, including solar energy, wind energy or biomass.
The research conducted here has some limitations. Firstly, these limitations are due to the shortcomings of the DEA method. The DEA method is a deterministic technique and produces results that are particularly sensitive to measurement error. Moreover, the DEA method measures efficiency relative to best practices within a particular sample, and so comparisons of scores between different studies are not meaningful [119].
It should also be noted that, when analysing the sustainability of agriculture, the economic, environmental, and social aspects should be taken into account. One of the main limitations of the methods used to study the eco-efficiency of agriculture is the lack of consideration of social aspects.
A significant difficulty in conducting in-depth eco-efficiency studies is also the limited availability of reliable and harmonised data, especially for individual agricultural production processes, this is confirmed by other researchers [120,121,122,123,124].
The research on the eco-efficiency of EU agricultural sectors conducted in this paper is certainly not exhaustive. Future research could therefore address the following issues.
- First of all, due to the fact that many of the largest agricultural sectors in the EU in terms of agricultural production, i.e., France, Germany and Poland, belong to the group of countries with moderate or low eco-efficiency, it is worth examining these agricultural production systems in a more comprehensive and detailed way;
- An important direction of research would be also to establish the determinants of eco-efficiency of the EU agriculture, taking into account the importance of taxes and subsidies;
- From a methodological point of view, it is advisable to test and compare the results of different methods to assess the eco-efficiency of the EU agricultural sector;
- It also becomes critical to develop methods to reduce GHG emissions from agriculture, and methods to support decision makers in deciding who should bear the burden of the costs of these reductions.
Funding
This research received no external funding.
Institutional Review Board Statement
Not applicable.
Informed Consent Statement
Not applicable.
Data Availability Statement
Not applicable.
Conflicts of Interest
The author declare no conflict of interest.
References
- Chavas, J.-P.; Aliber, M. An Analysis of Economic Efficiency in Agriculture: A Nonparametric Approach. J. Agric. Resour. Econ. 1993, 18, 1–16. [Google Scholar]
- Gaviglio, A.; Filippini, R.; Madau, F.A.; Marescotti, M.E.; Demartini, E. Technical efficiency and productivity of farms: A periurban case study analysis. Agric. Food Econ. 2021, 9, 1–18. [Google Scholar] [CrossRef]
- Chetroiu, R.; Ion, C. The concept of economic efficiency in agriculture. Agrar. Econ. Rural Dev. Realities Perspect. Rom. 2013, 4, 258–263. [Google Scholar]
- Guth, M.; Smędzik-Ambroży, K. Economic resources versus the efficiency of different types of agricultural production in regions of the European Union. Econ. Res.-Ekon. Istraživanja 2020, 33, 1036–1051. [Google Scholar] [CrossRef] [Green Version]
- Vicente, J.R. Economic efficiency of agricultural production in Brazil. Rev. Econ. Sociol. Rural 2004, 42, 201–222. [Google Scholar] [CrossRef] [Green Version]
- Alem, H.; Lien, G.; Hardaker, J.B. Economic performance and efficiency determinants of crop-producing farms in Norway. Int. J. Product. Perform. Manag. 2018, 67, 1418–1434. [Google Scholar] [CrossRef] [Green Version]
- Baran, J. Regional differentiation of financial support from the European Union and its impact on agricultural efficiency in Poland. Econ. Sci. Rural Dev. 2015, 38, 227–238. [Google Scholar]
- World Bank (WB). Agriculture for Development. World Development Report 2008; World Bank: Washington, DC, USA, 2007; Available online: https://openknowledge.worldbank.org/handle/10986/5990 (accessed on 5 September 2021).
- Nemecek, T.; Dubois, D.; Huguenin, O.; Gaillard, G. Life cycle assessment of Swiss framing systems. Agric. Syst. 2011, 104, 217–232. [Google Scholar] [CrossRef]
- Moutinho, V.; Robaina, M.; Macedo, P. Economic-environmental efficiency of European agriculture—A generalized maximum entropy approach. Agric. Econ. Czech 2018, 64, 423–435. [Google Scholar]
- Mbow, C.; Rosenzweig, C.; Barioni, L.G.; Benton, T.G.; Herrero, M.; Krishnapillai, M.; Liwenga, E.; Pradhan, P.; Rivera-Ferre, M.G.; Sapkota, T.; et al. Food security supplementary material. In Climate Change and Land: An IPCC Special Report on Climate Change, Desertification, Land Degradation, Sustainable Land Management, Food Security, and Greenhouse Gas Fluxes in Terrestrial Ecosystems; Shukla, P.R., Skea, J., Calvo Buendia, E., Masson-Delmotte, V., Pörtner, H.-O., Roberts, D.C., Zhai, P., Slade, R., Connors, S., van Diemen, R., et al., Eds.; Intergovernmental Panel on Climate Change; Springer: New York, NY, USA, 2019; pp. 437–550. [Google Scholar]
- Crippa, M.; Solazzo, E.; Guizzardi, D.; Monforti-Ferrario, F.; Tubiello, F.N.; Leip, A. Food systems are responsible for a third of global anthropogenic GHG emissions. Nat. Food 2021, 2, 198–209. [Google Scholar] [CrossRef]
- Brisson, N.; Gate, P.; Gouache, D.; Charmet, G.; Oury, F.X.; Huard, F. Why are wheat yields stagnating in Europe? A comprehensive data analysis for France. Field Crop. Res. 2010, 119, 201–212. [Google Scholar] [CrossRef]
- Lobell, D.B.; Schlenker, W.; Costa-Roberts, J. Climate Trends and Global Crop Production since 1980. Science 2011, 333, 616–620. [Google Scholar] [CrossRef] [PubMed] [Green Version]
- Rybaczewska-Błażejowska, M.; Gierulski, W. Eco-Efficiency Evaluation of Agricultural Production in the EU-28. Sustainability 2018, 10, 4544. [Google Scholar] [CrossRef] [Green Version]
- EU (the European Parliament and the Council), Decision No. 1386/2013/EU on a General Union Environment Action Programme to 2020 Living Well, within the Limits of Our Planet; EU: Brussels, Belgium, 2019; Available online: https://eur-lex.europa.eu/legal-content/EN/TXT/PDF/?uri=CELEX:32013D1386&from=EN (accessed on 20 July 2021).
- Godard, C.; Bamière, L.; Debove, E.; De Cara, S.; Jayet, P.A.; Niang, N.B. Interface between Agriculture and the Environment: Integrating Yield Response Functions in an Economic Model of EU Agriculture. Modelling Agricultural Policies: State of the Art and New Challenges; University of Parma: Parma, Italy, 2005; pp. 475–494. [Google Scholar]
- Huppes, G.; Ishikawa, M. A framework for quantified eco-efficiency analysis. J. Ind. Ecol. 2005, 9, 25–41. [Google Scholar] [CrossRef]
- Prasada Rao, D.S.; Coelli, T.J. Catch-up and convergence in global agricultural productivity. Indian Economic Review. J. Delhi Sch. Econ. 2014, 39, 123–148. [Google Scholar]
- Baran, J. Changes in productivity of agriculture after Polish accession to the European Union. Acta Sci. Pol. Oecon. 2014, 13, 5–15. [Google Scholar]
- Alene, A.D.; Manyong, V.M.; Gockowski, J. The production efficiency of intercroping annual and perennial crops in southern Ethiopia: A comparison of distance functions and production frontiers. Agric. Syst. 2006, 91, 51–70. [Google Scholar] [CrossRef]
- Błażejczyk-Majka, L.; Kala, R.; Maciejewski, K. Productivity and efficiency of large and small field crop farms and mixed farms of the old and new EU regions. Agric. Econ. Czech 2011, 58, 61–71. [Google Scholar] [CrossRef] [Green Version]
- Latruffe, L.; Balcombe, K.; Davidova, S.; Zawalińska, K. Technical and scale efficiency of crop and livestock farms in Poland: Does specialization matter? Agric. Econ. 2005, 32, 281–296. [Google Scholar] [CrossRef]
- Galanopoulos, K.; Aggelopoulos, S.; Kamenidou, I.; Mattas, K. Assessing the effects of managerial and production practices on the efficiency of commercial pig farming. Agric. Syst. 2006, 88, 125–141. [Google Scholar] [CrossRef]
- Schaltegger, S.; Sturm, A. Ökologische Rationalität. Unternehm 1990, 4, 273–290. [Google Scholar]
- Schidemeny, S. With the Business Council for Sustainable Development (BCSD). In Changing Course: A Global Business Perspective on Development and the Environment; MIT Press: Cambridge, UK, 1992. [Google Scholar]
- World Business Council for Sustainable Development (WBCSD). Measuring Ecoefficiency. A Guide to Reporting Company Performance; WBCSD: London, UK, 2000. [Google Scholar]
- Organisation for Economic Cooperation and Development (OECD). Eco-Efficiency; OECD Publishing: Paris, France, 1998. [Google Scholar]
- Picazo-Tadeo, A.J.; Gómez-Limón, J.A.; Reig-Martinez, E. Assessing farming eco-efficiency: A data envelopment analysis approach. J. Environ. Manag. 2011, 92, 1154–1164. [Google Scholar] [CrossRef]
- Reinhard, S.; Lovell, C.A.K.; Thijssen, G. Analysis of environmental efficiency variation. Am. J. Agric. Econ. 2002, 84, 1054–1065. [Google Scholar] [CrossRef]
- Greene, W. Reconsidering heterogeneity in panel data estimators of the stochastic frontier model. J. Econom. 2005, 126, 269–303. [Google Scholar] [CrossRef]
- Simar, L.; Wilson, P.W. Estimation and inference in two-stage, semi-parametric models of production processes. J. Econom. 2007, 136, 31–64. [Google Scholar] [CrossRef]
- Lauwers, L. Justifying the incorporation of the materials balance principle into frontier-based eco-efficiency models. Ecol. Econ. 2009, 68, 1605–1614. [Google Scholar] [CrossRef]
- Pérez Domínguez, I.; Fellmann, T.; Weiss, F.; Witzke, P.; Barreiro-Hurlé, J.; Himics, M.; Jansson, T.; Salputra, G.; Leip, A. An Economic Assessment of GHG Mitigation Policy Options for EU Agriculture (EcAMPA 2); JRC Science for Policy Report; Publications Office of the European Union: Seville, Spain, 2016. [Google Scholar]
- Huppes, G.; Ishikawa, M. A Quantified Eco-Efficiency an Introduction with Applications; Springer: Dordrecht, The Netherlands, 2007. [Google Scholar]
- World Business Council for Sustainable Development (WBCSD). Eco-Efficiency Learning Module. 2006, pp. 1–231. Available online: https://www.wbcsd.org/Projects/Education/Resources/Eco-efficiency-Learning-Module (accessed on 30 September 2021).
- Yu, Y.; Chen, D.; Zhu, B.; Hu, S. Eco-efficiency trends in China, 1978–2010: Decoupling environmental pressure from economic growth. Ecol. Indic. 2013, 24, 177–184. [Google Scholar] [CrossRef]
- Kuosmanen, T.; Kortelainen, M. Measuring eco-efficiency of production with data envelopment analysis. J. Ind. Ecol. 2005, 9, 59–72. [Google Scholar] [CrossRef]
- Pereira, C.P.; Prata, D.M.; Santos, L.S.; Monteiro, L.P.C. Development of eco-efficiency comparison index through eco-indicators for industrial applications. Braz. J. Chem. Eng. 2018, 35, 69–89. [Google Scholar] [CrossRef]
- Tyteca, D. On the measurement of the environmental performance of firms—A literature review and a productive efficiency perspective. J. Environ. Manag. 1996, 46, 281–308. [Google Scholar] [CrossRef]
- Saling, P.; Kicherer, A.; Dittrich-Krämer, B.; Wittlinger, R.; Zombik, W.; Schmidt, I.; Schrott, W.; Schmidt, S. Eco-efficiency analysis by BASF: The method. Int. J. Life Cycle Assess. 2002, 7, 203–218. [Google Scholar] [CrossRef]
- Czaplicka-Kolarz, K.; Burchart-Korol, D.; Krawczyk, P. Metodyka analizy ekoefektywności. J. Ecol. Health 2010, 14, 267–271. [Google Scholar]
- International Organization for Standardization (ISO). ISO/TC 207/SC 1, Environmental Management Systems. 2012. Available online: https://committee.iso.org/home/tc207sc1 (accessed on 15 September 2021).
- Joachimiak-Lechman, K. Środowiskowa ocena cyklu życia (LCA) i rachunek kosztów cyklu życia (LCC). Aspekty porównawcze. Ekon. Sr. 2014, 1, 80–96. [Google Scholar]
- Wagner, M.; Lewandowski, I. Life-cycle sustainability assessment. In Bieconomy. Shaping the Transition to a Sustainable, Biobased Economy; Lewandowski, I., Ed.; Springer: Cham, Switzerland, 2018; pp. 1–354. [Google Scholar]
- Samson-Bręk, I. Zastosowanie metody oceny cyklu życia LCA do oszacowania wpływu na środowisko wytwarzania paliwa biogazowego do silników spalinowych. Arch. Motoryz. 2011, 2, 181–191. [Google Scholar]
- Kuosmanen, T. Measurement and Analysis of Eco-efficiency: An Economist’s Perspective. J. Ind. Ecol. 2005, 9, 15–18. [Google Scholar] [CrossRef]
- Zhang, B.; Bi, J.; Fan, Z.; Yuan, Z.; Ge, J. Eco-efficiency analysis of industrial system in China: A data envelopment analysis approach. Ecol. Econ. 2008, 68, 306–316. [Google Scholar] [CrossRef]
- Dyckhoff, H.; Allen, K. Measuring ecologic al efficiency with data envelopment analysis. Eur. J. Oper. Res. 2001, 132, 312–325. [Google Scholar] [CrossRef]
- Huang, J.; Yang, H.; Cheng, G.; Wang, S. A comprehensive eco-efficiency model and dynamics of regional eco-efficiency in China. J. Clean. Prod. 2014, 67, 228–238. [Google Scholar] [CrossRef]
- Gómez-Limón, J.A.; Picazo-Tadeo, A.J.; Reig-Martinez, E. Eco-efficiency assessment of olive farms in Andalusia. Land Use Policy 2012, 29, 395–406. [Google Scholar] [CrossRef]
- Jan, P.; Dux, D.; Lips, M.; Alig, M.; Dumondel, M. On the link between economic and environmental performance of Swiss dairy farms of the alpine area. Int. J. Life Cycle Assess. 2012, 17, 706–719. [Google Scholar] [CrossRef] [Green Version]
- Pang, J.; Chen, X.; Zhang, Z.; Li, H. Measuring eco-efficiency of agriculture in China. Sustainability 2016, 8, 398. [Google Scholar] [CrossRef] [Green Version]
- Orea, L.; Wall, A. Measuring ecoefficiency using the stochastic frontier analysis approach, international series in operations research & management science. In Advances in Efficiency and Productivity; Aparicio, J., Knox Lovell, C.A., Pastor, J.T., Eds.; Springer: Cham, Switzerland, 2016; pp. 275–297. [Google Scholar]
- Callens, I.; Tyteca, D. Towards indicators of sustainable development for firms: A productive efficiency perspective. Ecol. Econ. 1999, 28, 41–53. [Google Scholar] [CrossRef]
- Picazo-Tadeo, A.J.; Beltrán-Esteve, M.; Gómez-Limón, J.A. Assessing eco-efficiency with directional distance functions. Eur. J. Oper. Res. 2012, 220, 798–809. [Google Scholar] [CrossRef]
- Wursthorn, S.; Poganietz, W.-R.; Schebek, L. Economic-environmental monitoring indicators for European countries: A disaggregated sector-based approach for monitoring eco-efficiency. Ecol. Econ. 2011, 70, 487–496. [Google Scholar] [CrossRef]
- Suzigan, L.H.; Peña, C.R.; Guarnieri, P. Eco-efficiency Assessment in Agriculture: A Literature Review Focused on Methods and Indicators. J. Agric. Sci. 2020, 12, 118–134. [Google Scholar] [CrossRef]
- Pacini, C.; Wossinka, A.; Giesena, G.; Vazzanac, C.; Huirn, R. Evaluation of sustainability of organic, integrated and conventional farming systems: A farm and field-scale analysis. Agric. Ecosyst. Environ. 2003, 95, 273–288. [Google Scholar] [CrossRef]
- Reinhard, S.; Thijssen, G. Nitrogen efficiency of Dutch dairy farms: A shadow cost system approach. Eur. Rev. Agric. Econ. 2000, 27, 167–186. [Google Scholar] [CrossRef]
- Vand der Werf, H.; Petit, J. Evaluation of the environmental impact of agriculture at the farm level: A comparison and analysis of 12 indicator-based methods. Agric. Ecosyst. Environ. 2002, 93, 131–145. [Google Scholar] [CrossRef]
- Abay, A.; Assefa, A. The Role of Education on the Adoption of Chemical Fertilizer under different Socioeconomic Environments in Ethiopia. Agric. Econ. 2004, 30, 215–228. [Google Scholar]
- Hoang, V.N.; Alauddin, M. Input-orientated data envelopment analysis framework of measuring and decomposing economic, environmental and ecological efficiency: An application to OECD agriculture. Environ. Resour. Econ. 2012, 51, 431–452. [Google Scholar] [CrossRef]
- Hoang, V.N.; Coelli, T. Measurement of agricultural total factor productivity growth incorporating environmental factors: A nutrients balance approach. J. Environ. Econ. Manag. 2011, 62, 462–474. [Google Scholar] [CrossRef] [Green Version]
- Asmild, M.; Hougaard, J.L. Economic versus environmental improvement potentials of Danish pig farms. Agric. Econ. 2006, 35, 171–181. [Google Scholar] [CrossRef]
- Lozano, S.; Iribarren, D.; Moreira, M.T.; Feijoo, G. The link between operational efficiency and environmental impacts. Sci. Total Environ. 2009, 407, 1744–1754. [Google Scholar] [CrossRef] [PubMed]
- Iribarren, D.; Hospido, A.; Moreira, M.T.; Feijoo, G. Benchmarking environmental and operational parameters through eco-efficiency criteria for dairy farms. Sci. Total Environ. 2011, 409, 1786–1798. [Google Scholar] [CrossRef] [PubMed]
- Vázquez-Rowe, I.; Villanueva-Rey, P.; Iribarren, D.; Teresa Moreira, M.; Feijoo, G. Joint life cycle assessment and data envelopment analysis of grape production for vinification in the Rias Baixasappellation (NW Spain). J. Clean. Prod. 2012, 27, 92–102. [Google Scholar] [CrossRef]
- Mohseni, P.; Borghei, A.M.; Khanali, M. Coupled life cycle assessment and data envelopment analysis for mitigation of environmental impacts and enhancement of energy efficiency in grape production. J. Clean. Prod. 2018, 197, 937–947. [Google Scholar] [CrossRef]
- Masuda, K. Measuring eco-efficiency of wheat production in Japan: A combined application of life cycle assessment and data envelopment analysis. J. Clean. Prod. 2016, 126, 373–381. [Google Scholar] [CrossRef]
- Ullah, A.; Perret, S.R.; Gheewala, S.H.; Soni, P. Eco-efficiency of cotton-cropping systems in Pakistan: An integrated approach of life cycle assessment and data envelopment analysis. J. Clean. Prod. 2016, 134, 623–632. [Google Scholar] [CrossRef]
- Mohammadi, A.; Rafiee, S.; Jafari, A.; Dalgaard, T.; Knudsen, M.T.; Keyhani, A.; Mousavi-Avval, S.; Hermansen, J. Potential greenhouse gas emission reductions in soybean farming: A combined use of life cycle assessment and data envelopment analysis. J. Clean. Prod. 2013, 54, 89–100. [Google Scholar] [CrossRef]
- Mohammadi, A.; Rafiee, S.; Jafari, A.; Keyhani, A.; Dalgaard, T.; Knudsen, M.T.; Nguyen, T.; Borek, R.; Hermansen, J. Joint life cycle assessment and data envelopment analysis for the benchmarking of environmental impacts in rice paddy production. J. Clean. Prod. 2015, 106, 521–532. [Google Scholar] [CrossRef]
- Basset-Mens, C.; Ledgard, S.; Boyes, M. Eco-efficiency of intensification scenarios for milk production in New Zealand. Ecol. Econ. 2009, 68, 1615–1625. [Google Scholar] [CrossRef]
- Mouron, P.; Scholz, R.W.; Nemecek, T.; Weber, O. Life cycle management on Swiss fruit farms: Relating environmental and income indicators for apple-growing. Ecol. Econ. 2006, 58, 561–578. [Google Scholar] [CrossRef]
- Forleo, B.; Palmieri, N.; Suardi, A.; Coaloa, D.; Pari, L. The eco-efficiency of rapeseed and sunflower cultivation in Italy. Joining environmental and economic assessment. J. Clean. Prod. 2018, 172, 3138–3153. [Google Scholar] [CrossRef]
- Coelli, T.; Lauwers, L.; Van Huylenbroeck, G. Environmental efficiency measurement and the materials balance condition. J. Product. Anal. 2007, 28, 3–12. [Google Scholar] [CrossRef] [Green Version]
- Van Passel, S.; Nevens, F.; Mathijs, E.; Van Huylenbroeck, G. Measuring farm sustainability and explaining differences in sustainable efficiency. Ecol. Econ. 2007, 62, 149–161. [Google Scholar] [CrossRef]
- Barba-Guitierrez, Y.; Adenso-Diaz, B.; Lozano, S. Eco-efficiency of electric and electronic appliances: A data envelopment analysis (DEA). Environ. Model. Assess. 2009, 14, 439–447. [Google Scholar] [CrossRef]
- Van Meensel, J.; Lauwers, L.; Van Huylenbroeck, G.; Van Passel, S. Comparing frontier methods for economic-environmental trade-off analysis. Eur. J. Oper. Res. 2010, 207, 1027–1040. [Google Scholar] [CrossRef]
- Khoshnevisan, B.; Rafieed, S.; Musazadeh, H. Environmental impact assessment of open field and greenhouse strawberry production. Eur. J. Agron. 2013, 50, 29–37. [Google Scholar] [CrossRef]
- Sulewski, P.; Wąs, A.; Kłoczko-Gajewska, A.; Kobus, P.; Pogodzińska, K.; Gołaś, M. Ekoefektywność Towarowych Gospodarstw Rolnych w Polsce; Wydawnictwo SGGW: Warsaw, Poland, 2020; pp. 1–158. [Google Scholar]
- Shorthall, O.K.; Barnes, A.P. Greenhouse gas emissions and the technical efficiency of dairy farmers. Ecol. Indic. 2013, 29, 478–488. [Google Scholar] [CrossRef]
- Bieńkowski, J.; Baum, R.; Holka, M. Eco-Efficiency of Milk Production in Poland Using the Life Cycle Assessment Methodologies. Eur. Res. Stud. J. 2021, 24, 890–912. [Google Scholar] [CrossRef]
- Hochman, Z.; Prestwidge, D.; Carberry, P.S. Crop sequences in Australia’s northern grain zone are less agronomically efficient than implied by the sum of their parts. Agric. Syst. 2014, 129, 124–132. [Google Scholar] [CrossRef]
- Bieńkowski, J.; Baum, R. Eco-Efficiency in Measuring the Sustainable Production of Agricultural Crops. Sustainability 2020, 12, 1418. [Google Scholar] [CrossRef] [Green Version]
- Kulak, M.; Nemecek, T.; Frossard, E.; Chable, V.; Gaillard, G. Life cycle assessment of bread from several alternative food networks in Europe. J. Clean. Prod. 2015, 90, 104–113. [Google Scholar] [CrossRef]
- Pereira, A.; Carballo-Penela, A.; González-López, M.; Vence, X. A case study of servicizing in the farming-livestock sector: Oganisational change and potential environmental improvement. J. Clean. Prod. 2016, 124, 84–93. [Google Scholar] [CrossRef]
- Polcyn, J. Eco-Efficiency and Human Capital Efficiency: Example of Small- and Medium-Sized Family Farms in Selected European Countries. Sustainability 2021, 13, 6846. [Google Scholar] [CrossRef]
- Stępień, S.; Czyżewski, B.; Sapa, A.; Borychowski, M.; Poczta, W.; Poczta-Wajda, A. Eco-efficiency of small-scale farming in Poland and its institutional drivers. J. Clean. Prod. 2021, 279, 123721. [Google Scholar] [CrossRef]
- Gołaś, M.; Sulewski, P.; Wąs, A.; Kłoczko-Gajewska, A.; Pogodzińska, K. On the Way to Sustainable Agriculture—Eco-Efficiency of Polish Commercial Farms. Agriculture 2020, 10, 438. [Google Scholar] [CrossRef]
- Hoang, V.-N.; Rao, D.S.P. Measuring and decomposing sustainable efficiency in agricultural production: A cumulative exergy balance approach. Ecol. Econ. 2010, 69, 1765–1776. [Google Scholar] [CrossRef]
- Vlontzos, G.; Niavis, S.; Manos, B. DEA approach for estimating the agricultural energy and environmental efficiency of EU countries. Renew. Sustain. Energy Rev. 2014, 40, 91–96. [Google Scholar] [CrossRef]
- Halkos, G.E.; Tzeremes, N.G.; Kourtzidis, S.A. Measuring Sustainability Efficiency Using a Two-Stage Data Envelopment Analysis Approach. J. Ind. Ecol. 2016, 20, 1159–1175. [Google Scholar] [CrossRef]
- Fang, Y.L.; Zeng, X.L. Evaluation and improvement of agricultural eco-efficiency in China. J. Agric. Resour. Environ. 2021, 38, 135–142. [Google Scholar]
- Richterová, E.; Richter, M.; Sojková, Z. Regional eco-efficiency of the agricultural sector in V4 regions, its dynamics in time and decomposition on the technological and pure technical eco-efficiency change. Equilib. Q. J. Econ. Econ. Policy 2021, 16, 553–576. [Google Scholar] [CrossRef]
- Wysokiński, M.; Domagała, J.; Gromada, A.; Golonko, M.; Trębska, P. Economic and energy efficiency of agriculture. Agric. Econ. Czech 2020, 66, 355–364. [Google Scholar] [CrossRef]
- Wysokiński, M.; Golonko, M.; Gromada, A.; Trębska, P.; Jun Jiang, Q. Economic and energy efficiency of agriculture in Poland compared to other European Union countries. Acta Sci. Pol. Oecon. 2020, 19, 97–105. [Google Scholar] [CrossRef]
- Schmidheiny, S.; Zorraquin, J.L. Financing Change, the Financial Community, Eco-Efficiency and Sustainable Development; MIT Press: Cambridge, UK, 1996. [Google Scholar]
- Cooper, W.W.; Seiford, L.M.; Tone, K. Data Envelopment Analysis. A Comprehensive Text with Models. Applications. References and DEA-Solver Software; Kluwer Academic Publishers: New York, NY, USA, 2007. [Google Scholar]
- Coelli, T.J.; Prasada Rao, D.S.P.; O’Donnell, C.J.; Battese, G.E. An Introduction to Efficiency and Productivity Analysis; Springer: New York, NY, USA, 2005. [Google Scholar]
- Banker, R.D.; Charnes, A.; Cooper, W.W. Some models for estimating technical and scale inefficiency in data envelopment analysis. Manag. Sci. 1984, 30, 1078–1092. [Google Scholar] [CrossRef] [Green Version]
- Charnes, A.; Cooper, W.W.; Rhodes, A. Measuring the efficiency of decision making units. Eur. J. Oper. Res. 1978, 2, 429–444. [Google Scholar] [CrossRef]
- Guzik, B. Podstawowe Modele DEA w Badaniu Efektywności Gospodarczej i Społecznej; Wydawnictwo UE w Poznaniu: Poznan, Poland, 2009. [Google Scholar]
- Baran, J. Efektywność polskiego rolnictwa na tle pozostałych krajów Unii Europejskiej. Wieś Rol. 2016, 3, 69–85. [Google Scholar] [CrossRef]
- Wysokiński, M.; Klepacki, B.; Gradziuk, P.; Golonko, M.; Gołasa, P.; Bieńkowska-Gołasa, W.; Gradziuk, B.; Trębska, P.; Lubańska, A.; Guzal-Dec, D.; et al. Economic and Energy Efficiency of Farms in Poland. Energies 2021, 14, 5586. [Google Scholar] [CrossRef]
- Bartolini, F.; Viaggi, D. The Common Agricultural Policy and the determinants of changes in EU Farm Size. Land Use Policy 2013, 31, 126–135. [Google Scholar] [CrossRef]
- Communication from the Commission to the European Parliament; The European Council; The Council; The European Economic and Social Committee; The Committee of the Regions and the European Investment Bank. A Clean Planet for All—A European Strategic Long-Term Vision for a Prosperous, Modern, Competitive and Climate Neutral Economy; COM: Brussels, Belgium, 2018; Available online: https://eur-lex.europa.eu/legal-content/EN/TXT/?uri=CELEX%3A52018DC0773 (accessed on 30 September 2021).
- Food and Agricultural Organization of the United Nations (FAO); International Fund for Agricultural Development (IFAD); United Nations Children’s Fund (UNICEF); World Food Programme (WFP); World Health Organization (WHO). The State of Food Security and Nutrition in the World 2020. Transforming Food Systems for Affordable Healthy Diets; Food and Agriculture Organization of the United Nations: Rome, Italy, 2020. [Google Scholar]
- Wirsenius, S.; Hedenus, F.; Mohlin, K. Greenhouse gas taxes on animal food products: Rationale, tax scheme and climate mitigation effects. Clim. Chang. 2010, 108, 159–184. [Google Scholar] [CrossRef]
- Edjabou, L.D.; Smed, S. The effect of using consumption taxes on foods to promote climate friendly diets—The case of Denmark. Food Policy 2013, 39, 84–96. [Google Scholar] [CrossRef]
- Sosulski, T.; Szymańska, M.; Szara, E. Assessment of various practices of the mitigation of N2O emissions from the arable soils of Poland. Soil Sci. Annu. 2017, 68, 55–64. [Google Scholar] [CrossRef]
- MacLeod, M.; Eory, V.; Gruère, G.; Lankoski, J. Cost-Effectiveness of Greenhouse Gas Mitigation Measures for Agriculture. A Literature Review. OECD Food Agric. Fish. Pap. 2015, 89. [Google Scholar] [CrossRef]
- Piechota, G.; Igliński, B. Biomethane in Poland—Current status, potential, perspective and development. Energies 2021, 14, 1517. [Google Scholar] [CrossRef]
- Syp, A.; Faber, A. Zastosowanie Modelu DNDC do Symulacji Plonów Roślin i Oceny Wpływu Zmian na Środowisko w Zmieniających Się Warunkach Klimatycznych i Różnych Systemach Uprawy. Rocz. Nauk. Stowarzyszenia Ekon. Rol. Agrobiz. 2012, 14, 183–187. [Google Scholar]
- Soto Embodas, I.; Barnes, A.; Balafoutis, A.; Beck, B.; Sanchez Fernandez, B.; Vangeyte, J.; Fountas, S.; Van DerWal, T.; Eory, V.; Gomez Barbero, M. The Contribution of Precision Agriculture Technologies to Farm Productivity and the Mitigation of Greenhouse Gas Emissions in the EU; Publications Office of the European Union: Luxembourg, 2019. [Google Scholar]
- Monarch Tractor: The World’s Smartest, Fully Electric, Autonomous Tractor. Available online: https://www.monarchtractor.com/monarch-blogs/#/news/1toEOumnkEksWakieoeC6M (accessed on 19 September 2021).
- Regulation (EU) 2016/1628 of the European Parliament and of the Council of 14 September 2016 on Requirements Relating to Gaseous and Particulate Pollutant Emission Limits and Type-Approval for Internal Combustion Engines for Non-Road Mobile Machinery, Amending Regulations (EU) No. 1024/2012 and (EU) No. 167/2013, and Amending and Repealing Directive 97/68/EC. Available online: https://eur-lex.europa.eu/legal-content/EN/TXT/PDF/?uri=CELEX:32016R1628&from=EN (accessed on 23 September 2021).
- Baran, J.; Górecka, A.K. Economic and environmental aspects of inland transport in EU countries. Economic Research-Ekonomska Istraživanja 2019, 32, 1037–1059. [Google Scholar] [CrossRef] [Green Version]
- Rodrigues, G.S.; Rodrigues, I.A.; de Almeida Buschinelli, C.C.; De Barros, I. Integrated farm sustainability assessment for the environmental management of rural activities. Environ. Impact Assess. Rev. 2010, 30, 229–239. [Google Scholar] [CrossRef]
- Bengtsson, J.; Seddon, J. Cradle to retailer or quick service restaurant gate life cycle assessment of chicken products in Australia. J. Clean. Prod. 2013, 41, 291–300. [Google Scholar] [CrossRef]
- Todorovic, M.; Mehmeti, A.; Scardigno, A. Eco-efficiency of agricultural water systems: Methodological approach and assessment at meso-level scale. J. Environ. Manag. 2016, 165, 62–71. [Google Scholar] [CrossRef] [PubMed]
- Corrado, S.; Castellani, V.; Zampori, L.; Sala, S. Systematic analysis of secondary life cycle inventories when modelling agricultural production: A case study for arable crops. J. Clean. Prod. 2018, 172, 3990–4000. [Google Scholar] [CrossRef]
- Xing, Z.; Wang, J.; Zhang, J. Expansion of environmental impact assessment for eco-efficiency evaluation of China’s economic sectors: An economic input-output based frontier approach. Sci. Total Environ. 2018, 635, 284–293. [Google Scholar] [CrossRef] [PubMed]
Figure 1.
Change in EU-28 greenhouse gas emissions, 1990–2019 (1990 = 100). Source: European Environment Agency.
Figure 1.
Change in EU-28 greenhouse gas emissions, 1990–2019 (1990 = 100). Source: European Environment Agency.

Figure 2.
Sources of greenhouse gas emissions in the EU-28, 2019. Source: European Environment Agency and Eurostat.
Figure 2.
Sources of greenhouse gas emissions in the EU-28, 2019. Source: European Environment Agency and Eurostat.

Figure 3.
The economic and energy efficiency of EU agriculture based on the DEA method (2019). Source: author’s own calculations based on Eurostat.
Figure 3.
The economic and energy efficiency of EU agriculture based on the DEA method (2019). Source: author’s own calculations based on Eurostat.


Table 1.
Share of GHG from agriculture * of a given country in the total GHG from EU agriculture and in the total GHG in a given country, 2019 (%).
Table 1.
Share of GHG from agriculture * of a given country in the total GHG from EU agriculture and in the total GHG in a given country, 2019 (%).
| Country | Share of Greenhouse Gas Emissions from Agriculture in the Total Greenhouse Emissions from EU Agriculture (%) | Country | Share of Greenhouse Gas Emissions from Agriculture in the Total Greenhouse Emissions in Country (%) |
|---|---|---|---|
| France | 17.1 | Sweden | 45 |
| Germany | 14.5 | Ireland | 32 |
| United Kingdom | 9.8 | Lithuania | 28 |
| Spain | 8.8 | Romania | 23 |
| Poland | 7.7 | Denmark | 23 |
| Italy | 6.9 | Latvia | 22 |
| Ireland | 4.8 | France | 18 |
| Romania | 4.4 | Finland | 17 |
| The Netherlands | 4.1 | Croatia | 15 |
| Denmark | 2.5 | Spain | 14 |
| Belgium | 2.2 | Bulgaria | 13 |
| Czechia | 1.9 | Hungary | 12 |
| Greece | 1.8 | Portugal | 12 |
| Austria | 1.7 | Estonia | 11 |
| Hungary | 1.7 | The Netherlands | 10 |
| Sweden | 1.6 | Greece | 10 |
| Portugal | 1.6 | Austria | 10 |
| Finland | 1.5 | Slovenia | 10 |
| Bulgaria | 1.5 | United Kingdom | 9 |
| Lithuania | 1.0 | Poland | 9 |
| Slovakia | 0.6 | Germany | 8 |
| Croatia | 0.6 | Italy | 8 |
| Latvia | 0.5 | Belgium | 8 |
| Slovenia | 0.4 | Slovakia | 8 |
| Estonia | 0.4 | Luxembourg | 7 |
| Luxembourg | 0.2 | Czechia | 6 |
| Cyprus | 0.1 | Cyprus | 6 |
| Malta | 0.02 | Malta | 4 |
* Land use, land use change and forestry net removals are not included in total greenhouse gas emissions. Emissions from agricultural transport and energy use are not included in agriculture emissions, as these sectors are not defined as part of the agriculture sector by the current IPCC reporting guidelines. Source: author’s own calculations based on European Environment Agency.
Table 2.
The role of agriculture in the economy of EU.
| Agricultural Sector in Country | Agricultural Production Value as Percent of Total EU Agricultural Production | Agricultural Sector in Country | Value Added in the Agricultural Sector as Percent of GDP in the EU | Agricultural Sector in Country | Employment in Agriculture as Percent of Total Employment in the EU |
|---|---|---|---|---|---|
| France | 18.44 | Romania | 4.13 | Romania | 21.24 |
| Germany | 14.01 | Greece | 3.78 | Greece | 11.6 |
| Italy | 13.84 | Latvia | 3.73 | Poland | 9.15 |
| Spain | 12.37 | Hungary | 3.32 | Latvia | 7.29 |
| The Netherlands | 6.98 | Bulgaria | 3.24 | Bulgaria | 6.62 |
| Poland | 6.31 | Lithuania | 3.22 | Lithuania | 6.44 |
| Romania | 4.54 | Croatia | 2.92 | Croatia | 6.19 |
| Greece | 2.84 | Spain | 2.59 | Portugal | 5.5 |
| Denmark | 2.65 | Estonia | 2.51 | Hungary | 4.72 |
| Hungary | 2.09 | Slovakia | 2.48 | Ireland | 4.43 |
| Belgium | 2.09 | Finland | 2.46 | Slovenia | 4.28 |
| Ireland | 2.04 | Finland | 2.35 | Spain | 4.03 |
| Portugal | 1.94 | Portugal | 2.05 | Italy | 3.89 |
| Austria | 1.79 | Slovenia | 1.96 | Finland | 3.78 |
| Sweden | 1.44 | Italy | 1.91 | Austria | 3.66 |
| Czechia | 1.32 | Czechia | 1.86 | Estonia | 3.17 |
| Finland | 1.14 | Cyprus | 1.74 | Slovakia | 2.79 |
| Bulgaria | 1.03 | The Netherlands | 1.64 | Czechia | 2.66 |
| Lithuania | 0.77 | France | 1.52 | France | 2.53 |
| Croatia | 0.58 | Sweden | 1.39 | Cyprus | 2.41 |
| Slovakia | 0.54 | Denmark | 1.22 | Denmark | 2.22 |
| Latvia | 0.39 | Austria | 1.09 | The Netherlands | 2.08 |
| Slovenia | 0.32 | Ireland | 0.90 | Sweden | 1.69 |
| Estonia | 0.24 | Germany | 0.78 | Germany | 1.21 |
| Cyprus | 0.18 | Malta | 0.71 | Malta | 1.02 |
| Luxembourg | 0.11 | Belgium | 0.63 | Belgium | 0.92 |
| Malta | 0.03 | Luxembourg | 0.23 | Luxembourg | 0.68 |
| Average | 3.70 | Average | 2.09 | Average | 4.67 |
Source: author’s own calculations based on Eurostat and World Bank.
Table 3.
Labour productivity, land productivity and productivity of energy consumption in agriculture in EU (2019).
Table 3.
Labour productivity, land productivity and productivity of energy consumption in agriculture in EU (2019).
| Country | Labour Productivity (Thousand EUR/AWU *) | Land Productivity (Thousand EUR/ha) | Productivity of Energy Consumption (Million EUR/Thousand Toe) |
|---|---|---|---|
| Austria | 64 | 2.82 | 5.89 |
| Belgium | 157 | 6.41 | 2.77 |
| Bulgaria | 23 | 0.86 | 10.02 |
| Croatia | 14 | 1.61 | 5.14 |
| Cyprus | 35 | 6.03 | 7.63 |
| Czechia | 54 | 1.56 | 2.77 |
| Denmark | 212 | 4.21 | 5.02 |
| Estonia | 53 | 1.01 | 2.49 |
| Finland | 77 | 2.09 | 2.05 |
| France | 106 | 2.65 | 7.88 |
| Germany | 126 | 3.51 | 6.22 |
| Greece | 28 | 2.31 | 22.13 |
| Hungary | 24 | 1.64 | 5.31 |
| Ireland | 53 | 1.88 | 12.93 |
| Italy | 52 | 4.40 | 12.11 |
| Latvia | 23 | 0.83 | 2.73 |
| Lithuania | 24 | 1.08 | 11.13 |
| The Netherlands | 186 | 16.04 | 2.84 |
| Poland | 16 | 1.81 | 2.67 |
| Portugal | 34 | 2.25 | 8.31 |
| Romania | 14 | 1.37 | 15.77 |
| Slovakia | 51 | 1.18 | 4.03 |
| Slovenia | 17 | 2.76 | 7.66 |
| Spain | 60 | 2.12 | 10.74 |
| Sweden | 109 | 2.00 | 2.47 |
| United Kingdom | 104 | 1.76 | 9.54 |
| Average | 68 | 3.00 | 7.19 |
* AWU—Annual Work Unit. Source: author’s own calculations based on Eurostat.
Table 4.
The values of coefficients of the linear combination (λ) of common technology for agriculture in particular EU Member States.
Table 4.
The values of coefficients of the linear combination (λ) of common technology for agriculture in particular EU Member States.
| Inefficient Agricultural Sectors in the Countries | Efficient Agricultural Sectors (Benchmarks) | ||||||
|---|---|---|---|---|---|---|---|
| Denmark | Ireland | Greece | Italy | Cyprus | The Netherlands | United Kingdom | |
| Austria | 0.20 | 0.08 | 0.03 | ||||
| Belgium | 0.36 | 0.43 | 0.15 | ||||
| Bulgaria | 0.30 | 0.15 | |||||
| Croatia | 0.05 | 0.03 | |||||
| Czechia | 0.43 | 0.04 | 0.03 | ||||
| Estonia | 0.05 | 0.01 | 0.01 | ||||
| Finland | 0.27 | 0.01 | 0.04 | ||||
| France | 4.67 | 0.10 | 0.50 | 0.60 | |||
| Germany | 4.69 | 0.12 | 0.09 | ||||
| Hungary | 0.24 | 0.29 | 0.05 | ||||
| Latvia | 0.07 | 0.04 | 0.02 | 0.01 | |||
| Lithuania | 0.13 | 0.18 | |||||
| Poland | 0.10 | 0.22 | 16.63 | ||||
| Portugal | 0.18 | 0.02 | 6.14 | ||||
| Romania | 1.60 | ||||||
| Slovakia | 0.01 | 0.06 | 0.01 | 0.05 | |||
| Slovenia | 0.03 | 0.02 | |||||
| Spain | 3.15 | 1.32 | 0.02 | ||||
| Sweden | 0.44 | 0.01 | 0.03 | ||||
Source: author’s own calculations.
Table 5.
Recommendations regarding reduction of agricultural input in particular countries in order to achieve efficiency.
Table 5.
Recommendations regarding reduction of agricultural input in particular countries in order to achieve efficiency.
| Inefficient Agricultural Sectors in the Countries | Utilised Agricultural Area (%) | Labour (%) | Fertilisers (%) | Energy Consumption (%) |
|---|---|---|---|---|
| Belgium | −7 | −7 | 62 | 7 |
| Bulgaria | 58 | 42 | 52 | 42 |
| Czechia | −58 | −58 | −59 | −58 |
| Germany | −15 | −15 | −17 | −15 |
| Estonia | −60 | −60 | −60 | −60 |
| Spain | −37 | −14 | −14 | −14 |
| France | −11 | −11 | −11 | −11 |
| Croatia | −55 | −68 | −74 | −55 |
| Latvia | −68 | −68 | −68 | −68 |
| Lithuania | −50 | −30 | −55 | −30 |
| Hungary | −49 | −49 | −63 | −49 |
| Austria | −41 | −15 | −15 | −15 |
| Poland | −64 | −64 | −82 | −64 |
| Portugal | −45 | −2 | −2 | −2 |
| Romania | −41 | −53 | −53 | −21 |
| Slovenia | −24 | −61 | −48 | −24 |
| Slovakia | −36 | −36 | −36 | −36 |
| Finland | −60 | −50 | −50 | −50 |
| Sweden | −57 | −40 | −40 | −40 |
Source: author’s own calculations.
Table 6.
Efficiency of greenhouse gas emissions from agriculture, 2019.
| Country | Efficiency of GHG Emissions, 2010 (EUR/t GHG) | Efficiency of GHG Emissions, 2019 (EUR/t GHG) | Change of Efficiency of GHG Emissions (2019/2010) (%) |
|---|---|---|---|
| Italy | 874 | 889 | 102 |
| Greece | 668 | 747 | 112 |
| Cyprus | 593 | 615 | 104 |
| Spain | 618 | 592 | 96 |
| The Netherlands | 546 | 543 | 99 |
| Croatia | 452 | 508 | 112 |
| Portugal | 421 | 398 | 95 |
| France | 368 | 381 | 104 |
| Austria | 363 | 360 | 99 |
| Romania | 378 | 350 | 93 |
| Hungary | 347 | 276 | 80 |
| Germany | 268 | 273 | 102 |
| Belgium | 260 | 266 | 102 |
| Poland | 258 | 252 | 98 |
| Denmark | 246 | 245 | 99 |
| Slovenia | 240 | 234 | 97 |
| Sweden | 226 | 223 | 98 |
| Finland | 217 | 218 | 100 |
| Bulgaria | 256 | 217 | 85 |
| United Kingdom | 190 | 187 | 98 |
| Estonia | 187 | 157 | 84 |
| Lithuania | 157 | 153 | 98 |
| Slovakia | 151 | 130 | 86 |
| Czechia | 128 | 118 | 92 |
| Latvia | 126 | 107 | 85 |
| Ireland | 76 | 68 | 90 |
| EU-28 | 362 | 358 | 99 |
Source: own calculation based on European Environment Agency and Eurostat.
Table 7.
Pearson’s correlation coefficients between efficiency of GHG emissions in agriculture in the EU countries and economic and energy efficiency and productivity of energy consumption in EU agriculture.
Table 7.
Pearson’s correlation coefficients between efficiency of GHG emissions in agriculture in the EU countries and economic and energy efficiency and productivity of energy consumption in EU agriculture.
| Pearson’s CORRELATION COEFFICIENTS | ||
|---|---|---|
| Tested Parameters | Correlation COEFFICIENTS between EFFICIENCY of GHG Emissions and | |
| rxy | p-Value | |
| Economic and energy efficiency (DEA method) | 0.405 | 0.040 |
| Productivity of energy consumption | 0.456 | 0.019 |
Source: own calculation.
Publisher’s Note: MDPI stays neutral with regard to jurisdictional claims in published maps and institutional affiliations. |
© 2021 by the author. Licensee MDPI, Basel, Switzerland. This article is an open access article distributed under the terms and conditions of the Creative Commons Attribution (CC BY) license (https://creativecommons.org/licenses/by/4.0/).
Share and Cite
MDPI and ACS Style
Domagała, J. Economic and Environmental Aspects of Agriculture in the EU Countries. Energies 2021, 14, 7826. https://doi.org/10.3390/en14227826
AMA Style
Domagała J. Economic and Environmental Aspects of Agriculture in the EU Countries. Energies. 2021; 14(22):7826. https://doi.org/10.3390/en14227826
Chicago/Turabian StyleDomagała, Joanna. 2021. "Economic and Environmental Aspects of Agriculture in the EU Countries" Energies 14, no. 22: 7826. https://doi.org/10.3390/en14227826
Note that from the first issue of 2016, this journal uses article numbers instead of page numbers. See further details here.