1. Introduction
Energy production from biogas is one part of the strategy of the Federal Government of Germany to achieve a modern, climate-friendly, sustainable and secure energy supply [
1]. By the year 2020, a share of at least 30% of the total gross electricity consumption is meant to come from renewable energies [
1]. Due to guaranteed feed-in tariffs for “green” electricity under the Renewable Energy Sources Act (EEG) from 2001 and its amended versions of 2004, 2009 and 2012, the number of biogas plants has grown rapidly [
2] and reached 5.905 in 2010, with an installed electrical capacity of 2,291 MW [
3]. According to certain predictions, the numbers of biogas plants in Germany will increase approximately to 7,521, with an installed electrical capacity of 3,185 MW, by the end of 2012 [
3,
4]. Electricity production from biogas accounted for 2.8% of the total electricity demand in 2011, supplying the grid with 17.5 TWh of electricity
per annum [
1]. The share of biogas in electricity supplied from renewable energy sources reached 14.4% in 2011 [
1]. With an increasing percentage of bioenergy produced from biogas, the question arises of whether this technology has a positive life-cycle assessment compared to others [
5,
6]. By using renewable energy crops as basic material for the anaerobic conversion to biogas, these substrates represent the main costs of biogas production. This means a great difference to other bioenergy sources such as wind and solar power which work on naturally supplied energy. The prices for biogas substrates on the market are volatile and may rise over time [
7]. However, the feed-in tariff is fixed and new tariffs are laid out by the Renewable Energy Sources Act in Germany and many other European countries [
8,
9], with a possible decrease [
7] in the future.
For these reasons, the energy efficiency of a biogas plant is of major importance both for the acceptance of the technology itself and for the profitability of such ventures. For the production of biogas it is at first necessary to produce raw materials with a high energy expenditure. These materials must then be transformed in a technical installation for fermentative conversion using electric power and different equipment [
10]. The use of this auxiliary energy input by the biogas plant reduces its net energy production and therefore reduces the positive climate balance of biogas production [
11].
The efficiency of energy conversion from biomass varies widely, depending on different technologies [
12]. The demand for auxiliary electric energy was measured by a program covering 61 BGP in various regions in Germany. It showed that 5%–10% of the produced electrical energy was used for conversion [
13]. Taking this as a reference, 2,291 MW/h electricity from biogas were fed into to the grid in 2010. Furthermore, calculations show that for a given electric energy consumption of 5%–10%, a CHP availability of 95% and an assumed energy price of 0.145 € [
14], the total expenditures for electricity vary between 138 and 276 Million € per year.
In practice, only a small number of biogas plants are equipped with sufficient measurement instrumentation. Most operators calculate their percentage of electric energy consumption from the invoices of the energy suppliers. In order to identify the main consumers of electric power on a biogas plants, several measuring activities and programs have been carried out. They showed that the results partly vary over a wide range [
11,
13,
15,
16,
17]. In 2005, a survey of the FNR revealed a variation from 1% to 6% of electric energy consumption in relation to the produced electric energy among the majority of the surveyed biogas plants. A study of Lehner and Effenberger [
18] on 10 agricultural biogas plants over a period of one to two years, with an electric capacity ranging from 250 to 526 kW, showed that the total energy consumption varied from 3.7% to 17.4% with an average of 8.8% of the produced electricity. Taking the total electric energy consumption into account, the consumer units CHP accounted for 30%–88%, the agitation units for 5.4%–57.8% and the solid feeding system for 0.9%–7.6%, giving an unequal distribution among the biogas plants. The authors pointed out that such substantial differences in electric energy consumption are mainly influenced by the technology applied and the individual plant operating conditions [
18]. A survey on 61 biogas plants in Germany showed a range from 5% to 20.7% of electricity, consumed with an average of 7.9%, also in relation to the total electric energy produced by the CHP unit [
13]. Electric energy consumption within a range from 3.5% to 17.5% an average of 8.2% was measured on six biogas plants by Dachs and Rehm, without taking into account the biological conditions at these plants [
16]. In order to increase the energy efficiency of biogas plants, the interaction of technical equipment and biological parameters have to be taken into consideration. Still, there is a lack of long-term as well as detailed measurement of all relevant electric consumers and their impact on microbial parameters. The "Intensive Measuring Program" project, financed with funds of the Landesstiftung Baden-Württemberg GmbH, aims to examine the influence of the process technology on the auxiliary electrical power consumption of the plant and its influence on the microbial conversion of the biomass. The survey is set on the research biogas plant “Unterer Lindenhof” of the University of Hohenheim.
The first project phase focused on measuring and analyzing the auxiliary energy input of this biogas plant. The aim was to examine in detail not only the entire auxiliary electric energy of the biogas plant, but also individual components as set out in this paper. Particularly, the combined heat and power plant (CHP) and its auxiliary drives was of special importance. On the basis of these results the energy production process could then be analyzed and optimized along the closed biomass material cycle.
2. Results and Discussion
2.1. Research Biogas Plant “Unterer Lindenhof”
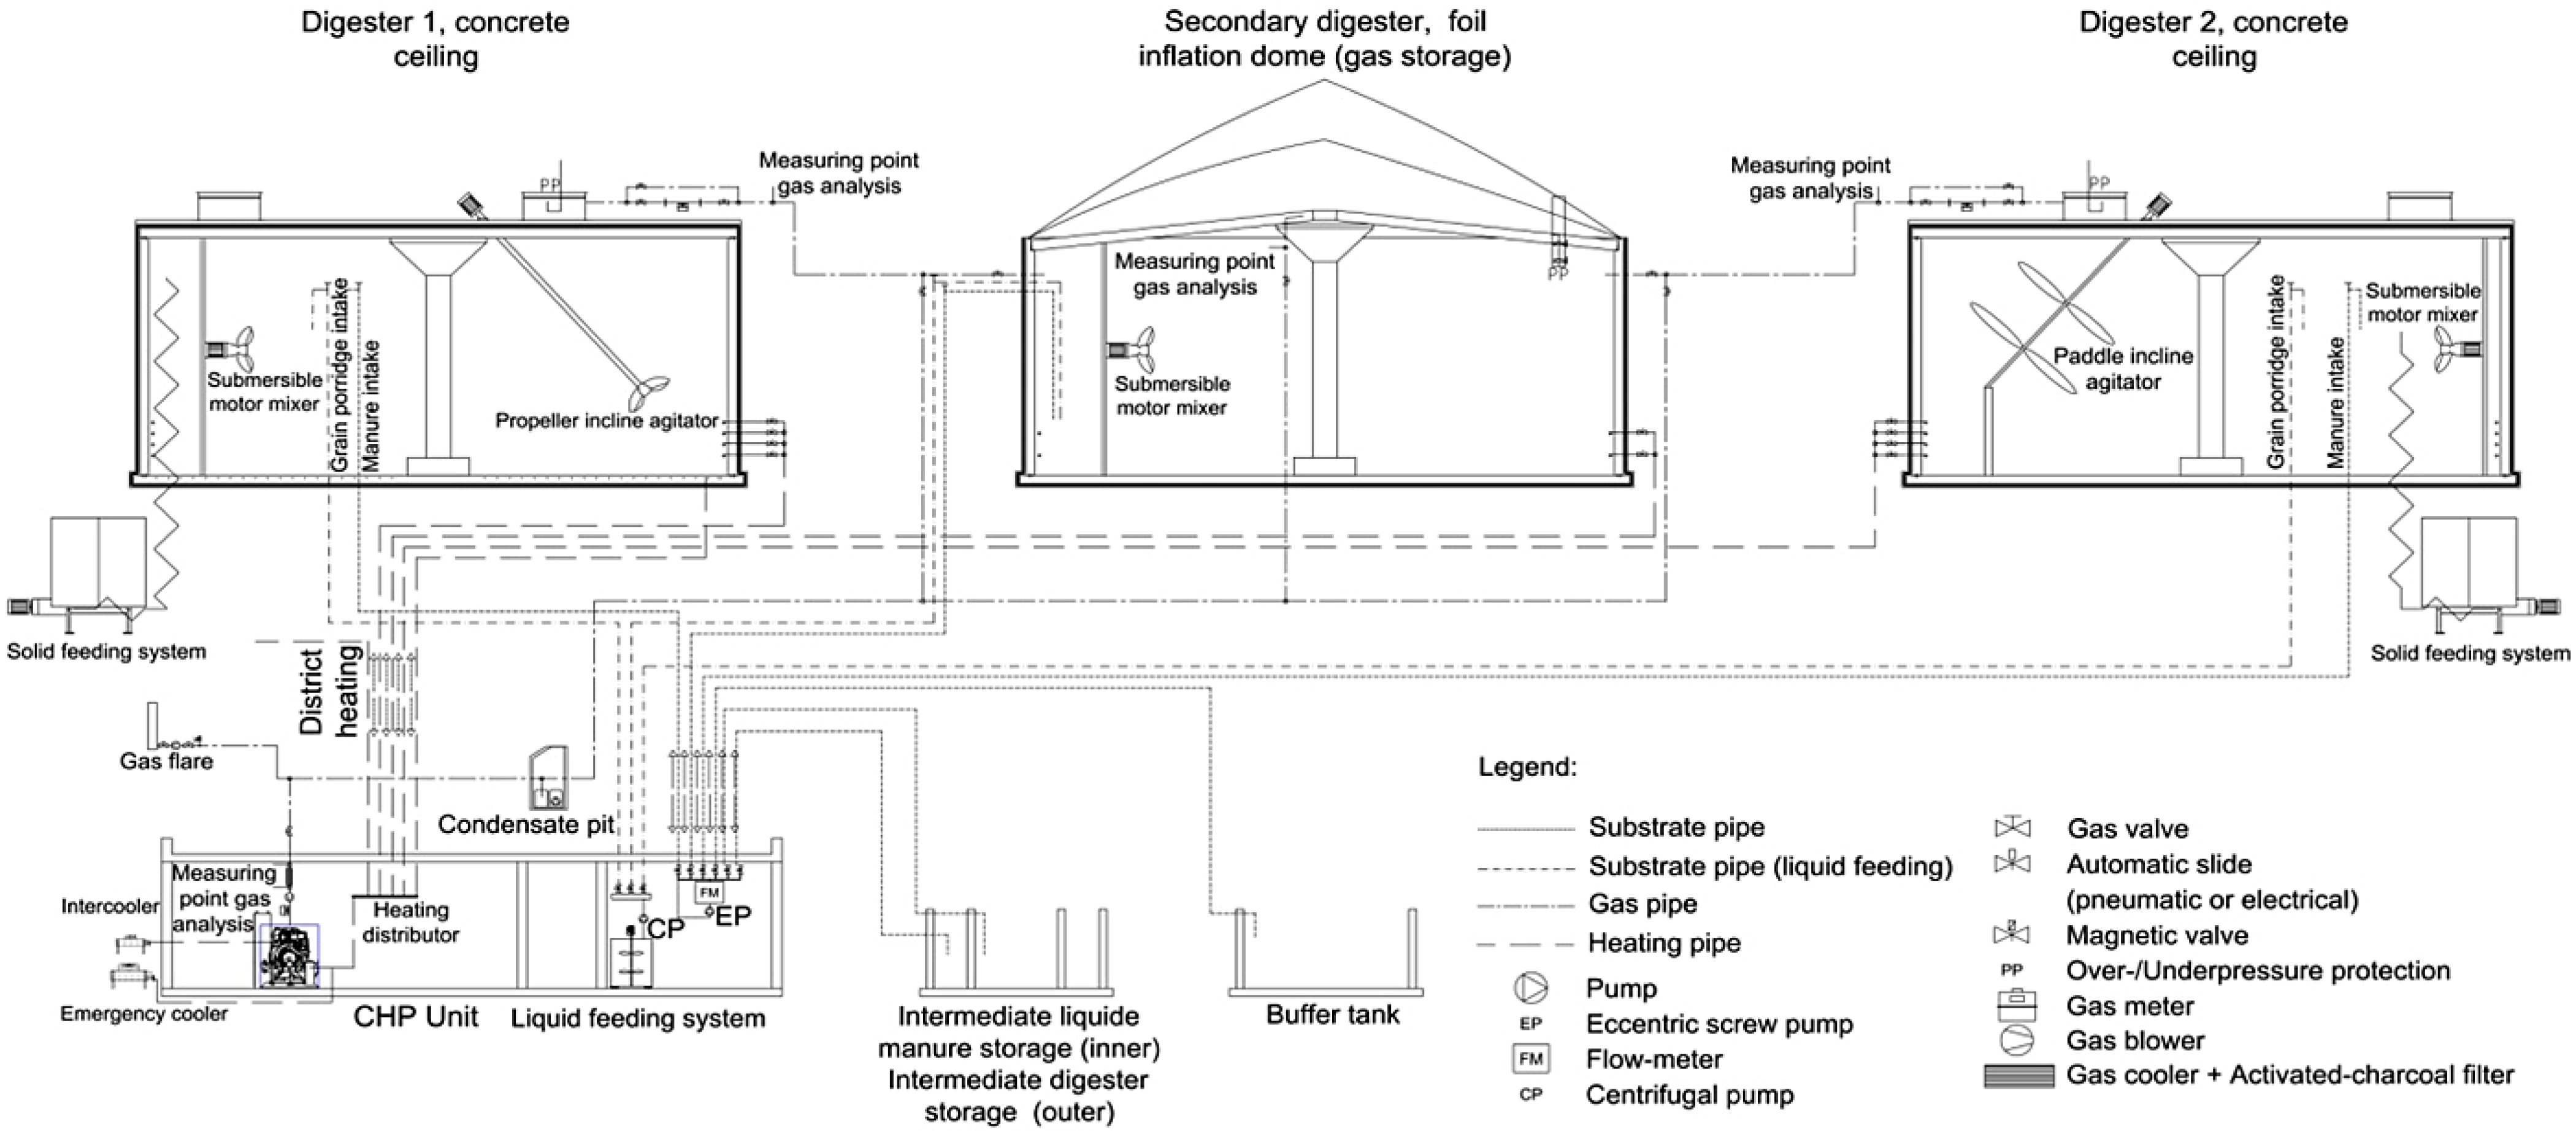
The research biogas plant of the University of Hohenheim is located at the “Lindenhof” agricultural research estate in the village of Eningen unter Achalm, 35 km south of Stuttgart. The substrates for the conversion process are manure in liquid and solid form (from the 220 livestock unit animal production there), as well as energy crops from 180 ha of arable land and grassland. All renewable energy crops, mainly grass silage, whole-plant grain silage, maize silage and special biogas crop-mixtures from the research fields are stored in five horizontal silos for all year operation. The substrate is premixed in two different vertical mixer systems and fed into the two digesters via two feeding screws. Since all crops are harvested with a forage harvester and cut to a size of 10–65 mm, no additional pretreatment is applied. The biogas plant consists of two digesters, covered with insulation concrete, and one secondary-digester, set up with a 300 m
3 foil inflation dome for gas storage. Every digester has a maximum volume of 923 m
3 and is equipped with different heating systems (
Figure 1). All heating systems can be run independently from each other. The digesters are all equipped with submersible motor mixers. Furthermore, digester no. 1 is set up with a propeller incline agitator, whereas digester No. 2 is fitted with a paddle incline agitator unit. The system is fed with a mixture of approximately eight tons of renewable energy crops and two tons of solid manure. Additionally, 6–10 m
3 of liquid manure are added per day. This input allows the six cylinder gas engine to run on 186 kW electrical and 202 kW thermal power. After transformation, the electrical power is fed into the local energy grid. The thermal power is primarily used for digester heating and supplies the thermal energy grid of the research station with the surplus energy. The remaining heat surplus is recooled in emergency cooler systems. The thermal output power extracted from the mixture cooling with 29 kW cannot be used, due to the construction setup. It is recooled with an emergency cooler system. The organic loading-rate related to the organic dry matter (BODM) equals 1.93 kg·m
−3 day
−1 oDM with a total hydraulic retention time (HRT) of 120 days. The standard procedure for desulfurization is carried out on a biological basis with a calculated amount of ambient air, injected into the gaseous phase of the digesters and the secondary digester. Before entering the engine, the gas passes through a gas processing module: at first, it reduces the content of water by active cooling. In a second step, it finally cleans H
2S residues from the gas with an activated-charcoal filter. In 2010 and 2011, a full scale external biological desulfurization plant was tested and replaced the internal desulfurization during this period for most of the time. The research biogas plant is designed to measure a maximum of different data for research and is therefore equipped with a central plant control unit for data collection, storage and evaluation. All substrates fed into the biogas process are weighed by the feeding systems or measured with a flow-meter. The substrate temperatures in the fermenting substrate, gas quality, gas temperature, as well as gas quantity are measured continuously in every digester. Samples of input substrates and digester substrate were taken at a weekly routine and analyzed for DM, oDM and volatile fatty acids content in a laboratory. Furthermore, the electrical and thermal energy demand was measured for every key consumer unit.
Figure 1.
Flow scheme of the investigated research biogas plant.
Figure 1.
Flow scheme of the investigated research biogas plant.
2.2. Electric Power Measurement
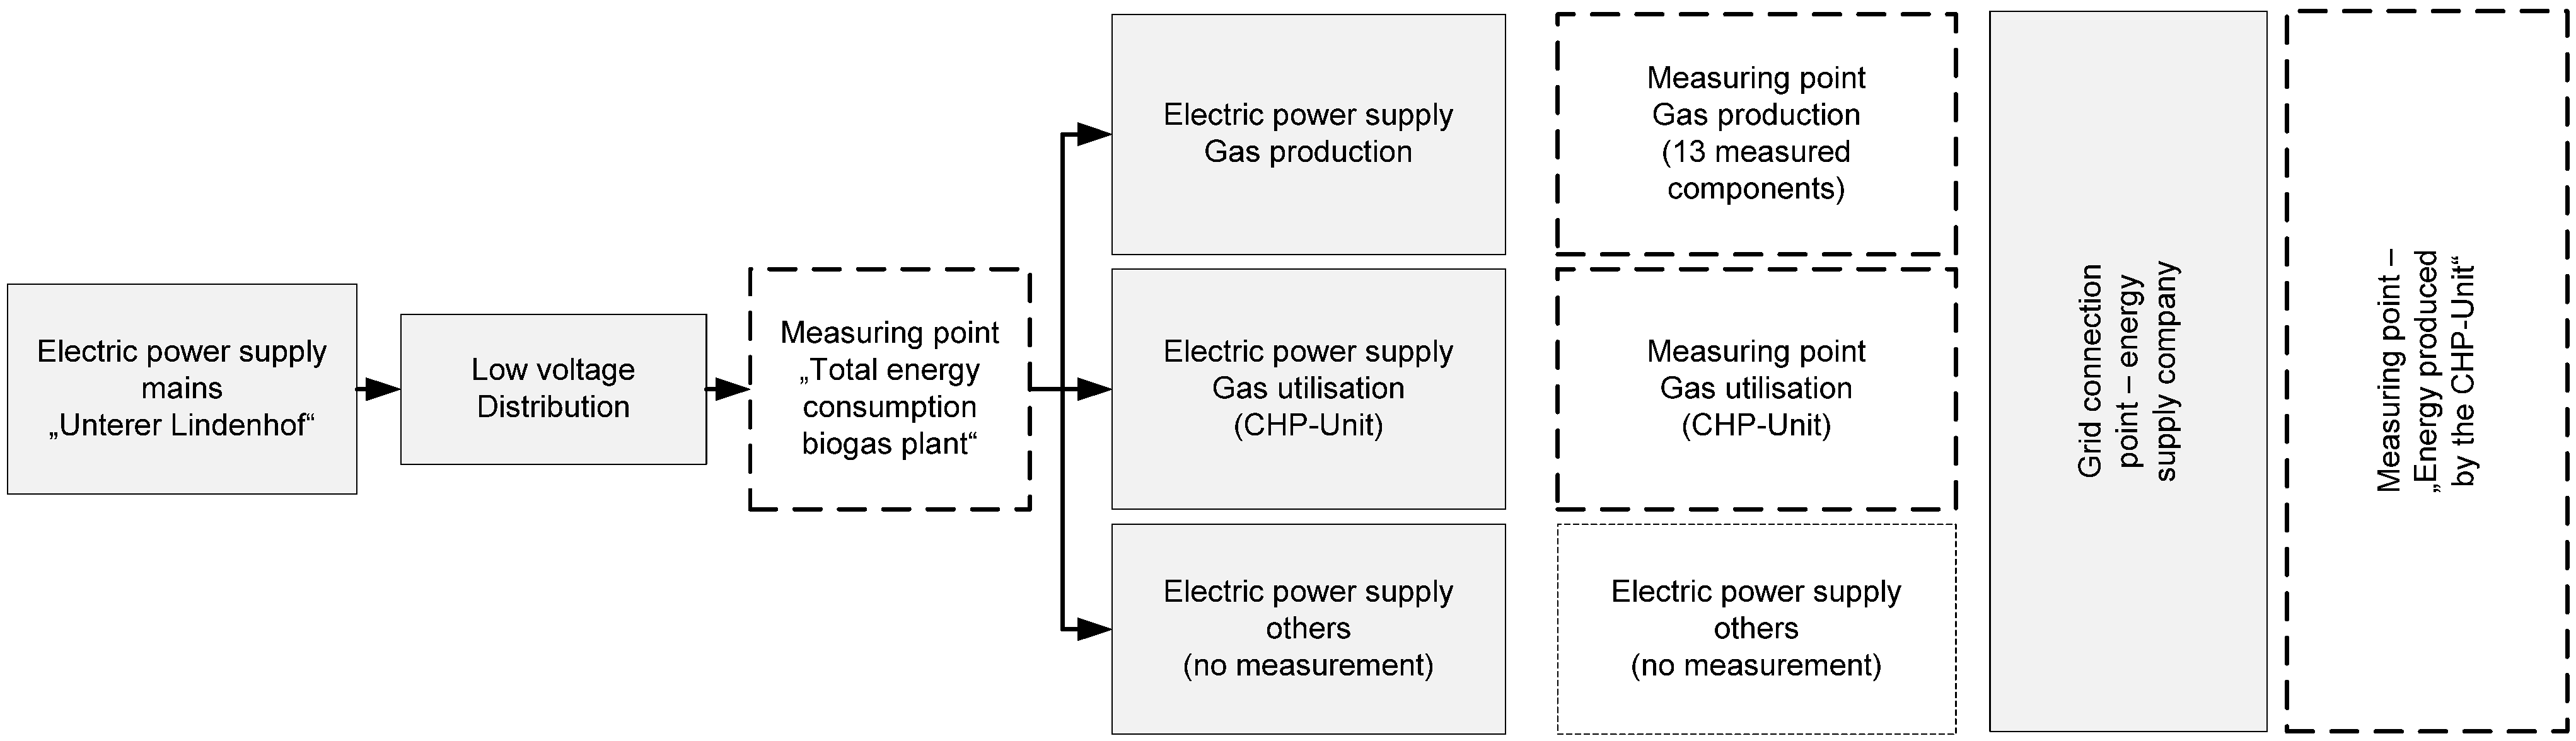
At the research biogas plant electricity is procured from the public power grid via a low voltage distribution (LVD) unit. The individual consumer units of the biogas plant (BGP)—gas production, gas utilization and light & power—are supplied separately from this LVD (
Figure 2). The path for gas production runs in a separate switch cabinet and is divided into 13 individual consumer units. The gas utilization path is located in the control cabinet of the CHP, where it is systematically divided into the individual power consumers of the CHP and its peripheral components. At the CHP electricity meter all CHP auxiliary drives and other auxiliary drives supplying the digesters are bundled together. In order to examine the CHP unit in detail, the individual components were monitored over several periods, using external measuring equipment. The results were then analyzed (
Table 1). All other small loads, such as outlet sockets and light, were combined in the light & power line, but not explicitly measured, due to their very low energy consumption.
Figure 2.
Electric power flow with measuring points at the University of Hohenheim research biogas plant.
Figure 2.
Electric power flow with measuring points at the University of Hohenheim research biogas plant.
The biogas plant was controlled and regulated via a programmable logic controller (PLC), which was joined to the Central Plant Control (CPC) unit via a network. The CPC represents the human machine interface and allows the operator to monitor and control the BGP over a graphic surface. The CPC of the research plant can automatically and simultaneously record, calculate, visualize and archive the data from all measuring points.
Three different methods were applied for the electric energy consumption:
three-phase electric power consumption measurement,
single-phase current measurement,
data acquisition from frequency converters.
2.3. Three Phase Measurement
A calibration-capable, electronic three-phase transformer connected meter (ABB DAB 13000) was used to measure the entire active power input of the biogas plant. This instrument was used for measuring an electric current >80 A via current transformers.
The ABB DBB 23000 meter, used to measure the CHP unit power consumption, measures the current up to 80 A directly at the mains. Each meter was connected with voltage and current coils, using the three watt-meter method, (for three phase 4-wire circuits with a neutral conductor). The meters are able to deal with asymmetrical and symmetrical loads, measuring current (A), voltage (V), frequency (Hz), power factor (cos φ), apparent power (S) and reactive power (Q). The active power (P) is calculated from this source. The electric meter multiplies time (t) with active power, resulting in electric energy consumption. The electric power production of the CHP unit is measured by a manufacturer specific three phase meter. Electronic meters contain analog–digital (AD) converters which generate a digital signal from an analog voltage, current output of the voltage or of a current measuring transformer [
7,
19]. The microprocessors of the ABB electric meters are able to determine the phase displacement between current and voltage curve from the digitized output values of the AD converters. In a further step, they can calculate the cos φ.
A high precision measurement is achieved with a display error of ±2% related to the N-value of the measuring range, hereby taking all three phases into account. The data from the three meters is transferred to the digital inputs module of the PLC via potential-free contacts. An impulse of 100 ms corresponds to one kilowatt hour electric power demand, which has passed through the meter. The PLC adds up the electric power demand as a cumulative meter value and ensures that the values are achieved and visualized by using the network connection to the CPC.
2.4. Single Phase Measurement
In a 3-phase system it can be assumed that the average power is balanced. Therefore, the current intensity virtually displays the same curve for all phases [
19]. Power consumption measurements for three-phase motors can then be carried out with sufficient precision and subsequent conversion on only one phase. In the case of current transformer measuring transducers, the magnetic field of the primary current to be measured induces a secondary current of 4 to 20 mA (on a coil, depending on the consumer load) [
19]. This analog signal is transmitted directly to the PLC at the research plant. The active power is calculated by the PLC from the measured current and from the given fixed factor voltage and cos φ. The voltage was assumed to be 400 V, and at the beginning of measurements the value of 0.8 was filed for the power factor cos φ (for all electric motors) and subsequently adapted specifically for each unit. The consumed electric power was added together as a cumulative meter value in kWh and finally transferred to the CPC for visualization and archiving.
2.5. Frequency Converter Measurements
The auxiliary energy demand (in kWh) of units operated via frequency converters (
Table 2) can be read off directly from the units and transmitted to the PLC. Again, the consumed electric power was added together as a cumulative meter value in kWh and transferred to the CPC for visualization and archiving.
Table 1.
Overview of the auxiliary units at the CHP and measuring methods.
Table 1.
Overview of the auxiliary units at the CHP and measuring methods.
| No. | Unit | Measuring method | Active power factor cos φ |
|---|
| 1 | Gas cooler | Single-phase current measurement | 0.757 (measured) |
| 2 | Heating-circuit pump | Single-phase current measurement | 0.72 (measured) |
| 3 | CHP-control unit + aux power units | Single-phase current measurement | 0.797 (read at the type plate) |
| 4 | Gas compressor | Single-phase current measurement | 0.755 (measured) |
| 5 | CHP Compartment fan | Single-phase current measurement | 0.58 (read at the type plate) |
| 6 | Engine lubricating oil pump | Single-phase current measurement | 0.9 (manufacturers information) |
| 7 | Biogas mixture cooler pump | Single-phase current measurement | 0.762 (measured) |
| 8 | Biogas mixture cooler fan | Single-phase current measurement | 0.797 (read at the type plate) |
| 9 | Emergency cooler pump | Single-phase current measurement | 0.855 (measured) |
| 10 | Emergency cooler fan | Three-phase current measurement | Recorded during the measuring cycle |
Table 2.
Measured unit, measuring method and electric driving power of the units.
Table 2.
Measured unit, measuring method and electric driving power of the units.
| No | Unit | Measuring method | Driving power |
|---|
| 1 | Propeller incline agitator digester 1 | Frequency converter “Danfoss VLC FC 300” | 15 kW |
| 2 | Submersible motor mixer digester 1 | Single phase | 13 kW |
| 3 | Paddle incline agitator digester 2 | Frequency converter “Fuji Electric FA Frenic 5000” | 11 kW |
| 4 | Submersible motor mixer digester 2 | Single phase | 13 kW |
| 5 | Vertical mixer 1—Solid feeding system digester 1 | Single phase | 22 kW |
| 6 | Vertical mixer 2—Solid feeding system digester 1 | Single phase | 22 kW |
| 7 | Feeding screws—Solid feeding system digester 1 | Single phase | 5.5 kW |
| 8 | Vertical mixer—Solid feeding system digester 2 | Single phase | 37 kW |
| 9 | Feeding screw 1—Solid feeding system digester 2 | Frequency converter “Danfoss VLC FC 300” | 3 kW |
| 10 | Feeding screw 2—Solid feeding system digester 2 | Frequency converter “Danfoss VLC FC 300” | 7.5 kW |
| 11 | Submersible motor mixer—Storage tank | Single phase | 7.5 kW |
| 12 | Submersible motor mixer—Secondary digester | Single phase | 13 kW |
| 13 | Manure pump | Frequency converter “Danfoss VLC FC 300” | 11 kW |
| 14 | Energy counter biogas plant | Three phase | - |
| 15 | CHP-electric energy production | Three phase | - |
| 16 | CHP-electric energy consumption | Three phase | - |
2.6. Additional Measuring Equipment
A HIOKI power quality analyser (3197) with current clamps (9660) was used to measure the auxiliary energy input of all CHP auxiliary units. This measuring device allows the measuring of both single-phase and three-phase current intensities of the individual units for the AC current. Electric current and voltage are determined for the unit over all three phases. The equipment-specific cos φ was measured in advance where possible, or taken from the unit’s data sheet. In order to measure a large number of auxiliary units at the same time, the current intensity of one phase was measured at all units and recorded every five minutes. Afterwards, the electric energy consumption in kWh was calculated from current intensity, voltage, cos φ and time unit.
2.7. Data Processing
The data acquisition and monitoring started in October 2008 with a full year of data verification and adjustment of measuring equipment. However, by November 2009 not all data was consistent and representative and therefore not of use for evaluations. As a consequence, the data presented in this paper covers two years, starting from January 2010 to December 2011. At the CPC, the measured data is available in four different compression stages (minutes, hour, day, and month). For further processing, the required data was downloaded, formatted and checked for outliers due to measurement failures. The proportion of electric energy consumption in relation to electric energy, produced by the CHP unit, was calculated as follows:
Table 3 gives a summary of all electrical and additional units used for calculating the results.
Table 3.
Summary of electrical and additional units.
Table 3.
Summary of electrical and additional units.
| Unit | Unit abbreviation | Symbol |
|---|
| Voltage | U | Volt [V] |
| Current | I | Ampere [A] |
| Active power | P | Kilowatt [kW] |
| Power factor | cos φ | - |
| Electric energy consumption | P | Kilowatt hours [kWh] |
| Time | t | [min] |
| Electric energy consumption | - | [%] |
3. Results
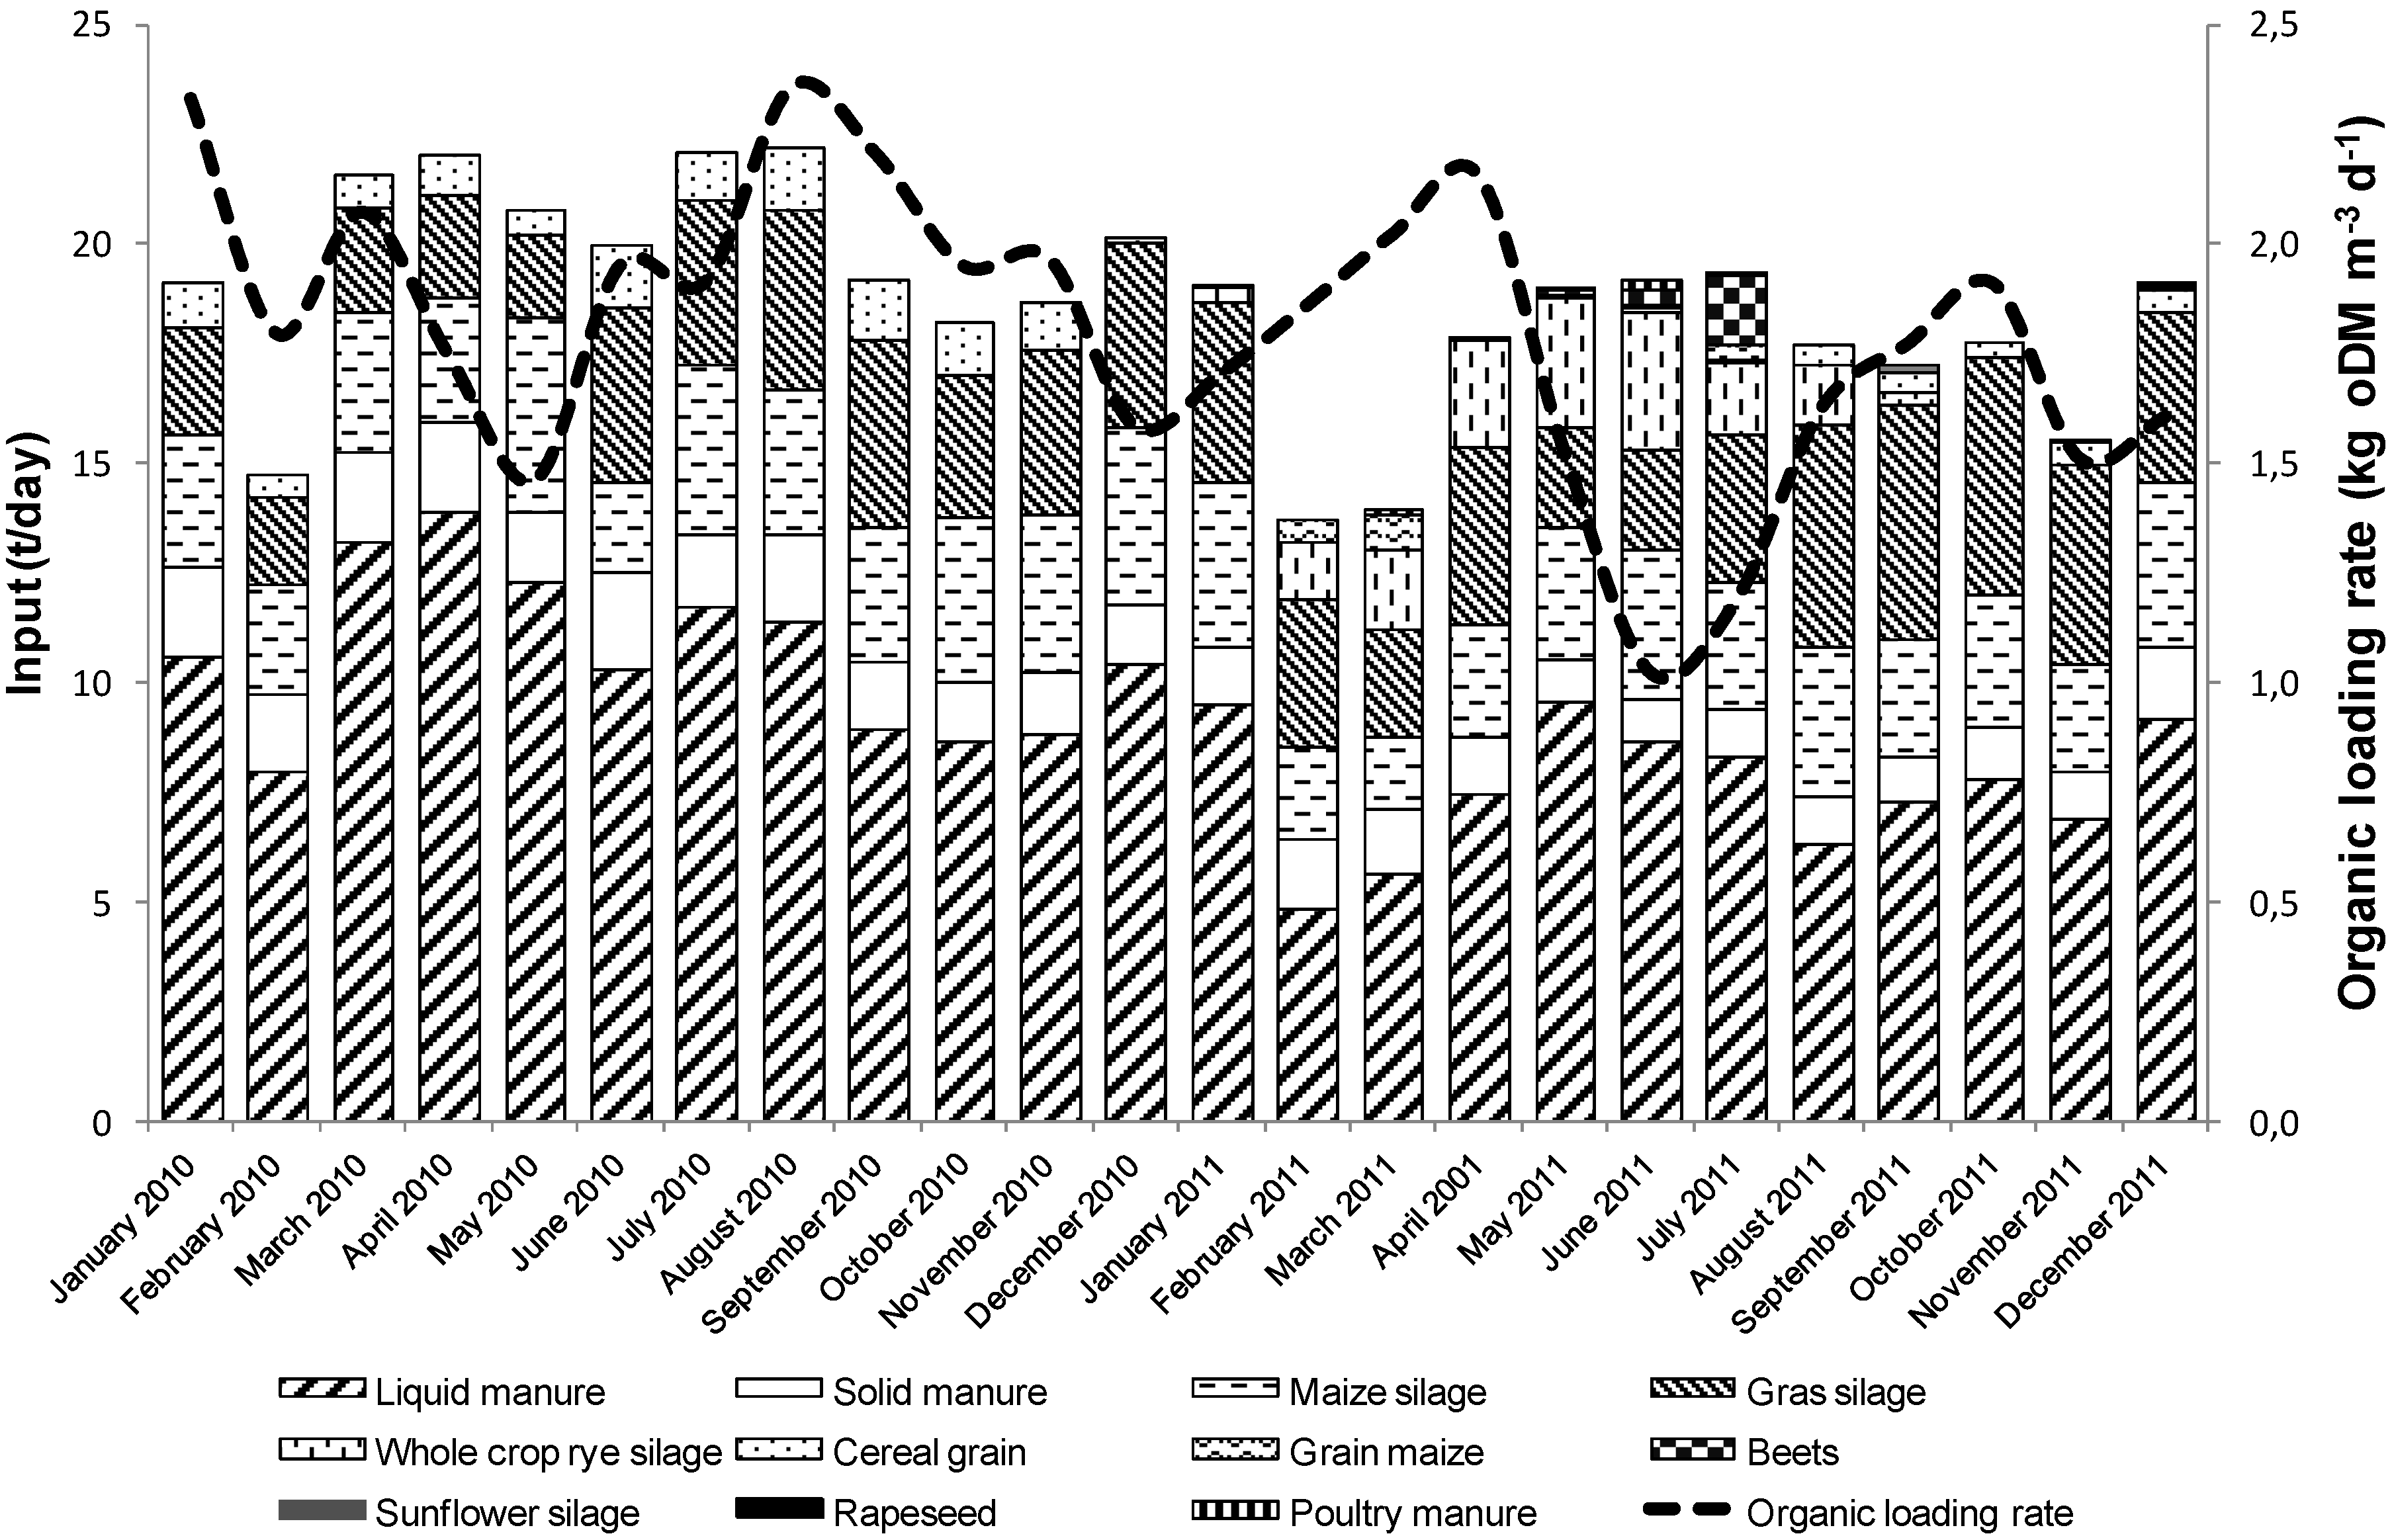
As shown in
Figure 3 a wide variation within the substrates fed to the digester was observed (for the investigated time). This variation is caused by the changing availability of material at the farm, special research arrangements and technical faults of the solid-feeding systems or the manure pump. A mixture of liquid manure from cattle and pig husbandry with a share of more than 60% was the basis for biogas production. In addition, maize- grass-, and whole plant silage, as well as solid manure and grain were the main energy sources supplied to the digesters. Crops from research fields covered the remaining demand, but did not provide a major share of the feed. Fluctuations in liquid manure supply depend on the livestock units held on the farm and the amount of rainfall on the free-range areas for animals.
Figure 3.
Boxplot of input substrates for the years 2010 and 2011.
Figure 3.
Boxplot of input substrates for the years 2010 and 2011.
Higher amounts are generally more common during the winter housing season. Livestock units were reduced at the end of 2010, due to structural changes on the farm (
Figure 4). This led to a lower supply of liquid manure. The feed of solid manure, maize- and grass-silage was however stable throughout the years.
Table 4 shows the mean and STD of DM and oDM of the feeding substrates over the measured period.
Table 4.
Characteristics of dry matter (DM) and organic dry matter (oDM) of the main feeding substrates for the years 2010 and 2011.
Table 4.
Characteristics of dry matter (DM) and organic dry matter (oDM) of the main feeding substrates for the years 2010 and 2011.
| Input substrates | DM [% FM] | oDM [% DM] |
|---|
| SD | | SD |
|---|
| Liquid_Manure | 3.10 | ±1.47 | 67.54 | ±6.41 |
| Solid_Manure | 33.60 | ±9.98 | 68.39 | ±14.2 |
| Poultry_manure | 49.90 | ±25.4 | 88.14 | ±1.88 |
| Maize_silage | 31.30 | ±4.29 | 95.41 | ±1.10 |
| Gras_silage | 32.22 | ±12.33 | 89.05 | ±3.07 |
| Whole_crop_silage | 46.27 | ±4.24 | 92.93 | ±2.06 |
| Cereal_grain | 86.62 | ±0.85 | 97.70 | ±0.47 |
| Beets | 16.80 | ±NA | 69.90 | ±NA |
| Sunflower_silage | 16.88 | ±NA | 78.68 | ±NA |
The DM for all substrates changed during the period due to different harvesting times, qualities or storage conditions. However, the values were in accordance with the general state of knowledge and therefore fulfilled the expectations. From December 2010 to February 2011 no grain was fed to the biogas plant, due to storage capacity problems. The organic loading rate (OLR) varied at a low level: between 1.5 and 2.3 kg m
−3 day
−1) oDM for both digesters (
Figure 4). During the observed period the digestion process showed very stable conditions, while chemical digester conditions were always measured below the detection limit.
Figure 4.
Substrate input for 2010 and 2011 and its corresponding organic loading rate.
Figure 4.
Substrate input for 2010 and 2011 and its corresponding organic loading rate.
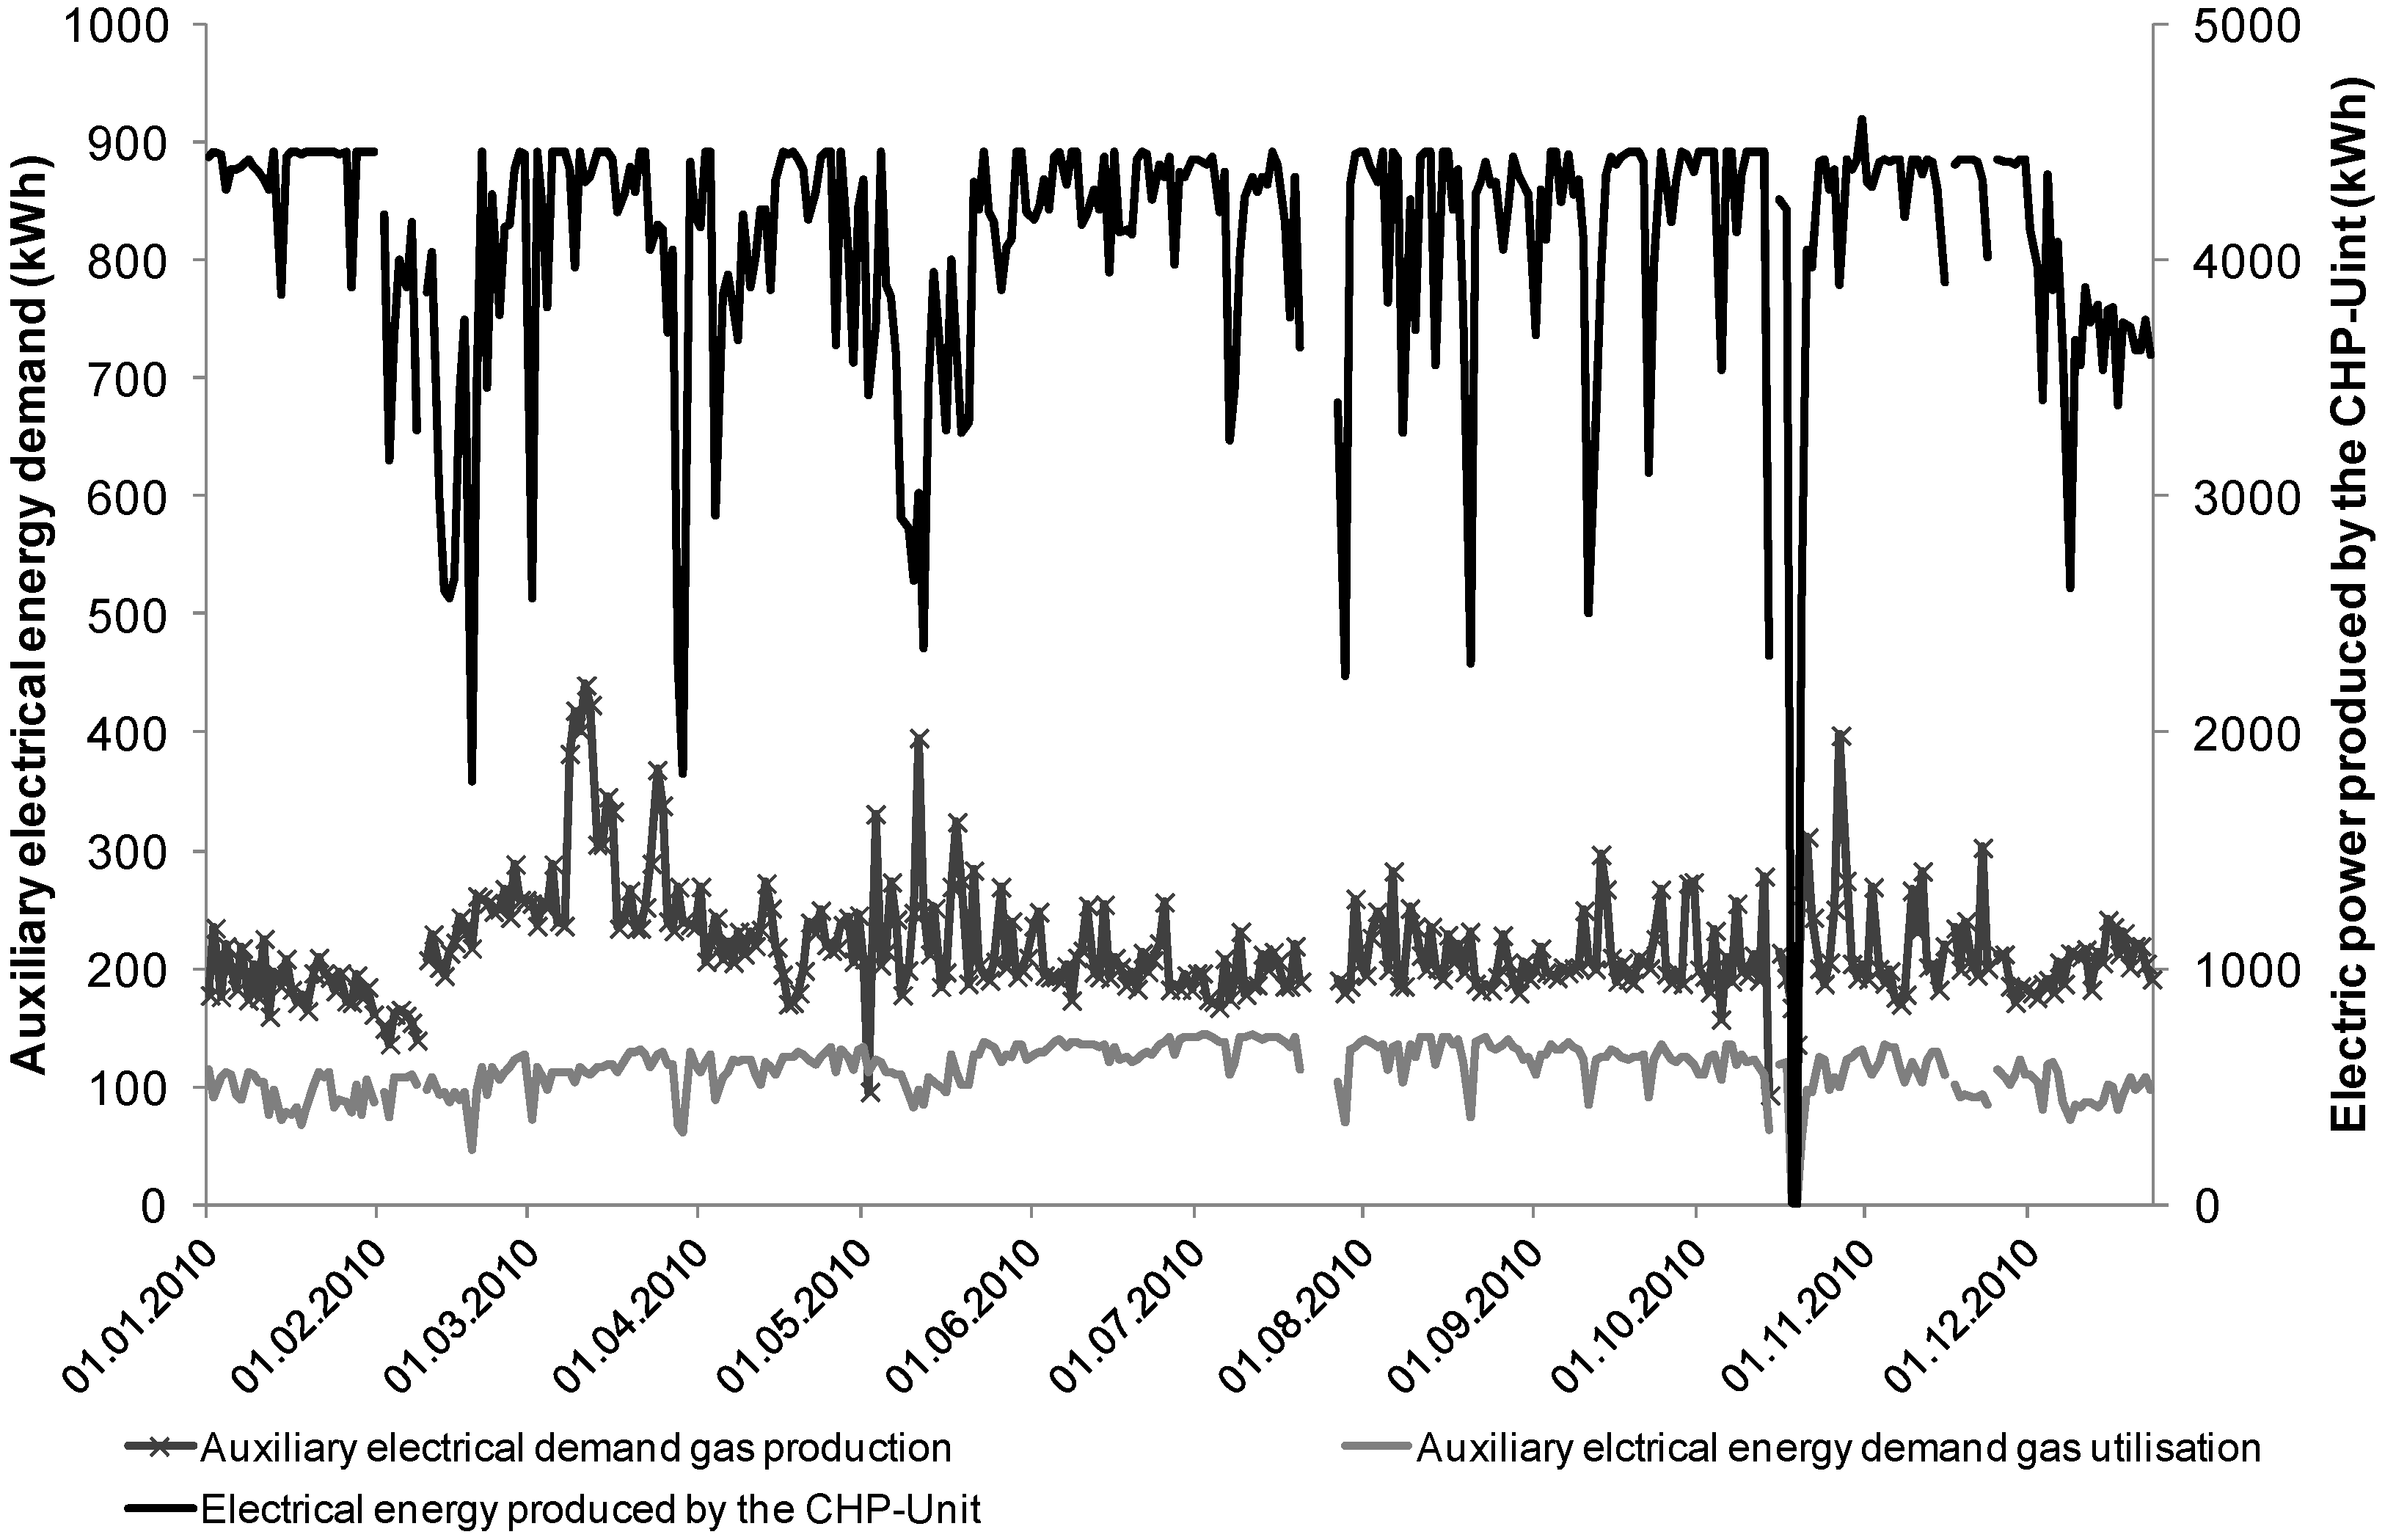
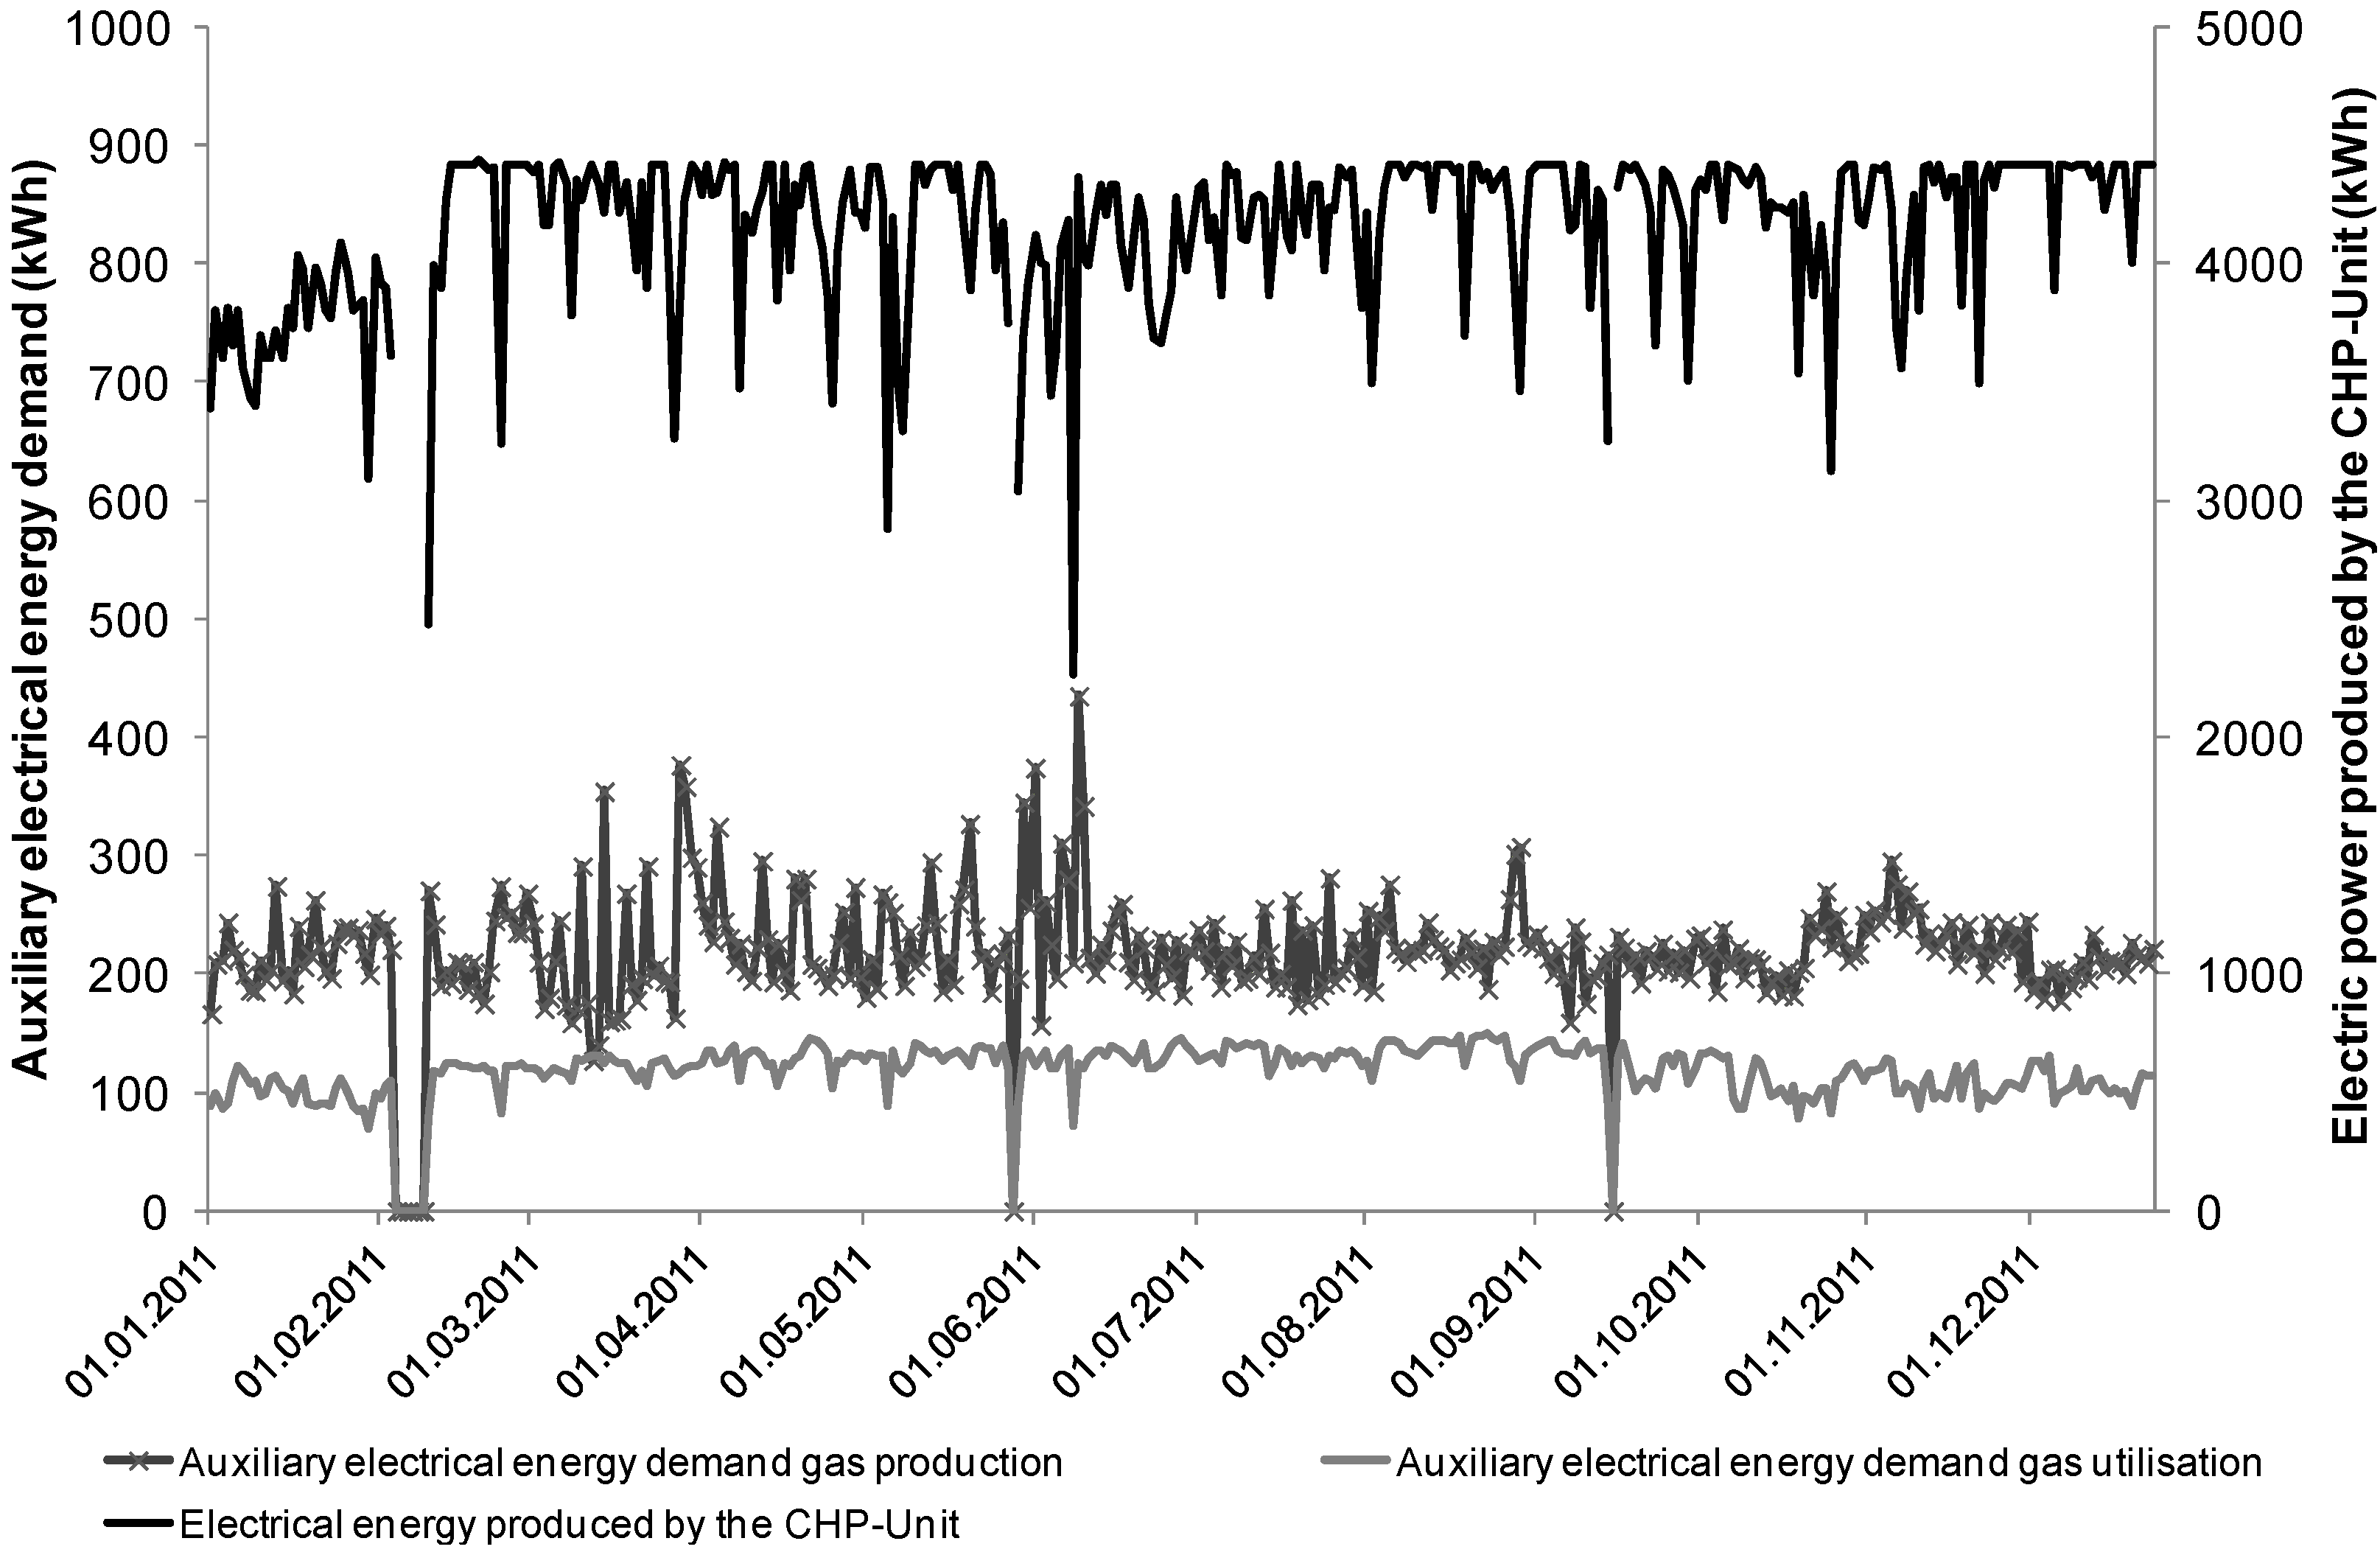
The recorded results depicted in
Figure 5 and
Figure 6 show the daily distribution of electrical power produced and procured over the measured period 2010–2011. The procured electrical power is displayed in two lines—the consumer units for gas utilization and gas production. The sum of both lines equals the total electrical energy demand of the biogas plant. Failures in the CPC which lead to falsely recorded data were erased. The characteristic of electrical energy produced by the CHP shows that the engine was running on full capacity for most of the time, only interrupted by maintenance intervals: 10 times for 600 h and five times for 1,800 h each year. As shown in the graphs, fluctuation in gas production leads to lower electric energy production (up to 10% of the possible maximum), due to changes in research questions, variation of raw materials or defects in the feeding systems. From December 2010 on, the gas production was reduced because no grain was added to the process. This naturally leads to a lower amount of biogas and therefore a lower electrical energy production (until February 2011). The demand for auxiliary electric energy for the gas production shows a stable distribution for most of the year. In March and April 2010, the demand for electric energy increased due to higher stirring activity, based on the feeding of large quantities of whole plant silage. Peaks in the demand for electric energy (in the gas production) occur from stirring of the digesters. This is done by submersible motor mixers in order to avoid sinking layers. From March to May 2011 the demand for electric energy of the stirring fluctuated and stayed at a higher level due to experiments on the agitation units. A breakdown of the CPC lead to a failure of the data recording in July 2010 (
Figure 5) and February 2011 (
Figure 6).
Figure 5.
Electric energy produced and procured by the BGP in the measured period 2010.
Figure 5.
Electric energy produced and procured by the BGP in the measured period 2010.
Figure 6.
Electrical energy produced and procured by the BGP in the measured period 2011.
Figure 6.
Electrical energy produced and procured by the BGP in the measured period 2011.
The demand for auxiliary energy for gas utilization also shows a balanced distribution between 80 and 140 kWh/day over the measured period. Engine stops lead to decreased energy consumption in the CHP and its auxiliary units (for the time not running). The demand is moreover influenced by the seasons. In winter and spring, when the demand for thermal power is at its maximum, the supply of thermal power increased, whereas the consumption of electric energy for cooling pumps and fans declined.
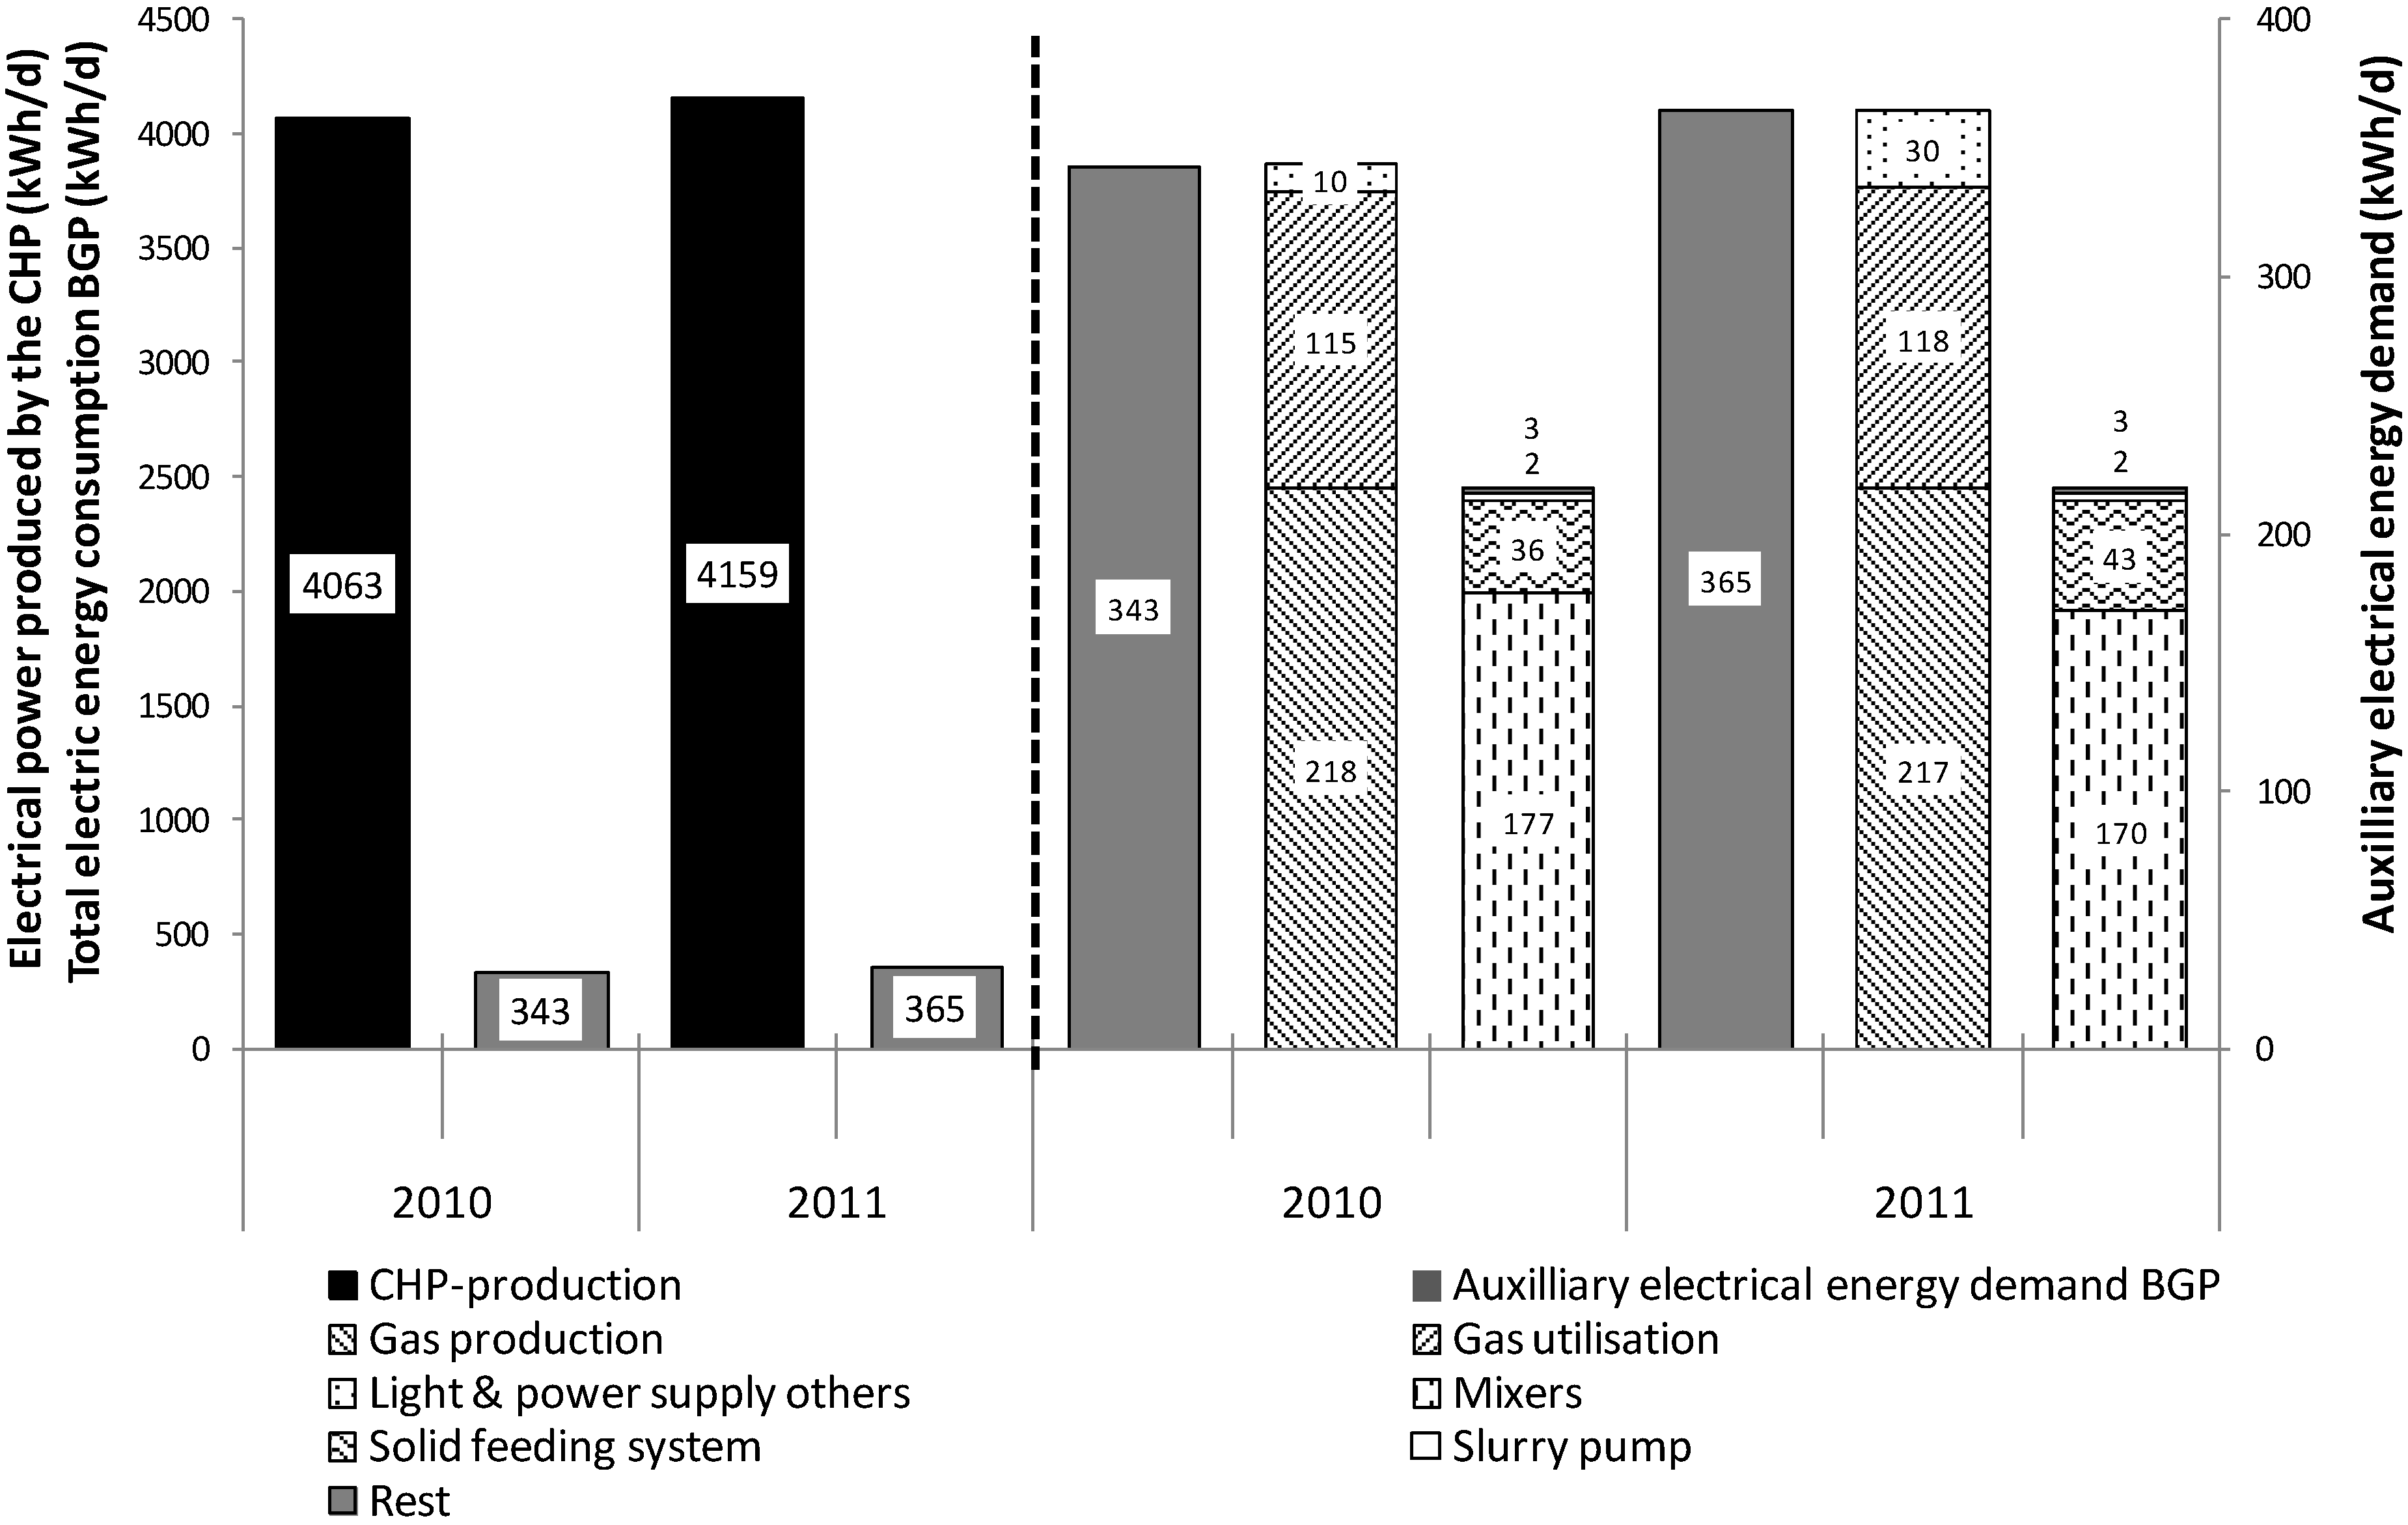
Figure 7 shows the energy produced and procured in 2010 and 2011 (calculated for an average day). The mean value of produced electric energy reached 4063 kWh/day in 2010, while the energy consumed by the auxiliary units added up to 343 kWh/day—leading to a total energy demand of 8.4%. The path for gas production is the biggest consumer and has a requirement of 218 kWh/day, which represents 63% of the total energy demand of the BGP. The path for gas utilization reaches 115 kWh/day (33% of total energy demand of the BGP) whereas the light and power supply reaches 10 kWh/day (3% of the total energy demand of the BGP). A deeper insight in the distribution of the gas utilization path shows that the agitators with 177 kWh/day are the most demanding consumer group, followed by the solid feeding systems with 36 kWh/day. In summary, the agitators consumed 51.6% of the total consumed energy, this being a 4.3% share of the energy produced by the CHP unit. An almost comparable distribution was measured for the year 2011 with a slight rise (2%) in electric energy consumption to 4159 kWh. At the same time, the consumed electric energy increased by 6% to 365 kWh. The only appreciable change measured was an increase in light and power consumption from 10 to 30 kWh a day, due to the supply of electric energy to an external desulfurization plant at the BGP. The amount of electric energy for agitation declined in 2011 by 4% in comparison to the previous year.
Figure 7.
Electrical energy production and consumption of the entire BGP for 2010 and 2011.
Figure 7.
Electrical energy production and consumption of the entire BGP for 2010 and 2011.
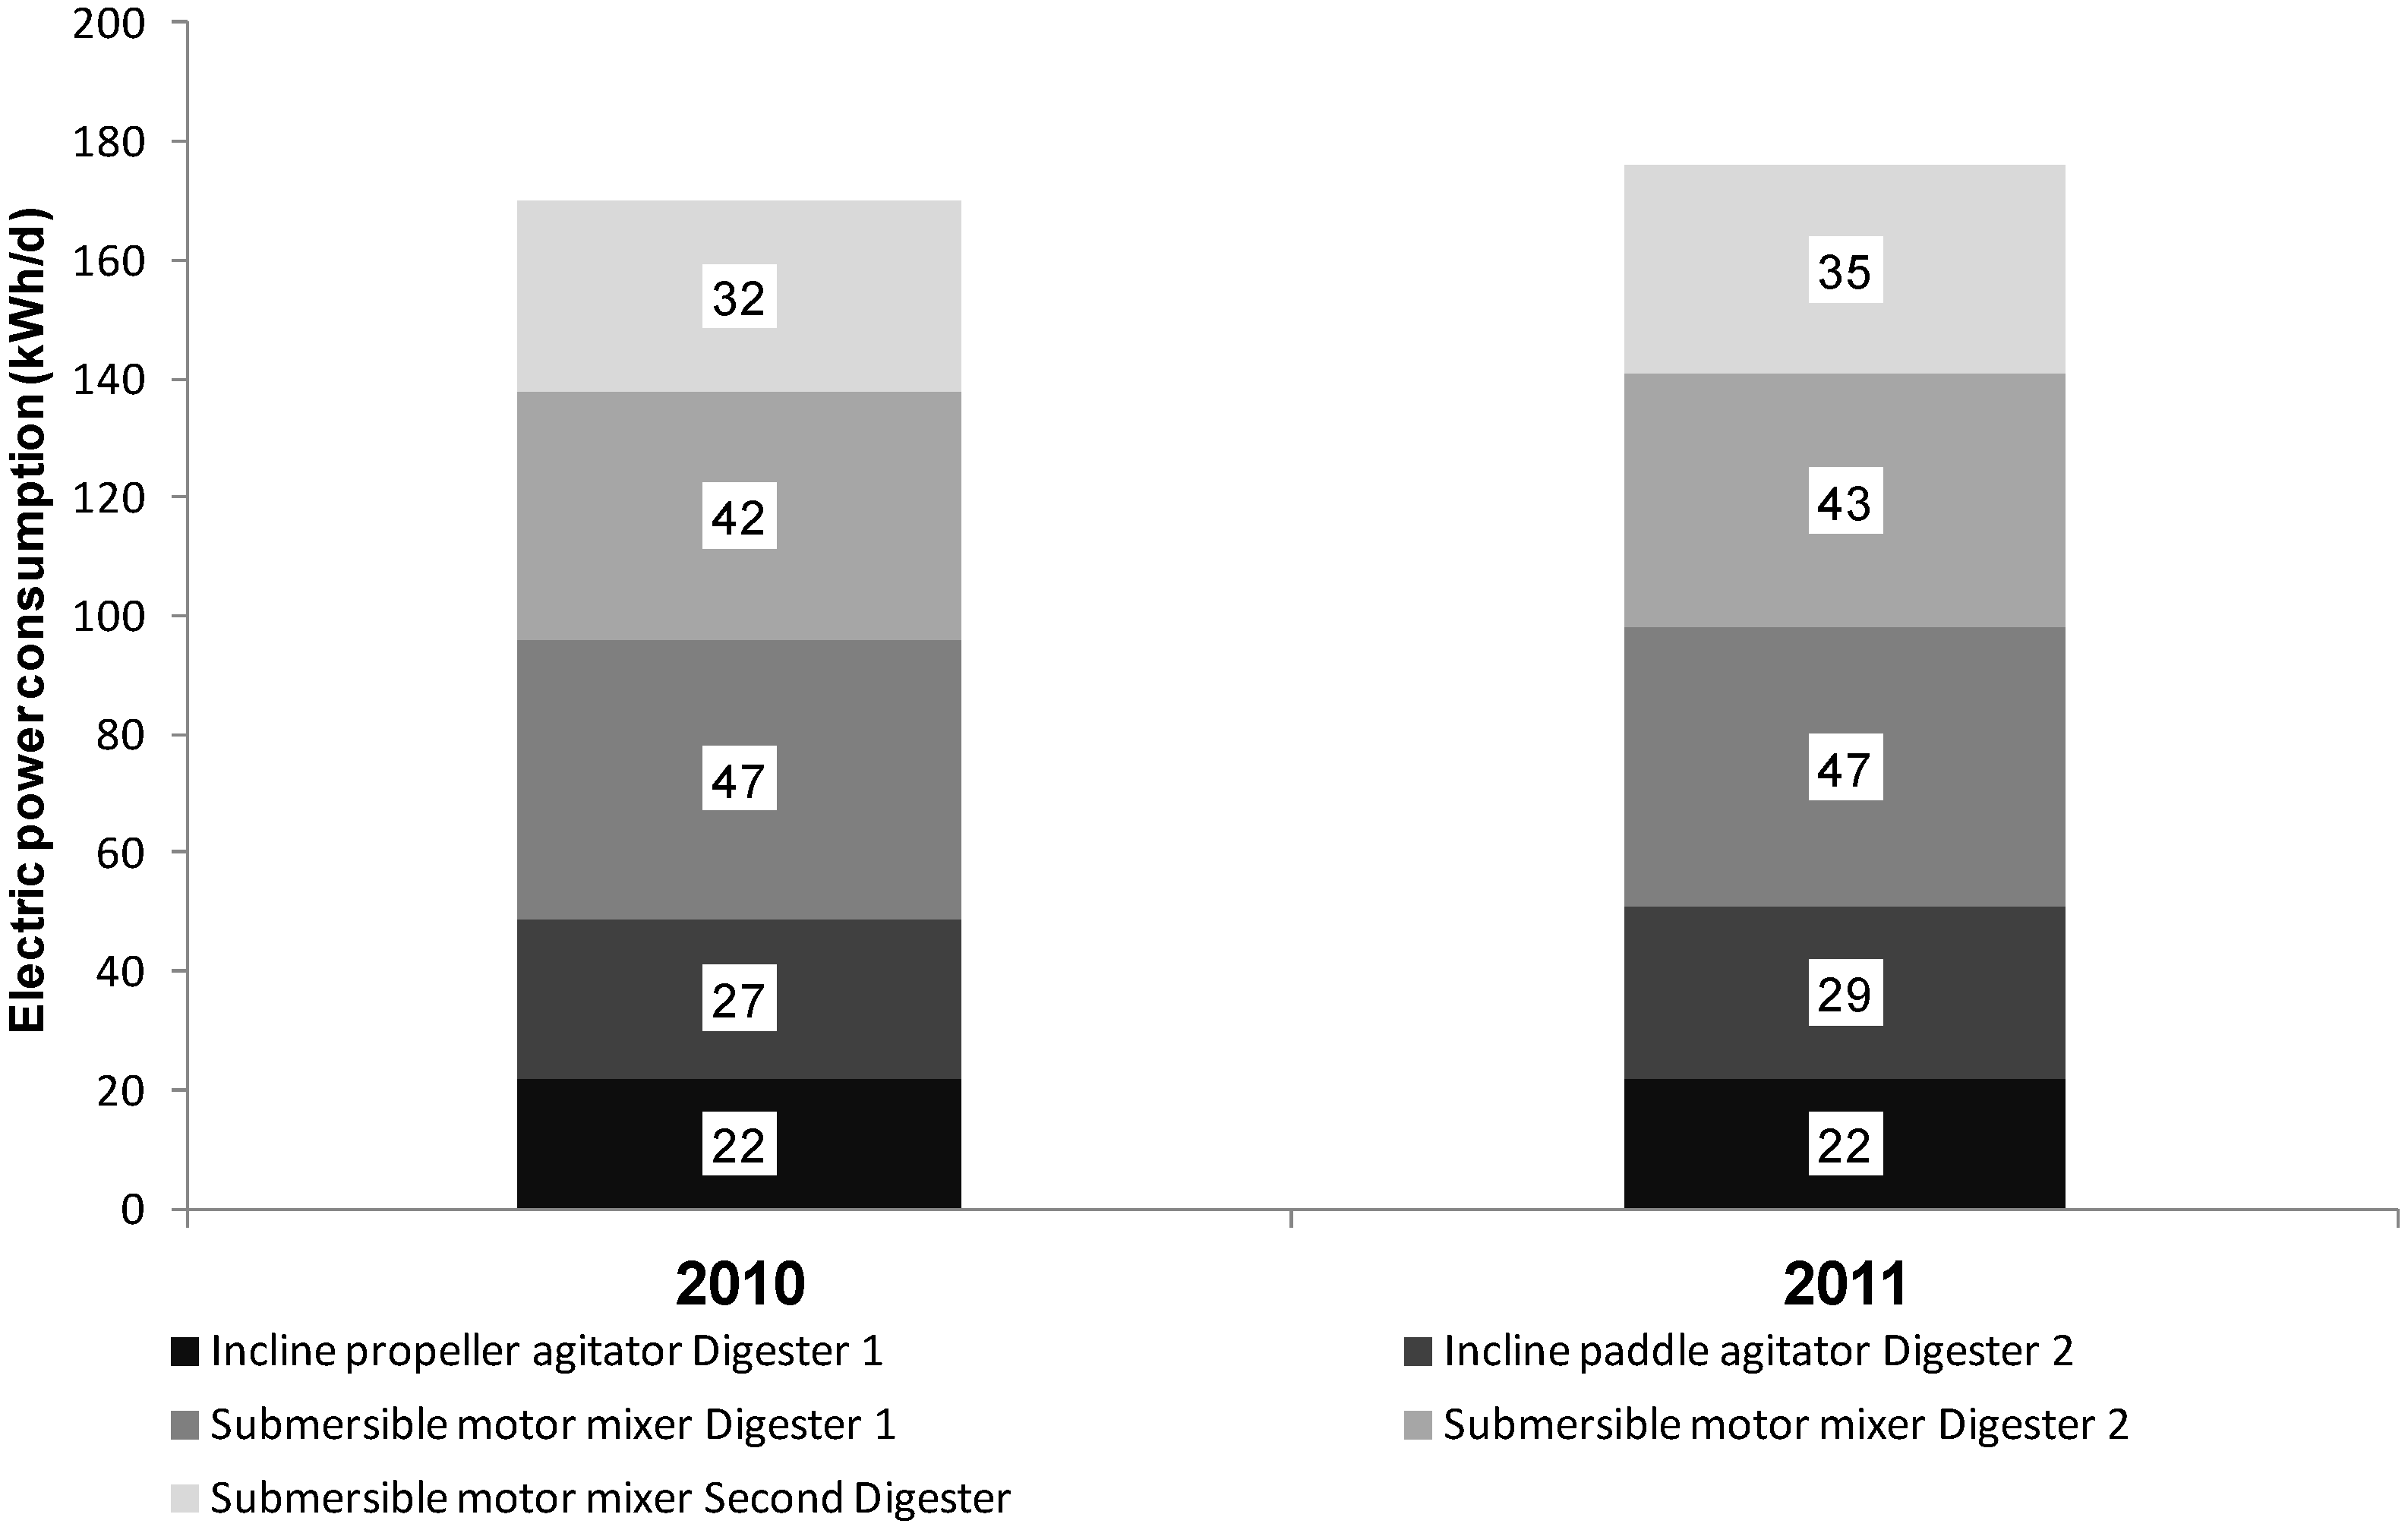
A calculation of the mean values for the agitation units (within the surveyed period) shows an almost steady electric power consumption of the agitation units for both years (
Figure 8). The incline agitation units consumed less electric power, compared with the submersible motor mixing systems. In both digesters both agitation units were operated for three minutes every 30 minutes. While the substrate was fed all agitators were operated one minute pre- and post feeding and throughout the feeding process.
Figure 8.
Electric power consumption of the agitation units calculated for an average day 2010 and 2011.
Figure 8.
Electric power consumption of the agitation units calculated for an average day 2010 and 2011.
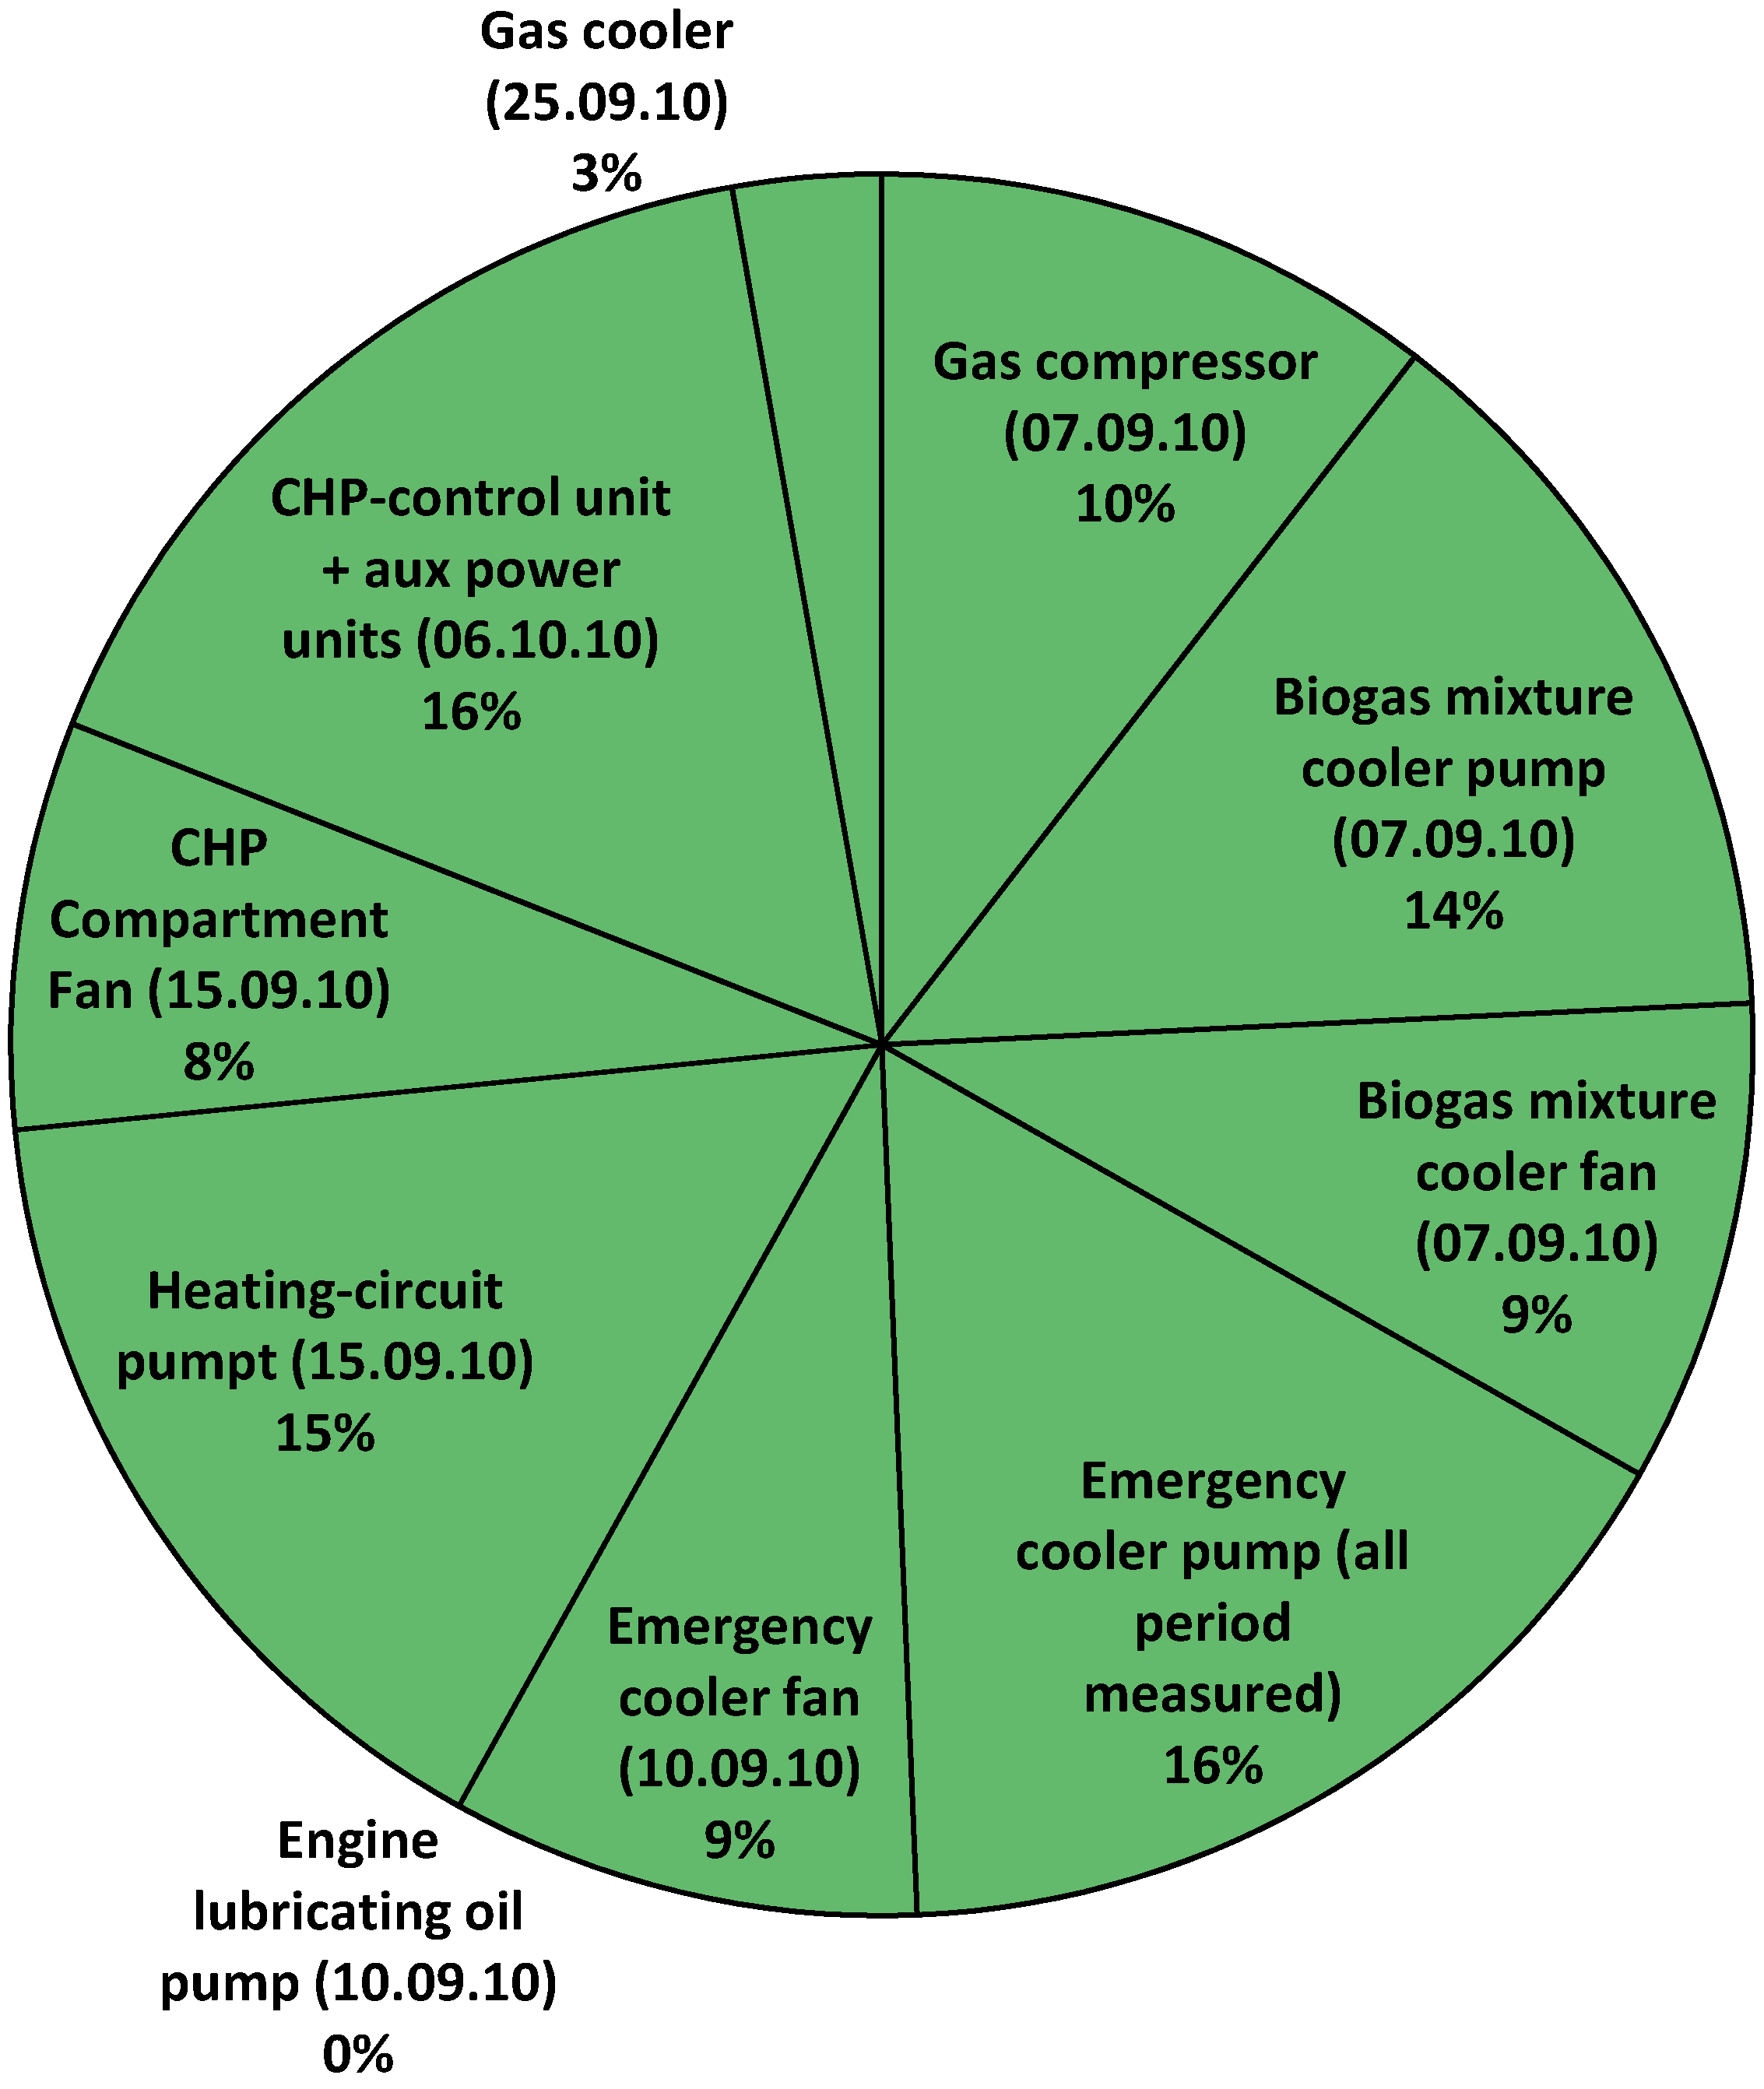
The data revealed that approximately 30% of the energy demand of the BGP is consumed by the CHP unit. Therefore, a more exact measurement was conducted for a short period to identify the distribution of consumption in the auxiliary equipment and to identify any possible electric energy saving potential. Detailed measurements could only be conducted by using the HIOKI measurement equipment as the CPC measuring point does not cover each single consumer unit, but rather the whole unit itself. The unit consumption measurements did not record the module management and gas cooler consumption. The module management remains unrecorded, thus leading to a lower output of the CHP production. Furthermore, it was found that the electric energy consumption of the gas cooler is measured by the general electricity consumption meter. The apportioning of the electrical power input into the individual CHP unit aggregates (based on the average daily consumption of 194 kWh) shows that the module management as well as the emergency cooler pump had the highest consumption with 16%. The second biggest consumption groups were the heating-circuit pump with 15% and the gas mixture cooler pump. Within a range of 8%–9% were the room ventilator fan, the gas compressor, the mixer cooling ventilator fan and the emergency cooling ventilator fan. The gas cooler accounted for 3% electric power consumption. The lubricating oil pump could not be instrumentally recorded because of its extremely short operational periods (
Figure 9).
Figure 9.
Distribution of the auxiliary electrical energy input for all units of the CHP.
Figure 9.
Distribution of the auxiliary electrical energy input for all units of the CHP.
4. Discussion and Conclusions
A lot of high quality practical data and experience could be deduced from the detailed and long term monitoring of a full scale research biogas plant. The study proved that long term measurements are needed to understand the electric power production and consumption of a biogas plant. In comparison to recent literature, this study provides deeper insight into the electric power consumption of specific consumer units by also considering the biological parameters, such as input materials and fermenter substrate characteristics. Over the year, the data showed a higher demand of electric energy during the warm summer months, as more recooling of thermal power of the CHP unit is needed compared to winter times. A change in the supply of substrates automatically affects the electric power output of the CHP unit, but does not have an effect on auxiliary electric energy demand. The bacteria react to changes of substrate supply, yet a visible lag in time can be observed. The availability of substrates varies, according to operation management and harvested quantities. The weekly analysis of the fermenting substrate in both digesters showed most VFA results were below the detection limit and only a few within the range of tolerance. Additional calculations of the input substrate degradability for the reporting period proved a degradation rate higher than 70%. Hence, both results confirm a very high digestibility and stable and safe fermenting conditions for both digesters. A comparison of the electric energy production and consumption for the entire BGP in 2010 and 2011 showed only slight differences between the years. The electric power consumption of the CHP is on average 194 kWh/day and represents 4.6% of the electric power generated per day (during the period covered by the study). It has to be taken into consideration that this higher value results from the intensive measuring of the CHP unit. The data presented in
Figure 7 does not include the module control and the gas cooler included in the gas producing path. The distribution of the energy input displays a uniform distribution among the heating pump group and the fans. The module control, which comprises all the auxiliary units of the CHP unit, also accounts for a high proportion of the total consumption. However, in practice this amount of consumed energy can hardly be reduced. One optimization method is to increase the amount of thermal power supplied to the district heating system of the farm and hereby reduce the operation time of emergency cooler pumps and fans. Moreover, the type of the heating pumps could be changed into high energy efficiency pumps.
The increase of energy efficiency, especially of the agitation units, proves to be the biggest challenge for plant operators. In practice, from a wide range of available agitator types different combinations are installed in the digesters. This is to avoid sinking and floating layers, for heat and nutrient distribution and to enable gas lift at high DM contents. The challenge is to ensure a homogenous digestate, although fibrous input substrates on one hand (with a tendency to form floating layers), and fluids on the other hand have to be homogenized while the entire emulsion is subject to thixotropic conditions. The main reasons for high electric energy consumption are long mixing intervals, missing compatibility between engine and propeller, a lack of knowledge of the mixing process and required mixing times. Additionally, lacking measurement devices for the quality of the digestate complicate an appropriate time management of the procedure. At the expense of efficiency in the construction, operators finally tend to select technical units with a stronger focus on construction stability and reliability (with a tendency to oversize). The operation of the research biogas plant showed that these challenges are indeed difficult to solve. In fact, only a very strong focus on research on this specific topic can be one of the appropriate measure for an efficient mixing process. The results can help the plant operators to improve plant controlling, in order to gain a higher level of energy efficiency in the future. Finally, the data will provide a basis for detailed investigations of agitation quality in the digesters in order to improve the electric energy efficiency of the BGP.
To improve the energy efficiency of biogas plants it is necessary to reduce the electric power consumption, thus needing precise information about the energy consumption of BGP. The conduction of intensive, detailed and long-term field tests identified the main electricity consumer units of a full scale biogas plant. Over a period of two years, data has been collected and evaluated. As expected and already shown in other literature, the agitation units consumed most of the procured energy, followed by the CHP unit and the feeding systems. Hence, the saving potential within the agitation technique needs to be investigated more thoroughly in future studies. However, despite the harsh practical conditions, the aim of intensive, detailed and long term measurements proved to be successful.


