
Performance of Natural Ester as a Transformer Oil in Moisture-Rich Environments


Abstract
:1. Introduction
2. Experimental Setup
2.1. Materials
2.2. Sample Preparation and Aging Experiment Setup
3. Kinetic Degradation of Cellulose Insulation
4. Comparison of Aging of Pressboard (PB)
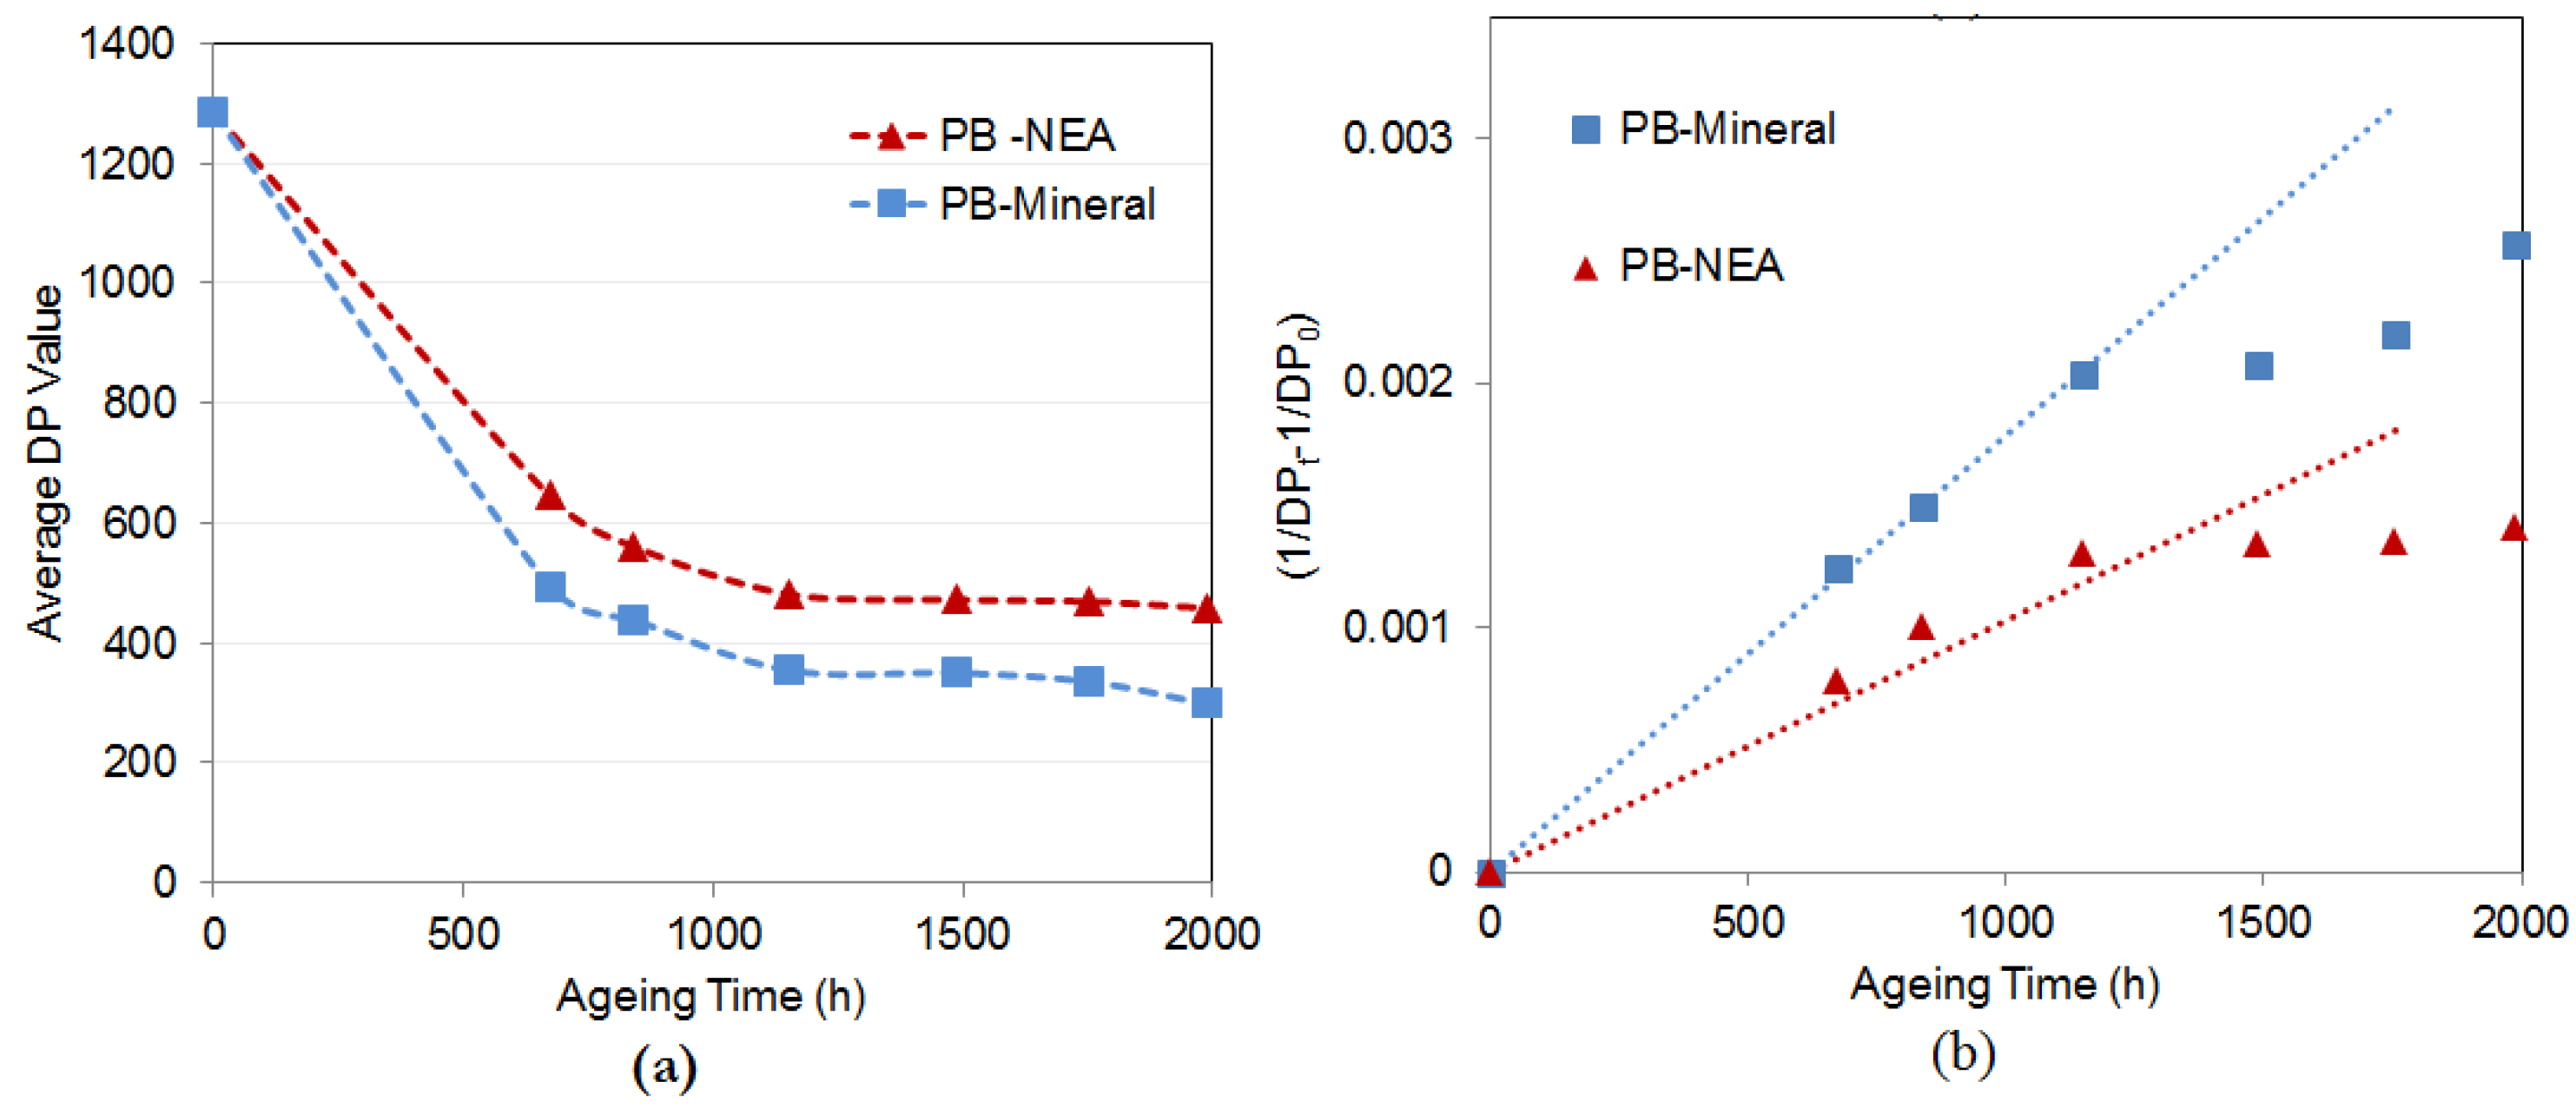
4.1. Decrease in Degree of Polymerization (DP) of Pressboard (PB) Insulation
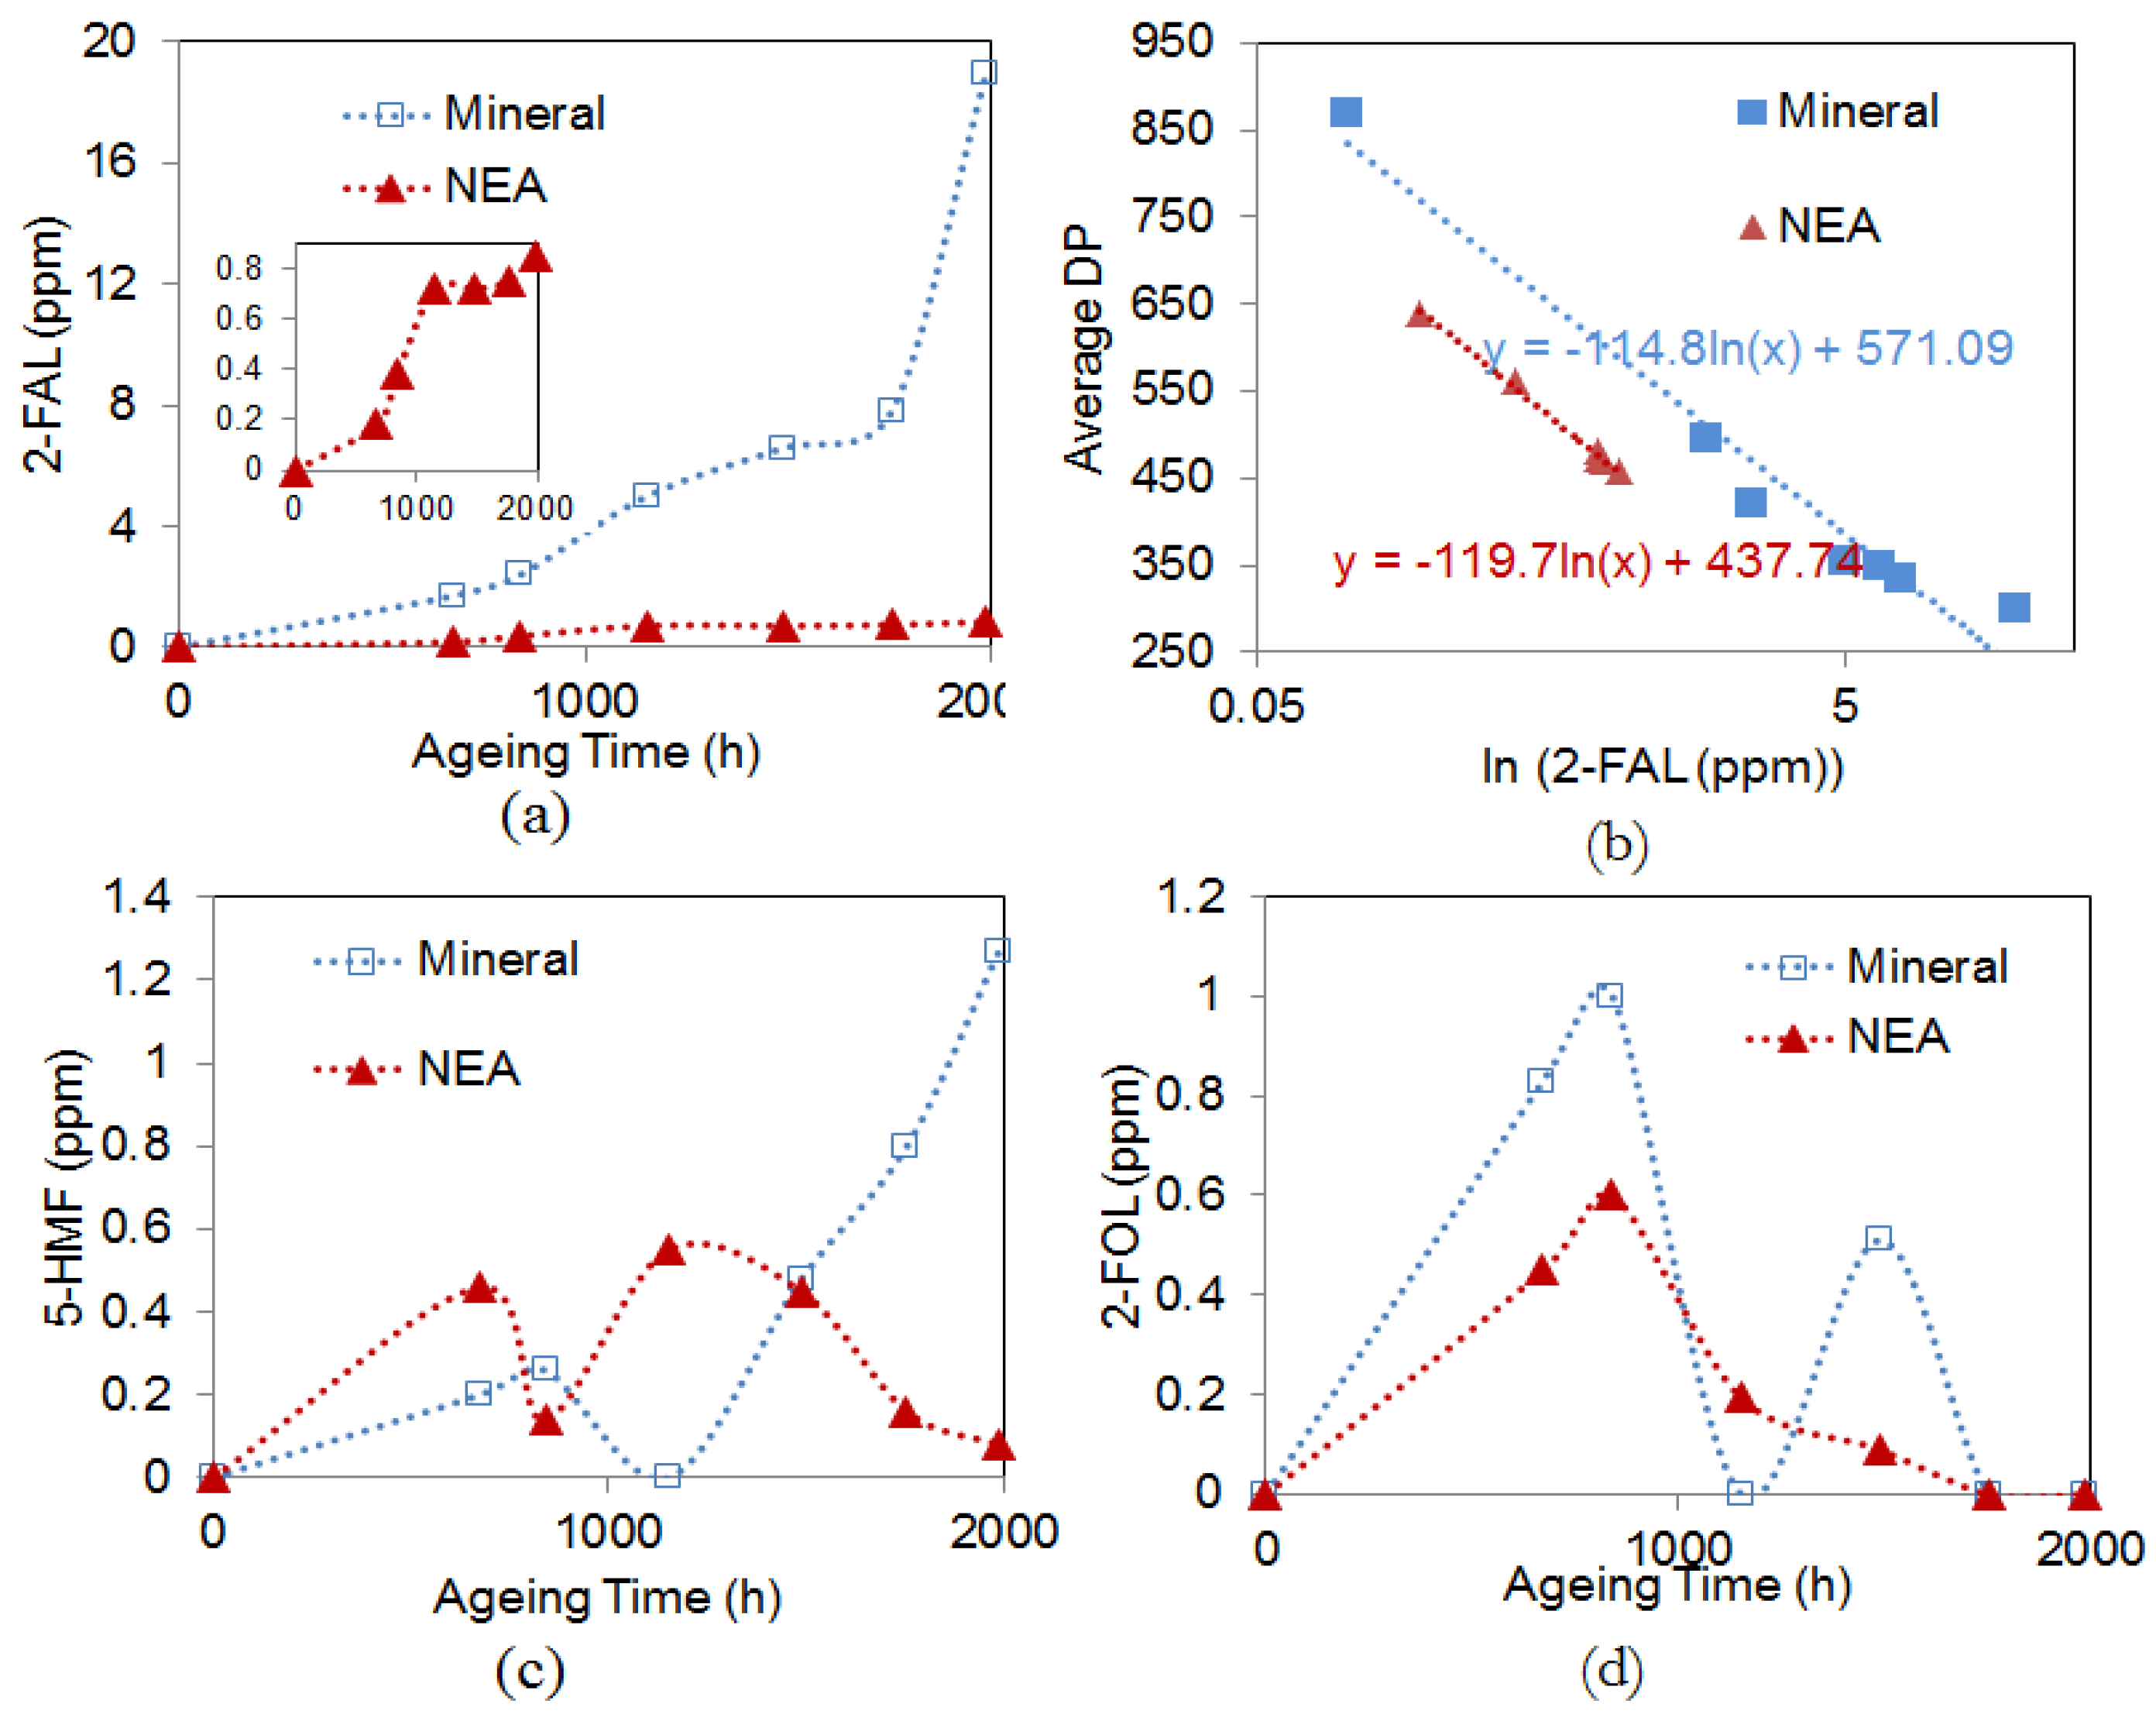
4.2. Correlation between Furfural and Pressboard PBAging
5. Aging of Oil
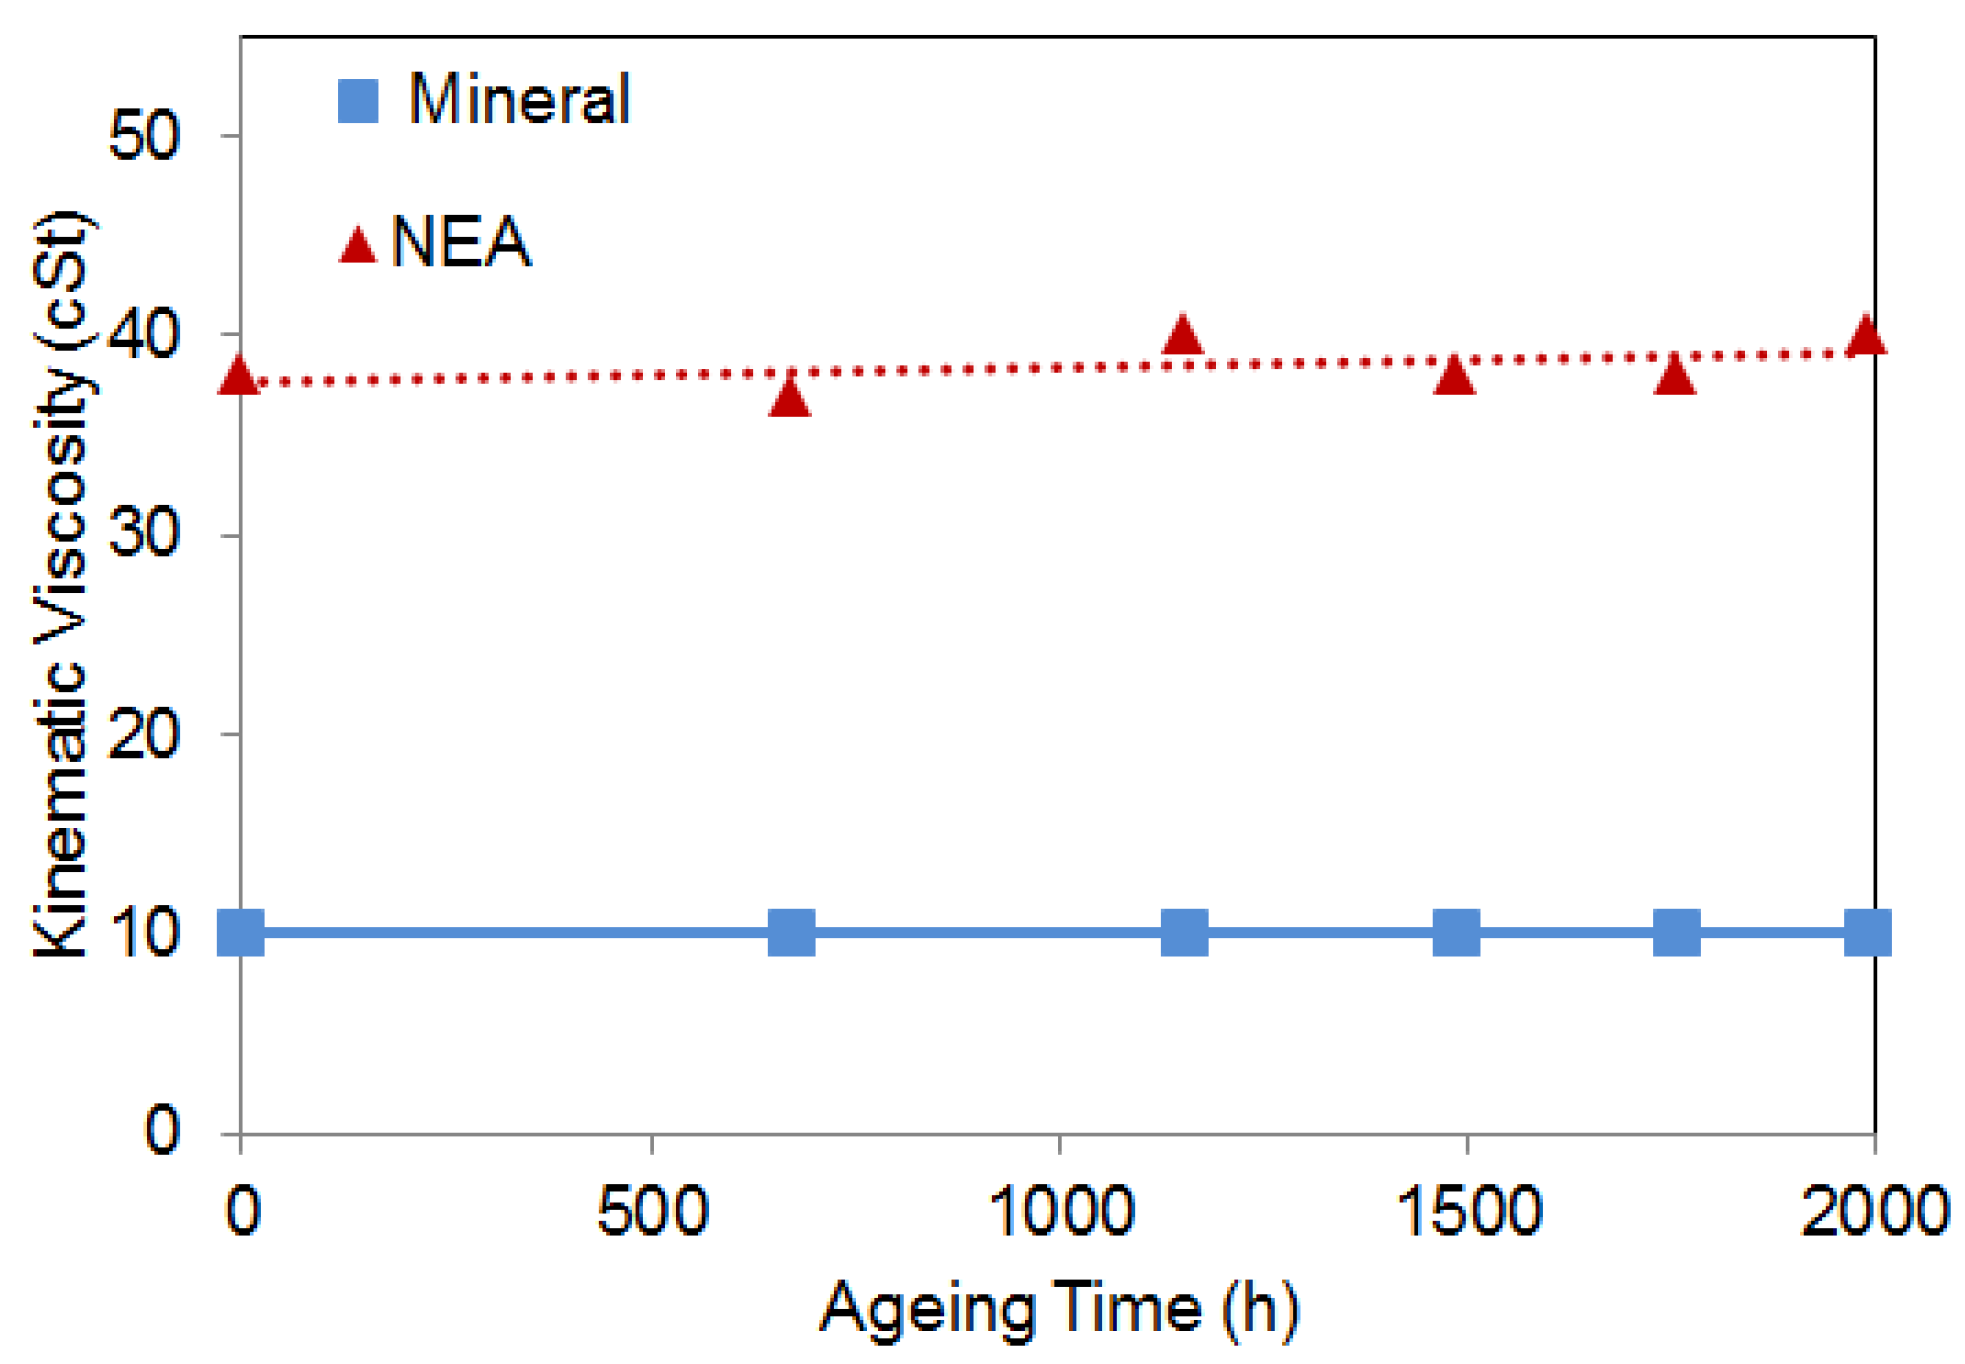
5.1. Viscosity
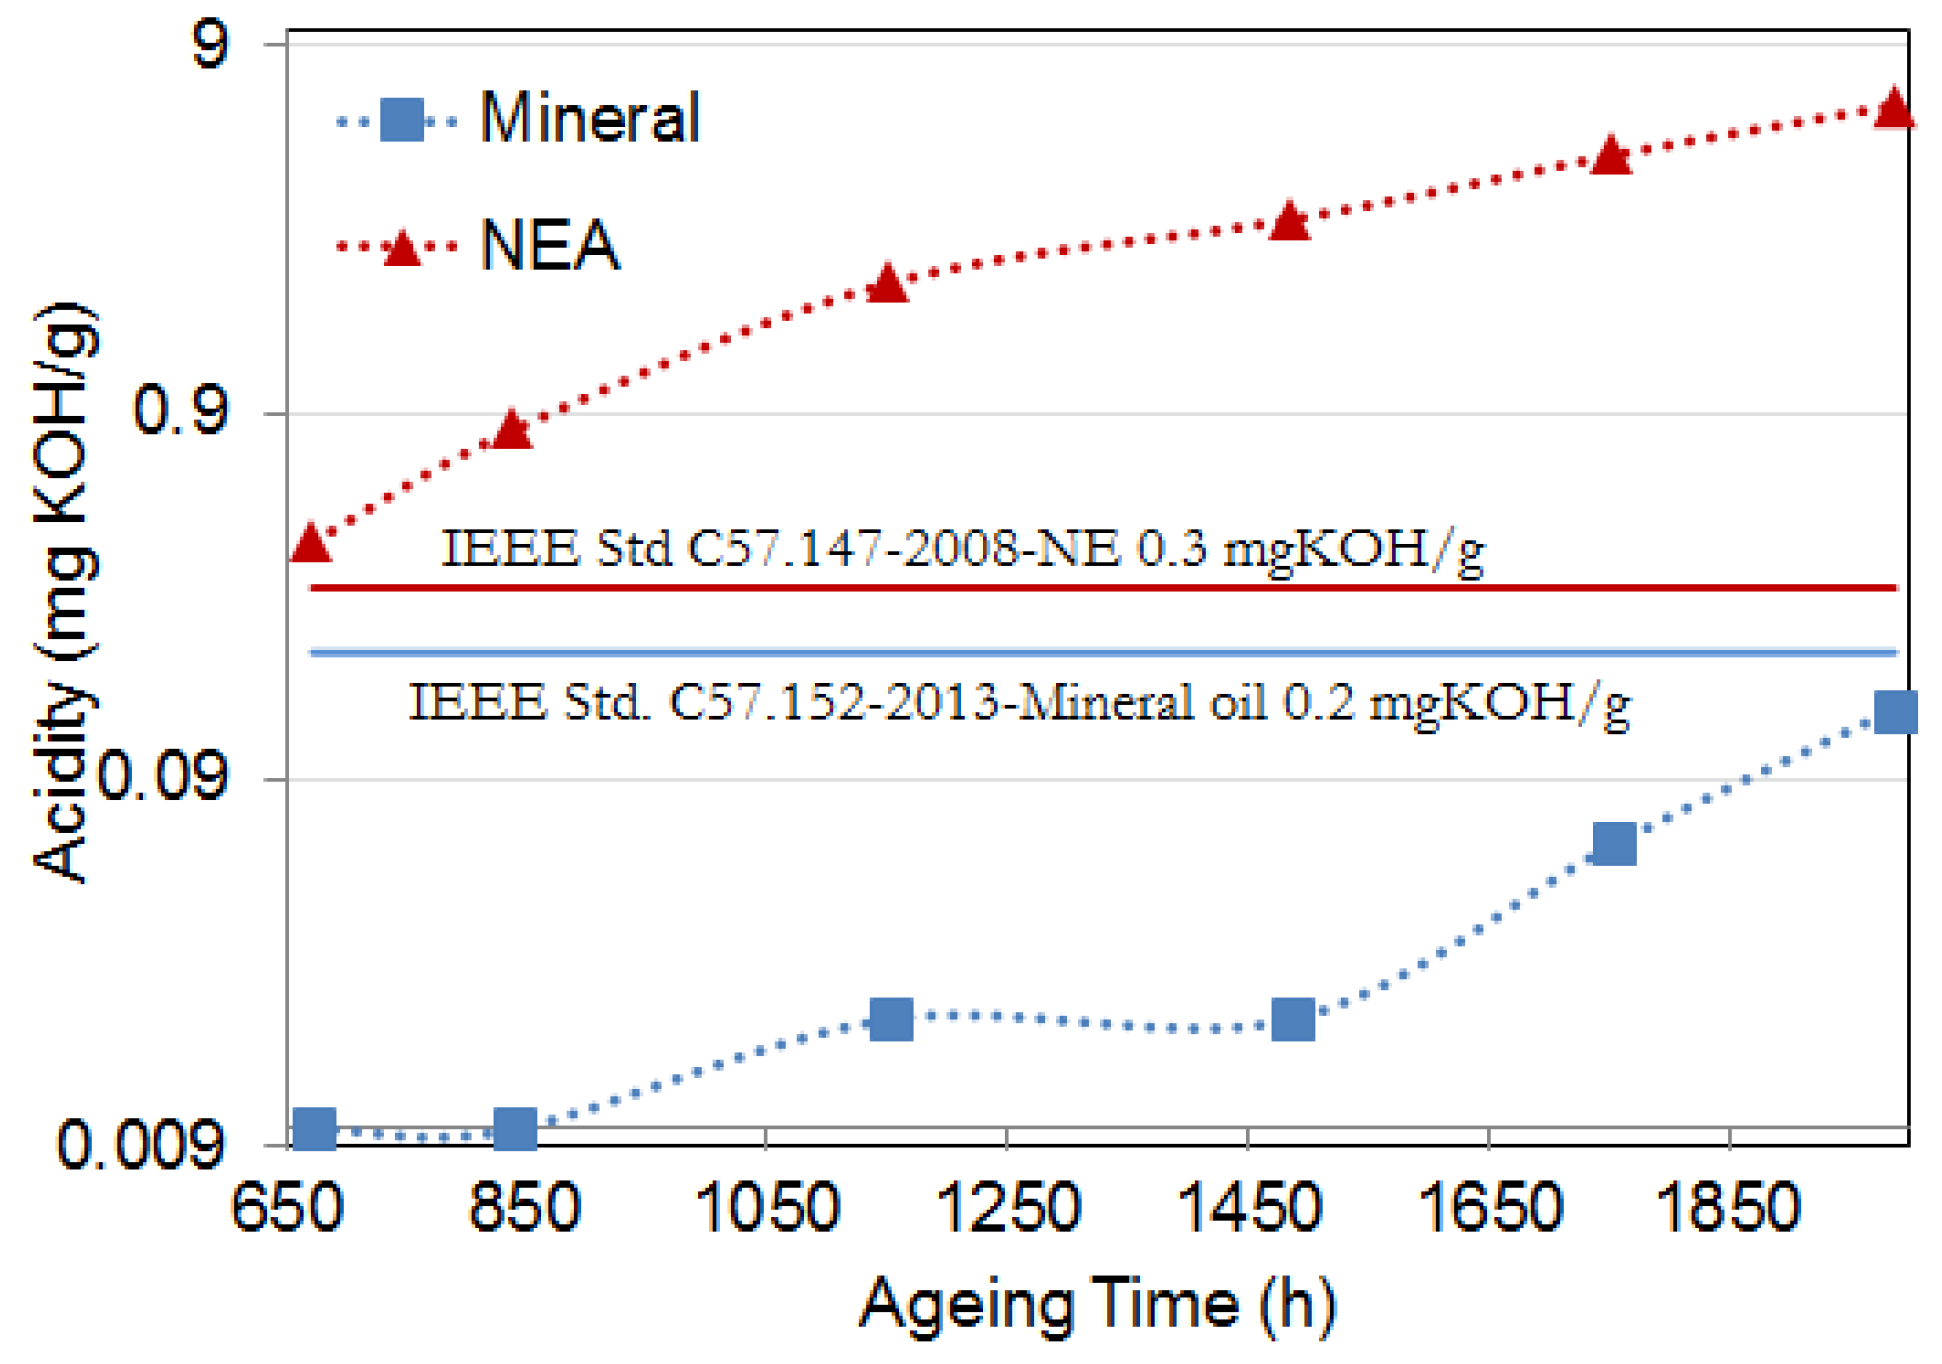
5.2. Acidity
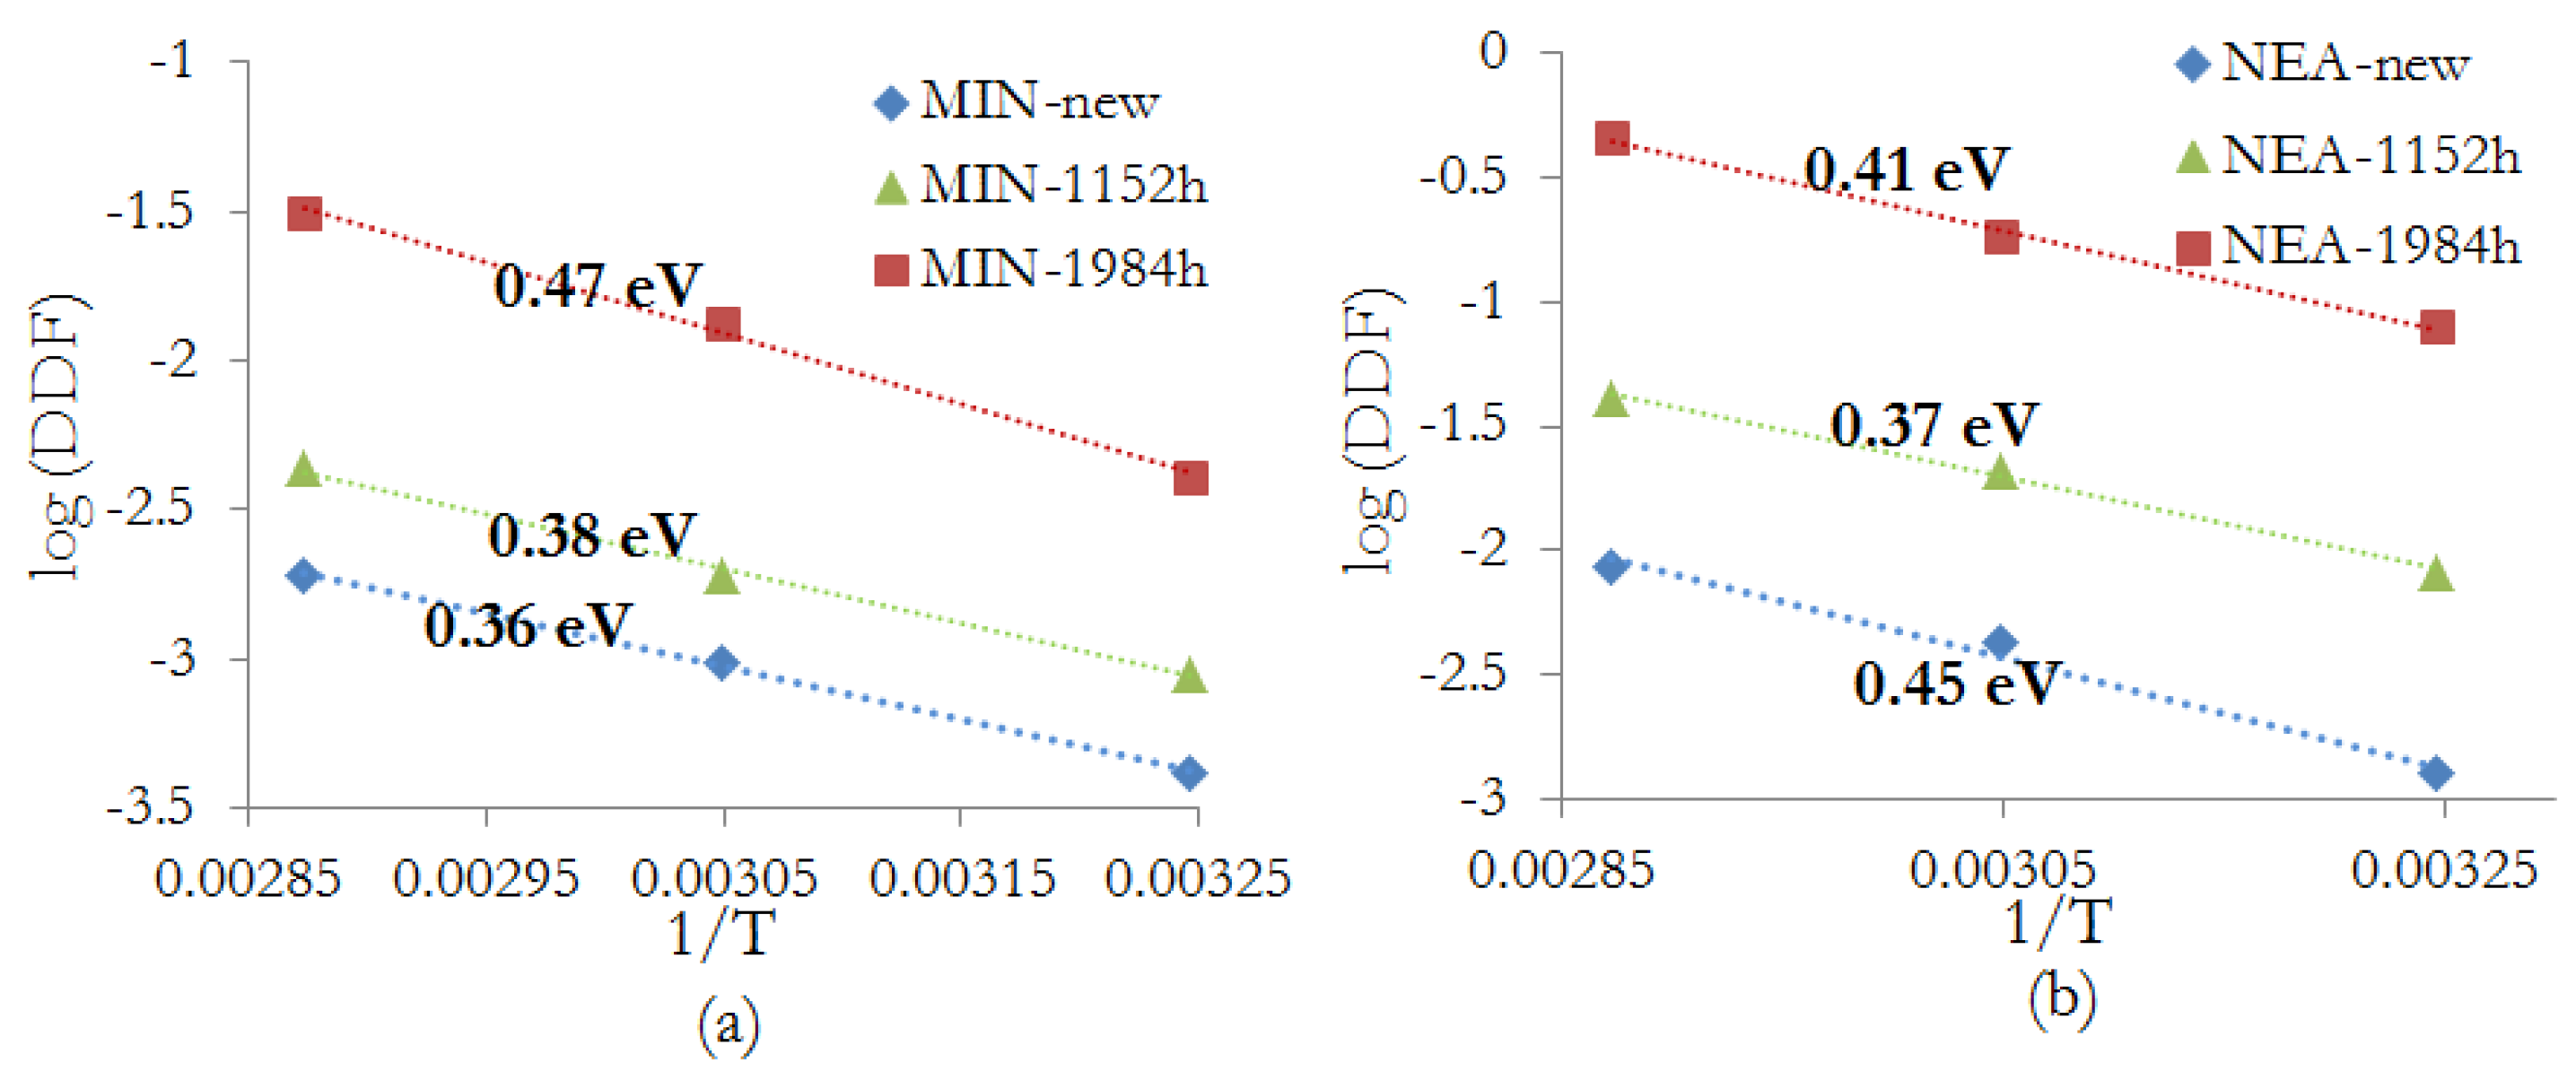
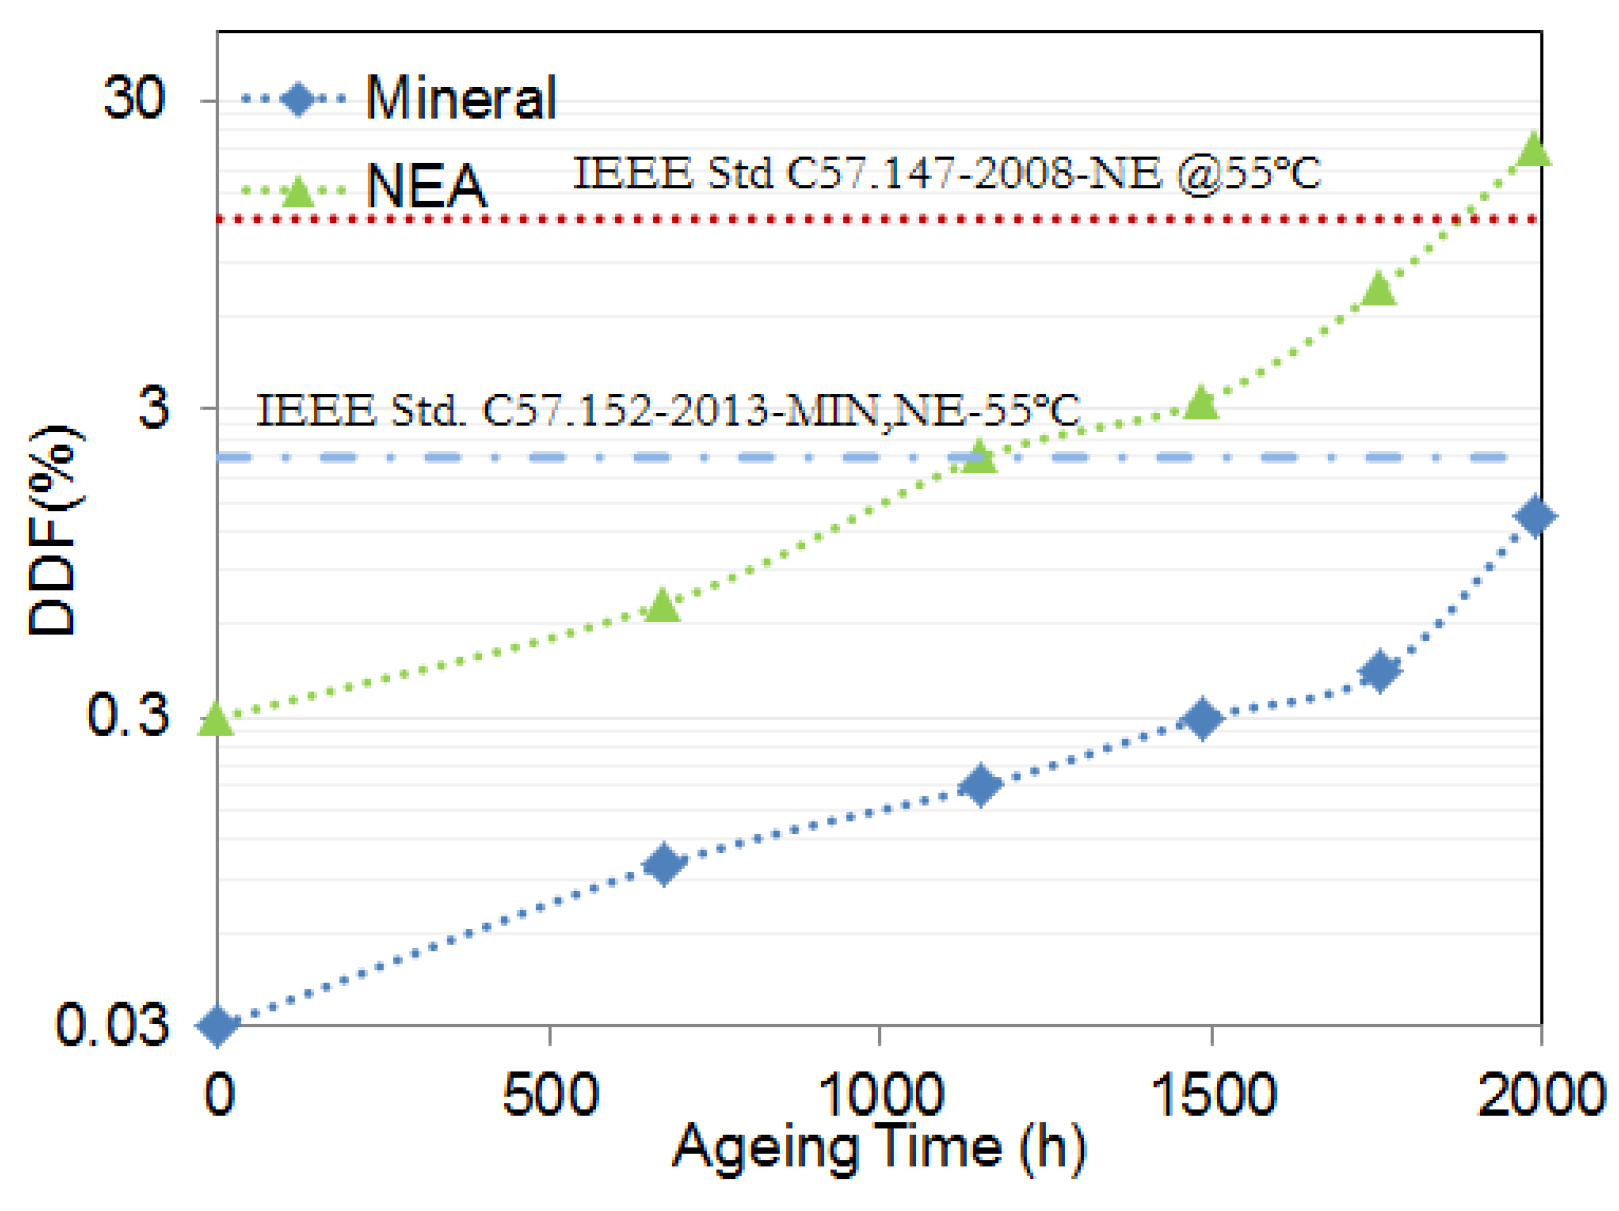
5.3. Change of Dielectric Dissipation Factor (DDF)
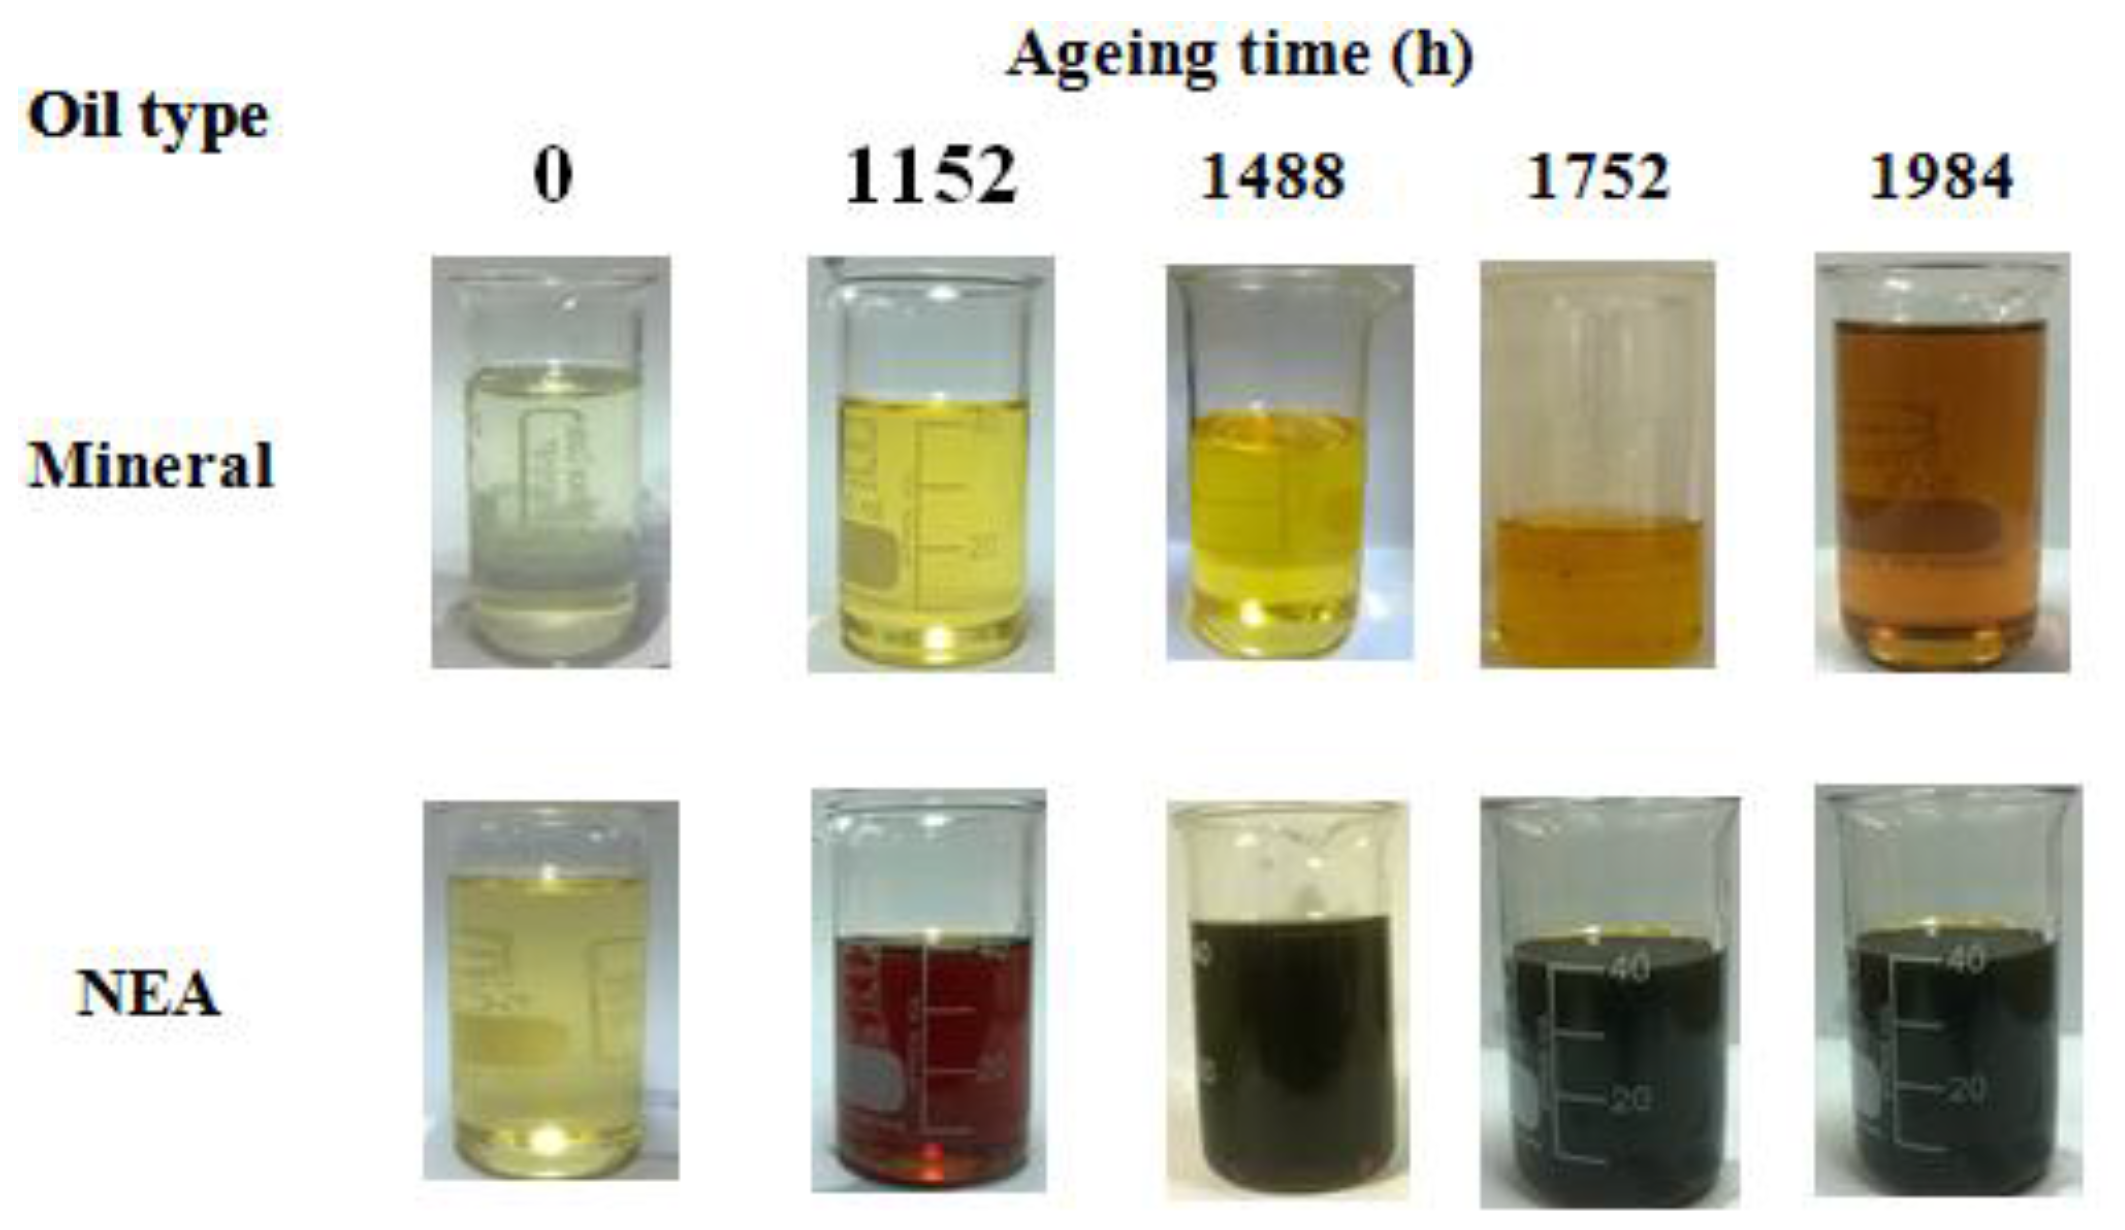
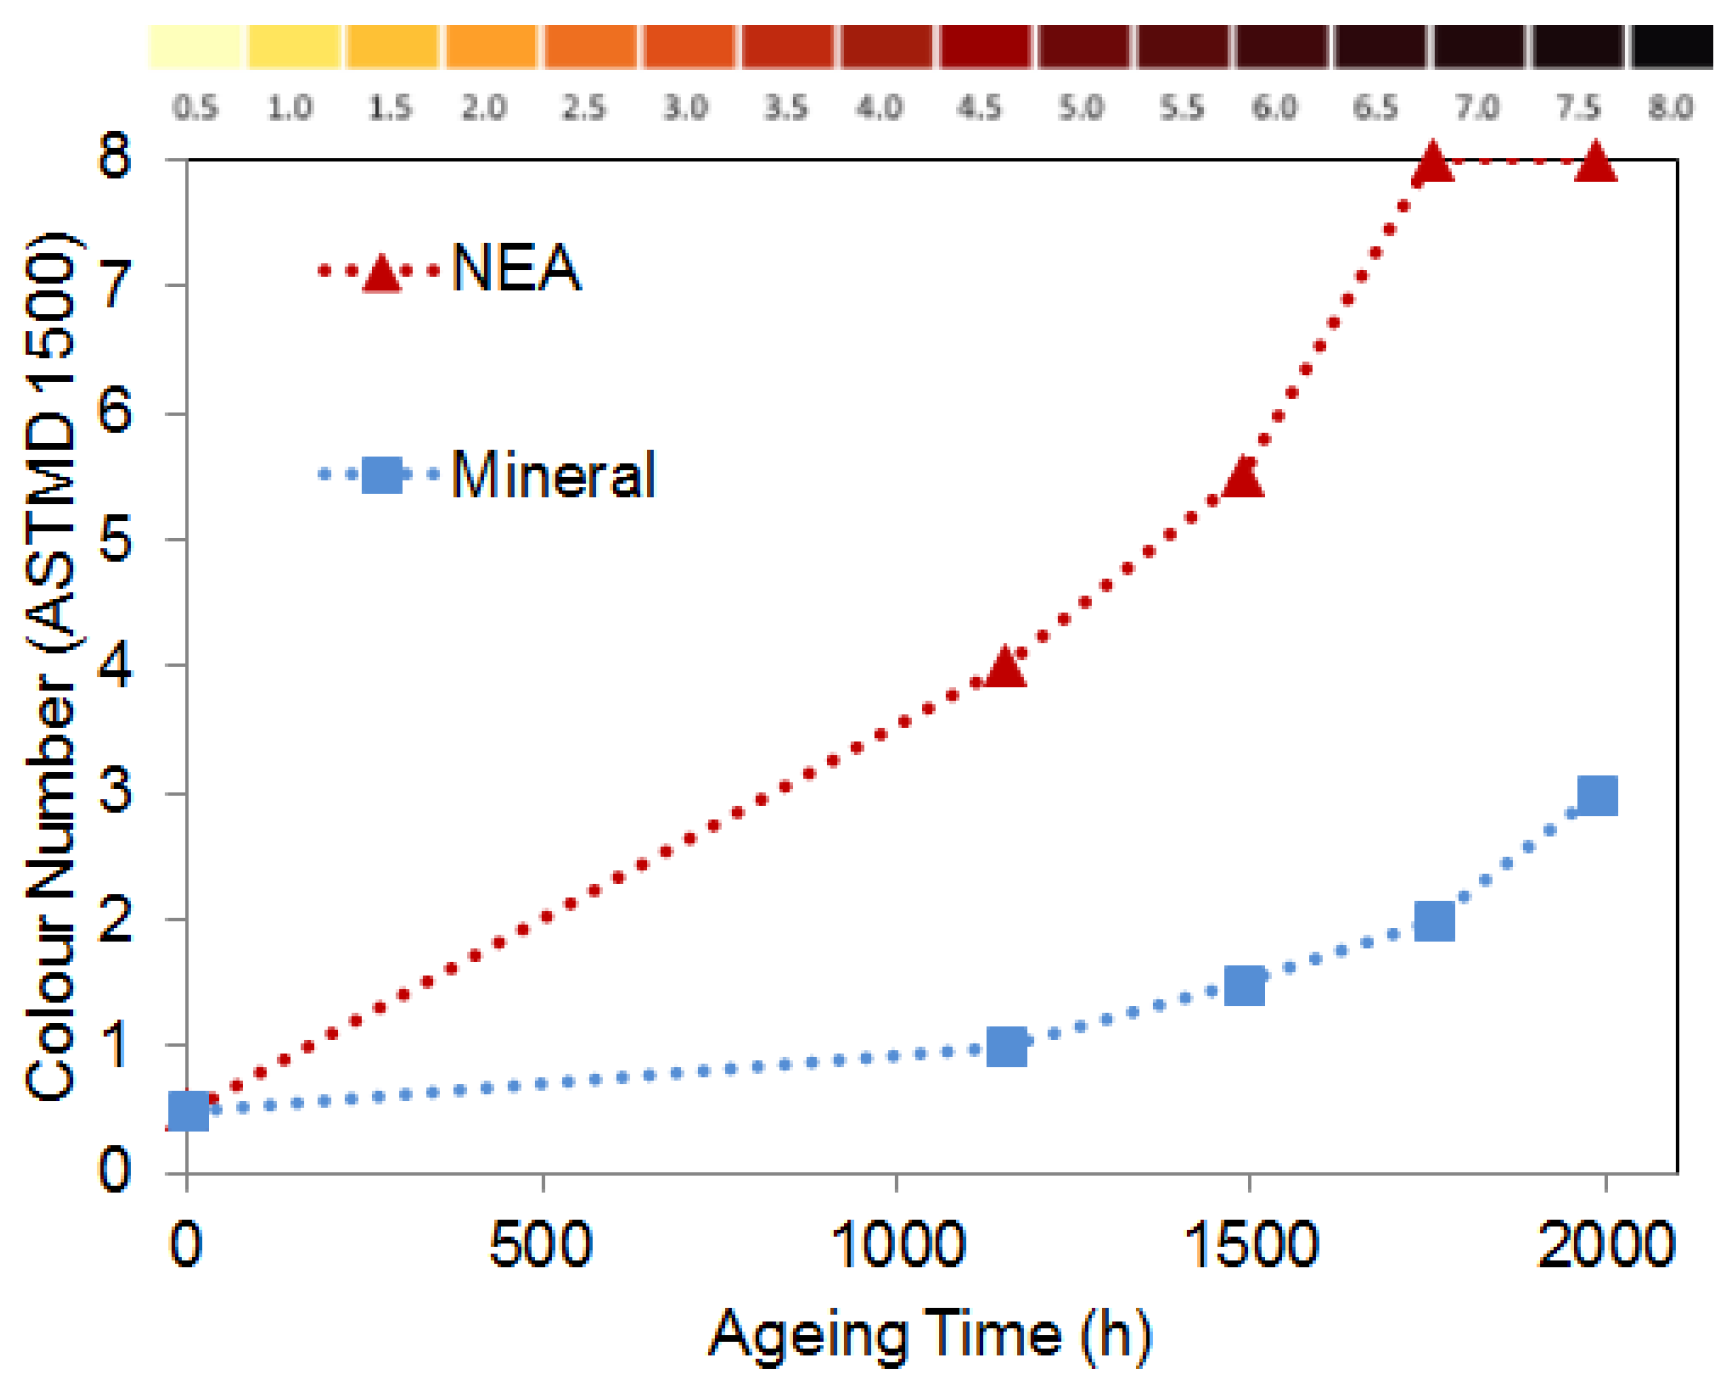
5.4. Colour Change
5.5. Overall Analysis of Oil Condition
6. Conclusions
Acknowledgments
Author Contributions
Conflicts of Interest
References
- Prevost, T.A.; Oommen, T.V. Cellulose insulation in oil-filled power transformers: Part I—History and development. IEEE Electr. Insul. Mag. 2006, 22, 28–35. [Google Scholar] [CrossRef]
- Rouse, T.O. Mineral insulating oil in transformers. IEEE Mag. Electr. Insul. Mag. 1998, 14, 6–16. [Google Scholar] [CrossRef]
- Oommen, T.V.; Claiborne, C.C.; Mullen, J.T. Biodegradable electrical insulation fluids. In Proceedings of the Electrical Insulation and Electrical Manufacturing & Coil Winding Conference, Rosemont, IL, USA, 22–25 September 1997; pp. 465–468.
- McShane, C.P.; Corkran, J.; Rapp, K.; Luksich, J. Natural Ester Dielectric Fluid Development. In Proceedings of the IEEE PES Transmission and Distribution Conference and Exhibition, Dallas, TX, USA, 21–24 May 2006; pp. 18–22.
- Tenbohlen, S.; Koch, M. Aging Performance and Moisture Solubility of Vegetable Oils for Power Transformers. IEEE Trans. Power Deliv. 2010, 25, 825–830. [Google Scholar] [CrossRef]
- Dai, J.; Wang, Z.D. A Comparison of the Impregnation of Cellulose Insulation by Ester and Mineral Oil. IEEE Trans. Dielectr. Electr. Insul. 2008, 15, 374–381. [Google Scholar] [CrossRef]
- Du, Y.; Zahn, M.; Lesieutre, B.C.; Mamishev, A.V.; Lindgren, S.R. Moisture equilibrium in transformer paper-oil systems. IEEE Electr. Insul. Mag. 1999, 15, 11–20. [Google Scholar] [CrossRef]
- Emsley, A.M.; Stevens, G.C. Kinetics and mechanisms of the low-temperature degradation of cellulose. J. Cellul. 1994, 1, 26–56. [Google Scholar] [CrossRef]
- Lundgaard, L.E.; Hansen, W.; Linhjell, D.; Painter, T.J. Aging of oil-impregnated paper in power transformers. IEEE Trans. Power Deliv. 2004, 19, 230–239. [Google Scholar] [CrossRef]
- Lelekakis, N.; Wijaya, J.; Martin, D.; Saha, T.; Susa, D.; Krause, C. Aging rate of grade 3 presspaper insulation used in power transformers. IEEE Trans. Dielectr. Electr. Insul. 2014, 21, 2355–2362. [Google Scholar] [CrossRef] [Green Version]
- Internaltional Electrotechnical Commision (IEC). Measurement of the Average Viscometric Degree of Polymerization of New and Aged Cellulose Electrically Insualting Materials; IEC Std. 60450:2004; IEC: Geneva, Switzerland, 2004. [Google Scholar]
- Hill, D.J.T.; Le, T.T.; Darveniza, M.; Saha, T. A study of the degradation of cellulosic insulation materials in a power transformer. Part III: Degradation products of cellulose insulation paper. Polym. Degrad. Stab. 1996, 51, 211–218. [Google Scholar] [CrossRef]
- Dissado, L.A.; Hill, R.M. Anomalous low-frequency dispersion. Near direct current conductivity in disordered low-dimensional materials. J. Chem. Soc. Faraday Trans. 2 Mol. Chem. Phys. 1984, 80, 291–319. [Google Scholar] [CrossRef]
- Liao, R.; Liang, S.; Sun, C.; Yang, L.; Sun, H. A comparative study of thermal aging of transformer insulation paper impregnated in natural ester and in mineral oil. Eur. Trans. Electr. Power 2010, 20, 518–533. [Google Scholar] [CrossRef]
- McShane, C.P.; Rapp, K.J.; Corkran, J.L.; Gauger, G.A.; Luksich, J. Aging of Kraft paper in natural ester dielectric fluid. In Proceedings of the 2002 IEEE 14th International Conference on Dielectric Liquids, Graz, Austria, 7–12 July 2002; pp. 173–177.
- Koch, M.; Tenbohlen, S.; Stirl, T. Diagnostic Application of Moisture Equilibrium for Power Transformers. IEEE Trans. Power Deliv. 2010, 25, 2574–2581. [Google Scholar] [CrossRef]
- IEEE C57.91 Working Group. IEEE Guide for Loading Mineral-Oil-Immersed Transformers and Step-Voltage Regulators—Redline; IEEE Std C57.91-2011 (Revision of IEEE Std C57.91-1995)—Redline; IEEE: New York, NY, USA, 2012; pp. 1–172. [Google Scholar]
- Coulibaly, M.L.; Perrier, C.; Marugan, M.; Beroual, A. Aging behavior of cellulosic materials in presence of mineral oil and ester liquids under various conditions. IEEE Trans. Dielectr. Electr. Insul. 2013, 20, 1971–1976. [Google Scholar] [CrossRef]
- Cigre Working Group TF D1.01.13. Furanic Compounds for Diagnosis; International Council on Large Electric Systems: Paris, France, 2012. [Google Scholar]
- Scheirs, J.; Camino, G.; Avidano, M.; Tumiatti, W. Origin of furanic compounds in thermal degradation of cellulosic insulating paper. J. Appl. Polym. Sci. 1998, 69, 2541–2547. [Google Scholar] [CrossRef]
- Emsley, A.M.; Xiao, X.; Heywood, R.J.; Ali, M. Degradation of cellulosic insulation in power transformers. Part 3: Effects of oxygen and water on ageing in oil. IEE Proc. Sci. Meas. Technol. 2000, 147, 115–119. [Google Scholar] [CrossRef]
- Kachler, A.J.; Hohlein, I. Aging of cellulose at transformer service temperatures. Part 1: Influence of type of oil and air on the degree of polymerization of pressboard, dissolved gases, and furanic compounds in oil. IEEE Electr. Insul. Mag. 2005, 21, 15–21. [Google Scholar] [CrossRef]
- Lijun, Y.; Ruijin, L.; Caixin, S.; Huigang, S. Study on the Influence of Natural Ester on Thermal Ageing Characteristics of Oil-paper in Power Transformer. In Proceedings of the International Conference on High Voltage Engineering and Application, Chongqing, China, 9–12 November 2008; pp. 437–440.
- Emsley, A.M.; Stevens, G.C. Review of chemical indicators of degradation of cellulosic electrical paper insulation in oil-filled transformers. IEE Proc. Sci. Meas. Technol. 1994, 141, 324–334. [Google Scholar] [CrossRef]
- De Pablo, A. Furfural and ageing: How are they related. In Proceedings of the IEE Colloquium on Insulating Liquids, Leatherhead, UK, 27 May 1999; pp. 5/1–5/4.
- Levchik, S.; Scheirs, J.; Camino, G.; Tumiatti, W.; Avidano, M. Depolymerization processes in the thermal degradation of cellulosic paper insulation in electrical transformers. Polym. Degrad. Stab. 1998, 61, 507–511. [Google Scholar] [CrossRef]
- Jung-Il, J.; Jung-Sik, A.; Chan-Su, H. Accelerated aging effects of mineral and vegetable transformer oils on medium voltage power transformers. IEEE Trans. Dielectr. Electr. Insul. 2012, 19, 156–161. [Google Scholar] [CrossRef]
- IEEE Diagnostic Field Testing Power Transformers and Reactors Working Group. IEEE Guide for Diagnostic Field Testing of Fluid-Filled Power Transformers, Regulators, and Reactors; IEEE Std C57.152-2013; IEEE: New York, NY, USA, 2013. [Google Scholar]
- IEEE Natural Easter Working Group. IEEE Guide for Acceptance and Maintenance of Natural Ester Fluids in Transformers; IEEE Std. C57.147-2008; IEEE: New York, NY, USA, 2008. [Google Scholar]
- Duy, C.T.; Denat, A.; Lesaint, O.; Bonifaci, N.; Bertrand, Y. Moisture and temperature effects on conduction and losses in modified rape-seed insulating oil. In Proceedings of the Conference on Electrical Insulation and Dielectric Phenomena, Vancouver, BC, Canada, 14–17 October 2007; pp. 647–650.
- Fofana, I.; Bouaicha, A.; Farzaneh, M.; Sabau, J.; Bussieres, D.; Robertson, E.B. Decay products in the liquid insulation of power transformers. IET Electr. Power Appl. 2010, 4, 177–184. [Google Scholar] [CrossRef]
- Fofana, I.; Bouaicha, A.; Hadjadj, Y.; N’Cho, J.S.; Aka-Ngnui, T.; Beroual, A. Early stage detection of insulating oil decaying. In Proceedings of the 2010 Annual Report Conference on Electrical Insulation and Dielectric Phenomena (CEIDP), West Lafayette, IN, USA, 17–20 October 2010; pp. 1–4.
- Internaltional Electrotechnical Commision (IEC). Insulating liquids -Determination of the Breakdown Voltage at Power Frequency—Test Method; IEC Std. 60156; IEC: Geneva, Switzerland, 1995. [Google Scholar]


| Impregnated Oil | Moisture Content (%) | DP |
|---|---|---|
| Mineral | 2.2 | 1305 |
| NEA | 2.4 | 1307 |
| Aging Time (h) | Mineral Oil | NE | ||||
|---|---|---|---|---|---|---|
| Acidity | DDF | Colour | Acidity | DDF | Colour | |
| 672 | √ | √ | - | x | √ | - |
| 1152 | √ | √ | √ | x | √ | severe |
| 1488 | √ | √ | √ | x | √ | extreme |
| 1752 | √ | √ | √ | x | √ | extreme |
| 1984 | √ | √ | bad | x | x | extreme |
| √—acceptable for further use, x—not in good condition to further use | ||||||
© 2016 by the authors; licensee MDPI, Basel, Switzerland. This article is an open access article distributed under the terms and conditions of the Creative Commons by Attribution (CC-BY) license (http://creativecommons.org/licenses/by/4.0/).
Share and Cite
Bandara, K.; Ekanayake, C.; Saha, T.; Ma, H. Performance of Natural Ester as a Transformer Oil in Moisture-Rich Environments. Energies 2016, 9, 258. https://doi.org/10.3390/en9040258
Bandara K, Ekanayake C, Saha T, Ma H. Performance of Natural Ester as a Transformer Oil in Moisture-Rich Environments. Energies. 2016; 9(4):258. https://doi.org/10.3390/en9040258
Chicago/Turabian StyleBandara, Kapila, Chandima Ekanayake, Tapan Saha, and Hui Ma. 2016. "Performance of Natural Ester as a Transformer Oil in Moisture-Rich Environments" Energies 9, no. 4: 258. https://doi.org/10.3390/en9040258