Review

A Review of Dangerous Dust in Fusion Reactors: from Its Creation to Its Resuspension in Case of LOCA and LOVA

Department of Industrial Engineering, Associazione EUROFUSION-ENEA, University of Rome Tor Vergata, Via del Politecnico 1, 00133 Rome, Italy
*
Author to whom correspondence should be addressed.
Energies 2016, 9(8), 578; https://doi.org/10.3390/en9080578
Submission received: 22 April 2016 / Revised: 22 June 2016 / Accepted: 27 June 2016 / Published: 25 July 2016
(This article belongs to the Special Issue Fusion Power)

Abstract

:
The choice of materials for the future nuclear fusion reactors is a crucial issue. In the fusion reactors, the combination of very high temperatures, high radiation levels, intense production of transmuting elements and high thermomechanical loads requires very high-performance materials. Erosion of PFCs (Plasma Facing Components) determines their lifetime and generates a source of impurities (i.e., in-vessel tritium and dust inventories), which cool down and dilute the plasma. The resuspension of dust could be a consequences of LOss of Coolant Accidents (LOCA) and LOss of Vacuum Accidents (LOVA) and it can be dangerous because of dust radioactivity, toxicity, and capable of causing an explosion. These characteristics can jeopardize the plant safety and pose a serious threat to the operators. The purpose of this work is to determine the experimental and numerical steeps to develop a numerical model to predict the dust resuspension consequences in case of accidents through a comparison between the experimental results taken from campaigns carried out with STARDUST-U and the numerical simulation developed with CFD codes. The authors in this work will analyze the candidate materials for the future nuclear plants and the consequences of the resuspension of its dust in case of accidents through the experience with STARDUST-U.

Graphical Abstract

1. Introduction

“Fusion energy holds promise for obtaining the consent of the public, as it can provide intrinsic safety, favorable environmental characteristics and it can address global climate change concerns. In particular, fusion energy has the potential to become a CO2-free clean and inexhaustible energy source. In the world, all nuclear power plants in operation are related to fission, which is based on the fractionation of large atomic nuclei, especially the very heavy elements uranium and plutonium. However, to release energy, an alternative approach is that of nuclear fusion. Unlike fission, nuclei of light atoms gather to create atoms of a more stable and heavy form” [1]. “Fusion is the process which powers the sun and other stars” [2]. “During the fusion of elements with low atomic numbers substantial amounts of energy are released. In the core of the sun, the huge gravitational pressure allows this to happen at temperatures of around 10 million degrees Celsius. Gas raised to these temperatures becomes a “plasma”, where the electrons are completely separated from the atomic nuclei (ions)” [2]. “The plasma is a globally neutral ionized gas, consisting of a set of electrons and positive ions. As such, the plasma is considered as the fourth state of matter, which therefore differs from the solid, the liquid and the gaseous.” “The most promising combination for power on Earth today is the fusion of a deuterium atom with a tritium one. The process, which requires temperatures of approximately 72 million degrees F (39 million degrees Celsius), produces 17.6 million electron volts of energy [3].”
Nowadays the experimental nuclear facilities present worldwide are based on the deuterium-tritium technological concept. Deuterium and tritium are 2 isotopes of hydrogen, the first one can be obtained through an extraction process starting from the sea water, the second one can be obtained using lithium panel. Lithium is present in the sea rocks so it is clear that the combustible necessary to let this plant work is almost unlimited. The security levels of these plants are quite high because, in case of a malfunction, there are plasma material interaction that provokes an immediate reduction of temperature of the plasma causing its turn off. The products coming from chemical combustion are negligible as the radioactivity levels inside the facilities. Actually this is a promising alternative for the production of electricity with a reduced CO2 and other gas emission, the main problem that has to be faced is obtain a continuous production of electric energy. The International Thermonuclear Experimental Reactor (ITER, see Figure 1) main goal is be the first nuclear fusion plant with a positive energetic efficiency.
There are safety and security concerns related to several technological peculiarities of these plants, one of the most important is the creation of dust due to the plasma material interaction inside the vacuum vessel (VV) of the nuclear fusion plants [5,6,7,8,9,10,11,12] and its resuspension due to accidents like Loss of Vacuum (LOVA), Loss of Coolant (LOCA) [13,14].

2. Dust in Fusion Nuclear Reactors

“The combination of high temperatures, high radiation damage levels, intense production of transmuting elements (in particular, H and He) and high thermomechanical loads that produce significant primary and secondary stresses and time-dependent strains requires very high-performance materials for fusion energy systems” [15]. The materials that have direct interaction with the plasma must resist to load of energy till 14 MeV due to the neutrons. These neutrons can produce displacements and transmutation that can provokes material defects and gas atoms (like He or H). The plasma interaction temperatures are in the range of 780–3500 K causing several erosion phenomena. “The selection of plasma facing materials is mainly limited by their capability of absorbing heat and minimizing plasma contamination” [16,17,18].

2.1. Materials based on carbon

International Thermonuclear Experimental Reactor (ITER) and DEMO, the future nuclear fusion plants that will be build, will be characterized by PMIs (Plasma Material Interactions) but, actually, is it not possible estimate the exact numbers of these events [19,20,21,22].
Since few years ago graphite was used as PFC because of the following characteristics [18,23]:
(1) 
“A good compatibility with a wide variety of plasma operation conditions.”
(2) 
“A good thermo-mechanical properties of carbon fiber composites (CFC) and the lack of melting under transient power fluxes makes these materials compatible with high power flux plasmas.”
(3) 
“A high density plasmas in ITER-like regimes were obtained in the experiments with a relatively low core contamination (Zeff = 1.5–2.0).”
(4) 
“Due to its Low-Z, the core radiative losses associated with C in high temperature plasmas are low, while the divertor radiative losses by C, which are necessary to maintain semi-detached operation in ITER, can decrease the divertor power flux by more than a factor of ∼2 compared with fully attached conditions.“
The main negative aspect in using carbon material were [24,25,26]:
(1)
High erosion trend.
(2)
High tritium retention levels
During these year have been constructed database in order to analyze “yield data with respect to ion energy, target temperature and ion flux”.
“The database suggests a weak dependence of the erosion yield on ion impact energy between 10 and 200 eV and a clear tendency for the yield to decrease with increasing flux density [27], implying a ∼2.5-fold reduction in yield for the ITER strike-point conditions compared with previous assumptions (∼1%)”.
Figure 2 taken from [18] shows the variation of gross erosion expected in ITER versus the distance along outer target from separatrix.
“This figure illustrates the complex coupling of target erosion and power load and associated tritium retention which makes predictions to ITER uncertain. [18]
(a) The carbon chemical erosion yield depends strongly on the target temperature, which is determined by the incident plasma power flux.
(b) The power flux at the divertor is determined by the radiative losses and the degree of detachment, which is strongly influenced by the release of carbon into the divertor by chemical erosion. [18]”
The different projects and test actually leave uncertainties about the plasma conditions in ITER that are strongly related to the variation of event like Edge Localizated Modes (ELMs) or disruption that strongly contribute to sputtering and erosion phenomena’s. [18]
For these reasons, actually, the Carbon is not considered as material for ITER.

2.2. Material Based on Beryllium

“Use of beryllium in fusion reactors has been considered for neutron multiplication in breeding blankets and as an oxygen getter for plasma-facing surfaces.” [28]
Beryllium has a strong cross session and a low atomic mass and this combination is ideal for its use in the neutron reflectors, placing this material as candidate for many blanket design [28].
The advantages in using Be as PFC are [18,19,20,21,22,23,24,25,26,27,28]:
  • Low Z material
  • Sputtering lower than carbon [27]
  • “Low radiative losses from the core plasma” [28]
  • Oxygen gathering
The experiment made at the Joint European Torus (JET) nuclear fusion plant, placed in Culham (UK), confirm the above mentioned characteristics [29,30].
The plasma material interaction of beryllium and plasma provokes the creation of beryllium oxides like BeO2 that, from one side, reduce the sputtering and from the other side enhance the H retention [31] to levels comparable to those of carbon oxides [32,33]. The experiments made on PISCE-B facility demonstrate that the H retention depends also from other impurities [34,35,36].
One of the flaw of Be is its low melting temperature (1550 K) that in future plants, like ITER, can provoke extended damages of PFCs in case of PMIs [37].
“The dynamics and loss of the layers of molten Be during transients, which are subject to forces associated with plasma impact, Lorentz forces, etc., it is yet to be studied in detail. The experience with Be in JET was recently reviewed [38,39] with emphasis on the behavior and influence on the plasma of Be melting and molten Be-PFCs. In JET, a single large ELM depositing ∼1MJ in less than 1ms [39,40], led to substantial melting of the Be JET divertor target and terminated the high performance ELM-free phase of the discharge. However, the effects of Be melting on subsequent plasma operations were not catastrophic, due to the plasma’s high tolerance to the Low-Z Be. Therefore, the precise implications of significant Be first-wall melting on the lifetime of the wall in ITER, and on the performance of a burning plasma experiment like ITER, are still not clear and require further study.”
Another key safety issue is the toxicity of Be in case of inhalation, so it is necessary guarantee a continuous monitoring of air to prevent workers disease [28].

2.3. Materials with High-Z

“The major focus of research on High-Z materials in fusion devices has been the achievement of low core plasma contamination, due to the low ‘fatal’ core concentrations (for ignition 10−3–10−4 for Mo and W, respectively) in burning plasma experiments. The core concentration of High-Z impurities is controlled by both the impurity physical sputtering source at PFCs and impurity transport. High-Z materials have been used for the majority of PFCs in several large fusion experiments recently and in the past: Frascati Tokamak Upgrade (FTU) with molybdenum toroidal limiters [41], Alcator C-Mod with a molybdenum first wall and divertor [41,42], TEXTOR with High-Z components as limiters [43] and ASDEX-Upgrade both at the divertor [44] and main chamber [45].“
“In general, High-Z core concentrations decrease with increasing density [43,46,47], as expected from the reduction of physical sputtering with edge temperature, and are lower (by factors of 2.5–10) in the divertor than in limiter geometries [47,48,49,50].”
There are several studies [51,52,53,54,55,56,57,58] that have investigated the possibility to use tungsten and its alloys for the divertor and the first wall. EFDA has runned also a program (W&WALLOYS) to analyze these applications for W [49,50,59,60].
DEMO, as ITER, will have the classic torus shape with the 85% of the inner surface that has to be covered with blanked boxes to convert the power coming from fusion reactors provoking the transmutation of Li in tritium [49].
Under normal condition an heat load of 2 MW/m2 can be reasonably expected so a potential structural material can be the ferritic–martensitic 9% Cr steels with a protection layer based on W as armor material.
“Furthermore, the divertor is the highest thermally loaded components of a fusion power plant. About 15% of the total fusion power has to be removed by divertor while peak loads of 10–20 MW/m2 have to be considered. Like the protection layer of the first wall, the plasma facing divertor parts are intended to be made of tungsten or tungsten alloys. In helium cooled divertor designs tungsten materials are also considered for structural use (e.g., as pressurized pipes or thimbles) [49,50]. Since the requirements for both applications (armor or structure) are quite different, in this paper we distinguish between armor and structural materials which in both cases could be made of tungsten. In addition, all plasma facing components are exposed to fast neutrons. That means that the consequent damage, wear, and aging can reduce the durability of some divertor components significantly.”
The anisotropic microstructure of W allow its use for fabrication of pipes and plates [61].
“So far, only rhenium is known to improve the ductility of tungsten by solid solution but its use for fusion energy applications has been ruled out for reasons of cost and irradiation embrittlement.
Iridium too is sometimes mentioned in literature as having a similar effect [62], though it is even more expensive. This leaves only tantalum, vanadium, molybdenum, and titanium which also form solid solution with tungsten (Cr is excluded from this list since W–Cr alloys are known for their brittleness). Round blanks of W–1%Ta, W–5%Ta, W–5%V, W–25%Mo, and W–50%Mo have been produced by PLANSEE (sintered in hydrogen atmosphere and forged to a deformation degree of 80%). Charpy tests in the temperature range of 400–1100 °C (in vacuum) have shown that compared to pure tungsten the Ductile-Brittle Transition Temperature (DBTT) of all alloys is higher, i.e., they are more brittle. Therefore, it is assumed that tungsten cannot be ductilised by solid solution, except with rhenium (or maybe iridium). As a last option, however, the effect of titanium has still to be investigated. [49,50]”
Experiments to test thermal shock and fatigues have been performed in Jülich and Garching [63,64,65] varying the power flux from 0.19 and 1.13 GW/m2 and the temperature from 25 °C to 400 °C with a load of pulsed from 100–1000 per 1 ms concluding that “the most promising material so far is W–1 vol.%Y2O3 showing as yet no crack formation, while pronounced cracking is observed in W–5 vol.%Y2O3 and W–5 wt.%Ta materials under similar loadings [49,50]”
The loss of coolant accidents can provokes temperatures (in vessel) till 1200 °C that can oxide W causing a radioactive W oxides release [66].
“The linear oxidation rate of tungsten at 1000 °C is about 1.4 × 10⁻² mg·cm−2·s−1 [67], which in the approximately 1000 m2 DEMO first wall would correspond to a release of half a ton of tungsten oxides per hour. A way of avoiding this problem is the addition to tungsten of oxide-forming alloying elements leading to the growth of a self-passivating layer at high temperature in the presence of oxygen. During normal operation, the surface of this material will consist of pure tungsten, owing to preferential sputtering of the alloying elements. In previous studies the good performance of the system W-Cr-Si manufactured via magnetron sputtering could be demonstrated [68]. Thin films of such alloys showed a strongly reduced oxidation rate compared to pure tungsten. However, the formation of brittle tungsten silicide may be disadvantageous for the powder metallurgical production of bulk W-Cr-Si alloys if a good workability is needed [49,50].”
Several oxidation tests have been made with different W-based alloys at a temperature of 1073 K for 3 hours (see Table 1 taken from [69]). Table 1 shows good results for Tungsten- Chromium- Titanium alloys. The amour of first wall needs a certain thickness (in the order of millimeters) using the above mentioned combinations (W-Cr-Si and W-Cr-Ti) obtaining a quasi-dense material [49,50,70,71].
Table 2 shows the main characteristics of two alloys (W-Cr10-Si10 and W-Cr12-Ti2.5) [71,72,73].
“So far, thin tungsten plates show the best ductility, as long as specific fabrication or machine rules are followed: (1) stress concentrators have to be avoided and (2) the anisotropic microstructure has to be aligned to the contour of the according part. Joining of tungsten materials is possible, but design routes, cost and low-activation criteria probably have to be redefined for brazing materials. A complete picture of the irradiation performance of tungsten materials is not yet available. But for further, more specific designs at least, basic irradiation damage data have to be produced. This, together with the aforementioned issues, should be at the top of the priority list of fusion material programs in general” [49].

2.4. Austenitic and Ferritic/Martensitic Steels and Other Advanced Materials

“It is impressive how the world of nuclear fusion research and the world of nuclear fission research have been in touch during these last decades exchanging ideas, new research achievements and resources.” One of the scientific discipline that has deeply strongly tapped this dual-use approach is the material science (see Figure 3).
One of the main fusion nuclear reactor difference if compared with the nuclear fission reactors is the high production of He and H that “require special mitigation techniques to minimize cavity swelling and embrittlement. At low temperatures, defect cluster accumulation in the matrix can produce high hardening with accompanying embrittlement and the localized deformation phenomenon is known as dislocation channeling may create high stress concentrations at grain boundaries. At high temperatures, formation of helium cavities at grain boundaries can lead to severe inter granular embrittlement. Therefore, the matrix regions and grain boundaries must be designed to mitigate the severe neutron radiation effects. Finally, the unique requirement to restrict alloying compositions to so-called “reduced activation” elements in order for fusion to achieve its environmental “low-impact” potential produces considerable constraint on the number of options for development of improved materials” [5].
These challenges are faced by the production of advanced material with unique performances [74,75,76,77,78], these material include ferritic/martensitic steels, V–Cr–Ti alloys and SiC/SiC ceramic composites.
“There is an overlap between the temperatures of fusion, fission and spallation facilities as showed in Figure 2 taken from [78].
“In Table 3 is it possible read also the main operating parameters of these three types of plants [78].”
“We can divide the materials into two main groups: steels (austenitic and ferritic/martensitic) and other advanced materials. Although there are very significant differences in the fusion, fission and spallation environments, there is a range of performance-limiting phenomena arising from radiation effects that are common to all nuclear environments. However, to illustrate the similarities in challenges, the operating requirements for two of the principal structural materials used in component design, austenitic stainless steels and ferritic/martensitic stainless steels, are summarized in Table 4 and Table 5 taken from [78] and Table 1 in [79] shows a list of commercial and research steels [79,80,81].“
Actually the use of stainless steel has not been planned for nuclear plants like ITER because of its low thermal conductivity and He embrittlement. The worldwide research for DEMO is actually focused on 8–9 Chrome ferritic/martensitic steels [82,83,84,85,86].
“Several high-priority near-term potential research activities to address fusion nuclear science challenges are summarized”. General recommendations are reported in [87].
The operating temperature strongly influence the microstructural features [88,89,90] and the PMIs include several phenomena over different range of time and length scale reported in Figure 4 taken from [87].
“Regarding the materials for material structures, the overarching challenge is to maintain mechanical and structural integrity by designing highly efficient radiation self-healing nanostructures that are resistant to unprecedented levels of displacement damage and nuclear transmutation products. Atomic displacement damage in a DEMO reactor corresponds to ejecting every atom from its lattice site more than 50–150 times. The conversion of fusion power to practical electricity and the creation of fusion fuel in the blanket, tritium systems, and balance of plant regions is a complex topic involving multiple scientific phenomena. Between the PFCs, the tritium fueling, purification and recycle components and the heat exchangers, the tritium concentration and neutron flux will vary by over 10 orders of magnitude and the temperature and magnetic field will vary by several orders of magnitude, and span different regimes of physics and chemistry predominance [91]. A broad and fundamental science-based approach is needed to meet this challenge. In order to appropriately position the technological maturity of PFCs, materials, blanket, and tritium technology for potential next step devices following ITER, it is imperative to initiate or enhance modest research activities on fusion nuclear technology. Numerous opportunities for high-impact fusion research may be achievable by making modifications to existing facilities and/or moderate investment in new medium-scale facilities [87].
In conclusion, it is possible to affirm that several research programs have been developed and are in progress to find the proper solutions to choose the right materials for the future nuclear plants like ITER or DEMO, you can read also [92,93,94,95,96,97,98,99,100,101,102,103,104,105,106,107,108,109,110,111,112,113,114,115,116,117,118,119,120,121,122,123,124,125,126,127,128,129,130,131,132,133,134,135] to go into the details of the most important research in progress. Another important conclusion is that the research programs for the materials that are used in nuclear fission plants can be a source of ideas and information for nuclear fusion research framework.

3. Materials and Methods

The previous sections put in evidence that the material selection from future nuclear plans (like ITER or DEMO) is one of the most important scientific challenge to let the nuclear fusion be a real alternative for energy production. Another key point is that the PMIs are inevitable so as the formation of dust, flakes and composites from PFCs due to PMIs. Accidents provoking vacuum failures and coolant dispersions (LOVA or LOCA) can jeopardize the functionality of the nuclear plants provoking dust re-suspension inside the vacuum vessel, this re-suspension can damage the plants causing explosions and can be dangerous for the health of operators because of its toxicity, radioactivity and capability to chemical react. In order to face these security and safety problems the Quantum Electronic and Plasma Physics (QEP) Research Group of University of Rome Tor Vergata in collaboration with ENEA Fusion Technology of Frascati (Italy) has developed a facility, STARDUST, in order to reproduce experimental conditions comparable to those expected in ITER in case of LOVA or LOCA in order to get a mathematical model to predict dust re-suspension. STARTDUST facility showed limits and it has been upgraded, the new facility is STARDUST-U. The dimension of dust created inside the tokamaks that are used worldwide is in the range 0,1–1000 μm and the most dangerous for the respiratory system are the one in the range 0,1–1 μm that can be withheld from the lungs. These particle dimensions, in the pressurization regime used inside STARDUST and STARDUST-U, has a behaviour comparable to those of the air streamlines and this is way in this work we will analyse the thermodynamic behaviour both from an experimental and numerical point of view [136,137,138,139,140,141,142,143,144,145,146,147,148,149].
STARDUST-U (Acronyms for Small Tank for Aerosol Removal and DUST-Upgrade) is an experimental facility build in 2014 by the QEP research group in order to get experimental data necessary to run numerical simulations and validate the mathematical models necessary to predict dust resuspension. It has been obtained through a structural and mechanical upgrade of STARDUST facility. It has been build up to reproduce thermos-fluid dynamic conditions comparable to those expected in a fusion reactor vessel during vacuum failures [136,137,138,139,140,141,142,143,144,145,146,147,148,149]. The vacuum failures are replicated through the inlet of pressurized air by different ports of the facility (C-D-E-F, see Figure 5).
The data collected inside STARDUST-U are:
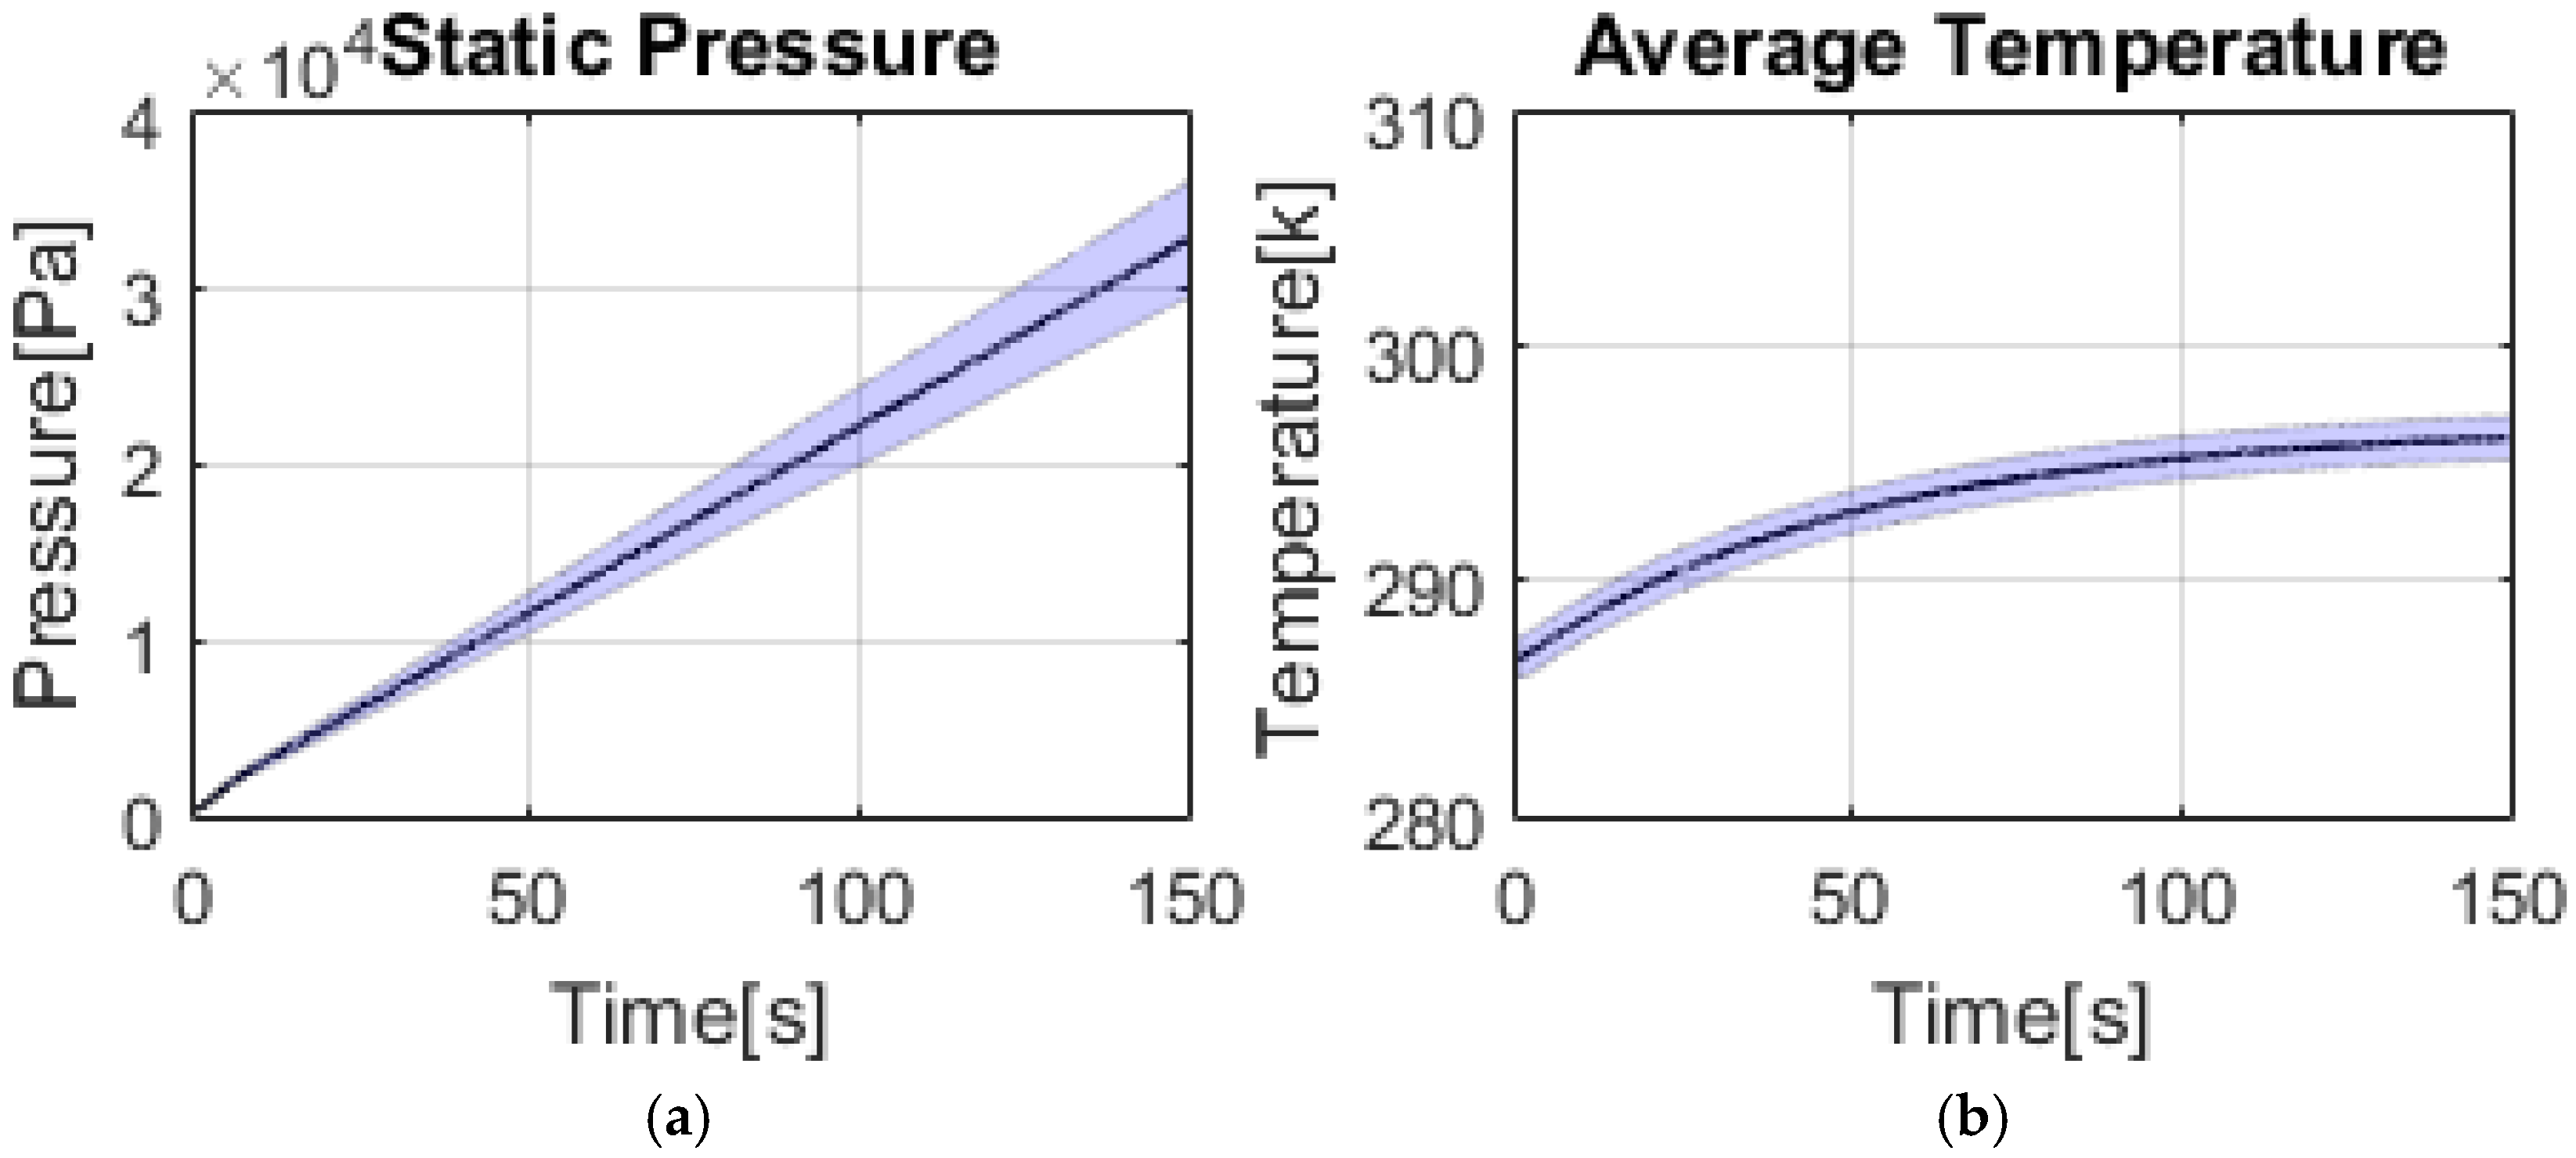
  • static pressure inside the chamber (Pa),
  • average temperature of the chamber (K),
  • air volume flow-rate in liters per minute (L/min),
  • differential pressure from transducers in selected locations (Pa), local air velocity (m/s) and corresponding Mach Number (Ma).
All this data is collected by a National Instruments cards system able to store (with a frequency of 50 Hz) the information coming from the hardware placed on the facility.
Static pressure was measured with a Pressure gauges (Alcatel AP 1004 Pirani Gauge, Alcatel Vacuum Technology, Annecy, France [135]), temperature with three J-thermocouples, flow rate with MKS flow meter (1559A Mass-Flo Controller, MKS Instruments, Andover, Ma, USA [135]) that covers the range from 20 to 200 standard L/min, differential pressure from Kulite piezo resistive transducers (XCE-093-2D High Temperature Miniature Pressure Transducers [135]). Voltage signal from transducers was converted into differential pressure (Pa) according to transducers sensitivity and allowed to calculate local air velocity and Ma in the locations where the transducers have been placed for each replication.
In order to replicate the vacuum failure accidental event expected, an integrated LabVIEW control system was developed to correctly set up the border conditions, and to control and acquire the thermofluid-dynamic variables throughout the experiment. Standard Procedures of a typical run are summarized in Figure 6.
In the experimental campaign presented in this paper, LOVAs have been reproduced as air intake from three different inlet ports (ports C, E, F; Figure 6), corresponding to upper, mid-plane, and lower part of the facility. Two different air flow-rates have been used (27 and 40 L/min), allowing to reproduce two different pressurization rates. A vacuum pump connected with the chamber allowed to set to 300 Pa the initial vacuum level for each replication (only for port C the experiments have been conducted also starting from 2000 Pa). Data acquisition was triggered by the on/off electro valve opening that allowed the air to enter the chamber from the selected port replicating the breach of a vacuum failure. Three replications have been performed for each experiment. Diagnostics data regarding internal static pressure, average temperature and air volume flow rate will be shown for one of the three set-ups, i.e., port C, while the two others, having the same trend, have been omitted. For the three experimental set-ups (i.e., upper, mid-plane and lower vacuum failures respectively from ports C, E, F), transducers positions inside the chamber will be shown, along with corresponding air velocity and Ma trends over time. Experimental results (presented with error tube calculated according to error analysis presented below) are compared with numerical results from simulations performed with ANSYS CFX 16.0 using SST k-ω turbulence model with γ-ϑ transitional model.
Acquisition system for each replication provides a data files where the following quantities are listed: observation no., actual internal static pressure (Pa), j-thermocouples temperatures (°C), air volume flow rate (L/min), differential pressure voltage signal from transducers (mV).
The replications were elaborated to calculate the average local air velocity and Ma average for each experiment using a script developed with Matlab.
According to the First Law of Thermodynamics for an open system, assuming steady state operations, altitude term negligible, isentropic process (no heat transfer), no work done, and considering compressible air as a perfect gas, its local velocity and Ma can be determined as in the Equation (1):
v = 2 k k 1 R T ¯ M [ ( P Δ P S + 1 ) k 1 k 1 ] ,
where:
-
k = c p / c v Ratio of the fluid specific heat at constant pressure c p to the fluid specific heat at constant volume c v (it is approximately equal to 1.4 for air at standard condition);
-
R = 8.314   J K 1 m o l 1 Universal gas constant;
-
M = 0.028968   k g / m o l Dry air molecular mass at standard conditions.
-
T ¯ = 1 N i = 1 N T i Mean temperature in the transducer’s positions from i thermocouples (K);
-
P S (Pa) Static pressure (measured by Pirani pressure gauge);
-
P Δ = P T P S (Pa) Differential pressure (measured by pressure transducers as difference between its head pressure and its reference tube pressure);
-
P T (Pa) Total pressure (measured by the transducers head).
“However, experimental measurements are affected by direct errors and propagation of uncertainty in case of indirect measurements, like in this case velocity and Ma. If the three uncertainties Δ x 1 , Δ x 2 , Δ x 3 on the variables of the velocity function v = f ( x 1 , x 2 , x 3 ) are not likely of the same sign, and if variables correlations are neglected, and if this applies also to the Ma function M a = g ( y 1 , y 2 ) , it is possible to use the following Equations 2 and 3 [135,136,137,138,139,140,141,142,143,144,145] respectively for total uncertainty Δ v of velocity and Δ M a of Ma.“
Δ v = [ ( f x 1 ) Δ x 1 ] 2 + [ ( f x 2 ) Δ x 2 ] 2 + [ ( f x 3 ) Δ x 3 ] 2 ,   and
Δ Ma = [ ( g y 1 ) Δ y 1 ] 2 + [ ( g y 2 ) Δ y 2 ] 2 ,
where x 1 = T ¯ (mean temperature from J-thermocouples), x 2 = P S (static pressure from Pirani pressure gauge), x 3 = P Δ (differential pressure from Kulite pressure transducers), y 1 = x 1 , y 2 = v (local air velocity).
f x 1 = 1 2 T ¯ 2 k k 1 R T ¯ M [ ( P Δ P S + 1 ) k 1 k 1 ]   ;
f x 2 = P Δ R T ¯ ( P Δ P S + 1 ) 1 k MP S 2 2 k k 1 R T ¯ M [ ( P Δ P S + 1 ) k 1 k 1 ] ;
f x 3 = R T ¯ ( P Δ P S + 1 ) 1 k MP S 2 k k 1 R T ¯ M [ ( P Δ P S + 1 ) k 1 k 1 ] ;
g y 1 = v 2 T ¯ 1.5 k R / M ;
g y 2 = 1 k R T ¯ / M .
Uncertainties Δ x 1 , Δ x 2 , Δ x 3 , Δ y 1 , Δ y 2 (direct errors) on the corresponding variables are [23]: Δ x 1 = 0.0031 Δ T ¯ ( t ) , Δ x 2 = 0.1 Δ P S ( t ) (Pirani pressure range: from 0.0005 to 1000 mbar), Δ x 3 = 0.1 Δ P Δ ( t ) , Δ y 1 = Δ x 1 , Δ y 2 = Δ v , where T ¯ ( t ) , P S ( t ) and P Δ ( t ) are functions of time, acquired throughout the experiments.” [134,135,136,137,138,139,140,141,142,143,144,145,146,147,148,149].

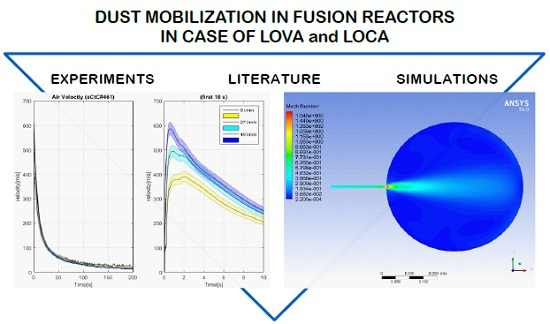
4. Results and Discussion

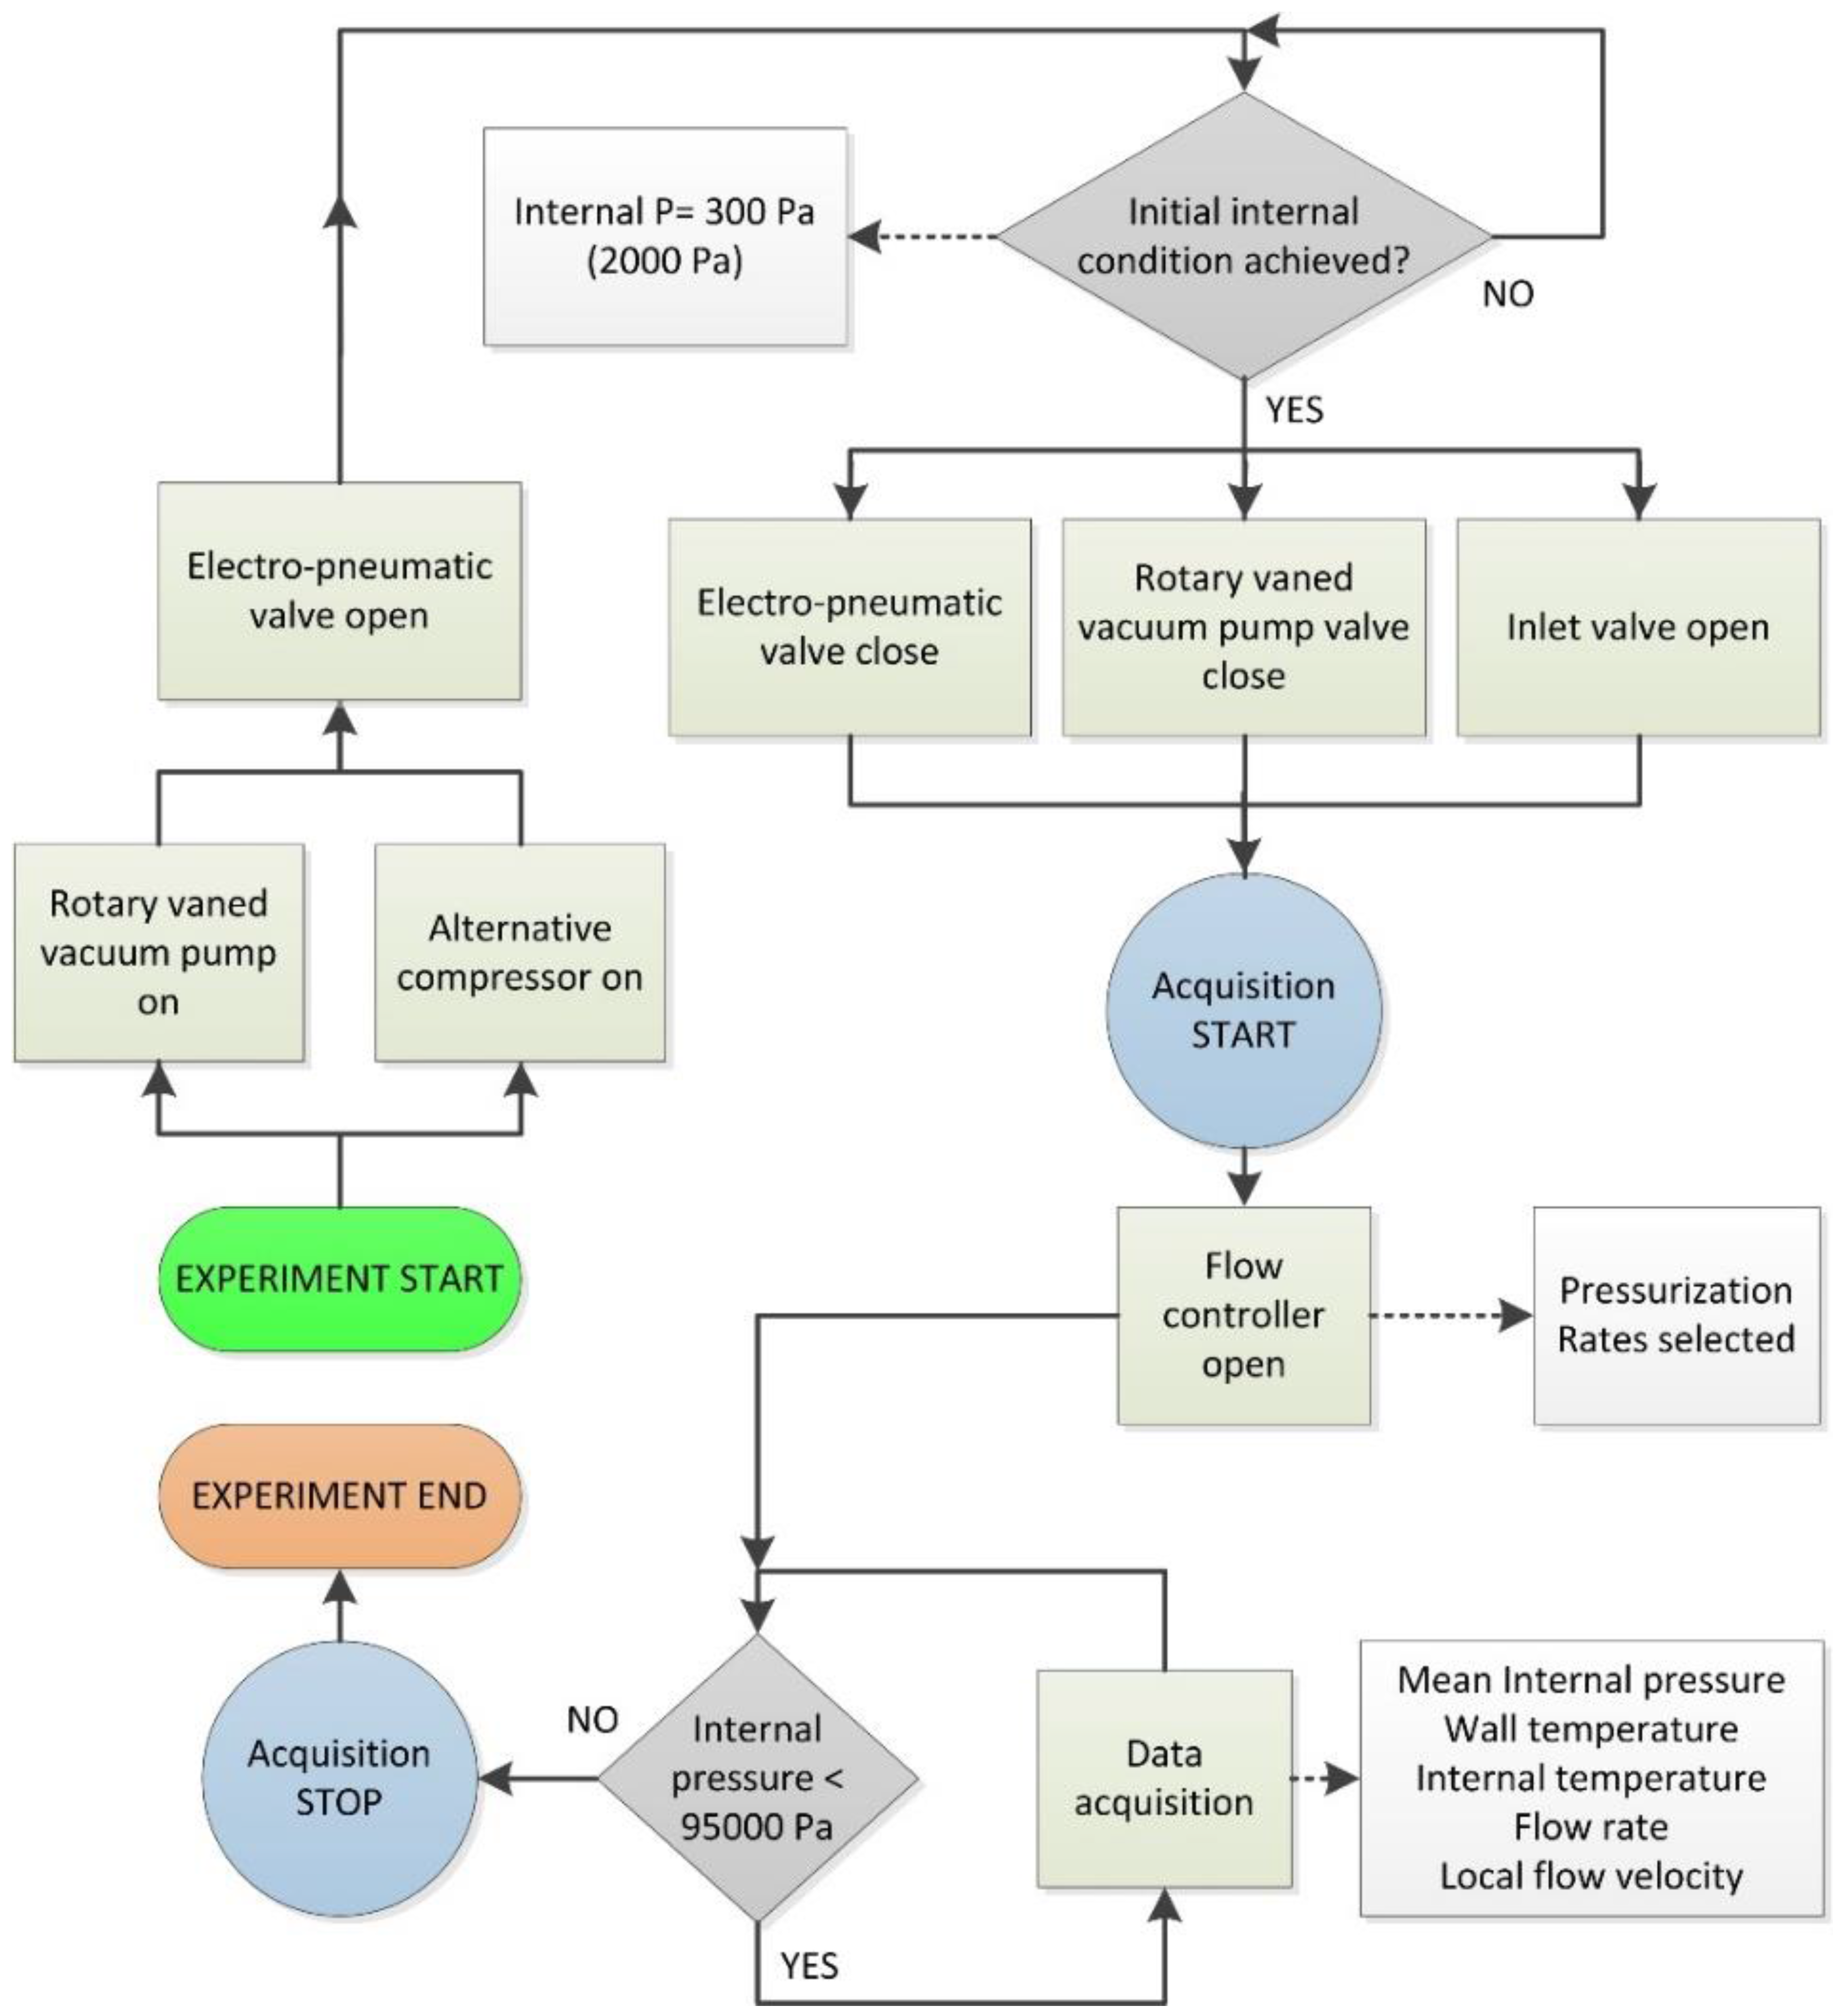
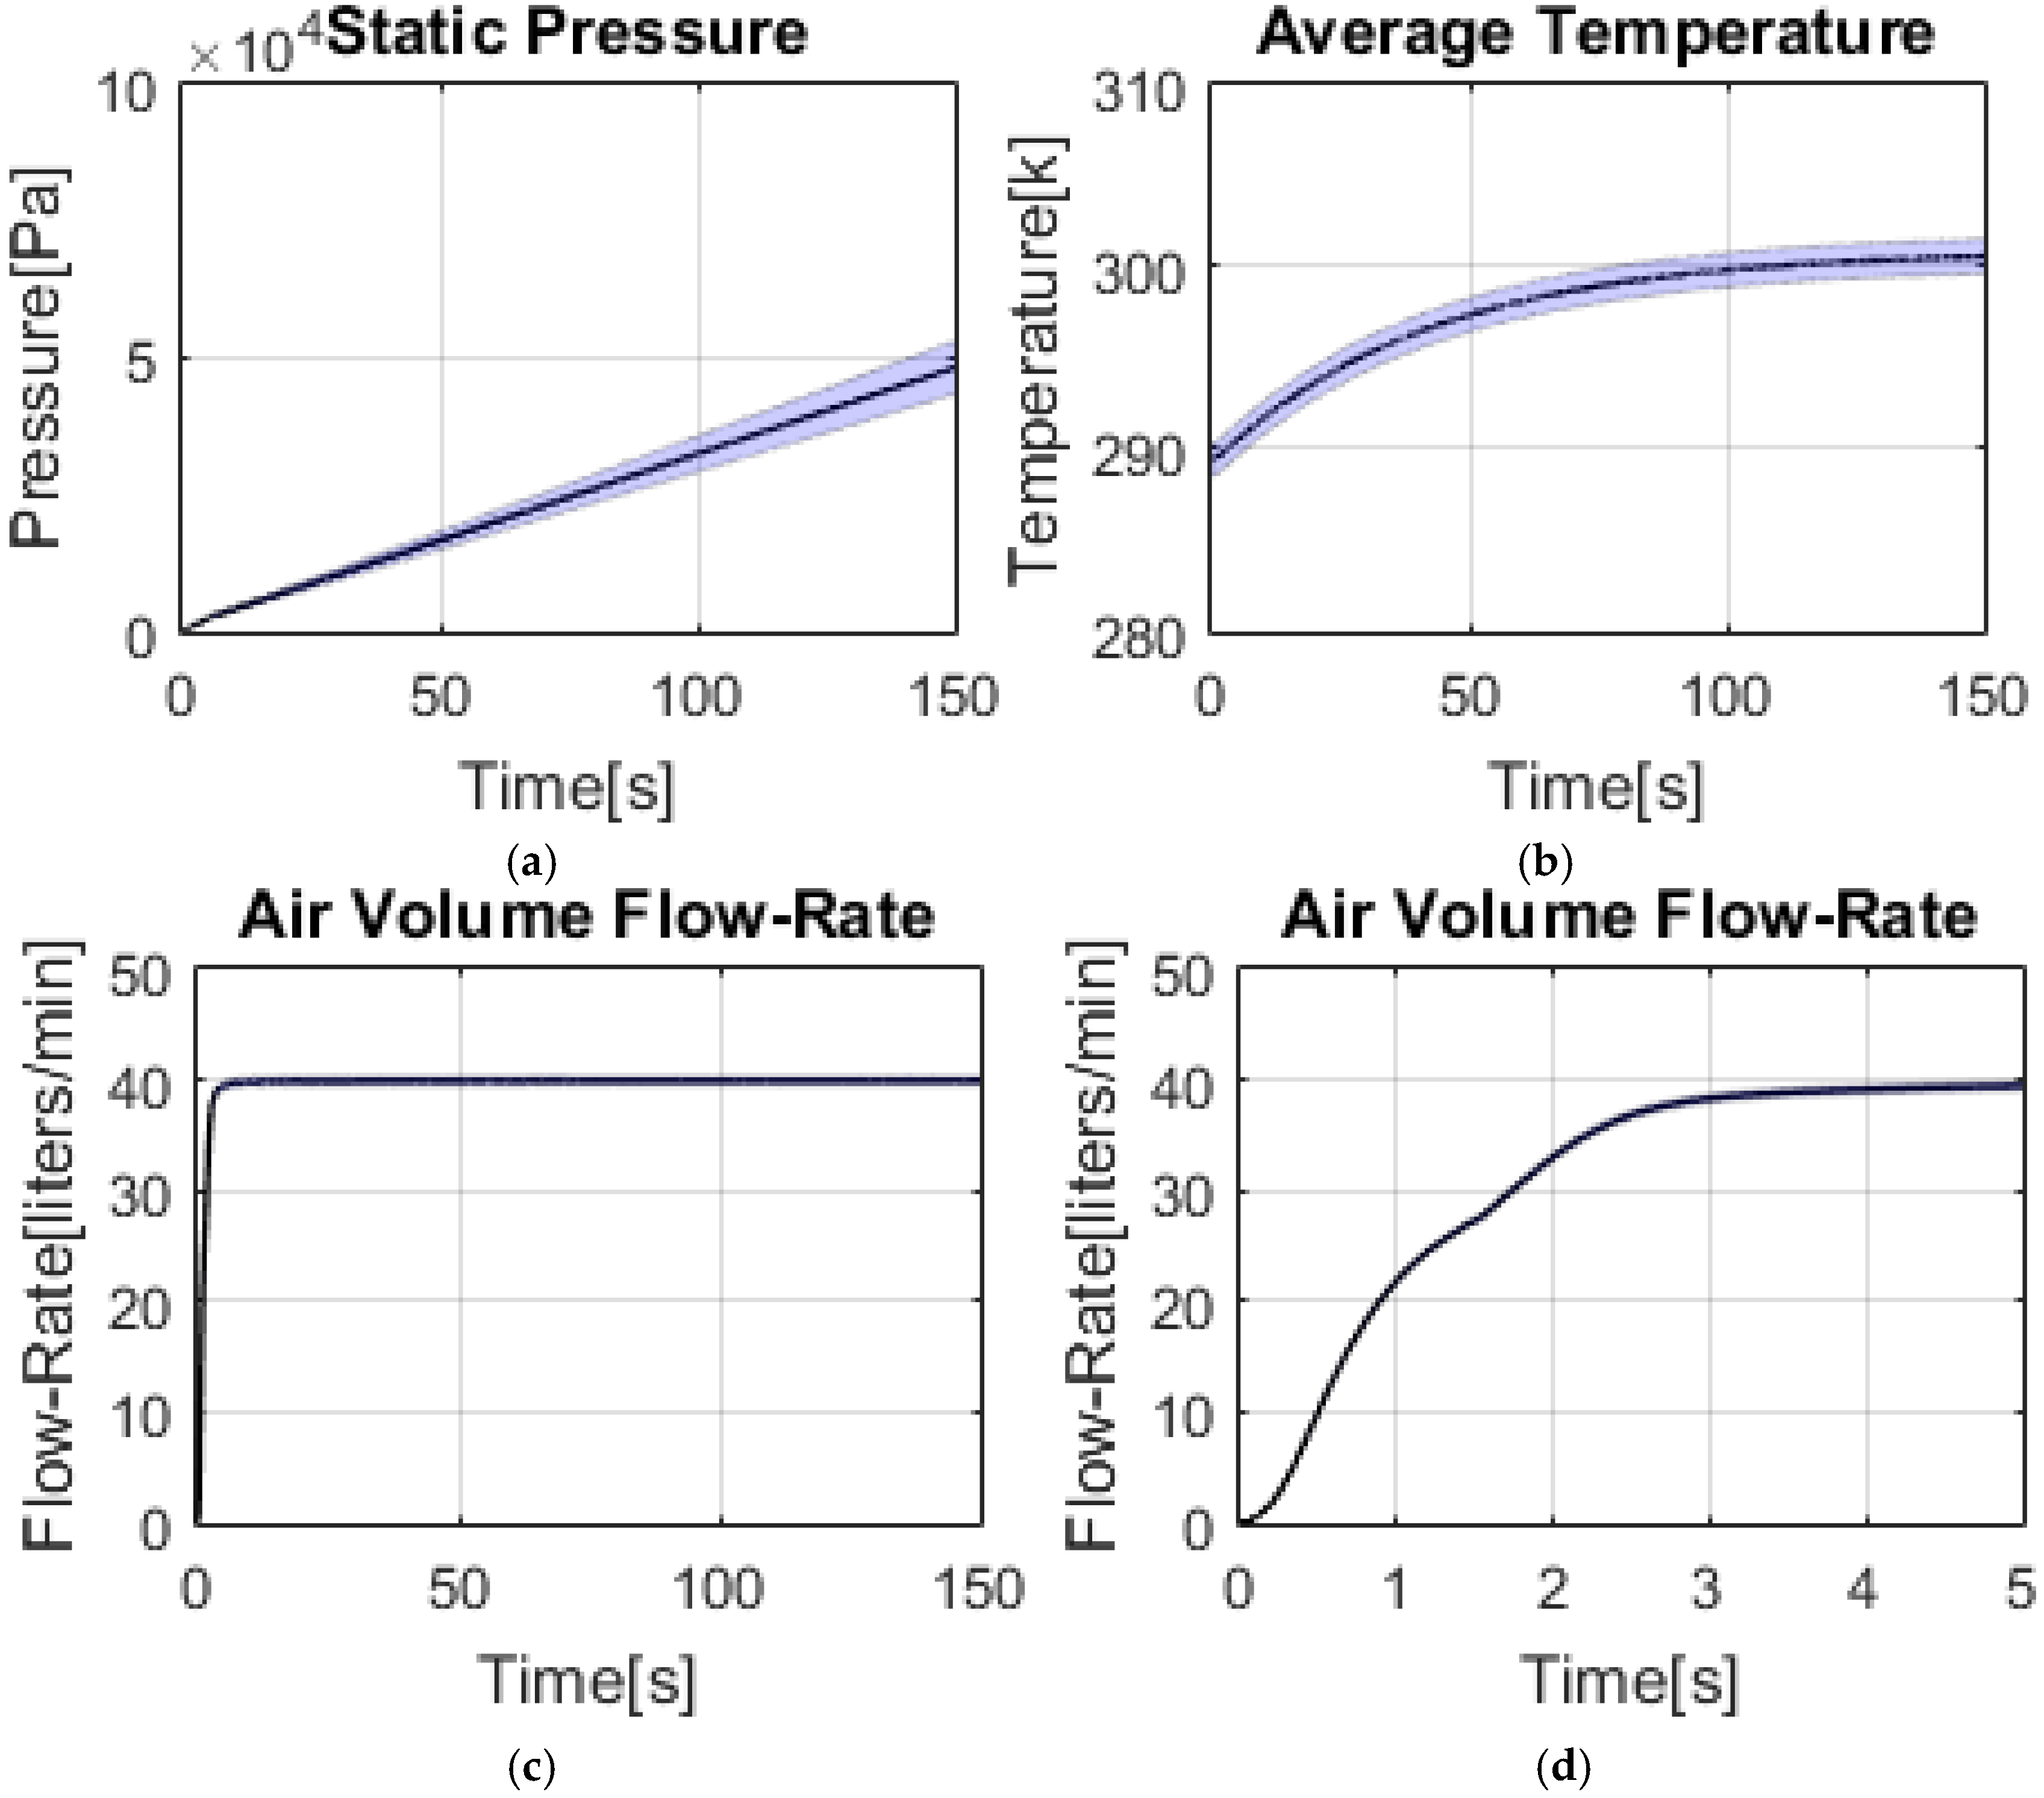
4.1. Experimental Campaign

The experimental set-up (see Section 4) allow to reproduce different LOVA and LOCA accidents by flowing compressed air inside the experimental facility (STARDUST-U) in order to get the data that allow a thermo-fluid dynamics analysis of those accidents inside the facility.
The values measured and collected are:
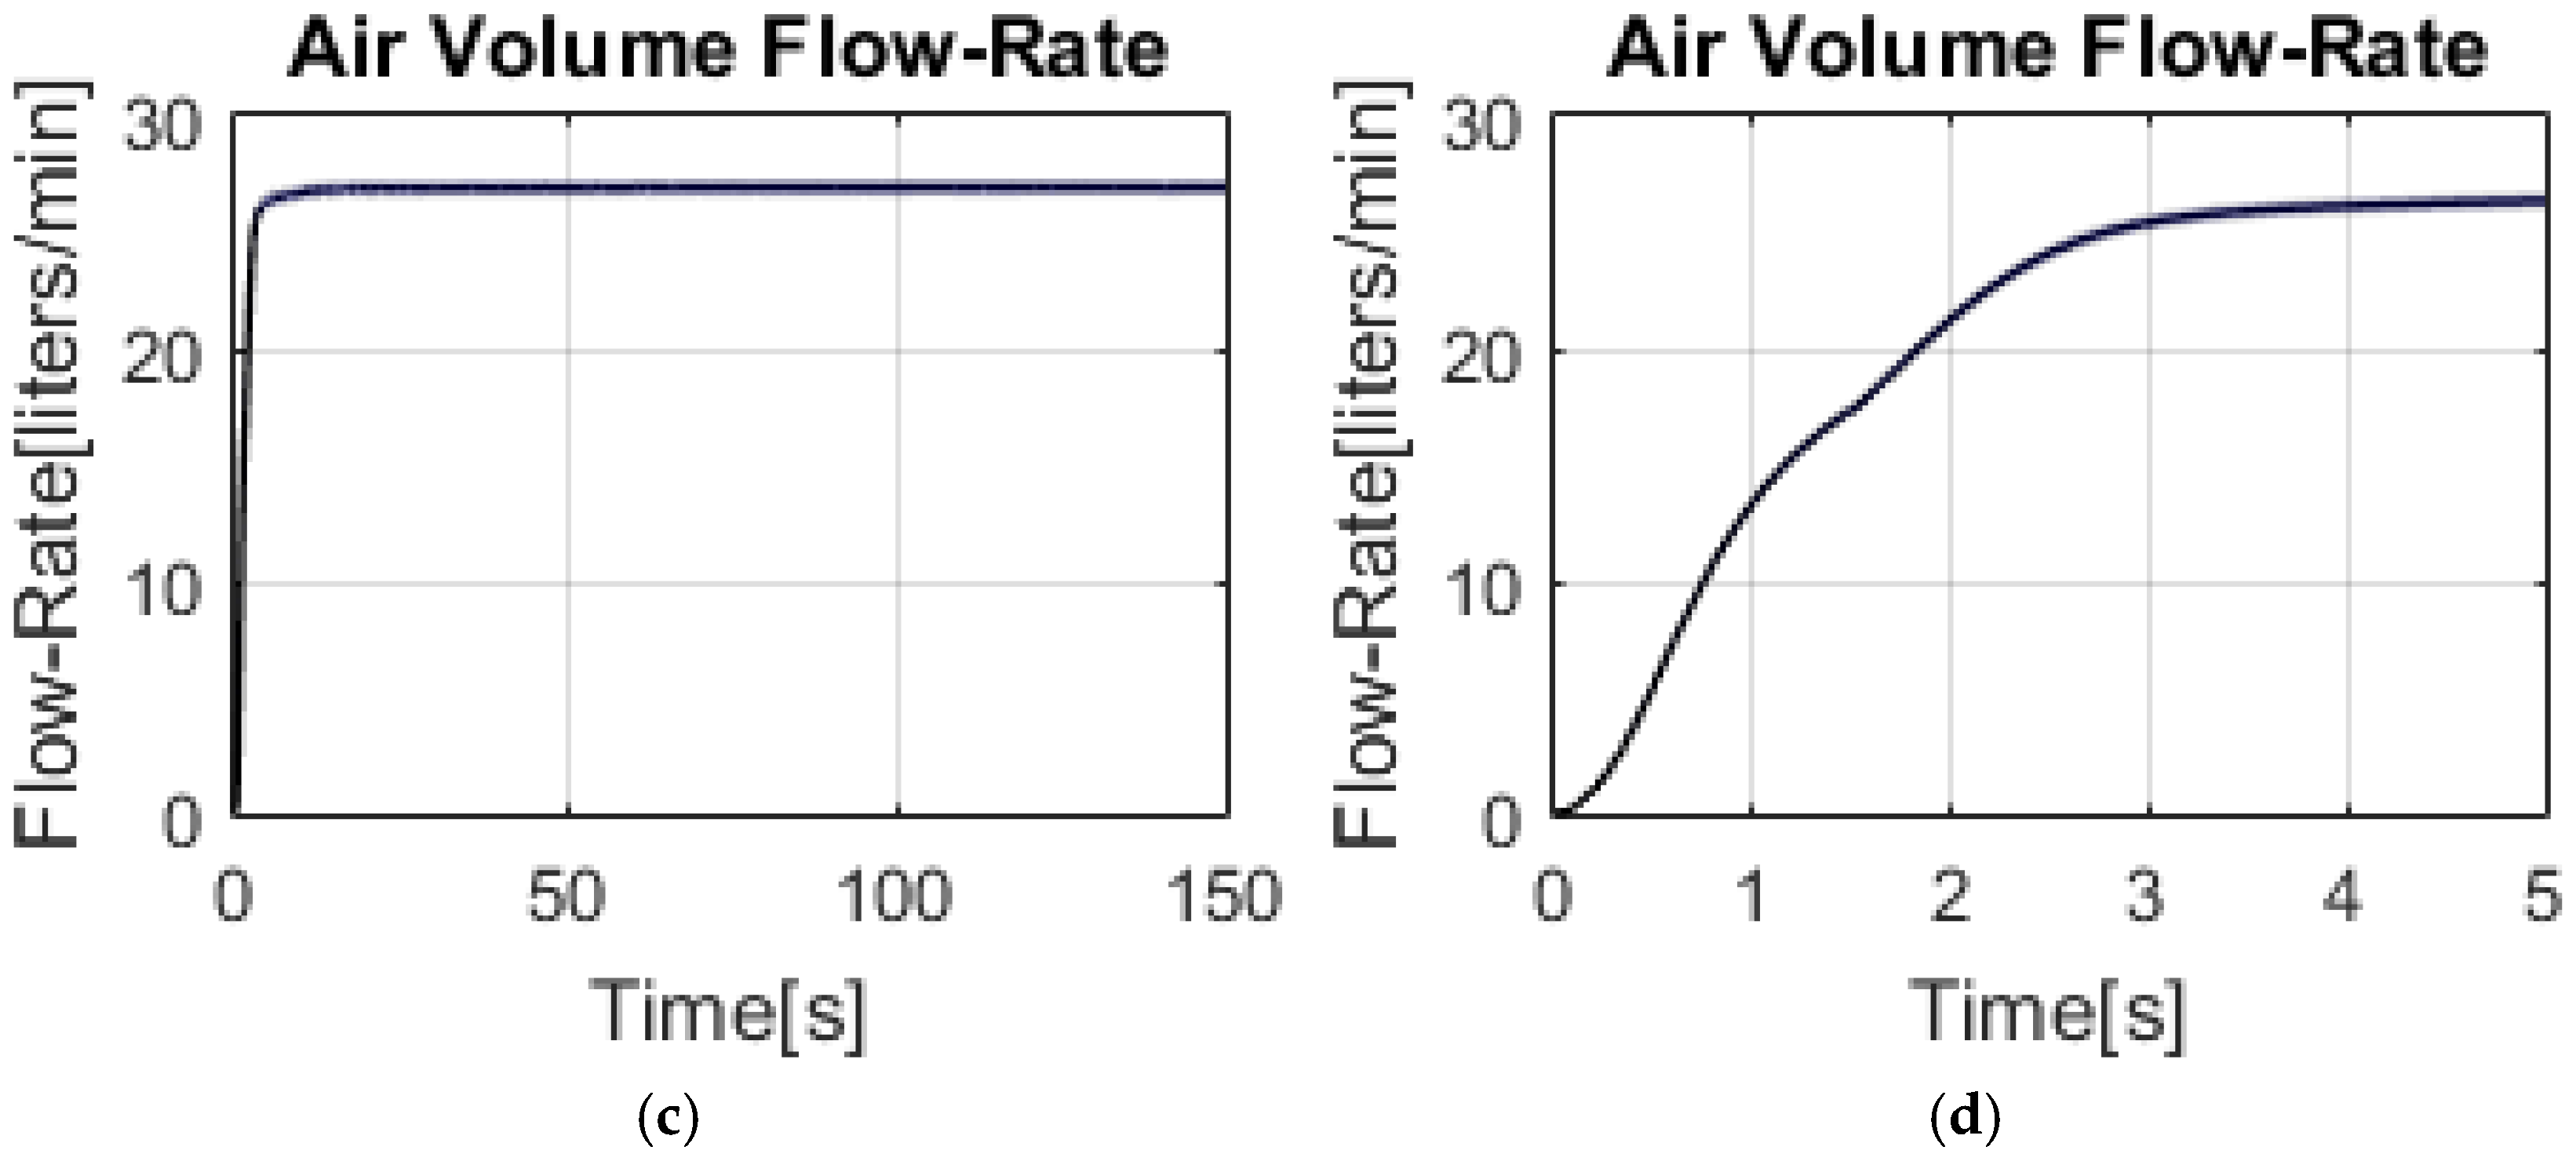
  • Flow rate measures (through the flow meters)
  • Pressure rates (through pressure gauges)
  • Temperatures rates (through thermocouples)
  • Punctual velocity values (through pressure transducers)
These values are collected and stored with a frequency of 50 Hz and have a dual function: give the proper boundary conditions to run the simulation and be used as comparison data to validate the output of the simulation that means validate the mathematical model to predict the consequences of a LOVA or LOCA accidents on dust resuspension.
The experimental campaign discussion will be divided into two sub-section:
  • Experimental results get reproducing the LOCA accident through an air injection from valve C and D
  • Experimental results get reproducing the LOVA accident through an air injection from valve E and F
The boundary conditions used to experimentally reproduce the accidents (from Valve C, D, E, F) are:
  • Initial pressure of the compressed air that has to be flowed in the facility: 2,8 bar
  • Initial pressure inside the chamber: 200 Pa
  • Final pressure inside the chamber: 95000 Pa
  • Environmental temperature: 25 °C
  • Three different inlet air flow rates:
    • 8 L/min (to reproduce a pressurization rate of 100 Pa/s inside STARDUST-U)
    • 27 L/min (to reproduce a pressurization rate of 300 Pa/s inside STARDUST-U as suggested by the GSSR)
    • 40 L/min (to reproduce a pressurization rate of 500 Pa/s inside STARDUST-U)
    For each combination, three replications were made. The results showed the average of the three replication.

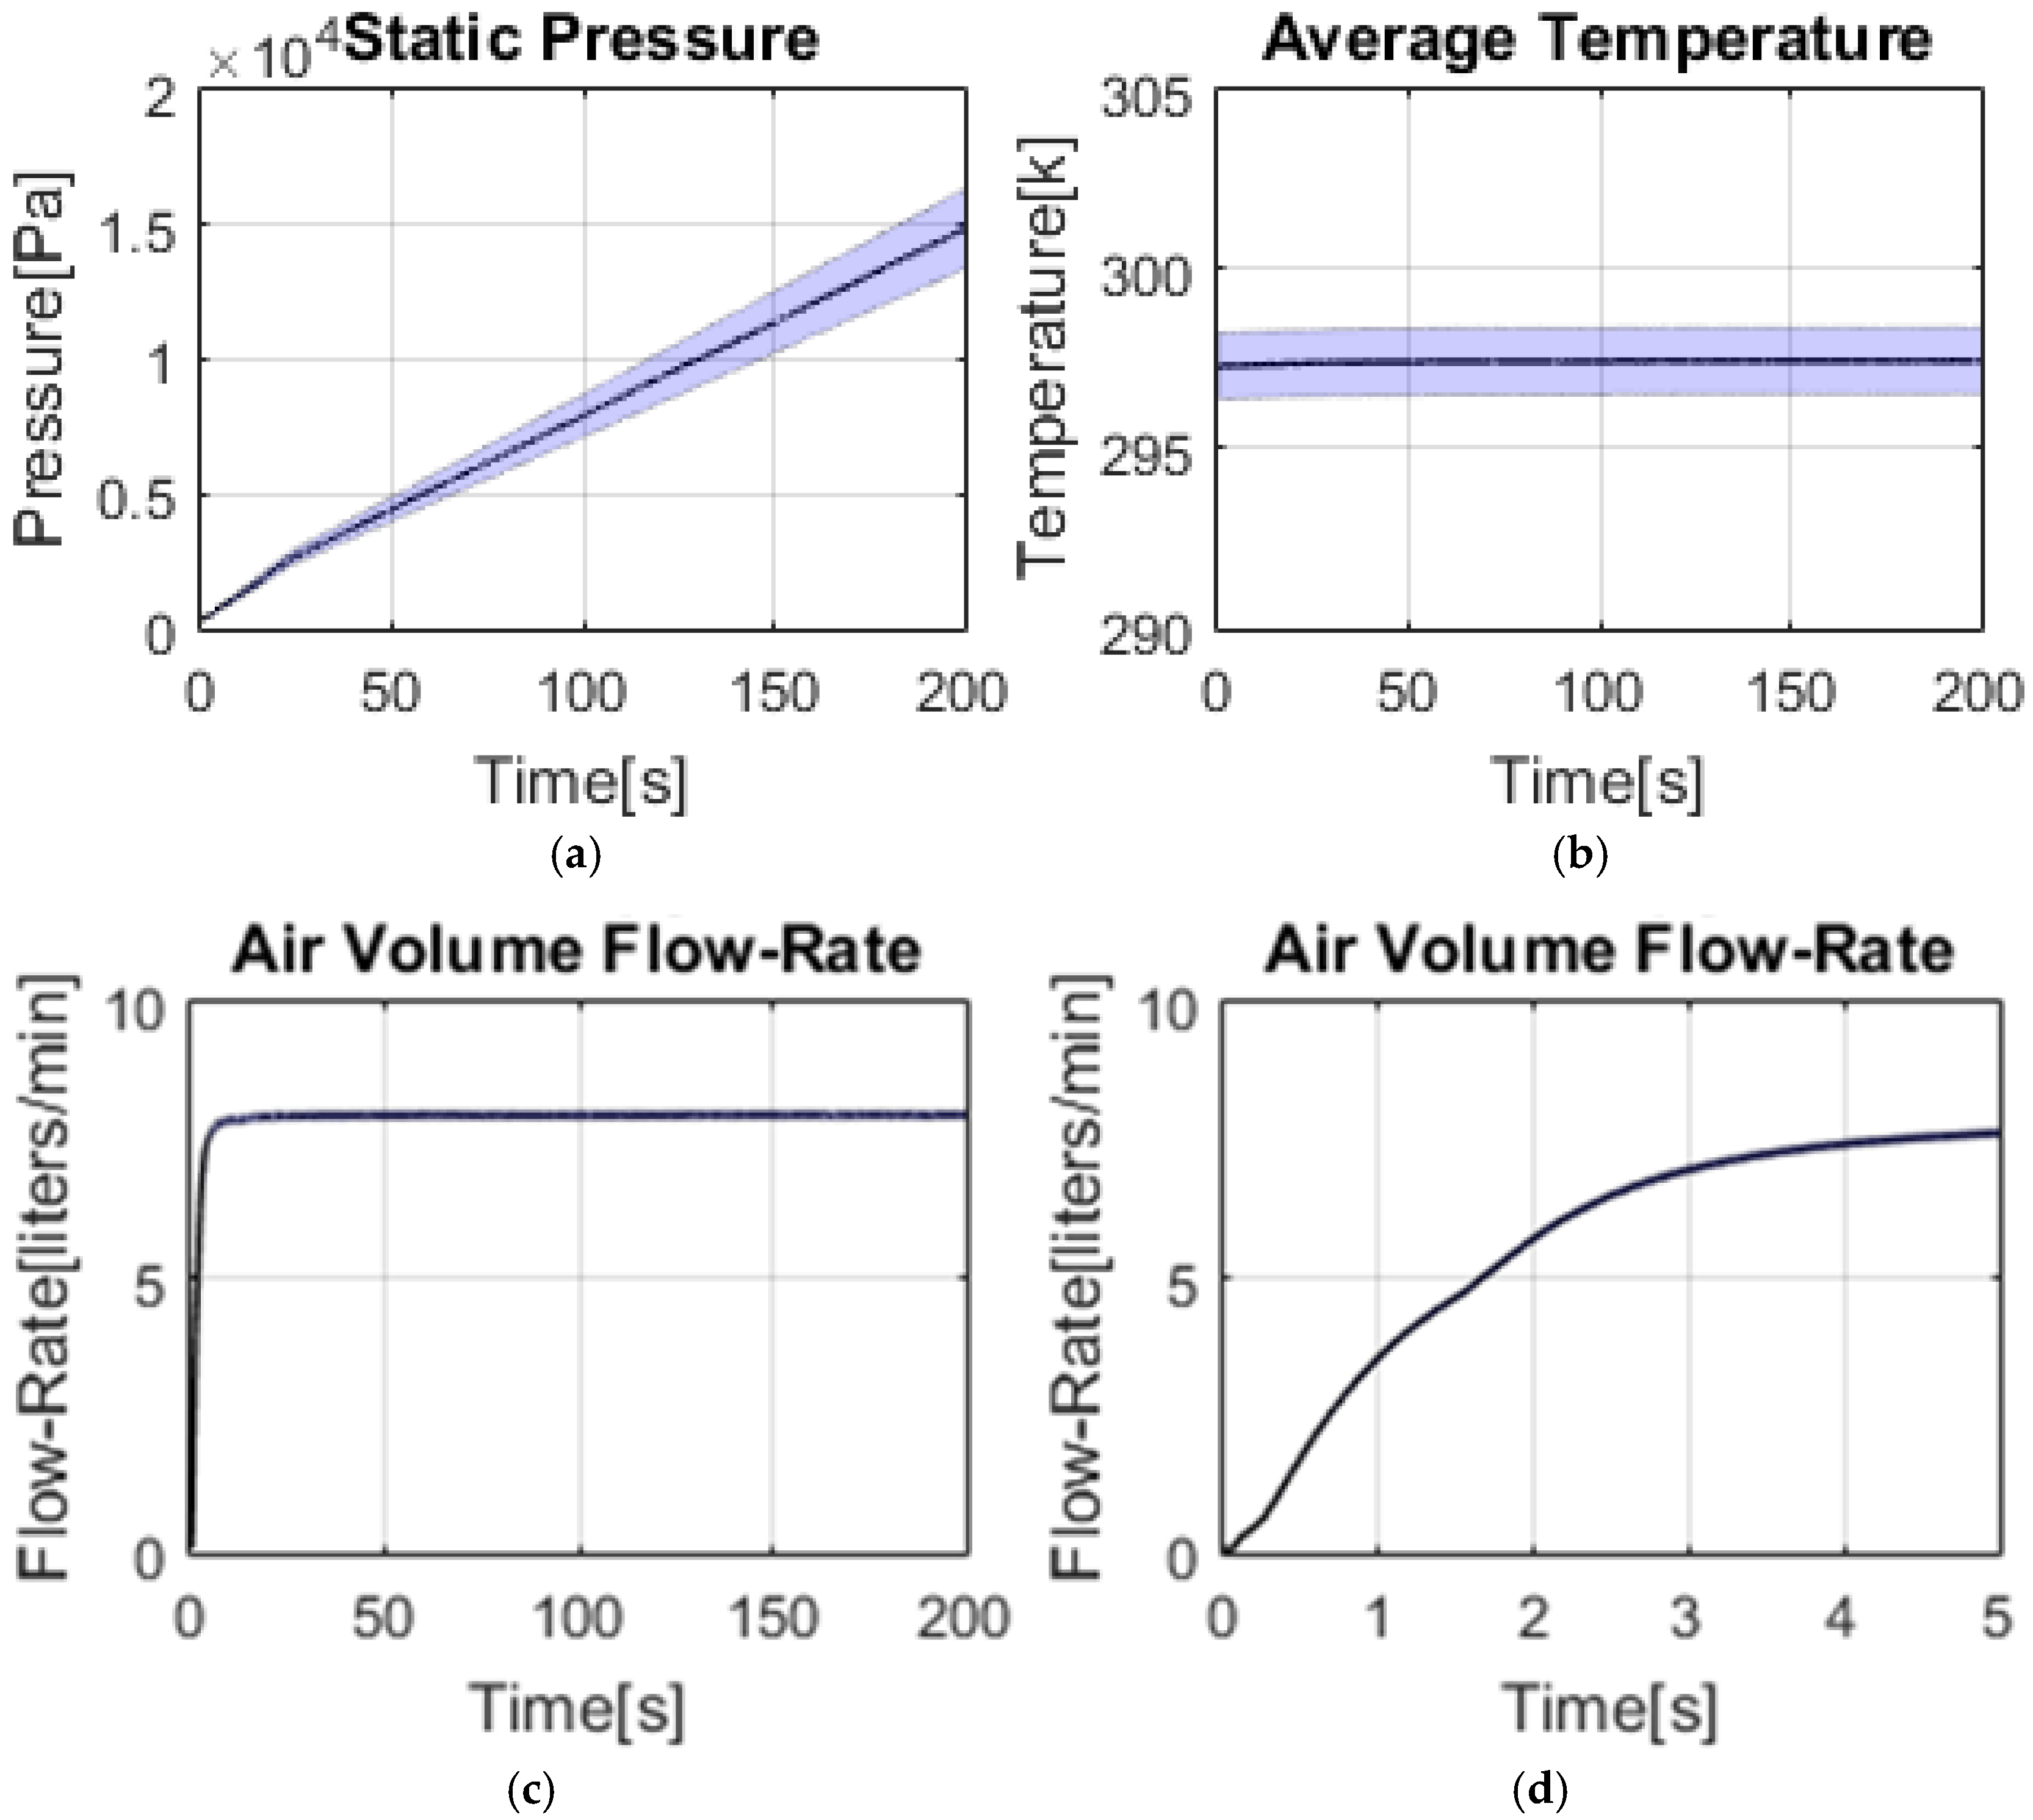
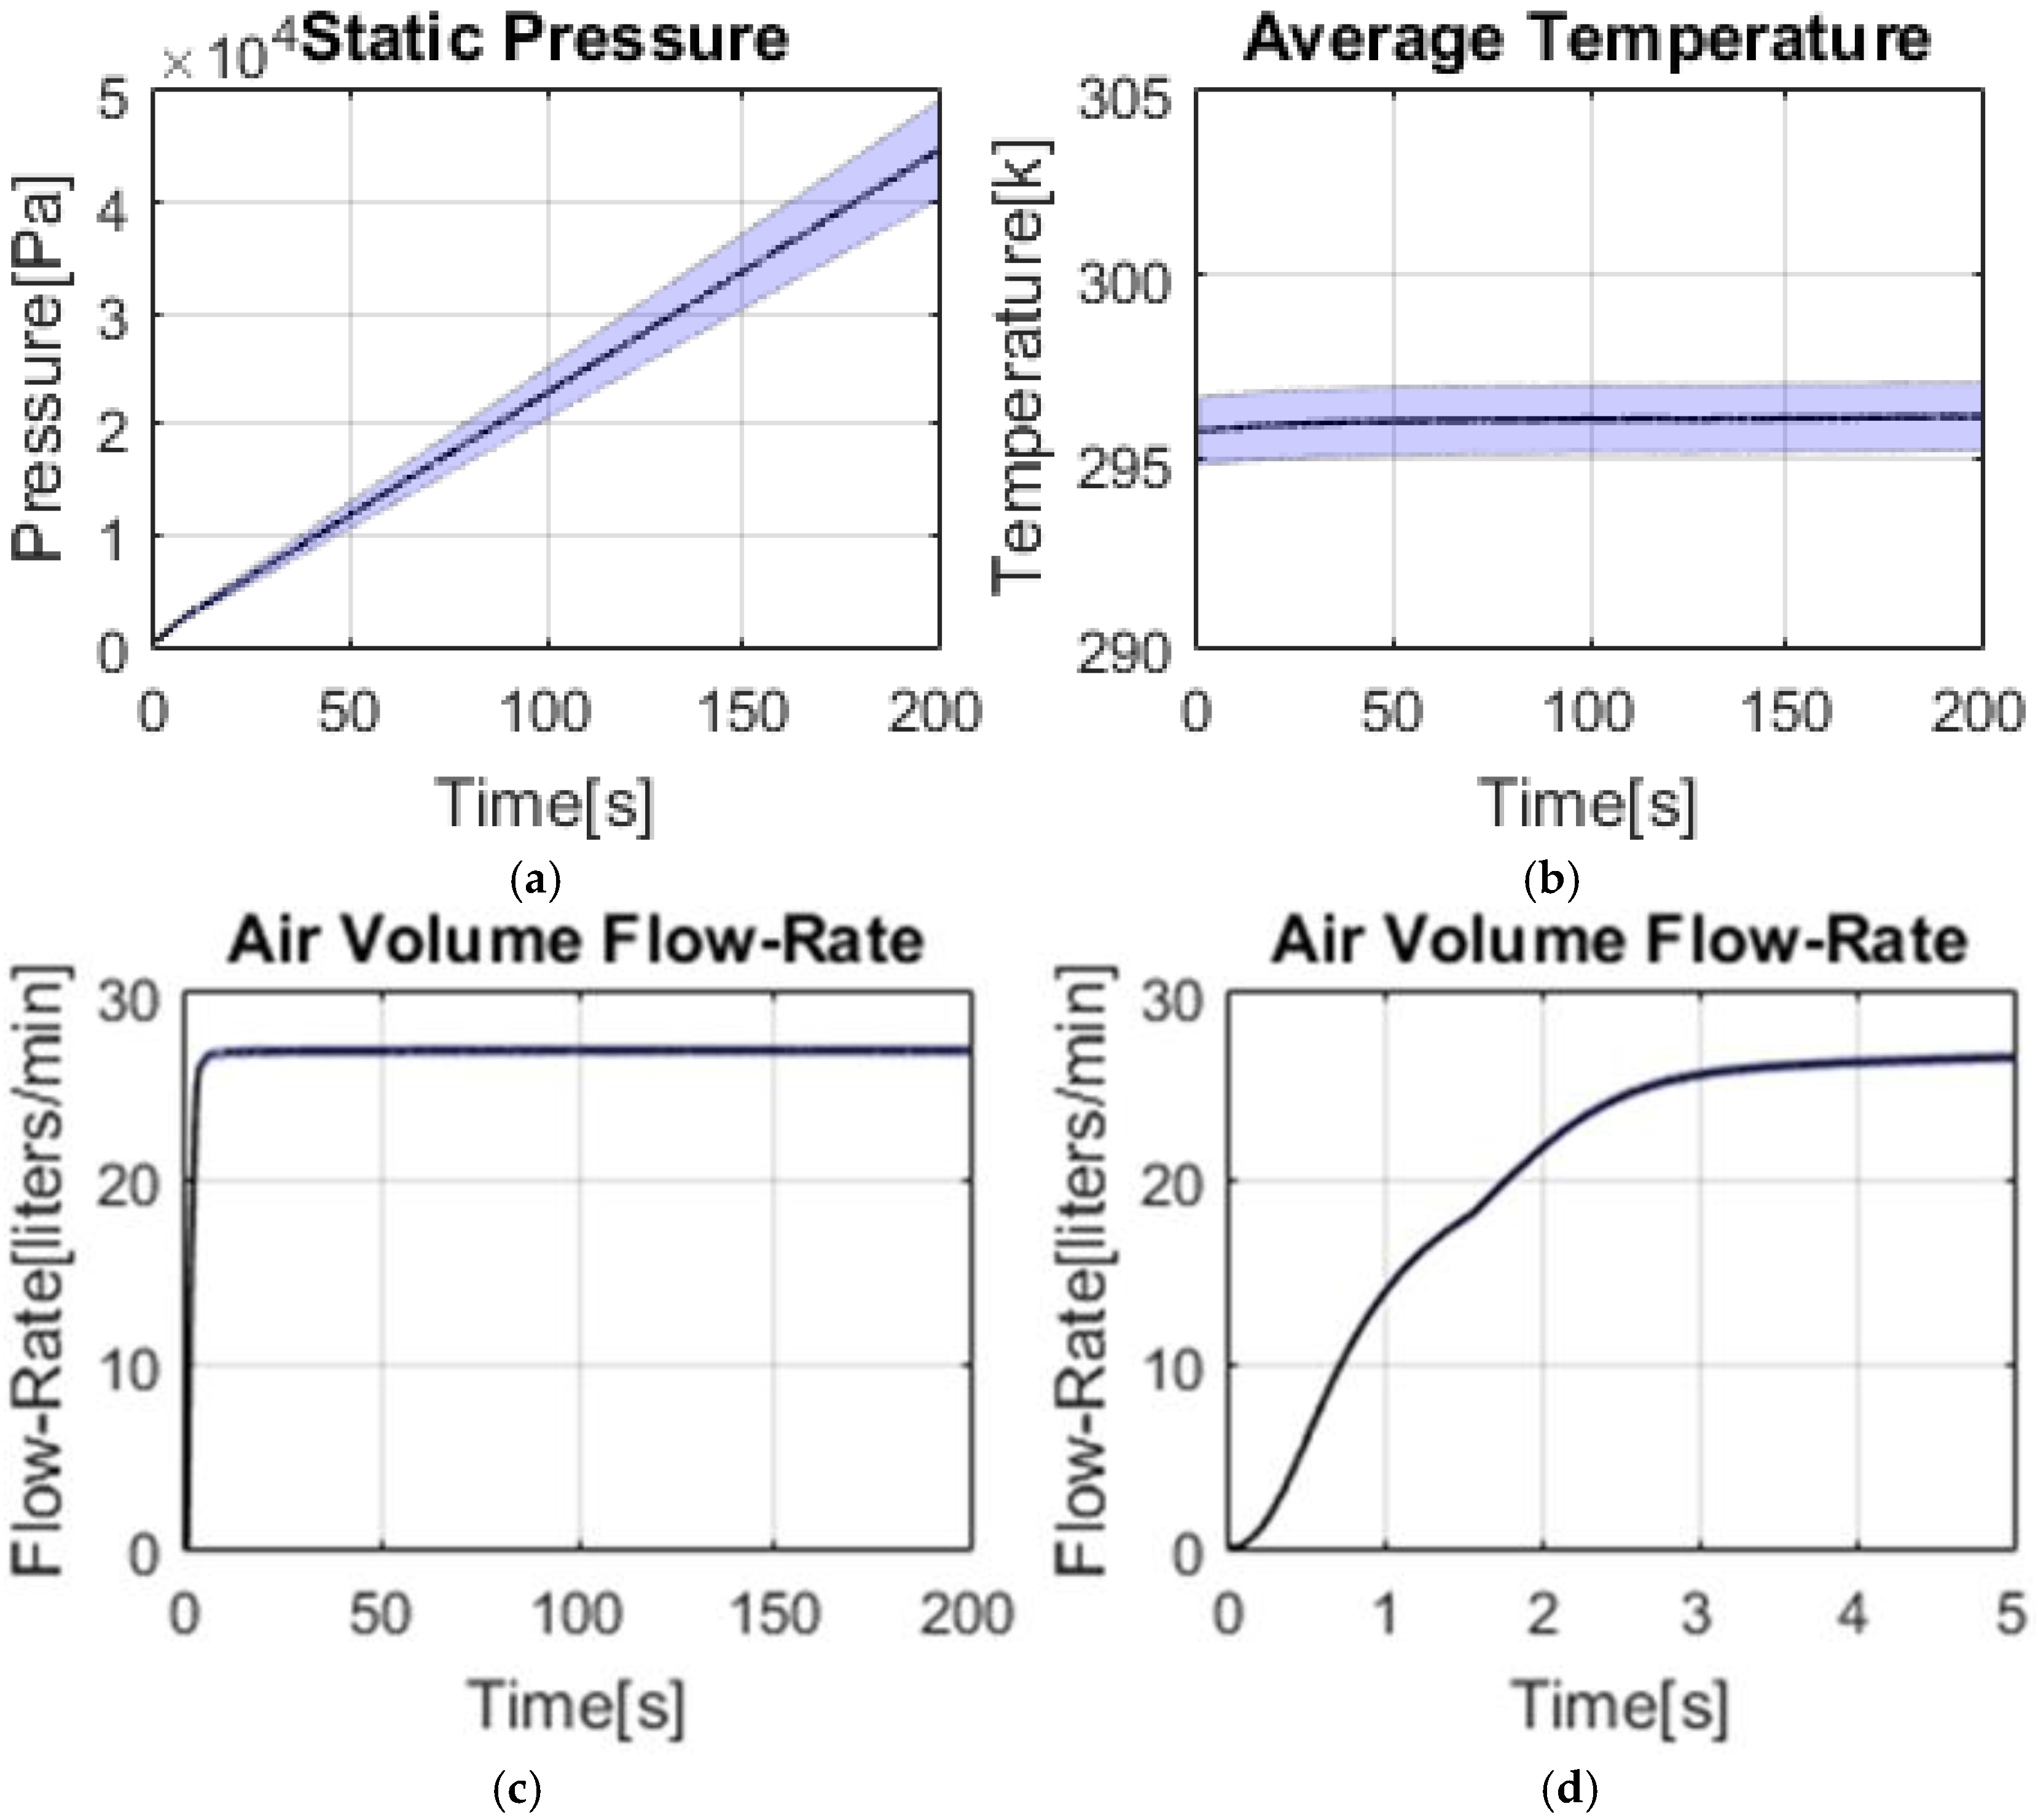
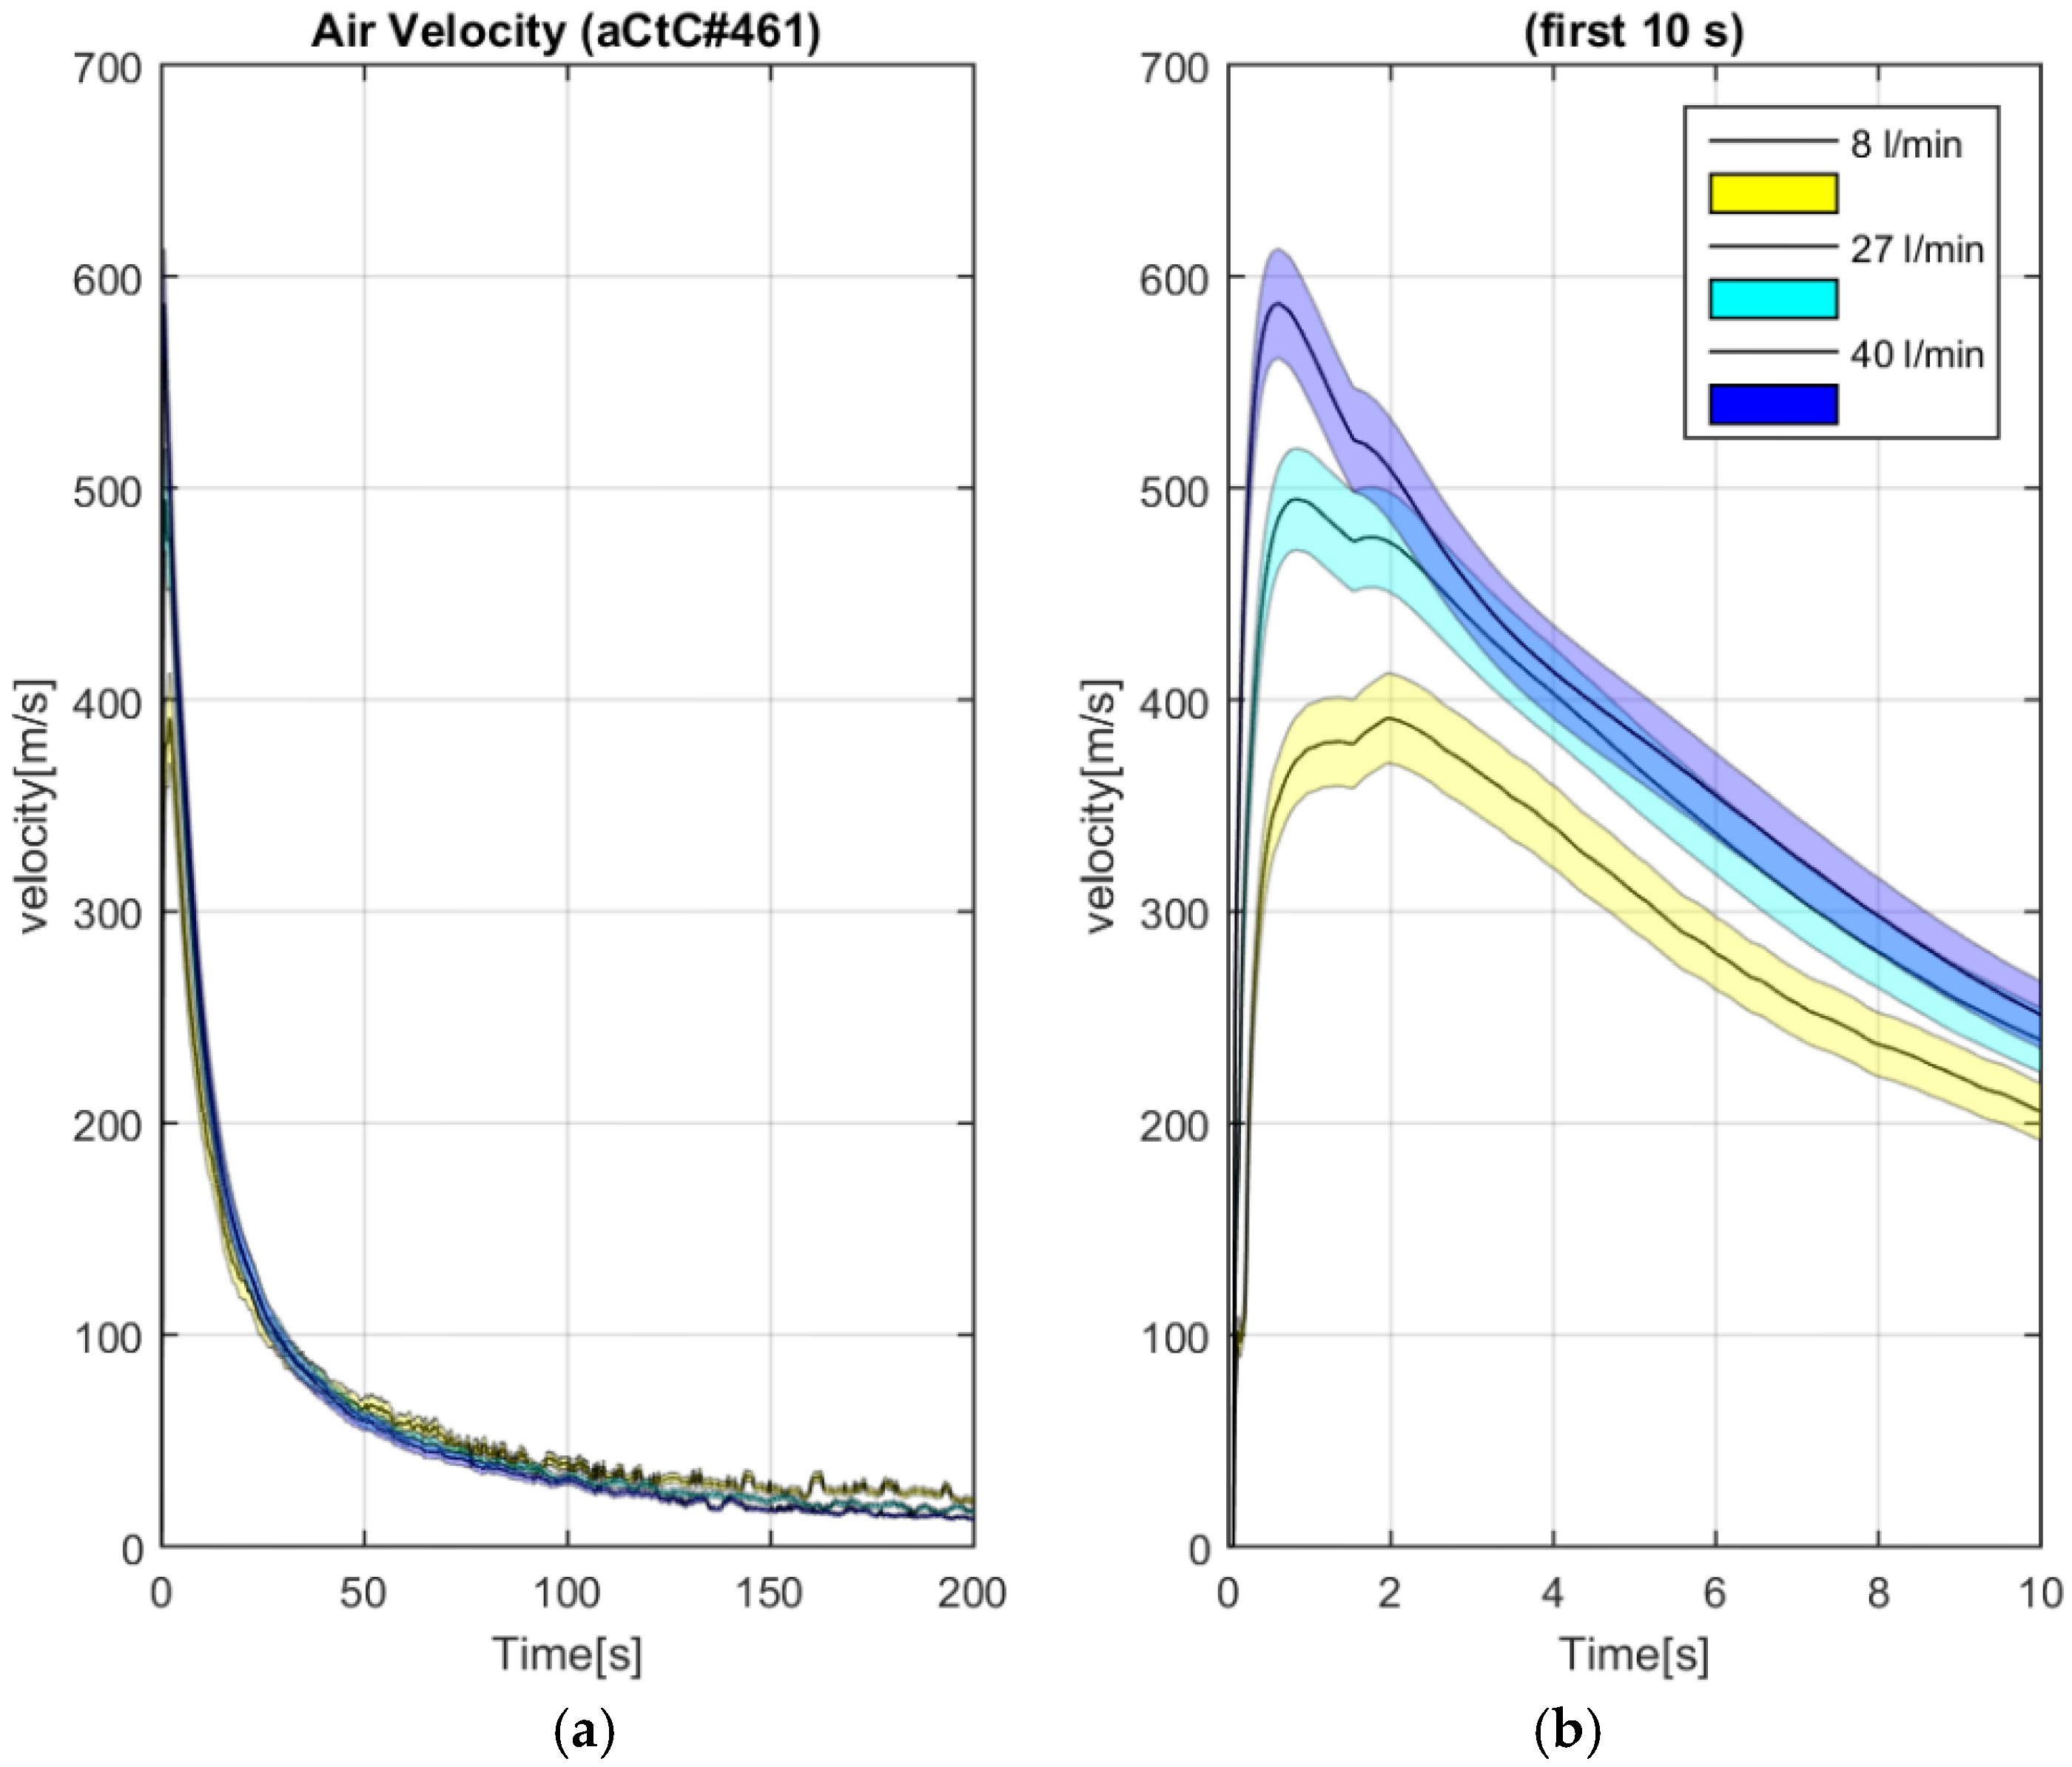
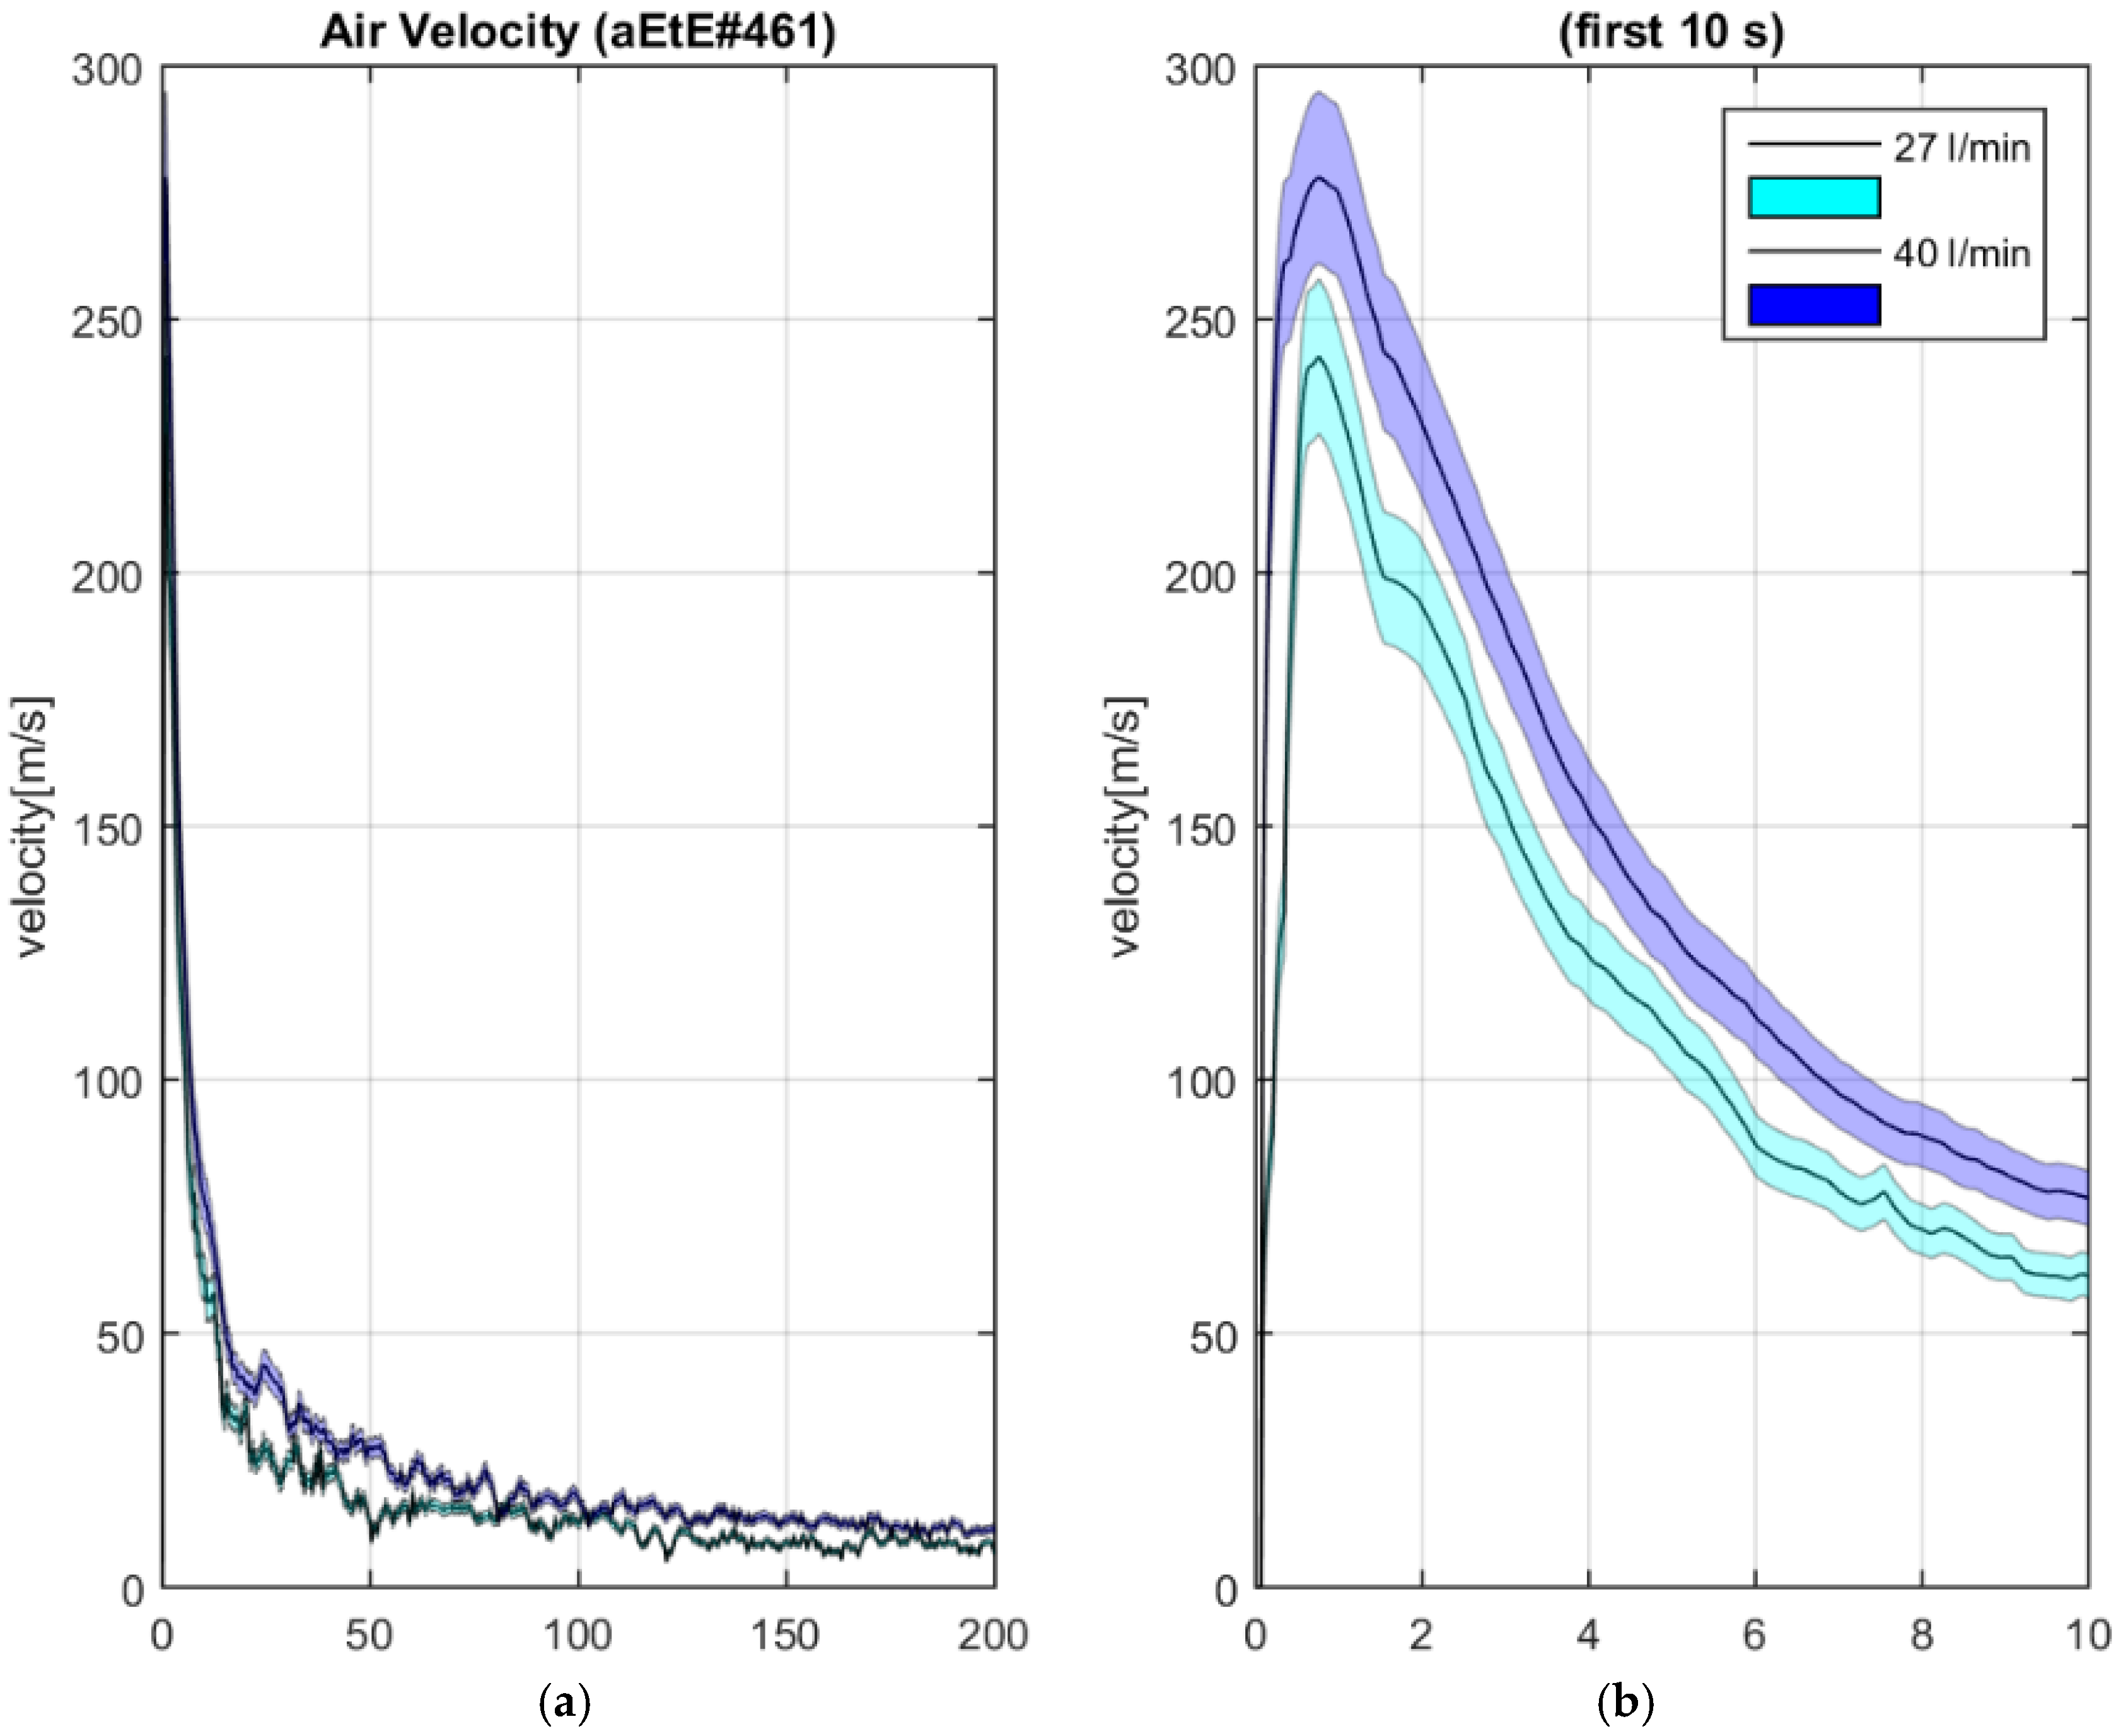
4.2. Experiments from Valve C and D (LOCA Accidents Reproduction)

Figure 7, Figure 8 and Figure 9 shown the variations of internal pressure, temperature and flow rate during the accident replication (with the calculated error bar).
The results of pressure variations, flow rate variations and temperature variation obtained for vale D are comparable to those obtained for valve C.
For the three different conditions (8 L/min, 27 L/min and 40 L/min) the first diagram shows the internal pressure trend of the chamber from the initial pressure of 200 Pa to atmospheric pressure. The blue line is the value detected by the measuring instruments (Edward or Pirani). The red line represents the minimum error value, while the green line is the maximum error value. The internal pressure has a linear trend and reaches the fixed boundary conditions in about 1200 s for flow rate of 8 L/min, 400 s for flow rate of 27 L/min and 250 for flow rate of 40 L/min. It is very interesting see how the slop of the pressure diagram increase with the increasing of the flow rate from 8 L/min to 27 L/min with a percentage of almost 100% and from 27 L/min to 40 L/min with a percentage of almost 60%. It means that it is not possible to go over the 1000 Pa/s as accident simulation with this facility because the maximum flow rate achievable is 100 L/min. (see Figure 10).
In the second graphic the mean temperature, evaluated by thermocouples, is shown. In the same way, the blue line is the value detected by the measuring instruments, the red line represents the minimum error value, while the green line is the maximum error value. It is possible see that the measured error is very low for this measure. For the two graphs, error bars are used with temporal spacing of 80 s for flow rate of 8 L/min, 30 s for flow rate of 27 L/min, 16 s for flow rate of 40 L/min, to make legible graphics.
The third graph shows the flow rate trend, while the last diagram shows the flow rate trend for the first 6 second of the experiment. The flow rate reaches the fixed value around 6 s.
Figure 11 shows the variation of velocity measure by pressure transducer placed at 1 cm from valve C with the air flowed from valve C at 8 L/min (blue diagram), at 27 L/min (red diagram) and 40 L/min (red diagram) with the related error reference tube.
Figure 12 shows the variation of velocity measure by pressure transducer placed at 1 cm from valve D with the air flowed from valve D at 8 L/min (blue diagram), at 27 L/min (red diagram) and 40 L/min (red diagram) with the related error reference tube.
“The velocities are evaluated through the transducer #461 [135]. The trend has a peak for each velocity in the first s, that varies according to the flow rate. It stabilizes in the first 50 s and then follows an asymptotic behavior that tends to zero.“
It is clear from this results that the most important experimental evidence is condensed in the first 5–6 s from the beginning of the accidents (that is the required quantity of time to get mobilized the 90% of the dust [136,137,138,139,140,141]).

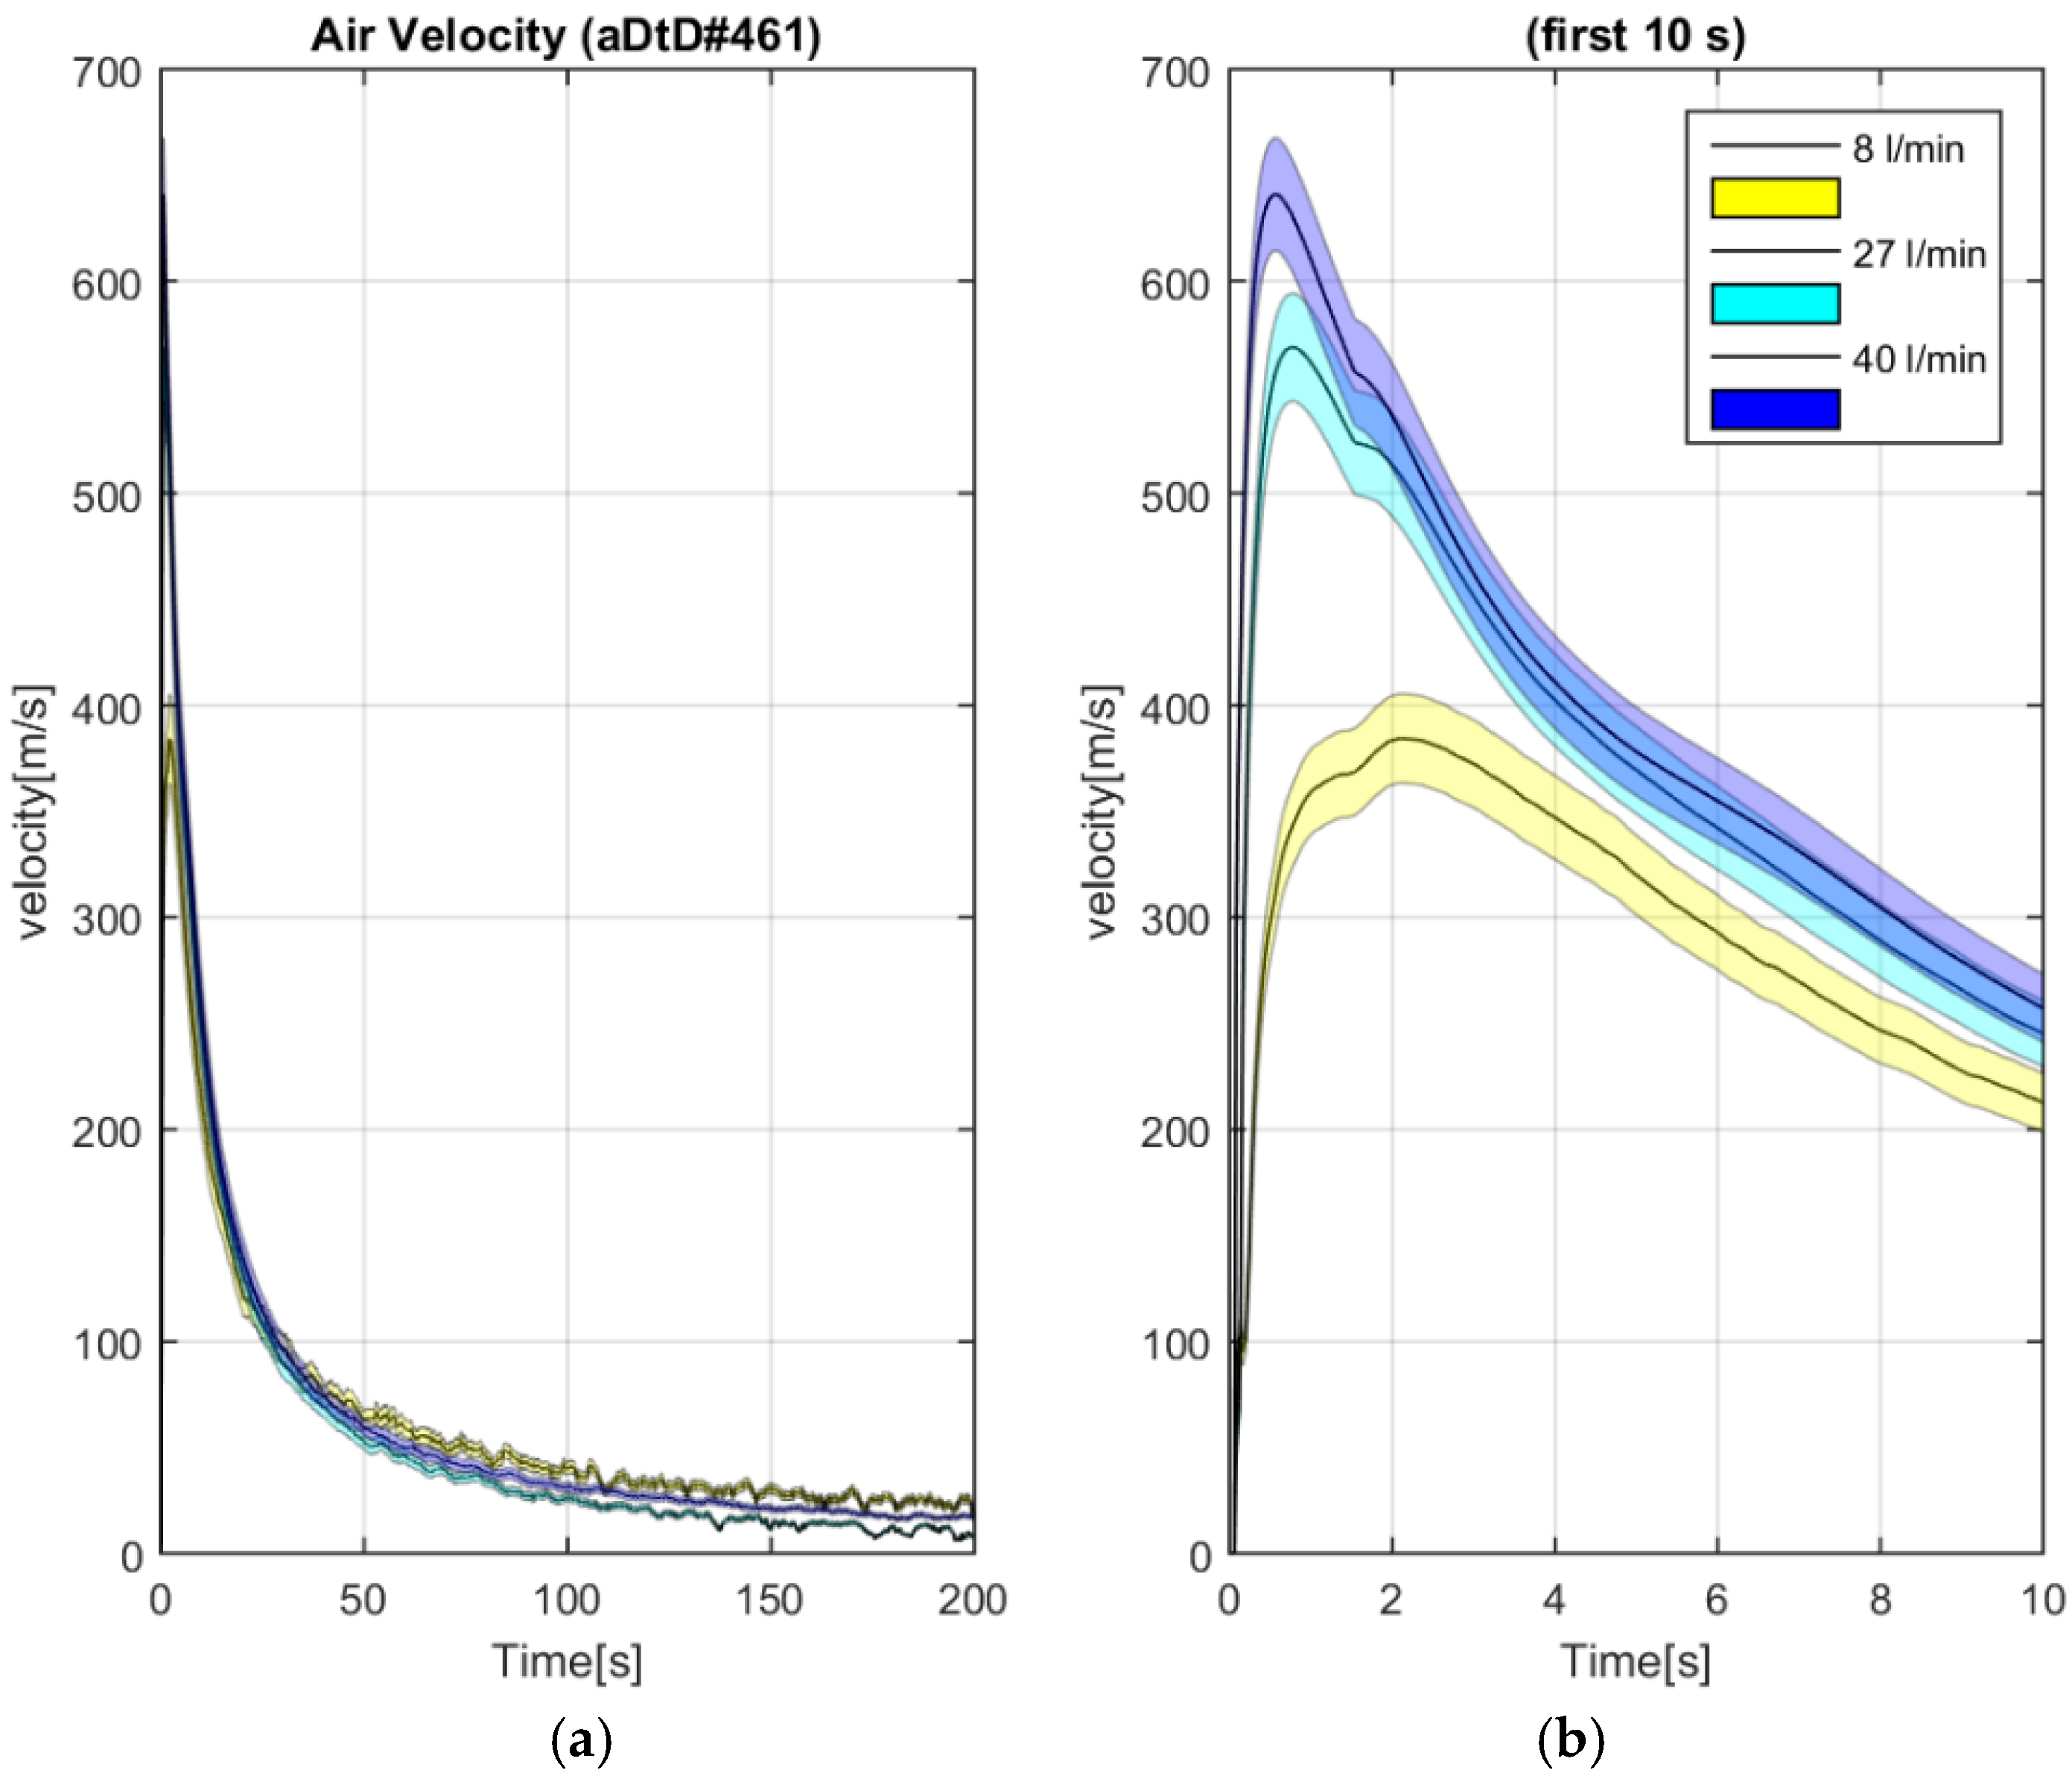
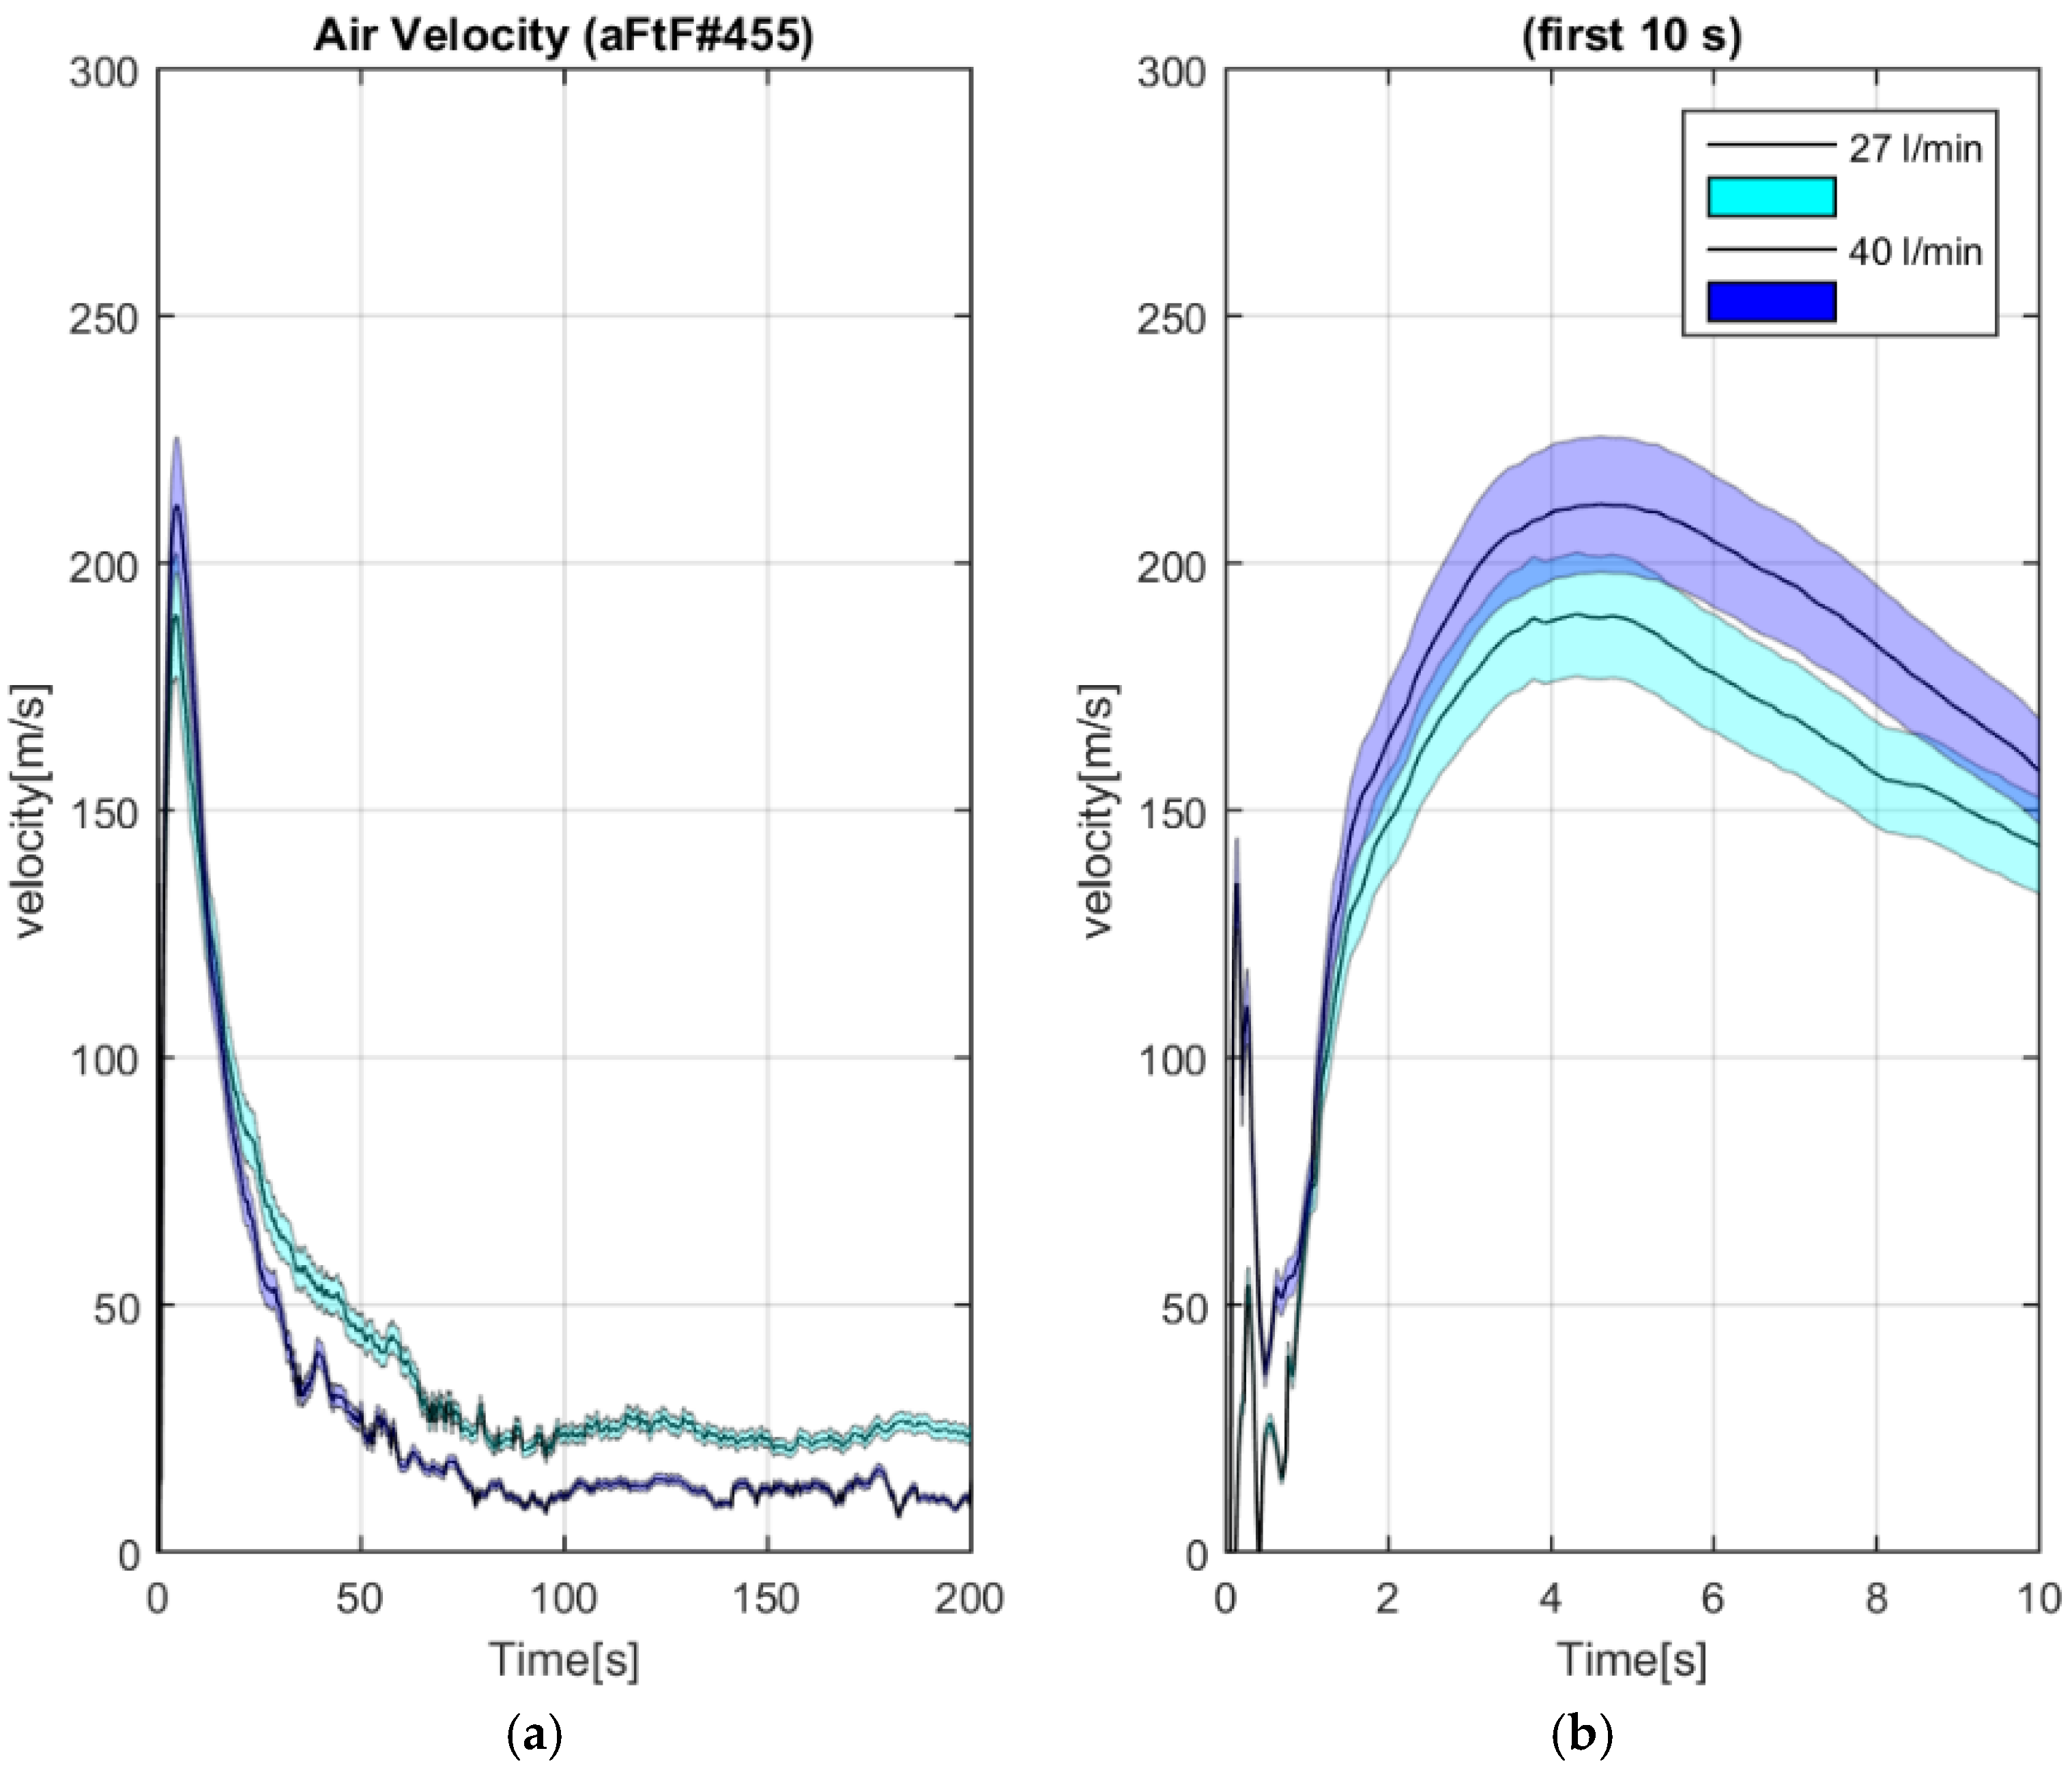
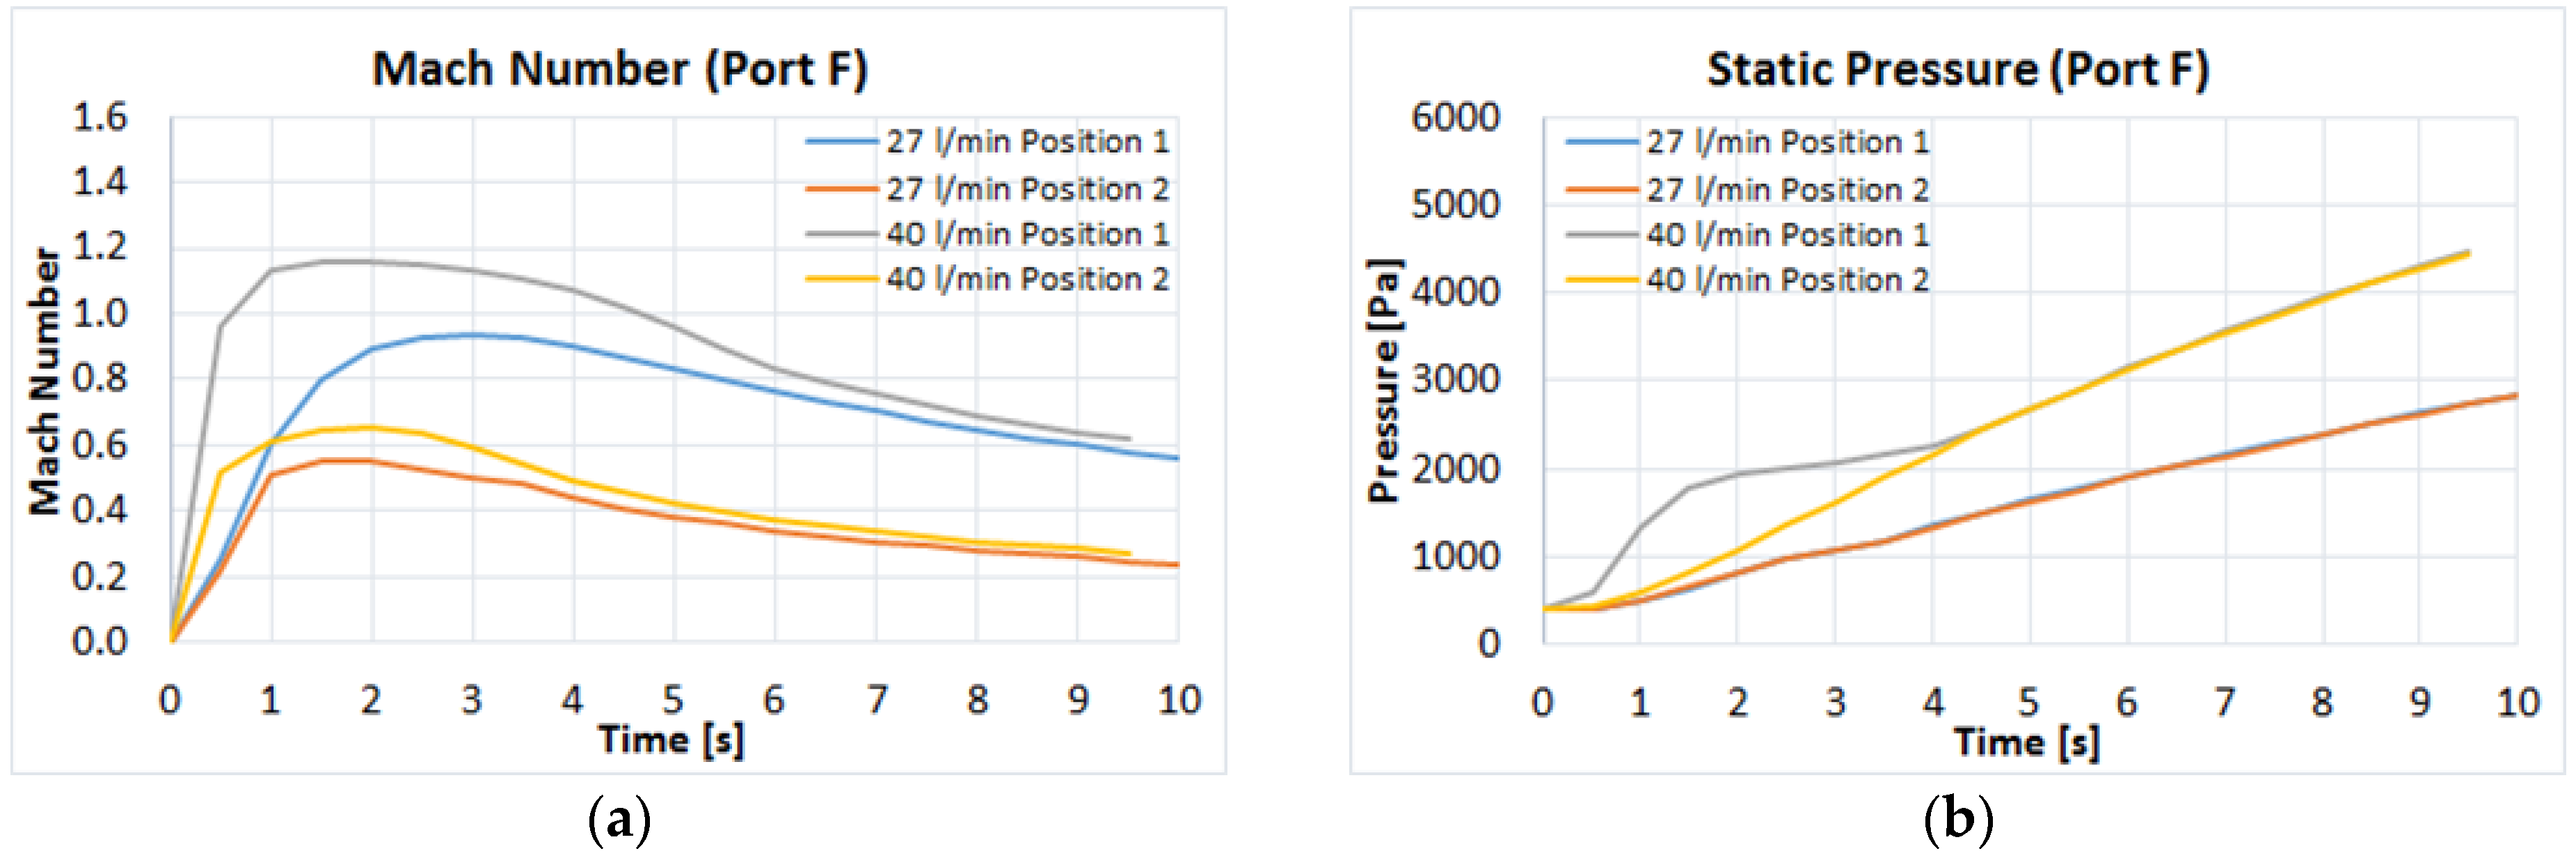
Experiments from Valve E and F (LOVA Accidents Reproduction)

Figure 13 and Figure 14 shown the variations of internal pressure, temperature and flow rate during the accident replication (with the calculated error bar). The experiments have been conducted only at 27 L/min and 40 L/min to reproduce the worst condition (300 Pa/s and 500 Pa/s).
The results of pressure variations, flow rate variations and temperature variation obtained for vale F are comparable to those obtained for valve E.
Figure 14 shows velocity with initially growing trend. The peak value is about 200 m/s for a flow rate of 40 L/min and about 180 m/s for a flow rate of 27 L/min, achieved around 5 s of the experiment. Then velocity decreased.
Figure 15 shows the variation of velocity measure by pressure transducer placed at 24,5 cm from valve E with the air flowed from valve E at 27 L/min (red diagram) and 40 L/min (blue diagram) with the related error reference tube.
The graphs in Figure 13 and Figure 14 show the internal pressure (Pa), the mean temperature (K) (calculated as arithmetic mean of the temperatures), the flow rate and the flow rate during first 6 s. Graphs include error bars calculated according to error analysis described in ‘‘Error Analysis’’ section. The results showed an increasing monotone linear trends of static pressure, from the initial value fixed at 200 Pa up to the ambient pressure fixed at about 95000 Pa; average temperature trend measured by the thermocouples with almost constant error range of about 2 K; trend of the constant flow rate after approximately 6 s from the start of the experiment. The trend in the first s is parabolic and represents that the flow meter takes about 6 s to open fully.
Figure 15 shows velocity with initially growing trends. The peak value is about 270 m/s for a flow rate of 40 L/min and about 200 m/s for a flow rate of 27 L/min, achieved around 2 s of the experiment. After the peak velocity decreased up to asymptotically to zero for different times depending on the flow rate. The graphics have been reported for 10 s because the first moments are crucial to study the phenomenon of dust mobilization.
Figure 14 shows the variation of velocity measure by pressure transducer placed at 10 cm from valve F with the air flowed from valve F at 27 L/min (red diagram) and 40 L/min (blue diagram) with the related error reference tube.
Figure 16 shows velocity with an initially growing trend. The peak value is about 200 m/s for a flow rate of 40 L/min and about 180 m/s for a flow rate of 27 L/min, achieved around 5 s of the experiment. Then velocity decreased up to asymptotically to zero for different times depending on the flow rate. The graphics have been reported for 10 s because the first moments are crucial to study the phenomenon of dust mobilization.

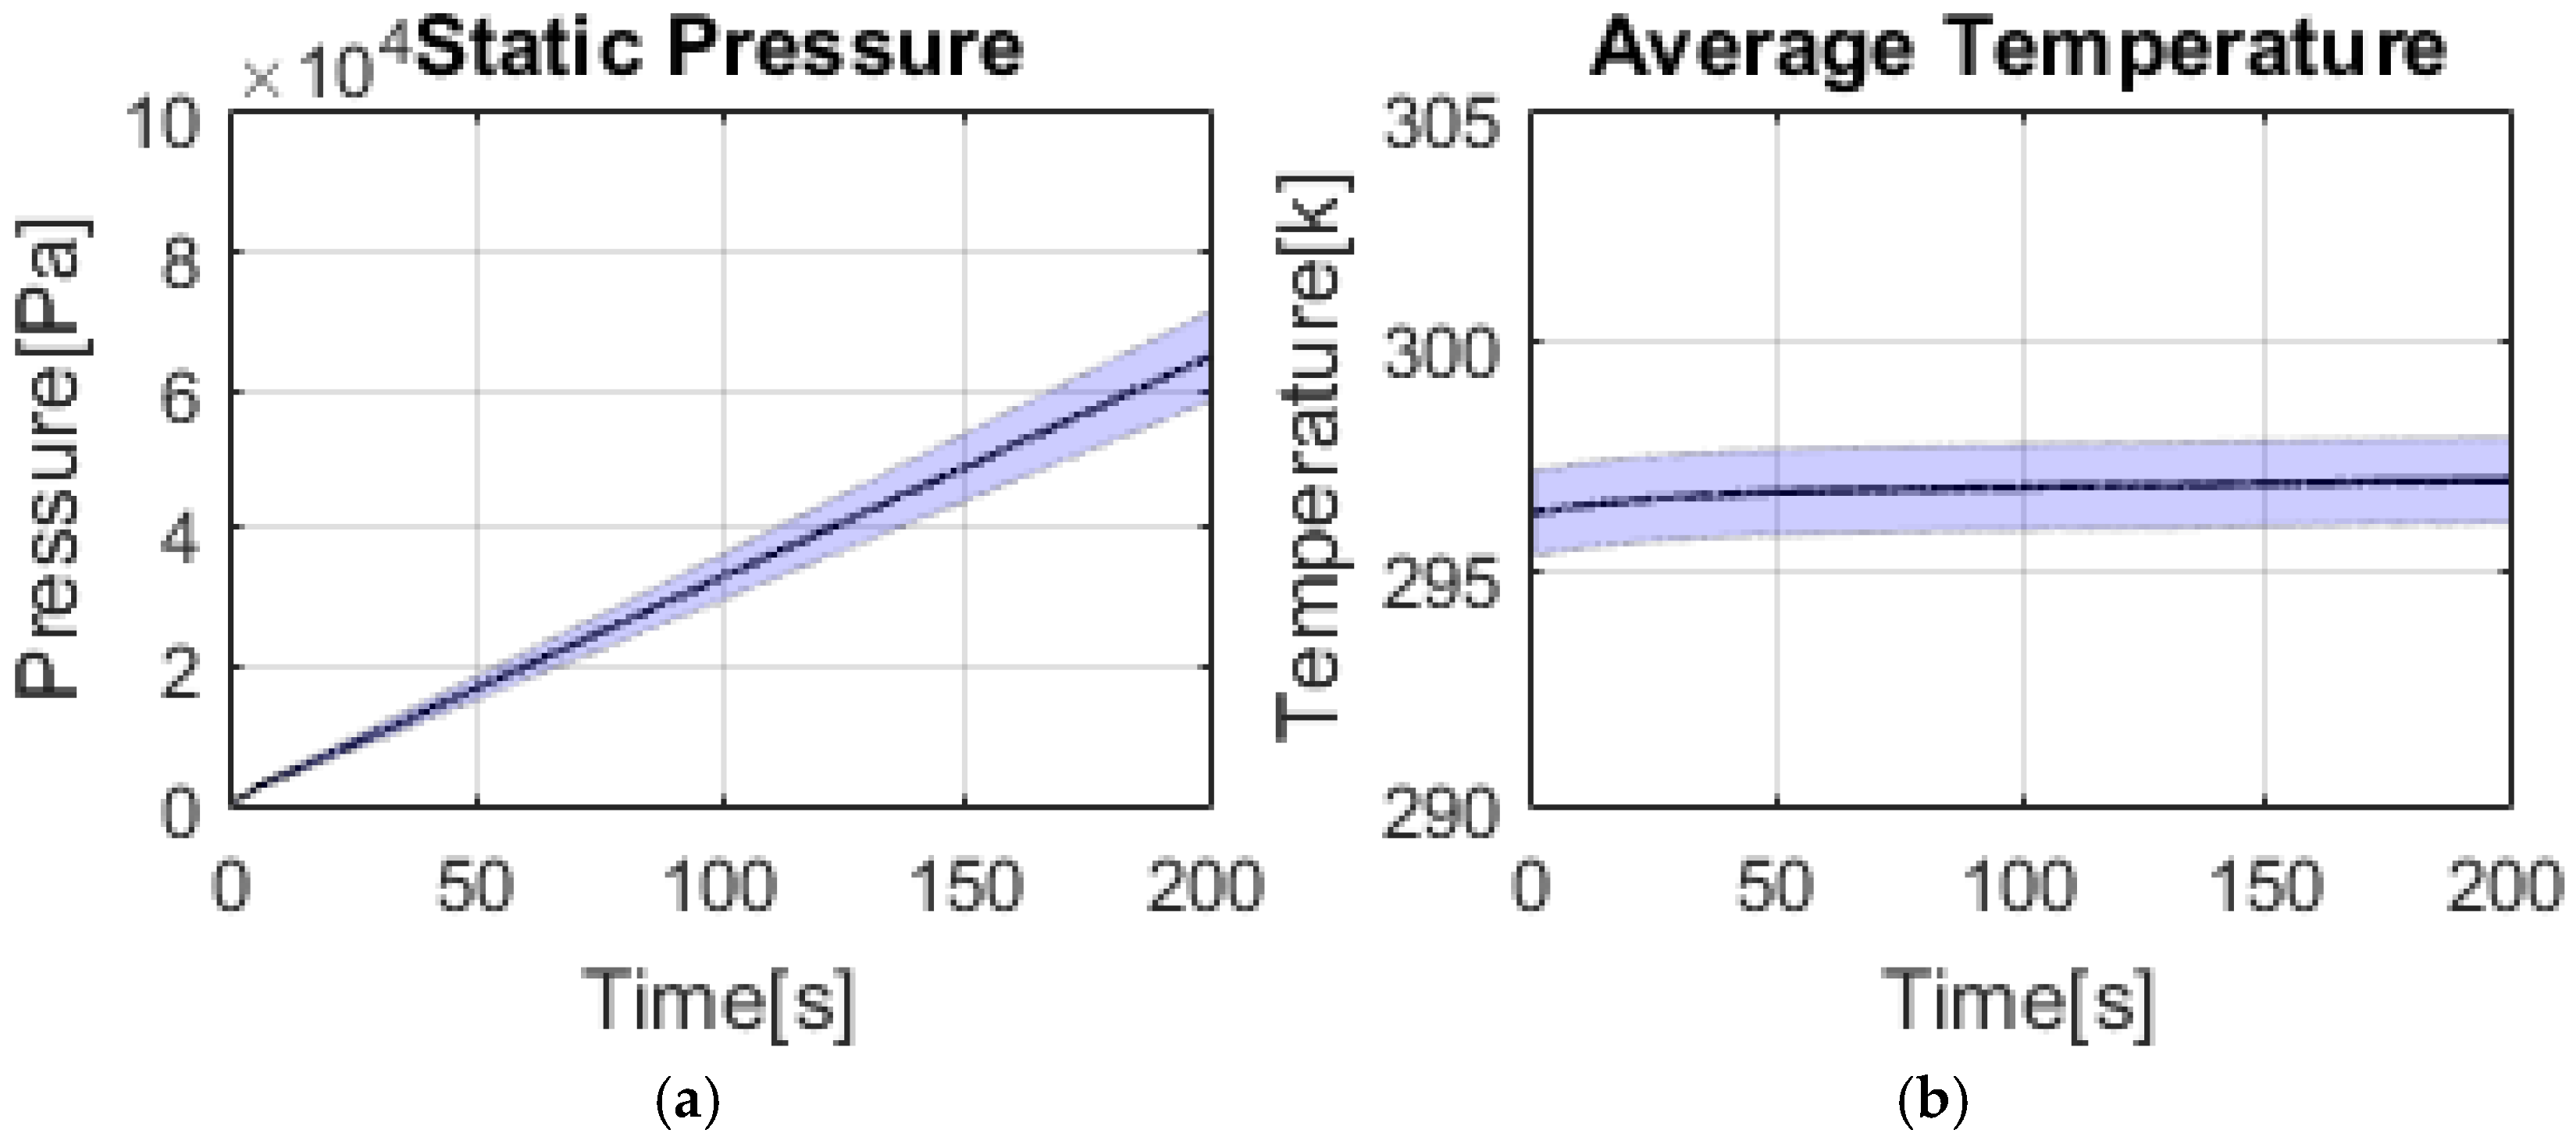
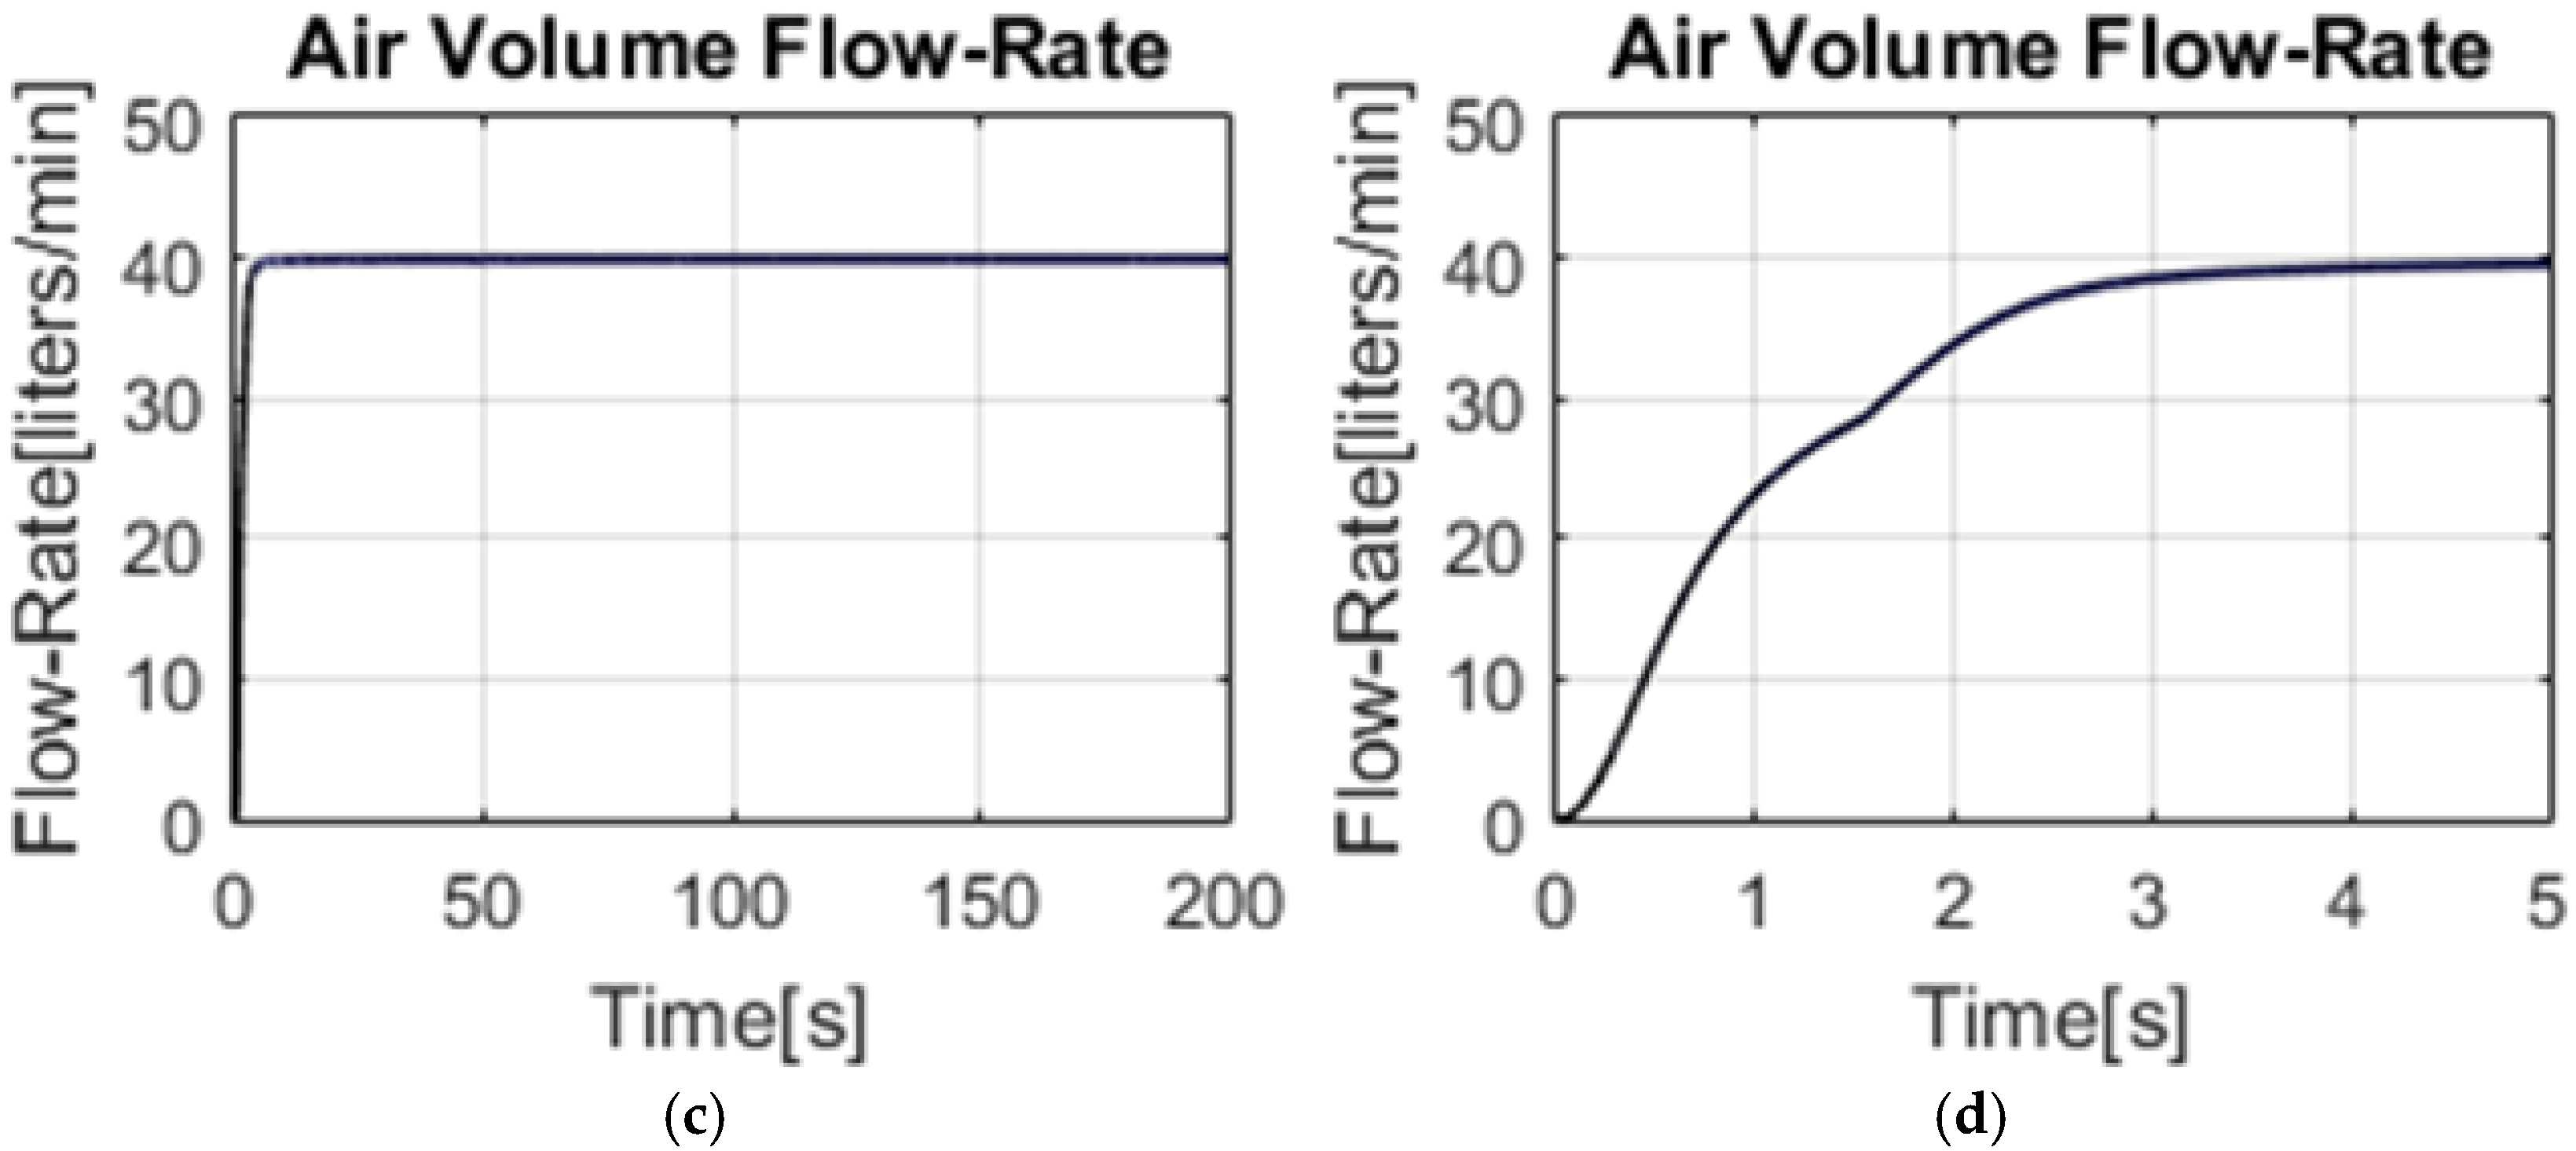
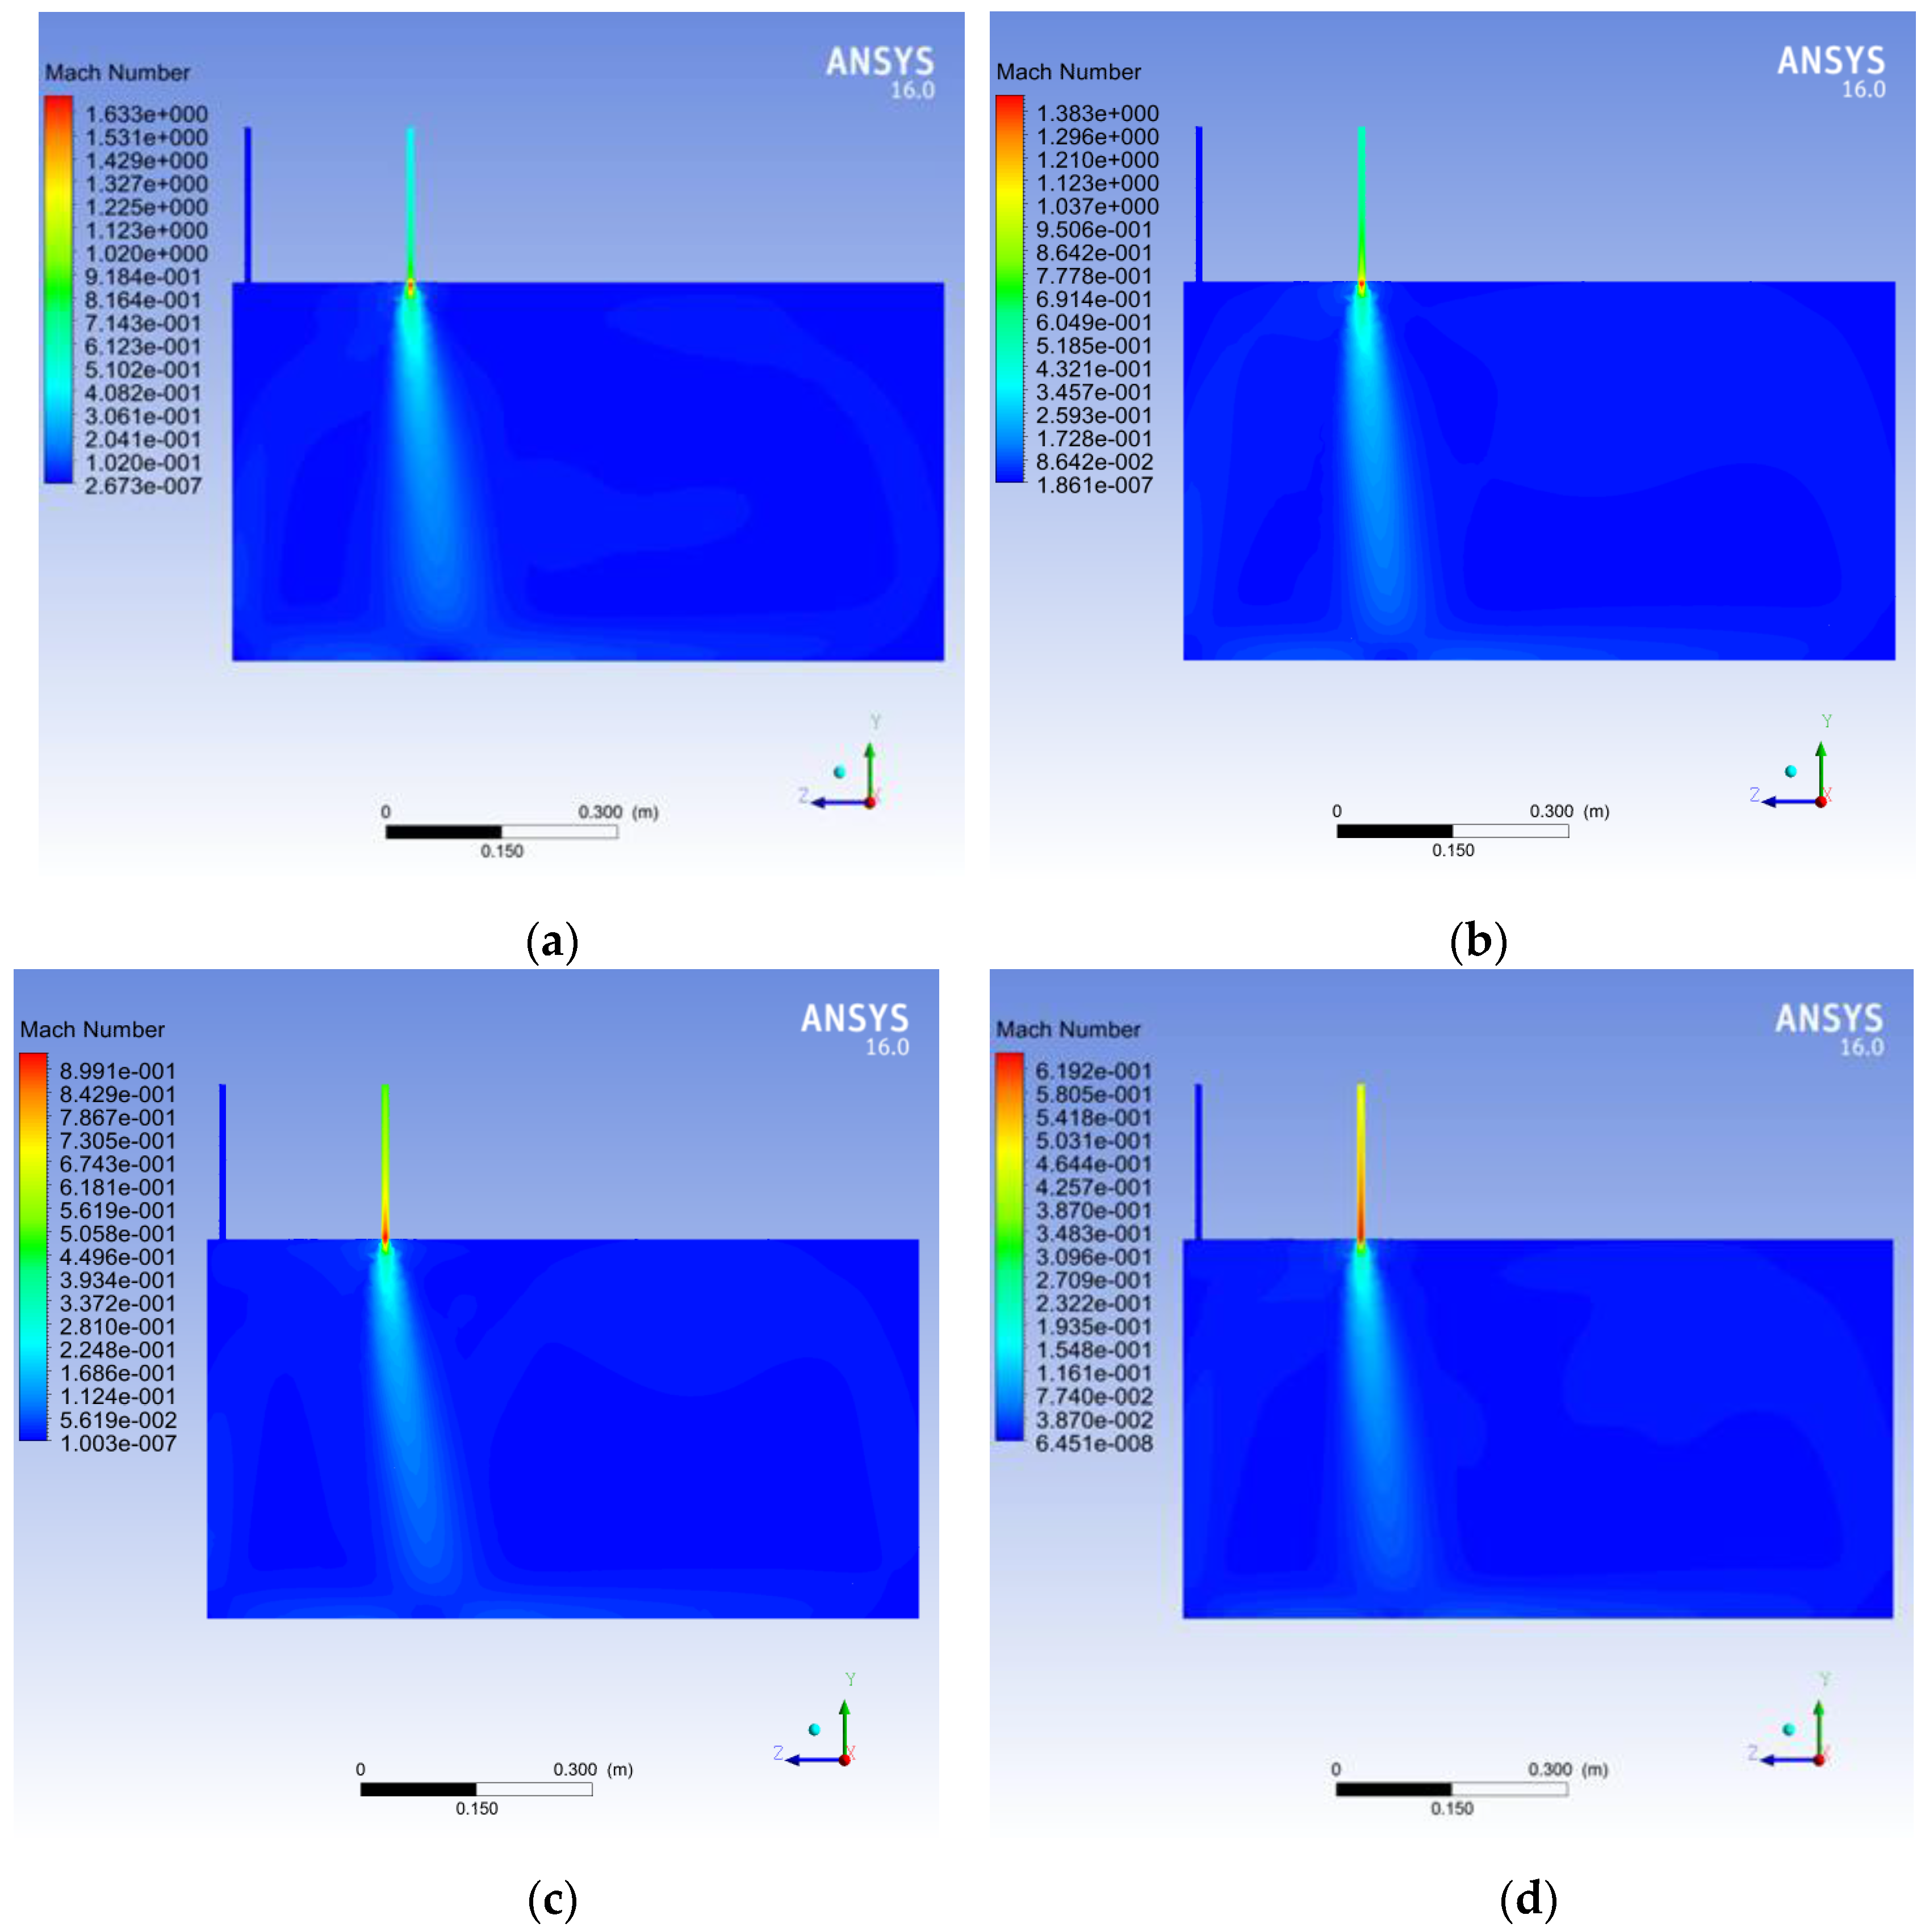
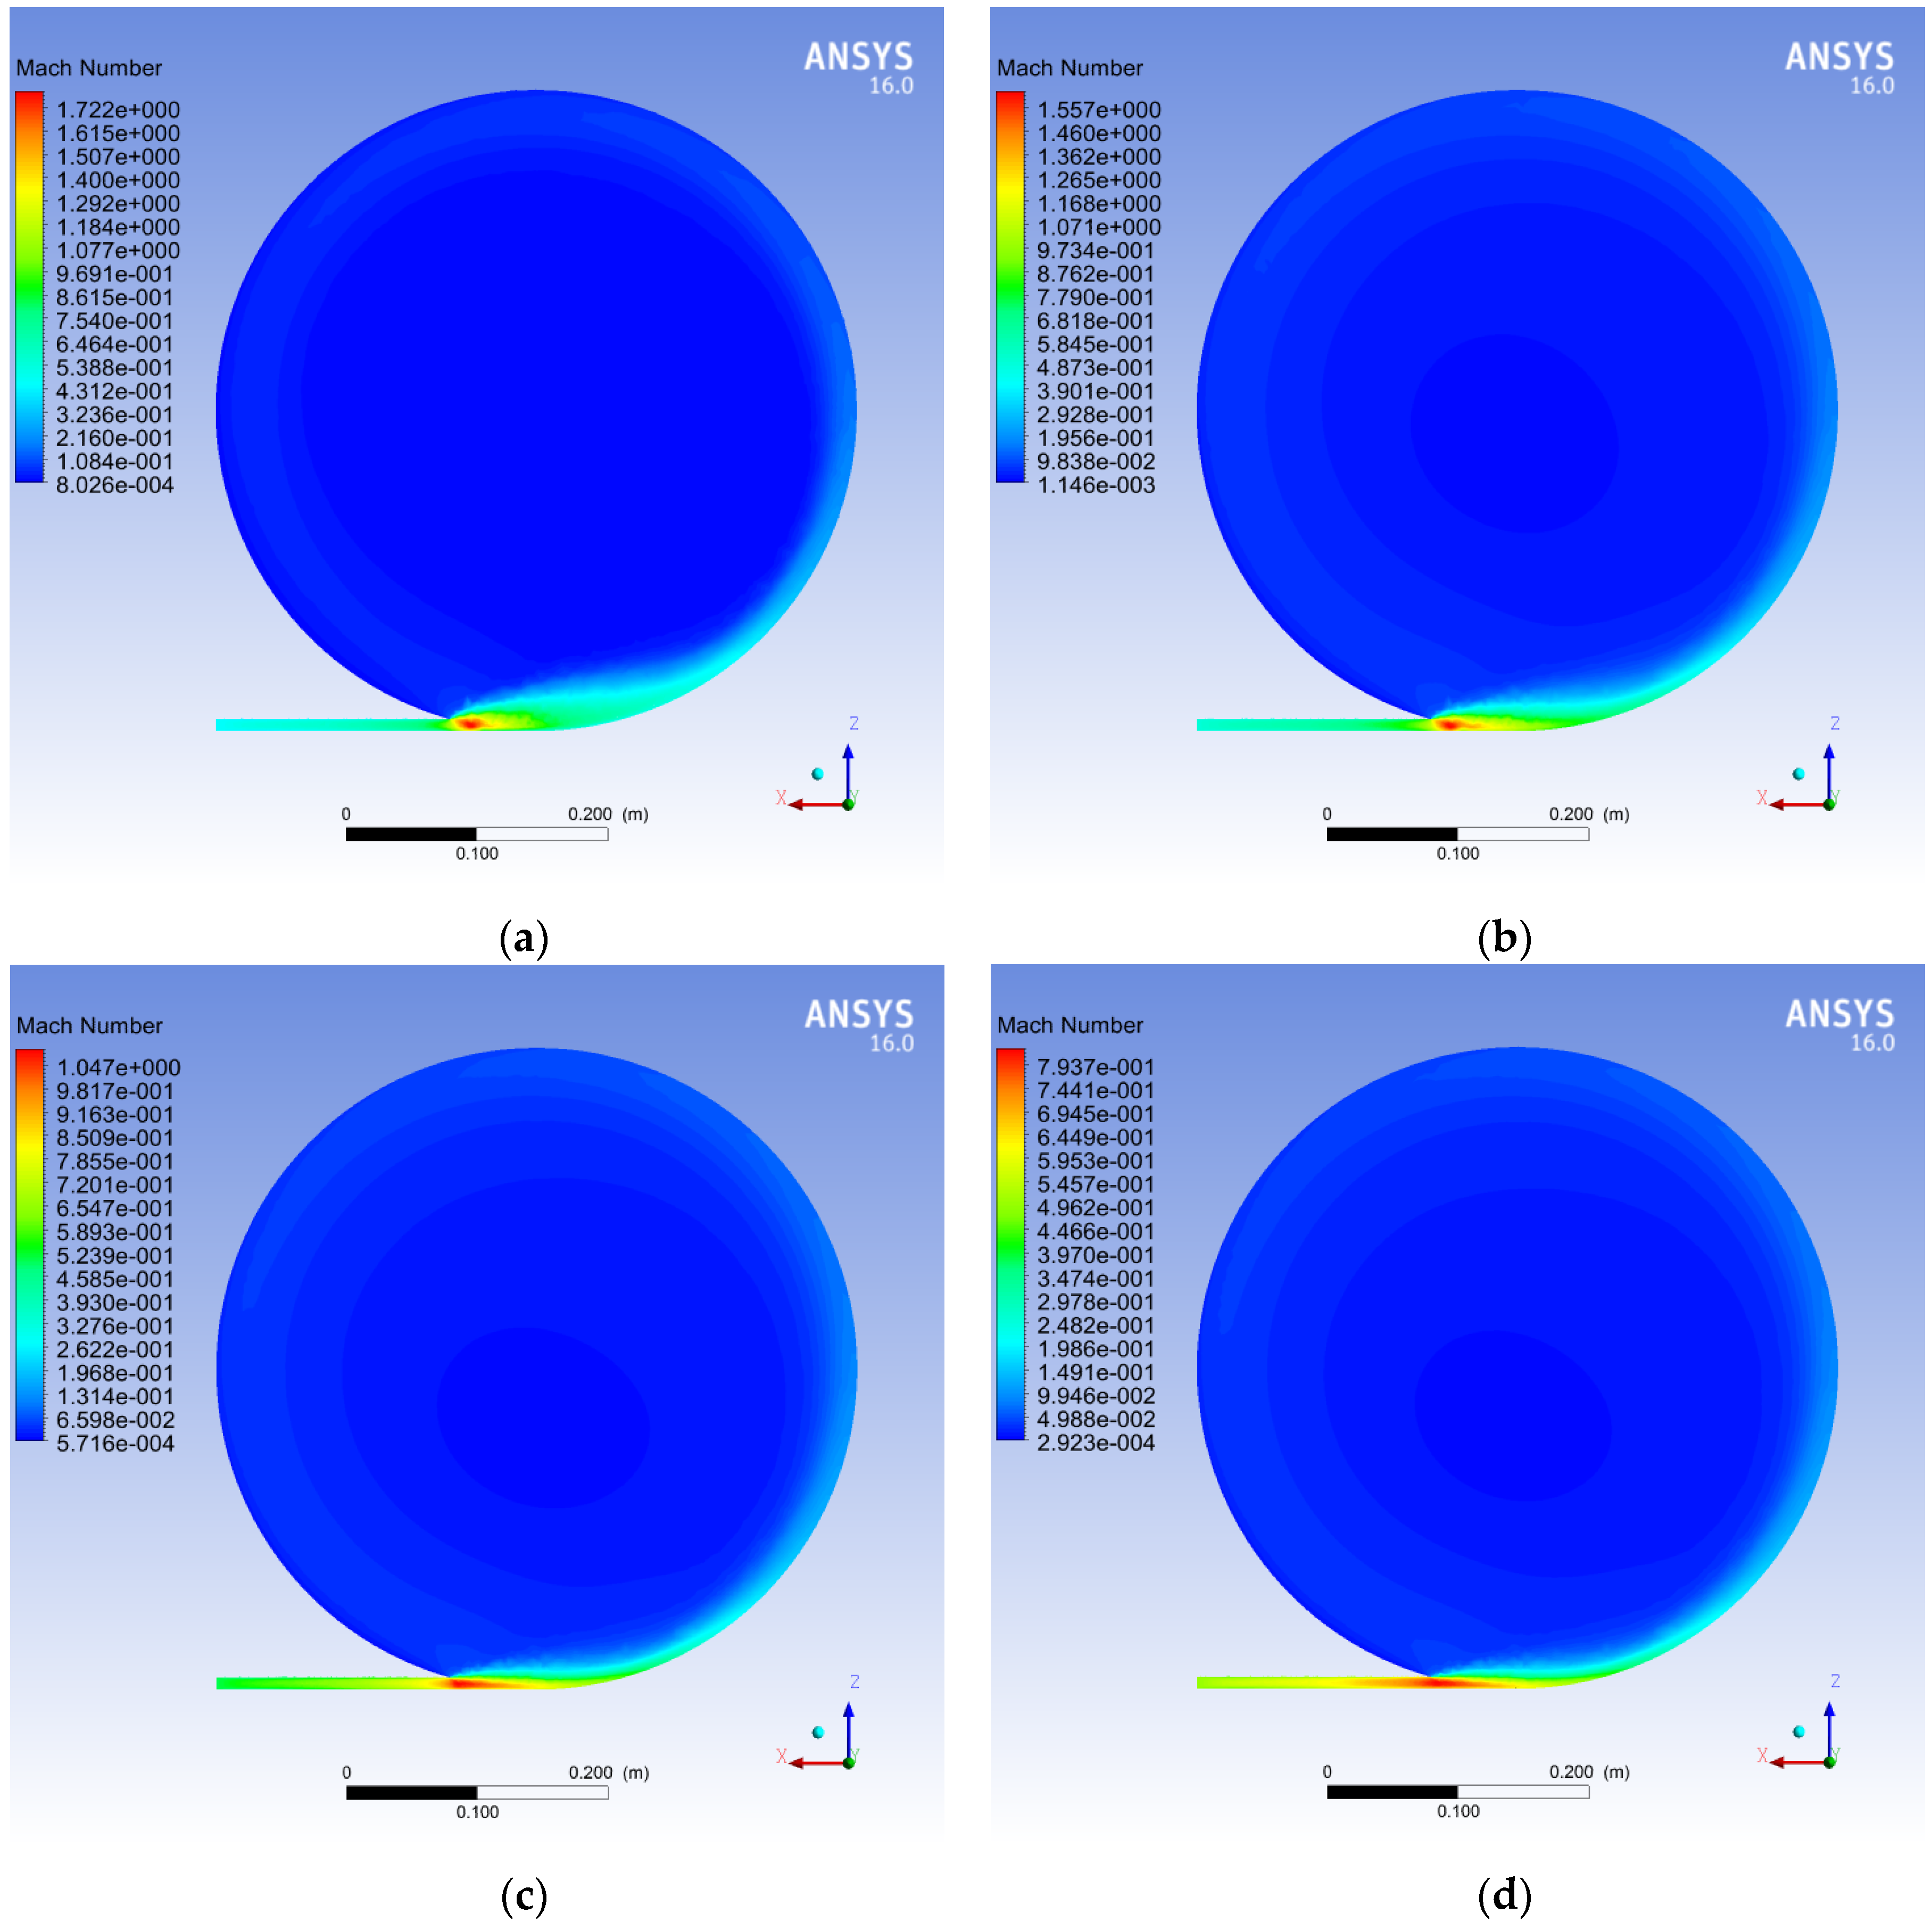
4.3. Numerical Simulations

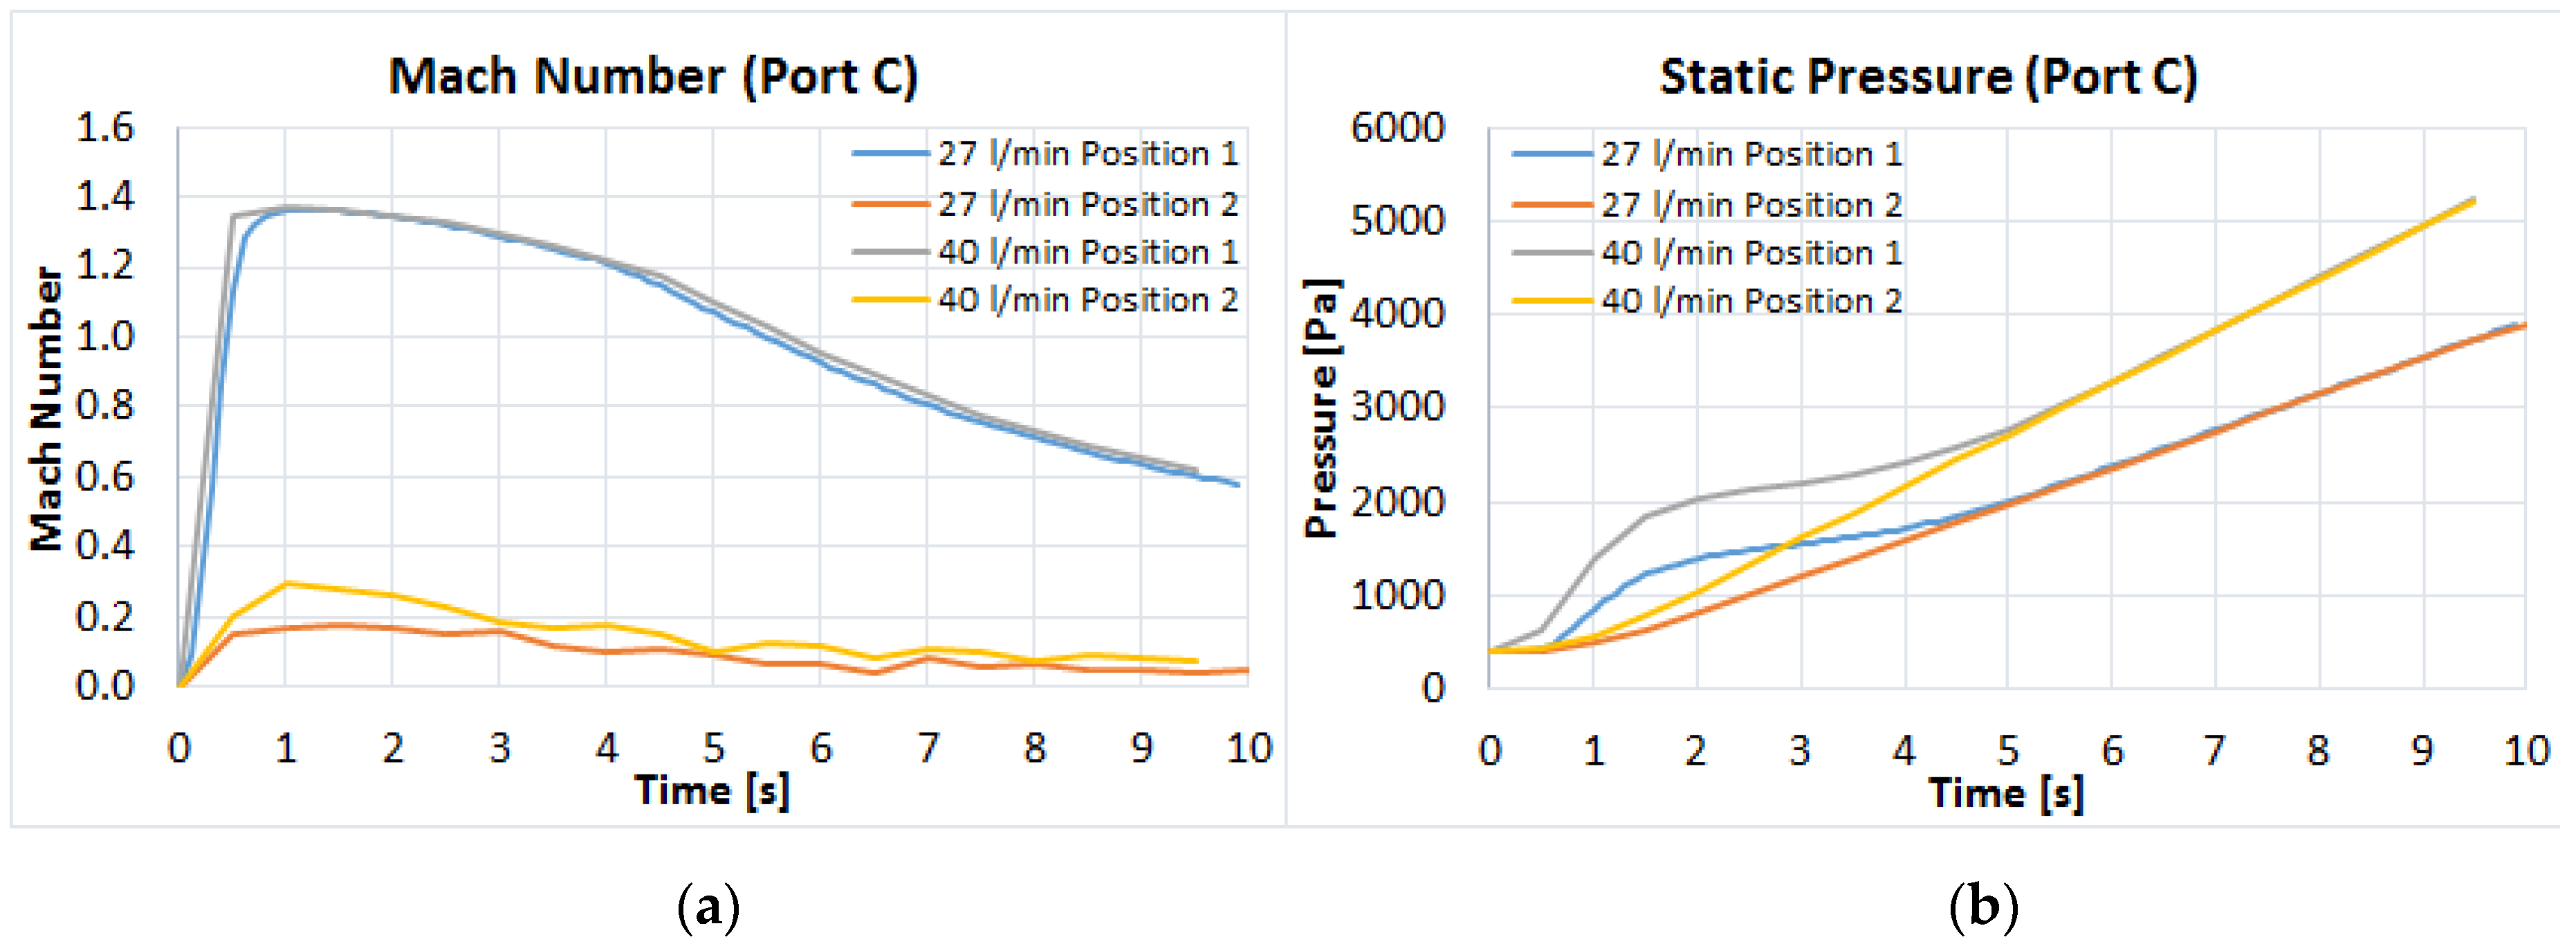
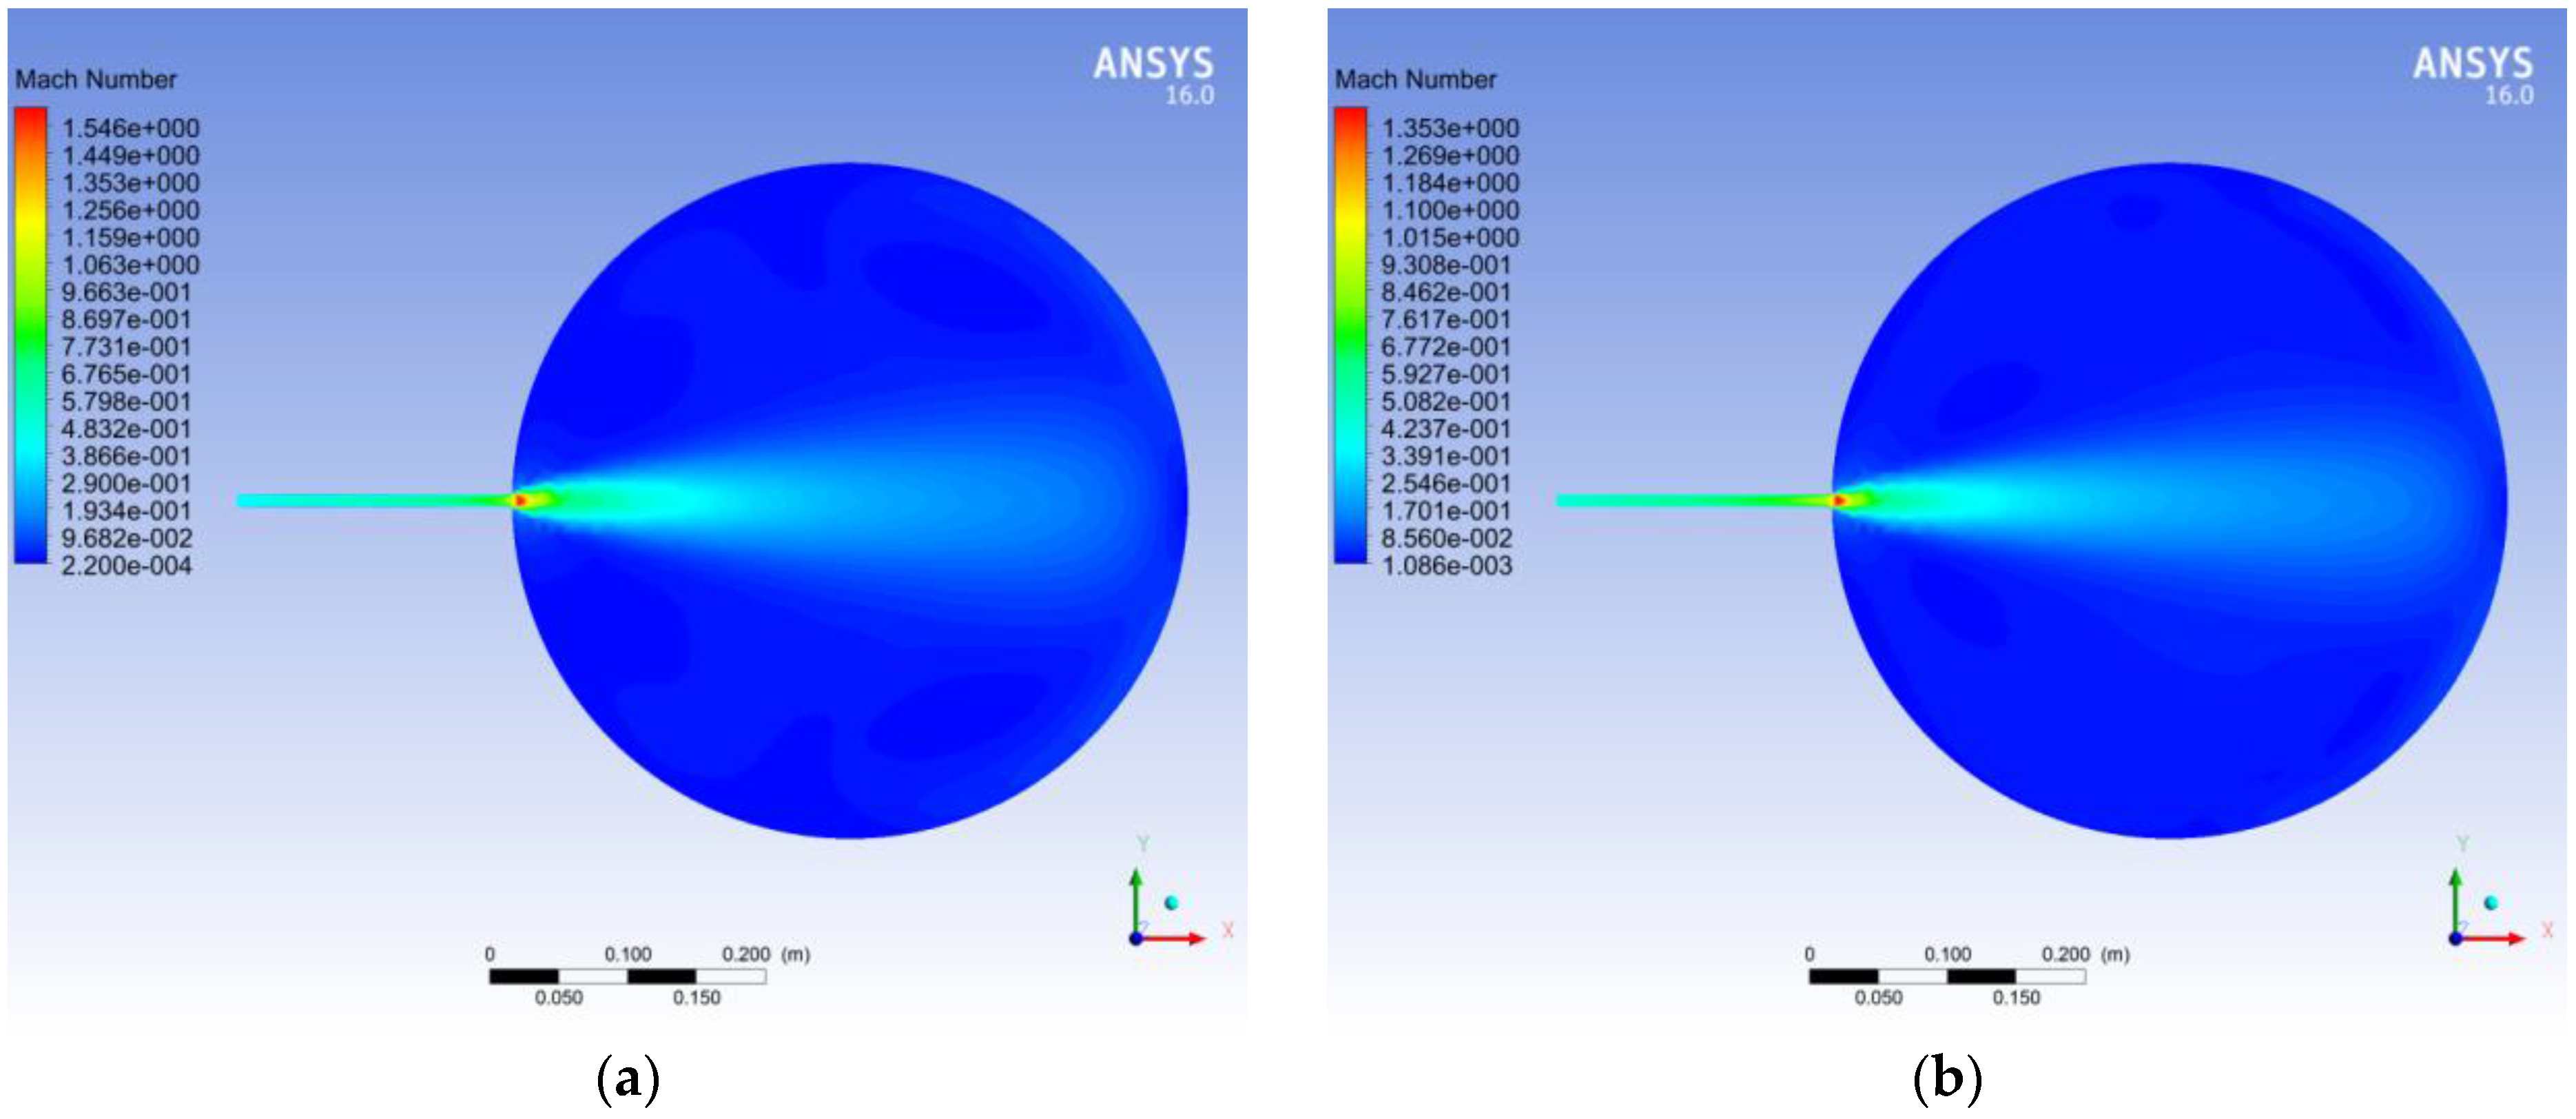
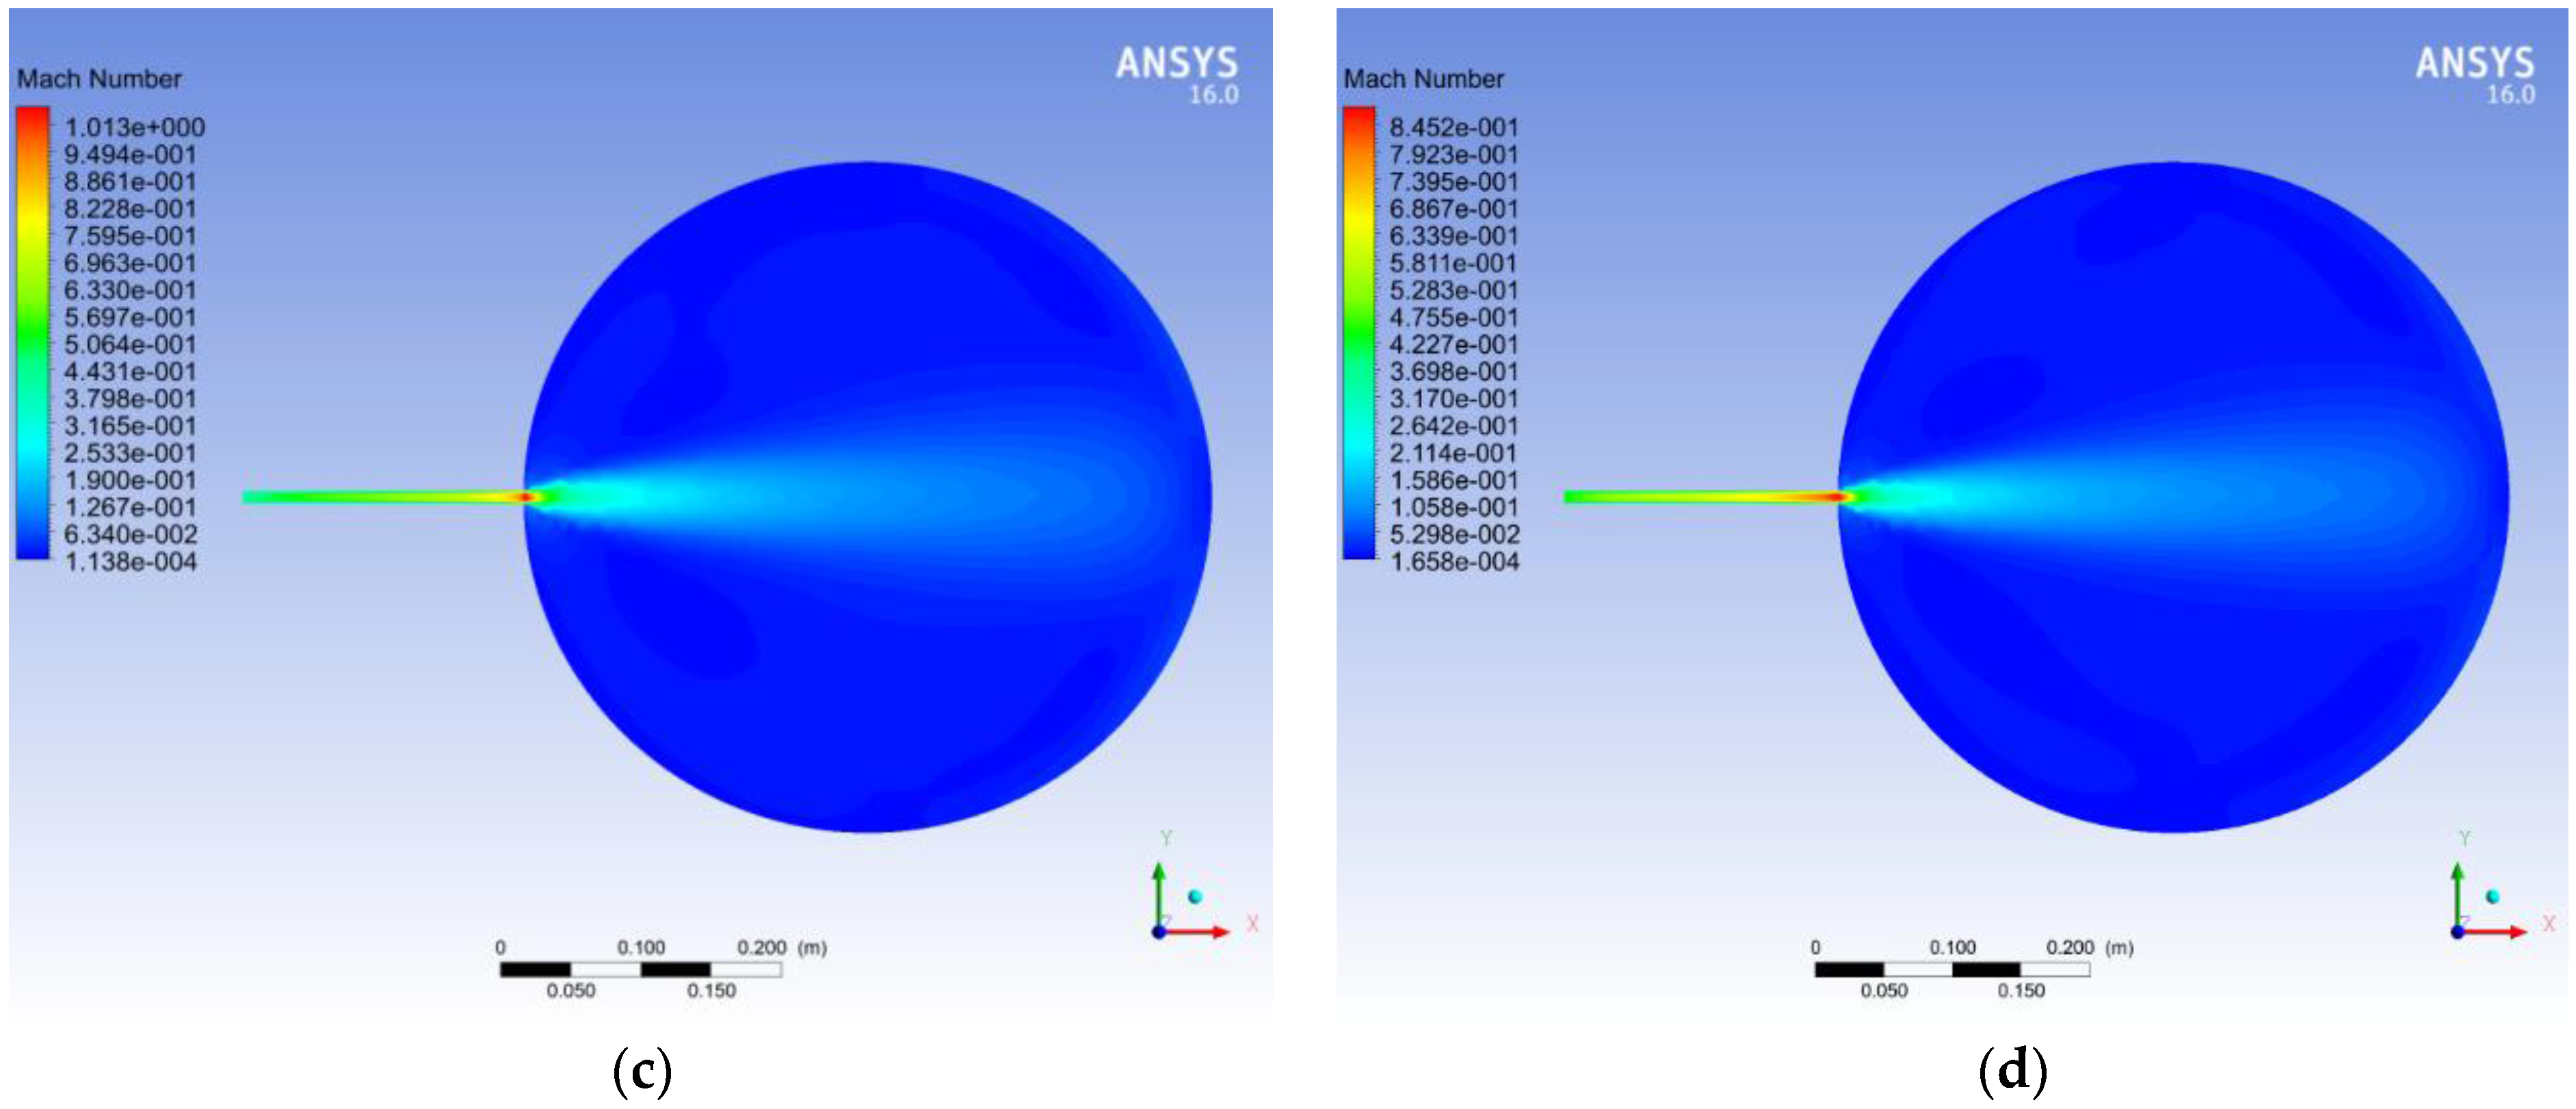
4.3.1. Numerical Simulation from Valve C (LOCA Accidents Reproduction)

The experimental results have been used to carry out the numerical simulations through the software CFX ANSYS 16.0. The flow produced by the entering jet of air leads, as it will be shown, to the formation of several vortices in all configurations. The flow is highly recirculating and the classical k ε model has proved not to be fit to this kind of problem. A more accurate model, which takes into account flow separation and recirculation is the SST k ω . Furthermore, as initially the air in the vacuum chamber has a low pressure and therefore a low density, it is expected that in many zones of the vessel where the velocity is low the Reynolds number is low and so the flow is laminar, while is turbulent in elsewhere, so a transitional model, the γ θ one, has been added to the turbulence model in order to catch the laminar-to-turbulent transition during the opening transient of the valve.
The analysis has been focused on the study the Mach number. The Mach number (Ma) is a dimensionless group that is defined as the ratio between the speed of an object in motion in a fluid and the speed of sound in the considered fluid. It allows to determine how important the compressibility effects of the fluid under examination. “The motion around the bodies can be classified in six different conditions which match to different fluid dynamic behavior.
  • Subsonic incompressible regime: Ma < 0,2–0,3
  • Subsonic regime: Ma < 1
  • Transonic regime: 0,8 < Ma < 1,2
  • Sonic regime: Ma = 1
  • Supersonic regime: Ma > 1
  • Hypersonic regime: Ma > 5” [149]
In Figure 17 (port C, 27 L/min), the patterns of Mach number and density are shown on the symmetry plane of the facility at 1s (Figure 17a), 3s (Figure 17b), 6 s (Figure 17c) and 9 s (Figure 17d) after the beginning of the pressurization transient:
As it can be seen in Figure 17a,b a jet which is always transonic, and even supersonic at some moments, enters in the vacuum vessel. The speed initially increases because the mass flow rate rises, then, as the pressure gets higher, the Mach number drops. The asymmetric position of the inlet port leads to the formation of two counter-rotating vortices whose dimensions are different, as outlined by the density field. The lack of space in the left part of the vacuum chamber makes the jet bend right.
In Figure 18, the graphs of Mach number (a) and pressure (b) are shown for the two mass flow rates in the two probed positions:
In all cases, the Mach number increases initially because of the augmentation of the mass flow rate. Then, as the vessel’s pressure and therefore the air density rise, the speed decreases. It can be seen that there is a difference between the Mach number evolution in the two points: in the second one, there are great oscillations, whereas in the first one these fluctuations are not observed. This is due to the fact that two asymmetric and unstable vortices form and make the jet oscillate, which causes rapid variations in the local jet speed. In the first probing point, as the flow is supersonic for several s, the perturbations are not able to move upstream, whereas in the second point, as the flow is subsonic, the influence of the vortices affects the local Mach number.
Both Mach number and pressure rise during time, at a rate which is greater when the mass flow rate is higher. The pressure rises faster near to the inlet than in the second position, due to the lateral dispersion of the jet.

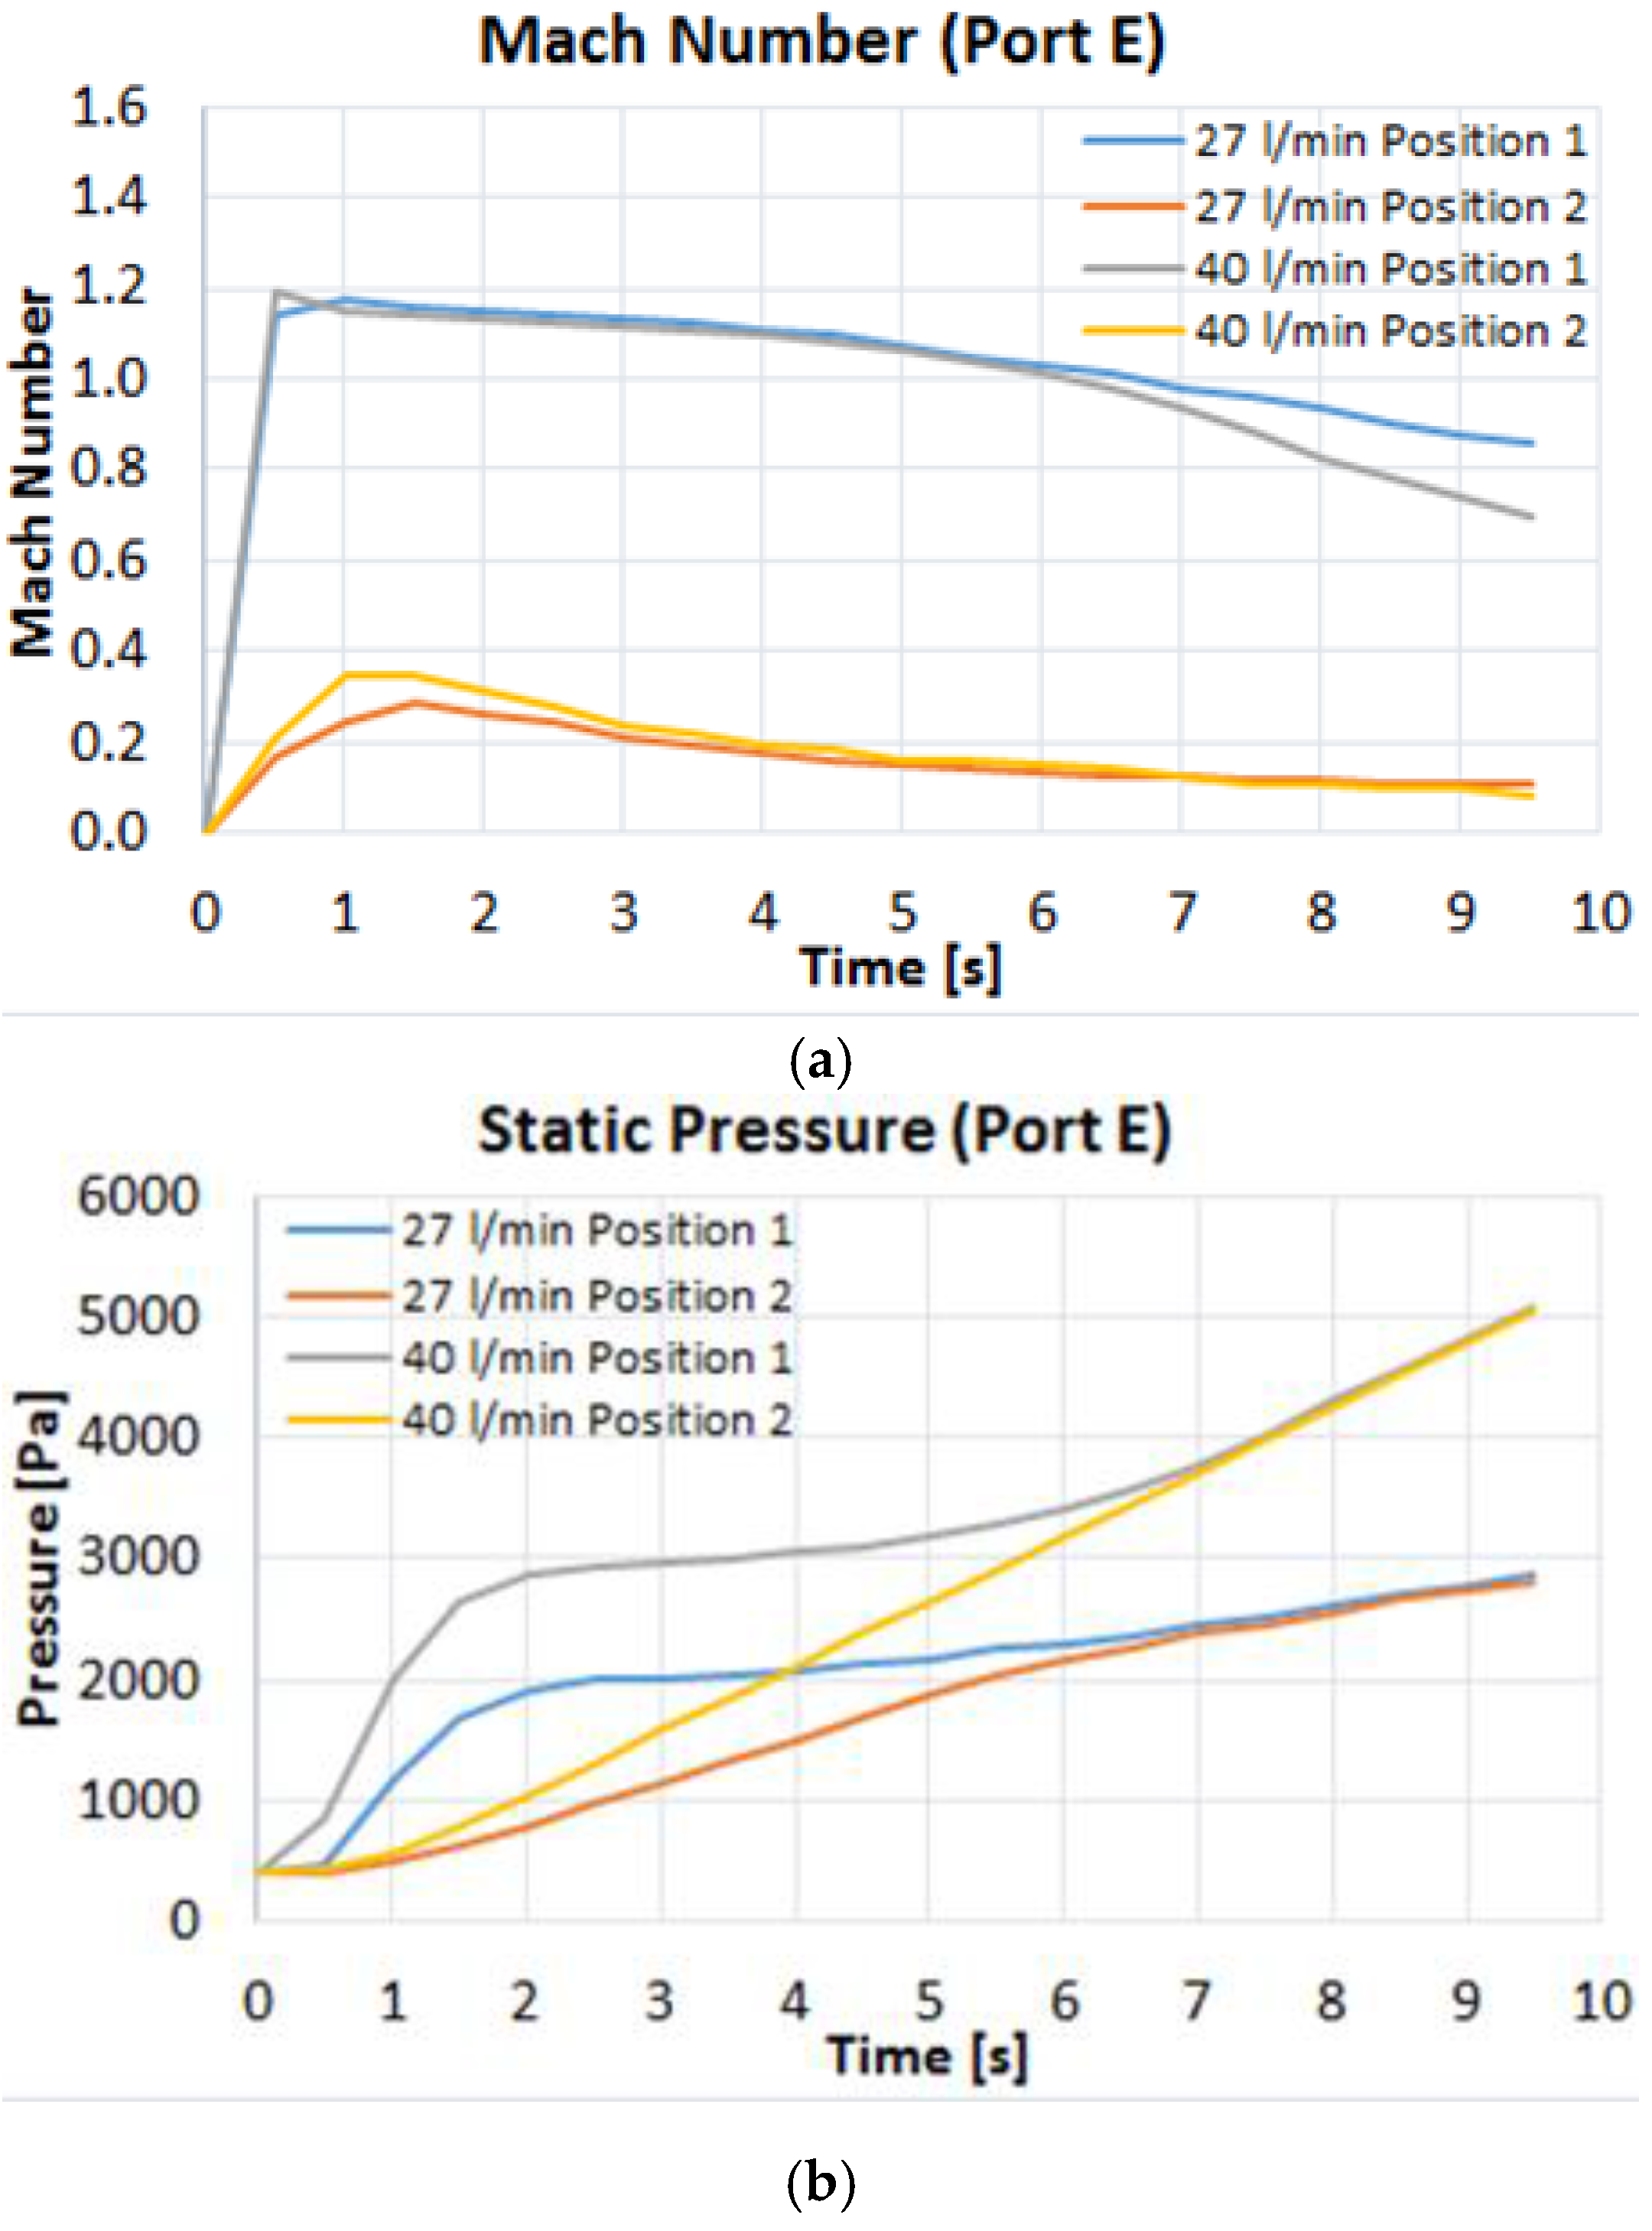
4.3.2. Numerical Simulation from Valve E and F (LOVA Accidents Reproduction)

Figure 19 (port E, 27 L/min) show the Mach number and density fields in the symmetry plane containing the inlet duct at 1s (Figure 19a), 3s (Figure 19b), 6 s (Figure 19c) and 9 s (Figure 19d) after the pressurization transient beginning:
In Figure 20, the Mach number and the pressure evolution during the transient are shown for the two chosen positions:
In Figure 21 (port F, 27 L/min) show the Mach number and density fields in the symmetry plane containing the inlet duct at 1s (Figure 21a), 3s (Figure 21b), 6 s (Figure 21c) and 9 s (Figure 21d) after the pressurisation transient beginning:
Finally, the Mach number and pressure variations with time are shown in Figure 22 for the two probing points:
As shown, the Mach number is lower than for the C and E ports, and there are no fluctuations because there is only one stable vortex. For this port, it can be seen that when the flow exiting from the duct is subsonic (27 L/min), there is no pressure difference between the two probing points, as they are very close. For the greater mass flow rate (40 L/min), the flow just after the duct exit is supersonic and it impacts the curving wall of the vessel. This causes a great loss of pressure, so the pressurization rate is lower in the second probing point than in the first one.

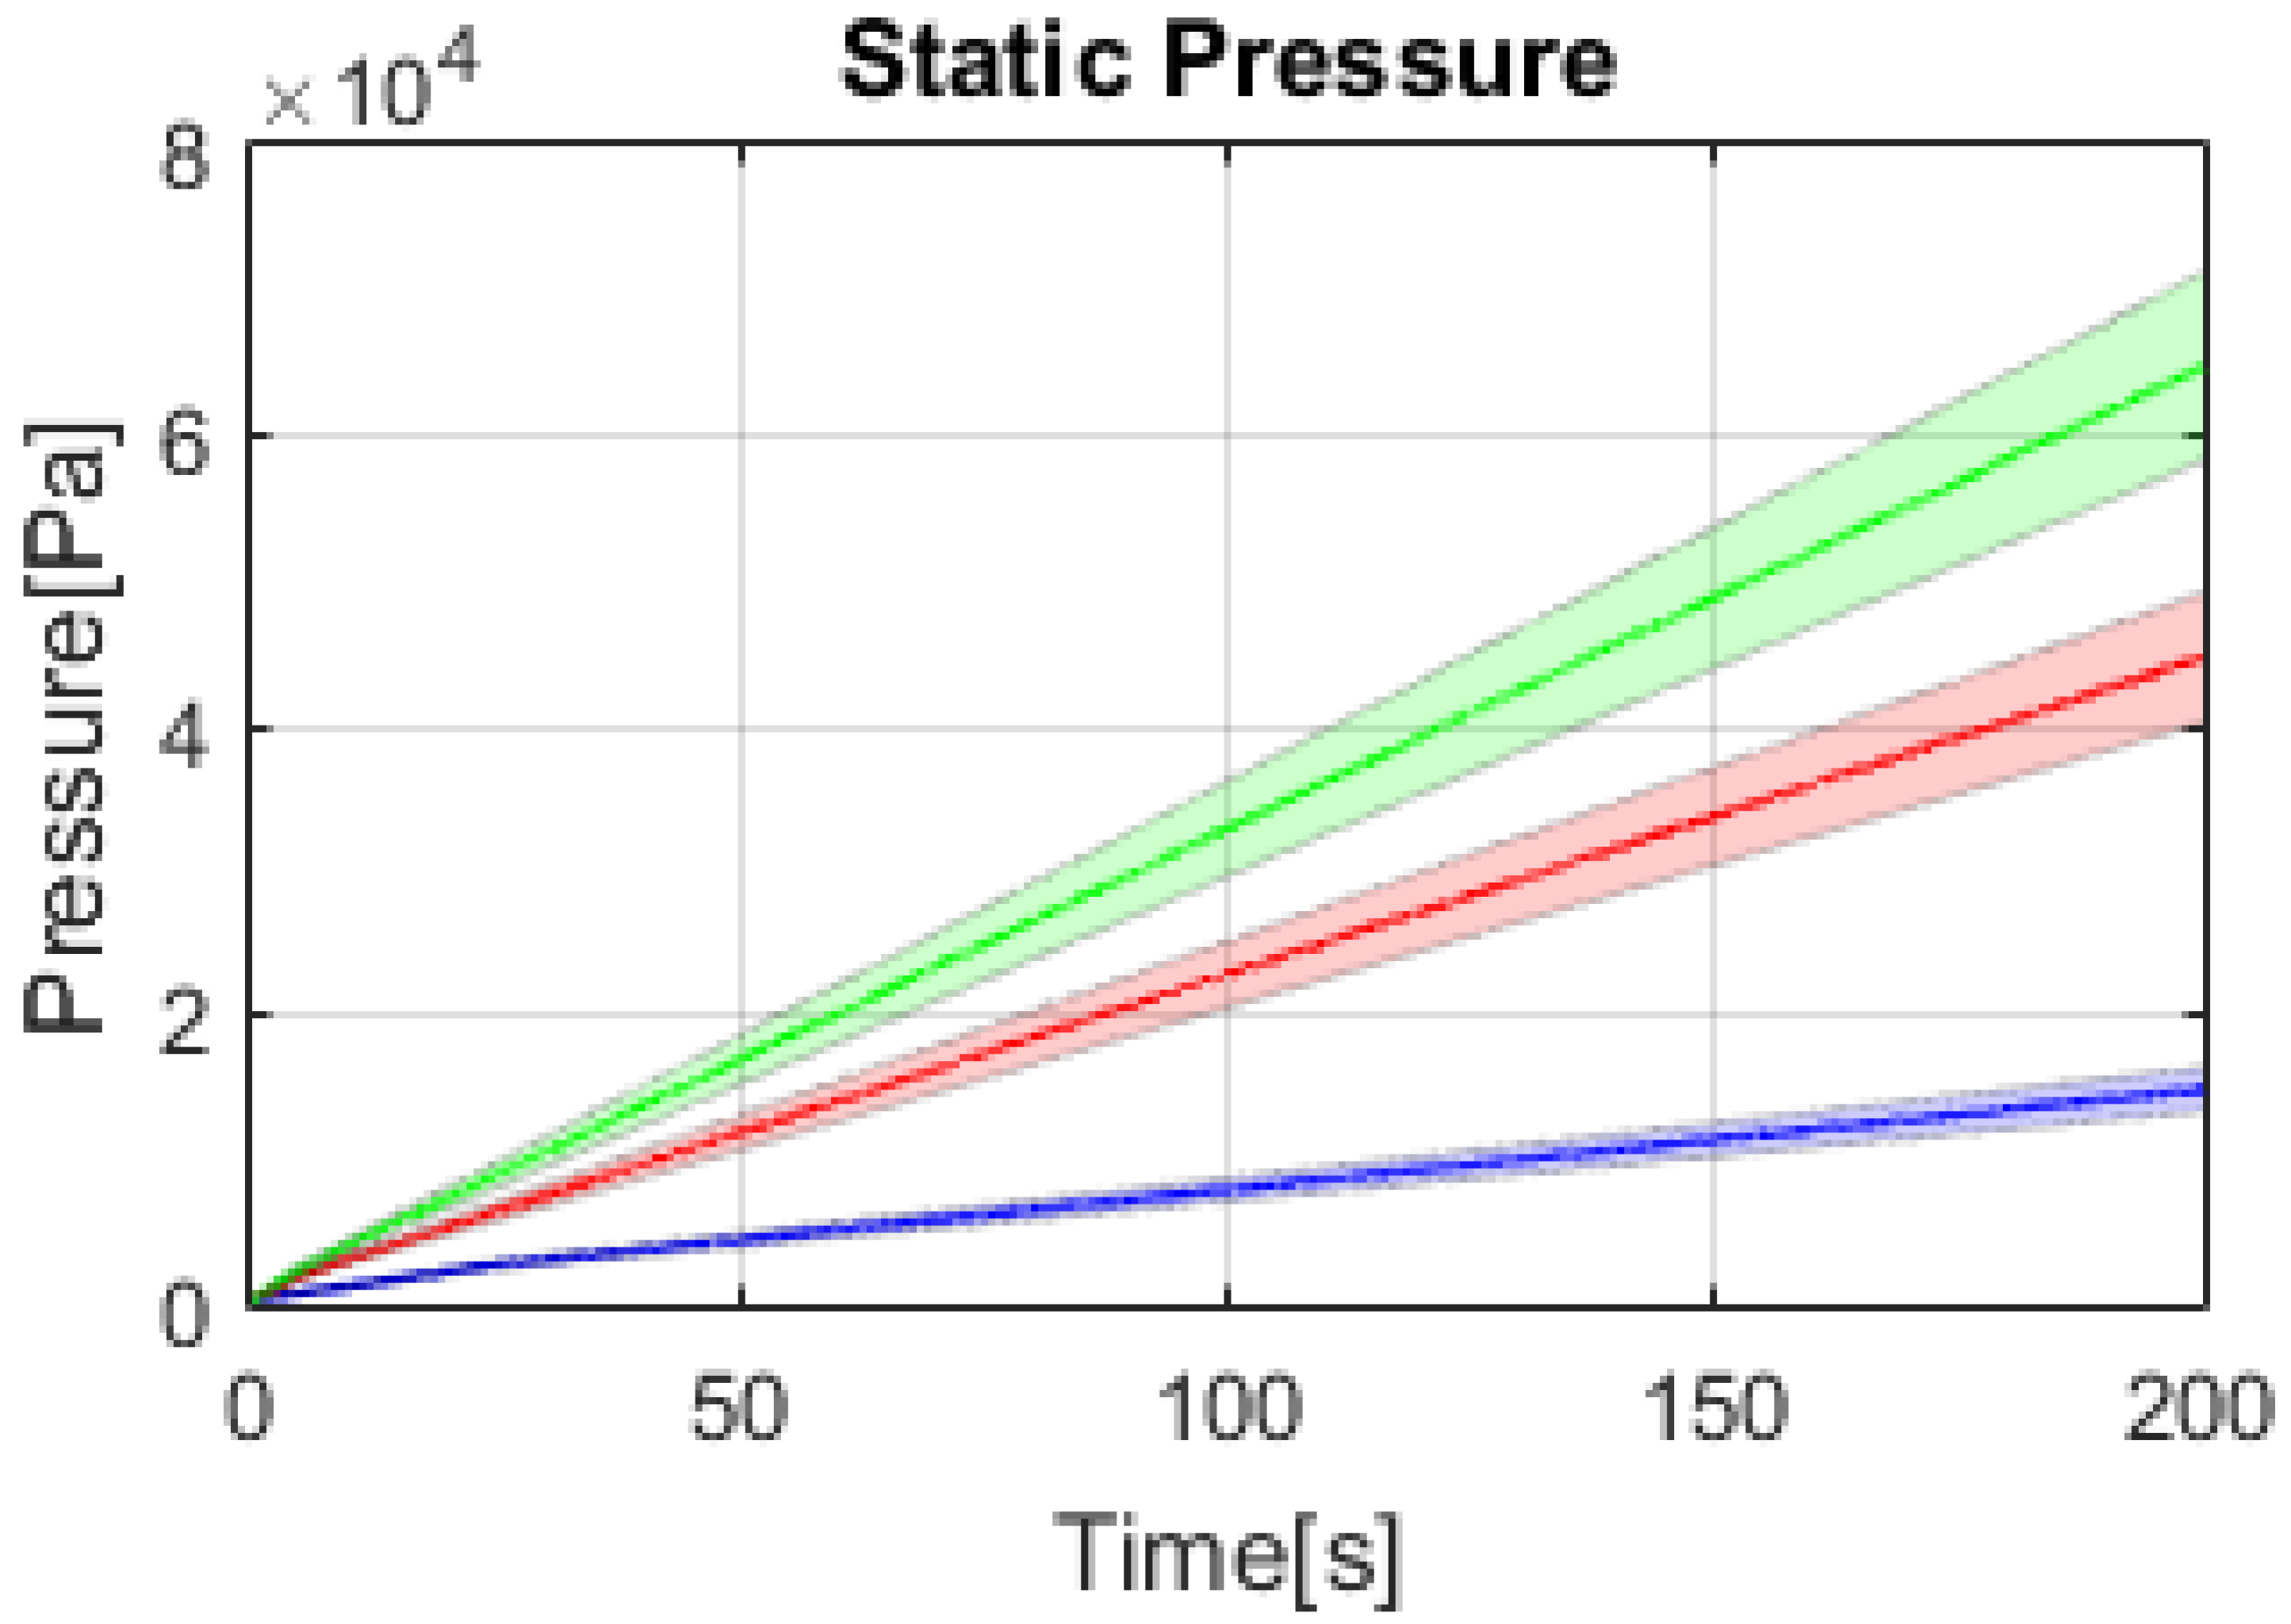
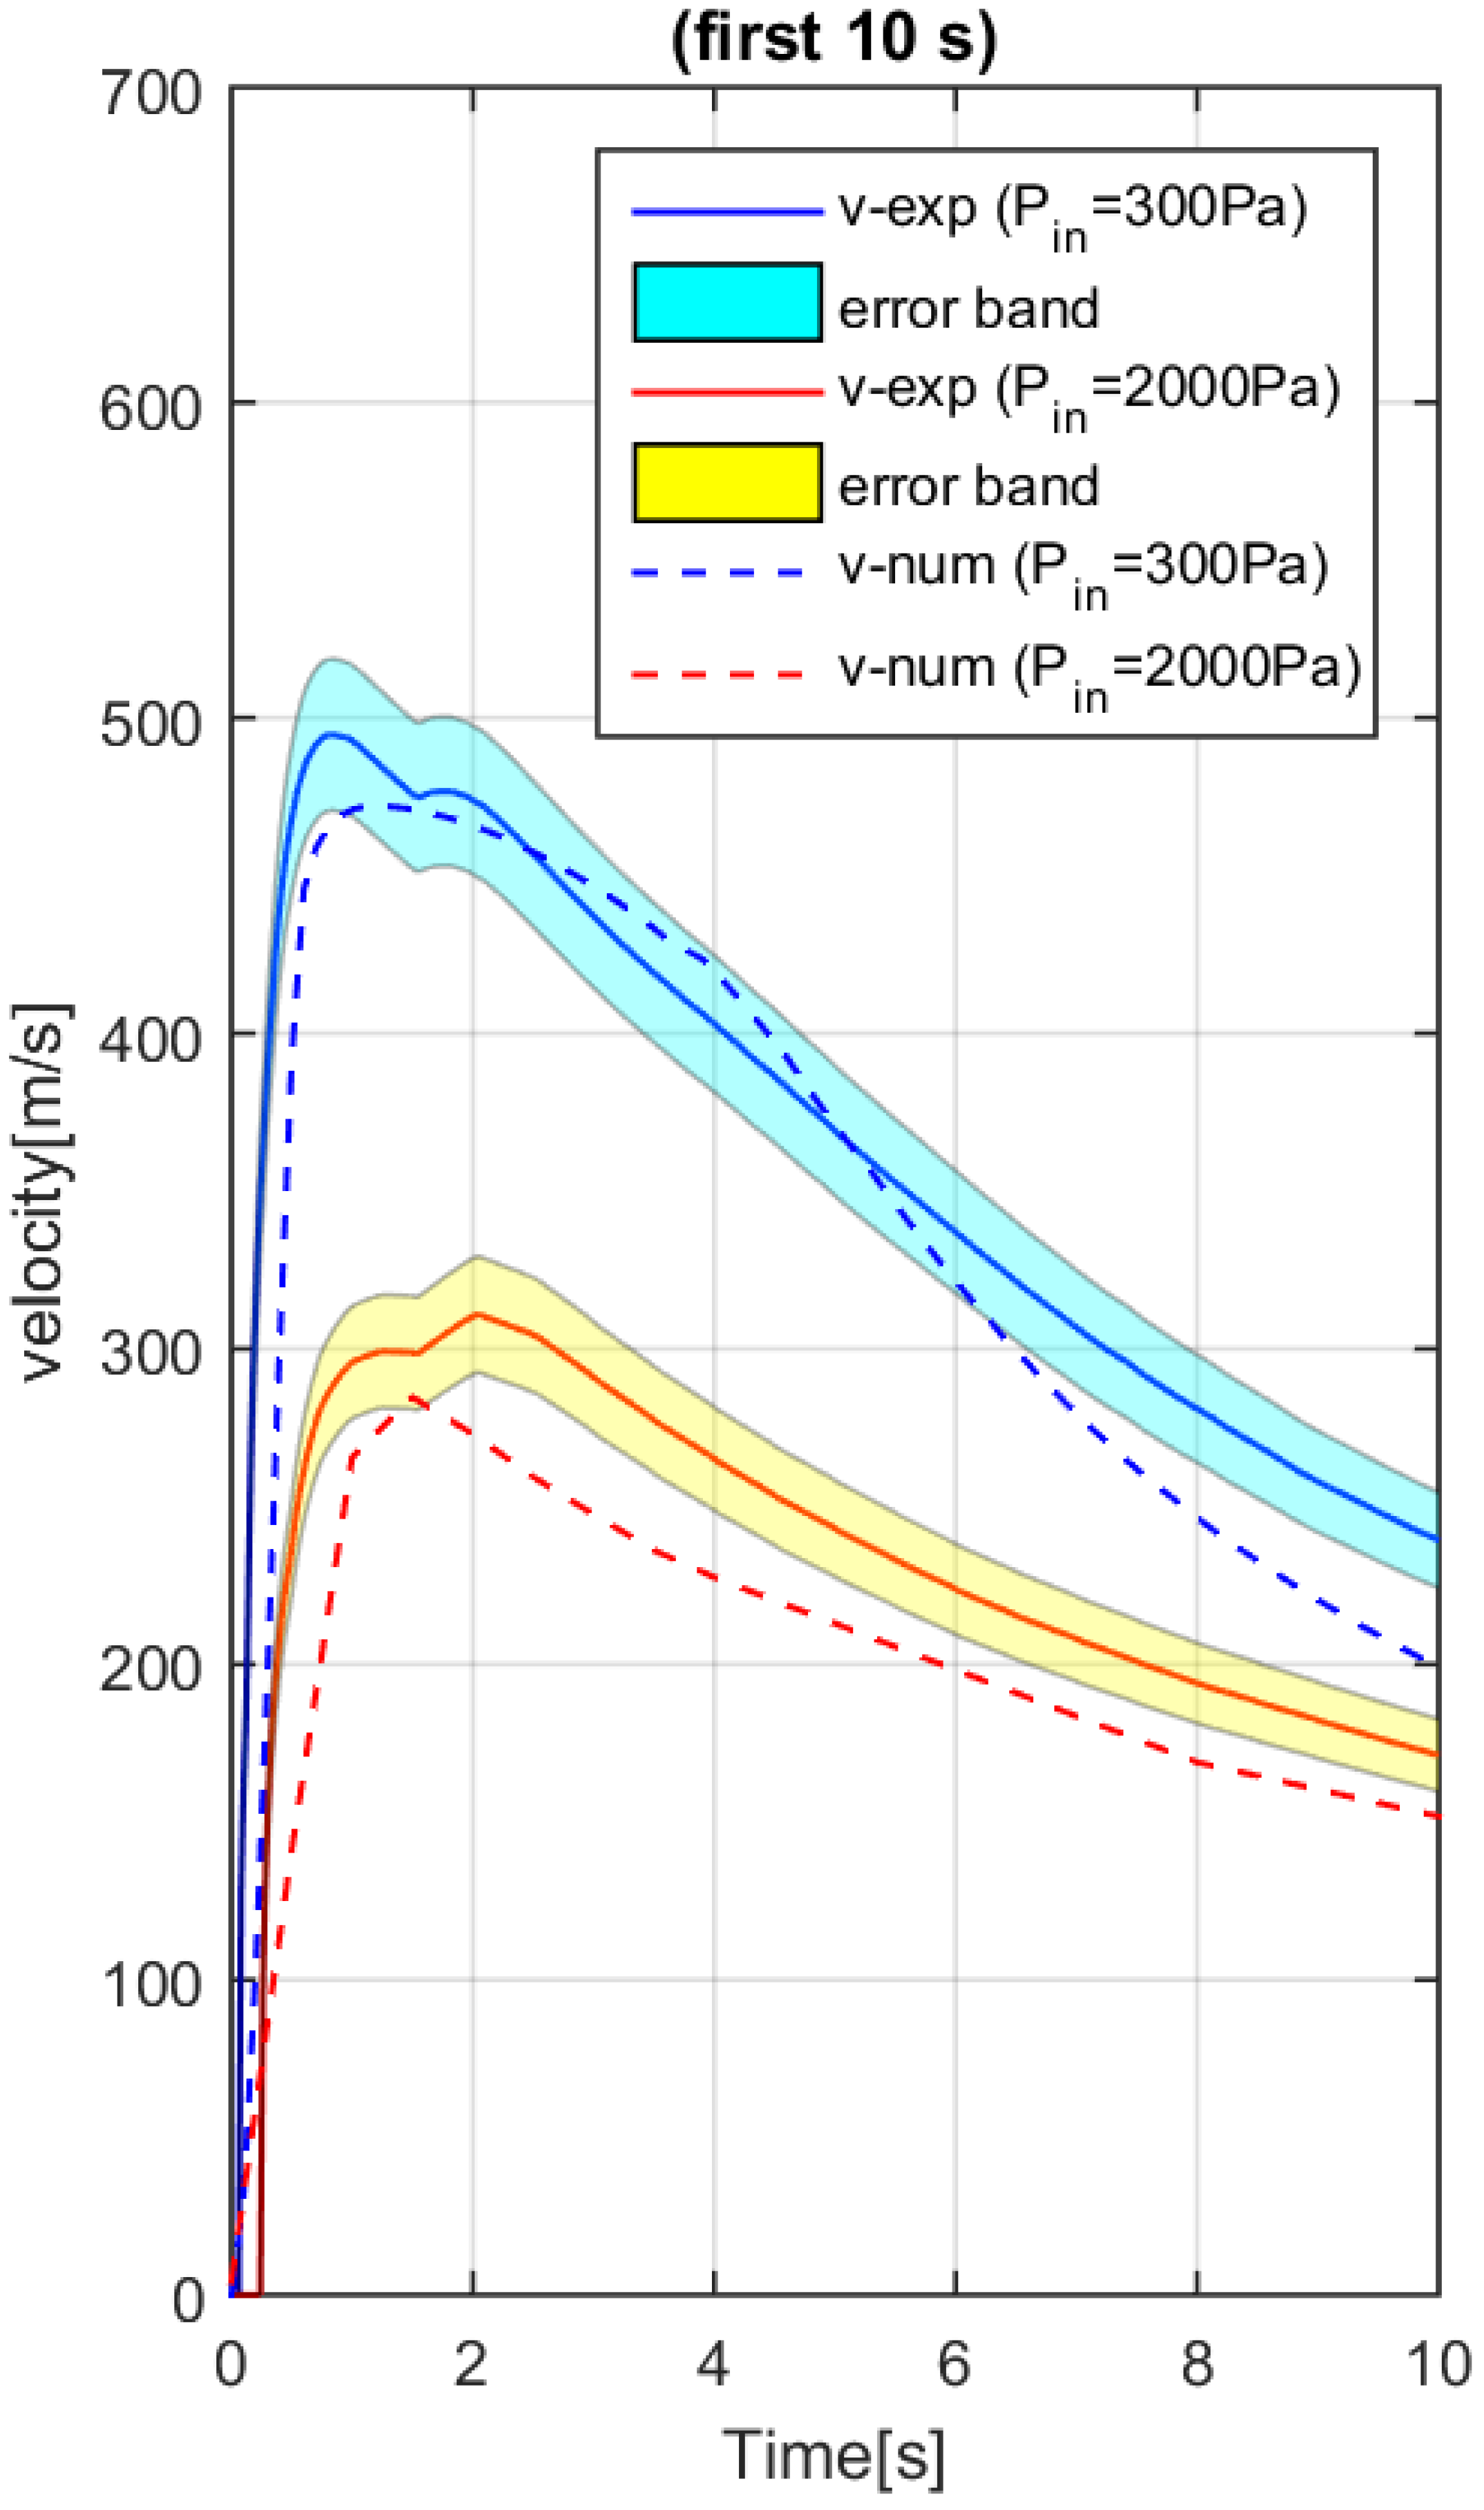
4.4. Comparison between by Experimental Results and Numerical Simulations

The experimental results have been compared with the numerical simulation results. This numerical simulation was performed with ANSYS CFX program 16.0. The results obtained experimentally are in agreement with the simulation results. Mach number and static pressure trends obtained with the experimental campaign were compared with that obtained with the numerical simulations. “The Mach number (Ma), equation (1) is a dimensionless group defined as the ratio between the velocity of an object in motion in a fluid and the speed of the sound in the fluid considered.
M a = v a = v γ R T
where:
  • v : macroscopic velocity of the object considered [m/s],
  • a: velocity of sound in the fluid considered [m/s],
  • γ : adiabatic coefficient [aim.],
  • R: specific gas constant [J kg−1 K−1],
  • T: absolute temperature [K].” [149]
Figure 23 shows the comparison between the Mach number obtained with the experiments and that calculated numerically. It should be noted that the error tube shown in Figure 23 for the experimental data was calculated according to the error analysis presented below, here uncertainties for all single measurements and indirect errors have been taken into account. In addition, 〈v〉 macroscopic velocity of the object considered was calculated according to Equation 2. This local air velocity is a function of the static pressure of the chamber and the local differential pressure measured by pressure transducers. However, static pressure and differential pressure were measured in two different locations of the chamber (at a distance of about 50 cm), due to physical limitations inside the chamber itself. This could have caused, as evidenced in Figure 23 for the higher vacuum level (i.e., the lower initial static pressure of 300 Pa inside the chamber), that the experimental results appear to reveal an underestimation of the air velocity after about 5 s. In addition, even if it is slightly noticeable from Figure 23 (left hand-side), the gap between numerical and experimental results does not grow after 10 s and it shrinks down as the air velocity decreases over time. However, the present analysis is focused on the first 5–10 s of the experiments that are crucial for the dust mobilization phenomena.
It is clear that numerical simulations (performed with ANSYS CFX software) are in substantial agreement with the numerical results. However, the static pressure measured experimentally through Pirani is less than that obtained through the numerical simulations. This is justified by the fact that the static pressure is measured at a pint roughly 50 cm far from the inlet port where the transducers have been positioned and where is the air inlet valve. Mach number obtained from the velocity during the first 4 s, measured during the experimental campaign, is greater than the velocity measured during the numerical simulation because it is inversely proportional to static pressure. Finally, the maximum experimental Mach number value is in good agreement with the numerical maximum velocity value (see Table 6). The differences between the experimental and numerical results are most likely due to the sensors used (better sensors should be used to this end) as well as to their positioning rather than to the chosen turbulence model.
It has to be noted that in terms of relative error on the speed of the flow, the situation is worse in the case of an initial pressure of 300 Pa. This is due to the fact that in this case, the expansion rate of the jet is greater, and therefore there are bigger differences in the pressure measured in two different points. This leads to greater errors in the speed experimental estimation.
Taking account of this error we can see that the experimental results agree with those numerical.

5. Conclusions

The objective of this experimental campaign was to determine the air thermos-fluid-dynamic characteristics during accidents of type LOCA and LOVA with the experimental system STARDUST-Upgrade facility. Several replications were made for each experiment. Same boundary conditions have been used:
  • initial pressure of 200 Pa;
  • final pressure of 95000 Pa;
  • room temperature.
  • While the following conditions were changed:
  • the flow rate with value of 8 L/min, 27 L/min, 40 L/min;
  • the transducers position: C and D;
  • valve air inlet: C and D.
The results evidence a pressure static with a monotonous linear upward trend, from the initial value of 200 Pa to the environmental pressure of 95000 Pa.
The pressure trends for the three value of flow rate are shown. The blue line is the pressure trend with flow rate of 8 L/min, the red line is the pressure trend with flow rate of 27 L/min, while the green line is the pressure trend with flow rate of 40 L/min. The gradients represent the pressurization rate. It increases with the value of flow rate. This means that the final pressure i.e., the atmospheric pressure is reached at different times for the three flow rate: 1200 s for flow rate of 8 L/min, 400 s for flow rate of 27 L/min and 250 for flow rate of 40 L/min.
The mean temperature trend measured by thermocouples is almost constant with an error range of about 2 K. The flow rate reaches a constant trend after about 6 s. The first 6 s trend is a parabolic type and this time reflects the fact that the flow meter takes time to fully open after signal is received from the control system.
The velocity graphs were developed with MATLAB (see APPENDIX B). All the velocity trends for each replication were similar. The graphs report an increasing velocity trend until a peak. It decreases and stabilizes in the first 50 s and then follows an asymptotic behaviour that tends to zero.
The peak value of velocity trends in function of the flow rate and the position of transducers are reported:
Air from C, transducers under C:
  • Time ≅ 2–3 s; Velocity ≅ 500 m/s flow rate = 40 L/min;
  • Time ≅ 2–3 s; Velocity ≅ 470 m/s flow rate = 27 L/min;
  • Time ≅ 2–3 s; Velocity ≅ 350 m/s flow rate = 8 L/min.
Air from D, transducers under D:
  • Time ≅ 2–3 s; Velocity ≅ 550 m/s flow rate = 40 L/min;
  • Time ≅ 2–3 s; Velocity ≅ 500 m/s flow rate = 27 L/min;
  • Time ≅ 2–3 s; Velocity ≅ 350 m/s flow rate = 8 L/min.
In the experiments with air from C, transducers under C, the velocity peak increases of about 20 and 30 m/s when the flow rate increases. While in the experiments with air from D, transducers under D, the velocity peak increases of about 50 m/s when the flow rate increases. The velocity graphs of the first 10 s are reported because they are crucial for the dust mobilization study. They show another peak before the expected one that is the result of a shock wave caused by the vacuum breach.
So, it was demonstrated that there is a relation between the flow air inlet and the measured velocity: to growing of the first growing the second.
Comparisons with numerical simulation performed with the software ANSYS CFX denote that the experimental results are in agreement with the numerical results.
These data will be useful for the development of a 3D multi-phase numerical model for the study of dust re-suspension and mobilization during the LOCA and LOVA type accidents.

Acknowledgments

A special Acknowledgment goes to Ilaria Giovannangeli and Chiara Del Papa for their efforts in the experimental campaign during their bachelor degrees.

Author Contributions

Andrea Malizia has conducted the work about the state of the art of materials in nuclear fusion plants. Andrea Malizia, Luigi Antonio Poggi and Riccardo Rossi have conducted the experimental campaigns and elaborated the data. Jean Francois Ciparisse, Pasqualino Gaudio and Carlo Bellecci have conducted the numerical simulations.

Conflicts of Interest

The authors declare no conflict of interest.

References

  1. Nuttall, W.J. Fusion as an Energy Source; Institute of Physics: London, UK, 2008; Available online: https://www.iop.org/publications/iop/2008/file_38224.pdf (accessed on 18 April 2016).
  2. European Commission. Fusion Research an Energy Option for Europe’s Future; Office for Official Publications of the European Communities: Luxembourg, 2007; Available online: https://ec.europa.eu/research/energy/pdf/92-79-00513-8_en.pdf (accessed on 18 April 2016).
  3. Redd, N.T. What is Fusion? 2012. Available online: http://www.livescience.com/23394-fusion.html (accessed on 19 July 2016).
  4. Brumfiel, G. Fusion Dreams Delayed—Nature. Available online: http://www.nature.com/news/2009/090527/full/459488a.html (accessed on 20 July 2016).
  5. Sharpe, J.P.; Petti, D.A.; Bartels, H.W. A review of dust in fusion devices: Implications for safety and operational performance. Fusion Eng. Des. 2002, 63–64, 153–163. [Google Scholar] [CrossRef]
  6. Winter, J. Dust: A new challenge in nuclear fusion research? Phys. Plasmas 2002, 7, 3862–3866. [Google Scholar] [CrossRef]
  7. Malizia, A.; Lupelli, I.; Richetta, M.; Gelfusa, M.; Bellecci, C.; Gaudio, P. Safety Analysis in Large Volume Vacuum Systems Like Tokamak: Experiments and Numerical Simulation to Analyse Vacuum Ruptures Consequences. Adv. Mater. Sci. Eng. 2014, 2014, 1–29. [Google Scholar] [CrossRef]
  8. Federici, G.; Skinner, C.H.; Brooks, J.N.; Coad, J.P.; Grisolia, C.; Haasz, A.A.; Hassanein, A.; Philipps, V.; Pitcher, C.S.; Roth, J.; et al. Plasma-material interactions in current tokamaks and their implications for next step fusion reactors. Nucl. Fusion 2001, 41, 1967–2137. [Google Scholar] [CrossRef]
  9. Federici, G.; Andrew, P.; Barabaschi, P.; Brooks, J.; Doerner, R.; Geier, A.; Herrmann, A.; Janeschitz, G.; Krieger, K.; Kukushkin, A.; et al. Key ITER plasma edge and plasma-material interaction issues. J. Nucl. Mater. 2003, 313–316, 11–22. [Google Scholar] [CrossRef]
  10. ITER. Radiological and Energy Source Terms. Generic Site Safety Report, Vol. III, G 84 RI 3 01-07-13 R1.0 Garching JWS. 2001. Available online: https://fusion.gat.com/iter/iter-fdr/final-report-sep-2001/Plant_Assembly_Documents_(PADs)/Generic_Site_Safety_Report_GSSR/GSSR_03_Rad+EnergySources.pdf (accessed on 18 April 2016).
  11. Jin, X.Z.; Bachmann, C.; Porfiri, M.T.; Federici, G. Source terms and critical event sequences for the blanket concept HCPB. Report for Task Agreement, EFDA_D_2L8RZY v3.0-WP13-SYS04-T03. 2014. Available online: https://idm.euro-fusion.org/?uid=2L8RZY (accessed on 18 April 2016).
  12. Jin, X.Z.; Bachmann, C.; Porfiri, M.T.; Federici, G. Source terms and critical event sequences for two DEMO blanket concepts HCPB and HCLL. Report for Task Agreement, EFDA_D_2LDAL4 V2.0-WP13-SYS04-T03. 2014. Available online: https://idm.euro-fusion.org/?uid=2KX64M (accessed on 18 April 2016).
  13. Di Giovanni, D.; Luttazzi, E.; Marchi, F.; Latini, G.; Carestia, M.; Malizia, A.; Gelfusa, M.; Fiorito, R.; D’Amico, F.; Cenciarelli, O.; et al. Two realistic scenarios of intentional release of radionuclides (Cs-137, Sr-90)—The use of the HotSpot code to forecast contamination extent. WSEAS Trans. Environ. Dev. 2014, 10, 106–122. [Google Scholar]
  14. Malizia, A.; Lupelli, I.; D’Amico, F.; Sassolini, A.; Fiduccia, A.; Quarta, A.M.; Fiorito, R.; Gucciardino, A.; Richetta, M.; Bellecci, C.; et al. Characterisation of Carbon Dioxide Absorbent Material For Enclosed Space Applications. Def. S T Tech. Bull. 2012, 5, 36–45. [Google Scholar]
  15. Rondeau, A.; Merrison, J.; Iversen, J.J.; Peillon, S.; Sabroux, J.C.; Lemaitre, P.; Gensdarmes, F.; Chassefière, E. First experimental results of particle re-suspension in a low pressure wind tunnel applied to the issue of dust in fusion reactors. Fusion Eng. Des. 2015, 32, 98–99. [Google Scholar] [CrossRef]
  16. Sharpe, J.P.; Humrickhouse, P.W. Dust mobilization studies in the TDMX facility. Fusion Eng. Des. 2006, 81, 1409–1415. [Google Scholar] [CrossRef]
  17. Baluc, N.; Abe, K.; Boutard, J.L.; Chernov, V.M.; Diegele, E.; Jitsukawa, S.; Kimura, A.; Klueh, R.L.; Kohyama, A.; Kurtz, R.J.; et al. Status of R&D activities on materials for fusion power reactors. Nucl. Fusion 2007, 47, S696–S717. [Google Scholar]
  18. Stork, D.; Agostini, P.; Boutard, J.-L.; Buckthorpe, D.; Diegele, E.; Dudarev, S.L.; English, C.; Federici, G.; Gilbert, M.R.; Gonzalez, S.; et al. Materials R&D for a timely DEMO: Key findings and recommendations of the EU Roadmap Materials Assessment Group. Fusion Eng. Des. 2014, 89, 1586–1594. [Google Scholar]
  19. Boccaccini, L.V.; Hermsmeyer, S.; Fischer, U.; Ihli, T.; Janeschitz, G.; Kohly, C.; Nagy, D.; Norajitra, P.; Polixa, C.; Reinamnn, J.; et al. Studies of In-Vessel Component Integration for a Helium-Cooled Fusion Reactor. Available online: http://www-pub.iaea.org/MTCD/publications/PDF/P1250-cd/papers/ppca1-i.pdf (accessed on 18 July 2016).
  20. Kakudate, S.; Shibanuma, K. Rail deployment and storage procedure and test for ITER blanket remote maintenance. Fusion Eng. Des. 2003, 65, 133–140. [Google Scholar] [CrossRef]
  21. Raffray, A.R.; Chiocchio, S.; Ioki, K.; Krassovski, D.; Kubik, D.; Tivey, R. High heat flux thermal-hydraulic analysis of ITER divertor and blanket systems. Fusion End. Des. 1998, 39–40, 323–331. [Google Scholar] [CrossRef]
  22. Izard, J.B. Development of Remote Handling Technologies Tolerant to Operation Ready Fusion Reactor Conditions. Ph.D. Thesis, Tampere University of Technology, Tampere, Finland, 14 June 2013. [Google Scholar]
  23. Kallenbach, A.; Kaufmann, M.; Coster, D.P.; Fuchs, J.C.; Herrmann, A.; Neuhauser, J.; Schneider, R.; Borrass, K.; Bosch, H.-S.; Carlson, A.; et al. Scrape-off layer radiation and heat load to the ASDEX Upgrade LYRA divertor. Nucl. Fusion 1999, 39, 901–918. [Google Scholar] [CrossRef]
  24. Loarte, A.; Lipschultz, B.; Kukushkin, A.S.; Matthews, G.F.; Stangeby, P.C.; Asakura, N.; Cousnell, G.F.; Federici, G.; Kallenbach, A.; Kneger, K.; et al. Chapter 4: Power and particle control. In Nuclear Fusion; IAEA: Vienna, Austria, 2007; Volume 47. [Google Scholar]
  25. Loarte, A.; Saibene, G.; Sartori, R.; Riccardo, V.; Andrew, P.; Paley, J.; Fundamenski, W.; Eich, T.; Herrmann, A.; Pautasso, G.; et al. Transient heat loads in current fusion experiments, extrapolation to ITER and consequences for its operation. Phys. Scr. 2007, 2007, 222–228. [Google Scholar] [CrossRef]
  26. Hender, T.C. Chapter 3: MHD stability, operational limits and disruptions. In Nuclear Fusion; IAEA: Vienna, Austria, 2007; Volume 47. [Google Scholar]
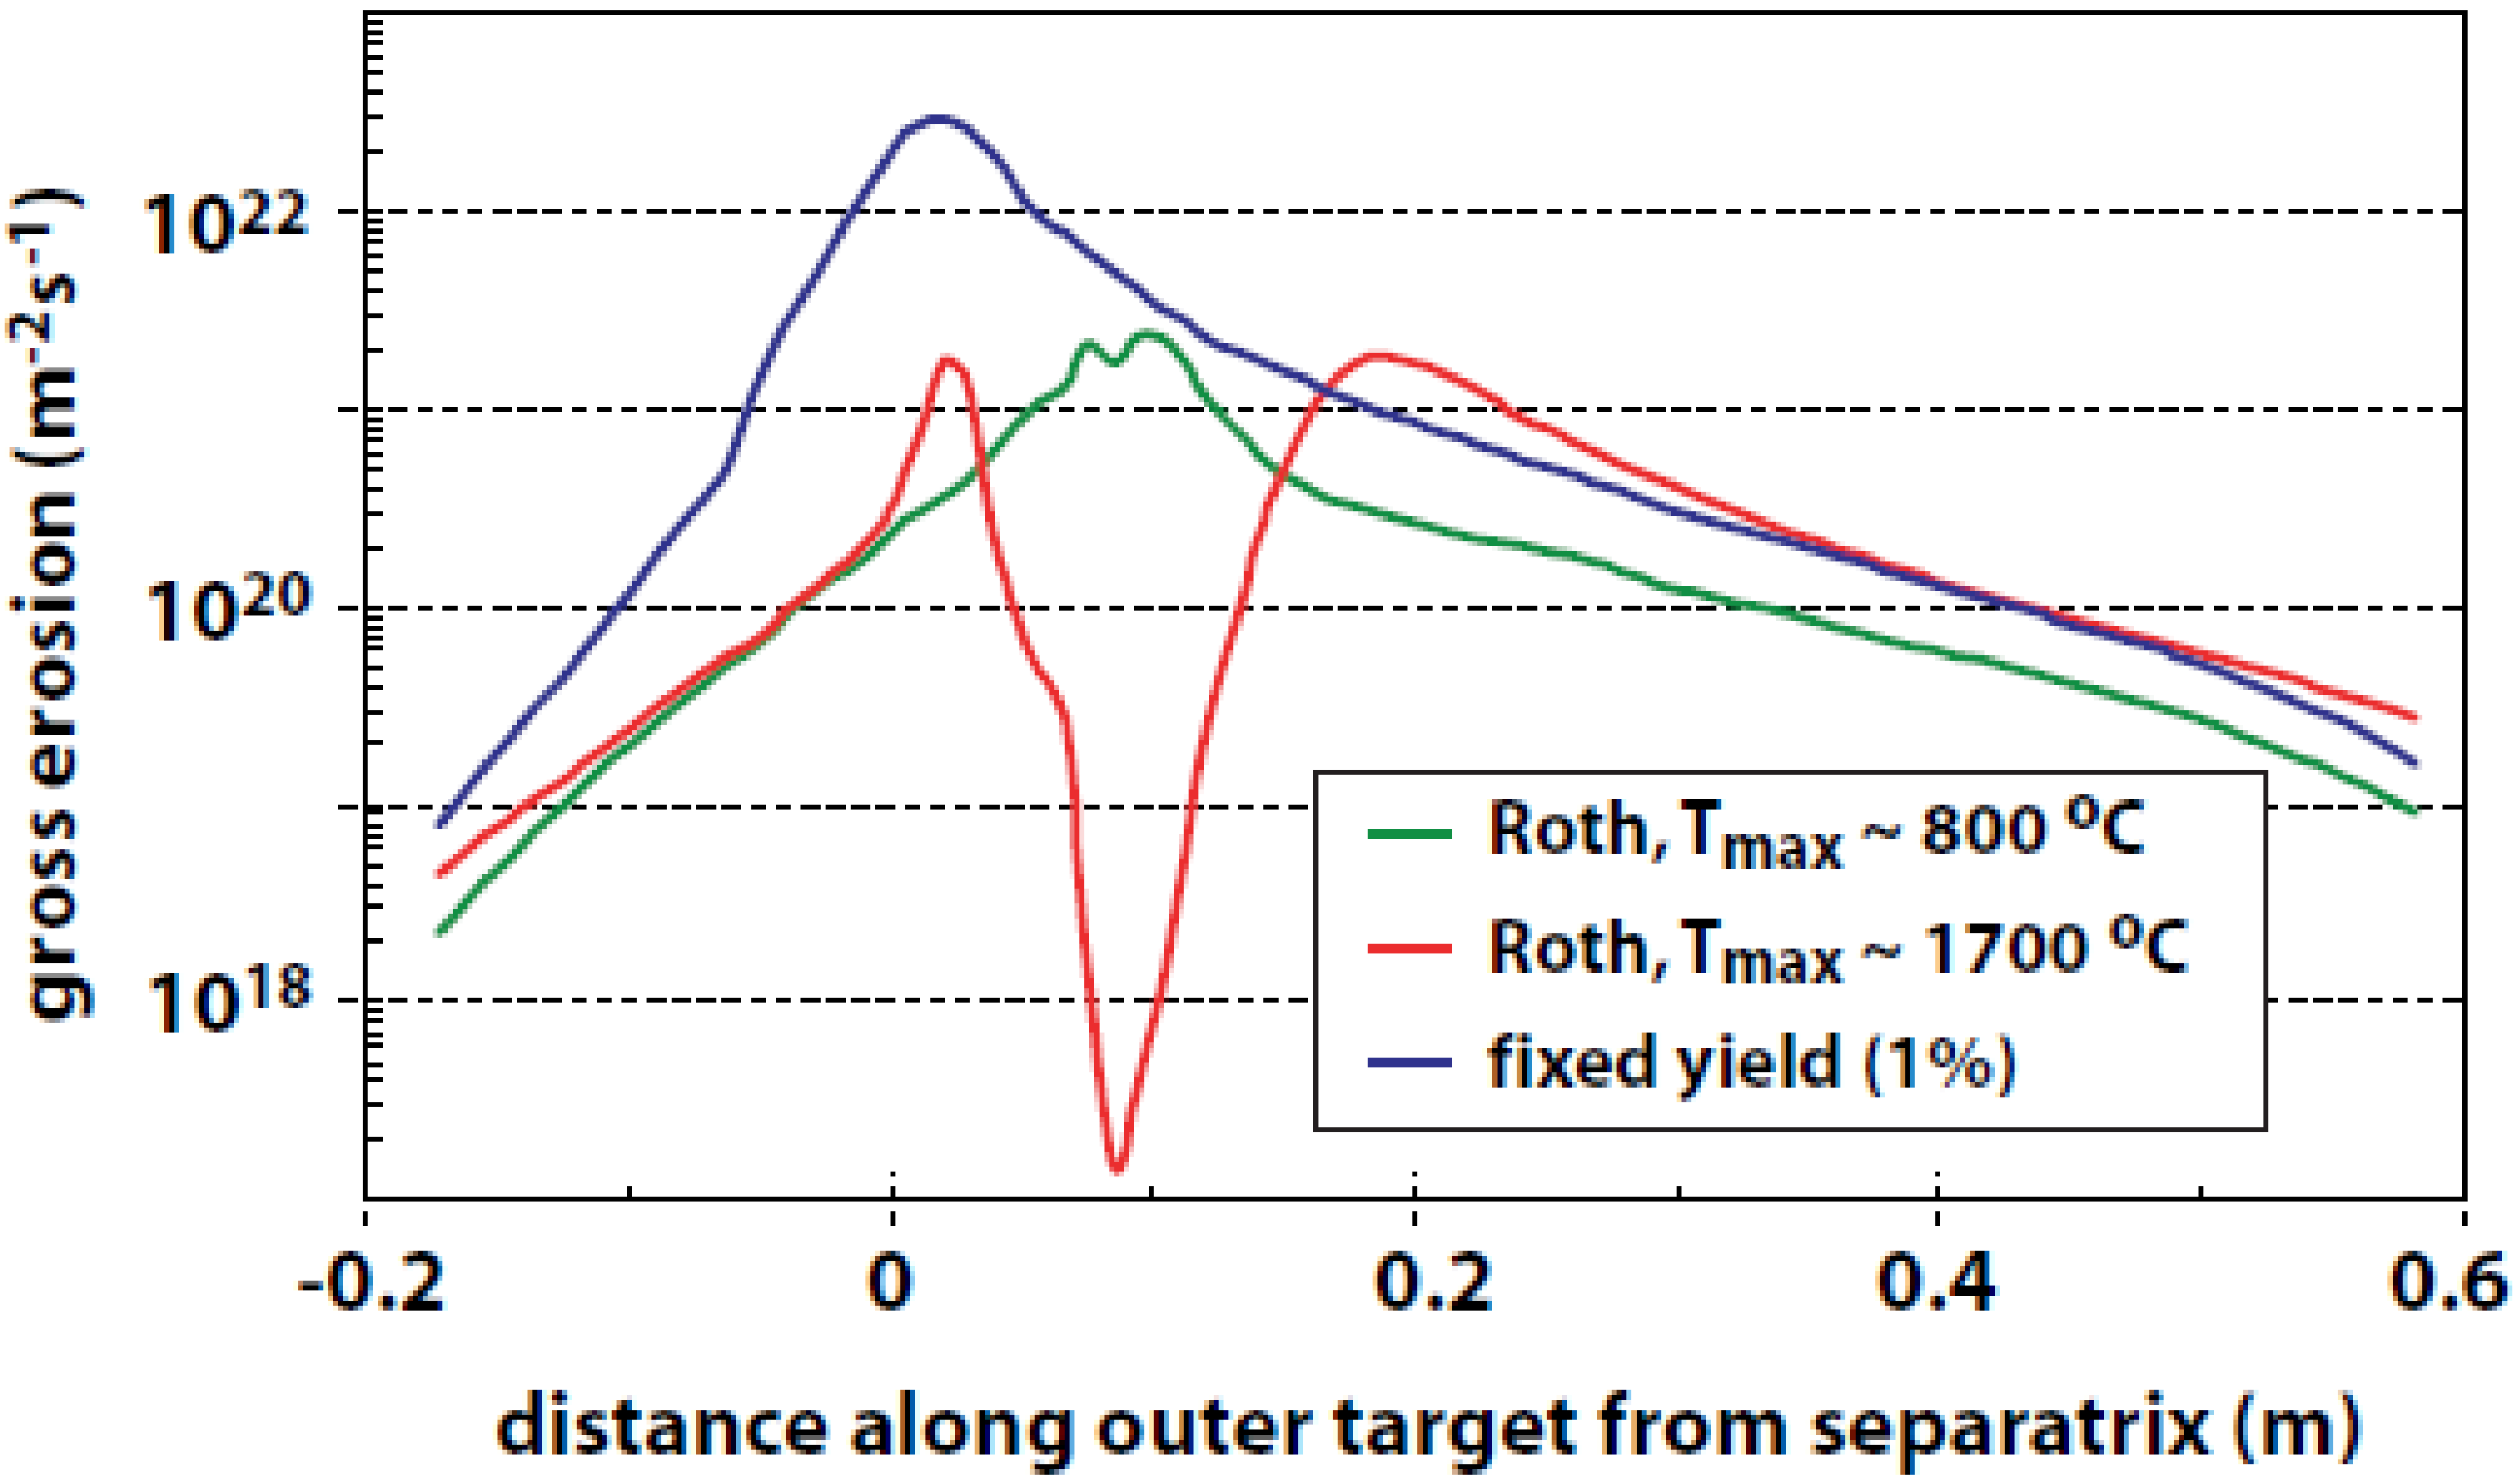
  27. Roth, J.; Preuss, R.; Bohmeyer, W.; Brezinsek, S.; Cambe, A.; Casarotto, E.; Doerner, R.; Gauthier, E.; Federici, G.; Higashijima, S.; et al. Flux dependence of carbon chemical erosion by deuterium ions. Nucl. Fusion 2004, 44, L21–L25. [Google Scholar] [CrossRef]
  28. Longhurst, G.R.; Snead, L.L.; Abou-Sena, A.A. The status of beryllium research for fusion in the United States. In Proceedings of the Sixth International Workshop on Beryllium—Technology for Fusion, Miyazaki, Japan, 2 December 2003.
  29. Thomas, P.R.; Jet Team. Results of JET operation with beryllium. J. Nucl. Mater. 1990, 176–177, 3–13. [Google Scholar]
  30. Campbell, D.J.; Jet Team. Experimental comparison of carbon and beryllium as divertor target materials in JET. J. Nucl. Mater. 1997, 241–243, 379–384. [Google Scholar] [CrossRef]
  31. Anderl, R.A.; Causey, R.A.; Davis, J.W.; Doerner, R.P.; Federici, G.; Haasz, A.A.; Longhurst, G.; Wampler, W.R.; Wilson, K.L. Hydrogen isotope retention in beryllium for tokamak plasma-facing applications. J. Nucl. Mater. 1999, 273, 1–26. [Google Scholar] [CrossRef]
  32. Causey, R.A. Hydrogen isotope retention and recycling in fusion reactor plasma-facing components. J. Nucl. Mater. 2002, 300, 91–117. [Google Scholar] [CrossRef]
  33. Mayer, M. Codeposition of deuterium with BeO at elevated temperatures. J. Nucl. Mater. 1997, 240, 164–167. [Google Scholar] [CrossRef]
  34. Doerner, R.P.; Baldwin, M.J.; Causey, R.A. Beryllium-tungsten mixed-material interactions. J. Nucl. Mater. 2005, 342, 63–67. [Google Scholar] [CrossRef]
  35. Doerner, R.P.; Baldwin, M.J.; Conn, R.W.; Grossman, A.A.; Luckhardt, S.C.; Seraydarian, R.; Tynan, G.R.; Whyte, D.G. Measurements of erosion mechanisms from solid and liquid materials in PISCES-B. J. Nucl. Mater. 2001, 290–293, 166–172. [Google Scholar] [CrossRef]
  36. Doerner, R.P.; Krasheninnikov, S.I.; Schmid, K. Particle-induced erosion of materials at elevated temperature. J. Appl. Phys. 2004, 95, 4471. [Google Scholar] [CrossRef]
  37. Piet, S.J.; Costley, A.; Federici, G.; Heckendorn, F.; Little, R. ITER tokamak dust-limits, production, removal, surveying. In Proceedings of the 17th IEEE/NPSS Symposium on Fusion Engineering, San Diego, CA, USA, 6–10 October 1997.
  38. Whyte, D.G.; Davis, J.W. Tritium recovery in ITER by radiative plasma terminations. J. Nucl. Mater. 2005, 337–339, 560–564. [Google Scholar] [CrossRef]
  39. Loarte, A.; Saibene, G.; Sartori, R.; Campbell, D.J.; Lomas, P.J.; Matthews, G.F. A new look at JET operation with Be as plasma facing material. J. Nucl. Mater. 2005, 337–339, 816–820. [Google Scholar] [CrossRef]
  40. Lingertat, J.; Tabasso, A.; Ali-Arshad, S.; Alper, B.; van Belle, P.; Borrass, K.; Clement, S.; Coad, J.P.; Monk, R. Studies of giant ELM interaction with the divertor target in JET. J. Nucl. Mater. 1997, 241–243, 402–407. [Google Scholar]
  41. Ciotti, M.; Ferro, C.; Maddaluno, G. Optimization of the FTU toroidal limiter shape. J. Nucl. Mater. 1992, 196–198, 725–728. [Google Scholar] [CrossRef]
  42. Hutchinson, I.H.; Boivin, R.; Bombarda, F.; Bonoli, P.; Fairfax, S.; Fiore, C.; Goetz, J.; Golovato, S.; Granetz, R.; Greenwald, M.; et al. First results from Alcator-C-MOD. Phys. Plasmas 1994, 1, 1511–1518. [Google Scholar] [CrossRef]
  43. Pospieszczyk, A.; Tanabe, T.; Philipps, V.; Sergienko, G.; Ohgo, T.; Kondo, K.; Wada, M.; Rubel, M.; Biel, W.; Kirschner, A.; et al. Operation of TEXTOR-94 with tungsten poloidal main limiters. J. Nucl. Mater. 2001, 290–293, 947–952. [Google Scholar] [CrossRef]
  44. Neu, R.; Dux, R.; Geier, A.; Kallenbach, A.; Pugno, R.; Rohde, V.; Bolshukhin, D.; Fuchs, J.C.; Gehre, O.; Gruber, O.; et al. Impurity behaviour in the ASDEX Upgrade divertor tokamak with large area tungsten walls. Plasma Phys. Control. Fusion 2002, 44, 811–826. [Google Scholar] [CrossRef]
  45. Neu, R.; Bobkov, V.; Dux, R.; Fuchs, J.C.; Gruber, O.; Herrmann, A.; Kallenbach, A.; Maier, H.; Mayer, M.; Putterich, T.; et al. Ten years of W programme in ASDEX Upgrade—Challenges and conclusions. Phys. Scr. 2009, T138, 014038. [Google Scholar] [CrossRef]
  46. May, M.J.; Fournier, K.B.; Goetz, J.A.; Terry, J.L.; Pacella, D.; Finkenthal, M.; Marmar, E.S.; Goldstein, W.H. Intrinsic molybdenum impurity density and radiative power losses with their scalings in ohmically and ICRF heated Alcator C-Mod and FTU tokamak plasmas. Plasma Phys. Control. Fusion 1998, 41, 45–64. [Google Scholar] [CrossRef]
  47. Lipschultz, B.; Pappas, D.A.; LaBombard, B.; Rice, J.E.; Smith, D.; Wukitch, S.J. A study of molybdenum influxes and transport in Alcator C-Mod. Nucl. Fusion 2001, 41, 585–596. [Google Scholar] [CrossRef]
  48. Apicella, M.L.; Mazzitelli, G.; Apruzzese, G.; Bracco, G.; Esposito, B.; Gabellieri, L.; Kroegler, H.; Leigheb, M.; Maddaluno, G.; Marinucci, M.; et al. Effects of wall boron coating on FTU plasma operations. J. Nucl. Mater. 2003, 313–316, 269–273. [Google Scholar] [CrossRef]
  49. Rieth, M.; Dudarev, S.L.; Gonzalez de Cicente, S.M.; Aktaa, J.; Ahlgren, T.; Antusch, S.; Armstrong, D.E.J.; Balden, M.; Baluc, N.; Barthe, M.F.; et al. Recent progress in research on tungsten materials for nuclear fusion applications in Europe. J. Nucl. Mater. 2013, 432, 482–500. [Google Scholar] [CrossRef]
  50. Rieth, M.; Dudarev, S.L.; Gonzalez de Vicente, S.M.; Aktaa, J.; Ahlgren, T.; Antusch, S.; Armstrong, D.E.J.; Balden, M.; Baluc, N.; Barthe, M.F.; et al. A brief summary of the progress on the EFDA tungsten materials program. J. Nucl. Mater. 2013, 442, S173–S180. [Google Scholar] [CrossRef]
  51. Pamela, J.; Bécoulet, A.; Borba, D.; Boutard, J.L.; Horton, L.; Maisonnier, D. Efficiency and availability driven R&D issues for DEMO. Fusion Eng. Des. 2009, 84, 194–204. [Google Scholar]
  52. Maisonnier, D.; Campbell, D.; Cook, I.; Di Pace, L.; Giancarli, L.; Hayward, J.; Li Puma, A.; Medrano, M.; Norajitra, P.; Roccella, M.; et al. Power plant conceptual studies in Europe. Nucl. Fusion 2007, 47, 1524–1532. [Google Scholar] [CrossRef]
  53. Norajitra, P.; Abdel-Khalik, S.I.; Giancarli, L.M.; Ihli, T.; Janeschitz, G.; Malang, S.; Mazul, I.V.; Sardain, P. Divertor conceptual designs for a fusion power plant. Fusion Eng. Des. 2008, 83, 893–902. [Google Scholar] [CrossRef]
  54. Janeschitz, G. Plasma-wall interaction issues in ITER. J. Nucl. Mater. 2001, 290–293, 1–11. [Google Scholar] [CrossRef]
  55. Bolt, H.; Barabash, V.; Federici, G.; Linke, J.; Loarte, A.; Roth, J.; Sato, K. Plasma facing and high heat flux materials-needs for ITER and beyond. J. Nucl. Mater. 2002, 307–311, 43–52. [Google Scholar] [CrossRef]
  56. Wittlich, K.; Hirai, T.; Compan, J.; Klimov, N.; Linke, J.; Loarte, A.; Merola, M.; Pintsuk, G.; Podkovyrov, V.; Singheiser, L.; Zhitlukhin, A. Damage structure in divertor armor materials exposed to multiple ITER relevant ELM loads. Fusion Eng. Des. 2009, 84, 1982–1986. [Google Scholar] [CrossRef]
  57. Hirai, T.; Pintsuk, G.; Linke, J.; Batilliot, M. Cracking failure study of ITER-reference tungsten grade under single pulse thermal shock loads at elevated temperatures. J. Nucl. Mater. 2009, 390–391, 751–754. [Google Scholar] [CrossRef]
  58. Roth, J.; Tsitrone, E.; Loarte, A.; Loarer, Th.; Counsell, G.; Neu, R.; Philipps, V.; Brezinsek, S.; Lehnen, M.; Coad, P.; et al. Recent analysis of key plasma wall interactions issues for ITER. J. Nucl. Mater. 2009, 390–391, 1–9. [Google Scholar] [CrossRef]
  59. Rieth, M.; Boutard, J.L.; Dudarev, S.L.; Ahlgren, T.; Antusch, S.; Baluc, N.; Barthe, M.F.; Becquart, C.S.; Ciupinski, L.; Correia, J.B.; et al. Review on the EFDA programme on tungsten materials technology and science. J. Nucl. Mater. 2011, 417–463, 463–467. [Google Scholar] [CrossRef]
  60. Rieth, M.; Hoffmann, A. Influence of microstructure and notch fabrication on impact bending properties of tungsten materials. Int. J. Refract. Met. Hard Mater. 2010, 28, 679–686. [Google Scholar] [CrossRef]
  61. Nemoto, Y.; Hasegawa, A.; Satou, M.; Abe, K.; Hiraoka, Y. Microstructural development and radiation hardening of neutron irradiated Mo–Re alloys. J. Nucl. Mater. 2004, 324, 62–70. [Google Scholar] [CrossRef]
  62. Duwe, R.; Kühnlein, W.; Münstermann, M. The new electron beam facility for materials testing in hot cells—Design and Preliminary experience. In Proceedings of the 18th Symposium on Fusion Technology, Karlsruhe, Germany, 22–26 August 1994.
  63. Greuner, H.; Bolt, H.; Böswirth, B.; Lindig, S.; Kuhnlein, W.; Huber, T.; Sato, K.; Suzuki, S. Vacuum plasma-sprayed tungsten on EUROFER and 316L: Results of characterisation and thermal loading tests. Fusion Eng. Des. 2005, 75, 333–338. [Google Scholar] [CrossRef]
  64. Maisonnier, D.; Cook, I.; Sardain, P.; Andreani, R.; Di Pace, L.; Forrest, R.; Giancarli, L.; Hermsmeyer, S.; Norajitra, P.; Taylor, N.; Ward, D. A Conceptual Study of Commercial Fusion Power Plants; Final Report of the European Fusion Power Plant Conceptual Study (PPCS). EFDA, 2005. Available online: https://www.ipp.mpg.de/ippcms/de/presse/archiv/PPCS_summary (accessed on 18 April 2016).
  65. Koch, F.; Bolt, H. Self passivating W-based alloys as plasma facing material for nuclear fusion. Phys. Scr. 2007, T128, 100–105. [Google Scholar] [CrossRef]
  66. Koch, F.; Köppl, S.; Bolt, H. Self passivating W-based alloys as plasma-facing materiatungsten l. J. Nucl. Mater. 2009, 386–388, 572–574. [Google Scholar]
  67. Koch, F.; Brinkmann, J.; Lindig, S.; Mishra, T.P.; Linsmeier, C. Oxidation behaviour of silicon-free tungsten alloys for use as first wall material. Phys. Scr. 2011, T145, 014019. [Google Scholar] [CrossRef]
  68. López-Ruiz, P.; Ordás, N.; Lindig, S.; Koch, F.; Iturriza, I.; García-Rosales, C. Self passivating bulk tungsten-based alloys manufactured by powder metallurgy. Phys. Scr. 2011, T145, 014018. [Google Scholar]
  69. Gonzalez, C.; Panizo-Laiz, M.; Gordillo, N.; Guerrero, C.L.; Tejado, E.; Munnik, F.; Piaggi, P.; Bringa, E.; Iglesias, R.; Gonzalez-Arrabal, R. H trapping and mobility in nanostructured tungsten grain boundaries: A combined experimental and theoretical approach. Nucl. Fusion, 2015, 55, 11. [Google Scholar] [CrossRef]
  70. López-Ruiz, P.; Ordás, N.; Iturriza, I.; Koch, F.; García-Rosales, C. Powder metallurgical processing of self-passivating tungsten alloys for fusion first wall application. J. Nucl. Mater. 2013, 442, S219–S224. [Google Scholar] [CrossRef]
  71. Neu, R.; Dux, R.; Kallenbach, A.; Putterich, T.; Balden, M.; Fuchs, J.C.; Herrmann, A.; Maggi, C.F.; O’Mullane, M.; Pugno, R.; et al. Tungsten: an option for divertor and main chamber plasma facing components in future fusion devices. Nucl. Fusion 2005, 45, 209–218. [Google Scholar] [CrossRef]
  72. Matějíček, J.; Chráska, P.; Linke, J. Thermal spray coatings for fusion applications—Review. J. Therm. Spray Technol. 2007, 16, 64–83. [Google Scholar] [CrossRef]
  73. Davis, J.W.; Slattery, K.T.; Driemeyer, D.E.; Ulrickson, M.A. Use of tungsten coatings on ITER plasma facing components. J. Nucl. Mater. 1996, 233–237, 604–608. [Google Scholar] [CrossRef]
  74. Bloom, E.E. The challenge of developing structural materials for fusion power systems. J. Nucl. Mater. 1998, 258–263, 7–17. [Google Scholar] [CrossRef]
  75. Ehrlich, K.; Bloom, E.E.; Kondo, T. International strategy for fusion materials development. J. Nucl. Mater. 2001, 283–287, 79–88. [Google Scholar] [CrossRef]
  76. Zinkle, S.J.; Victoria, M.; Abe, K. Scientific and engineering advances from fusion materials R&D. J. Nucl. Mater. 2002, 307–311, 31–42. [Google Scholar]
  77. Bloom, E.E.; Conn, R.W.; Davis, J.W.; Gold, R.E.; Little, R.; Schultz, K.R.; Smith, D.L.; Wiffen, F.W. Low Activation Materials for Fusion Applications. University of California-Los Angeles (UCLA), UCLA Report PPG-728. 1983. Available online: http://dx.doi.org/10.1016/0022-3115(84)90570-1 (accessed on 18 April 2016).
  78. Mansur, L.K.; Rowcliffe, A.F.; Nanstad, R.K.; Zinkle, S.J.; Corwin, W.R.; Stoller, R.E. Materials needs for fusion, Generation IV fission reactors and spallation neutron sources—Similarities and differences. J. Nucl. Mater. 2004, 329–333, 166–172. [Google Scholar] [CrossRef]
  79. Klueh, R.L. Ferritic/martensitic steels for advanced nuclear reactors. Trans. Indian Inst. Met. 2009, 62, 81–87. [Google Scholar] [CrossRef]
  80. Mansur, L.K. Materials research and development for the spallation neutron source mercury target. J. Nucl. Mater. 2003, 318, 14–25. [Google Scholar] [CrossRef]
  81. Mansur, L.K.; Gabriel, T.A.; Haines, J.R.; Lousteau, D.C. R&D for the Spallation Neutron Source mercury target. J. Nucl. Mater. 2001, 296, 1–16. [Google Scholar]
  82. Montanari, R.; Filacchioni, G.; Iacovone, B.; Plini, P.; Riccardi, B. High temperature indentation tests on fusion reactor candidate materials. J. Nucl. Mater. 2007, 367–370, 648–652. [Google Scholar] [CrossRef]
  83. Zinkle, S.J.; Ghoniem, N.M. Operating temperature windows for fusion reactor structural materials. Fusion Eng. Des. 2000, 51–52, 55–71. [Google Scholar] [CrossRef]
  84. Van der Schaaf, B.; Gelles, D.S.; Jitsukawak, S.; Kimura, A.; Klueh, R.L.; Moslang, A.; Odette, G.R. Progress and critical issues of reduced activation ferritic/martensitic steel development. J. Nucl. Mater. 2000, 283–287, 52–59. [Google Scholar] [CrossRef]
  85. Hishinuma, H.; Kohyama, A.; Klueh, R.L.; Gelles, D.S.; Dietz, W.; Ehrlich, K. Current status and future R&D for reduced-activation ferritic/martensitic steels. J. Nucl. Mater. 1998, 258–263, 193–204. [Google Scholar]
  86. Kittel, J.H.; Frost, B.R.T.; Mustelier, J.P.; Bagley, K.Q.; Crittenden, G.C.; Van Dievoet, J. History of fast reactor fuel development. J. Nucl. Mater. 1993, 204, 1–13. [Google Scholar] [CrossRef]
  87. Zinkle, S.J. Fusion materials science and technology research opportunities nowand during the ITER era. Fusion Eng. Des. 2014, 89, 1579–1585. [Google Scholar] [CrossRef]
  88. Zinkle, S.J. Radiation-induced effects on microstructure. In Comprehensive Nuclear Materials; Konings, R.J.M., Ed.; Elsevier: Amsterdam, The Netherlands, 2012; Volume 1, pp. 65–98. [Google Scholar]
  89. Kajita, S.; Sakaguchi, W.; Ohno, N.; Yoshida, N.; Saeki, T. Formation process of tungsten nanostructure by the exposure to helium plasma under fusion relevant plasma conditions. Nucl. Fusion 2009, 49, 095005. [Google Scholar] [CrossRef]
  90. Zenobia, S.; Garrison, L.M.; Kulcinski, G.L. The response of polycrystalline tungsten to 30 keV helium ion implantation at normal incidence and high temperatures. J. Nucl. Mater. 2012, 425, 83–92. [Google Scholar] [CrossRef]
  91. Tanabe, T. Tritium issues to be solved for establishment of a fusion reactor. Fusion Eng. Des. 2012, 87, 722–777. [Google Scholar] [CrossRef]
  92. Zinkle, S.J. Fusion materials science: Overview of challenges and recent progress. Phys. Plasmas 2005, 12, 5. [Google Scholar] [CrossRef]
  93. Dai, Y.; Odette, G.R.; Yamamoto, T. The effects of helium in irradiated structuralalloys. In Comprehensive Nuclear Materials; Konings, R.J.M., Ed.; Elsevier: Amsterdam, The Netherlands, 2012; Volume 1, pp. 141–193. [Google Scholar]
  94. Yamamoto, T.; Odette, G.R.; Kishimoto, H.; Rensman, J.-W.; Miao, P. On the effects of irradiation and helium on the yield stress changes and hardening and non-hardening embrittlement of 8Cr tempered martensitic steels: Compilation and analysis of existing data. J. Nucl. Mater. 2006, 356, 27–49. [Google Scholar] [CrossRef]
  95. Kurtz, R.J.; Alamo, A.; Lucon, E.; Huang, Q.; Jitsukawa, S.; Kimura, A.; Klueh, R.L.; Odette, G.R.; Petersen, C.; Sokolov, M.A.; et al. Recent progress toward development of reduced activation ferritic/martensitic steelsfor fusion structural applications. J. Nucl. Mater. 2009, 386–388, 411–417. [Google Scholar]
  96. Blanchard, J.P.; Martin, C.J.; Tillack, M.S.; Wang, X.R. Ratcheting Models for Fusion Component Design. Fusion Sci. Technol. 2011, 60, 313–317. [Google Scholar]
  97. Majumdar, S.; Kalinin, G. ITER structural design criteria and their extension to advanced fusion reactor blankets. J. Nucl. Mater. 2000, 283–287, 1424–1428. [Google Scholar] [CrossRef]
  98. Bloom, E.E.; Busby, J.T.; Duty, C.E.; Maziasz, P.J.; McGreevy, T.E.; Nelson, B.E.; et al. Critical questions in materials science and engineering for successful development of fusion power. J. Nucl. Mater. 2007, 367–370, 1–10. [Google Scholar] [CrossRef]
  99. Karditsas, P.J. Design issues and implications for structural integrity of fusion power plant components. Fusion Eng. Des. 2009, 84, 2104–2108. [Google Scholar] [CrossRef]
  100. Kasahara, N.; Satoh, K.; Tsukimori, K.; Kawasaki, N. Proposals of guidelines for high temperature structural design of fast reactor vessels. In Proccedings of the ASME Pressure Vessels & Piping Conference, New York, NY, USA, 18–22 July 2010.
  101. Berton, M.N.; Ancelet, O.; Gelineau, O.; Sperandio, M. Presentation of RCC-MRcode 2007 for high temperature reactor and ITER projects: Improvement of the creep fatigue rules. In Proceedings of the ASME Pressure Vessels and Piping Conference, New York, NY, USA, 26–30 July 2009; pp. 567–572.
  102. Zinkle, S.J.; Möslang, A.; Muroga, T.; Tanigawa, H. Multimodal options for materials research to advance the basis for fusion energy in the ITER era. Nucl. Fusion 2013, 53, 104024. [Google Scholar] [CrossRef]
  103. Moreau, R.; Brechet, Y.; Maniguet, L. Eurofer corrosion by the flow of the eutectic alloy Pb–Li in the presence of a strong magnetic field. Fusion Eng. Des. 2011, 86, 106–120. [Google Scholar] [CrossRef]
  104. Zinkle, S.J. Challenges in developing materials for fusion technology—Past, present, and future. Fusion Sci. Technol. 2013, 64, 65–75. [Google Scholar] [CrossRef]
  105. Ihli, T.; Basu, T.K.; Giancarli, L.M.; Konishi, S.; Malang, S.; Najmabadi, F.; Nishio, S.; Raffray, A.R.; Rao, C.V.S.; Sagara, A.; et al. Review of blanket designs for advanced fusion reactors. Fusion Eng. Des. 2008, 83, 912–919. [Google Scholar] [CrossRef]
  106. Giancarli, L.; Chuyanov, V.; Abdou, M.A.; Akiba, M.; Hong, B.G.; Laesser, R.; Pan, C.; Strebkov, H.; the TBWG. Breeding blanket modules testing in ITER: An international program on the way to DEMO. Fusion Eng. Des. 2006, 81, 393–405. [Google Scholar] [CrossRef]
  107. Tillack, M.S.; Turnbull, A.D.; Waganer, L.M.; Malang, S.; Steiner, D.; Sharpe, J.P.; Cadwallader, L.C.; El-Guebaly, L.; Raffray, A.R.; Najmabadi, F.; et al. An evaluation of fusion energy R&D gaps using technology readiness levels. Fusion Sci. Technol. 2009, 56, 949–956. [Google Scholar]
  108. Stambaugh, R.D.; Chan, V.S.; Garofalo, A.M.; Sawan, M.; Humphreys, D.A.; Lao, L.L.; Leuer, J.A.; Petrie, T.W.; Prater, R.; Snyder, P.B.; et al. Fusion nuclear science facility candidates. Fusion Sci. Technol. 2011, 59, 279–307. [Google Scholar] [CrossRef]
  109. Burn, J. Fusion Materials Semiannual Progress Report for the Period Ending June 30, 1998; Oak Ridge National Lab.: Oak Ridge, TN, USA, 1998. [Google Scholar]
  110. Zinkle, S.J.; Eatherly, W.S. Effect of Heat Treatments on the Tensile and Electrical Properties of High-Strength, High-Conductivity Copper Alloys; Fusion Materials Semiannual Progress Report for Period Ending, June 30, 1997, DOE/ER-0313/22; Oak Ridge National Lab: Oak Ridge, TN, USA, 1997. [Google Scholar]
  111. Harkness, J.C.; Spiegelberg, W.D.; Cribb, W.R. Properties and Selection: Nonferrous Alloys and Special-Purpose Materials, Metals Handbook, 10th ed.; ASM International: Materials Park, OH, USA, 1990; Volume 2, p. 403. [Google Scholar]
  112. Murray, H.A. Development of a welding procedure for high conductivity, copper-beryllium alloy C17510. In Proceedings of the 14th IEEE/NPSS Symposium on Fusion Engineering, San Diego, CA, USA, 30 Sepember–3 October 1991; Volume 1, pp. 272–275.
  113. Dieter, G.E. Mechanical Metallurgy, 2nd ed.; McGraw-Hill: New York, NY, USA, 1976. [Google Scholar]
  114. Haasen, P. Physical Metallurgy; Cambridge Univ. Press: New York, NY, USA, 1978. [Google Scholar]
  115. Spitznagel, J.A.; Doyle, N.J.; Choyke, W.J.; Greggi, J.G.; McGruer, J.N.; Davis, J.W. Ion irradiation effects on high strength, high conductivity copper alloys. Nucl. Instrum. Meth. B 1986, 16, 279–287. [Google Scholar] [CrossRef]
  116. Rioja, R.J.; Laughlin, D.E. The sequence of precipitation in Cu-2w/o Be alloys. Acta Metall. 1980, 28, 1301–1313. [Google Scholar] [CrossRef]
  117. Monzen, R.; Seo, T.; Sakai, T.; Watanabe, C. Precipitation Processes in a Cu–0.9 mass% Be Single Crystal. Mater. Trans. 2006, 47, 2925–2934. [Google Scholar] [CrossRef]
  118. Xie, G.; Wang, Q.; Mi, X.; Xiong, B.; Peng, L. The precipitation behavior and strengthening of a Cu–2.0 wt% Be alloy. Mater. Sci. Eng. A 2012, 558, 326–330. [Google Scholar]
  119. Watanabe, C.; Monzen, R. Precipitation process in a Cu-Ni-Be alloy. Diffus. Defect Data B Solid State Phenom. 2011, 172–174, 432–436. [Google Scholar] [CrossRef]
  120. Fabritsiev, S.; Pokrovsky, A.S.; Zinkle, S.J.; Rowcliffe, A.; Edwards, D.J.; Garner, F.A. The effect of neutron spectrum on the mechanical and physical properties of pure copper and copper alloys. J. Nucl. Mater. 1996, 233–237, 526–533. [Google Scholar] [CrossRef]
  121. Fabritsiev, S.A.; Pokrovsky, A.S. The effect of neutron irradiation on the electrical resistivity of high-strength copper alloys. J. Nucl. Mater. 1997, 249, 239–249. [Google Scholar] [CrossRef]
  122. Edwards, D.J. Temperature and Strain Rata Effects in High Strength High Conductivity Copper Alloys Tested in Air; Fusion Materials Semiannual Progress Report for Period Ending, December 31, 1997, DOE/ER-0313/23; Oak Ridge National Lab.: Oak Ridge, TN, USA, 1997; p. 213. [Google Scholar]
  123. Slattery, K. Personal communication; McDonnell Douglas Corp.: St. Louis, MO, USA, 1997. [Google Scholar]
  124. Lucas, G.E. Review of small specimen test techniques for irradiation testing. Metall. Trans. A 1990, 21, 1105. [Google Scholar] [CrossRef]
  125. Sun, Z.; Laitern, C.; Vincent, A. Dynamic embrittlement at intermediate temperature in a Cu–Ni–Si alloy. Mater. Sci. Eng. A 2008, 477, 145–152. [Google Scholar] [CrossRef]
  126. Laporte, V. Mortensen, Intermediate temperature embrittlement of copper alloys. Int. Mater. Rev. 2009, 54, 94–116. [Google Scholar] [CrossRef]
  127. Fenici, P.; Boerman, D.J.; Tartaglia, G.P.; Elen, J.D. Effect of fast-neutron irradiation on tensile properties of precipitation-hardened Cu-Cr-Zr alloy. J. Nucl. Mater. 1994, 212–215, 399–403. [Google Scholar] [CrossRef]
  128. Fabritsiev, S.A.; Pokrovsky, A.S.; Zinkle, S.J.; Edwards, D.J. Low-temperature radiation embrittlement of copper alloys. J. Nucl. Mater. 1996, 233–237, 513–518. [Google Scholar] [CrossRef]
  129. Fabritsiev, S.A.; Pokrovsky, A.S.; Edwards, D.J.; Zinkle, S.J.; Rowcliffe, A.F. Effect of high-dose neutron irradiation on the mechanical properties and structure of copper alloys and Cu/SS joints for ITER applications. J. Nucl. Mater. 2000, 283–287, 523–527. [Google Scholar] [CrossRef]
  130. Rowcliffe, A.F.; Mansur, L.K.; Hoelzer, D.T.; Nanstad, R.K. Perspectives on radiation effects in nickel-base alloys for applications in advanced reactors. J. Nucl. Mater. 2009, 392, 341–352. [Google Scholar] [CrossRef]
  131. Boothby, R.M. Radiation Effects in Nickel-Based Alloys. In Comprehensive Nuclear Materials; Konings, R.J.M., Ed.; Elsevier: Amsterdam, The Netherlands, 2012; Volume 4, pp. 123–150. [Google Scholar]
  132. Zinkle, S.J. Evaluation of high strength, high conductivity CuNiBe alloys for fusion energy applications. J. Nucl. Mater. 2014, 449, 277–289. [Google Scholar] [CrossRef]
  133. Barbato, F.; Scarpellini, D.; Malizia, A.; Gaudio, P.; Richetta, P.; Antpnelli, L. X-ray High-Resolution Spectroscopy for Laser-Produced Plasma. Phys. Procedia 2015, 62, 84–91. [Google Scholar] [CrossRef] [Green Version]
  134. Mattoccia, A.; Bernardone, E.; Digiamberardino, L.; Gaudio, P.; Malizia, A.; Orsini, A. Morphological and structural investigation of (Zn,Al) layered double hydroxides (LDH) nanoplatelets synthesized on aluminum-coated substrates [Studio morfologico di nanostrutture di layered double hydroxides (LDH) depositate su film sottili di alluminio]. Metall. Ital. 2015, 107, 15–22. [Google Scholar]
  135. Kulite Semiconductor Products, Inc., Leonia, NJ, USA. Available online: www.kulite.com/docs/products/XCE-093.pdf (accessed on 1 March 2016).
  136. Benedetti, M.; Gaudio, P.; Lupelli, I.; Malizia, A.; Porfiri, M. T.; Richetta, M. Scaled experiment for Loss of Vacuum Accidents in nuclear fusion devices: Experimental methodology for fluid-dynamics analysis in STARDUST facility. Available online: http://www.wseas.us/e-library/conferences/2011/Corfu/CUTAFLUP/CUTAFLUP-24.pdf (accessed on 19 July 2016).
  137. Bellecci, C.; Gaudio, P.; Lupelli, I.; Malizia, A.; Porfiri, M.T.; Quaranta, R. Loss of vacuum accident (LOVA): Comparison of computational fluid dynamics (CFD) flow velocities against experimental data for the model validation. Fusion Eng. Des. 2011, 86, 330–340. [Google Scholar] [CrossRef]
  138. Bellecci, C.; Gaudio, P.; Lupelli, I.; Malizia, A.; Porfiri, M.T.; Quaranta, R.; Richetta, M. STARDUST experimental campaign and numerical simulations: Influence of obstacles and temperature on dust resuspension in a vacuum vessel under LOVA. Nucl. Fusion 2011, 51, 053017. [Google Scholar] [CrossRef]
  139. Gaudio, P.; Malizia, A.; Lupelli, I. Experimental and numerical analysis of dust resuspension for supporting chemical and radiological risk assessment in a nuclear fusion device. In Proceedings of the International Conference on Mathematical Models for Engineering Science (MMES’ 10), Puerto De La Cruz, Spain, 30 November–2 December 2010; pp. 134–147.
  140. Bellecci, C.; Gaudio, P.; Lupelli, I.; Malizia, A.; Porfiri, M.T.; Quaranta, R.; Richetta, M. Exerimental Mapping of Velocity Flow Field in Case of L.O.V.A. inside STARDUST facility. In Proceedings of the 37th EPS Conference on Plasma Physics, Dublin, Ireland, 21–25 June 2010; pp. 703–706.
  141. Bellecci, C.; Gaudio, P.; Lupelli, I.; Malizia, A.; Porfiri, M.T.; Quaranta, R.; Richetta, M. Characterization of divertor influence in case of LOVA: CFD analysis of STARDUST experimental facility. In Proceedings of the 36th EPS Conference on Plasma Physics, Sofia, Bulgaria, 29 June–3 July 2009.
  142. Ciparisse, J.-F.; Malizia, A.; Poggi, L.A.; Cenciarelli, O.; Gelfusa, M.; Carestia, M.C.; Di Giovanni, D.; Mancinelli, S.; Palombi, L.; Bellecci, C.; et al. Numerical Simulations as Tool to Predict Chemical and Radiological Hazardous Diffusion in Case of Nonconventional Events. Model. Simul. Eng. 2016, 2016, 1–11. [Google Scholar] [CrossRef]
  143. Malizia, A.; Carestia, M.; Cafarelli, C.; Milanese, L.; Pagannone, S.; Pappalardo, A.; Pedemonte, M.; Latini, G.; Barlascini, O.; Fiorini, E.; et al. The free license codes as Decision Support System (DSS) for the emergency planning to simulate radioactive releases in case of accidents in the new generation energy plants. WSEAS Trans. Env. Dev. 2014, 10, 453–464. [Google Scholar]
  144. Camplani, M.; Malizia, A.; Gelfusa, M.; Barbato, F.; Antonelli, L.; Poggi, L.A.; Ciparisse, J.-F.; Salgado, L.; Richetta, M.; Gaudio, P. Image computing techniques to extrapolate data for dust tracking in case of an experimental accident simulation in a nuclear fusion plant. Rev. Sci. Instrum. 2016, 87, 013504. [Google Scholar] [CrossRef] [PubMed]
  145. Gaudio, P.; Maliza, A.; Camplani, M.; Barbato, F.; Antonelli, L.; Gelfusa, M.; Del Vecchio, M.; Salgado, L.; Bellecci, C.; Richetta, M. Shadowgraph technique applied to STARDUST facility for dust tracking: First results. In Proceedings of 3rd International Conference Frontiers in Diagnostic Technologies (ICFDT3 2013), Rome, Italy, 25–27 November 2013; pp. 97–101.
  146. Ciparisse, J.-F.; Malizia, A.; Poggi, L.A.; Gelfusa, M.; Murari, A.; Mancini, A.; Gaudio, P. First 3D numerical simulations validated with experimental measurements during a LOVA reproduction inside the new facility STARDUST-Upgrade. Fusion Eng. Des. 2015, 101, 204–208. [Google Scholar] [CrossRef]
  147. Lupelli, I.; Gaudio, P.; Richetta, M.; Gelfusa, M.; Malizia, A.; Belluzzo, I.; Richetta, M. Numerical study of air jet flow field during a loss of vacuum. Fusion Eng. Des. 2014, 89, 2048–2052. [Google Scholar] [CrossRef]
  148. Benedetti, M.; Gaudio, P.; Lupelli, I.; Malizia, A.; Porfiri, M.T.; Richetta, M. Large Eddy simulation of loss of Vacuum accident in STARDUST facility. Fusion Eng. Des. 2013, 88, 2665–2668. [Google Scholar] [CrossRef]
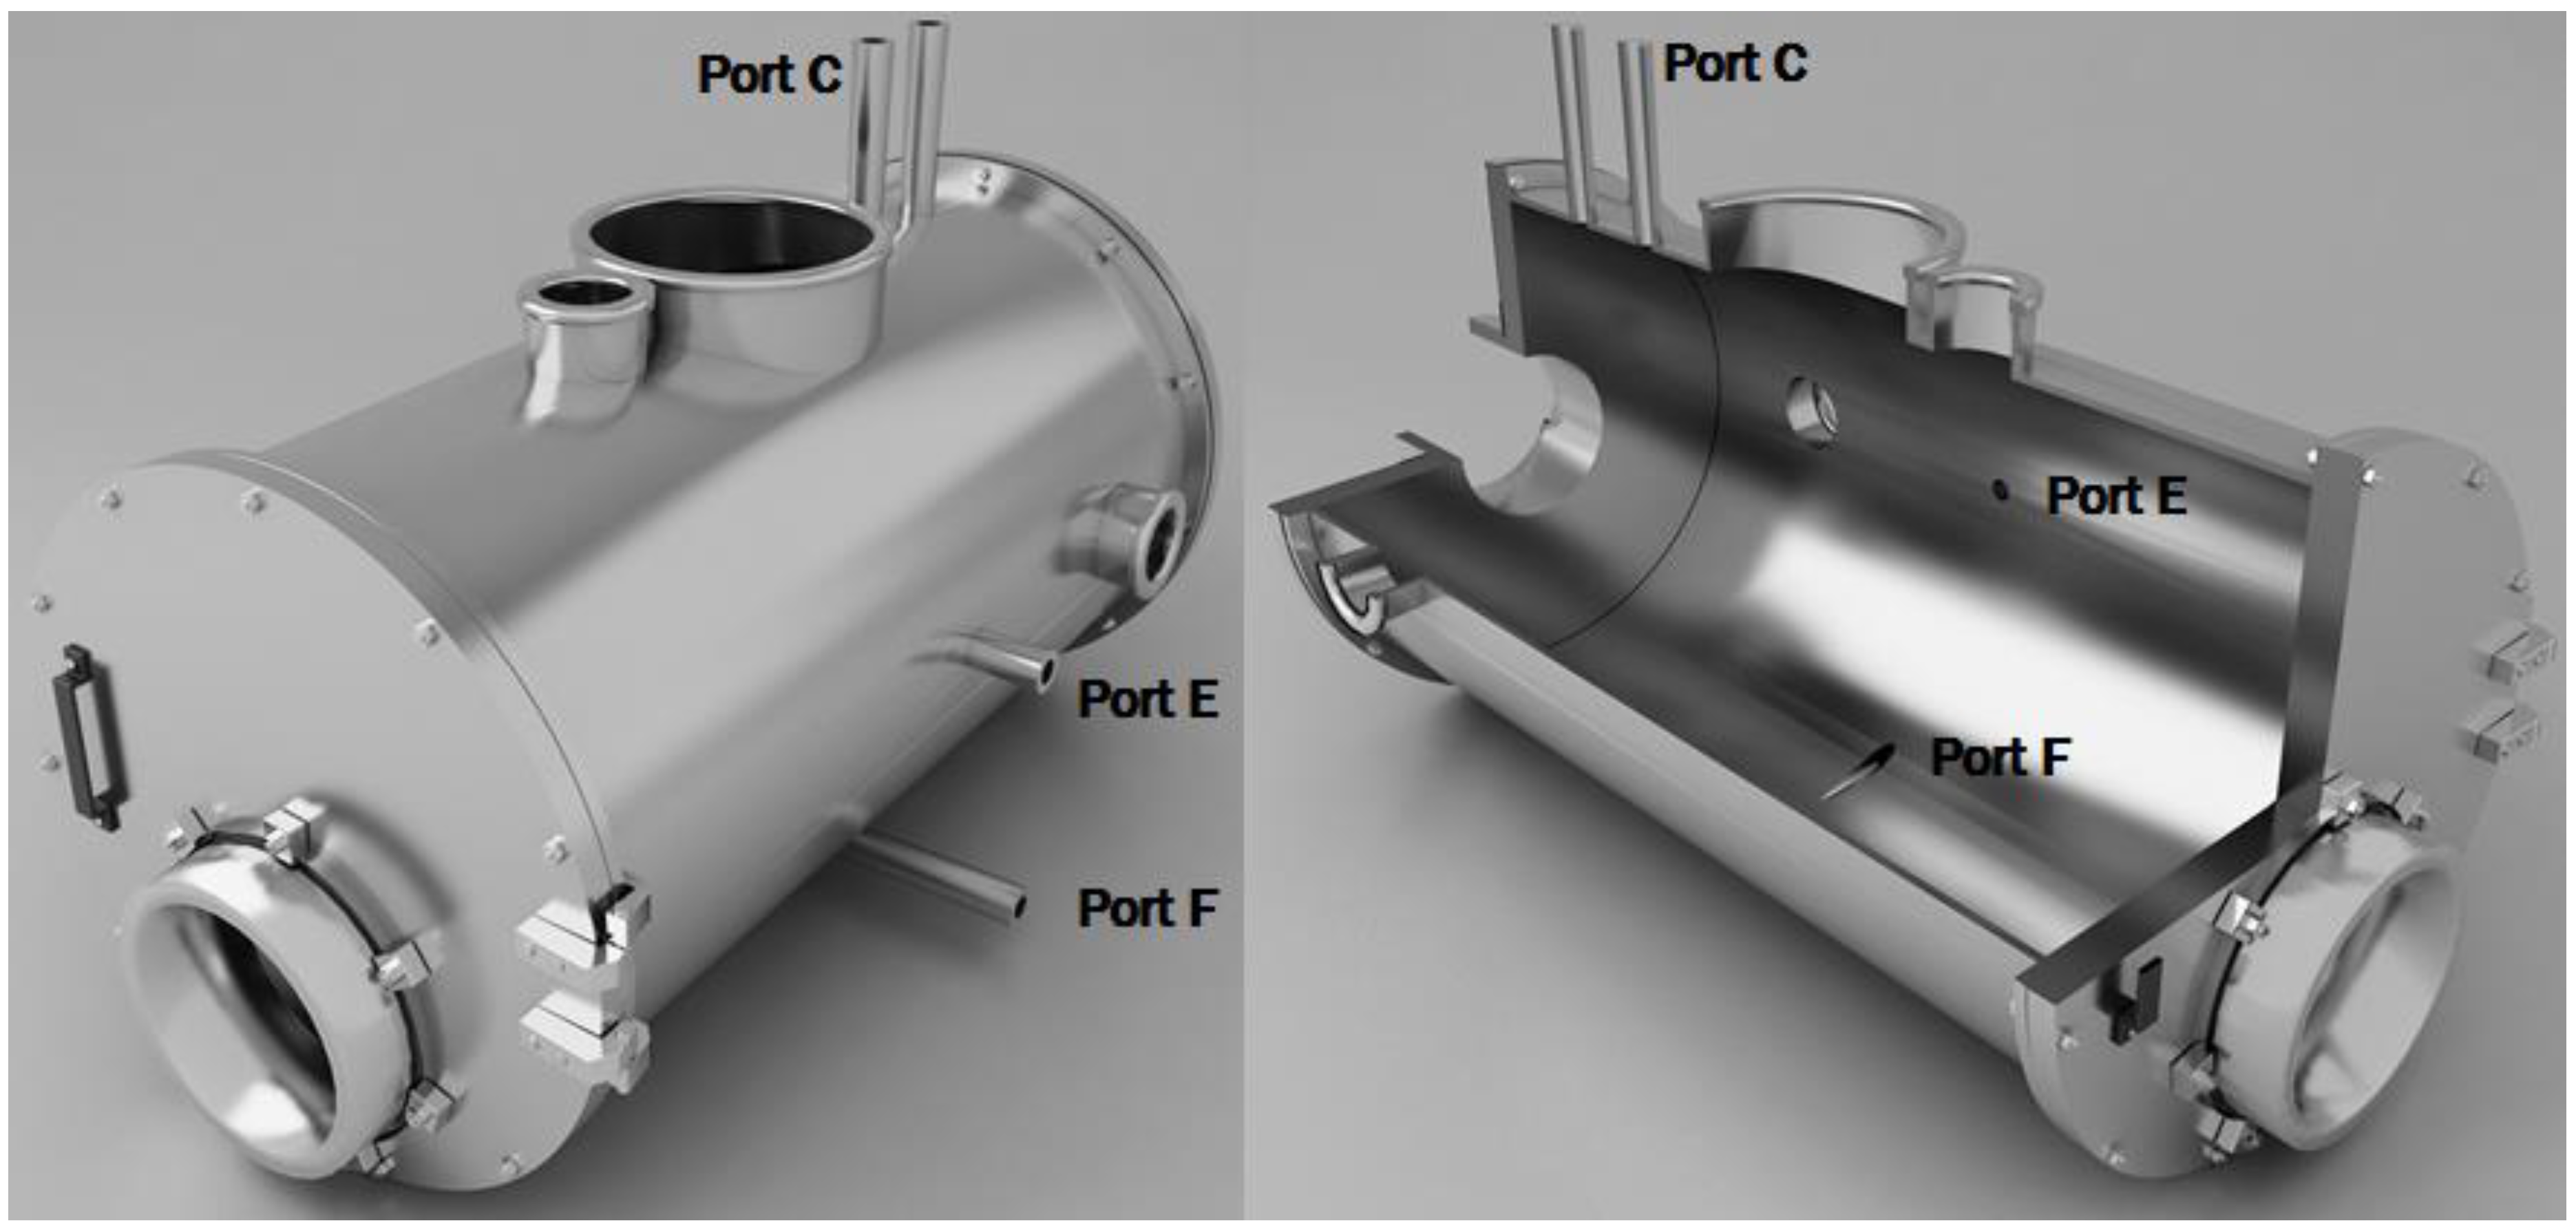
  149. Malizia, A.; Gelfusa, M.; Francia, G.; Boccitto, M.; Del Vecchio, M.; Di Giovanni, D.; Richetta, M.; Bellecci, C.; Gaudio, P. Design of a new experimental facility to reproduce LOVA and LOCA consequences on dust resuspension. Fusion Eng. Des. 2015, 98–99, 2191–2195. [Google Scholar] [CrossRef]
Figure 1. ITER scheme. This figure is taken from [4].
Energies 09 00578 g001
Figure 2. “Calculated chemical gross erosion of the outer ITER divertor target assuming a fixed erosion yield of 1% or the full erosion dependence on energy, surface temperature and particle flux. Calculations are done for a high and a low surface temperature case”. This figure is taken from [18].
Energies 09 00578 g002
Figure 3. Overlap in temperatures for fusion, fission and spallation facilities. This figure is taken from [18].
Energies 09 00578 g003
Figure 4. Overview of the coupled multi-scale phenomenon associated with plasma-materials interactions. This figure is taken from [87].
Energies 09 00578 g004
Figure 5. STARDUST-Upgrade facility rendering, showing ports C, E and F used in the present campaign.
Energies 09 00578 g005
Figure 6. STARDUST-Upgrade facility standard procedures flowchart.
Energies 09 00578 g006
Figure 7. (a) Description of the pressure increase inside STARDUST-U during the air flow inlet at 8 L/min. (b) Description of the temperature variations measured during the experiment. (c) Description of the flow rate variation in the time. (d) Flow rate increase in the early stage from the accident experimental simulation.
Energies 09 00578 g007
Figure 8. (a) Description of the pressure increase inside STARDUST-U during the air flow inlet at 27 L/min. (b) Description of the temperature variations measured during the experiment. (c) Description of the flow rate variation in the time. (d) Flow rate increase in the early stage from the accident experimental simulation.
Energies 09 00578 g008
Figure 9. (a) Description of the pressure increase inside STARDUST-U during the air flow inlet at 40 L/min. (b) Description of the temperature variations measured during the experiment. (c) Description of the flow rate variation in the time. (d) Flow rate increase in the early stage from the accident experimental simulation.
Energies 09 00578 g009aEnergies 09 00578 g009b
Figure 10. Comparison of the three pressure diagrams, 8 L/min (blue diagram), at 27 L/min (red diagram) and 40 L/min (red diagram).
Energies 09 00578 g010
Figure 11. (a) Description of the velocities variation during the whole experiments. (b) A detail of the velocities variation in the first 10 s.
Energies 09 00578 g011
Figure 12. (a) Description of the velocities variation during the whole experiments. (b) A detail of the velocities variation in the first 10 s.
Energies 09 00578 g012
Figure 13. (a) Description of the pressure increase inside STARDUST-U during the air flow inlet at 27 L/min. (b) Description of the temperature variations measured during the experiment. (c) Description of the flow rate variation in the time. (d) Flow rate increase in the early stage from the accident experimental simulation.
Energies 09 00578 g013aEnergies 09 00578 g013b
Figure 14. (a) Description of the pressure increase inside STARDUST-U during the air flow inlet at 40 L/min. (b) Description of the temperature variations measured during the experiment. (c) Description of the flow rate variation in the time. (d) Flow rate increase in the early stage from the accident experimental simulation.
Energies 09 00578 g014
Figure 15. (a) Description of the velocities variation during the whole experiments. (b) A detail of the velocities variation in the first 10 s.
Energies 09 00578 g015
Figure 16. (a) Description of the velocities variation during the whole experiments. (b) A detail of the velocities variation in the first 10 s.
Energies 09 00578 g016
Figure 17. Air inlet with a flow rate of 27 L/min, valve C (a) Mach number after 1 s. (b) Mach number after 3 s. (c) Mach number after 6 s. (d) Mach number after 9 s.
Energies 09 00578 g017
Figure 18. Mach number (a) and pressure (b) versus time, C port, 27 and 40 L/min.
Energies 09 00578 g018
Figure 19. Air inlet with a flow rate of 27 L/min, valve E (a) Mach number after 1 s. (b) Mach number after 3 s. (c) Mach number after 6 s. (d) Mach number after 9 s.
Energies 09 00578 g019aEnergies 09 00578 g019b
Figure 20. Mach number (a) and pressure (b) versus time, E port, 27 and 40 L/min.
Energies 09 00578 g020
Figure 21. Mach number, F port, 27 L/min valve E (a) Mach number after 1 s. (b) Mach number after 3 s. (c) Mach number after 6 s. (d) Mach number after 9 s.
Energies 09 00578 g021
Figure 22. Mach number (a) and pressure (b) versus time, F port, 27 and 40 L/min.
Energies 09 00578 g022
Figure 23. Comparing numerical “numb” and experimental “exp” results for flow rate 27 L/min, valve C, transducers under C, for two different initial vacuum levels “Pin” (300 Pa and 2000 Pa).
Energies 09 00578 g023
Table 1. Composition and results of the screening oxidation tests with different tungsten-based alloys at 1073 K for 3 h. [69].
Alloy (wt.%)Oxidation Test Results
W-Cr14-Ti2Slow oxidation
W-Cr18-Ti2Slow oxidation
W-Cr16-Zr9Film delamination
W-Hf17-Ta15Film delamination
W-Hf32-Ti2Film delamination
W-Ta12-Ti2Film delamination
W-Ta12-Zr5Fast oxidation
W-Zr2-Ti1Film delamination
W-Y7-Cr3Relatively slow oxidation
W-Y24-Cr2Film delamination
Table 2. Characteristics of two W based alloys [49].
MaterialOxidation behaviorThermal ConductivityDBTT
W-Cr10-Si10Lower at 600 °C
Higher at 1000 °C
In comparison with thin films that have the same composition
16 W/m K at 500 °C1000–1050 °C
W-Cr12-Ti2.5Same at 600 °C
Higher at 800 & 1000 °C
In comparison with thin films that have the same composition
50 W/m K at 500–600 °C900 °C
Table 3. Summary of operating parameters for fusion, fission and spallation facilities. This table is taken from [78].
ParameterFusionFission (Generation IV)Spallation
Working fluidH2O, He, Li, PbLi, FLiBeH2O (SC), He, Na, Pb, PbBiHg, PbBi, H2O
Energy<14,1 MeV<1–2 MeV (most n)≤1 GeV (p and n)
He/dpa *100,1–5050–100
StressesModerate, slow varying **Moderate, slow varyingHigh pulsed
* dpa: displacement per atom. ** For normal operation. In a plasma disruption the stresses to the structure are to “high transient”. High, for both fusion and spallation, indicates stresses levels that are near the allowable maximum fraction of yield stresses under applicable engineering design rules.
Table 4. Austenitic stainless steels: spallation, fusion, and Generation IV fission applications. Asterisks indicate conditions set for removal of first target. Later targets may be subjected to higher doses and transmutation levels with experience gained in conditions specific to SNS. This table is taken from [78].
System (Working Fluid)ComponentT °CMax dose, dpaMaximum He, ppmCandidate Alloys
SNS a (mercury)Spallation target module80–1505200316LN
ITER (water)First wall/Blanket100–300375316LN
SCWR bFuel assembly280–62015200Advanced low swelling steels: D9, PN316, HT-UPS
SC c (water)Core support/internals280–5000,1–20250
a Spallation Neutron Source is one-of-a-kind research facility that provides the most intense pulsed neutron beams in the world for scientific research and industrial development. b Supercritical Water Reactor. c Sipercritical.
Table 5. Ferritic/martensitic steels: fusion, and Generation IV fission applications. This table is taken from [77].
System (working fluid)ComponentT °CMax dose, dpaMaximum He, ppmCandidate Alloys
SSTR a (water)First wall/blanket300–550100>1000Low activation 8%–9%Cr ferritic-martensitic steels
HCLL b (He)First wall/blanket270–550100>1000
HPBC c (He)First wall/blanket300–550100>1000
SCWR (SC water)Fuel assembly280–6201520Advanced 8%–12% ferritic-martensitic steels
Core support/internals280–5000,1–2020
FR d (Pb-Bi, Pb)Fuel assembly300–55015015
a Solid State Track Recorders. b Helium-Cooled Lithium–Lead. c Helium Cooled Pebble Bed. d Fast Reactor.
Table 6. Mach number peak of experimental results and Mach number peak of numerical result, during a simulation of 27 L/min flow rate, air from Valve F.
Data fromMach Number Peak
Numerical simulation0.55
Experimental campaign0.4

