
Landscape-Scale Drivers of Resistance and Resilience to Bark Beetles: A Conceptual Susceptibility Model


1
Forest Resources Department, University of Minnesota, Saint Paul, MN 55108, USA
2
Department of Wildland Resources and Ecology Center, Utah State University, Logan, UT 84322, USA
*
Author to whom correspondence should be addressed.
Forests 2021, 12(6), 798; https://doi.org/10.3390/f12060798
Submission received: 3 May 2021
/
Revised: 2 June 2021
/
Accepted: 7 June 2021
/
Published: 17 June 2021
(This article belongs to the Special Issue Ecology and Management of Forest Pests)
Abstract
:Bark beetle (Dendroctonus spp.) outbreaks in the middle latitudes of western North America cause large amounts of tree mortality, outstripping wildfire by an order of magnitude. While temperatures play an important, and direct role in the population dynamics of ectothermic bark beetles, an equally important influence is the nature of the host substrate—the structure and composition of forested communities. For many of the dominant tree species in the western United States, “hazard” indices have been developed for specific bark beetles, which generally include three key variables—host tree size, absolute or relative density of the stand, and percentage of host composition. We provide a conceptual model to apply these three variables across forest ecosystems and bark beetles that shifts the thinking from a species–specific model to a model which focuses on the underlying ecological factors related to bark beetle outbreak susceptibility. We explored the use of our model across multiple scales using the Forest Inventory and Analysis database: Interior West, USA; the states of Colorado and Arizona; and specific national forests within Arizona that are implementing a large-scale restoration effort. We demonstrated that across the Interior West and Colorado, the vast majority of forests have moderate to high susceptibility to bark beetles. Our conceptual model maintains the simplicity of previous “hazard” models but acknowledges the need to consider scale when managing bark beetles. It also shifts the management approach from resistance thinking to the development of “associational resilience”, where the focus is not on any one individual stand or area but the longer-term perspective of forest persistence across the landscape.
1. Introduction
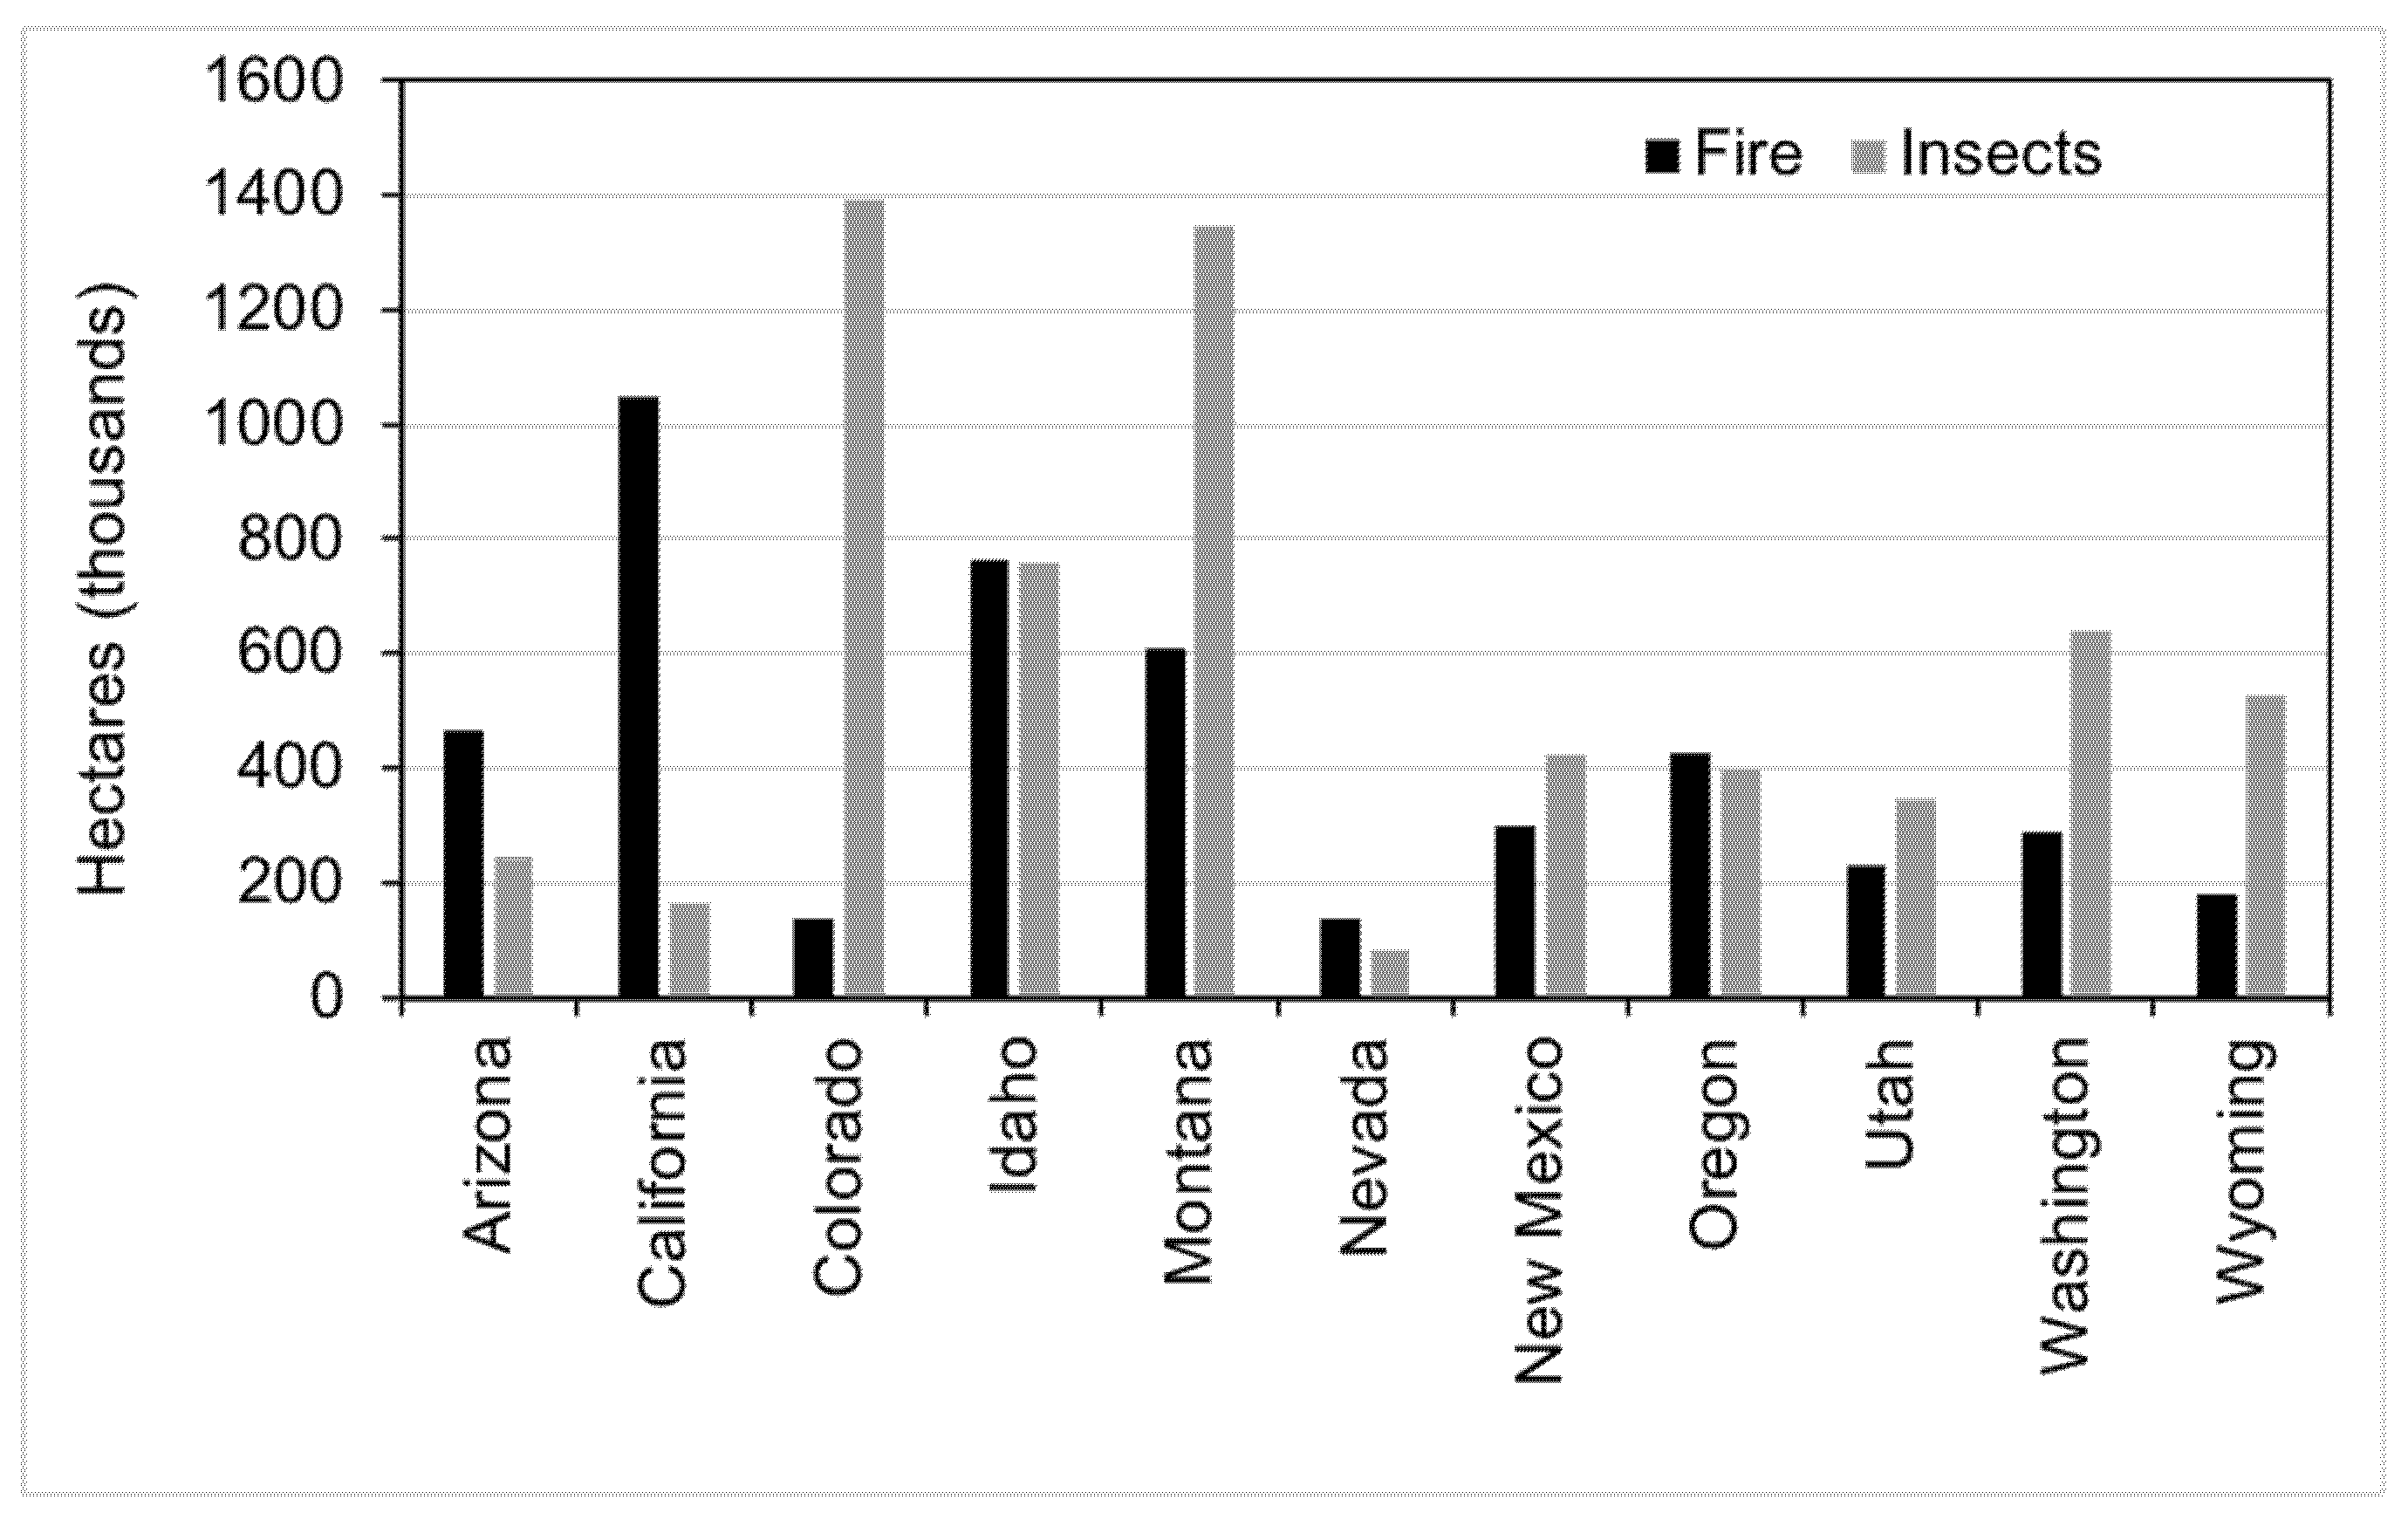
Native bark beetles (Dendroctonus spp.) are disturbance agents that drive stand development and dynamics across all the important coniferous forested systems of North America [1]—and have probably existed in this capacity for millennia [2]. European colonization and western expansion in the US drastically altered landscape-level disturbance dynamics due to the extractive practices related to logging [3], such as wood for mine props, tie-hacking for railroad construction [4], and also fire exclusion [5]. The simplification of structure (e.g., age structure; Figure 1) and species composition across western US landscapes have been implicated as factors contributing to the “age of mega-fires” [6], but may also be a factor in the recent, unprecedented mortality caused by epidemic bark beetle populations [7,8]. The recent severity of mortality attributable to bark beetles is extraordinary; more than 6 million hectares in the last ten years in the conterminous western US (Figure 2), and the volume of mortality far exceeds that caused by fire in forests over the same time-period [9,10,11,12].
Because of the huge ecological and economic importance of Dendroctonus spp., they have received considerable attention from forest entomologists, applied forest ecologists and forest managers, resulting in a rich literature that spans more than 100 years [14,15,16]. During the middle of the 20th century, when forest management practices focused on the concept of sustained yield [17], bark beetle research focused on characterizing and quantifying susceptibility of particular host tree species to their associated Dendroctonus spp. “pest” to reduce timber loss (Table 1). Susceptibility is typically associated with stand structure, tree species composition, and stand density. A natural resource manager could manipulate one or more of these variables through forest management practices to reduce susceptibility (i.e., conditions conducive for building populations of bark beetles within the stand) with the idea that they were creating beetle-resistant stands. Here, we characterize resistance as the influence of stand structure and composition on disturbance severity [10]; a highly resistant stand is expected to limit the growth of beetle populations from endemic to epidemic, and therefore have minimal host mortality.
As land management policy and practices shifted from sustained yield to multi-use and multi-value, land managers are increasingly trying to balance multiple objectives, including sustaining or increasing landscape resilience. But what is a resilient landscape? Resilience at the landscape level can be characterized as the influence of the disturbance on future structure and composition [10]. Resilient ecosystems are predicted to maintain greater ecosystem functionality as climate change influences their composition and structure [53,54]. Rehfeldt [55] predicts that by the end of the century (2100), almost half of the current coniferous vegetation within the western US will have a novel climate profile. This could result in novel species assemblages and will require increased flexibility in forest management, including assessing and quantifying susceptibility to bark beetles. Natural resource managers may need to shift from stand-level [56] approaches regarding the susceptibility of individual tree species for a particular forest type and Dendroctonus spp., to assessing the susceptibility of the landscape, which will span multiple host tree species and multiple Dendroctonus spp. The overarching goal of this paper is to use the existing, extensive literature on Dendroctonus spp. and their host species to re-characterize individual species, stand-level models as a more general multi-species, landscape-level assessment model. We integrate existing bark beetle models into a conceptual landscape model by generalizing important shared characteristics. The landscape-level bark beetle conceptual model provides a broad framework based on key ecological relationships between bark beetles and host species. The result is a conceptualization that can be used across forest types and bark beetle species. We demonstrate the conceptual model using three different scales of landscapes generated from the Forest Inventory and Analysis data. The model allows resource managers the flexibility to influence future bark beetle population dynamics through specific approaches that build resistance and/or resilience to outbreaks, for example, by promoting multiple species and structural complexity across forested landscapes.
2. Ecology of Bark Beetles
While there are dozens of Dendroctonus spp., currently, only a handful develop into epidemic populations that result in large mortality events for their hosts in the form of outbreaks. Normally, at endemic population levels, Dendroctonus spp. exhibit limited activity and have been described as a “natural thinning agent”—an important part of stand development [57,58]. Bark beetles are typically capable of rearing a brood over a 1–3-year life-cycle, e.g., generally one year for Dendroctonus ponderosae Hopkins (mountain pine beetle), and typically two years for Dendroctonus rufipennis Kirby (spruce beetle). It is possible, however, the percentage of spruce beetle that can rear a brood in just one year can increase in warm years [59], and that warmer growing season temperatures may allow the mountain pine beetle to rear two broods in a year [60]. To find susceptible hosts, early in the growing season beetles take flight; upon testing hosts that are desirable brood trees, they elicit congregation pheromones that coordinate more beetles in a “mass attack”. It is at this point that a response in trees (i.e., sap flow) can be induced, increasing production of traumatic resin ducts [61], and pioneering beetles can potentially be “pitched out”. If bark beetles succeed and are in large enough numbers, they begin releasing anti-aggregation pheromones to repel any more beetles. There is extensive research related to pheromones and bark beetle chemical ecology and management ([62] and references therein).
After successfully boring beneath the bark, females excavate galleries, mate, and lay their eggs [63]. Once the eggs hatch, the larvae further excavate within the phloem, in a direction roughly perpendicular to the maternal gallery, i.e., horizontally; it is by this process that bark beetles and their fungal associates essentially girdle the tree, cutting off the connection between the crown and roots, resulting in mortality of the tree [64]. Newly emerged beetles leave the tree and look for a new host to repeat the life cycle. As a bark beetle moves throughout its life cycle, other insects, pathogens, and animal species can influence brood development. Beauvaria bassiana is a fungus that has been utilized as a control for multiple bark beetles (e.g., Ips typographus) and has been documented to result in mortality of D. ponderosae when the beetle is at epidemic populations [65]. Thanasimus undatulus has been observed to prey on multiple Dendroctonus species, including D. ponderosae, D. rupipennis, and D. pseudotsugae. Finally, multiple species of bird and small mammals prey on bark beetles in limited numbers [66,67,68]. However, when at epidemic levels, predatory insects, fungi, and other species have a limited impact on the population dynamics [65].
Successful brood production that leads to increasing population numbers is facilitated by a combination of factors that include optimum temperature conditions and abundant suitable hosts for the bark beetles [58]. Warmer summer temperatures that lengthen flight times and increase the chance of shortening life cycles is one mechanism that can increase beetle brood production [62]. Ameliorated winter-time minimum temperatures may also result in higher overwinter survival in beetles [69]. A final factor is the availability and susceptibility of suitable host material, which directly relates to stand conditions (e.g., the density and size of suitable hosts); the availability and susceptibility of suitable hosts form the foundation of stand-level hazard models.
3. History and Ecological Underpinnings of Stand-Level Hazard Models
Natural resource managers have long observed the influence of stand structure and tree species composition on susceptibility to the important North American bark beetles. An early monograph on North American Dendroctonus spp. [14] described important life history characteristics and framed the “... beetle problem as important as the fire problem” (Figure 2). In addition to providing recommendations regarding the potential for direct control of bark beetle populations (e.g., creation and treatment of trap-trees), Hopkins [14] suggested that a forest stand will have a lower susceptibility to attack “in areas of vigorous young to mature growth under some system of forest management”. A hundred years later, this key piece of literature has laid a strong foundation in applied research on bark beetle dynamics and management. From this body of research, there is a consensus that targeted manipulation of stands can reduce both the susceptibility to and the impact of bark beetle attacks [70,71]. For most of the host tree species-Dendroctonus spp. systems, forest entomologists have developed relatively simple models which rate the susceptibility of individual stands to bark beetle attack (Table 2). Individual models may be referred to by the authors as assessing hazard, risk, or susceptibility. This can and does create confusion in the terminology. Bentz and colleagues [34] argued for clear statements of terminology. We explicitly avoid the use of the terms hazard and risk. Instead, we will use susceptibility and its inverse—resistance. In using the term susceptibility, we maintain the focus on the original intent of the models, that beetle populations can be indirectly controlled through the direct manipulation of forest structure and composition. It is also through indirect methods that natural resource managers can have the opportunity to influence susceptibility and resilience for the larger landscape.
While each of the susceptibility models are unique to the individual Dendroctonus spp. and their immediate host tree, there are underlying similarities (Table 2). This is not surprising given commonalities within the Dendroctonus genus and life history characteristics of conifer species in North America [63,72,74]. The susceptibility models were developed at the stand level and basically share a focus on three metrics that allow for the potential building of bark beetle populations: (1) average diameters of the host species; (2) density of the stand; and (3) composition of tree species. These metrics are easy to quantify, commonly measured during a standard forest inventory, can be applied to management at the stand-level, and generally capture the underlying ecological controls on bark beetle population dynamics. For example, a larger host size is associated with increased phloem thickness and increased brood success [29]. Additionally, a high host percentage in a given stand will decrease associational resistance, increasing the probability that a bark beetle is able to find a suitable host tree [75]. Finally, absolute or relative stand density relates to the overall amount of resources or growing space available to individual trees, with implications for an individual tree’s ability to defend itself against bark beetle attacks [76]. While each individual factor can influence bark beetle dynamics, it is the combined, additive effect of all three factors that influence the likelihood of large increases in beetle populations. In combination, these structural and compositional factors ultimately dictate stand-level resistance to bark beetles. For a stand to be truly resistant to any given bark beetle, it would need to be composed of trees that were below the size threshold (small diameter) for beetle use, such as recently regenerated stands [76]. In the short term, young stands exhibit resistance to building bark beetle populations [77]. Another way to build resistance is to focus on species composition or to transition the stand towards a different forest community (e.g., conifers transitioning to hardwoods). However, if management activities focus on reducing the susceptibility of one or two of the factors (i.e., thinning to reduce density), then the current models will give a false sense of resistance. This false sense of resistance has been confirmed by Bentz and colleagues [34], who observed that the stand-level ratings had a weak predictive ability because they do not include the influences of the spatial nature of both bark beetle populations and stand conditions. The models also fail to capture important landscape dynamics of bark beetle populations; are bark beetle populations in epidemic phases elsewhere in the landscape? (Figure 3). Natural resource managers are increasingly working at multiple scales, ranging from a few hectares to thousands of hectares. New technologies, especially remote sensing tools, have allowed landscapes to be mapped and modeled, and bark beetle susceptibility to be predicted (as reviewed by [78]). However, as the complexity of the model increases, so do the data requirements and the underlying assumptions, reducing the potential ease of use by natural resource managers. Thus, the appeal of the stand-level susceptibility models and the need for a landscape-level model.
4. Landscape Susceptibility Index: Conceptual Model
The individual stand-level susceptibility models essentially characterize the available resources or growing space in terms of stand structure and composition. Utilizing this same concept, these three components can be broadened, or generalized, to be applicable across forest types; the three components of the model are average tree size (diameter), density, and species composition (Table 3). The landscape-level bark beetle conceptual model broadens the characterization from the stand to the larger landscape (i.e., multiple stands, Figure 3), maintains a focus on susceptibility related to composition, structure, and diversity (i.e., tree species composition), and is quantified in a landscape susceptibility index (LSI). Focusing on these components maintains the ease of interpretation and utilization by resource managers. Additionally, unlike temperature and precipitation, natural resource managers have the ability to manage or manipulate composition, structure, and diversity at the stand- and landscape-levels, allowing this information to be translated into forest management prescriptions.

Table 3.
The framework for the conceptual landscape model, which maintains the same approach of the individual species susceptibility models, but instead of working stand by stand, our model incorporates the percentage of the area or landscape (two stands, a landscape, a state, etc.) in calculating the susceptibility. Each of the variables are rated as a 1, 2, or 3 and then multiplied by the percent of plots or area to create a landscape susceptibly index (LSI), allowing the comparison across scales while still being able to be utilized at the individual stand level. An example calculation is completed for Colorado (Table 4) this can then be compared against Arizona (Table 5). The model highlights that manipulating any one variable will influence resilience but it is the combination of all three variables which confer resilience.
| Susceptibility | Stocking (Relative Stand Density Index) * | Structural Susceptibility (QMD cm) | Tree Species Richness (Count of Species) |
|---|---|---|---|
| High (3) | >35% | >25.4 cm DBH | 1 |
| Medium (2) | 15.1–35% | 12.71–25.4 cm DBH | 2 |
| Low (1) | 0–15% | 2.54–12.7 cm DBH | >3 |
* Relative stand density was calculated based on the summation method (Shaw, 2000) and using forest type-specific maximum SDI (FIA data on file). Structural susceptibility is the quadratic mean diameter (QMD) for trees with a DBH > 2.54 cm. Richness is a count of the number of tree species within a plot.
5. Material and Methods
5.1. Testing the Conceptual Model
We demonstrate the conceptual model for multiple, hierarchical spatial extents utilizing the Forest Inventory and Analysis (FIA) database. The FIA program collects and compiles a national-scale forest inventory database across all forests regardless of ownership, to assess current forest conditions and facilitate the projection of forest attributes across space and through time. Data are collected using a three-phase sampling design; see [13] for additional details. Data collected on the FIA plots are spatially explicit and geographically unbiased, where each plot represents approximately 2428 hectares. The scale of our analysis includes the Interior West, individual states within the Interior West (Arizona (AZ) and Colorado (CO)), individual national forests within one state (AZ), and individual national forests undergoing restoration efforts within Arizona (Four Forest Restoration Initiative (4FRI)). We define the Interior West as the eight interior western states (AZ, CO, ID, MT, NM, NV, UT, and WY). Within this larger extent, we further examined two states: Colorado and Arizona, where there are 9.9 million and 8.3 million hectares of forestland, respectively [12,79]. Forests in both Arizona and Colorado have been recently impacted by large bark beetle outbreaks (e.g., [80]), and continue to be shaped by increased bark beetle activity. Additionally, both states could be considered to be exhibiting a fire deficit, with state-level rotation levels exceeding 200 years [81]—which only adds to the number of aging stands. Finally, both Arizona and Colorado are also currently assessing and/or implementing large landscape-level restoration initiatives [81,82,83] that might be enhanced through an assessment of forest susceptibility. Specifically, we assessed the national forests which are part of the Four Forest Restoration Initiative (4FRI) in the context of all the national forests in Arizona. The 4FRI is one of the largest restoration initiatives, with plans to treat over 1 million hectares of forest land across four national forests (Apache-Sitgreaves, Coconino, Kaibab, and Tonto); treatments began in 2010. We assessed susceptibility (i.e., calculate the LSI, see below) individually for each national forest, across all four national forests, and for the entire state of Arizona. Exploring the LSI outputs from our model across multiple scales will allow us to explore commonalities, differences, and possible emergent patterns.
5.2. FIA Dataset
A full cycle of the Forest Inventory and Analysis data (2006–2015) was used to explore our model. For each plot (regardless of forest types) with a homogenous condition (i.e., CONDPROP = 1), we calculated the three metrics (stand structure, stand density, and stand composition) which are components of our LSI. Specifically, stand structure was quantified using the quadratic mean diameter (QMD) for all trees greater than 2.54 cm in DBH (diameter at breast height). Structural susceptibility was binned into three classes: low (2.54–12.7 cm DBH), medium (12.71–25.4 cm DBH), and high susceptibility (25.4+ cm DBH). Stocking was represented by relative stand density index (SDI) and was calculated based on the summation method [84], and using forest type-specific maximum SDI (FIA data on file). Susceptibility with respect to density was binned into low (0–15%), medium (15.1–35%), and high density (35%+) based on well-known competitive interactions over stand development [85]. The composition was characterized as richness, calculated as the number of species greater than 2.54 cm in DBH on an FIA plot. Susceptibility in species richness was binned using the categories: low (richness = 3+); medium (richness = 2); and high susceptibility (richness = 1, Table 3).
5.3. Conceptual Model Testing
To quantify the landscape susceptibility index (LSI), we combined the three generalized metrics into an index scaled by relative susceptibility (i.e., low, medium, and high) for regional-, state-, and national forest-level assessments. A numeric value was assigned to each category, i.e., low is 1, medium is 2, and high is 3 (Table 3). The percentage of each component is then calculated as well (e.g., percent of the landscape with low species richness (Table 4). The numeric value from the LSI (1, 2, or 3) for each component is multiplied by the percentage (Table 4) and then summed. Summing the three values assumes the effects of these ecological component is additive, and results in an LSI that ranges from 3 to 9 (Table 4). The assumptions of the additive nature of these components follows previous assumptions of susceptibility models; additionally, the ecological underpinning of this assumption is that it is not any one component that shifts bark beetles from endemic to epidemic but the summation of all three. A landscape with a composite score of 3 has a low susceptibility to bark beetles. A landscape with a composite score of 9 has high susceptibility. The LSI uses the simplified but ecologically-based stand structural and compositional attributes—as opposed to forest type- or disturbance type-specific scores, which greatly simplifies the generality and ease of application. Finally, the use of percentages allows the LSI to be used as multiple scales. An individual stand would have a score of 100% of the area represented by each of the components; vice versa, a large region or state (Table 4) is composed of many stands that could be accessed with the sample model. Time is not an explicit component of our model.
Table 4.
Example calculation of the LSI for Colorado (n = 3656) across the three component classes. First, the percent of each component on the landscape is calculated and then scored to allow for the summation of the total. It should be noted that the total of the percentages may not add to zero due to unstocked stands. The total LSI ranges from 3 to 9, with 3 being the lowest susceptibility and 9 the highest. By incorporating a percentage approach, the LSI is saleable and comparable (see Table 5 for example).
| Percentage of Plots | Component | Low | Medium | High |
| Stocking (relative stand density index) | 14.9% | 34.8% | 48.6% | |
| Structural Susceptibility (QMD) | 6.7% | 52.3% | 40.9% | |
| Richness (count of tree species) | 38.5% | 39.3% | 22.2% | |
| Scoring of the LSI | ||||
| Stocking (relative stand density index) | (0.149 × 1) = 0.149 | (0.348 × 2) = 0.696 | (0.486 × 3) = 1.458 | |
| Structural Susceptibility (QMD) | (0.067 × 1) = 0.067 | (0.523 × 2) = 1.046 | (0.409 × 3) = 1.227 | |
| Richness (count of tree species) | (0.385 × 1) = 0.385 | (0.393 × 2) = 0.786 | (0.222 × 3) = 0.666 | |
| Total LSI | (0.149 + 0.696 +1.458 + 0.067 + 1.046 + 1.227 +0.385 +0.786 +0.666) = | 6.48 | ||
6. Results
6.1. Interior Western States
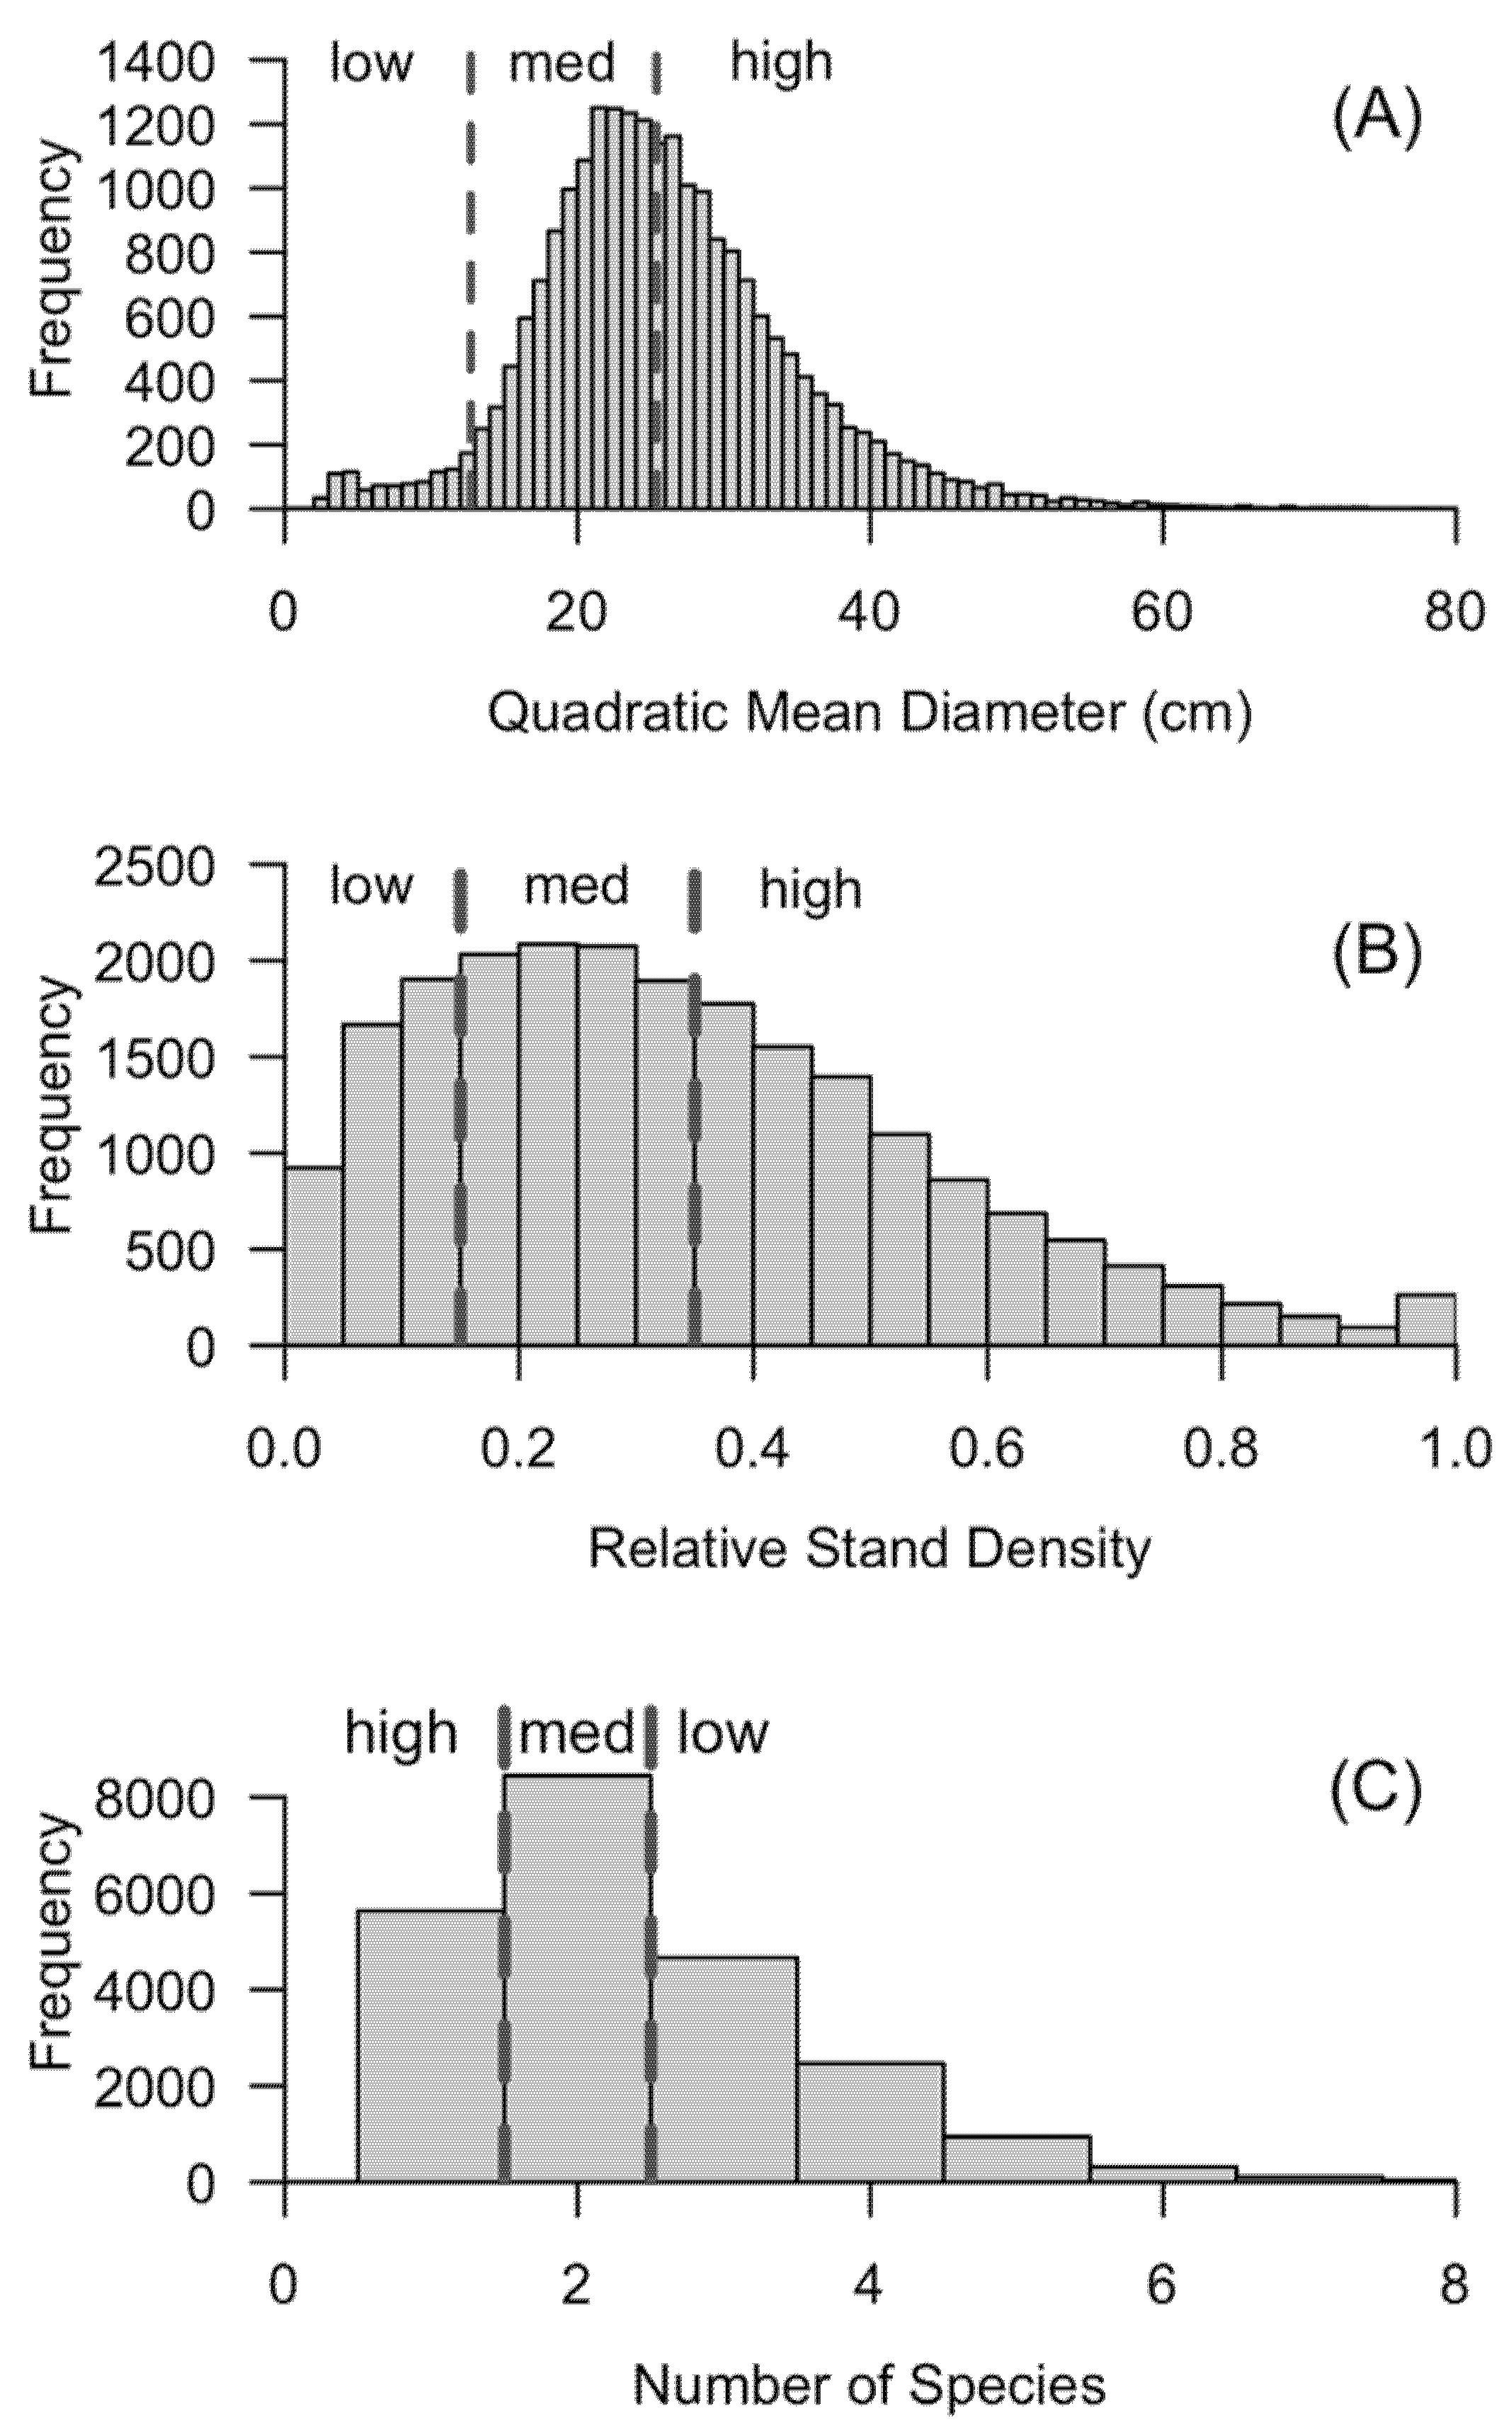
The history of European colonization and settlement-era exploitation was clearly evident in the pronounced peak in the stand age class of western US forests approximately 100 years ago (Figure 1). Extensive extraction, in combination with intense fire suppression that began in the early 20th century, has led to a paucity of age-class diversity across the west. The large peak in the 0–20-year age class indicated a new cohort of “nonstocked” areas (i.e., inventory plots that are forested, but do not yet have trees greater than the 2.54-cm diameter cutoff to be tallied); many of these forest areas are a result of recent wildfires and bark beetle-caused mortality. The imbalance in age-class distribution (e.g., Figure 1) provided context for the strong unimodal distribution of stand structure (QMD) across the Interior Western states (Figure 4A), and as a result, there was a substantial deficit in small diameter stands. At the landscape-level this equated to a smaller proportion of low-susceptibility stand structures. Overstory species richness and relative stand density were more evenly distributed (Figure 4B,C). Median overstory tree species richness in the Interior West was two, with very few plots containing more than four overstory species (Figure 4B). The highest density of plots peaked around 0.2 or 20% for relative density and there was a gradual decline in the number of plots in each category as relative density increased (Figure 4C).
6.2. Colorado
The forests of Colorado provided a stark example of the aging nature of western US forests. Nearly half, or 49% of Colorado forests exhibited high relative stand density, while only 15% of forests had low stand density (Table 4). Similarly, for the variable of structure (QMD) only 7% of the plots were in the low susceptibility class, while 52% and 41% were in the medium and high classes, respectively. The distribution of richness was more closely balanced, 22% in the low (three or more species) and 39% in both medium and high susceptibility classes. The calculated LSI for Colorado was 6.48, which equates to moderate risk largely due to the current structure and stand density. To increase the number plots with a rating of one for stand density by just a third, decreasing susceptibility to bark beetles, would require forest management activities (thinning or regeneration harvests) on 651 FIA plots in the state, which is representative of over 1.5 million hectares!
6.3. Arizona
Across all forests in Arizona, relative density and species richness was fairly evenly split between low, moderate, and high susceptibility resulting in an LSI of 6.65, slightly greater than the LSI of Colorado (6.48, Table 5). At the state level, there were very few stands with QMDs associated with low susceptibility; the vast majority of plots had moderate or high susceptibility (Table 5). However, when assessing the National Forests that compose the 4FRI restoration initiative and each individual national forest within 4FRI, there is a decrease in the number of low-susceptibility stands for metrics of relative SDI and species richness (Table 5). The LSI for the 4FRI restoration initiative was 6.86, representing a landscape with moderately high susceptibility to bark beetles. Each of the individual National Forests within the 4FRI except for the Tonto National Forest have LSI values above the state LSI value. Exploring each of the individual components of the models allow comparisons. For example, while approximately 25% of the forests in the state had low relative SDIs, none of the four National Forests that make up the 4FRI project were characterized by a majority of low-susceptibility stands (Table 5). In fact, all of them had at least 50% of the plots in the high-susceptibility group (Table 5). Similarly, about a third of the forests in the state had three or more species in a plot. However, only the Coconino National Forest had a similar distribution of plots to the state for the category of species richness. Much like the Interior West generally, across Arizona, the 4FRI restoration initiative, and each of the individual National Forests there are very limited (<3%) small diameter, young stands (Table 5).
Table 5.
Example of the scalability and the comparability of LSI the state of Arizona, the Four Forest Restoration Initiative (4FRI), and each of the National Forests within 4FRI. The of the landscape area for each of the three components was calculated utilizing the Forest Inventory Analysis (FIA) Database with the number of plots noted; the percentages may not add up to zero because of non-stocked stands. The LSI was calculated from the percentages and ranges from 3 to 9.
| Arizona (n = 2986) LSI = 6.65 | |||
| Component | Low | Medium | High |
| Relative stand density index | 26.8% | 33.6% | 36.9% |
| Quadratic mean diameter | 2.0% | 37.6% | 60.3% |
| Richness (number species) | 31.2% | 35.8% | 33.1% |
| Four Forest Restoration Initiative (4FRI) (n = 1109) LSI = 6.86 | |||
| Component | Low | Medium | High |
| Relative stand density index | 16.8% | 34.9% | 46.5% |
| Quadratic mean diameter | 2.7% | 42.8% | 54.4% |
| Richness (number species) | 40.9% | 34.1% | 25.0% |
| Apache-Sitgreaves National Forest (n = 336) LSI = 6.67 | |||
| Component | Low | Medium | High |
| Relative stand density index | 14.3% | 33.6% | 50.3% |
| Quadratic mean diameter | 3.0% | 44.0% | 52.7% |
| Richness (number species) | 42.6% | 29.5% | 28.0% |
| Coconino National Forest (n = 268) LSI = 6.72 | |||
| Component | Low | Medium | High |
| Relative stand density index | 22.4% | 34.0% | 41.8% |
| Quadratic mean diameter | 3.4% | 38.8% | 57.8% |
| Richness (number species) | 31.7% | 35.1% | 33.2% |
| Kaibab National Forest (n = 267) LSI = 6.79 | |||
| Component | Low | Medium | High |
| Relative stand density index | 13.5% | 37.8% | 47.6% |
| Quadratic mean diameter | 1.9% | 43.4% | 54.7% |
| Richness (number species) | 42.3% | 38.2% | 19.5% |
| Tonto National Forest (n = 238) LSI = 6.42 | |||
| Component | Low | Medium | High |
| Relative stand density index | 17.6% | 34.5% | 45.4% |
| Quadratic mean diameter | 2.5% | 45.0% | 52.5% |
| Richness (number species) | 47.5% | 34.9% | 17.6% |
7. Discussion
As climate change and the compounding interactions between climate change and disturbance dynamics continue to influence forest ecosystems locally, regionally, and globally [86], resource managers will need to assess the potential to manage for resistance, increase resilience, or shift to a transition strategy to maintain ecological function [16,53]. Natural resource managers will need to continue to work at multiple scales, which represents a shift in the focus of forest management, from individual stands (the current administrative and operational unit) to landscapes [56]. Landscape restoration projects are becoming increasingly common [81,87]. However, as the unit of management shifts to better account for the complexity of disturbance dynamics, the tools to assess those dynamics must also evolve. The proposed landscape bark beetle susceptibility model facilitates that shift and solves two of the largest limitations of previous susceptibility models -scale and usability. Our landscape susceptibility conceptual model recognizes the additive importance of landscape-level features in the building of epidemic beetle populations [88]. A second improvement is the ability of this model to be scaled across forest types and Dendroctonus spp. as previous models focused on individual forest types and individual bark beetle species. While forest types may shift as individual species adapt to changing conditions—creating potentially novel forest communities [53], our model is flexible and adaptable to these changes because it captures the underlying ecological components that help drive bark beetle dynamics. With this model, quantitative or qualitative thresholds can be used to calculate the proportion of the landscape at various levels of susceptibility with respect to each of the three components.
Accounting for all three basic components in the conceptual model will provide insight into landscape-level susceptibility, and thus allow natural resource managers the potential to build “associational resistance”. Associational resistance may be impractical in the face of a building bark beetle population levels, especially if one cannot see the landscape for the stands. Therefore, forest managers should focus on building “associational resilience”, where the focus on the landscape shifts us away from what will happen in a particular (i.e., highly susceptible) stand, to the longer-term, larger-scale, perspective of forest persistence across the landscape. For example, management that decreases the percentage of the landscape in high, and medium risk classes and increases the amount of the landscape in medium and low risk classes serves as one possibility for building associational resilience.
By generalizing the host characteristics that influence the likelihood of bark beetle transitions from endemic to epidemic, we have simplified the recognition of susceptibility across landscapes without sacrificing the ease of use which drew natural resource managers to stand-level models over the last century. The LSI takes advantage of some host susceptibility traits that all aggressive, native Dendroctonus spp. in western North America respond to—tree host size, density, and tree species composition [63]. Focusing on a multi-stand scale does not preclude the natural resource manager from taking into consideration individual species or stands of special value, which is often an important part of management. This can still be calculated using our model. What it does provide is a tool to characterize more easily much larger areas that would otherwise need to be treated as individual units. This has utility not only for silvicultural prescriptions but in a more general way to facilitate decision-making at the planning stage of forest management [81]. When assessing a landscape, whether it be a project area, a National Forest or a State, its LSI is the first indication of relative susceptibility. This should cue the natural resource manager to dig deeper, to see which components are having the greatest influence on the LSI? For example, if a landscape has an LSI of 7 and the individual components include a score of 3 for relative density, 1 for species richness, and 3 for stand structure (QMD), the manager can consider both the past (what factors led to this condition?), present (what are my options?), and the future (how can we increase the landscape’s long-term resilience?). In this example, the forest overstory community is diverse but it is dense and has, on average, large diameter trees. This is an example where natural resource managers may be able to use silvicultural techniques (thinnings, regeneration harvests) to reduce relative density and modify stand structure to effectively reduce susceptibility to bark beetles [70]. In a different landscape with the same LSI (7), but with individual components scored as 1 for relative density, 3 for species richness, and 3 for stand structure, managing for future long-term resilience will likely be more difficult and represent a dramatic shift. This example could be representative of a low-density forest ecosystem composed of large-diameter trees of a single tree species (e.g., a restored open ponderosa pine forest) [89].
The restoration effort of a forest community may represent a trade-off with increased resilience to disturbances like fire, but this forest may be more susceptible to bark beetles. An LSI score of 7 in this restored landscape can also highlight that the restoration effort, while effective, can create relatively homogenous conditions across a landscape. Forest management (regeneration harvests) focused on increasing age-class diversity can decrease bark beetle susceptibility and likely increase resilience to other aspects of climate change, including fire and drought [8]. By utilizing both the LSI and individual components, natural resource managers can discuss trade-offs and prioritize management. Finally, treatments designed to reduce the size (average diameter) and reduce the impact of competition (reduce density, lower SDI) have been explored for more than a century in the Interior West (e.g., [17,90,91]). However, treatments focused on increasing tree species diversity are much less straightforward. That is, even within the three components of the landscape model, there are limitations. Given the inherently limited diversity in the Interior West (median species number = 2), increasing diversity is likely more difficult than changing the structure or density [92]. Increasing species diversity would require additional planning, investment in state and regional nurseries, logistical support, and the formation of collaborative working groups within a forest region to assess the trade-offs associated with increasing species diversity through artificial planting of native species or the use of assisted migration of near native or novel species [93].
Central to research and management of western North American forests is the unbalanced age-class distribution (Figure 1). There is a substantial deficit in small diameter, recently regenerated stands, especially across the Interior West (Figure 1 and Figure 4). The dearth of regenerating stands has been noted by others in western pine forests [94]; based on multiple lines of evidence, including dendrochronology and historic inventory data; Taylor and Carroll [94] hypothesized a negative exponential age class distribution. The combination of fire suppression and forest management decisions has resulted in a shift in the age class distribution (much like our Figure 1) which has increased the portion of lodgepole pine stands that are highly susceptible to mountain pine beetle to greater than 50%. The spike in newly regenerated stands across the west (0–10-year age class, Figure 1) indicates that recent, extensive disturbance events are re-setting the western-level age class distribution. Many of these factors (unbalanced age, high density, etc.) also influence other disturbance dynamics such as fire, mortality from drought, and ecosystem services such as snowpack dynamics [95,96,97]. As many national forests in the United States and other public forest lands globally move to a shared stewardship approach, forest planners will need numerous tools to assess and develop restoration strategies [98], especially as goals shift from considering historical conditions (in the US, often pre-European colonization), to considering current or future function (transition for climate change adaptation) [88]. While our model was built for a suite of bark beetles (Dendrodoctus spp.) and forest communities within western North America, the underlying ecological principles of our model could be adapted for other forest communities and bark beetles (e.g., Ips typographus (L.) [99,100]). Our landscape conceptual model links ecological principles with forest management options, allowing for the development of clear forest management treatments. Additionally, the model can be used to assess the ease and likelihood of success. Thus, broad landscape level goals and objectives can be translated into on-the-ground management strategies.
8. Implications for Management
Silvicultural and forest management is the manipulation of the structure and composition of a forest ecosystem based on the goals and values of an individual, an organization, and society [101]. The extensive mortality from bark beetle outbreaks has resulted in a call by society to increase forest resilience [102]. It should be clear that the stand-level approach to assessment is necessary but not sufficient, instead, the challenge is for managers to move to landscape assessment—that is, to change from resistance thinking (manipulate stand structure and composition to reduce the potential for population growth of beetles within the stand, short-term) to resilience thinking (manage multiple stands in a landscape to promote reduced susceptibility overall, long-term) as we move forward [7]. The conceptual model is an important way for forest and natural resource managers to think about their stand(s) in relation to the large landscape, and quickly and efficiently indicate what elements of structure and composition need to be managed to lower susceptibility overall. To do this, managers will need to broaden their focus from the stand to the landscape—what is the role of their stand in the context of the larger landscape? How does their stand contribute to high or low susceptibility to the larger landscape? Is the stand administratively or commercially capable of being manipulated? The proposed conceptual model allows natural resource managers to consider the above questions. Given the current age and size-class distribution in the western United States, the single-most effective approach to building resilience across landscapes would be to regenerate large acreages of forest. Despite large wildfires and extensive areas with epidemic levels of bark beetles, Figure 1 indicates there are substantially fewer young forests than we would expect by chance [94,103]. Foresters and natural resource managers have tools based on silvicultural research to shift the age class distribution. The primary limitations will be: (1) planning restraints such as the environmental planning process and administrative barriers such as land designation (e.g., wilderness or roadless); (2) scaling up projects to achieve sufficient acreage of treatments; and (3) viable markets.
9. Conclusions
Most of what we know about bark beetles is based on studies of epidemic populations [104]. By the time bark beetles reach epidemic population levels, our ability to effectively manage their impacts has been diminished. The full endemic-to-epidemic population cycle, however, includes phases where insect populations are much more dynamic and more easily managed using indirect methods. Relatively little is known about the spatial-scale dependence of these non-outbreak phases, but we do know that we cannot directly control temperatures, and there is little that can be done to reduce susceptibility once bark beetle populations build to epidemic levels; we may, however, be able to buy time [7,105]. Furthermore, because traditional stand-level models have focused on specific forest types, they fail to capture the landscape complexity, and our conceptual model does that. Given the generality of the three main components of the landscape model, we suggest the model could be used on many other species around the globe.
Author Contributions
Conceptualization, methodology, writing was completed by all authors (M.A.W.-C., J.D., J.N.L.); data curations were completed by J.D.; project administration was completed by M.A.W.-C. All individual authors brought their own funding. All authors have read and agreed to the published version of the manuscript.
Funding
Funding for this project is from the Minnesota Agricultural Experiment Station under project MIN-42-068 for M.A.W. and Utah Agricultural Experiment Station, Utah State University, and approved as journal paper number 9477 for J.D.
Data Availability Statement
All data utilized in our study is freely available from the FIA Datamart (https://apps.fs.usda.gov/fia/datamart/ (accessed on 19 April 2021)). Information on data utilized can be found in the methods.
Acknowledgments
We appreciate and acknowledge the numerous individuals responsible for the collection and processing of the U.S. Department of Agriculture, Forest Service, Forest Inventory and Analysis data used in this study.
Conflicts of Interest
The authors declare no conflict of interest.
References
- Bentz, B.J.; Kegley, S.; Gibson, K.; Thier, R. A test of high-dose verbenone for stand-level protection of lodgepole and whitebark pine from mountain pine beetle (Coleoptera: Curculionidae: Scolytinae) attacks. J. Econ. Entomol. 2005, 98, 1614–1621. [Google Scholar] [CrossRef]
- Brunelle, A.; Rehfeldt, G.E.; Bentz, B.J.; Munson, A.S. Holocene records of Dendroctonus bark beetles in high elevation pine forests of Idaho and Montana, USA. For. Ecol. Manag. 2008, 255, 836–846. [Google Scholar] [CrossRef]
- Morris, J.L.; Derose, R.J.; Brunelle, A.R. Long-term landscape changes in a subalpine spruce-fir forest in central Utah, USA. For. Ecosyst. 2015, 2, 35. [Google Scholar] [CrossRef] [Green Version]
- Thybony, S.; Rosenberg, R.G.; Rosenbergy, E.M. The Medicine Bows: Wyoming’s Mountain Country; Caxton Press: Caldwell, ID, USA, 1985; pp. 1–173. [Google Scholar]
- Keane, R.E.; Ryan, K.C.; Veblen, T.T.; Allen, C.D.; Logan, J.A.; Hawkes, B.; Barron, J. The cascading effects of fire exclu-sion in Rocky Mountain ecosystems. Rocky Mountain futures: An ecological perspective. In Rocky Mountain Futures: An Ecological Perspective; Barron, J., Ed.; Island Press: Washington, DC, USA, 2002; pp. 133–153. [Google Scholar]
- Stephens, S.L.; Burrows, N.; Buyantuyev, A.; Gray, R.W.; Keane, R.E.; Kubian, R.; Liu, S.; Seijo, F.; Shu, L.; Tolhurst, K.G.; et al. Temperate and boreal forest mega-fires: Characteristics and challenges. Front. Ecol. Environ. 2014, 12, 115–122. [Google Scholar] [CrossRef] [Green Version]
- Raffa, K.F.; Aukema, B.H.; Bentz, B.J.; Carroll, A.L.; Hicke, J.A.; Turner, M.G.; Romme, W.H. Cross-scale Drivers of Natural Disturbances Prone to Anthropogenic Amplification: The Dynamics of Bark Beetle Eruptions. Bioscience 2008, 58, 501–517. [Google Scholar] [CrossRef] [Green Version]
- Fettig, C.J.; Hilszczański, J. Management strategies for bark beetles in conifer forests. In Bark Beetles; Vega, F.E., Hofstetter, R.W., Eds.; Academic Press: San Diego, CA, USA, 2015; pp. 555–584. [Google Scholar]
- Kurz, W.A.; Dymond, C.C.; Stinson, G.; Rampley, G.J.; Neilson, E.T.; Carroll, A.L.; Ebata, T.; Safranyik, L. Mountain pine beetle and forest carbon feedback to climate change. Nature 2008, 452, 987–990. [Google Scholar] [CrossRef] [PubMed]
- Derose, R.J.; Long, J.N. Resistance and Resilience: A Conceptual Framework for Silviculture. For. Sci. 2014, 60, 1205–1212. [Google Scholar] [CrossRef]
- Witt, C.; Shaw, J.D.; Menlove, J.; Goeking, S.A.; DeRose, R.J.; Pelz, K.A.; Morgan, T.A.; Hayes, S.W. Montana’s forest re-sources, 2006–2015. In Resour. Bull. RMRS-RB-30; US Department of Agriculture, Forest Service, Rocky Mountain Research Station: Fort Collins, CO, USA, 2019; p. 30. [Google Scholar]
- Thompson, M.T.; Shaw, J.D.; Witt, C.; Werstak, C.E.; Amacher, M.C.; Goeking, S.A.; DeRose, R.J.; Morgan, T.A.; Sorenson, C.B.; Hayes, S.W.; et al. Colorado’s forest resources, 2004–2013. In Resour. Bull. RMRS-RB-23; U.S. Department of Agriculture, Forest Service, Rocky Mountain Research Station: Fort Collins, CO, USA, 2017. [Google Scholar]
- Woudenberg, S.W.; Conkling, B.L.; O’Connell, B.M.; LaPoint, E.B.; Turner, J.A.; Waddell, K.L. The Forest Inventory and Analysis Database: Database Description and Users Manual Version 4.0 for Phase 2 (No. RMRS-GTR-245); U.S. Department of Agriculture, Forest Service, Rocky Mountain Research Station: Fort Collins, CO, USA, 2010.
- Hopkins, A.D. The Black Hills Beetle. United States Bureau of Entomology, Series 56. 1905. Available online: https://ir.library.oregonstate.edu/concern/defaults/8623j0070 (accessed on 10 June 2021).
- Chamberlin, W.J. Bark-Beetles Infesting the Douglas fir (Vol. 147); Oregon Agricultural College Experiment Station: Corvallis, OR, USA, 1918. [Google Scholar]
- Aukema, B.H.; McKee, F.R.; Wytrykush, D.L.; Carroll, A.L. Population dynamics and epidemiology of four species of Dendroctonus (Coleoptera: Curculionidae): 100 Years since J.M. Swaine. Can. EÈntomol. 2016, 148, S82–S110. [Google Scholar] [CrossRef] [Green Version]
- Brown, T.C.; Carder, D.R. Sustained Yield of What? J. For. 1977, 75, 722–723. [Google Scholar]
- Keen, F.P. Relative Susceptibility of Ponderosa Pines to Bark-Beetle Attack. J. For. 1936, 34, 919–927. [Google Scholar] [CrossRef]
- Keen, F.P. Ponderosa pine tree classes redefined. J. For. 1943, 41, 249–253. [Google Scholar] [CrossRef]
- Miller, J.M.; Keen, F.P. Biology and Control of the Western Pine Beetle: A Summary of the First Fifty Years of Research (No. 800); US Department of Agriculture: Washington, DC, USA, 1960.
- Steele, R. Stand Hazard Rating for Central Idaho Forests; US Department of Agriculture, Forest Service, Inter-mountain Research Station: Ogden, UT, USA, 1996; Volume 332.
- Daniels, R.F.; Leuschner, W.A.; Zarnoch, S.J.; Burkhart, H.E.; Hicks, R.R. A method for estimating the probability of southern pine beetle outbreaks. For. Sci. 1979, 25, 265–269. [Google Scholar] [CrossRef]
- Hicks, R.R.; Howard, J.E.; Watterston, K.G.; Coster, J.E. Rating forest stand susceptibility to southern pine beetle in East Texas. For. Ecol. Manag. 1979, 2, 269–283. [Google Scholar] [CrossRef]
- Mason, G.N.; Bryant, C.M.V. Establishing southern pine beetle hazard from aerial stand data and historical records. For. Sci. 1984, 30, 375–382. [Google Scholar] [CrossRef]
- Hedden, R.L.; Belanger, R.P. Predicting susceptibility to southern pine beetle attack in the Coastal Plain, Piedmont, and Southern Appalachians. In Integrated Pest Management Research Symposium: The Proceedings; Branhman, S.J., Thatcher, R.C., Eds.; USDA Forest Service, Southern Forest Experiment Station: Ashevhille, NC, USA, 1985; pp. 233–238. [Google Scholar]
- Cook, S.; Cherry, S.; Humes, K.; Guldin, J.; Williams, C. Development of a Satellite-Based Hazard Rating System for Dendroctonus frontallis (Coleoptera: Scolytidae) in the Ouachita Mountains of Arkansas. J. Econ. EÈntomol. 2014, 100, 381–388. [Google Scholar] [CrossRef]
- Eaton, C.B. Insect-Caused Mortality in Relation to Methods of Cutting in Ponderosa Pine on the Blacks Mountain Experi-Mental Forest. Tech. Pap. 43; Department of Agriculture, Forest Service, Pacific Southwest Forest and Range Experiment Station: Berkeley, CA, USA, 1959; p. 33.
- Sartwell, C.; Stevens, R.E. Mountain pine beetle in ponderosa pine–prospects for silvicultural control in second-growth stands. J. For. 1975, 73, 136–140. [Google Scholar] [CrossRef]
- Amman, G.D.; McGregor, M.D.; Cahill, D.B.; Klein, W.H. Guidelines for Reducing Losses of Lodgepole Pine to the Mountain Pine Beetle in Unmanaged Stands in the Rocky Mountains; General Technical Report, INT-GTR-262; US Department of Agriculture, Forest Service, Intermountain Forest and Range Experiment Station: Ogden, UT, USA, 1977; p. 19.
- Stevens, R.E.; McCambridge, W.F.; Edminster, C.B. Risk Rating Guide for Mountain Pine Beetle in Black Hills Ponderosa Pine; Research Note RM-385; US Department of Agriculture, Forest Service, Rocky Mountain Forest and Range Experiment Station: Fort Collins, CO, USA, 1980; p. 2.
- McGregor, M.D.; Amman, G.D.; Cole, W.E. Hazard-rating lodgepole pine for susceptibility to mountain pine beetle in-festation. In Hazard Rating Systems in Forest Insect Pest Management: Symposium Proceedings; Hedden, R.L., Barras, S.J., Coster, J.E., Eds.; Tech. coord. USDA For. Serv. Gen.Tech.Rep.WO-27.; USDA Forest Service: Athens, GA, USA, 1981; pp. 99–104. [Google Scholar]
- Hazard-Rating Lodgepole Pine for Susceptibility to Mountain Pine Beetle Infestation; General Technical Report; USDA Forest Service: Washington, DC, USA, 1981; pp. 99–104.
- Schmid, J.M.; Mata, S.A. Stand Density and Mountain Pine Beetle-Caused Tree Mortality in Ponderosa Pine Stands; USDA, Forest Service, Rocky Mountain Forest and Range Experiment Station: Fort Collins, CO, USA, 1992.
- Bentz, B.J.; Amman, G.D.; Logan, J.A. A critical assessment of risk classification systems for the mountain pine beetle. For. Ecol. Manag. 1993, 61, 349–366. [Google Scholar] [CrossRef]
- Stuart, J.D. Hazard rating of lodgepole pine stands to mountain pine beetle outbreaks in southcentral Oregon. Can. J. For. Res. 1984, 14, 666–671. [Google Scholar] [CrossRef]
- Olsen, W.K.; Schmid, J.M.; Mata, S.A. Stand characteristics associated with mountain pine beetle infestations in Ponderosa pine. For. Sci. 1996, 42, 310–327. [Google Scholar] [CrossRef]
- Powell, J.; Kennedy, B.; White, P.; Bentz, B.; Logan, J.; Roberts, D. Mathematical Elements of Attack Risk Analysis for Mountain Pine Beetles. J. Theor. Biol. 2000, 204, 601–620. [Google Scholar] [CrossRef] [Green Version]
- Shore, T.L.; Safranyik, L.; Lemieux, J.P. Susceptibility of lodgepole pine stands to the mountain pine beetle: Testing of a rating system. Can. J. For. Res. 2000, 30, 44–49. [Google Scholar] [CrossRef]
- Parkins, J.R.; MacKendrick, N.A. Assessing community vulnerability: A study of the mountain pine beetle outbreak in British Columbia, Canada. Glob. Environ. Chang. 2007, 17, 460–471. [Google Scholar] [CrossRef]
- Hicke, J.A.; Jenkins, J.C. Mapping lodgepole pine stand structure susceptibility to mountain pine beetle attack across the western United States. For. Ecol. Manag. 2008, 255, 1536–1547. [Google Scholar] [CrossRef]
- Robertson, C.; Wulder, M.A.; Nelson, T.A.; White, J.C. Risk rating for mountain pine beetle infestation of lodgepole pine forests over large areas with ordinal regression modelling. For. Ecol. Manag. 2008, 256, 900–912. [Google Scholar] [CrossRef]
- Negrón, J.F.; Popp, J.B. Probability of ponderosa pine infestation by mountain pine beetle in the Colorado Front Range. For. Ecol. Manag. 2004, 191, 17–27. [Google Scholar] [CrossRef]
- Weatherby, J.C.; Thier, R.W. A preliminary Validation of Douglas-Fir Beetle Hazard Rating System; Mountain Home Ranger District, Boise National Forest; 1993; Forest Pest Management Report No. R4-93-05; U.S. Department of Agriculture, Forest Service: Boise, ID, USA, 1993; p. 7.
- Negron, J.F. Probability of infestation and extent of mortality associated with the Douglas-fir beetle in the Colorado Front Range. For. Ecol. Manag. 1998, 107, 71–85. [Google Scholar] [CrossRef]
- Shore, T.L.; Safranyik, L.; Riel, W.G.; Ferguson, M.; Castonguay, J. Evaluation of factors affecting tree and stand susceptibility to the douglas-fir beetle (coleoptera: Scolytidae). Can. EÈntomol. 1999, 131, 831–839. [Google Scholar] [CrossRef]
- Garrison-Johnston, M.T.; Moore, J.A.; Cook, S.P.; Niehoff, G.J. Douglas-Fir Beetle Infestations Are Associated with Certain Rock and Stand Types in the Inland Northwestern United States. Environ. EÈntomol. 2003, 32, 1354–1363. [Google Scholar] [CrossRef]
- Dodds, K.J.; Ross, D.W.; Randall, C.; Daterman, G.E. Landscape Level Validation of a Douglas-Fir Beetle Stand Hazard-Rating System Using Geographical Information Systems. West. J. Appl. For. 2004, 19, 77–81. [Google Scholar] [CrossRef] [Green Version]
- Dodds, K.J.; Garman, S.L.; Ross, D.W. Risk Rating Systems for the Douglas-Fir Beetle in the Interior Western United States. West. J. Appl. For. 2006, 21, 173–177. [Google Scholar] [CrossRef] [Green Version]
- Schmid, J.M.; Frye, R.H. Stand Ratings for Spruce Beetles; USDA FS RN-RM-309 4p, USDA Forest Service Research Note; Rocky Mountain Forest and Range Experiment Station: Fort Collings, CO, USA, 1976.
- Reynolds, K.; Holsten, E. Relative importance of risk factors for spruce beetle outbreaks. Can. J. For. Res. 1994, 24, 2089–2095. [Google Scholar] [CrossRef]
- Hansen, E.M.; Negron, J.F.; Munson, A.S.; Anhold, J.A. A Retrospective Assessment of Partial Cutting to Reduce Spruce Beetle-Caused Mortality in the Southern Rocky Mountains. West. J. Appl. For. 2006, 25, 81–87. [Google Scholar] [CrossRef] [Green Version]
- Crocker, S.J.; Liknes, G.C.; McKee, F.R.; Albers, J.S.; Aukema, B.H. Stand-level factors associated with resurging mortality from eastern larch beetle (Dendroctonus simplex LeConte). For. Ecol. Manag. 2016, 375, 27–34. [Google Scholar] [CrossRef]
- Millar, C.I.; Stephenson, N.L.; Stephens, S.L. Climate change and forests of the future: Managing in the face of uncertainty. Ecol. Appl. 2007, 17, 2145–2151. [Google Scholar] [CrossRef] [PubMed]
- McKenney, D.W.; Pedlar, J.H.; Lawrence, K.; Campbell, K.; Hutchinson, M.F. Potential Impacts of Climate Change on the Distribution of North American Trees. Bioscience 2007, 57, 939–948. [Google Scholar] [CrossRef]
- Rehfeldt, G.E.; Crookston, N.L.; Warwell, M.V.; Evans, J. Empirical Analyses of Plant-Climate Relationships for the Western United States. Int. J. Plant Sci. 2006, 167, 1123–1150. [Google Scholar] [CrossRef]
- O’Hara, K.L.; Nagel, L.M. The Stand: Revisiting a Central Concept in Forestry. J. For. 2013, 111, 335–340. [Google Scholar] [CrossRef] [Green Version]
- Royama, T. Analytical Population Dynamics; Chapman & Hall: London, UK, 1992. [Google Scholar]
- Bentz, B.J.; Régnière, J.; Fettig, C.J.; Hansen, E.M.; Hayes, J.L.; Hicke, J.A.; Kelsey, R.G.; Negrón, J.F.; Seybold, S.J. Climate Change and Bark Beetles of the Western United States and Canada: Direct and Indirect Effects. Bioscience 2010, 60, 602–613. [Google Scholar] [CrossRef]
- Hansen, E.M.; Bentz, B.J. Comparison of reproductive capacity among univoltine, semivoltine, and re-emerged parent spruce beetles (Coleoptera: Scolytidae). Can. EÈntomol. 2003, 135, 697–712. [Google Scholar] [CrossRef] [Green Version]
- Mitton, J.B.; Ferrenberg, S. Mountain Pine Beetle Develops an Unprecedented Summer Generation in Response to Climate Warming. Am. Nat. 2012, 179, E163–E171. [Google Scholar] [CrossRef] [Green Version]
- Derose, R.J.; Bekker, M.F.; Long, J.N. Traumatic resin ducts as indicators of bark beetle outbreaks. Can. J. For. Res. 2017, 47, 1168–1174. [Google Scholar] [CrossRef]
- Raffa, K.F. Mixed messages across multiple trophic levels: The ecology of bark beetle chemical communication systems. Chemoecology 2001, 11, 49–65. [Google Scholar] [CrossRef]
- Amman, G.D.; McGregor, M.D.; Dolph, R.E., Jr. Mountain Pine Beetle; USDA-Forest Service Forest Insect & Disease Leaflet 2; USDA-Forest Service: Portland, OR, USA, 1990.
- Six, D.L.; Bracewell, R. Dendroctonus. In Bark Beetles: Biology and Ecology of Native and Invasive Species; Vega, F.E., Hofstetter, R.W., Eds.; Academic Press: London, UK, 2015; pp. 305–350. [Google Scholar]
- Safranyik, L.; Shore, T.L.; Moeck, H.A.; Whitney, H.S. Dendroctonus Ponderosae Hopkins, Mountain Pine Beetle (Coleoptera: Scolytidae); CABI Publishing: Wallingford, UK, 2001; pp. 104–109. [Google Scholar]
- Amman, G.D. Prey Consumption and Development of Thanasimus undatulus, 1 a Predator of the Mountain Pine Beetle 2. Environ. EÈntomol. 1972, 1, 528–530. [Google Scholar] [CrossRef]
- Poland, T.M.; Borden, J.H. Attraction of a bark beetle predator, Thanasimus undatulus (Coleoptera: Cleridae), to pheromones of the spruce beetle and two secondary bark beetles (Coleoptera: Scolytidae). J. Entomol. Soc. Br. Columbia 1997, 94, 35–42. [Google Scholar]
- Ross, D.W.; Daterman, G.E. Using pheromone-baited traps to control the amount and distribution of tree mortality during outbreaks of the Douglas-fir beetle. For. Sci. 1997, 43, 65–70. [Google Scholar]
- Weed, A.S.; Bentz, B.J.; Ayres, M.P.; Holmes, T.P. Geographically variable response of Dendroctonus ponderosae to winter warming in the western United States. Landsc. Ecol. 2015, 30, 1075–1093. [Google Scholar] [CrossRef]
- Fettig, C.J.; Klepzig, K.D.; Billings, R.F.; Munson, A.S.; Nebeker, T.E.; Negrón, J.F.; Nowak, J.T. The effectiveness of vegetation management practices for prevention and control of bark beetle infestations in coniferous forests of the western and southern United States. For. Ecol. Manag. 2007, 238, 24–53. [Google Scholar] [CrossRef]
- Jenkins, M.J.; Hebertson, E.G.; Munson, A.S. Spruce Beetle Biology, Ecology and Management in the Rocky Mountains: An Addendum to Spruce Beetle in the Rockies. Forest 2014, 5, 21–71. [Google Scholar] [CrossRef] [Green Version]
- Randall, C.; Steed, B.; Bush, R. Revised R1 Forest Insect Hazard Rating System User Guide for Use with Inventory Data Stored in FSVeg and/or Analyzed with the Forest Vegetation Simulation. USDA Forest Health Protection Report 11-06. 2011. Available online: https://www.fs.usda.gov/Internet/FSE_DOCUMENTS/stelprdb5346736.pdf (accessed on 10 June 2021).
- Reed, D.D.; Burkhart, H.E.; Leuschner, W.A.; Hedden, R.L. A severity model for southern pine beetle infestations. For. Sci. 1981, 27, 290–296. [Google Scholar] [CrossRef]
- Burns, R.M.; Honkala, B.H. (Eds.) Silvics of North America: Volume 1. Conifers, Agric. Handb. 654; USDA/FS: Washington, DC, USA, 1990.
- Conner, L.G.; Bunnell, M.C.; Gill, R.A. Forest diversity as a factor influencing Engelmann spruce resistance to beetle outbreaks. Can. J. For. Res. 2014, 44, 1369–1375. [Google Scholar] [CrossRef]
- Mitchell, R.G.; Waring, R.H.; Pitman, G.B. Thinning lodgepole pine increases tree vigor and resistance to mountain pine beetle. For. Sci. 1983, 29, 204–211. [Google Scholar] [CrossRef]
- Long, N.J.; Windmuller-Campione, M.A.; DeRose, J.R. Building Resistance and Resilience: Regeneration Should Not be Left to Chance. Forests 2018, 9, 270. [Google Scholar] [CrossRef] [Green Version]
- Bentz, B.J.; Jönsson, A.M. Modeling Bark Beetle Responses to Climate Change. In Bark Beetles; Elsevier BV: Amsterdam, The Netherlands, 2015; pp. 533–553. [Google Scholar]
- Shaw, J.D.; Menlove, J.; Witt, C.; Morgan, T.A.; Amacher, M.C.; Goeking, S.A.; Werstak, C.E. Arizona’s Forest Resources, 2001–2014. Resour. Bull. RMRS-RB-25; US Department of Agriculture, Forest Service, Rocky Mountain Research Station: Fort Collins, CO, USA, 2018; p. 126.
- Audley, J.P.; Fettig, C.J.; Munson, A.S.; Runyon, J.B.; Mortenson, L.A.; Steed, B.E.; Gibson, K.E.; Jørgensen, C.L.; McKelvey, S.R.; McMillin, J.D.; et al. Impacts of mountain pine beetle outbreaks on lodgepole pine forests in the Inter-mountain West, US, 2004–2019. For. Ecol. Manag. 2020, 475, 118403. [Google Scholar] [CrossRef]
- Wurtzebach, Z.; DeRose, R.J.; Bush, R.R.; Goeking, S.A.; Healey, S.; Menlove, J.; Pelz, K.A.; Schultz, C.; Shaw, J.D.; Witt, C. Supporting National Forest System Planning with Forest Inventory and Analysis Data. J. For. 2020, 118, 289–306. [Google Scholar] [CrossRef]
- Underhill, J.L.; Dickinson, Y.; Rudney, A.; Thinnes, J. Silviculture of the Colorado Front Range Landscape Restoration Initiative. J. For. 2014, 112, 484–493. [Google Scholar] [CrossRef]
- Dickinson, Y. Landscape restoration of a forest with a historically mixed-severity fire regime: What was the historical landscape pattern of forest and openings? For. Ecol. Manag. 2014, 331, 264–271. [Google Scholar] [CrossRef]
- Shaw, J.D. Application of Stand Density Index to Irregularly Structured Stands. West. J. Appl. For. 2000, 15, 40–42. [Google Scholar] [CrossRef] [Green Version]
- Long, J.N. A Practical Approach to Density Management. For. Chron. 1985, 61, 23–27. [Google Scholar] [CrossRef] [Green Version]
- Seidl, R.; Thom, D.; Kautz, M.; Martin-Benito, D.; Peltoniemi, M.; Vacchiano, G.; Wild, J.; Ascoli, D.; Petr, M.; Honkaniemi, J.; et al. Forest disturbances under climate change. Nat. Clim. Chang. 2017, 7, 395–402. [Google Scholar] [CrossRef] [PubMed] [Green Version]
- Urgenson, L.S.; Ryan, C.M.; Halpern, C.B.; Bakker, J.D.; Belote, R.T.; Franklin, J.F.; Haugo, R.D.; Nelson, C.R.; Waltz, A.E. Visions of Restoration in Fire-Adapted Forest Landscapes: Lessons from the Collaborative Forest Landscape Restoration Program. Environ. Manag. 2017, 59, 338–353. [Google Scholar] [CrossRef]
- Raffa, K.F.; Aukema, B.H.; Bentz, B.J.; Carroll, A.L.; Hicke, J.A.; Kolb, T.E. Responses of tree-killing bark beetles to a changing climate. In Climate Change and Insect Pests; Björkman, C., Niemelä, P., Eds.; CAB International: Oxfordshire, UK, 2015; pp. 173–201. [Google Scholar]
- Arno, S.F.; Harrington, M.G.; Fiedler, C.E.; Carlson, C.E. Restoring fire-dependent ponderosa pine forests in western Montana. Restor. Manag. Notes 1995, 13, 32–36. Available online: https://www.jstor.org/stable/43440410 (accessed on 10 June 2021).
- Weidman, R.H. Forest succession as a basis of the silviculture of western yellow pine. J. For. 1921, 19, 877–885. [Google Scholar] [CrossRef]
- Henry, A.; Flood, M.G. The Douglas firs: A botanical and silvicultural description of the various species of Pseudotsuga. In Proceedings of the Royal Irish Academy. Section B: Biological, Geological, and Chemical Science; Royal Irish Academy: Dublin, Ireland, 1919; Volume 35, pp. 67–92. [Google Scholar]
- Peet, R.K. Forest vegetation of the Colorado Front Range: Patterns of species diversity. Vegetatio 1978, 37, 65–78. [Google Scholar] [CrossRef]
- Pedlar, J.H.; McKenney, D.W.; Aubin, I.; Beardmore, T.; Beaulieu, J.; Iverson, L.R.; O’Neill, G.A.; Winder, R.S.; Ste-Marie, C. Placing Forestry in the Assisted Migration Debate. Bioscience 2012, 62, 835–842. [Google Scholar] [CrossRef]
- Taylor, S.W.; Carroll, A.L.; Alfaro, R.I.; Safranyik, L. Forest, climate and mountain pine beetle outbreak dynamics in western Canada. In The Mountain Pine Beetle: A Synthesis of Biology, Management, and Impacts on Lodgepole Pine; Safranyik, L., Wilson, W.R., Eds.; Canadian Forest Service: Victoria, BC, Canada, 2006; pp. 67–94. [Google Scholar]
- Mikkelson, K.M.; Bearup, L.A.; Maxwell, R.M.; Stednick, J.D.; McCray, J.E.; Sharp, J.O. Bark beetle infestation impacts on nutrient cycling, water quality and interdependent hydrological effects. Biogeochemistry 2013, 115, 1–21. [Google Scholar] [CrossRef]
- Chen, H.Y.H.; Luo, Y.; Reich, P.B.; Searle, E.B.; Biswas, S.R. Climate change-associated trends in net biomass change are age dependent in western boreal forests of Canada. Ecol. Lett. 2016, 19, 1150–1158. [Google Scholar] [CrossRef]
- Kane, J.M.; Varner, J.M.; Metz, M.; van Mantgem, P.J. Characterizing interactions between fire and other disturbances and their impacts on tree mortality in western U.S. Forests. For. Ecol. Manag. 2017, 405, 188–199. [Google Scholar] [CrossRef]
- Bryant, T.; Waring, K.; Meador, A.S.; Bradford, J.B. A Framework for Quantifying Resilience to Forest Disturbance. Front. For. Glob. Chang. 2019, 2, 56. [Google Scholar] [CrossRef]
- Wermelinger, B. Ecology and management of the spruce bark beetle Ips typographus—A review of recent research. For. Ecol. Manag. 2004, 202, 67–82. [Google Scholar] [CrossRef]
- Seidl, R.; Müller, J.; Hothorn, T.; Bässler, C.; Heurich, M.; Kautz, M. Small beetle, large-scale drivers: How regional and landscape factors affect outbreaks of the European spruce bark beetle. J. Appl. Ecol. 2016, 53, 530–540. [Google Scholar] [CrossRef]
- Nyland, R.D. Silviculture: Concepts and Applications; Waveland Press: Long Grove, IL, USA, 2016. [Google Scholar]
- Morris, J.L.; Cottrell, S.; Fettig, C.J.; Derose, R.J.; Mattor, K.M.; Carter, V.A.; Clear, J.; Clement, J.; Hansen, W.; Hicke, J.A.; et al. Bark beetles as agents of change in social-ecological systems. Front. Ecol. Environ. 2018, 16, S34–S43. [Google Scholar] [CrossRef]
- Johnson, E.A.; Miyanishi, K.; Weir, J.M.H. Old-growth, disturbance, and ecosystem management. Can. J. Bot. 1995, 73, 918–926. [Google Scholar] [CrossRef]
- Lundquist, J.E.; Reich, R.M. Landscape Dynamics of Mountain Pine Beetles. For. Sci. 2013, 60, 464–475. [Google Scholar] [CrossRef]
- Windmuller-Campione, M.A.; Long, J.N. If Long-Term Resistance to a Spruce Beetle Epidemic is Futile, Can Silvicultural Treatments Increase Resilience in Spruce-Fir Forests in the Central Rocky Mountains? Forests 2015, 6, 1157–1178. [Google Scholar] [CrossRef]
Figure 1.
Stand age structure for forest land in the western United States. Data from a full cycle (2006–2015) of Forest Inventory and Analysis [13].
Figure 1.
Stand age structure for forest land in the western United States. Data from a full cycle (2006–2015) of Forest Inventory and Analysis [13].

Figure 2.
Thousands of hectares affected by bark beetle and fire over the past ten years in the western United States. To be considered affected, greater than 25% of the plot had to exhibit mortality due to fire or insects. Data from a full panel (10 years) of Forest Inventory and Analysis plots [13].

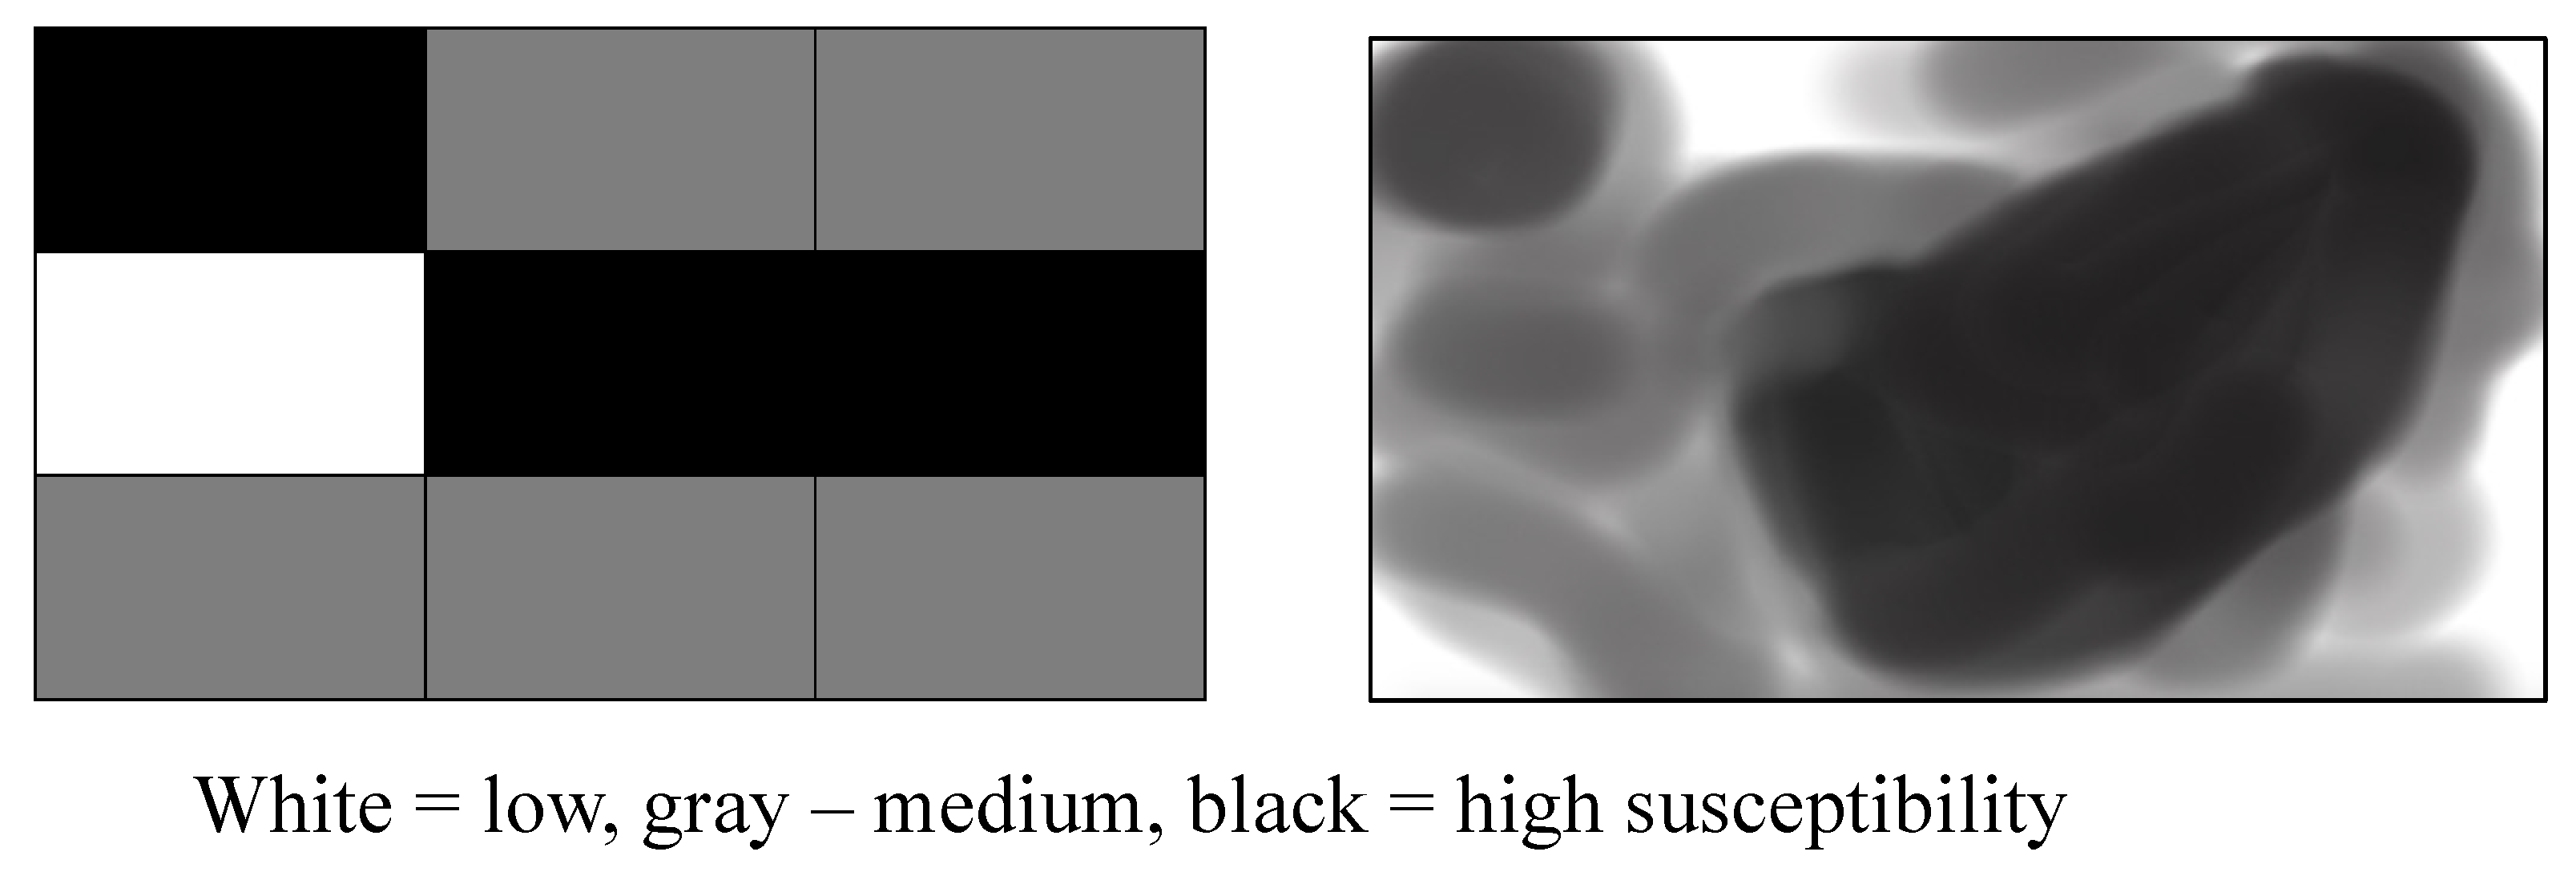
Figure 3.
(Left) Example of how a landscape may look using one of the current individual species susceptibility models (Table 3). Each individual stand (16 to 40 ha) would be assessed and rated individually using the indices found in Table 1. Treatments would likely focus on the high-risk stands (black). (Right) While the stand is often the administrative or management unit (unit to be thinned or harvested), forests and bark beetles occur across a landscape. By assessing susceptibility at the landscape level, treatments can focus on resilience and can better take into account bark beetle life cycle dynamics and variability of host substrate.

Figure 4.
The distribution of quadratic mean diameter (A), relative stand density (B), and species richness (C) across the Interior West. Susceptibility categories (low, med, and high) are defined in the methods. Dashed lines denote break points between low, medium (med), and high categories.
Figure 4.
The distribution of quadratic mean diameter (A), relative stand density (B), and species richness (C) across the Interior West. Susceptibility categories (low, med, and high) are defined in the methods. Dashed lines denote break points between low, medium (med), and high categories.

Table 1.
Important Dendroctonus spp., their known hosts, and a subset of publications related to susceptibility, risk, and hazard.
Table 1.
Important Dendroctonus spp., their known hosts, and a subset of publications related to susceptibility, risk, and hazard.
| Species | Common Name | Hosts | Susceptibility, Risk, and Hazard Ratings |
|---|---|---|---|
| Dendroctonus brevicomis Le Conte | western pine beetle | Pinus ponderosae Douglas ex Lawson | [18,19,20,21] |
| Dendroctonus frontalis Zimmermann | southern pine beetle | P. echinata Mill, P. elliottii Engelm., P. engelmannii Carr., P. leiophylla Schiede ex Schlechtendal et Chamisso, P. palustris Miller, P. ponderosae, P. taeda Linnaeus, P. virginiana Miller, others | [22,23,24,25,26] |
| Dendroctonus ponderosae Hopkins | mountain pine beetle | Pinus albicaulis Engelm., P. aristata Engelm., P. contorta Douglas, P. flexilis E. James, P. lambertiana Douglas, P. monticola Douglas ex D. Don in Lambert, P. ponderosae, others | [27,28,29,30,31,32,33,34,35,36,37,38,39,40,41,42] |
| Dendroctonus pseudotsugae Hopkins | Douglas-fir beetle | Pseudotsuga menziesii (Mirbel) Franco | [43,44,45,46,47,48] |
| Dendroctonus rufipennis Kirby | spruce beetle | Picea engelmannii Parry ex Engelmann, Pi. glauca (Moench) Voss, Pi. sitchensis (Bongard) Carrière | [49,50,51] |
| Dendroctonus simplex LeConte | eastern larch beetle | Larix laricina (DuRoi) K. Koch | [52] |
Table 2.
Characteristics shared by several susceptibility rating systems for an individual Dendroctonus species and associated tree species. Note the use of the term susceptibility to include risk and hazard.
Table 2.
Characteristics shared by several susceptibility rating systems for an individual Dendroctonus species and associated tree species. Note the use of the term susceptibility to include risk and hazard.
| Susceptibility Rating System | Host Size | Relative Density | Relative Density of Host | Other Variables |
|---|---|---|---|---|
| D. brevicomis in Pinus ponderosae [31] | Average diameter of P. ponderosae | Stand basal area | Proportion of stand basal area in P. ponderosae | Stand structure |
| Western pine beetle in D. ponderosae [31] | Average diameter of Ponderosa pine | Stand basal area | Proportion of stand basal area in Ponderosa pine | Stand structure |
| D. frontalis in southern pine species [34] | Average diameter of the stand | Total basal area of the stand | Not used—generally in single-species plantations | Number of attacked trees and number of other attack spots |
| D. ponderosae combined host model [72] | Average diameter of Pinus spp. Species | Stand basal area | Proportion of the stand basal area in Pinus spp. | |
| D. ponderosae in P. contorta [48] | Not used | Stand density index | Proportion of the stand basal area in P. contorta | Average stand age and elevation |
| Southern pine beetle [73] | Average diameter of the stand | Total basal area of the stand | Not used+ | Number of attacked trees and number of other attack spots |
| D. pseudotsugae in Ps. menziesii [52] | Average DBH of Ps. menziesii | Stand basal area | Proportion of stand basal area in Ps. menziesii | Average stand age |
| D. rufipennis in Pi. engelmannii [58] | Average diameter of live Pi. engelmannii | Stand basal area | Proportion of the stand basal area in Pi. engelmannii | Physiographic location |
| D. simplex for L. laricina [61] | Average diameter of L. laricina | Density of non-host gymnosperms | Not used | Presence of water and site index |
Publisher’s Note: MDPI stays neutral with regard to jurisdictional claims in published maps and institutional affiliations. |
© 2021 by the authors. Licensee MDPI, Basel, Switzerland. This article is an open access article distributed under the terms and conditions of the Creative Commons Attribution (CC BY) license (https://creativecommons.org/licenses/by/4.0/).
Share and Cite
MDPI and ACS Style
Windmuller-Campione, M.A.; DeRose, J.; Long, J.N. Landscape-Scale Drivers of Resistance and Resilience to Bark Beetles: A Conceptual Susceptibility Model. Forests 2021, 12, 798. https://doi.org/10.3390/f12060798
AMA Style
Windmuller-Campione MA, DeRose J, Long JN. Landscape-Scale Drivers of Resistance and Resilience to Bark Beetles: A Conceptual Susceptibility Model. Forests. 2021; 12(6):798. https://doi.org/10.3390/f12060798
Chicago/Turabian StyleWindmuller-Campione, Marcella A., Justin DeRose, and James N. Long. 2021. "Landscape-Scale Drivers of Resistance and Resilience to Bark Beetles: A Conceptual Susceptibility Model" Forests 12, no. 6: 798. https://doi.org/10.3390/f12060798
Note that from the first issue of 2016, this journal uses article numbers instead of page numbers. See further details here.