Article

Using a Simple Model to Determine the Best Management Regimes for Plantations at the Stand Level: A Case Study of Moshao Forest Farm in the Red-Soil Hilly Region of Southern China

1
Hebei Key Laboratory of Horticultural Germplasm Excavation and Innovative Utilization, College of Horticulture Science and Technology, Hebei Normal University of Science and Technology, Qinhuangdao 066004, China
2
Lhasa Plateau Ecosystem Research Station, Key Laboratory of Ecosystem Network Observation and Modeling, Institute of Geographic Sciences and Natural Resources Research, Chinese Academy of Sciences, Beijing 100101, China
3
University of Chinese Academy of Sciences, Beijing 100049, China
4
Key Laboratory of Land Surface Pattern and Simulation, Institute of Geographic Sciences and Natural Resources Research, Chinese Academy of Sciences, Beijing 100101, China
5
Key Laboratory of Forest Ecology and Management, Institute of Applied Ecology, Chinese Academy of Sciences, Shenyang 110016, China
6
Huitong National Research Station of Forest Ecosystem, Chinese Academy of Sciences, Huitong 418307, China
*
Author to whom correspondence should be addressed.
Forests 2021, 12(10), 1358; https://doi.org/10.3390/f12101358
Submission received: 10 September 2021 / Revised: 30 September 2021 / Accepted: 2 October 2021 / Published: 6 October 2021

Abstract

:
Plantations in Southern China are experiencing several major problems concerning even-aged forest structures and dwindling ecosystem services under traditional forest management. The objective of this study was to determine the best management regimes (BMRs) for sustainable forest management using the Moshao forest farm as a case study. We constructed a framework for BMR modeling characterized by highly scheduled timber production (STP), low fluctuations in periodically scheduled timber harvest levels (FPS), and age class structure (ACS) at the end of the planning horizon. A paired analysis was conducted between the three indicators to identify suitable management planning for long-term timber production. Our results suggest that STP, FPS, and ACS are correlated, enabling the control of these forest performance indicators by setting various harvesting intensities in a planning horizon. We found that management regimes (MRS) with cutting area percentages from 20% to 40% and a cutting period of 10 years combined with small-area clear-cutting (≤5 ha) are optimal (MR6–MR10) for the Moshao forest farm in Southern China. In particular, MR with a cutting area percentage of 35% is the best option (MR9). These findings suggest that an applicable MR is designed by identifying the optimal harvesting intensity. The current local harvesting intensity can be properly increased to balance between timber production and ecological impacts on plantations.

1. Introduction

Forests comprise a major part of the land’s ecosystem. They are characterized by their wide distribution, abundant biodiversity, complicated structures, functions, and ecological processes that play key roles in maintaining the ecological balance and protecting natural environments relied upon by humankind [1,2]. Plantations account for 7% of the global forest area but provide more than 60% of industrial timber [3,4,5]. In addition to providing timber, fiber, and fuel, plantations are also important in mitigating the adverse effects of global climate change, maintaining biodiversity, and conserving water and soil [6,7,8]. China contributes the highest percentage (28.8%) of the world’s total plantation area [4]. In China, timber production from plantations comprises approximately 46% of the world’s total timber production, and the carbon sink of plantations accounts for approximately 80% of the total forest carbon sink [9]. Thus, both the productivity and ecological function of plantations are essential.
However, the current plantation’s stocking volume is only half of the natural forests at 59.30 m3 ha−1 in China [10]. Furthermore, tree species are limited to a small set, with the top five species being Cunninghamia lanceolata, Populus simonii, Eucalyptus spp., Larix spp., and Pinus massoniana, accounting for 50.1% of the total plantation area [10]. Generally, the forestry industry in China aims for maximum timber production and only focuses on short-term benefits; thus, plantations are subject to large-scale harvesting with short rotations [11]. Problems concerning even-aged forest structure, low insect resistance, and low levels of biodiversity have arisen due to the development of plantations in China [12,13]. Thus, determining the BMRs for sustainable plantation management in China is necessary.
The foundation for sustainable forest management involves estimating the sustainable harvest levels of a forest. Over the past two centuries, several classic European and American methods, such as the Hanzlik formula, Hundeshagen formula, and Austrian formula, have been used in China and other countries to determine the sustainable harvest level [14,15,16]. Researchers and practitioners have focused on determining the optimal or best forest MRs for meeting various objectives in recent years. A variety of modeling approaches to solve these multi-objective forest management problems have been developed, e.g., linear programming (LP) harvest-scheduling models [17,18], the timber harvest allocation model (HARVEST) [19,20], and meta-heuristic techniques such as Monte Carlo integer programming (MCIP) [21,22], simulated annealing (SA) [23,24], and genetic algorithms (GA) [25,26]. However, these approaches often rely on complicated mathematical methods and modeling frameworks that are difficult to apply in many situations, especially for routine use by forest managers and policymakers.
The southern red-soil hilly area constitutes approximately 12.3% of China’s total area, and the plantation stocking volume accounts for 39% of China’s total plantation stocking volume [10,27]. Although this area is one of the major plantation regions in China, research on identifying or assessing optimal management alternatives is lacking. For our case study, we selected the Moshao forest farm, which has long-term field data, to represent the southern red-soil hilly area. The purpose of this study was to design a simple model for assessing BMRs that uses a predefined set of potential stand-level MRs for the Moshao forest farm. The relationship between harvesting intensity and STP, FPS, and ACS was evaluated at the end of the planning horizon. We also conducted a paired analysis among STP, FPS, and ACS to locate potential problems in the local MR and discussed the BMRs for long-term local timber production.

2. Materials and Methods
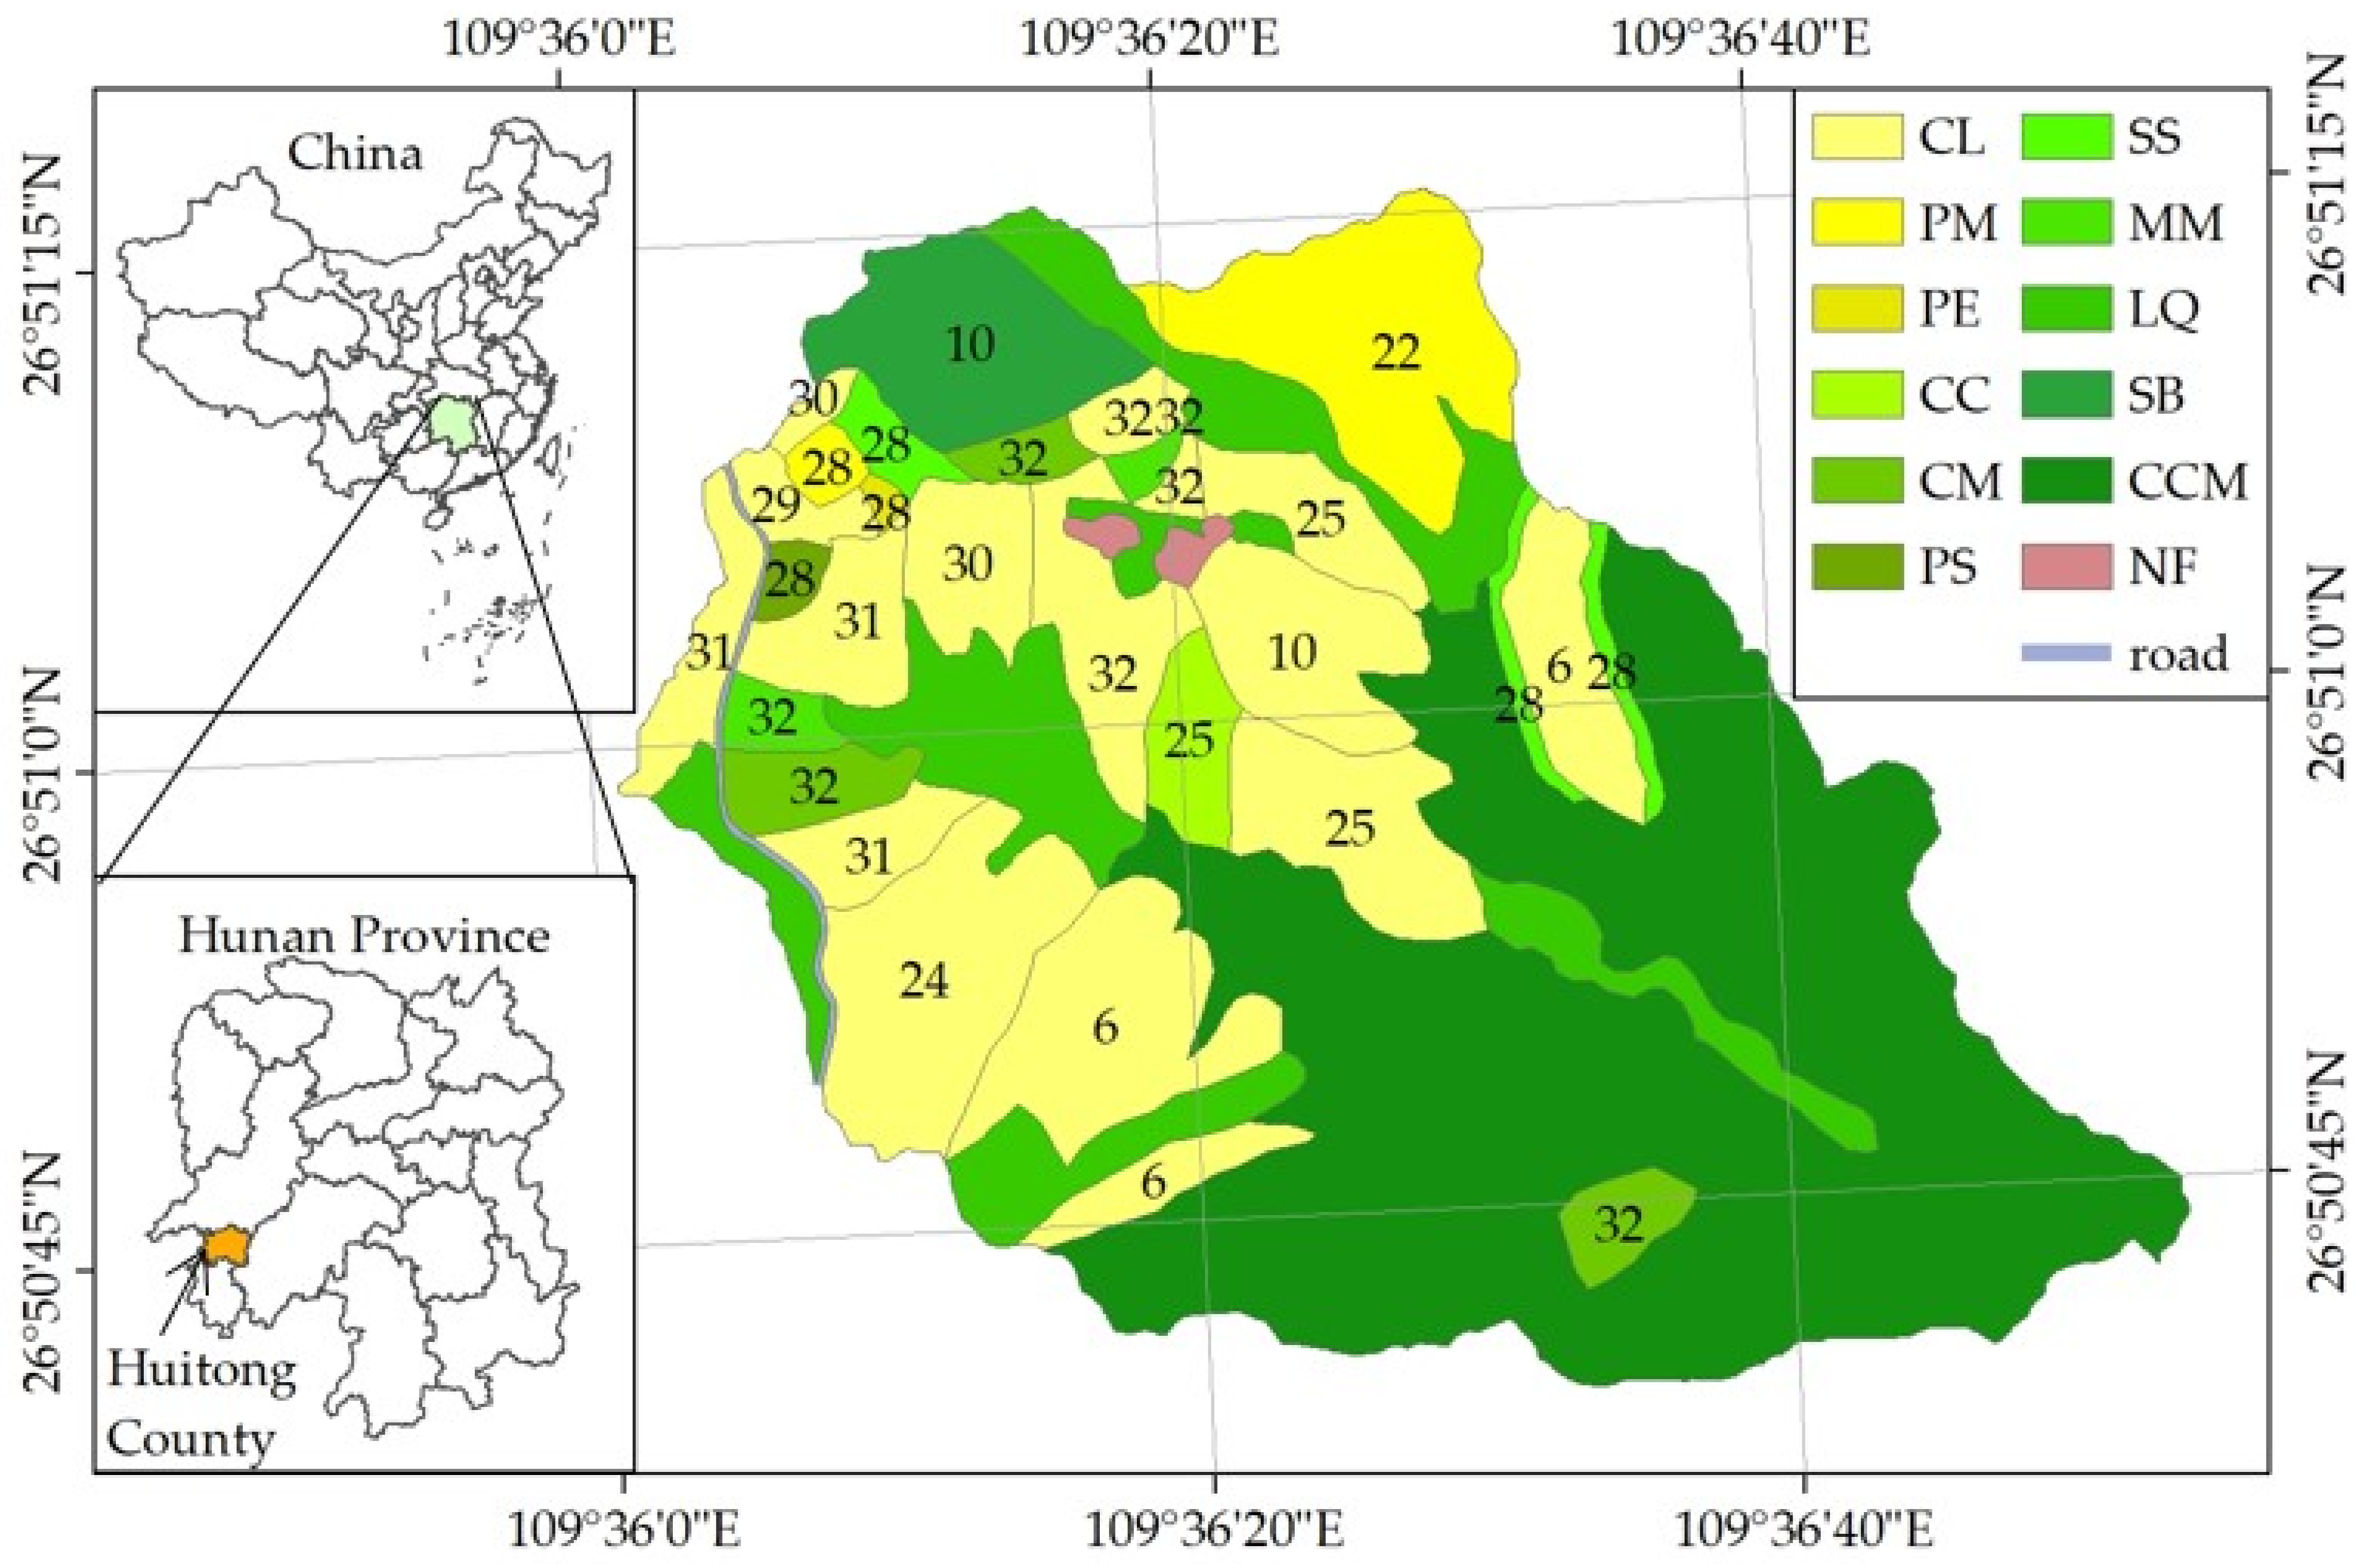
2.1. Study Area

Our study was conducted at the Huitong National Research Station of the Forest Ecosystem belonging to the Chinese Ecosystem Research Network (Huitong station, CERN). The Moshao forest farm is an experimental forest farm in the Huitong station located in Huitong County, Hunan Province, China (26°51′ N, 109°36′ E, Figure 1). Thirteen small permanent inventory plots (10 × 20 m) were established between 1983 and 1990. Measurements including the annual diameter at breast height (1.30 m aboveground) and the heights of all trees have been recorded since the plantation was first seeded. The topography of the Moshao forest farm is a small catchment of 98.24 ha, and the altitude ranges from 300 to 580 m. The study area is characterized by a subtropical monsoon climate. The mean annual temperature is 16.4 °C, with a maximum of 26.4 °C in July and a minimum of 4.1 °C in January. The annual precipitation is 1137 mm, and >70% falls during the rainy season from March to August (temperature and precipitation records derive from Huitong station’s automatic meteorological station from 1998 to 2014).
The study area has 11 tree species: C. lanceolata (CL), P. massoniana (PM), Pinus elliottii, mixed C. lanceolata and Cinnamomum camphora (CC), mixed C. lanceolata and Michelia macclurei (CM), mixed P. massoniana and Schima superba (PS), S. superba (SS), M. macclurei (MM), mixed Liquidambar formosana and Quercus fabri (LQ), mixed S. superba and Bretschneidera sinensis (SB), and mixed Castanopsis fargesii, Cyclobalanopsis glauca, and Machilus pauhoi (CCM).
The forest vegetation map of the study area was compiled using Pléiades satellite images with a resolution of 0.5 m × 0.5 m in 2014. The forest farm comprises 51.68 ha of natural forests and 46.56 ha of plantations. The dominant species are evergreen C. fargesii, C. glauca, and M. pauhoi in the natural broadleaved forest, and C. lanceolata and P. massoniana in the planted forest (Figure 1). Our research focused on MRs for plantations grouped into younger age classes. The initial age class structure for the plantations in our study area was: 14 ha in 0–10 years, 21 ha in 21–30 years, and 11 ha in 31–40 years.

2.2. Calculating Timber Production

We chose the Timber module from the Integrated Valuation of Ecosystem Services and Tradeoffs (InVEST) model to calculate timber production at the Moshao forest farm. The InVEST model is the most widely applied and successful ecosystem service evaluation model used in multiple world regions [28,29,30,31,32]. We used long-term field data from the Huitong station to parameterize the model. The following equation was used to calculate the timber production volume:
T V o l u m e = x = 1 n P a r c l _ a r e a x × P e r c _ h a r v x 100 × H a r v _ m a s s × 1 D x
where T V o l u m e is the total timber production volume (m3) of all the forest types in the study area, P a r c l _ a r e a x is the area of the xth forest type (ha), P e r c _ h a r v x is the proportion of the forest type area harvested during each rotation of the xth forest type (%), H a r v _ m a s s x is the trunk biomass of the xth forest type during each rotation (Mg ha−1), and D x is the average timber density of the xth forest type (Mg m−3).
The annual trunk biomass was calculated for each tree species using allometric equations determined by annual diameters and heights from permanent inventory plots established between 1983 and 1990. Then, we used the annual trunk biomass to establish stand growth models. Lastly, the H a r v _ m a s s x for each forest type was calculated by stand growth models.
The biomass of timber production was converted to forest stock volume by wood basic density. The latter information was directly accessed from the wood basic density table for monocultures [33]. The basic wood density was obtained for mixed forests by calculating the weighted average of the dominant tree species for each forest type.
H a r v _ m a s s x is an important parameter of the InVEST model and is simulated using stand growth models. Since the growth rate of trees follows a “slow-fast-slow-end” trend with increasing age, an S curve is used to describe it [34,35,36]. We attempted to use the power function equation, logarithmic equation, logistic equation, Richards equation, and S-curve equation to fit the stand growth model, and found that the S-curve equation ( y = e b 0 + b 1 / x ) (with the highest significance level) was most suitable for the stand growth equations in our study (Table 1).

2.3. Framework of BMR Modeling

2.3.1. BMR Modeling

A suite of indicators, including STP, FPS, and ACS, was constructed according to cutting area percentages and rotation. The BMR target for sustainable forest management was determined by comparing the change in three indicators under different MRs during a given period. We had two assumptions when identifying BMR for plantations in the Moshao forest farm: (1) tree growth is only affected by harvesting, whereas other conditions such as climate, soil, and hydrology conditions remain the same, and (2) the regeneration pattern is artificial, with 1-year-old seedlings planted after harvesting and the stand density remaining unchanged.
To achieve the multiple objectives of sustainable forest management, we considered environmental protection and economic benefit [37]. Therefore, we created the BMR model using a combination of cutting area percentages, cutting periods, and harvesting principles. From the first MR (MR1) to the nth MR (MRn), the production function of the forest increases, whereas the ecological function gradually decreases.

2.3.2. Determining BMRs

Three objectives were examined in determining optimal MRs: (a) maximization of STP, (b) minimization of FPS, and (c) minimization of ACS, represented by Equation (2). STP represents the sum of scheduled harvest levels over the planning horizon, FPS represents fluctuations in periodically scheduled timber harvest levels represented by the coefficient of variation (CV) for scheduled timber harvest levels, and ACS is the age class structure of plantations at the end of the planning horizon, which is quantified by the CV of the stand area for each age class.
BMR = f(STP, FPS, ACS)
Firstly, we identified the optimal combinations for each pair of the three indicators—STP, FPS, and ACS—to determine the BMR. The BMR was determined by the intersection of each pair’s optimal combination from the set of actions examined. The data were first standardized due to the indicators’ different dimensions. For instance, in the STP and FPS pair, the closer a point is located to the upper left corner, the higher STP and lower FPS meet the aim of the BMR. Likewise, the optimal combinations of STP and ACS are located in the upper left corner, whereas the optimal combinations of ACS and PFS are in the lower left corner [38]. Then, we used a comprehensive index of FPS + (1 − ACS) + (1 − STP) to select the highest number and processed the data in Microsoft Office 2019.

2.3.3. Identification of Potential MRs

Based on the framework for modeling BMR, 16 MRs were developed to represent combinations of possible management criteria, including cutting area percentages of 10–50%, cutting periods of 20, 10, and 5 years, and harvesting principles of small-area clear-cutting (≤5 ha) and large-area clear-cutting (>5 ha) (Table 2). A 100-year planning horizon was devised for each of these MRs, from 2014 to 2113. According to government regulations (Technical Survey and Design Requirements for the Forest Harvesting Area in Hunan Province, China), the rotation for all plantation species is regulated as follows: 18 years for P. elliottii, 21 years for C. lanceolata, 26 years for P. massoniana and S. superba, and 41 years for C. camphora and M. macclurei. MR7 represents the local MR (the statistical data were derived from the Forestry Department in Huitong County from 2010 to 2014).

3. Results

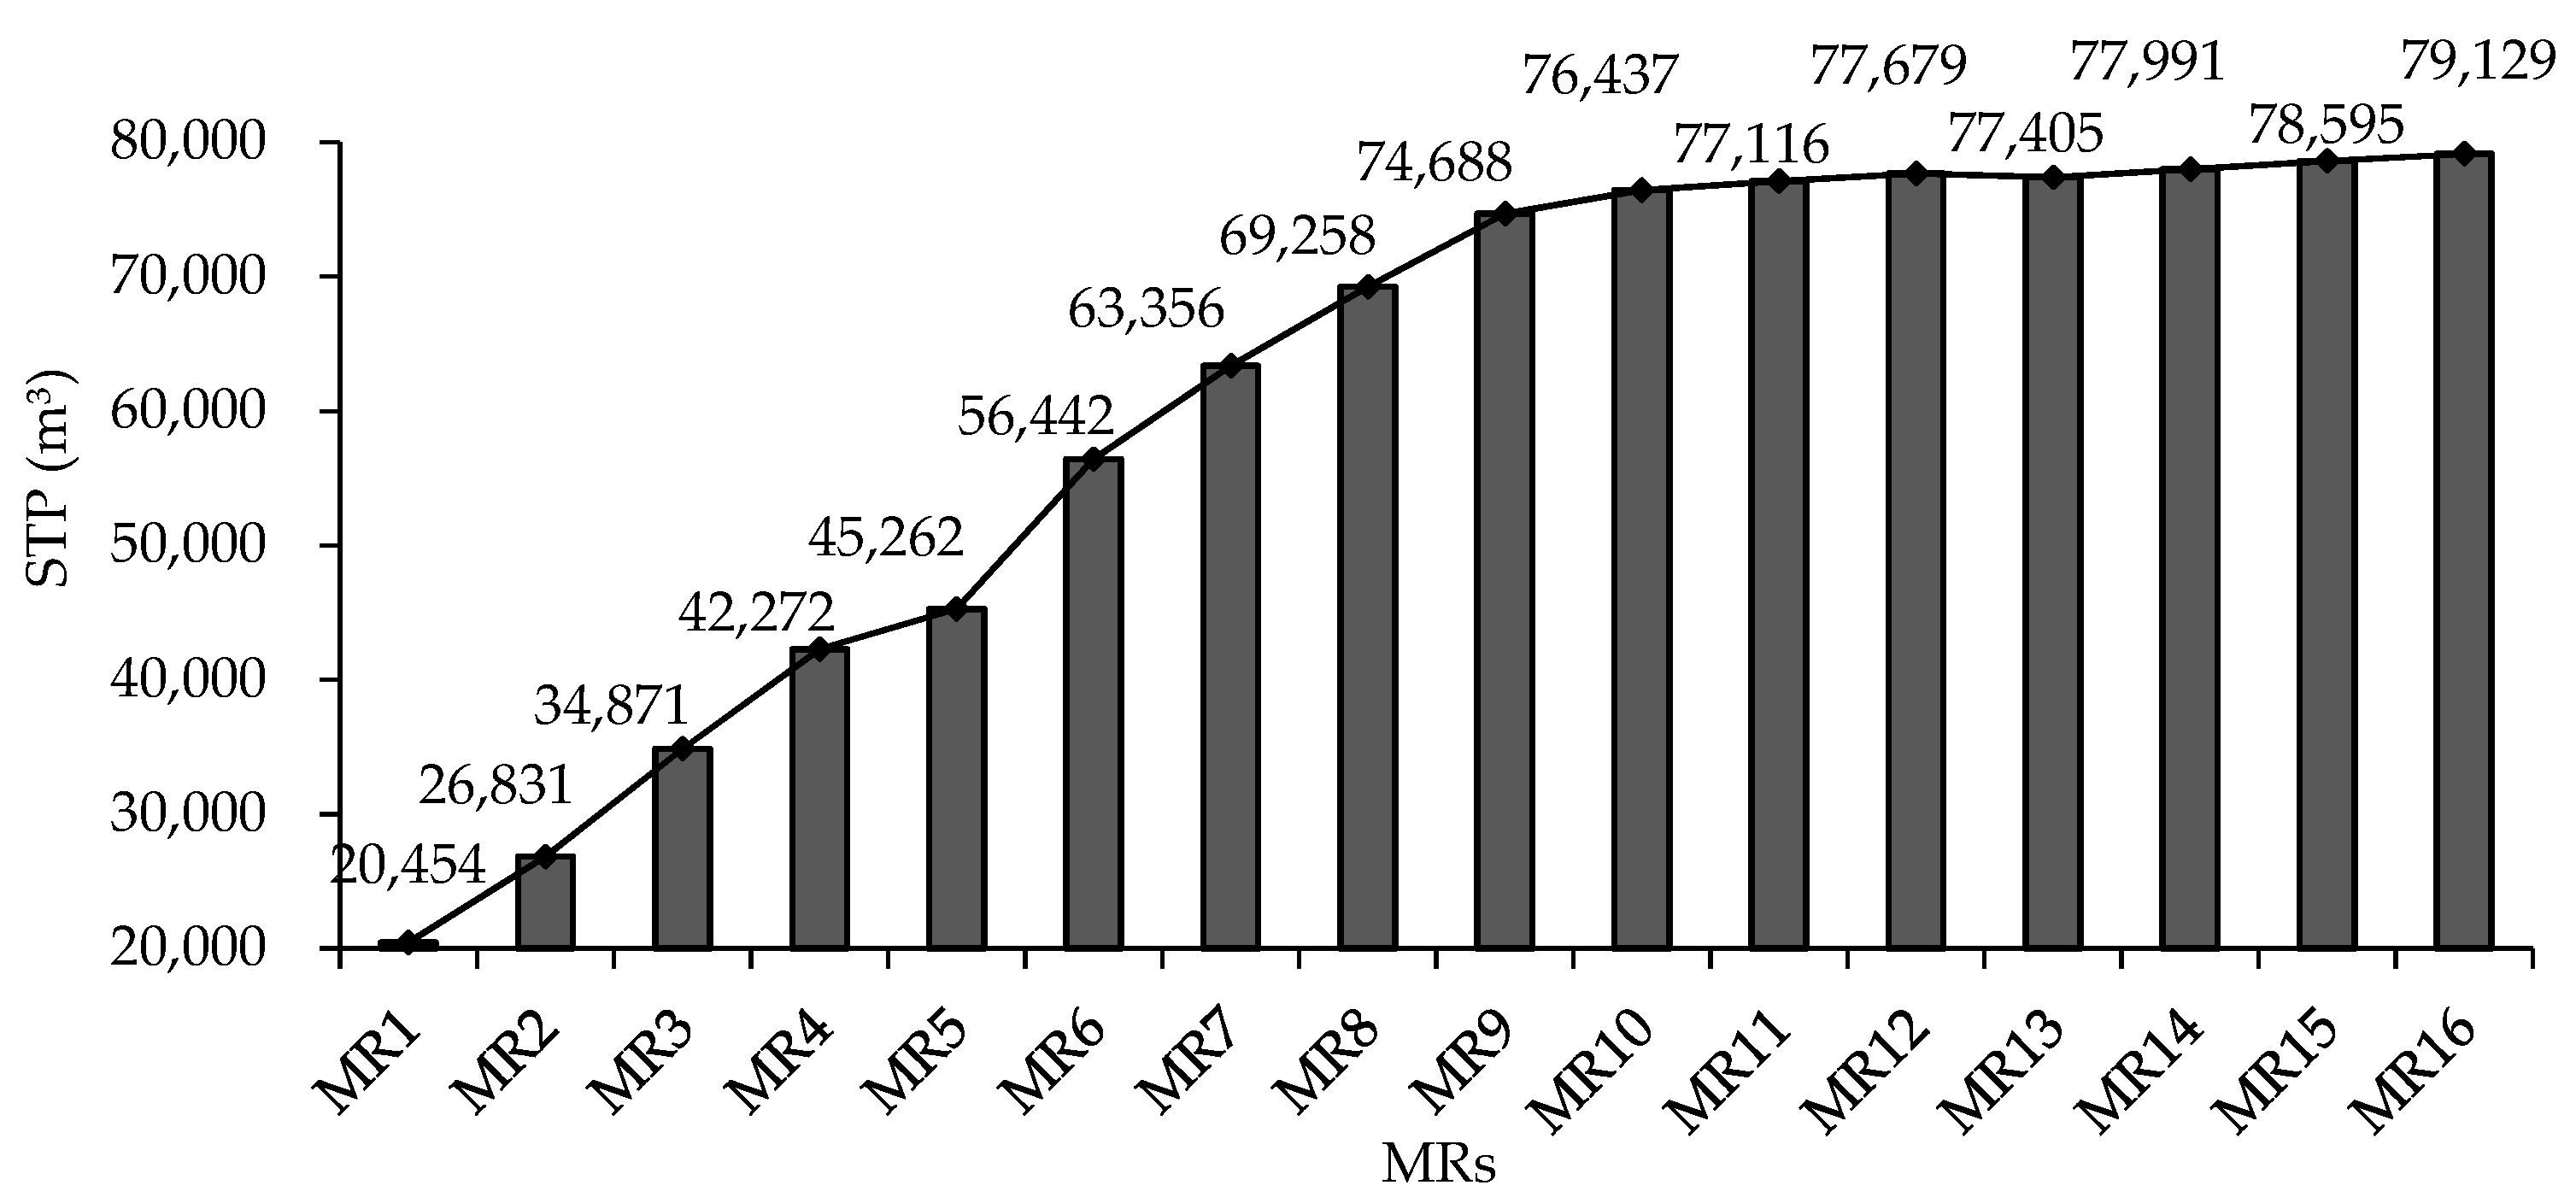
3.1. STP of Sixteen MRs

The STP gradually increased with harvesting intensity over the entire 100-year planning horizon. However, the degree of increase showed a gradually decreasing trend (Figure 2). Of the sixteen MRs, MR1 has the lowest harvesting intensity and the lowest STP, at 20,454 m3. In MRs from MR10 to MR16, an increase in STP is followed by a decrease in harvesting intensity. The STP of MR16 is the highest at 79,129 m3. MR16 produces nearly four times as much STP as MR1.

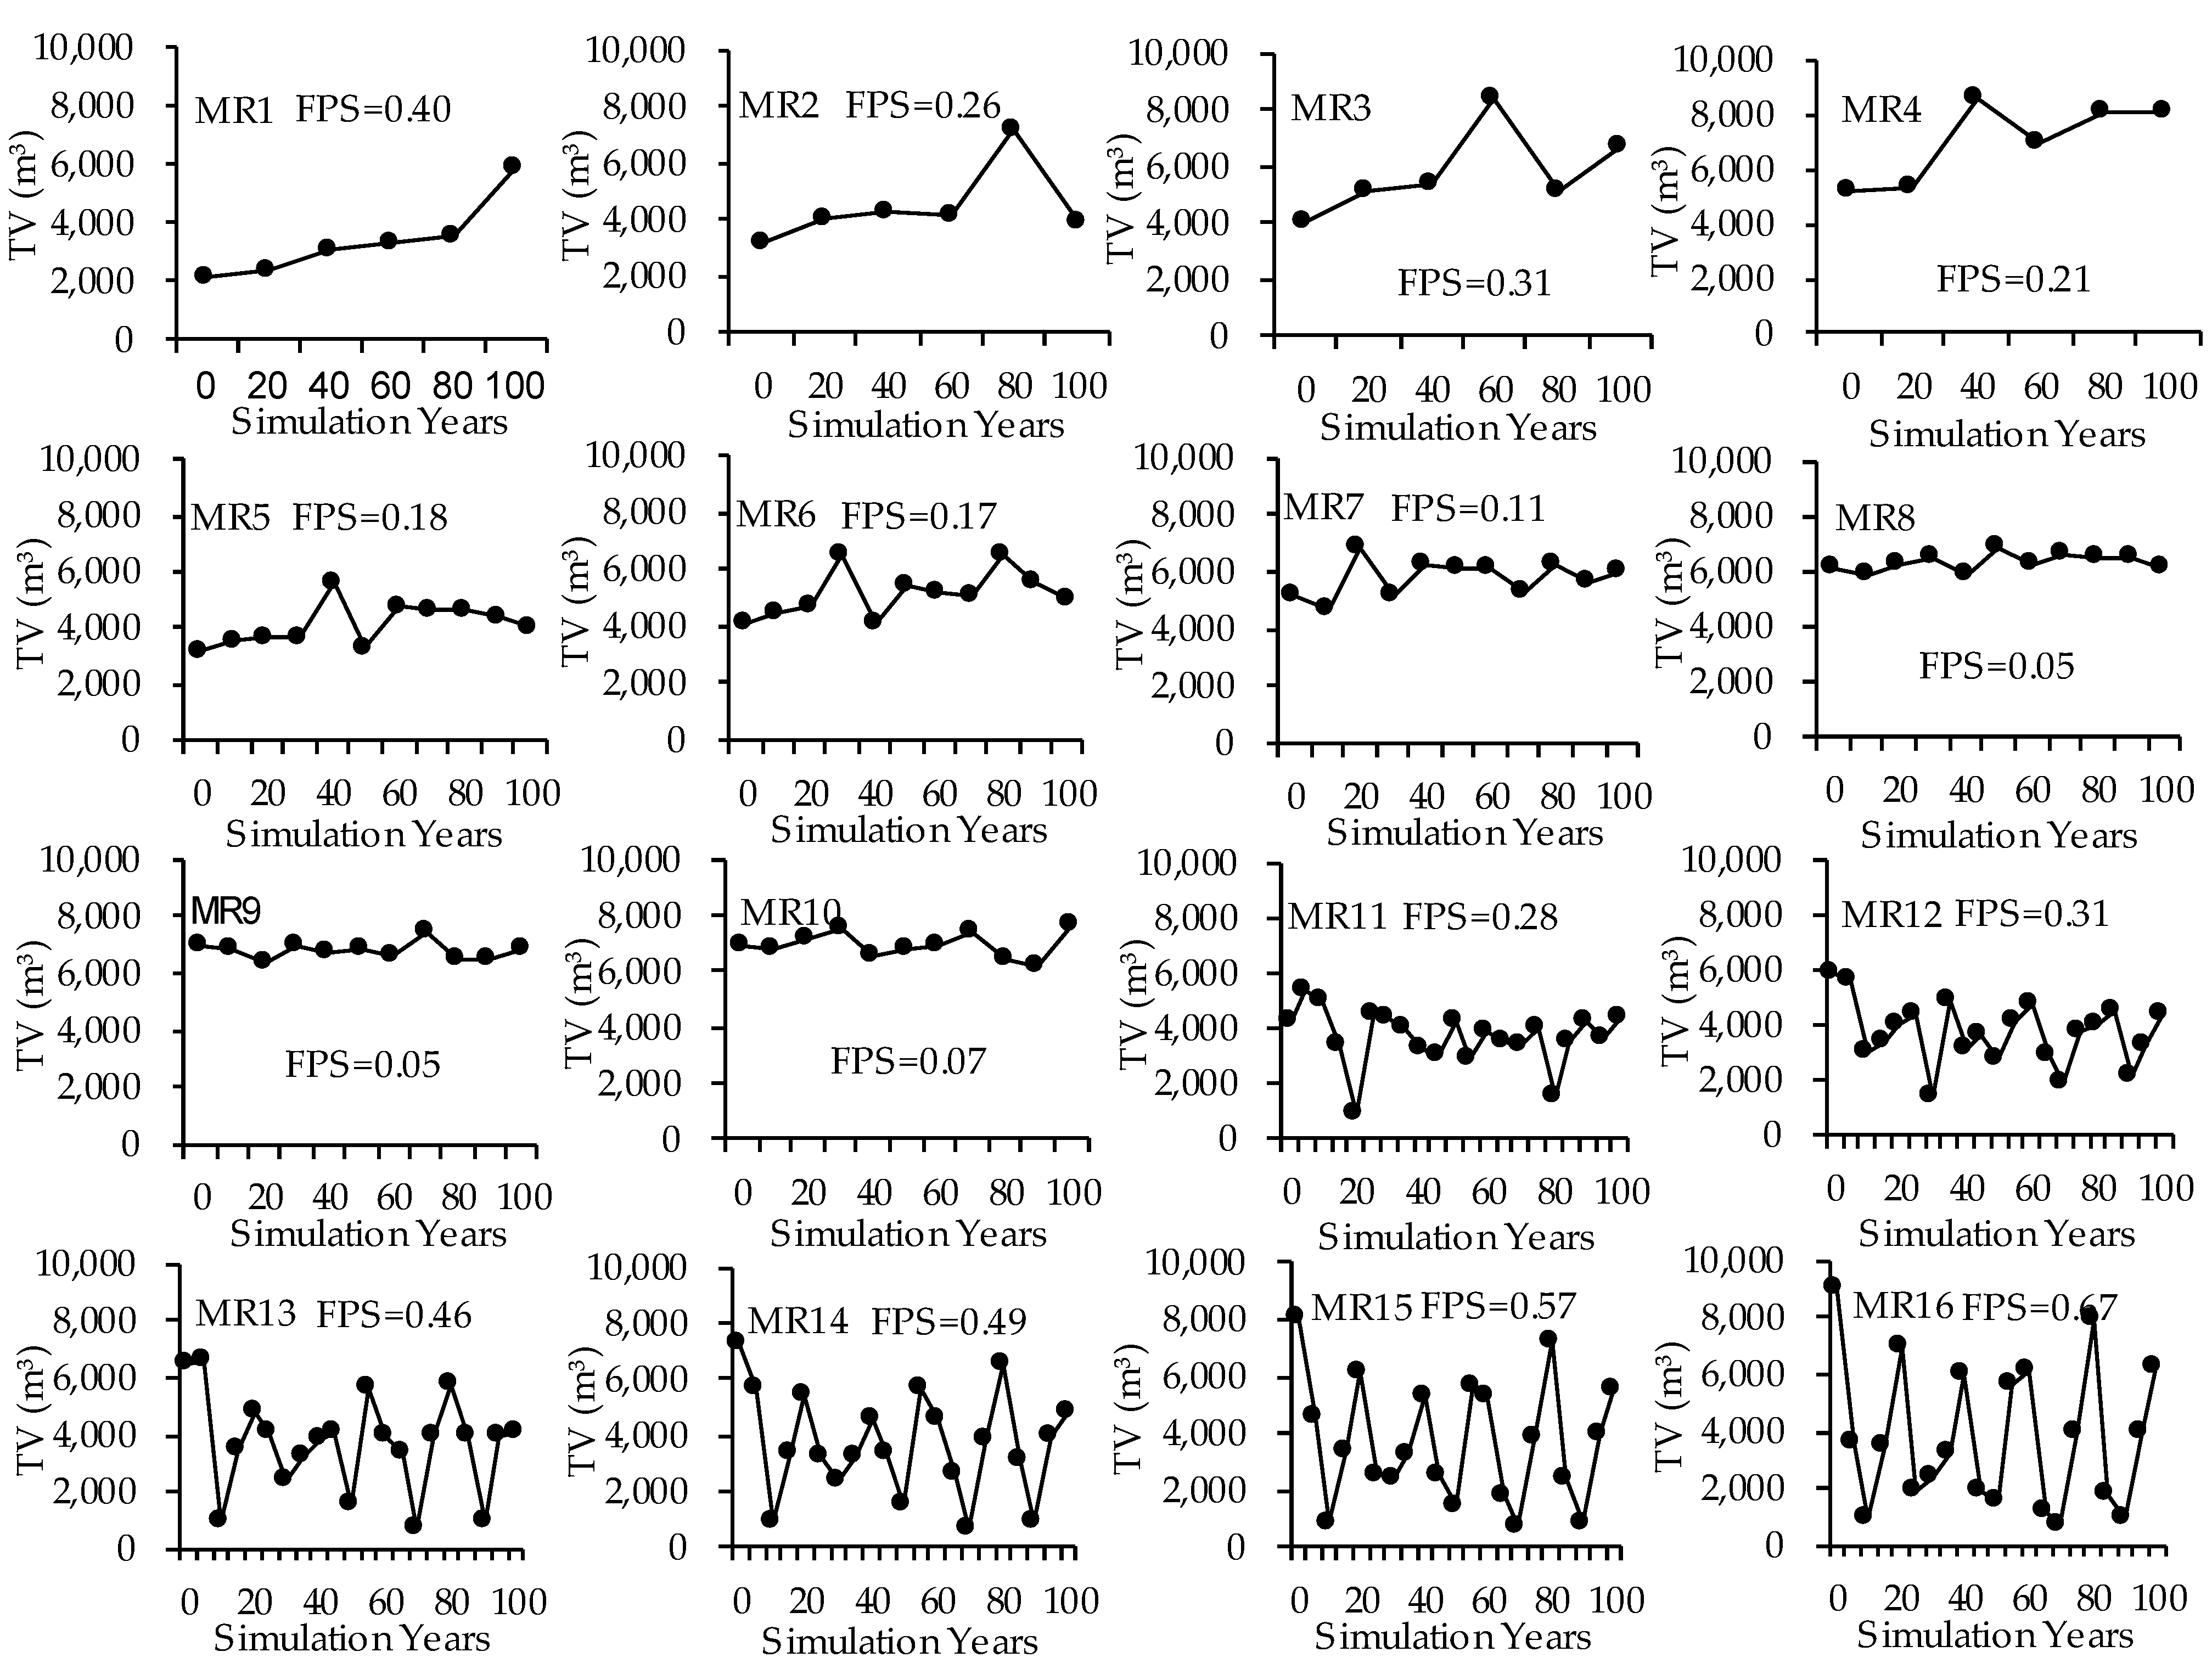
3.2. FPS of Sixteen MRs

The timber harvest volumes for the 16 MRs showed overall fluctuations during the planning horizon, especially between MR11 and MR16, which indicate a fluctuation period of approximately 20 years (Figure 3). MR1–MR4, which have cutting periods of 20 years, have the lowest harvesting intensities, and timber harvest volumes only fluctuate slightly over time. With cutting periods of 10 years, MR5–MR10 have higher harvesting intensities and lower FPS compared with those of MR1–MR4. The remaining six MRs (MR11–MR16) with cutting periods of five years have the highest harvesting intensities and FPS. It appears that FPS is the lowest for MR9 and the highest for MR16, and the difference between them reaches a factor of 14.7.

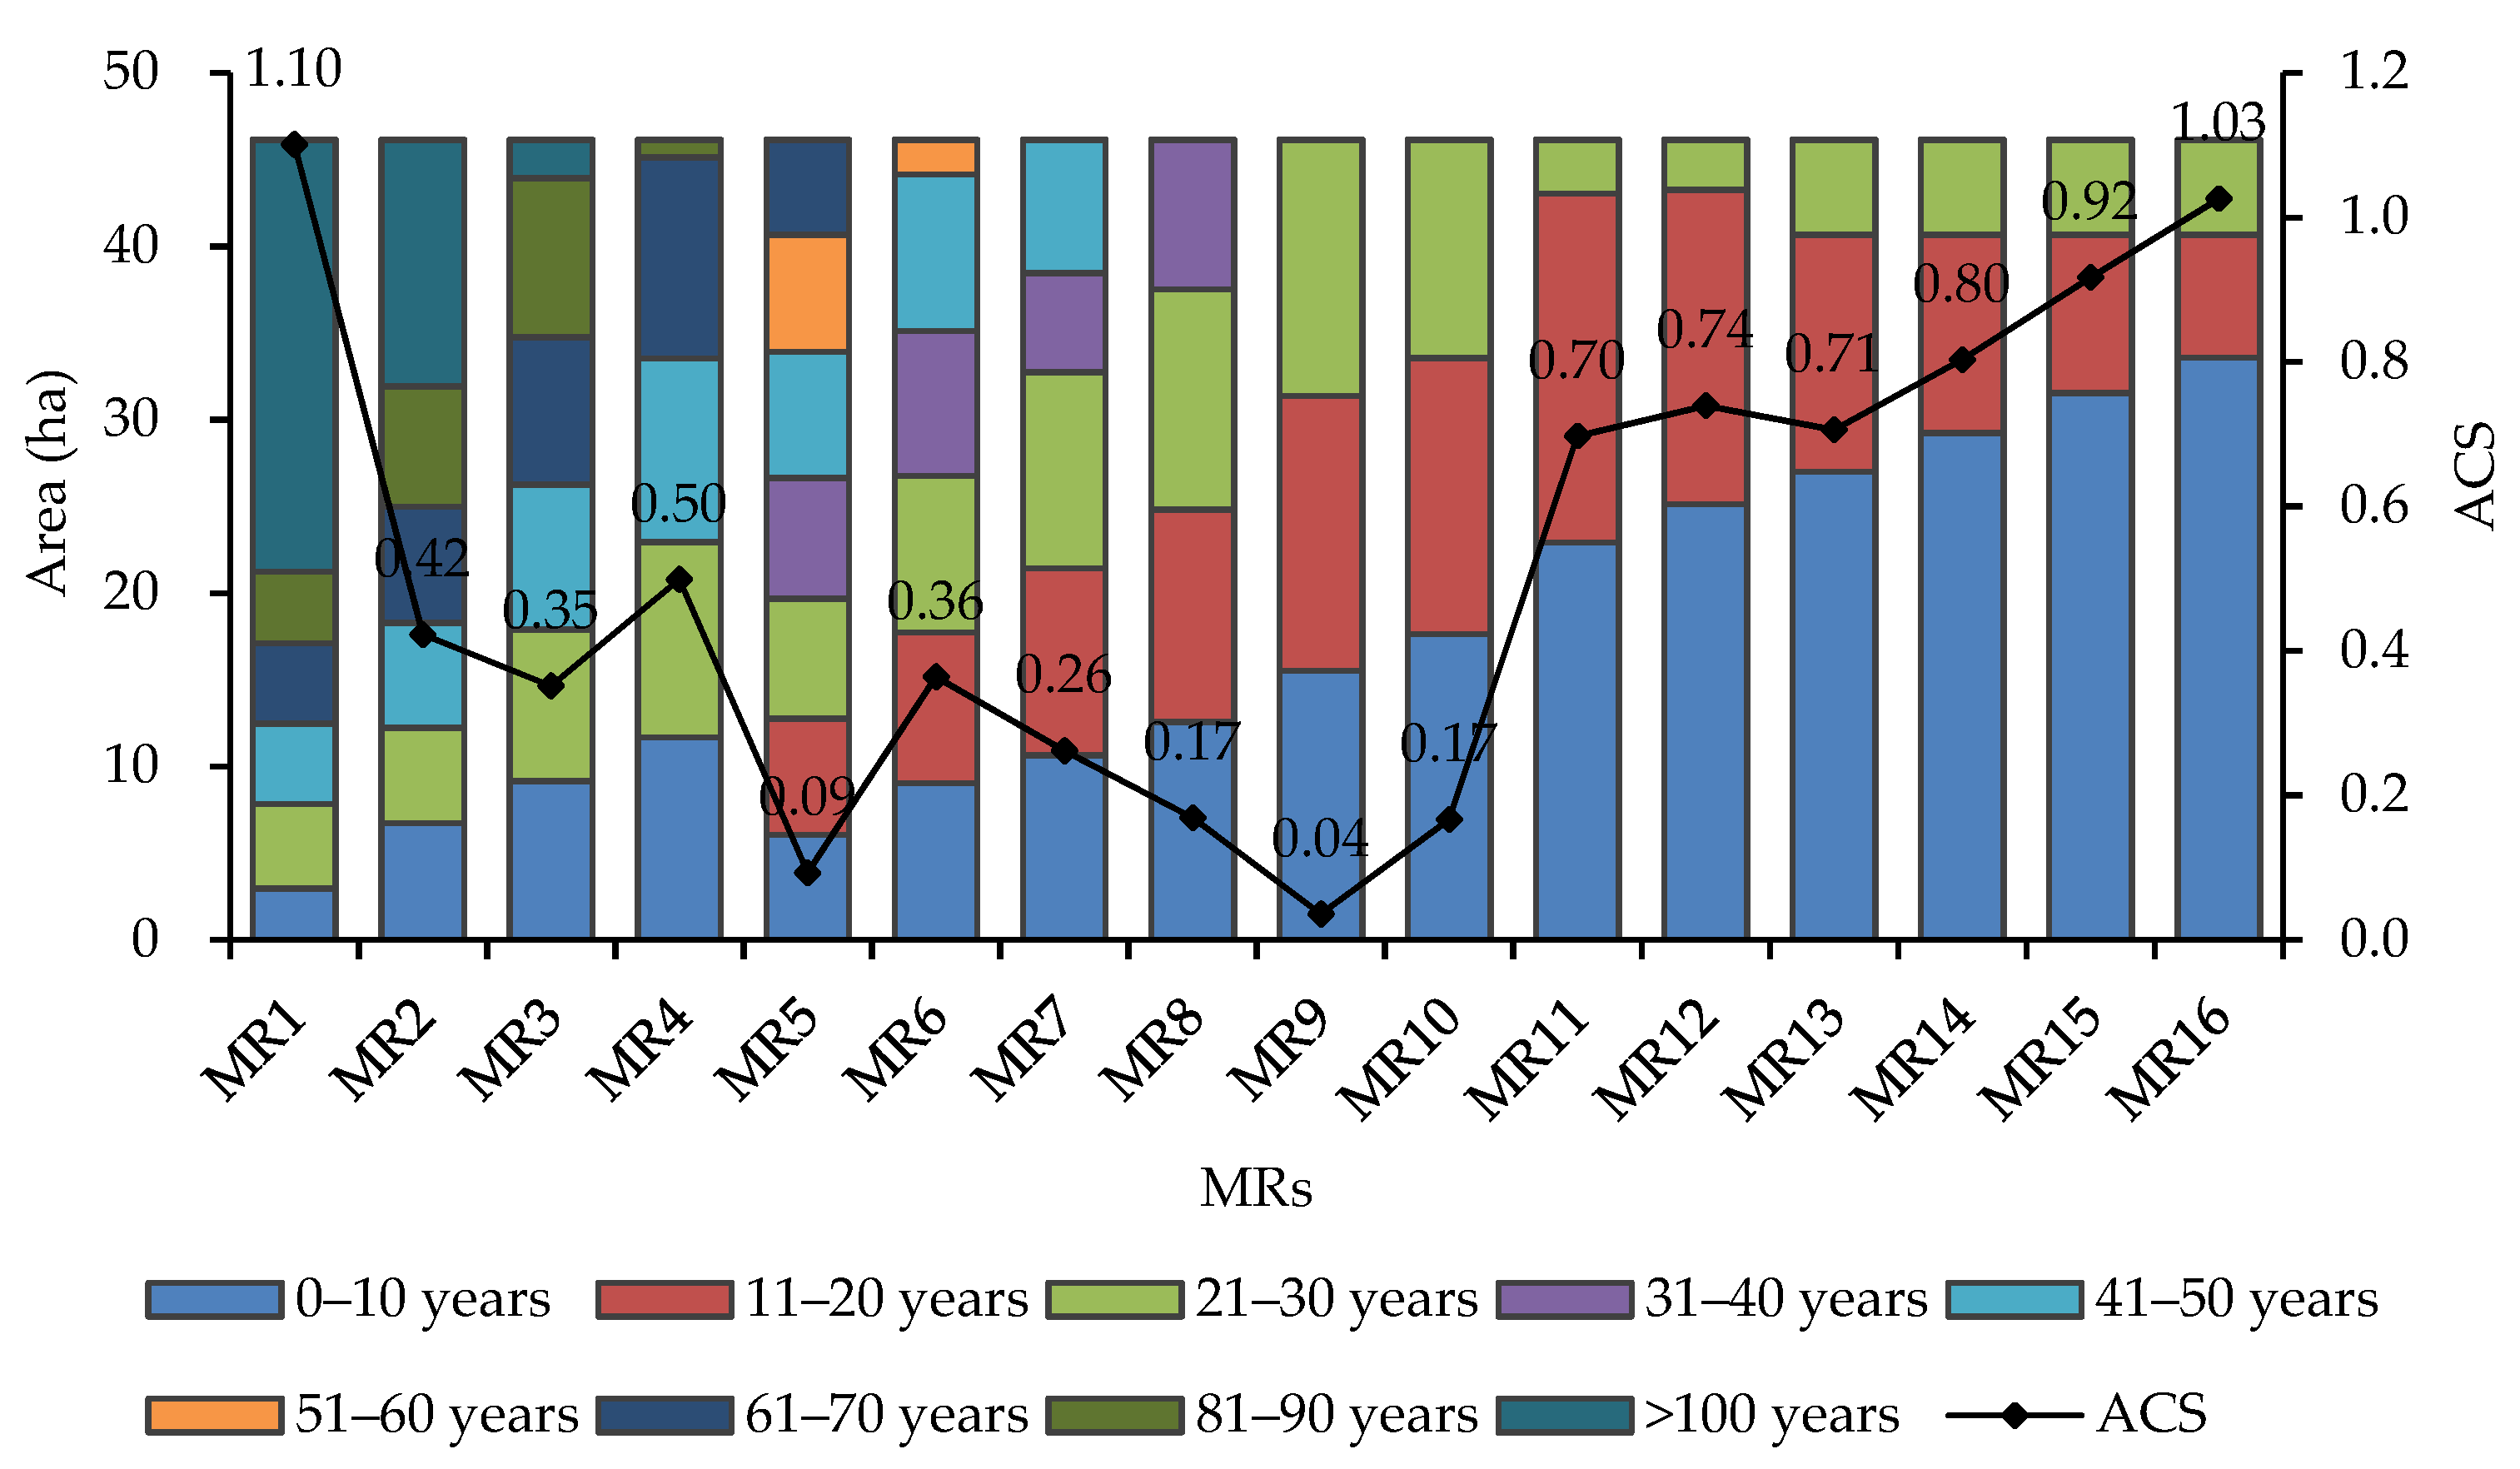
3.3. ACS of Sixteen MRs
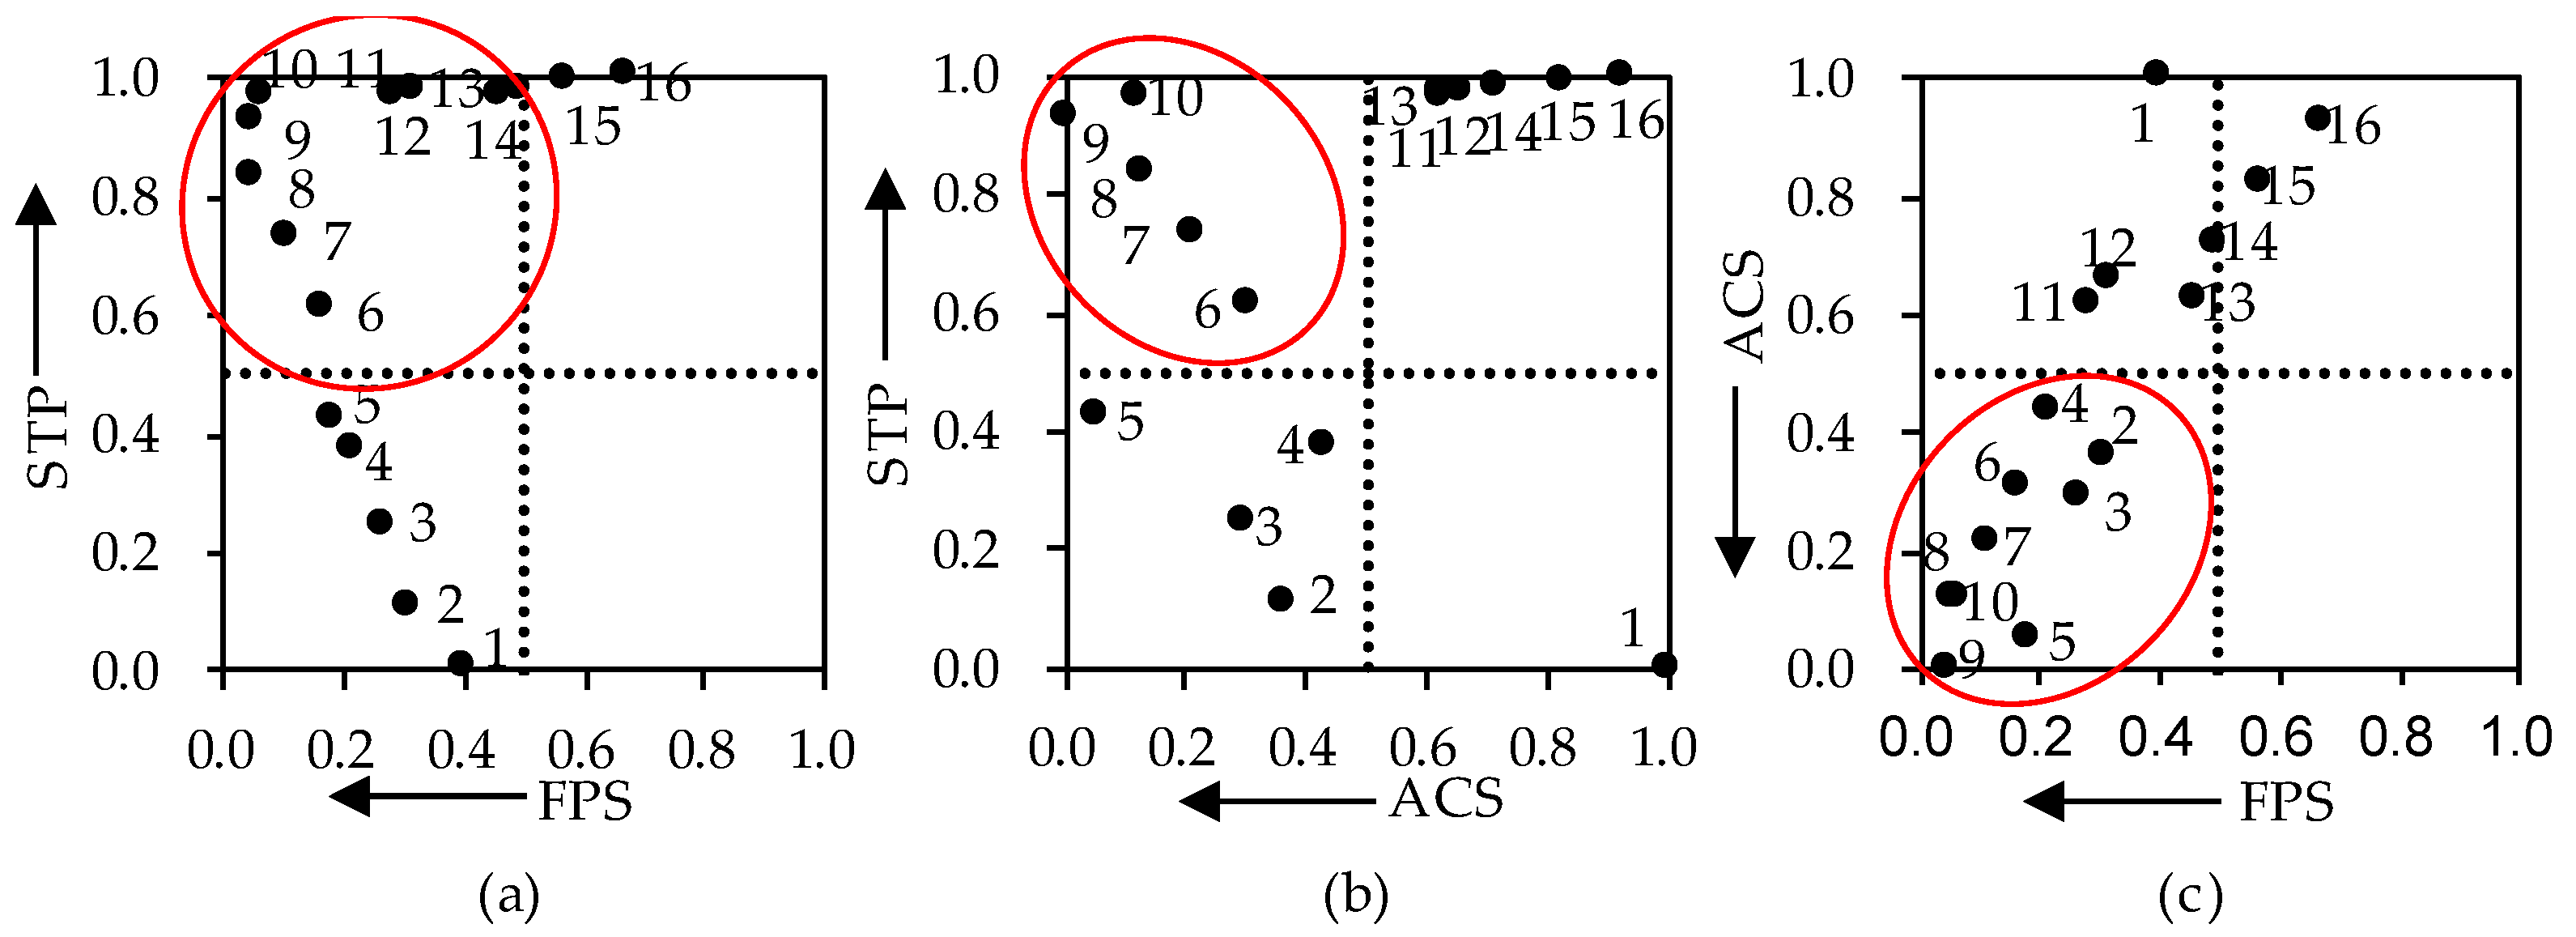
Figure 4 shows the differences in the ACS of plantations in sixteen forest MRs. In MR1–MR16, the main age class changes from an older age (>100 years) to a younger age (0–10 years) with increasing harvesting intensities. Only MR1, MR2, and MR3 leave growth stands more than a century old by the end of the planning horizon, and the total area of stands over 100 years for the three MRs is 24.93, 14.24, and 2.22 ha, respectively. The MRs from MR9 to MR16 consist of particularly young growth stands from the age class of 0–30 years by the end of the planning horizon. According to the distribution of each age class area, ACS first decreases, then increases after MR9 with harvesting intensity. Additionally, ACS is the lowest for MR9 and the highest for MR1.

3.4. Identify BMR

STP, FPS, and ACS are correlated, as shown in Figure 5. FPS and ACS initially decrease from MR1 to MR9, and then increase from MR10 to MR16 with STP (Figure 5a,b). ACS is positively correlated with FPS (y = 1.497x + 0.027, R2 = 0.783, p < 0.001, Figure 5c). The objectives of BMR may be expressed as high STP, and low FPS and ACS. The paired analysis among STP, FPS, and ACS showed that MR6–MR14 meet the objectives of high STP and low FPS, MR6–MR10 meet the objectives of high STP and low ACS, and MR2–MR10 meet the objectives of low FPS and ACS. It was concluded that MR6–MR10 are the BMRs that ideally meet the requirements of all three objectives. In particular, MR10 is the closest to the upper left corner, followed by MR9, in Figure 5a. MR9 is the closest to the upper left corner in Figure 5b and the lower left corner in Figure 5c. The comprehensive indexes of FPS + (1 − ACS) + (1 − STP) were calculated and MR9 was found to be the highest. In conclusion, MR9 is the optimal regime of the sixteen MRs developed.

4. Discussion

By designing multiple MRs with a wide range of harvesting intensities, the results from STP, FPS, and ACS show different variations with increasing harvesting intensity. Whereas STP increased with harvesting intensity, FPS and ACS first decreased and then increased. A critical threshold for STP, FPS, and ACS appears to be a harvesting intensity of 35% every 10 years (MR9). Additionally, further increases in harvesting intensity have a minimal effect on STP and a significant effect on FPS and ACS. Our cumulative results indicate that forests will not sufficiently recover to produce timber for the next harvest when the harvesting intensity exceeds the critical threshold, and this finding is consistent with a previous study that suggested the benefit of productivity increase with increasing harvesting intensity. However, it would decline when the ecosystem degraded with more intense use [39].
All plantation species are prescribed a relatively short rotation at 18–41 years. Consequently, the results of FPS and ACS show that timber harvest volumes in MRs with high harvesting intensities fluctuate substantially over time and the stand areas for each age class significantly differ from each other. Similar results were found in other studies focused on the appropriate harvesting intensity for the stand-level management of uneven-aged forests. For example, Huth and Ditzer reported that short cutting periods result in strong fluctuations of timber production from each harvesting event [40]. Baskent and Keles showed that forest management planning strategies aimed at the maximum timber production mainly consist of younger forest stands at the end of the planning horizon [41]. However, our results also show that ACS increases linearly with FPS, and high ACS and FPS occur in MRs with relatively low harvesting intensities. This can be explained by forest growth that is not harvested for its potentially harvestable stands, which generate a large number of older trees under a lower harvesting intensity, and harvest timber volumes increase over time in most cases. These results clearly state that the comprehensive benefit of forest management is directly affected by harvesting intensity.
We integrated three forest management objectives, including STP, FPS, and ACS, into forest management planning using a paired analysis. The simulation results suggest that cutting area percentages of 20–40% and a cutting period of 10 years combined with small-area clear-cutting (≤5 ha) MRs (MR6–MR10) may be BMRs for the Moshao forest farm in Southern China. MR9 with a cutting area percentage of 35% is the optimal regime. The results of forest MRs also show that low FPS and ACS of these BMRs can be attained without significantly reducing timber production. This study confirms the advantages of appropriate harvesting intensity to maintain relatively diversified age classes and ensure sustainable forest management [42,43].
By comparing the results of multiple forest MRs, we found that the local forest MR, MR7 (25% of harvest area every 10 years), meets the objectives of the BMRs in our study area. However, more benefits can be obtained from forests by increasing harvesting intensity appropriately. These results were influenced by regional and local forest MRs from historical forest management objectives in China [44]. Excessive timber harvesting was encouraged following the former direction of entirely unregulated wood production, and annual forest quotas were strictly imposed to monitor the reduction in forest resources since the mid-1980s [11,45]. Our study demonstrated the positive impacts of controlling annual forest quotas and some of their restrictions. We determined the following recommendations for future forest management: small-area clear-cutting (≤5 ha), a cutting area percentage of 35% combined with a cutting period of 10 years or equivalent harvesting intensity (such as 3.5% harvest area every year), and increasing the current local harvesting intensity while balancing between timber production and the ecological impact on plantations [46].
Our study has some key limitations and potentials for future work. Firstly, we hypothesized in our research that tree growth is only affected by harvesting activities; however, more factors, such as improved productivity, climate change, and fire disasters, should also be considered. Secondly, managers aim to maximize economic value in most cases, not just volume, and this is especially important if higher-value products are valued. Thirdly, the purpose of our study was to provide a simple method for identifying BMRs from a limited set of examined actions. The problem may have been better formulated in a goal programming manner, which requires an advanced mathematical background. Finally, various harvesting intensities were used to represent the degree of ecological protection. The ecological functions of forests, such as water and soil conservation, should be treated as indicators of multiple-objective management in future research.

5. Conclusions

In our study, we constructed a framework for BMR modeling in plantations at the stand level with a focus on the Moshao forest farm. We used a paired analysis to determine the BMRs for several potential MRs to augment the scientific support of the sustainable management of plantations in the red-soil hilly region of Southern China. To devise more precise and feasible forest harvesting planning, a reasonably low harvesting intensity combined with small-area clear-cutting is recommended for a MR.

Author Contributions

J.Z. and E.D. designed this study and performed the statistical analysis; S.W. conducted the study and collected important background information; J.Z. drafted the manuscript; D.Z. reviewed and edited the manuscript. All authors have read and agreed to the published version of the manuscript.

Funding

This research was funded by National Natural Science Foundation of China, grant number 32001240, National Key R&D Program of China, grant number 2020YFA0608200, 2018YFC1508805 and 2017YFC1502903.

Institutional Review Board Statement

Not applicable.

Informed Consent Statement

Not applicable.

Data Availability Statement

Data is contained within the article.

Acknowledgments

We would like to express our appreciation to Yan Shaokui, Yu Xiaojun, Zhang Xiuyong, and Huang Ke at the Huitong National Research Station of Forest Ecosystem for their help in data collection. We would also like to express our deep thanks to our colleagues Zhou Heng, Zhang Xiao, and Xu Jianning for their assistance in field work. Data for annual timber production were provided by the Forestry Department in Huitong County without any fee.

Conflicts of Interest

The authors declare no conflict of interest.

References

  1. Assessment, M.E. Ecosystems and Human Well-Being: A Framework for Assessment; Island Press: Washington, DC, USA, 2003. [Google Scholar]
  2. Zhao, T.Q.; Ouyang, Z.Y.; Zheng, H.; Wang, X.K.; Miao, H. Forest ecosystem services and their valuation in China. J. Nat. Resour. 2004, 19, 480–491. [Google Scholar]
  3. Carle, J.; Holmgren, P. Wood from Planted Forests A Global Outlook 2005–2030. For. Prod. J. 2008, 58, 6–18. [Google Scholar]
  4. FAO. Global Forest Resources Assessment 2020: Main Report; Food and Agriculture Organization: Rome, Italy, 2020; pp. 30–34. [Google Scholar]
  5. Payn, T.; Carnus, J.-M.; Freer-Smith, P.; Kimberley, M.; Kollert, W.; Liu, S.; Orazio, C.; Rodriguez, L.C.; Silva, L.N.; Wingfield, M.J. Changes in planted forests and future global implications. For. Ecol. Manag. 2015, 352, 57–67. [Google Scholar] [CrossRef] [Green Version]
  6. Hou, L.; Zhang, Y.; Li, Z.; Shao, G.; Song, L.; Sun, Q. Comparison of Soil Properties, Understory Vegetation Species Diversities and Soil Microbial Diversities between Chinese Fir Plantation and Close-to-Natural Forest. Forests 2021, 12, 632. [Google Scholar] [CrossRef]
  7. Dai, E.; Zhu, J.; Wang, X.; Xi, W. Multiple ecosystem services of monoculture and mixed plantations: A case study of the Huitong experimental forest of Southern China. Land Use Policy 2018, 79, 717–724. [Google Scholar] [CrossRef]
  8. Stokely, T.D.; Kormann, U.G.; Verschuyl, J.; Kroll, A.J.; Frey, D.W.; Harris, S.H.; Mainwaring, D.; Maguire, D.; Hatten, J.A.; Rivers, J.W.; et al. Experimental evaluation of herbicide use on biodiversity, ecosystem services and timber production trade-offs in forest plantations. J. Appl. Ecol. 2021, 00, 1–15. [Google Scholar] [CrossRef]
  9. Fang, J.; Chen, A.; Peng, C.; Zhao, S.; Ci, L. Changes in Forest Biomass Carbon Storage in China between 1949 and 1998. Science 2001, 292, 2320–2322. [Google Scholar] [CrossRef]
  10. China’s State Forestry Administration. China’s Forest Resources Report, 2004–2018; China Forestry Publishing House: Beijing, China, 2019. [Google Scholar]
  11. Zhang, H.R.; Tang, S.Z. Theory of ecology-based forest harvesting. Sci. Silvae Sin. 2008, 44, 127–131. [Google Scholar]
  12. Chen, X.; Ju, Q.; Lin, K. Development Status, Issues and Countermeasures of China’s Plantation. World For. Res. 2014, 27, 54–59. [Google Scholar]
  13. Liu, Q.; Yin, H.; Cheng, X.; Lin, B.; Hu, R.; Zhao, C.; Yin, C. Problems and Strategies of Sustainable Regeneration of Plantation Ecosystem in China. World For. Res. 2010, 23, 71–75. [Google Scholar]
  14. Pearse, P.H. Conflicting Objectives in Forest Policy: The Case of British Columbia. For. Chron. 1970, 46, 281–287. [Google Scholar] [CrossRef] [Green Version]
  15. Huang, Z.L. The general situation of mathematical model used to foreign forest management. For. Investig. Des. 1977, 2, 34–40. [Google Scholar]
  16. Morgenstern, E.K. The origin and early application of the principle of sustainable forest management. For. Chron. 2007, 83, 485–489. [Google Scholar] [CrossRef] [Green Version]
  17. Hirigoyen, A.; Acuna, M.; Rachid-Casnati, C.; Franco, J.; Navarro-Cerrillo, R. Use of Optimization Modeling to Assess the Effect of Timber and Carbon Pricing on Harvest Scheduling, Carbon Sequestration, and Net Present Value of Eucalyptus Plantations. Forests 2021, 12, 651. [Google Scholar] [CrossRef]
  18. Clements, S.E.; Dallain, P.L.; Jamnick, M.S. An operational, spatially constrained harvest scheduling model. Can. J. For. Res.-Rev. Can. Rech. For. 1990, 20, 1438–1447. [Google Scholar] [CrossRef]
  19. Gustafson, E.J. HARVEST: A timber harvest allocation model for simulating management alternatives. In Landscape Ecological Analysis; Springer: New York, NY, USA, 1996; pp. 109–124. [Google Scholar]
  20. Jemali, N.J.N.B.; Shiba, M.; Zawawi, A.A. Strategic Forest Management Options for Small-Scale Timber Harvesting on Okinawa Island, Japan. Small-Scale For. 2015, 14, 351–362. [Google Scholar] [CrossRef]
  21. Boston, K.; Bettinger, P. An analysis of Monte Carlo integer programming, simulated annealing, and tabu search heuristics for solving spatial harvest scheduling problems. For. Sci. 1999, 45, 292–301. [Google Scholar]
  22. Shabani, N.; Sowlati, T. Evaluating the impact of uncertainty and variability on the value chain optimization of a forest biomass power plant using Monte Carlo Simulation. Int. J. Green Energy 2016, 13, 631–641. [Google Scholar] [CrossRef]
  23. Baskent, E.Z.; Jordan, G.A. Forest landscape management modeling using simulated annealing. For. Ecol. Manag. 2002, 165, 29–45. [Google Scholar] [CrossRef]
  24. Moriguchi, K. Acceleration and enhancement of reliability of simulated annealing for optimizing thinning schedule of a forest stand. Comput. Electron. Agric. 2020, 177, 105691. [Google Scholar] [CrossRef]
  25. Sacchelli, S.; Bernetti, I. Integrated Management of Forest Ecosystem Services: An Optimization Model Based on Multi-objective Analysis and Metaheuristic Approach. Nat. Resour. Res. 2019, 28, 5–14. [Google Scholar] [CrossRef]
  26. Tang, D.S.; Chen, S.J.; Bian, F.L.; Wan, X.X. Genetic Algorithms for Forest Harvest Adjustment. In International Conference on Future Computer and Communication (FCC 2009), 1st ed.; Peoples R China: Wuhan, China, 2009. [Google Scholar]
  27. Ministry of Water Resources of China; Chinese Academy of Engineering. Water and Soil Conservation and Ecological Security in the Red-Soil Hilly Region of South China; Science Press: Beijing, China, 2010.
  28. Benra, F.; De Frutos, A.; Gaglio, M.; Álvarez-Garretón, C.; Felipe-Lucia, M.; Bonn, A. Mapping water ecosystem services: Evaluating InVEST model predictions in data scarce regions. Environ. Model. Softw. 2021, 138, 104982. [Google Scholar] [CrossRef]
  29. Kadaverugu, R.; Gurav, C.; Rai, A.; Sharma, A.; Matli, C.; Biniwale, R. Quantification of heat mitigation by urban green spaces using InVEST model—a scenario analysis of Nagpur City, India. Arab. J. Geosci. 2021, 14, 1–13. [Google Scholar] [CrossRef]
  30. Kim, S.-W.; Jung, Y.-Y. Application of the InVEST Model to Quantify the Water Yield of North Korean Forests. Forests 2020, 11, 804. [Google Scholar] [CrossRef]
  31. Li, K.; Cao, J.; Adamowski, J.F.; Biswas, A.; Zhou, J.; Liu, Y.; Zhang, Y.; Liu, C.; Dong, X.; Qin, Y. Assessing the effects of ecological engineering on spatiotemporal dynamics of carbon storage from 2000 to 2016 in the Loess Plateau area using the InVEST model: A case study in Huining County, China. Environ. Dev. 2021, 39, 100641. [Google Scholar] [CrossRef]
  32. Liu, R.; Niu, X.; Wang, B.; Song, Q. InVEST Model-Based Spatiotemporal Analysis of Water Supply Services in the Zhangcheng District. Forests 2021, 12, 1082. [Google Scholar] [CrossRef]
  33. Research Institute of Wood Industry of Chinese Academy of Forestry. Physical and Mechanical Properties of Wood of Main Tree Species in China; China Forestry Publishing House: Beijing, China, 1982. [Google Scholar]
  34. Von Bertalanffy, L. Quantitative Laws in Metabolism and Growth. Q. Rev. Biol. 1957, 32, 217–231. [Google Scholar] [CrossRef] [PubMed]
  35. Richards, F.J. A Flexible Growth Function for Empirical Use. J. Exp. Bot. 1959, 10, 290–301. [Google Scholar] [CrossRef]
  36. Zeide, B. Accuracy of equations describing diameter growth. Can. J. For. Res.-Rev. Can. Rech. For. 1989, 19, 1283–1286. [Google Scholar] [CrossRef]
  37. Baskent, E.Z.; Keles, S.; Yolasigmaz, H.A. Comparing multipurpose forest management with timber management, incorporating timber, carbon and oxygen values: A case study. Scand. J. For. Res. 2008, 23, 105–120. [Google Scholar] [CrossRef]
  38. Bradford, J.B.; D’Amato, A.W. Recognizing trade-offs in multi-objective land management. Front. Ecol. Environ. 2012, 10, 210–216. [Google Scholar] [CrossRef] [Green Version]
  39. Braat, L.C.; Ten Brink, P. The Cost of Policy Inaction (COPI): The Case of Not Meeting the 2010 Biodiversity Target; Alterra: Wageningen, The Netherlands, 2008. [Google Scholar]
  40. Huth, A.; Ditzer, T. Long-term impacts of logging in a tropical rain forest—A simulation study. For. Ecol. Manag. 2001, 142, 33–51. [Google Scholar] [CrossRef]
  41. Baskent, E.Z.; Keleş, S. Developing Alternative Forest Management Planning Strategies Incorporating Timber, Water and Carbon Values: An Examination of their Interactions. Environ. Model. Assess. 2009, 14, 467–480. [Google Scholar] [CrossRef]
  42. McDonald, R.I.; Motzkin, G.; Foster, D.R. The effect of logging on vegetation composition in Western Massachusetts. For. Ecol. Manag. 2008, 255, 4021–4031. [Google Scholar] [CrossRef]
  43. Nolet, P.; Béland, M. Long-Term Susceptibility of Even- and Uneven-Aged Northern Hardwood Stands to Partial Windthrow. Forests 2017, 8, 128. [Google Scholar] [CrossRef] [Green Version]
  44. Yu, D.; Zhou, L.; Zhou, W.; Ding, H.; Wang, Q.; Wang, Y.; Wu, X.; Dai, L. Forest Management in Northeast China: History, Problems, and Challenges. Environ. Manag. 2011, 48, 1122–1135. [Google Scholar] [CrossRef] [PubMed]
  45. Dai, L.; Wang, Y.; Su, D.; Zhou, L.; Yu, D.; Lewis, B.J.; Qi, L. Major Forest Types and the Evolution of Sustainable Forestry in China. Environ. Manag. 2011, 48, 1066–1078. [Google Scholar] [CrossRef] [PubMed]
  46. Kizha, A.; Nahor, E.; Coogen, N.; Louis, L.; George, A. Residual Stand Damage under Different Harvesting Methods and Mitigation Strategies. Sustainability 2021, 13, 7641. [Google Scholar] [CrossRef]
Figure 1. Forest vegetation map of the Moshao forest farm. The numbers on the map indicate the age of the plantations, LQ and CCM are natural forests with no specific age number. NF = non-forest.
Forests 12 01358 g001
Figure 2. Variance of STP with harvesting intensity in sixteen MRs.
Forests 12 01358 g002
Figure 3. Fluctuation curve of timber harvest volume over time and FPS in sixteen MRs (TV = timber harvest volume).
Forests 12 01358 g003
Figure 4. Age class structure of sixteen MRs at the end of the planning horizon.
Forests 12 01358 g004
Figure 5. Paired analysis and relationships between STP and FPS (a), STP and ACS (b), and FPS and ACS (c). The MRs located in the red circle region are BMRs.
Forests 12 01358 g005
Table 1. Stand growth models for the Moshao forest farm, where y represents trunk biomass and x represents stand age, n represents how many trees have been used to fit the model of each species.
Forest TypesStand Growth Models
P. massonianay = e6.706−38.294/x (R2 = 0.984, p < 0.001, n = 42)
M. macclureiy = e6.198−27.263/x (R2 = 0.991, p < 0.001, n = 37)
S. superbay = e5.916−31.971/x (R2 = 0.990, p < 0.001, n = 37)
C. lanceolatay = e5.597−21.597/x (R2 = 0.982, p < 0.001, n = 20)
C. camphoray = e5.994−44.639/x (R2 = 0.977, p < 0.001, n = 24)
Table 2. Sixteen potential MRs for the Moshao forest farm were developed according to combinations of cutting area percentages, cutting periods, and harvesting principles. The intensity of cutting gradually increased from MR1 to MR16.
MRsCutting Area (%)Rotations/YearHarvest Principles
MR11020Small-area clear-cutting refers to cutting areas ≤ 5 ha and the adjacent non-harvested areas ≥ cutting area (Management Rules of Forest Cutting and Regeneration in China, 2017)
MR215
MR320
MR425
MR51510
MR620
MR725
MR830
MR935
MR1040
MR11255Large-area clear-cutting (cutting area > 5 ha)
MR1230
MR1335
MR1440
MR1545
MR1650
Publisher’s Note: MDPI stays neutral with regard to jurisdictional claims in published maps and institutional affiliations.

