
Growth Rates of Non-Native Bighead and Silver Carp in the Upper Mississippi River


1
Department of Biological Sciences, Western Illinois University, Macomb, IL 61455, USA
2
Illinois Natural History Survey, Havana, IL 62644, USA
*
Author to whom correspondence should be addressed.
Fishes 2022, 7(2), 73; https://doi.org/10.3390/fishes7020073
Submission received: 21 January 2022
/
Revised: 13 March 2022
/
Accepted: 21 March 2022
/
Published: 24 March 2022
Abstract
:Fish age and growth analyses can be used to infer spawning success, recruitment, and population age structure. Understanding these dynamics is important when assessing the impacts of invasive species, such as bighead carp, Hypophthalmichthys nobilis, and silver carp, H. molitrix, (bigheaded carp). These species have established throughout much of the Mississippi River Basin; however, Lock and Dam 19 (LD19) has slowed their establishment in the Upper Mississippi River, resulting in low-density populations with limited reproduction upstream. The age and growth of Bigheaded Carp in recently established populations, especially in this region, are poorly characterized. Therefore, we compared the age and growth of bigheaded carp for four low-density navigation pools of the Mississippi River near the invasion front with one long-established high-density population, separated by LD19. To assess growth rates and age at maturity, we estimated consensus age from pectoral spines, postcleithra, and vertebrae from 1229 bigheaded carp, 30 fish per 50 mm size class. Length at age of capture and back-calculated length-at-age were used to create growth curves using VBGC analysis. The analysis indicated higher growth rates of bighead carp and silver carp upstream of Lock and Dam 19 than downstream. Comparison of growth models with a likelihood ratio test indicated differences in length at time zero between the pools for bighead carp but not for silver carp. However, maximum length and growth rates were significantly different for silver carp upstream and downstream of the dam but not for bighead carp. These results will be used to better understand the population dynamics of this emerging population to inform control and containment actions.
1. Introduction
Fish age and growth are important tools for the management and conservation of fish species [1]. Many factors can influence growth rates (i.e., population density, water chemistry, water temperature, and prey abundance; [2,3,4]) and are often dependent on available food resources, competition, and habitat [5]. With the ability to grow quickly, reproduce copiously, and exploit available resources, invasive species can cause reduced growth rates in native species. Individuals at invasion fronts are often ‘bigger and better’ with high phenotypic plasticity [6]. These fish often display boldness and increased dispersal behavior [7], leading to competition with native species. Although more attention is given to the invasive species’ impact on growth of native species, intraspecific growth effects of invasive species do occur [8].
Bighead carp, Hypophthalmichthys nobilis, and silver carp, H. molitrix, (bigheaded carps) are invasive and abundant planktivorous species introduced into the Mississippi River system in the USA in the early 1970s. Due to their mobility, high fecundity, and ability to quickly colonize new areas, increases in their density have been associated with the decline of native planktivore body condition [9] and their own body condition [10]. Body condition and growth are often closely correlated and behave similarly in response to available resources and density dependence [11,12]. Therefore, when evaluating the abundance of invasive species and their impacts on native species, trends showing deviations from baseline values can provide an indication of their densities and potential impacts to invaded ecosystems. Although age and growth estimates have been reported for bigheaded carps [13], it is still unclear how growth responds within the invasion front.
Lock and Dam 19 on the Upper Mississippi River was likely an impediment to the upstream expansion of bigheaded carp; thus, it has limited their abundance as compared to established populations downstream [14]. In 2013 and 2014, Haun [15] used standardized pulse-DC electrofishing to assess differences in fish community composition above the dam (Pool 19) and below (Pool 20). During this period, two silver carp were sampled in Pool 19, whereas 89 silver carp were sampled in Pool 20, indicating different densities above and below the dam. This dam was designed as a high head dam, preventing open river conditions. All upstream fish passage at LD19 must occur through the 366 m lock chamber, which likely has resulted in a slow infiltration of bigheaded carp, lower densities, and, until recently, limited reproduction upstream of this barrier [16]. We hypothesized that the growth of bigheaded carp in low-density navigation pools upstream of Lock and Dam 19 (i.e., in the invasion front) will be faster, and that they will achieve a larger average size than those in established high-density populations downstream. We tested this hypothesis by aging bigheaded carp in both low- and high-density areas with sectioned postcleithra, pectoral spines, and vertebrate to calculate growth estimates and predictive von Bertalanffy curves to compare growth. These results can provide insight into density-dependent growth of bigheaded carp and determine if growth rate serves as a surrogate to indicate their invasion progression and changes in abundance over time.
2. Materials and Methods
2.1. Fish Collection
Gill and trammel nets (7.0–12.7 cm bar mesh, 2.4–9.1 m deep × 91.4–182.9 m long), and hoop nets (5, 1.5-m diameter rings with 5 cm bar mesh in front and 3.8 cm bar mesh at cod end) were used to collect fish on the Upper Mississippi River in pools 16–20 from July 2015 to June 2017 (Figure 1). Multiple sampling gears were used to obtain a robust sample over a wide range of sizes, which a single gear could not achieve. Pool 20 (downstream of Lock and Dam 19, river kilometers 552–586) has a high-density bigheaded carp population, relative to pools 16–19 (river kilometers 586–778; [17]). To represent the range of ages in the populations, we attempted to collect at least 30 fish from each 50 mm size bin (bighead carp = 600–1450 mm, silver carp = 350–1200 mm), but this was often not possible and resulted in unequal numbers across length bins. Due to low densities of bigheaded carp above LD19, samples were collected over multiple seasons to obtain robust sample sizes across length categories. Backwaters, side channels, and areas upstream of spillways were primary targets for sampling as informed by residency and movement of acoustically transmittered fish.
2.2. Aging
Identification of species, sex, total length (mm), and weight (g) were recorded for each fish in the laboratory. Three aging structures were obtained for consensus age estimates (postcleithra, principal pectoral fin ray, and vertebrae) to avoid biases associated with spatial-specific lumen formation in structures between the species. Specifically, pectoral fin ray lumen formation and annulus obstruction is more prevalent in bigheaded carp in high-density areas, but the opposite is true for postcleithra in bigheaded carp from the low-density locations (J. Lamer, Illinois Natural History Survey, unpublished data). Postcleithra (left) and first pectoral fin ray (left) were dissected with a knife, placed into a labeled coin envelope, and dried for 48 h, at approximately 32 degrees C, in a custom-made dryer. Both structures were taken from the left side of the fish to ensure consistency. All structures were sectioned using a low-speed Isomet saw (Buehler, Lake Bluff, Illinois). Postcleithra were sectioned at the middle of the curve on the transverse plane [18], while pectoral spines were sectioned directly above the condyle and the basal recess (2 sections from each structure, 500-µm each). Five vertebrae were removed using a hand or reciprocating saw, just posterior to the first two fused vertebrae of the spinal column, anterior to the dorsal fin. The vertebrae were then boiled for 20 s to remove residual flesh and allowed to air dry for 48 h, and one undamaged vertebra was sectioned twice (500-µm sections) through the nucleus. Each section was photographed at 5× magnification using a Leica S8 APO stereomicroscope and a Leica MC170 HD microscope camera. Two readers recorded age estimates, and if disagreement between two readers occurred, structures were looked at in concert and an agreement reached. If disagreement between readers persisted, a third reader was used to resolve the age. One year was added to assigned age if the fish was caught during winter months, and no annuli was seen near the outer edge.
Despite our attempts to catch smaller individuals in gill nets (7 cm, 7.6 cm, and 8.9 cm bar mesh) and electrofishing, the effort to sample bigheaded carp was biased towards catching larger older fish because the primary effort was with large mesh nets (10.2 cm and 12.7 cm bar mesh gill nets) for removal by contract fishers for control purposes. To avoid sampling bias when creating growth curves, a stratified random sample of 30 fish per each 50 mm size class was used. Due to the high annual recruitment variability observed in these species [19,20], it is likely that many of these smaller size classes were not present or not very abundant in the population during our sampling. Therefore, to anchor our growth curves and to bolster our sample sizes for length-at-age for smaller age classes of silver carp (less than 600 mm) and bighead carp (less than 800 mm), we used vertebral cross sections to back-calculate length-at-age using the Dahl-Lea method. The Dahl-Lea method assumes that fish length is directly proportional to scale (vertebrae) radius [21]. We used vertebrae cross sections from 130 individuals based on the clarity of annuli, lack of central lumen, and radial shape. We modified the Dahl-Lea formula for use with vertebrae, and it is as follows:
where Li is the estimated length at ith age, Vi is the radius to the ith annulus, VC is the total vertebrae radius at time of capture, and LC is the total length of the fish at time of capture.
Vertebral annulus radii measurements, in µm, were recorded in Leica Application Suite software (Leica Microsystems, Wetzlar, Germany). Only back-calculated lengths up to age four were used for analysis to avoid the potential effects of Lee’s Phenomenon [22], and no fish were used to produce multiple length–age estimates (e.g., if a fish was used to estimate length at age 4 with the Dahl-Lea method, it could not be used to estimate length at age 3, 2, or 1) to avoid bias from the dependent nature of estimates from the same fish [23].
2.3. Statistical Analysis
Mean length-at-age was calculated for each species collected from each pool and compared at each age using an ANOVA in R [24]. Residual plots were used to test for normality. A Tukey’s Honestly Significant Difference (HSD) test was used to determine which pools differed at each age. Growth was modeled using the von Bertalanffy model implemented by the FSA [25] and AICcmodavg [26] packages in R [24] to create growth curves and statistically compare estimated parameters among the pools:
where l is the length at time t, L∞ is the average maximum length, K is the growth coefficient, and t0 is the theoretical time at which lt = 0 [27]. Using the methods outlined by Ogle [28], starting values were found for the model parameters L∞, K, and t0 for each pool separately, using length-at-age data via polynomial regression. These were then fit to the general von Bertalanffy model as well as two and single parameter models to find the best fit. A likelihood ratio test from the FSA package [25] was used to compare models to determine which parameters differed by pool.
3. Results
3.1. Fish Collection and Aging
Postcleithra and pectoral spines were obtained from 1203 fish, including 501 bighead carp and 702 silver carp from Pools 16 to 20 (Table 1). Of the bighead carp sampled, 55% were female and 45% were male, and for the silver carp sampled, 65% were female and 35% male.
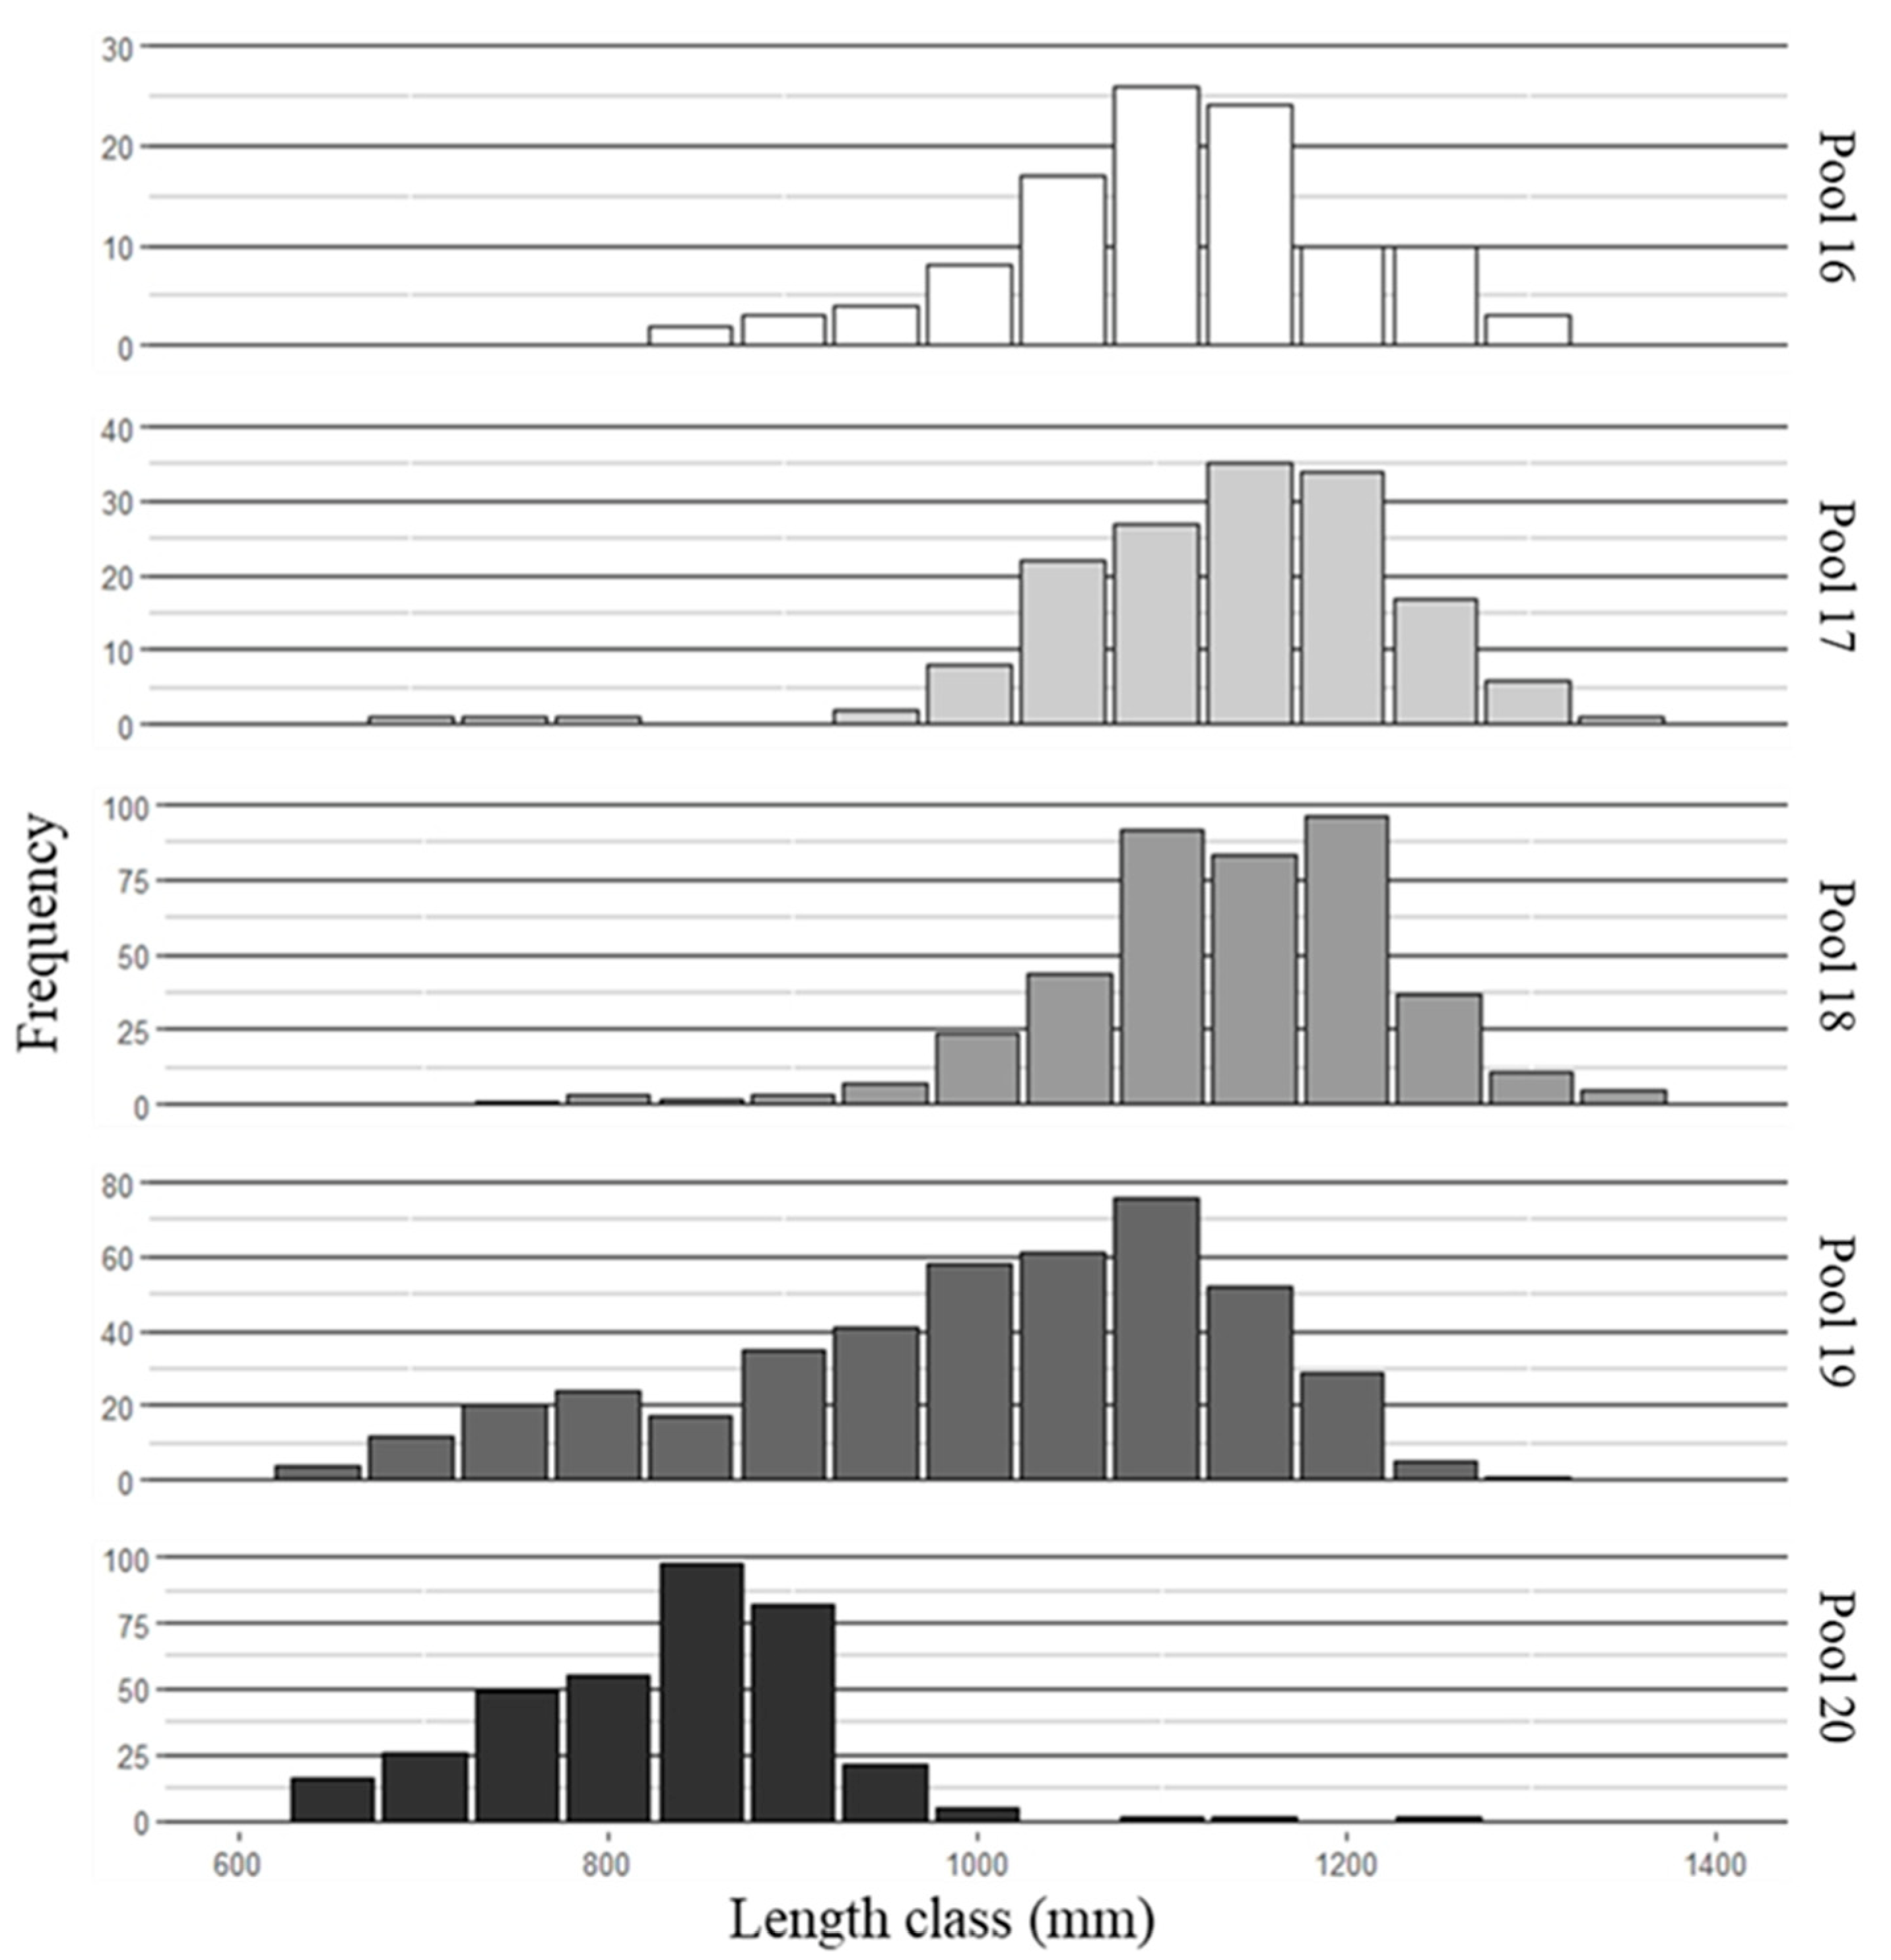
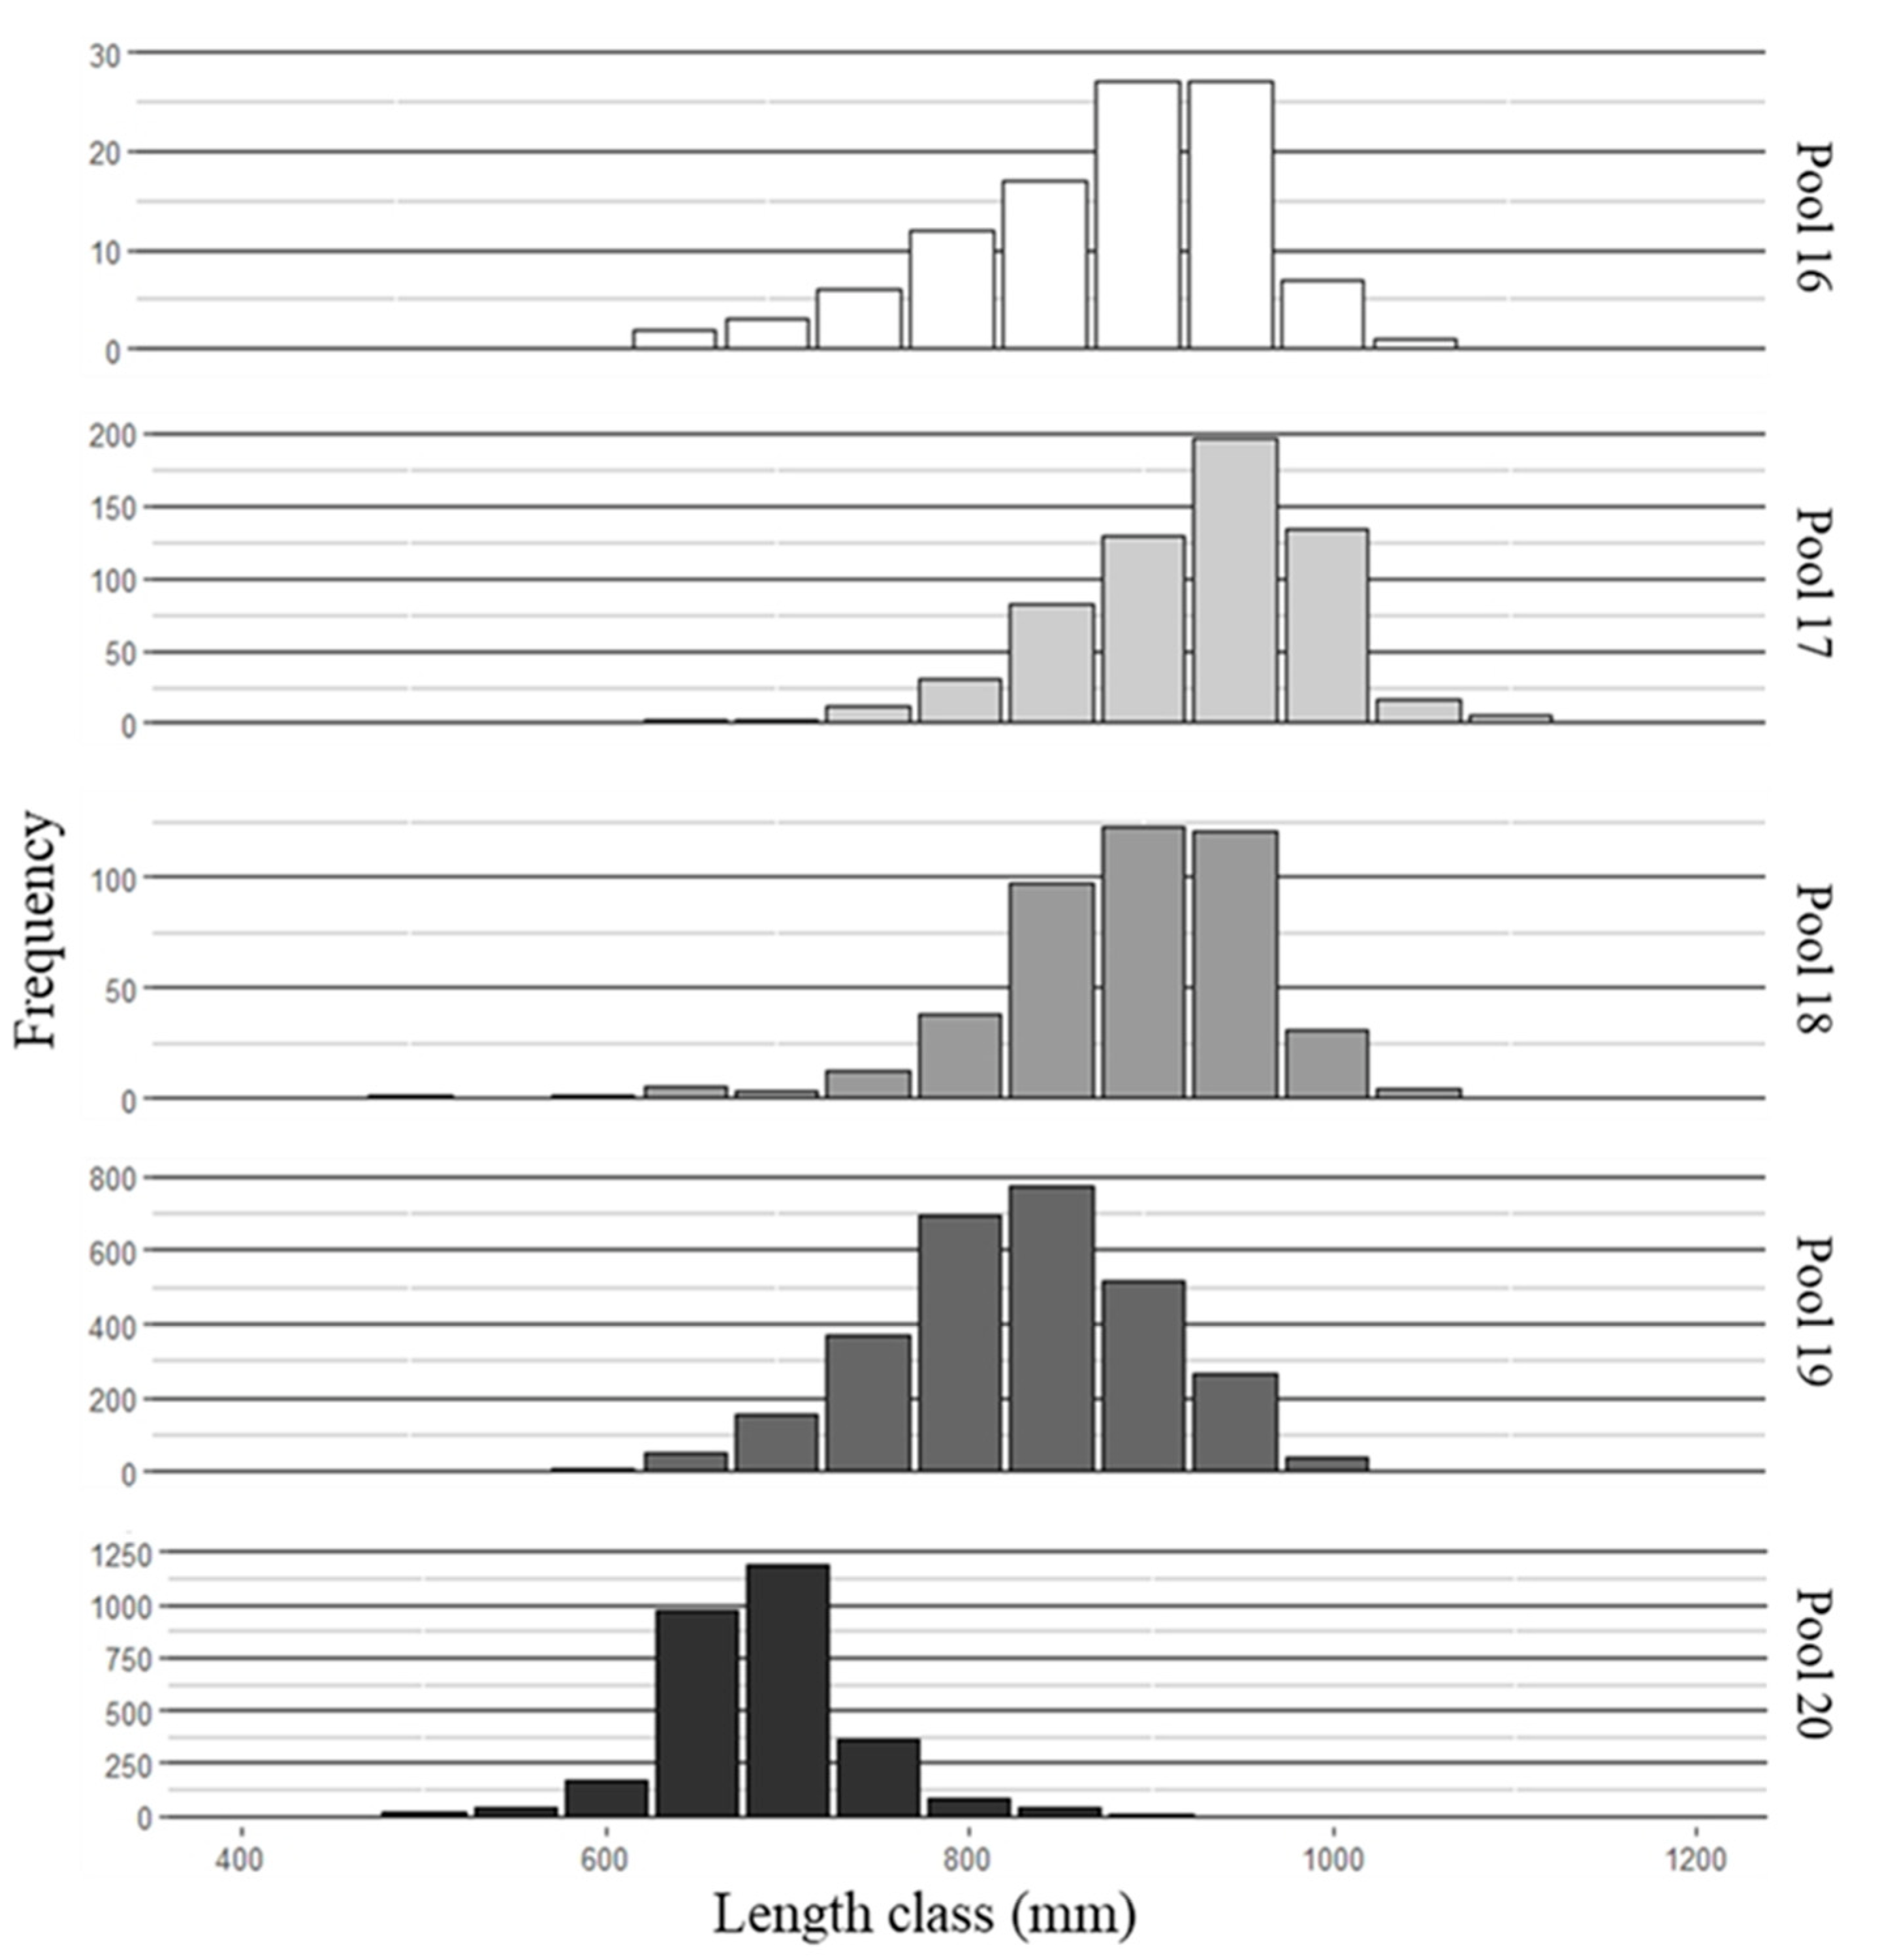
Pool 16 is at the leading edge of the invasion front, and fish were difficult to obtain from this pool, resulting in lower sample sizes of both species compared to pools 17–19 (Figure 2 and Figure 3).
Pool 20 sample sizes were also lower, because the majority of fish sampled were of similar size and fell into a narrow length range (650–750 mm). Complete age agreement between readers for all structures was 70.3%, and 98.3% agreement ±1 year. Agreement ±1 year for pectoral ray and postcleithra, pectoral ray and vertebrae, and postcleithra and vertebrae were 99.4%, 100%, and 92.5% respectively. Moreover, to estimate growth for fish younger than age 4, mean length-at-age was determined from back-calculated length-at-age from vertebrate increments (n = 128 fish: n = 67 bighead carp, n = 61 silver carp; Table 1). A combination of estimated (Dahl-Lea) and observed length-at-age were used for ages 3 and 4. Only estimated length-at-age was used for ages 1 and 2.
3.2. Mean Length-at-Age
Mean length-at-age after age five for both species was significantly lower (α = 0.05) for Pool 20 populations (high-density) compared to pools 16–19 (low-density; Table 2). The maximum age for bighead carp collected in Pool 20 was 9 years, and 11, 11, 12, and 12 years for pools 16–19, respectively. The maximum age for silver carp collected in Pool 20 was 7 years, and 8, 8, 9, and 10 years for pools 16–19, respectively. In pools 16–18, the most prominent age class of bigheaded carps present was 6–8 years. In Pool 19, this shifted to 5–7 years, and in pool 20, the most common age was 5 years. At age five, bighead carp upstream of LD19 were an average estimated length of 1056 (±35) mm versus 782 (±37) mm downstream. Silver carp at age five averaged 896 (±20) mm total length upstream of LD19 versus 676 (±9) mm downstream.
3.3. Von Bertalanffy Growth Curves
Comparison of potential growth models by the likelihood ratio test indicated a best fit model of L∞ and t0 (4 df; α = 0.01) for bighead carp, and L∞ (4 df; α = 0.005) for silver carp. Residual plots were examined to verify fit of growth models. Table 3 describes the calculated variables for each Von Bertalanffy equation for each pool. Pool 20 growth curves for both bighead carp and silver carp demonstrated smaller average maximum length compared to all upper pools. Bigheaded carp exhibited similar growth among upper pools (Figure 4). Bighead carp also exhibited different lengths at t0 between pools 16–18, Pool 19, and Pool 20 (Table 3).
4. Discussion
Differences in growth rates upstream and downstream of Lock and Dam 19 for bighead carp and silver carp indicate a potential density-dependent growth effect downstream. The growth curves suggest that bighead carp have a similar age at reproduction both upstream and downstream of Lock and Dam 19 but exhibit greater growth upstream of LD19. Age-at-reproduction is indicated by a decrease in the growth rate as the growth curve begins to reach an asymptote [29]. Silver carp growth rates began to decrease and reach the maximum asymptote 1–2 years earlier downstream of Lock and Dam 19 than upstream. Resource limitation or early onset of reproduction below LD19 may explain this difference. The lack of resource limitation upstream of Lock and Dam 19 may mask the shift to reproduction in the growth curves [29]. Supporting our findings that suggest density-dependent intraspecific competition below LD19, a recent study by Coulter et al. [10] found that the bigheaded carp’s condition decreased as density increased in the Illinois River.
In newly established populations, where resources are not limiting, high growth rates and early maturation are common [13,30]. A similar trend can be seen with African jewelfish in the Everglades. Populations from the invasion front had higher fitness, better body condition, and higher reproductive investment than the already established populations [31]. With reduced competition, individuals on the leading edge of an expanding population can trigger an increase in reproductive investment in order to establish the population quickly [32]. If the population of bigheaded carp reaches numbers in which interspecific competition occurs frequently, native populations of filter feeders and juveniles of other species may be adversely affected by diminished food resources.
The population of bigheaded carp upstream of Lock and Dam 19 has significantly greater mean length-at-age, growth rate, and larger sized individuals than the population in Pool 20 downstream of the dam. Consistent with our findings, increased growth rates of low-density bigheaded carp populations were also observed in newly established silver carp in the middle Mississippi River in 2003 [13]. They found silver carp to average 317.7 mm of growth in the first year and reach sexual maturation at 2–3 years. Lampo (Illinois Department of Natural Resources, unpublished data) found that silver carp in the high-density population of the LaGrange reach of the Illinois River were only 80–100 mm at the end of the first year of growth. Age 1 silver carp in our study averaged 216 mm in the pools upstream of the dam, intermediate of the two studies. However, these estimates are similar to length-at-capture of young-of-year bigheaded carp collected in 2016 from Pool 18 and 19, Kentucky and Barkley Lakes, and Gobindsagar Reservoir, India at the end of the first year of growth [13,33,34,35].
The frequency of hybrids in the population may also play a role in differing growth rates. Morphologically, later generation bighead carp and silver carp hybrids are very difficult to distinguish from each parental species. We were able to filter out early generation hybrids from our sample morphologically, indicated by twisted gill rakers [36]. Lamer et al. [36] found that early generation hybrids of bigheaded carp have a much lower body condition than that of parental species or later generation hybrids, which could also relate to lower growth rates. However, Lamer et al. (2015) found that early generation hybrids were more abundant at the leading edge of populations; thus, the growth effects we found (increased growth at the leading edge relative to established populations) would be contradictory to the effect suggested by Lamer et al. [17]. Had we not filtered out early generation hybrids, our results may not have been contradictory to Lamer et al. 2015.
Low densities of bigheaded carp above Lock and Dam 19 led to difficulties obtaining sufficient sample sizes in a single season. Samples were collected in an even effort throughout seasons each year to obtain robust samples. This may have resulted in increased variability in length-at-age estimates among individuals. Low sample sizes from Pool 16 and the lack of smaller individuals and underrepresented age classes may slightly bias growth curves. Our estimates also may be biased by the incorporation of back-calculated lengths.
Growth rates among pools upstream of Lock and Dam 19 were similar. This similarity might be explained by similar low densities and high longitudinal connectivity among pools. Lock and dams 16, 17, and 18 reach open river conditions frequently to control water levels in these pools [37]. During open river conditions, bigheaded carps can travel upstream between pools through dam spillways and open main channel gates rather than through lock chambers. Although many fish have a strong fidelity to a particular reach, tracking of telemetered bigheaded carp has determined that interpool movement in the reach between LD 15 and LD19 is common during high water conditions [38].
Density differences might not be the only factor contributing to growth differences upstream and downstream of LD19. The types of aquatic areas available for bigheaded carps upstream and downstream of the dam also differ. The pools upstream of Lock and Dam 19 have a greater proportion of off-channel habitats (i.e., backwaters, impounded habitats, and tributary mouths) and a lower proportion of main and side channel habitats as compared to Pool 20. For example, Pool 20 aquatic areas consist of 80.4% main channel, 19% side channel, and only 0.6% backwater. That is compared to a much smaller percent of main channel in Pool 19 (29.3%), less side channel habitat (17.4%), and more backwater (5.6%) and impounded habitat (47.7%) [39]. These off-channel habitats have lower flows and potentially greater primary and secondary productivity than channel habitats and, thus, might be more energetically favorable for growth of bigheaded carp. Lock and Dam 19 was designed to generate hydroelectric power with a constant water level elevation in the downstream 32 km of the pool to maintain minimum hydraulic head across the dam [40]. This constant water level and low flow creates a lacustrine environment upstream of the dam, which in turn, supports higher zooplankton and phytoplankton densities [41], the primary food source of bigheaded carp.
Length frequency histograms for both bighead carp and silver carp indicate fish from Pool 19 have lengths intermediate to those of Pool 20 and Pools 16–18. Stable isotope and elemental signatures in the otoliths indicated that many of the adult bigheaded carps in pools 17–19 spent their first year of life downstream of LD19 and have immigrated through LD19 to these upper pools [14,42]. These data suggest that increased growth rates upstream of Lock and Dam 19 are not driven by genetic factors, but rather by lower densities and potentially differences in habitat suitability. Better food and habitat conditions above LD19 as compared to below suggests that if bigheaded carp continue to immigrate and reproduce upstream of Lock and Dam 19, Pool 19 may be able to support a larger population than in Pool 20 before individual body condition begins to decline from density-dependent effects.
Bigheaded carp in pools 16–19 are reaching early maturation [43], and individuals are living well over eight years, similar to what is observed in their native range [44]. Abundant food and quality (low flow) habitat might be allowing these fish to use resources for gonadal growth and somatic growth simultaneously, continuing to grow at a high rate, while still being able to reproduce [45]. Lenaerts [43] found a single bighead carp could produce up to 3.2 million eggs per batch spawn. With early maturation, egg volume increasing exponentially with fish length [46], and large numbers of eggs spawned, the invasion front of bigheaded carp can produce large numbers of offspring quickly. Without control methods, the population above LD19 could increase quickly, increasing the risk of upstream expansion in the Mississippi River.
The growth differences between the low-density populations upstream of Lock and Dam 19 and the high-density populations downstream suggest that growth might be a good indicator of the effectiveness of management efforts to reduce populations in recently established, low-density populations. Current management efforts include contracted harvest; however, in the absence of reliable indicators of abundance, it is difficult to gauge the effectiveness of current harvest efforts and how they need to be scaled to achieve zero to negative population growth. Growth could act as a surrogate for general abundance. Observing growth rates over time could indicate changes in abundance of fish in this leading edge. For instance, if growth would negatively deviate from its current level over time, this may indicate that abundance is increasing and more intensive efforts to decrease populations are needed. Without adequate control, bigheaded carps may affect native filter feeding fish in the Upper Mississippi River, leading to decreased body condition and abundance, as observed in the Illinois River [9,47]. However, one might anticipate that intraspecific density-dependent growth effects, as indicated by reduced growth, would occur before interspecific effects. Thus, monitoring growth would also provide a tool to assess the likelihood of interspecific effects.
Early population dynamics data are essential to assess mortality, maturity, year class strength, and recruitment rates. These vital rate estimates can also be used to track changes over time and help guide ongoing contracted harvest in the Upper Mississippi River. Specifically, this information is necessary to parameterize population models such as the Spatially Explicit Asian Carp Population model (SEICarP), which can be used in scenario planning to evaluate alternative management actions such as contract removal and deterrent placement [48]. These population models also inform managers as to where and at what intensity management actions are necessary to achieve the desired goals. This is the first age and growth information on bigheaded carp from the invasion front in the Upper Mississippi River and will be useful in developing a SEICarP-like model for this important region at the leading edge of the invasion.
Author Contributions
Conceptualization, C.L.B. and J.T.L.; methodology, C.L.B. and J.T.L..; software, C.L.B.; validation, C.L.B. and J.T.L.; formal analysis, C.L.B.; investigation, C.L.B.; resources, J.T.L.; data curation, C.L.B.; writing—original draft preparation, C.L.B.; writing—review and editing, C.L.B. and J.T.L.; visualization, J.T.L.; supervision, J.T.L.; project administration, J.T.L.; funding acquisition, J.T.L. All authors have read and agreed to the published version of the manuscript.
Funding
This research was funded by the Illinois Department of Natural Resources and U.S. Fish and Wildlife Service.
Institutional Review Board Statement
The study was conducted under Western Illinois University animal welfare IACUC Protocol 16–09.
Acknowledgments
We would like to thank the hard work of commercial fisherman who helped obtain many samples for this study. Thanks to the graduate and undergraduate students at the Alice L. Kibbe Field Station, including Allison Lenaerts, Charmayne Anderson, Andrew Mathis, Boone La Hood, Jesse Williams, Thomas Plate, Katie Mainor, Ashley Stanley, Eli Lampo, Chelsea Center, Sabina Berry, and anyone else who helped fish for and dissect hundreds of bigheaded carp in all weather conditions and spent numerous hours slicing aging structures in the lab. Any use of trade, firm, or product names is for descriptive purposes only and does not imply endorsement by the U.S. Government.
Conflicts of Interest
The authors declare no conflict of interest. The funders had no role in the design of the study; in the collection, analyses, or interpretation of data; in the writing of the manuscript, or in the decision to publish the results.
References
- Miranda, L.E.; Bettoli, P.W. Mortality. In Analysis and Interpretation of Freshwater Fisheries Data; Guy, C.S., Brown, M.L., Eds.; American Fisheries Society: Bethesda, MD, USA, 2007; pp. 229–278. [Google Scholar]
- Michaletz, P.H. Factors affecting abundance, growth, and survival of age-0 gizzard shad. Trans. Am. Fish. Soc. 1997, 126, 84–100. [Google Scholar] [CrossRef]
- Margenau, T.L.; Rasmussen, P.W.; Kampa, J.M. Factors affecting growth of northern pike in small northern Wisconsin lakes. N. Am. J. Fish. Manag. 1998, 18, 625–639. [Google Scholar] [CrossRef] [Green Version]
- Viadero, R.C. Factors affecting fish growth and production. Water Encycl. 2005, 3, 129–133. [Google Scholar]
- Lorenzen, K.; Enberg, K. Density-dependent growth as a key mechanism in the regulation of fish populations: Evidence from among-population comparisons. Proc. Royal Soc. Lond. B Biol. Sci. 2002, 269, 49–54. [Google Scholar] [CrossRef] [Green Version]
- Brandner, J.; Cerwenka, A.F.; Schliewen, U.K.; Geist, J. Bigger is better: Characteristics of round gobies forming an invasion front in the Danube river. PLoS ONE 2013, 8, e73036. [Google Scholar] [CrossRef] [Green Version]
- Rehage, J.S.; Sih, A. Dispersal Behavior, Boldness, and the Link to Invasiveness: A Comparison of Four Gambusia Species. Biol. Invasions 2004, 6, 379–391. [Google Scholar] [CrossRef]
- Hilling, C.D.; Bunch, A.J.; Greenlee, R.S.; Orht, D.J.; Jiao, Y. Natural mortality and size structure of introduced blue catfish in Virginia Tidal Rivers. J. Southeast. Assoc. Fish Wildl. Agencies 2018, 5, 30–38. [Google Scholar]
- Irons, K.S.; Sass, G.G.; McClelland, M.A.; Stafford, J.D. Reduced condition factor of two native fish species coincident with invasion of non-native Asian carps in the Illinois River, USA. Is this evidence for competition and reduced fitness? J. Fish Biol. 2007, 71, 258–273. [Google Scholar] [CrossRef]
- Coulter, D.P.; MacNamara, R.; Glover, D.C.; Garvey, J.E. Possible unintended effects of management at an invasion front: Reduced prevalence corresponds with high condition of invasive bigheaded carps. Biol. Conserv. 2018, 221, 118–126. [Google Scholar] [CrossRef]
- DeVries, D.R.; Frie, R.V. Determination of Age and Growth. In Fisheries Techniques, 2nd ed.; Murphy, B.R., Willis, D.W., Eds.; American Fisheries Society: Bethesda, MD, USA, 1996; pp. 483–512. [Google Scholar]
- Pope, K.L.; Kruse, C.G. Condition. In Analysis and Interpretation of Freshwater Fisheries Data; Guy, C.S., Brown, M.L., Eds.; American Fisheries Society: Bethesda, MD, USA, 2007; pp. 423–471. [Google Scholar]
- Williamson, C.J.; Garvey, J.E. Growth, fecundity, and diets of newly established silver carp in the middle Mississippi River. Trans. Am. Fish. Soc. 2005, 134, 1423–1430. [Google Scholar] [CrossRef] [Green Version]
- Whitledge, G.W.; Knights, B.; Vallazza, J.; Larson, J.; Weber, M.J.; Lamer, J.T.; Phelps, Q.E.; Norman, J.D. Identification of bighead carp and silver carp early-life environments and inferring Lock and Dam 19 passage in the Upper Mississippi River: Insights from otolith chemistry. Biol. Invasions 2019, 21, 1007–1020. [Google Scholar] [CrossRef] [Green Version]
- Haun, R.L. Comparison of Fish Community Composition and Structure among River Reaches of the Upper Mississippi River: Determining the Effects of Lock and Dam 19 in Structuring Fish Communities. Master’s Thesis, Western Illinois University, Macomb, IL, USA, 2015. [Google Scholar]
- Larson, J.H.; Knights, B.C.; McCalla, S.G.; Monroe, E.; Tuttle-Lau, M.; Chapman, D.C.; George, A.E.; Vallazza, J.M.; Amberg, J. Evidence of Asian Carp spawning upstream of a key choke point in the Mississippi River. N. Am. J. Fish. Manag. 2017, 37, 903–919. [Google Scholar] [CrossRef]
- Lamer, J.T.; Ruebush, B.C.; Arbieva, Z.H.; McClelland, M.A.; Epifanio, J.M.; Sass, G.G. Diagnostic SNPs reveal widespread introgressive hybridization between introduced bighead and silver carp in the Mississippi River Basin. Mol. Ecol. 2015, 24, 3931–3943. [Google Scholar] [CrossRef] [PubMed]
- Johal, M.S.; Esmaeili, H.R.; Tandon, K.K. Postcleithrum of silver carp, Hypophthalmichthys molitrix (Val. 1844), an authentic indicator for age determination. Curr. Sci. 2000, 79, 945. [Google Scholar]
- Gibson-Reinemer, D.K.; Solomon, L.E.; Pendleton, R.M.; Chick, J.H.; Casper, A.F. Hydrology controls recruitment of two invasive cyprinids: Bigheaded carp reproduction in a navigable large river. PeerJ 2017, 5, e3641. [Google Scholar] [CrossRef] [Green Version]
- Sullivan, C.J.; Weber, M.J.; Pierce, C.L.; Wahl, D.H.; Phelps, Q.E.; Camacho, C.A.; Colombo, R.E. Factors regulating year-class strength of silver carp throughout the Mississippi River basin. Trans. Am. Fish. Soc. 2018, 147, 541–553. [Google Scholar] [CrossRef] [Green Version]
- Francis, R. Back-calculation of fish length: A critical review. J. Fish Biol. 1990, 36, 883–902. [Google Scholar] [CrossRef]
- Lee, R.M. An investigation into the methods of growth determination in fishes by means of scales. J. Cons. Int. Pour L’exploration Mer. 1912, 1, 3–34. [Google Scholar] [CrossRef]
- Quist, M.C.; Pegg, M.A.; Devries, D.R. Age and Growth. In Fisheries Techniques, 3rd ed.; Zale, A.V., Parrish, D.L., Sutton, T.M., Eds.; American Fisheries Society: Bethesda, MD, USA, 2012; pp. 677–731. [Google Scholar]
- R Core Team. R: A Language and Environment for Statistical Computing; R Foundation for Statistical Computing: Vienna, Austria, 2019; Available online: https://www.R-project.org/ (accessed on 12 March 2019).
- Ogle, D.H.; Wheeler, P.; Dinno, A. FSA: Fisheries Stock Analysis. R Package Version 0.8.25. 2019. Available online: https://github.com/droglenc/FSA (accessed on 12 March 2019).
- Mazerolle, M.J. AICcmodavg: Model Selection and Multimodel Inference Based on (Q)AIC(c). R Package Version 2.2-2. 2019. Available online: https://cran.r-project.org/package=AICcmodavg (accessed on 12 March 2019).
- Von Bertalanffy, L. A quantitative theory of organic growth. Hum. Biol. 1938, 10, 181–213. [Google Scholar]
- Ogle, D.H. Individual Growth. In Introductory Fisheries Analysis with R; CRC Press: Boca Raton, FL, USA, 2016; pp. 222–248. [Google Scholar]
- Lester, N.P.; Shuter, B.J.; Abrams, P.A. Interpreting the von Bertalanffy model of somatic growth in fishes: The cost of reproduction. Proc. Royal Soc. B Biol. Sci. 2004, 271, 1625–1631. [Google Scholar] [CrossRef] [Green Version]
- Stauffer, J.R., Jr. Colonization Theory Relative to Introduced Populations. In Distribution, Biology, and Management of Exotic Fishes; Courtenay, W.R., Stauffer, J.R., Jr., Eds.; Johns Hopkins University Press: Baltimore, MD, USA, 1984; pp. 8–21. [Google Scholar]
- Lopez, D.P.; Jungman, A.A.; Rehage, J.S. Nonnative African jewelfish are more fit but not bolder at the invasion front: A trait comparison across an Everglades range expansion. Biol. Invasions 2012, 14, 2159–2174. [Google Scholar] [CrossRef]
- Phillips, B.L.; Brown, G.P.; Shine, R. Life-history evolution in range-shifting populations. Ecology 2010, 91, 1617–1627. [Google Scholar] [CrossRef] [PubMed]
- U. S. Fish and Wildlife Service. Juvenile Asian Carp Monitoring to Document Geographic Range of Recruitment of Asian Carp in the Upper Mississippi River. Unpublished Report. 2018. Available online: http://www.micrarivers.org/wp-content/uploads/2018/08/UMR-Monitoring-Pools-14-19.pdf (accessed on 10 December 2019).
- Ridgway, J.L.; Bettoli, P.W. Distribution, age structure, and growth of bigheaded carps in the lower Tennessee and Cumberland Rivers. Southeast. Nat. 2017, 16, 426–442. [Google Scholar]
- Tandon, K.K.; Johal, M.S.; Kukreja, T. Morphometry, age and growth of silver carp, Hypophthalmichthys molotrix (Valenciennes) from Gobindsagar, Himachal Pradesh, India. Res. Bull. Panjab Univ. 1993, 43, 117–128. [Google Scholar]
- Lamer, J.T.; Ruebush, B.C.; McClelland, M.A.; Epifanio, J.M.; Sass, G.G. Body condition (Wr) and reproductive potential of bighead and silver carp hybrids: Postzygotic selection in the Mississippi River basin. Ecol. Evol. 2019, 9, 8978–8986. [Google Scholar] [CrossRef] [PubMed]
- Wilcox, D.B.; Stefanik, E.L.; Kelner, D.E.; Cornish, M.A.; Johnson, D.J.; Hodgins, I.J.; Zigler, S.J.; Johnson, B.L. Improving Fish Passage through Navigation Dams on the Upper Mississippi River System. ENV Report. 54. 2004. Available online: https://www.researchgate.net/publication/277009138 (accessed on 10 December 2019).
- U. S. Fish and Wildlife Service. Annual Report to Congress: Annual Summary of Activities and Expenditures to Manage the Threat of Asian Carp in the Upper Mississippi and Ohio River Basins. 2016. Available online: https://asiancarp.us/Documents/WRRDA2016.pdf (accessed on 10 December 2019).
- Anderson, R.L.; Anderson, C.A.; Larson, J.H.; Knights, B.; Vallazza, J.; Jenkins, S.E.; Lamer, J.T. Influence of a high-head dam as a dispersal barrier to fish community structure of the Upper Mississippi River. River Res. Appl. 2020, 36, 47–56. [Google Scholar] [CrossRef] [Green Version]
- Jahn, L.A.; Anderson, R.V. The Ecology of Pool 19 and 20, Upper Mississippi River: A Community Profile; National Wetlands Research Center. Research and Development, Fish and Wildlife Service, US Department of the Interior: Washington, DC, USA, 1986. [Google Scholar]
- Pillard, D.A.; Anderson, R.V. Longitudinal Variation in Zooplankton Populations in Pool 19, Upper Mississippi River. J. Freshw. Ecol. 1993, 8, 127–132. [Google Scholar] [CrossRef]
- Anderson, C. Using Microchemistry and Stable Isotopes to Determine Early-Life Environment and Movement of the Emerging Bigheaded Carp Population in POOLS 16–19 of the Mississippi River. Master’s Thesis, Western Illinois University, Macomb, IN, USA, 2020. [Google Scholar]
- Lenaerts, A.W. Reproductive Potential of Bigheaded Carp in the Upper Mississippi River. Master’s Thesis, Western Illinois University, Macomb, IL, USA, 2019. [Google Scholar]
- Kamilov, B.G. Morphology of growth structures in silver carp, Hypophthalmichthys molitrix, in relation to estimation of age and growth rate. J. Ichthyol. 1985, 25, 49–59. [Google Scholar]
- Papoulias, D.M.; Chapman, D.; Tillitt, D.E. Reproductive condition and occurrence of intersex in bighead carp and silver carp in the Missouri River. Hydrobiologia 2006, 571, 355–360. [Google Scholar] [CrossRef]
- Barneche, D.R.; Robertson, D.R.; White, C.R.; Marshall, D.J. Fish reproductive-energy output increases disproportionately with body size. Science 2018, 360, 642–645. [Google Scholar] [CrossRef] [Green Version]
- Solomon, L.E.; Pendleton, R.M.; Chick, J.H.; Casper, A.F. Long-term changes in fish community structure in relation to the establishment of Asian carps in a large floodplain river. Biol. Invasions 2015, 18, 2883–2895. [Google Scholar] [CrossRef]
- Asian Carp Regional Coordination Committee (ACRCC). Asian Carp Monitoring and Response Plan. Available online: https://www.asiancarp.us/Documents/MRP2018.pdf (accessed on 10 December 2019).
Figure 1.
Map of the Mississippi River showing locations of pools 16–20 where Bighead Carp and Silver Carp were sampled, 2015–2017. Stars indicate lock and dam locations.
Figure 1.
Map of the Mississippi River showing locations of pools 16–20 where Bighead Carp and Silver Carp were sampled, 2015–2017. Stars indicate lock and dam locations.

Figure 2.
Length frequency histograms of the number of Bighead Carp sampled per size class in pools 16–20 of the Upper Mississippi River from 2015 to 2017.
Figure 2.
Length frequency histograms of the number of Bighead Carp sampled per size class in pools 16–20 of the Upper Mississippi River from 2015 to 2017.

Figure 3.
Length frequency histograms of the number of Silver Carp sampled per size class in pools 16–20 of the Upper Mississippi River, 2015–2017.
Figure 3.
Length frequency histograms of the number of Silver Carp sampled per size class in pools 16–20 of the Upper Mississippi River, 2015–2017.

Figure 4.
Von Bertalanffy growth curves for Bighead Carp and Silver Carp from pools 16 to 20 of the Upper Mississippi River, 2015–2017.
Figure 4.
Von Bertalanffy growth curves for Bighead Carp and Silver Carp from pools 16 to 20 of the Upper Mississippi River, 2015–2017.


Table 1.
Total number of Bighead and Silver Carp sampled from Pools 16 to 20 of the Upper Mississippi River from which pectoral fin spines, postcleithra, and vertebrae were removed in 2015–2017.
Table 1.
Total number of Bighead and Silver Carp sampled from Pools 16 to 20 of the Upper Mississippi River from which pectoral fin spines, postcleithra, and vertebrae were removed in 2015–2017.
| Pool 16 | Pool 17 | Pool 18 | Pool 19 | Pool 20 | Total | |
| Bighead Carp | ||||||
| Pectoral fin spines and postcleithra | 17 | 95 | 175 | 189 | 25 | 501 |
| Vertebrae | 3 | 28 | 14 | 21 | 3 | 69 |
| Silver Carp | ||||||
| Pectoral fin spines and postcleithra | 23 | 179 | 152 | 261 | 87 | 702 |
| Vertebrae | 7 | 25 | 12 | 7 | 10 | 61 |
Table 2.
Estimated mean length-at-age (mm), standard error (SE), and sample size (n) for all (a) Bighead Carp and (b) Silver Carp sampled from pools 16 to 20 of the Upper Mississippi River, 2015–2017. Lowercase letters indicate significant differences among pools at each age (α = 0.05, df = 4).
Table 2.
Estimated mean length-at-age (mm), standard error (SE), and sample size (n) for all (a) Bighead Carp and (b) Silver Carp sampled from pools 16 to 20 of the Upper Mississippi River, 2015–2017. Lowercase letters indicate significant differences among pools at each age (α = 0.05, df = 4).
| (a) Bighead Carp | ||||||||||||||||||||||||
| Age 1 | ±SE | n | Sig | Age 2 | ±SE | n | Sig | Age 3 | ±SE | n | Sig | Age 4 | ±SE | n | Sig | Age 5 | ±SE | n | Sig | Age 6 | ±SE | n | Sig | |
| Pool 16 | 244 a | ··· | 1 | a | 422 a | ··· | 1 | a | 665 a | ··· | 1 | a | ··· | ··· | ··· | ··· | ··· | ··· | ··· | ··· | 1056 | 30 | 4 | a |
| Pool 17 | 263 a | 38 | 8 | a | 595 a | 53 | 8 | a | 728 a | 46 | 7 | a | 923 b | 38 | 8 | a | 1152 | 47 | 4 | a | 1088 | 19 | 16 | a |
| Pool 18 | 224 a | 33 | 4 | a | 441 a | 37 | 4 | a | 738 b | 85 | 4 | a | 969 b | 56 | 4 | a | 1070 | 37 | 9 | a,b | 1127 | 17 | 33 | a |
| Pool 19 | 298 a | 33 | 9 | a | 555 a | 53 | 8 | a | 705 b | 43 | 8 | a | 868 | 25 | 17 | a,b | 947 | 21 | 40 | b | 1031 | 17 | 53 | a |
| Pool 20 | 85 a | ··· | 1 | a | 312 a | ··· | 1 | a | 388 a | ··· | 1 | a | 690 | 48 | 4 | b | 782 | 37 | 6 | c | 847 | 26 | 9 | b |
| Age 7 | ±SE | n | Sig | Age 8 | ±SE | n | Sig | Age 9 | ±SE | n | Sig | Age 10 | ±SE | n | Sig | Age 11 | ±SE | n | Sig | Age 12 | ±SE | n | Sig | |
| Pool 16 | 1166 | 29 | 4 | a,b | 1200 | 37 | 5 | a | 1190 | 53 | 3 | a,b | ··· | ··· | ··· | ··· | 1190 | ··· | 1 | a | ··· | ··· | ··· | ··· |
| Pool 17 | 1178 | 18 | 30 | a | 1174 | 16 | 21 | a | 1266 | 10 | 10 | a | 1227 | 23 | 11 | a | 1169 | 30 | 2 | a | ··· | ··· | ··· | ··· |
| Pool 18 | 1124 | 14 | 30 | a,b | 1163 | 10 | 41 | a | 1193 | 12 | 29 | b | 1234 | 17 | 22 | a | 1196 | 37 | 4 | a | 1216 | 4 | 5 | a |
| Pool 19 | 1111 | 16 | 42 | b | 1171 | 16 | 20 | a | 1148 | 20 | 10 | b | 1157 | 37 | 3 | a | 1196 | 20 | 2 | a | 1101 | 0 | 1 | a |
| Pool 20 | 902 | 53 | 6 | c | 916 | 9 | 4 | b | 947 | ··· | 1 | c | ··· | ··· | ··· | ··· | ··· | ··· | ··· | ··· | ··· | ··· | ··· | ··· |
| (b) Silver Carp | ||||||||||||||||||||||||
| Age 1 | ±SE | n | Sig | Age 2 | ±SE | n | Sig | Age 3 | ±SE | n | Sig | Age 4 | ±SE | n | Sig | Age 5 | ±SE | n | Sig | |||||
| Pool 16 | 237 a | 26 | 3 | a | 350 a | 63 | 2 | a | 705 a | 74 | 2 | a | 777 | 56 | 3 | a,b | 928 | 42 | 3 | a,b | ||||
| Pool 17 | 193 a | 17 | 10 | a | 396 b | 29 | 11 | a | 736 b | 51 | 10 | a | 863 | 17 | 12 | a | 939 | 12 | 44 | a | ||||
| Pool 18 | 211 a | 32 | 4 | a | 440 a | 38 | 4 | a | 627 b | 53 | 5 | a,b | 826 | 15 | 40 | a | 888 | 14 | 30 | a,b | ||||
| Pool 19 | 213 a | 20 | 4 | a | 453 a | 83 | 3 | a | 749 | 13 | 19 | a | 798 | 8 | 65 | a | 831 | 12 | 96 | b | ||||
| Pool 20 | 180 a | 21 | 5 | a | 431 b | 30 | 4 | a | 449 b | 26 | 4 | b | 656 | 21 | 12 | b | 676 | 9 | 42 | c | ||||
| Age 6 | ±SE | n | Sig | Age 7 | ±SE | n | Sig | Age 8 | ±SE | n | Sig | Age 9 | ±SE | n | Sig | Age 10 | ±SE | n | Sig | |||||
| Pool 16 | 913 | 17 | 12 | a,b | 936 | 16 | 5 | a | 961 | ··· | 1 | a | ··· | ··· | ··· | ··· | ··· | ··· | ··· | ··· | ||||
| Pool 17 | 951 | 8 | 72 | a | 971 | 12 | 40 | a | 987 | 10 | 5 | a | ··· | ··· | ··· | ··· | ··· | ··· | ··· | ··· | ||||
| Pool 18 | 918 | 8 | 67 | a,b | 952 | 14 | 24 | a | 977 | 52 | 5 | a | 959 | ··· | 1 | a | ··· | ··· | ··· | ··· | ||||
| Pool 19 | 906 | 14 | 55 | b | 949 | 20 | 24 | a | 1046 | 11 | 3 | a | 1004 | ··· | 1 | a | 878 | 0 | 1 | ··· | ||||
| Pool 20 | 671 | 14 | 26 | c | 642 | 45 | 11 | b | ··· | ··· | ··· | ··· | ··· | ··· | ··· | ··· | ··· | ··· | ··· | ··· | ||||
a mean lengths contain lengths calculated via the Dahl-Lea method; b mean lengths contain lengths calculated via the Dahl-Lea method and observed lengths at capture.
Table 3.
Von Bertalanffy growth curve parameters for (a) Bighead Carp and (b) Silver Carp from pools 16 to 20 of the Upper Mississippi River, 2015–2017. Lowercase letters indicate significant differences among pools for each parameter (α = 0.05, df = 4).
Table 3.
Von Bertalanffy growth curve parameters for (a) Bighead Carp and (b) Silver Carp from pools 16 to 20 of the Upper Mississippi River, 2015–2017. Lowercase letters indicate significant differences among pools for each parameter (α = 0.05, df = 4).
| (a.) Bighead Carp | ||||||
| L∞ | K | t0 | ||||
| Pool 16 | 1318.503 | a | 0.299 | a | 0.471 | a |
| Pool 17 | 1266.387 | a | 0.379 | a | 0.380 | a |
| Pool 18 | 1233.584 | a | 0.418 | a | 0.633 | a |
| Pool 19 | 1280.488 | a | 0.279 | a | 0.046 | b |
| Pool 20 | 1030.707 | b | 0.331 | a | 0.848 | c |
| (b.) Silver Carp | ||||||
| L∞ | K | t0 | ||||
| Pool 16 | 1030.720 | a | 0.395 | a | 0.440 | a |
| Pool 17 | 1025.834 | a | 0.509 | a | 0.689 | a |
| Pool 18 | 993.133 | a | 0.494 | a | 0.593 | a |
| Pool 19 | 963.133 | a | 0.480 | a | 0.396 | a |
| Pool 20 | 695.449 | b | 0.669 | a | 0.590 | a |
Publisher’s Note: MDPI stays neutral with regard to jurisdictional claims in published maps and institutional affiliations. |
© 2022 by the authors. Licensee MDPI, Basel, Switzerland. This article is an open access article distributed under the terms and conditions of the Creative Commons Attribution (CC BY) license (https://creativecommons.org/licenses/by/4.0/).
Share and Cite
MDPI and ACS Style
Broaddus, C.L.; Lamer, J.T. Growth Rates of Non-Native Bighead and Silver Carp in the Upper Mississippi River. Fishes 2022, 7, 73. https://doi.org/10.3390/fishes7020073
AMA Style
Broaddus CL, Lamer JT. Growth Rates of Non-Native Bighead and Silver Carp in the Upper Mississippi River. Fishes. 2022; 7(2):73. https://doi.org/10.3390/fishes7020073
Chicago/Turabian StyleBroaddus, Cortney Lynn, and James T. Lamer. 2022. "Growth Rates of Non-Native Bighead and Silver Carp in the Upper Mississippi River" Fishes 7, no. 2: 73. https://doi.org/10.3390/fishes7020073