Ventilative Cooling in a School Building: Evaluation of the Measured Performances


Department of Civil Engineering, Katholieke Universiteit Leuven, Construction Technology Cluster, Sustainable Building, Technology Campus Ghent, 9000 Ghent, Belgium
*
Author to whom correspondence should be addressed.
Fluids 2018, 3(4), 68; https://doi.org/10.3390/fluids3040068
Submission received: 26 August 2018
/
Revised: 13 September 2018
/
Accepted: 18 September 2018
/
Published: 23 September 2018
(This article belongs to the Special Issue Ventilation and Passive Cooling for Healthy and Comfortable Buildings)
Abstract
:The test lecture rooms on Katholieke Universiteit Leuven (KU Leuven) Ghent Technology Campus (Belgium) are a demonstration case of Annex 62: Ventilative Cooling of the International Energy Agency’s Energy in Buildings and Communities programme (IEA EBC). The building is cooled by natural night ventilation and indirect evaporative cooling (IEC). Thermal comfort and the performances of ventilative cooling are evaluated. Long-term measurements of internal temperatures, occupancy, opening of windows and IEC were carried out in the cooling season of 2017. The airflow rates through the windows in cross- and single-sided ventilation mode were measured by both tracer gas concentration decay and air velocity measurements. In addition, the air flow pattern is visualized by measuring air temperatures in the room. The results show that good thermal summer comfort was measured except during heat waves and/or periods with high occupancy. Both nighttime ventilation and IEC operate very well. IEC can lower the supply temperature by day significantly compared to the outdoor temperature. The Air Changes Rates (ACR) of the night ventilation greatly depends on wind direction and velocity. The air temperature profile showed that the air is cooled down in the whole lecture but more in the upper zone. The extensive data monitoring system was important to detect malfunctions and to optimize the whole building performance.
1. Introduction
In the recently approved second recast of the Energy Performance of Buildings Directive (EPBD) [1], the member states of the European Union committed themselves to develop a sustainable, competitive, secure, and decarbonized energy system by 2050. An important aspect to achieve this goal is to find a cost-efficient equilibrium between decarbonizing energy supplies and reducing final energy consumption of the building stock. While the first recast of the EPBD [2] required that from 2020, all new buildings in the European Union have to be nearly zero-energy buildings (nZEB), this second recast focusses on renovation strategies. An average renovation rate of 3% annually towards nZEB, where nearly means cost effective, is needed [1].
One of the major new challenges in these highly insulated and airtight buildings is the increased need for cooling and the risk on overheating not only during summer but all year round. In addition, this cooling demand depends less on the outdoor temperature and more on the internal and solar heat gains [3]. A shift is noticed from reduction in heating to reduction in cooling demand. As a consequence, conceptual and building technical measures as well as energy efficient cooling systems are needed in these nZEB buildings to guarantee good thermal comfort all year round. Ventilative cooling is an example of an energy efficient cooling method that can contribute to achieve the goal of the 2nd recast of the EPBD and was extensively studied within IEA EBC Annex 62 [4]. Ventilative cooling is defined as “the application of the cooling capacity of the outdoor air flow by ventilation to reduce or even eliminate the cooling loads and/or the energy use by mechanical cooling in buildings, while guaranteeing a comfortable thermal environment” [3].
Ventilative cooling strategies depend on the indoor-outdoor temperature difference. For temperate outdoor conditions, i.e., mean outdoor 2 to 10 °C lower than indoor temperature, an increased airflow rate by day and night is recommended. For hot and dry, i.e., indoor–outdoor temperature difference between −2 °C and +2 °C, only the airflow rate during nighttime, i.e., night ventilation, is maximized. Extra natural cooling, like evaporative cooling and earth-to-air-heat-exchanger, or mechanical cooling can be provided to reduce the air intake temperature during daytime [3]. Santamouris and Kolokotska [5] reviewed the state of the art technologies for passive cooling including ventilative cooling and concluded that “the efficiency of the proposed passive cooling systems is found to be high while their environmental quality is excellent. Expected energy savings may reach 70% compared to a conventional air conditioned building”. Night ventilation was found to be very effective to reduce the cooling demand in office buildings and improve thermal summer comfort regardless the climatic conditions [5]. In free floating buildings, amongst others [6,7,8,9,10] monitored that night ventilation can decrease the next day peak internal temperature up to 3 °C. In addition, the climatic cooling potential of buildings with night ventilation in Europe was evaluated by Artmann et al. [11]. A very significant climatic cooling potential was found in Northern Europe; a significant in central and Eastern Europe but series of warmer nights can occur. As a consequence, night ventilation may not be sufficient to guarantee good thermal comfort during these periods [11]. Santamouris and Kolokotska [5] also concluded, based on amongst others [12,13,14], that “indirect evaporative cooling techniques can be low energy solutions for medium and large buildings where passive cooling techniques cannot reach the required comfort conditions”. However, these systems require fan energy, which can be up to 20% less due to lower air velocities [5]. Kolokotroni and Heiselberg [15] give amongst other things, insight in the limitations and barriers to ventilative cooling. The most important are the impact of global warming and heat island effect [6,16,17] noise and pollution [18]. It is expected that the average cooling potential of night ventilation will decrease significantly with regionally varying implications. In Northern Europe, the risk of thermal discomfort in buildings that use exclusively night ventilation is increased while in Central Europe the periods with low night cooling potential are becoming more frequent [19].
Appropriate control is also a requirement to guarantee good thermal comfort. To ensure that the required window opening on a regular basis, the night ventilation strategy should be integrated to the office buildings energy management system [5].
The test lecture rooms of KU Leuven Ghent Technology Campus, which are studied in this paper, were one the demonstration cases of IEA EBC Annex 62: Ventilative Cooling [20]. Natural night ventilation and indirect evaporative cooling techniques are applied. This paper aims to evaluate thermal comfort in this nZEB school building and to discuss the performances of its ventilative cooling systems.
First, a description of the building, its systems, and more specifically the ventilative cooling and control strategies are presented. Afterwards, the measurement setup for the evaluation of air flow rates, operation of ventilative cooling and thermal comfort is shown. Section 3 presents the results of the measurements and finally the conclusions and lessons learned are presented.
2. Materials and Methods
This paragraph describes the building, its systems and the ventilative cooling as well as the measurement setup.
2.1. Building Description
2.1.1. Building and Use
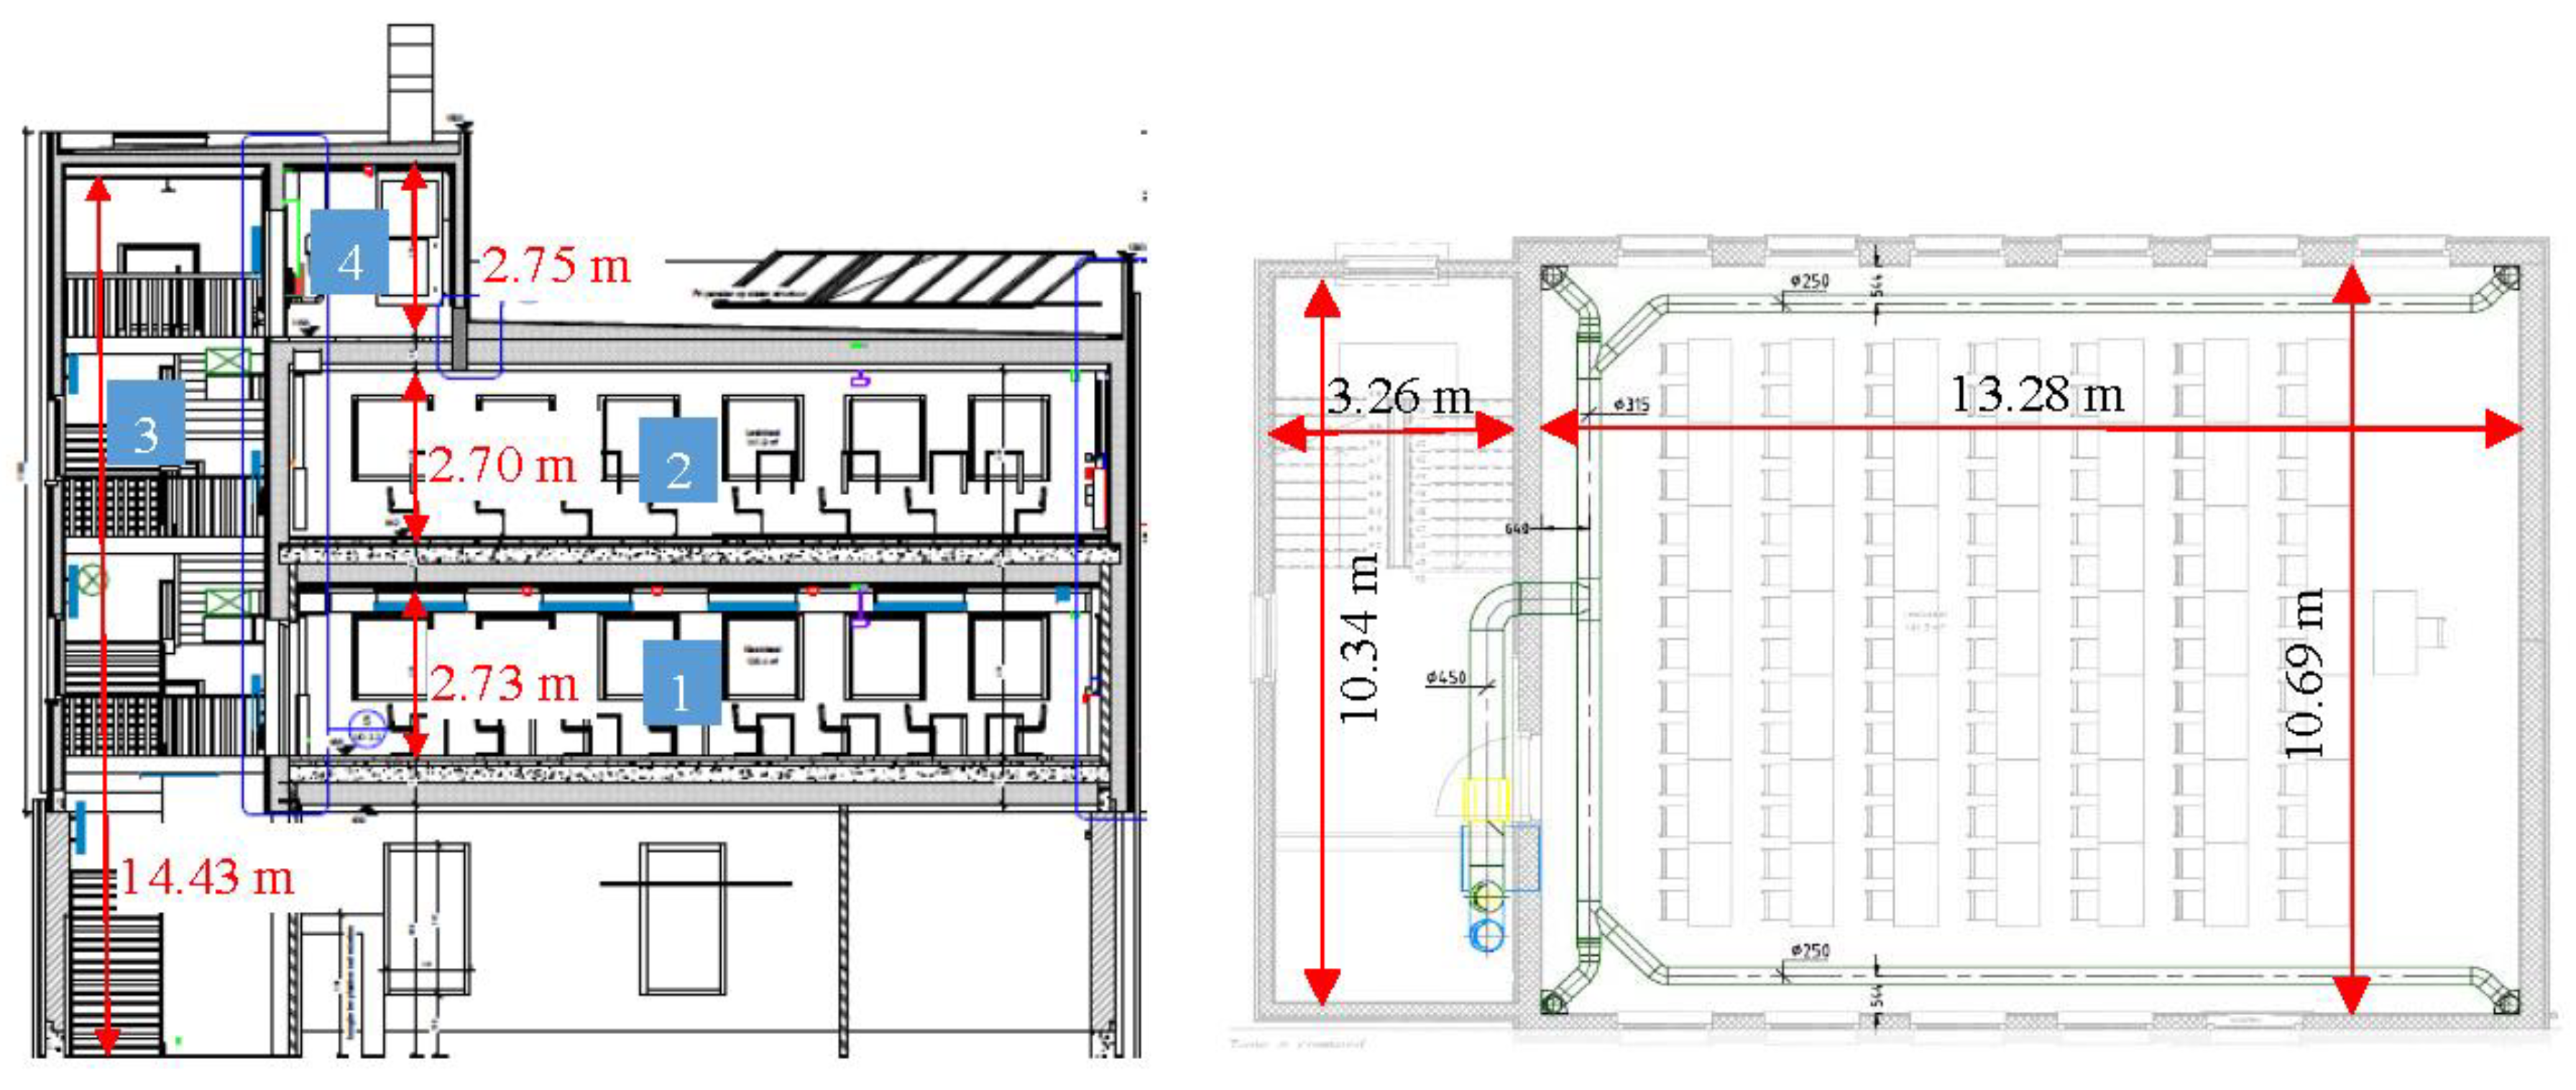
The nZEB school building is realized at the technology campus Ghent of KU Leuven (Belgium) on top of an existing university building. The building contains four zones (see Figure 1): two large lecture rooms (1) and (2), a staircase (3) and a technical room (4). The lecture rooms have a floor area of about 140 m2, a volume of 380 m3. The lecture rooms are designed as identical zones with a different thermal mass. The lower room has a brick external wall with exterior insulation while the upper room has a lightweight timber frame external wall with the same U-value. Both lecture rooms have a concrete slab floor. This results in a light (2nd floor) and a medium (1st floor) thermal mass according to EN ISO 13790 [21].
Table 1 shows the building properties. The school building is designed and constructed according to the Passive House standard. This means that the air tightness n50 is lower than 0.6 h−1 and the U-values of the envelope parts are maximum 0.15 W/m2 K. The windows are constructed with triple glazing and have a g-value of 0.52. The window-to-wall ratio is 26.5% on both façades. The window-to-floor ratio is 13%. The windows are equipped with internal and external solar shading. The external solar shading are moveable screens on the southwest façade which are controlled automatically and provided of manual overrule.
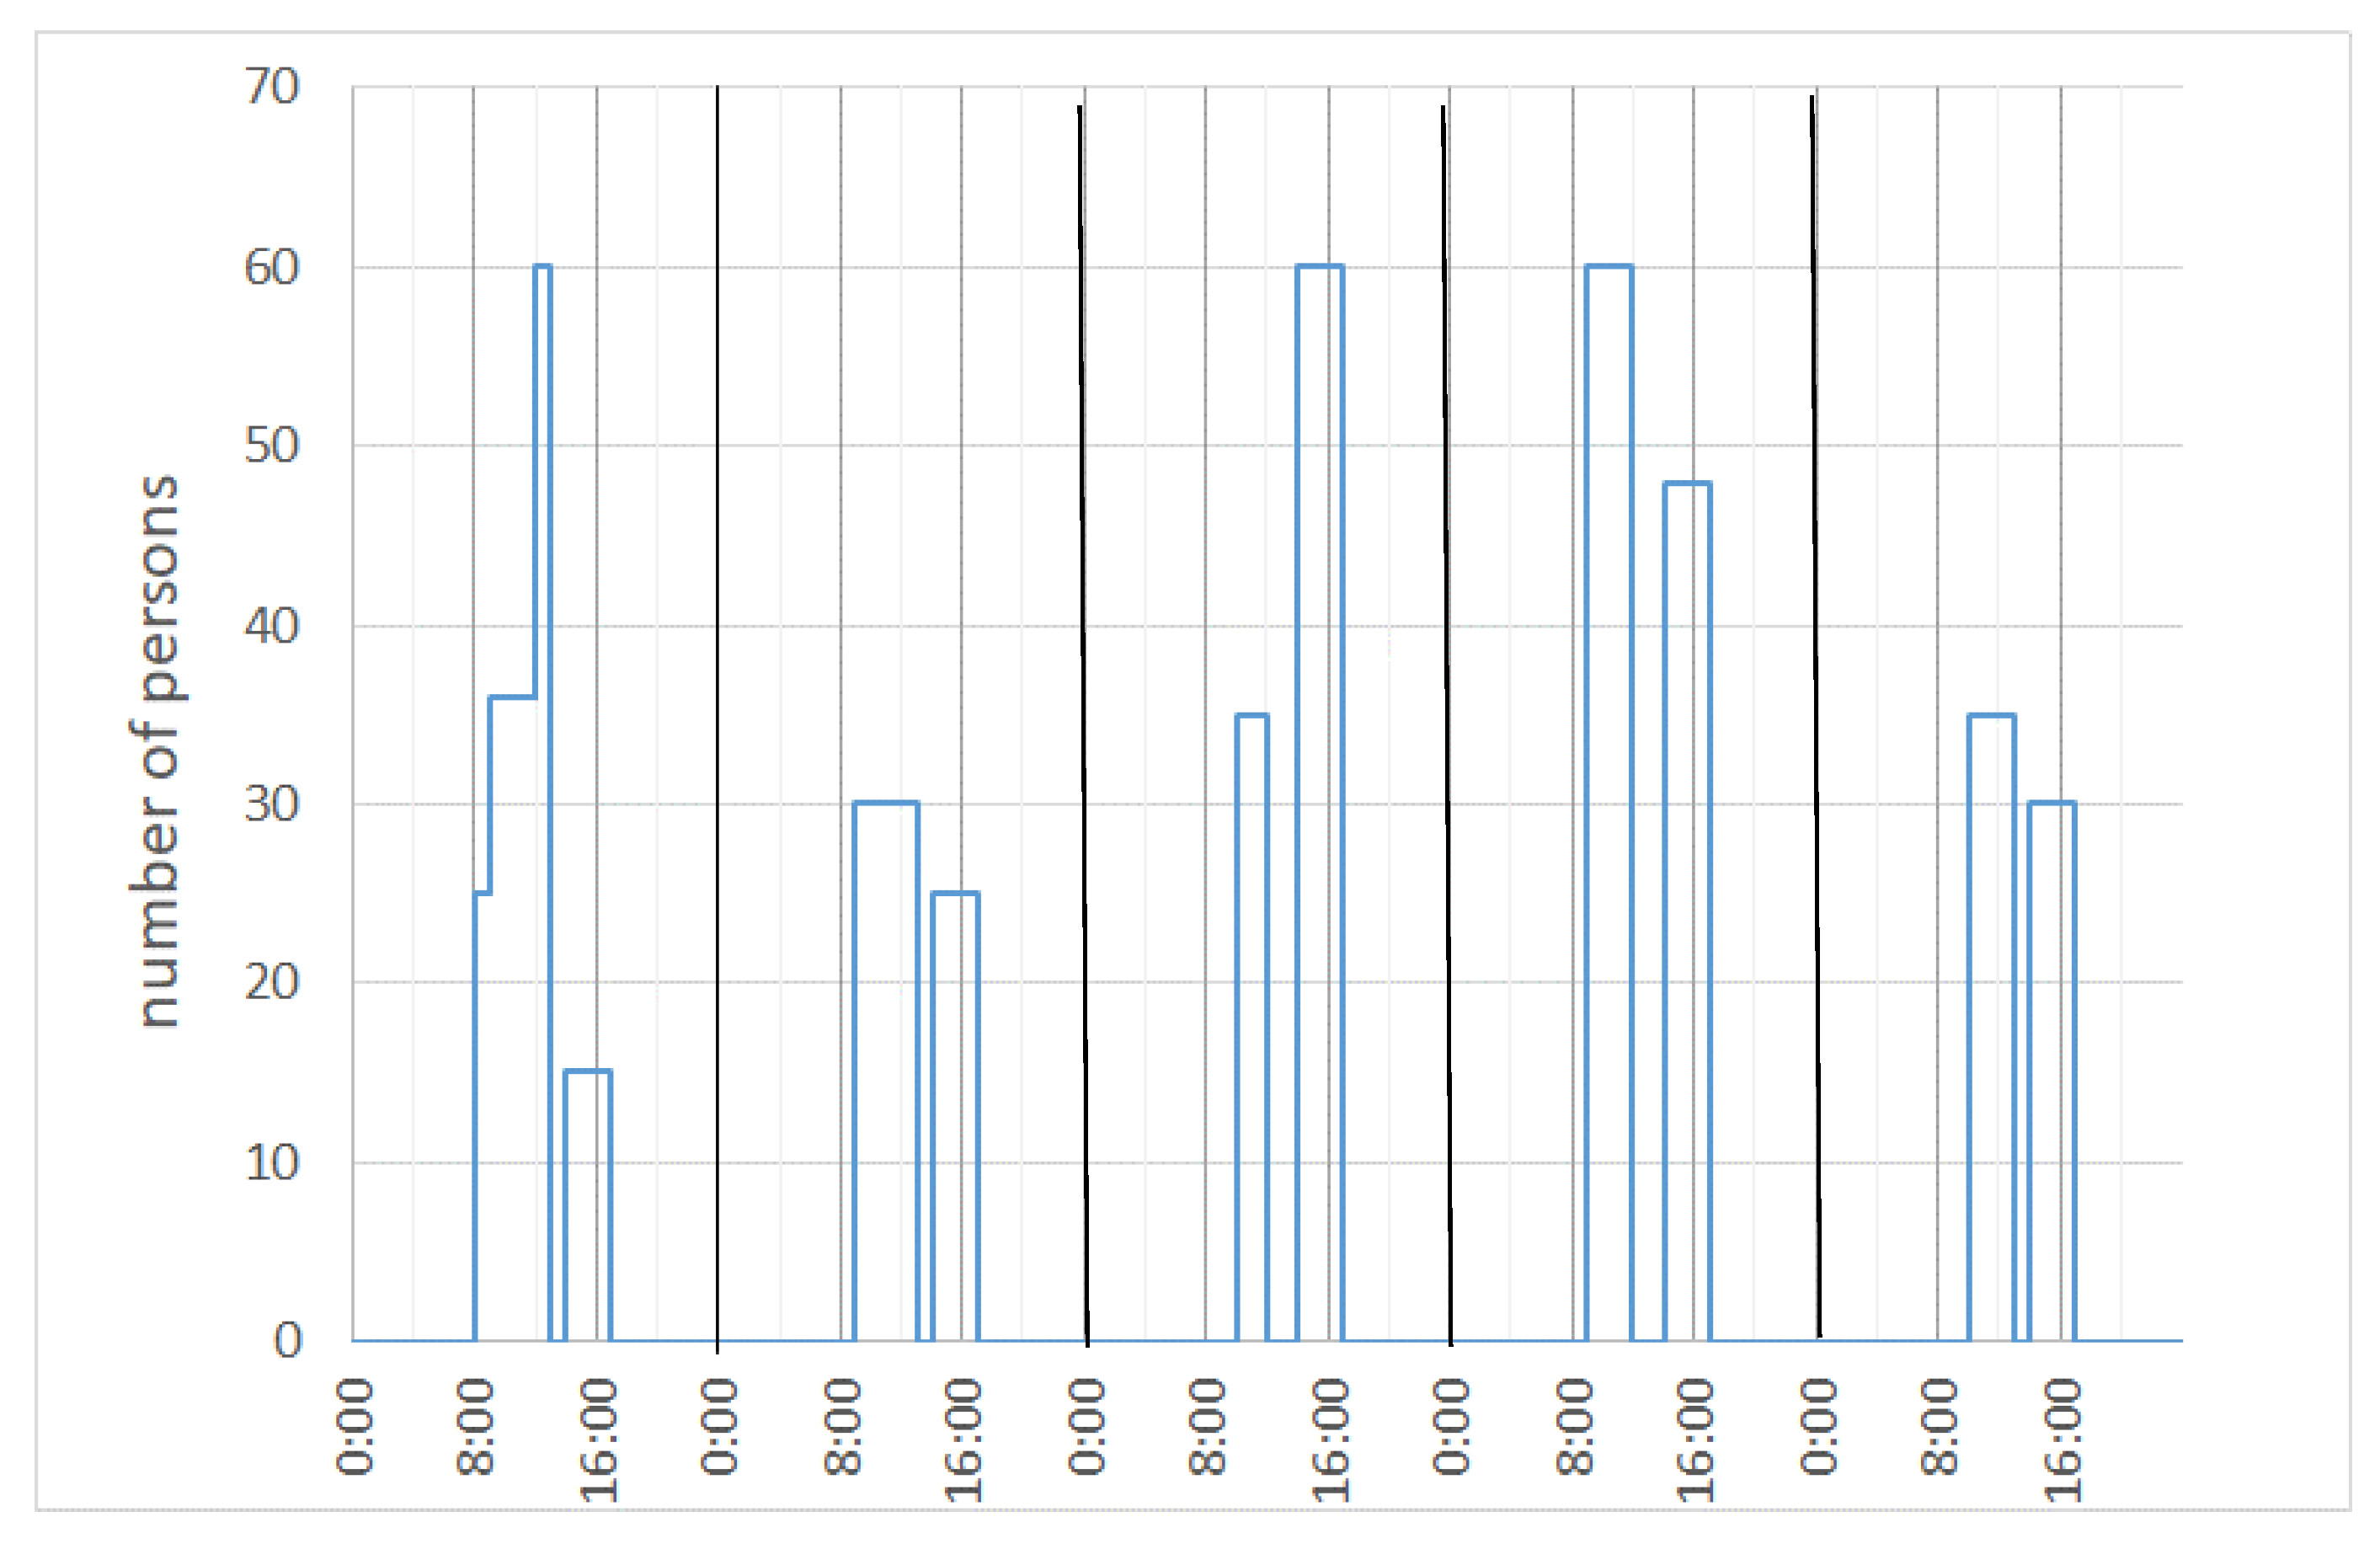
The occupancy level in the building is dependent on the academic year, which counts 124 days with courses and 63 days with exams (in January, June and August–September). Holiday periods are in April (2 weeks), July and the first half of August (6 weeks) and December–January (2 weeks). The lecture rooms are in use from Monday to Friday between 8 h15 and 18 h with a maximum occupancy of 80 persons or 1.78 m2/pers. Figure 2 shows details of 1 typical week of occupancy.
The net energy demand for heating in this school building is calculated in [22]. The annual net heating demand is 11 kWh/(m2·a), fulfilling the requirements of Passive House standard in school buildings [23]. In addition, large heat gains during the whole year and a short heating season, i.e., from November till March, are noticed.
2.1.2. Systems
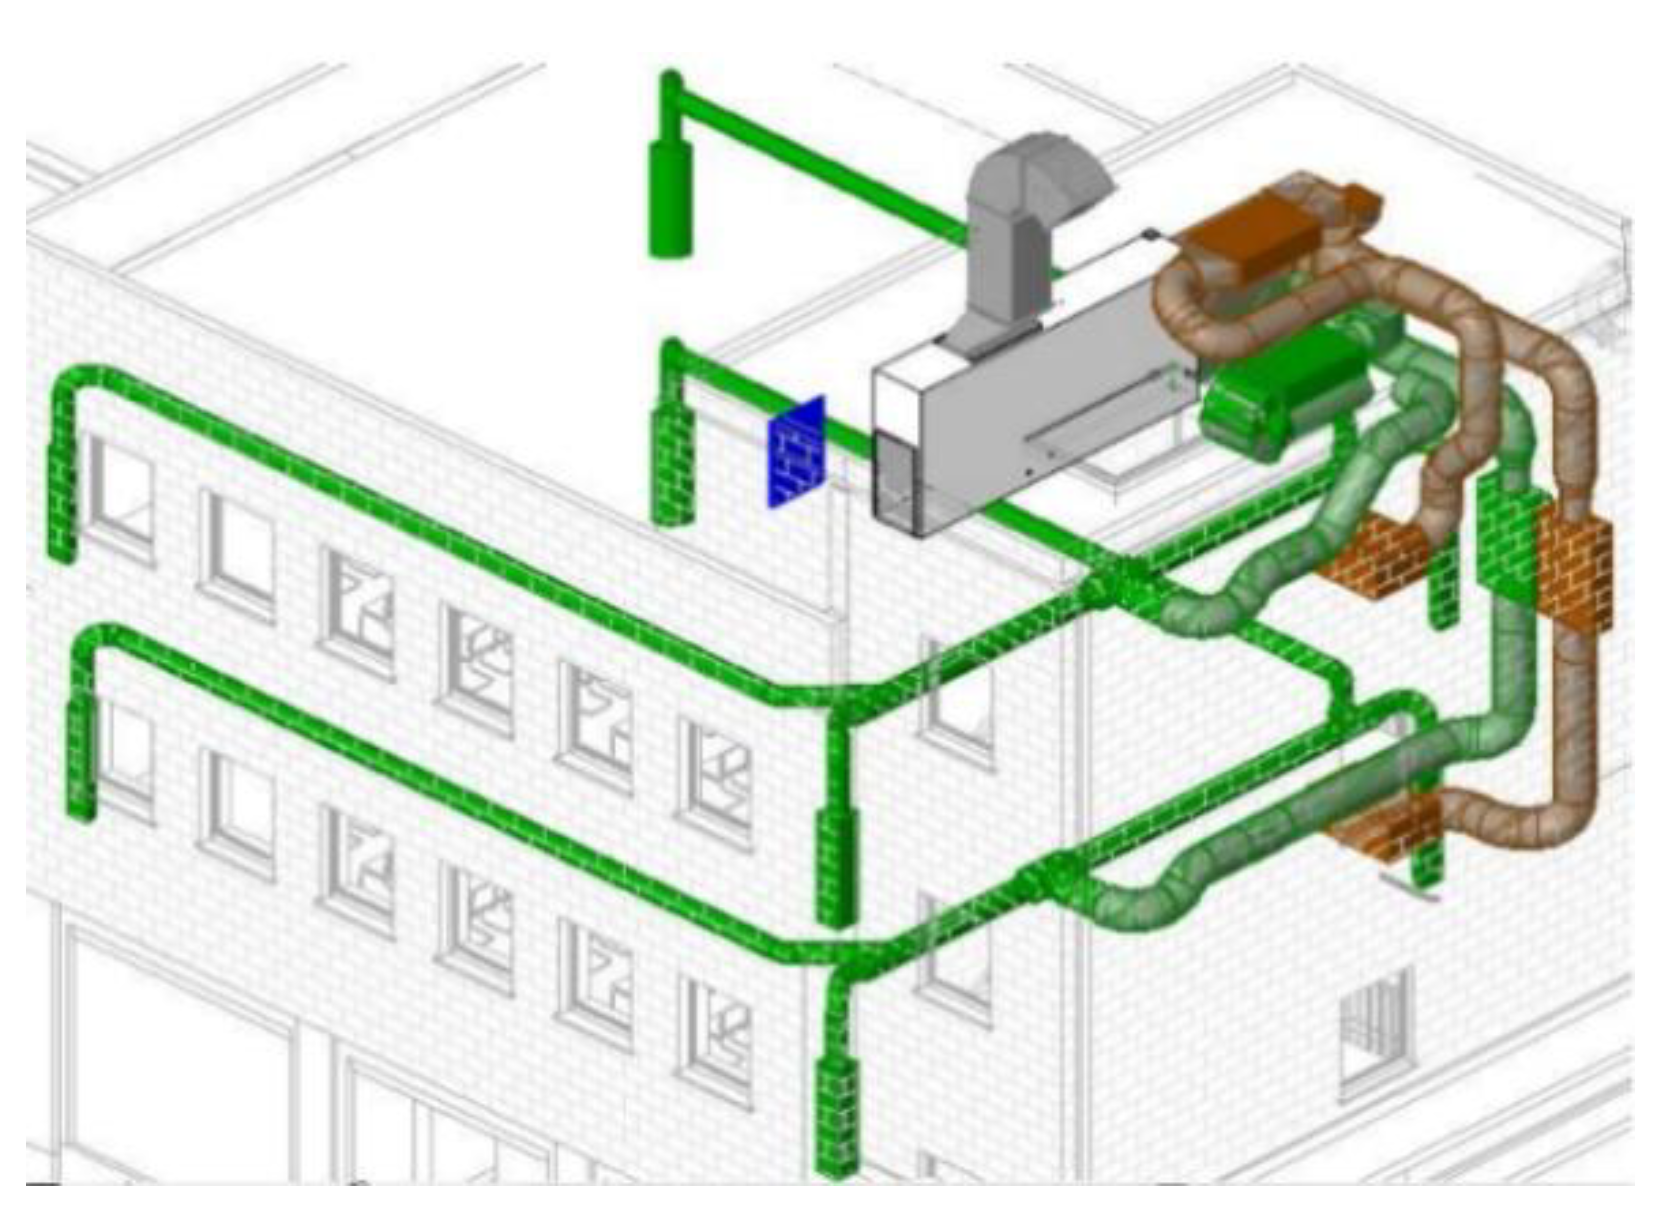
The building is equipped with an all air system with balanced mechanical ventilation with a total supply airflow of 4400 m3/h (see Figure 3). Demand controlled ventilation with 4 Variable Air Volume (VAV) boxes control the airflow based on CO2-concentrations in the rooms. For heating purposes, the air is preheated by air-to-air heat recovery, i.e., two cross flow plate heat exchangers connected in series, with an efficiency of 78%. Additionally, heating coils of 7.9 kW each are integrated in the supply ducts in each lecture room. The heating production system consists of a condensing wood pellet boiler with an internal storage of 600 L. The maximum heating power is 8 kW and the maximum efficiency is 95%.
2.1.3. Ventilative Cooling System
Two different principles of ventilative cooling are implemented in this building: (1) natural night ventilation (2) an air handling unit (AHU) that cools the supply air by controlling the modular bypass and by using indirect evaporative cooling (IEC).
Design of the building and its ventilative cooling systems is described in [22]. Thermal summer comfort and net cooling demand in both lecture rooms are evaluated using building energy simulations (BES). Without ventilative cooling, none of the lecture rooms meet the requirement of EN 15251 [24] of overheating hours less than 5% of the time in use. Night ventilation (with an airflow of 5 h−1) significantly lowered the predicted overheating hours. However, it was concluded from these BES simulations that thermal summer comfort was reasonable but not excellent in these densely occupied lecture rooms. As a result, it was decided to add indirect evaporative cooling. Moreover, the annual net cooling demand of the building with night ventilation is equal to 6 kWh/(m2·a), fulfilling the Passive House requirement of 15 kWh/( m2·a) in school buildings [23].
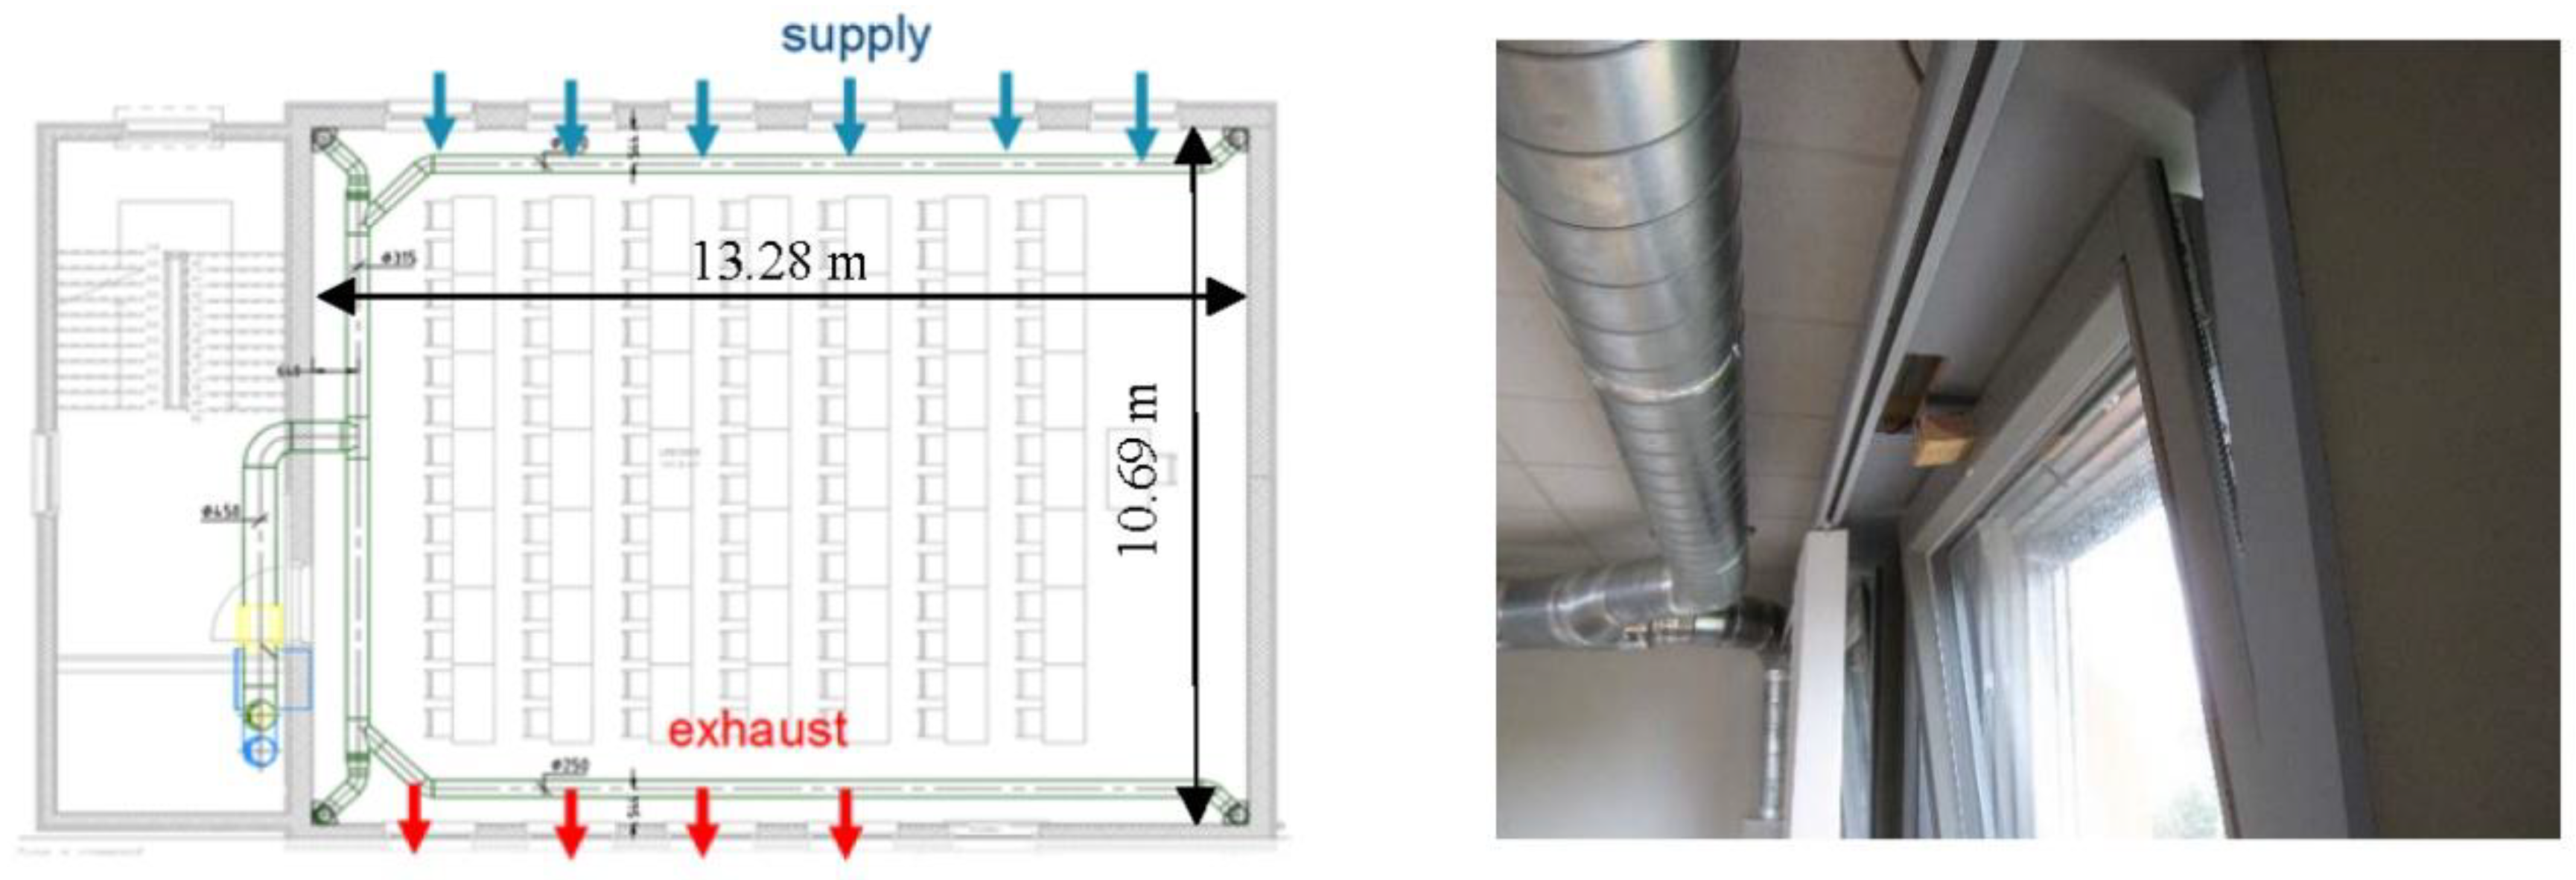
Night ventilation relies on cross ventilation through openable windows at both sides of the room (see Figure 4). The system includes 10 motorized bottom hung windows (1.29 × 1.38 m2, maximum opening angle of 8.8°) with a chain actuator. There are 6 windows on the southwestern side and 4 on the northeastern side of the lecture room located at 1m height from the bottom. The depth of the lecture room is 3.96 times the height of the room, i.e., smaller than the maximum depth-to-height of 5 according to the rule of thumb as described in [25]. The total effective opening area of these windows is 4.0% of the floor area.
The modular bypass and IEC are part of the AHU. The maximum airflow rate is 4400 m3/h. The maximum capacity of IEC at maximum airflow is 13.1 kW.
2.1.4. Control Strategy
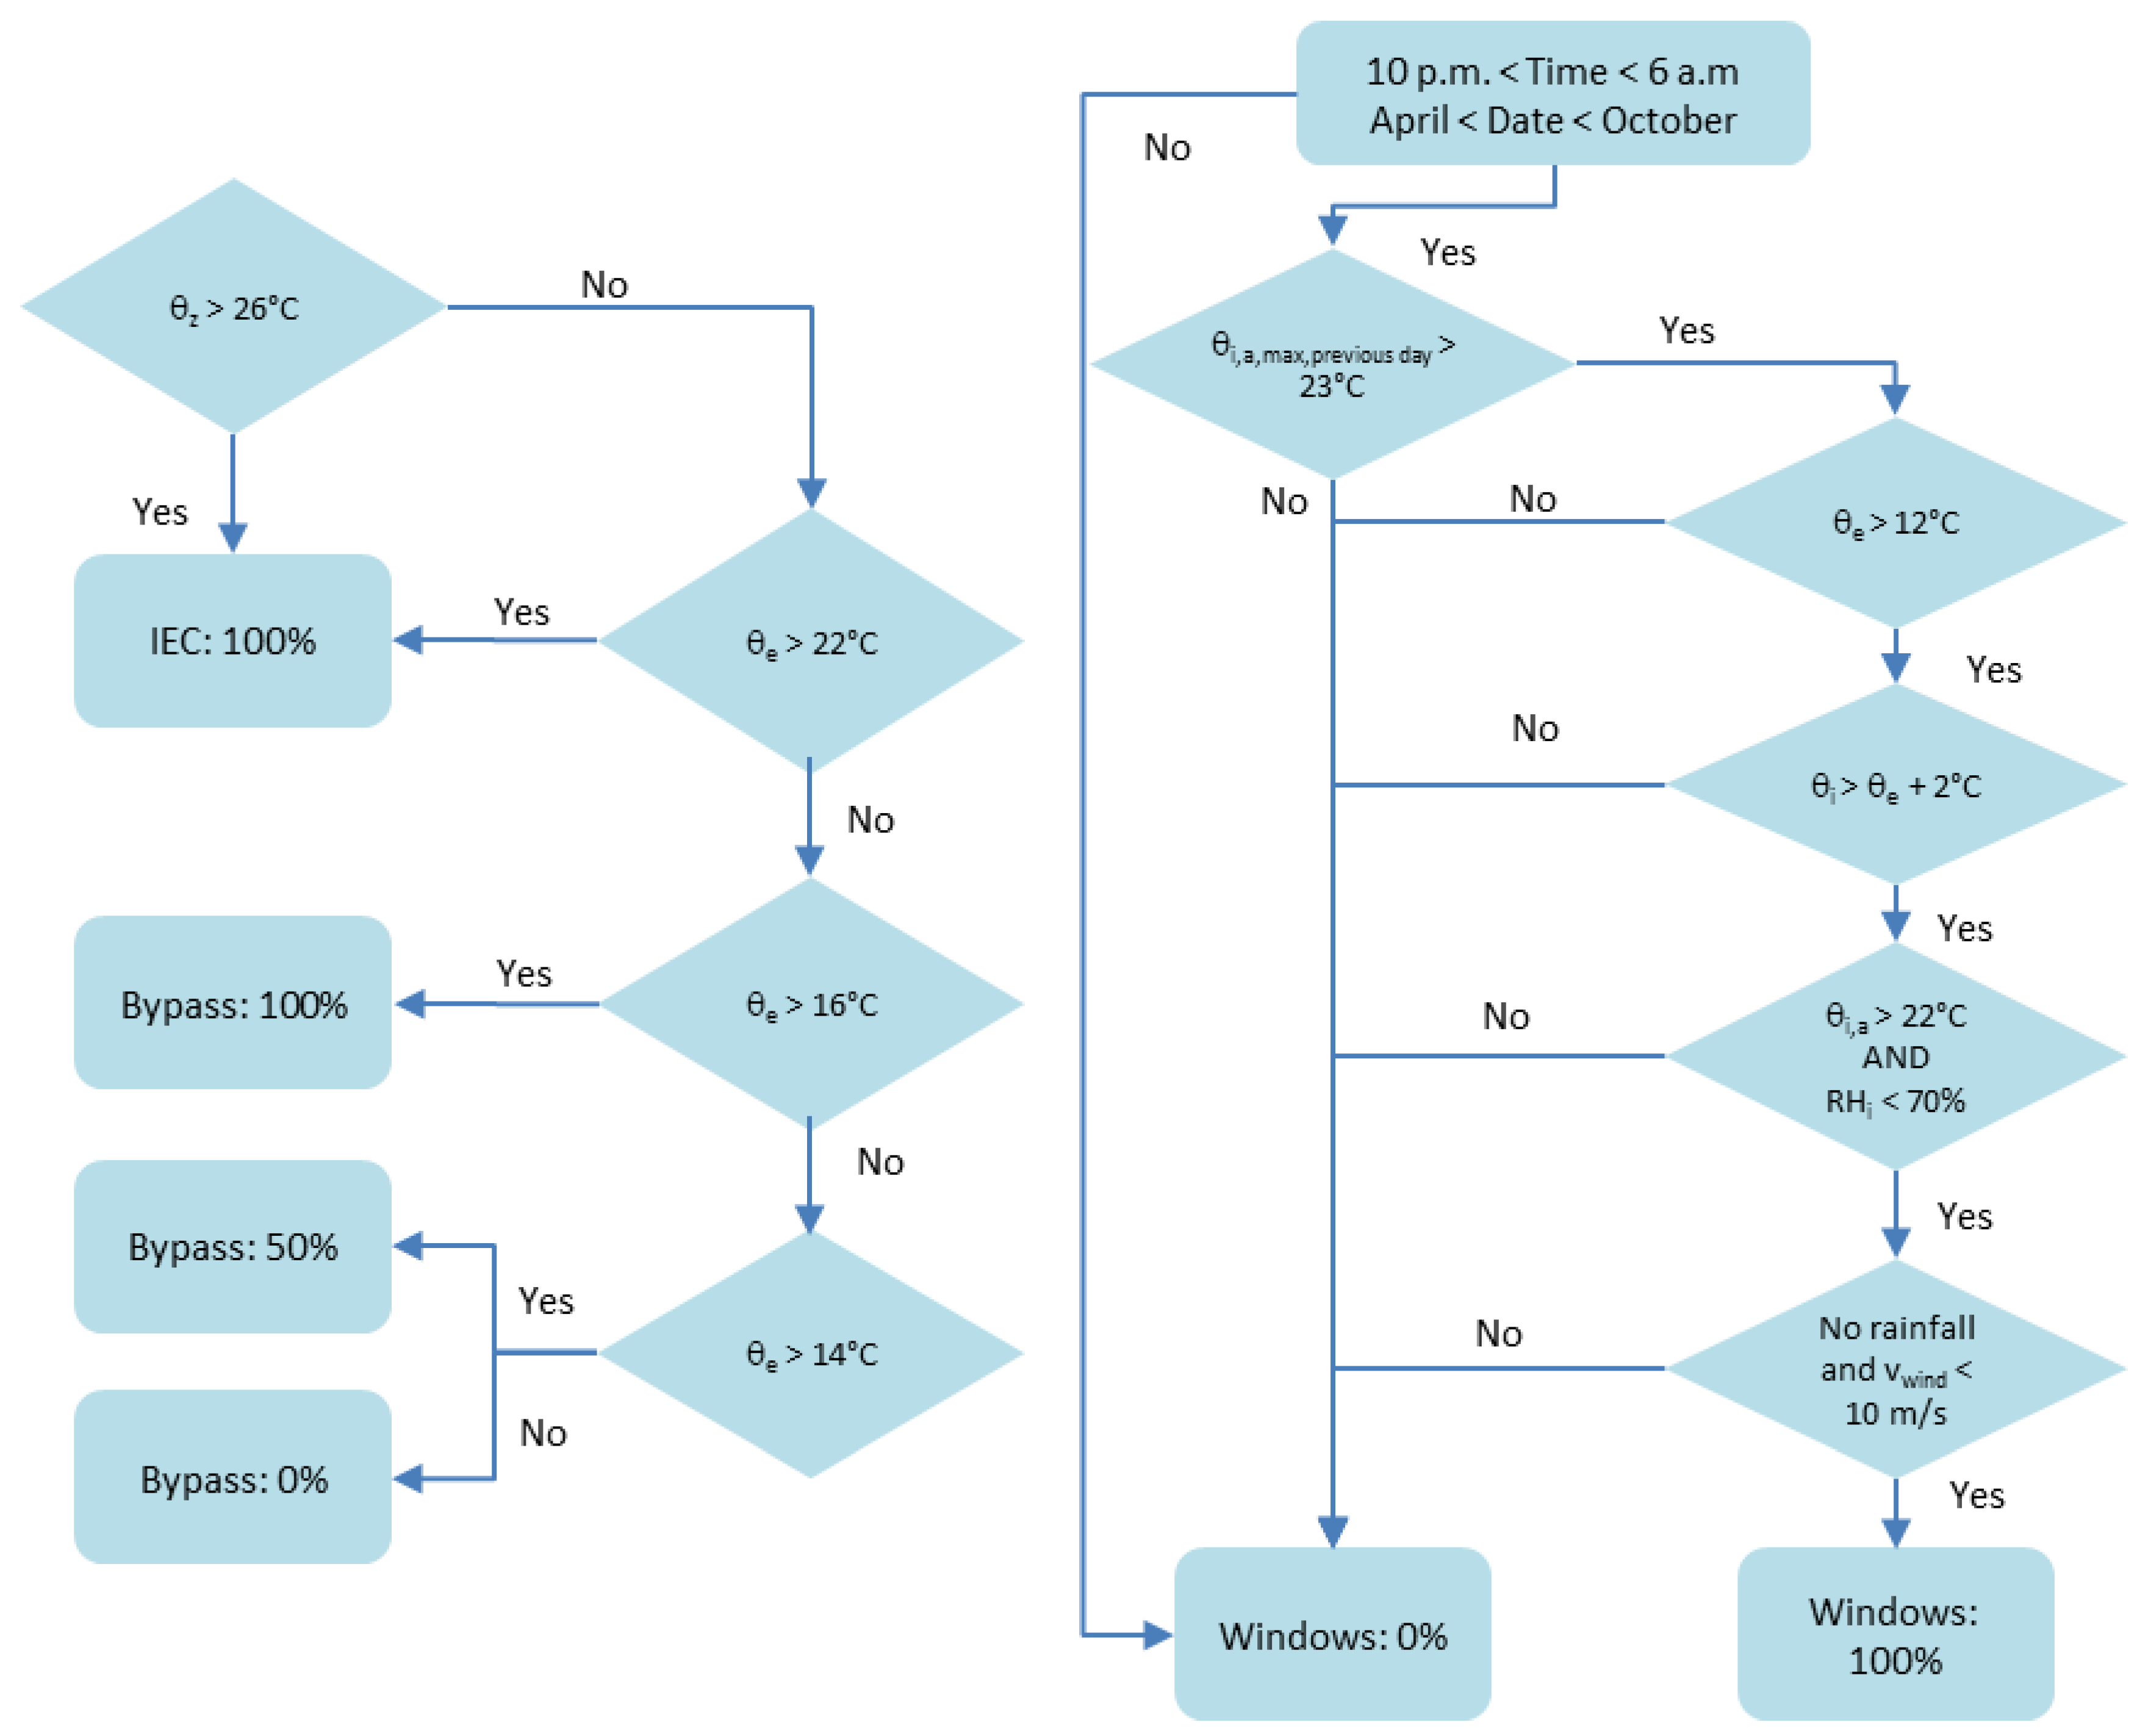
Control strategy of the systems consists of two parts. First, the control strategy of the mechanical ventilation system (operation of bypass and IEC) during occupancy is based on internal and external temperatures (see Figure 5 left). This strategy actuates the supply air temperature and the air flow rate. The internal room temperature set point is 22 °C. When the room temperature exceeds the set point +4 °C, the evaporative cooling is activated on maximum airflow rate. IEC is active until the room temperature is lower or equal to the set point −0.5 °C. When the external temperature is higher than 22 °C, indirect evaporative cooling is activated. If the external temperature is between 16 °C and 22 °C, the bypass on the heat exchanger is active. When the external temperature is between 14 °C and 16 °C, 50% of the fresh air is sent through the heat exchanger and 50% is bypassed. When the outside air is colder than 14 °C, the bypass is switched off.
Second, the control strategy at night that actuates the opening of the windows is based on internal temperature and relative humidity and external weather conditions (temperature, rain) measured on site (see Figure 5 right). This strategy is inspired by the recommendations of [26]. The windows remain open/closed for at least 15 min. Windows are opened between 10:00 p.m. and 6:00 a.m. from April 1st to October 31st when the following criteria are fulfilled:
- Room temperature exceeds both the heating set point (=22 °C) and the external temperature +2 °C
- Maximum room temperature of the previous day exceeds 23 °C
- External temperature is higher than 12 °C
- Internal relative humidity is smaller than 70%
- There is no rainfall and the wind velocity on site is smaller than 10 m/s
2.2. Measurement Setup
2.2.1. Airflow Rate and Room Air Temperature Profile
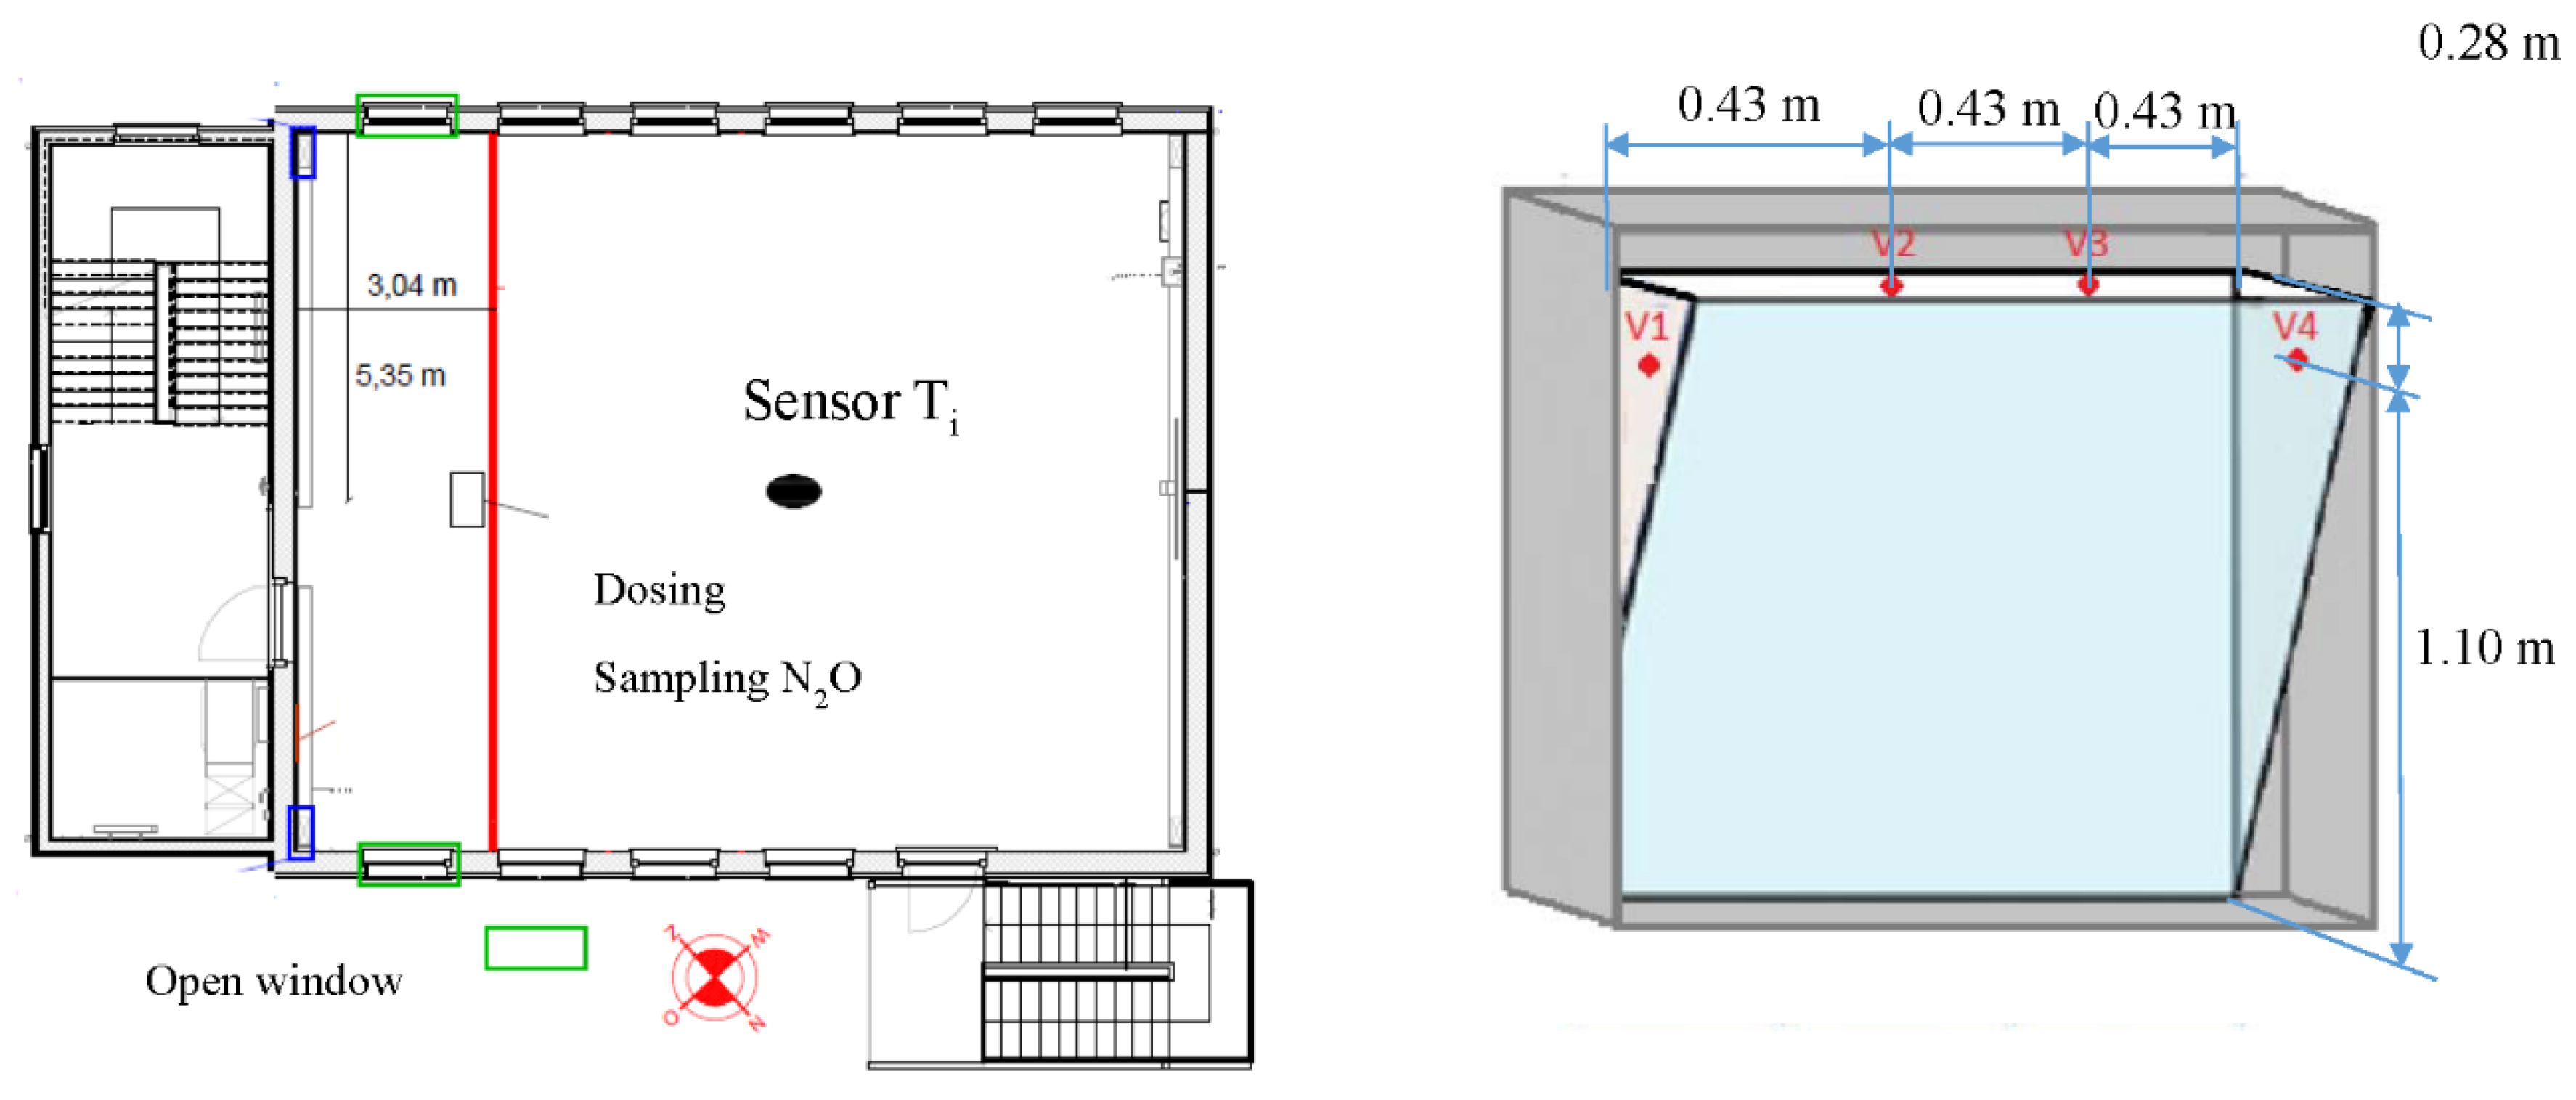
Air Changes Rates (ACR) as result of the opening of the windows in the lecture rooms was measured using a tracer gas concentration decay test method in March and April 2017. The used gas is N2O also known as laughing gas. Tests were completed in accordance with the procedures set out in EN 12569 [27]. The measurements were carried out in a representative zone with two opposing windows with a width of 3.04 m (see Figure 6, left). Tracer gas was injected and sampled in the middle of this small room. A fan was used to spread the tracer gas over the entire zone at to reach a homogenous concentration. This concentration was increased in this sealed room to a constant value of 200 ppm. After reaching this goal, one or two opposing windows (depending on the test) were opened. The accuracy of the tracer gas equipment is 10% of the measured value.
ACR was also estimated from the air velocity measurements. Figure 6 (right) shows the test setup: the air velocity is measured every 10 s during 30 min with omnidirectional sensors. The following 4 locations are selected: V1 and V4 are positioned in the side triangles of the window opening at 0.28 m below the top of the window. In addition, V2 and V3 are positioned in the top opening at 0.43 m from the left and right end of the window (i.e., at 1/3 and 2/3 of the width). The effective area of the window is calculated at 0.109 m². The airflow is determined as the effective area multiplied by the median of the air velocity.
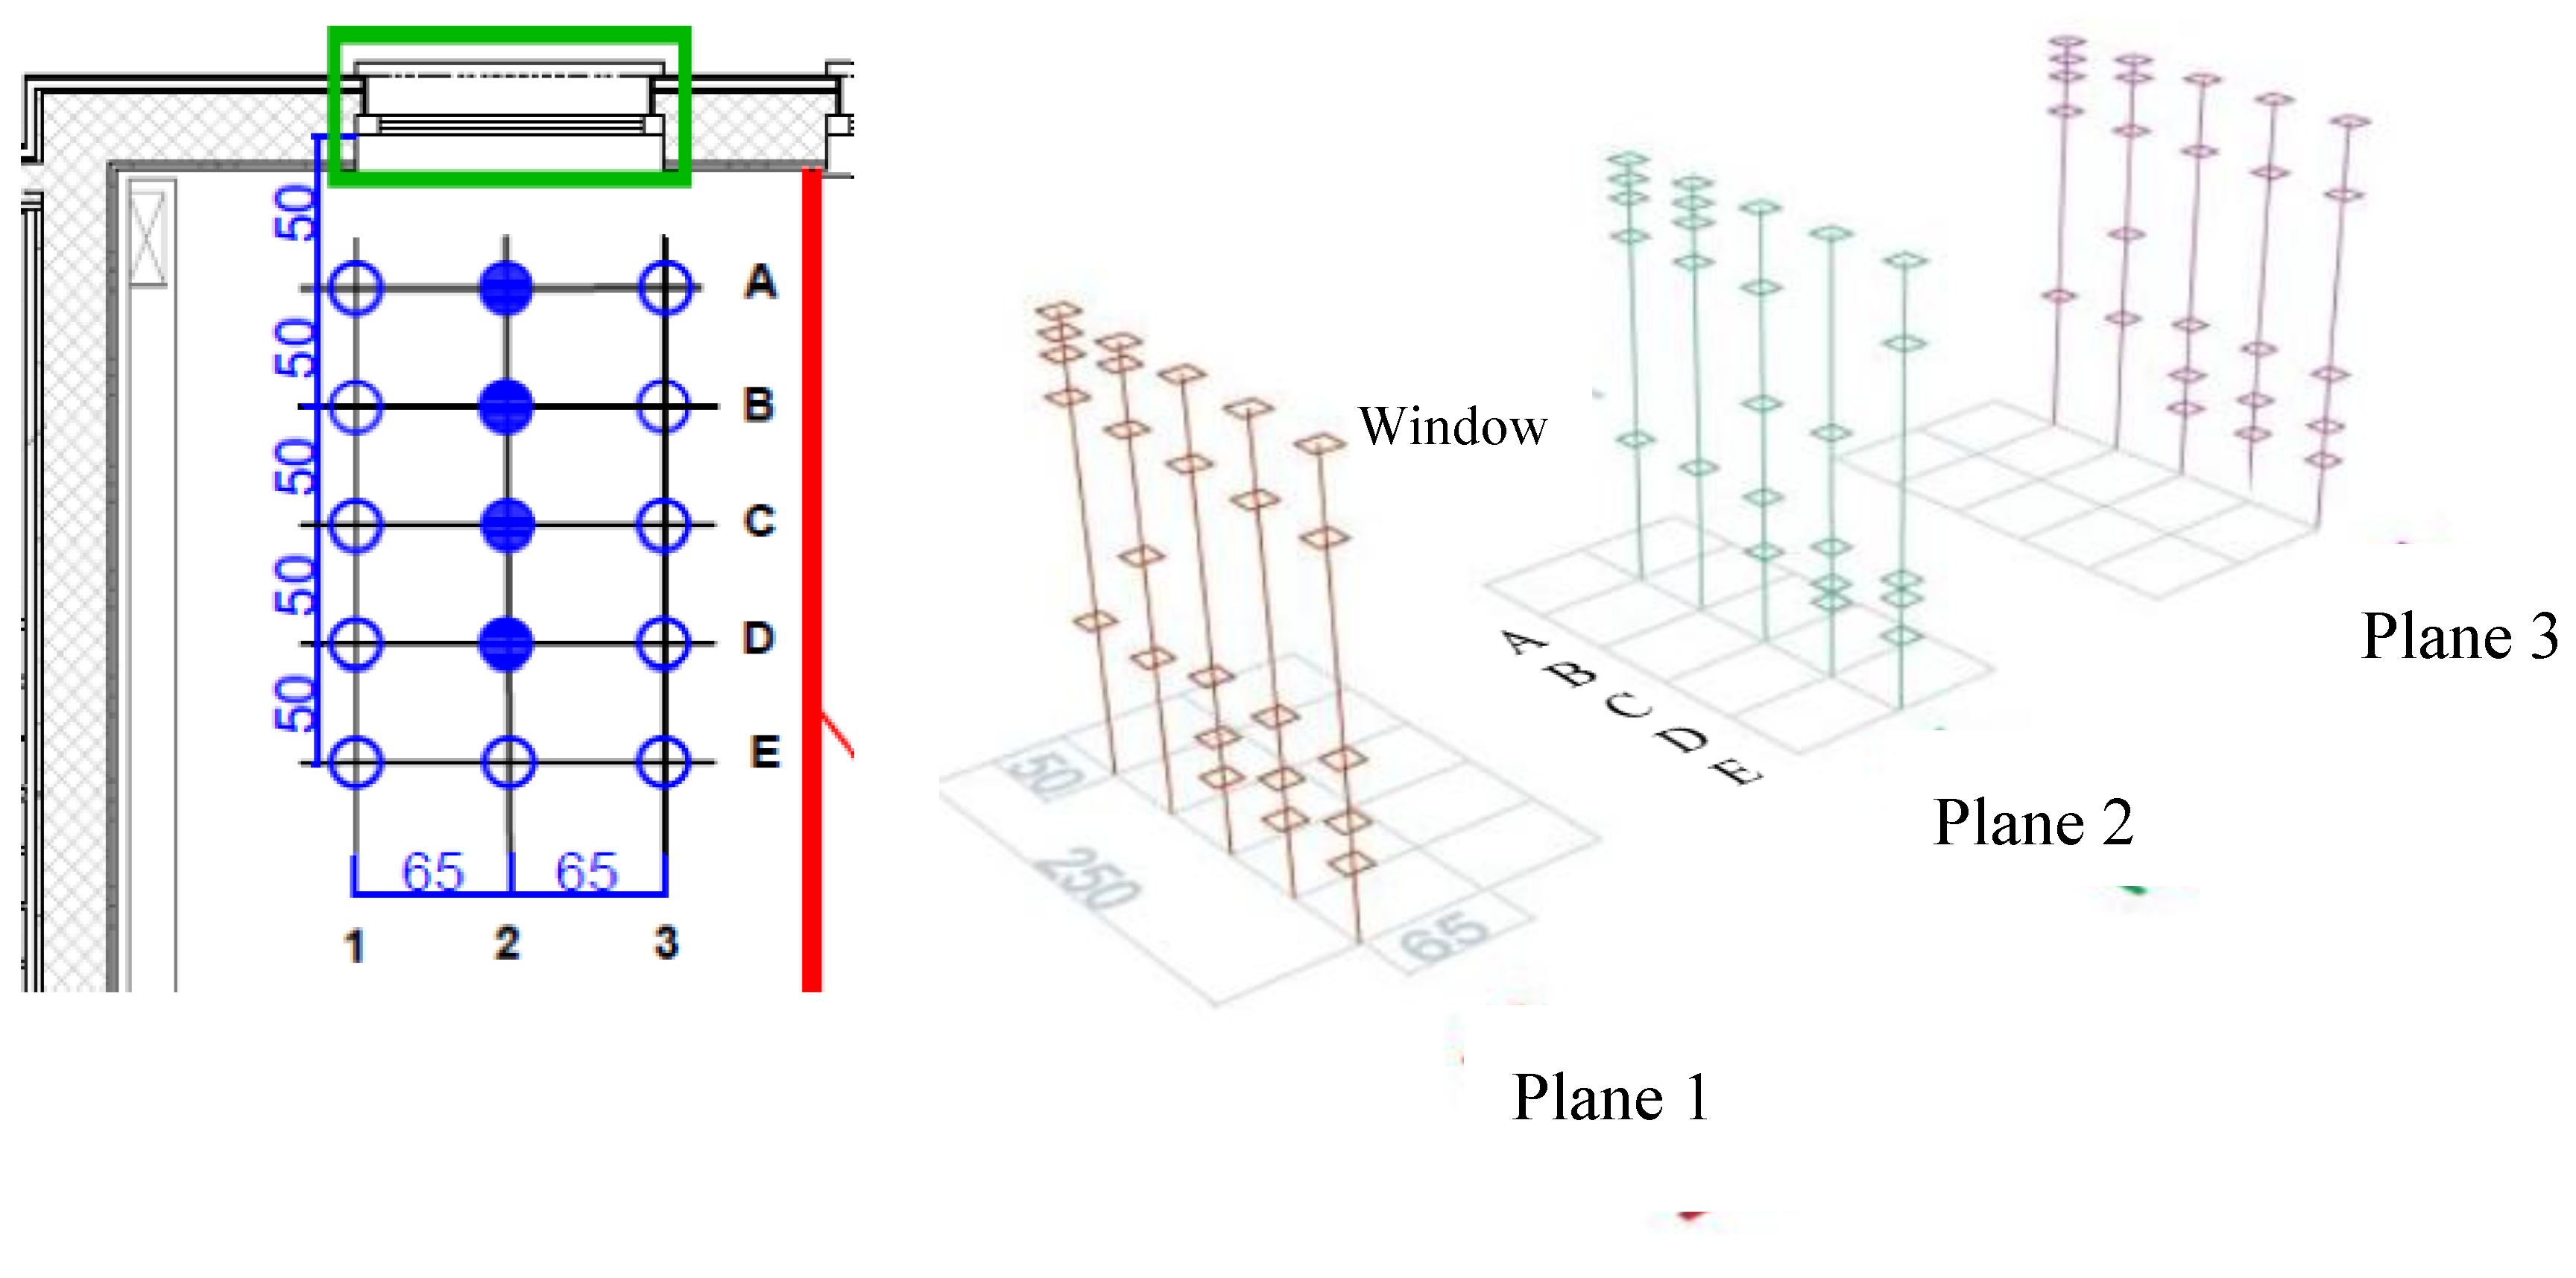
Moreover, the air flow pattern is visualized by measuring air temperatures in the room. Figure 7 shows the grid of sensors: positions with horizontal distances and heights. The measuring 5 different heights for each position were determined as follows (see reference [28]). On each position, 15 sensors were located from 0.3 m to 2.4 m with a height difference of 0.1 m. Air temperatures are measured during 20 min after opening of the window. Heights are eliminated whenever the temperature difference between two consecutive heights smaller is than 0.1 °C, i.e., the accuracy of the sensors. Moreover, sensors are distributed over the height of the room, representing the different stratification zones at the different positions. Table 2 shows the resulting measurement heights in plane 2, i.e., the central plane perpendicular to the window opening.
2.2.2. Indoor Climate and Operation of Ventilative Cooling
A set of sensors has been installed to monitor continuously indoor and outdoor conditions and is described in [29]. The lecture rooms have their own weather station that monitors the main outdoor parameters: global horizontal solar radiation, outdoor temperature, relative humidity, wind speed and direction. For the indoor conditions, the temperature, CO2 concentration and the humidity are continuously monitored. The occupancy of the lecture room is measured by using counting cameras which were installed in the lecture room. The operational data of the AHU, night ventilation, IEC, heating systems, etc. is also continuously monitored. The data from these sensors are displayed in real time and recorded within a computer based monitoring and control system. The time step is 1 minute. Table 3 shows type and accuracy of the sensors used in this study.
In this study, internal temperatures and operation of ventilative cooling are studied during the cooling season in 2017 in the lecture room on the first floor, i.e., from 22 May to 30 September 2017. As there was no occupancy in July and only limited in August, these months are excluded from the analysis.
Belgium has a temperate climate without dry season with warm summer, i.e., climate zone Cfb according to the Köppen–Geiger classification [30]. A typical year includes 28 days with a maximum outdoor temperature above 25 °C. 2017 had 33 and 7 days with a maximum outdoor temperature exceeding 25 °C and 30 °C, respectively [31].
3. Results and Discussion
3.1. Airflow Rate
Table 3 presents the results of the tracer gas decay tests for single sided and cross ventilation including the local weather conditions (wind velocity and direction) and the average indoor-outdoor temperature difference during the test. For single-sided and cross ventilation, the 95% confidence interval for ACR is respectively 1.21 to 2.12 and 2.17 to 4.64 h−1.
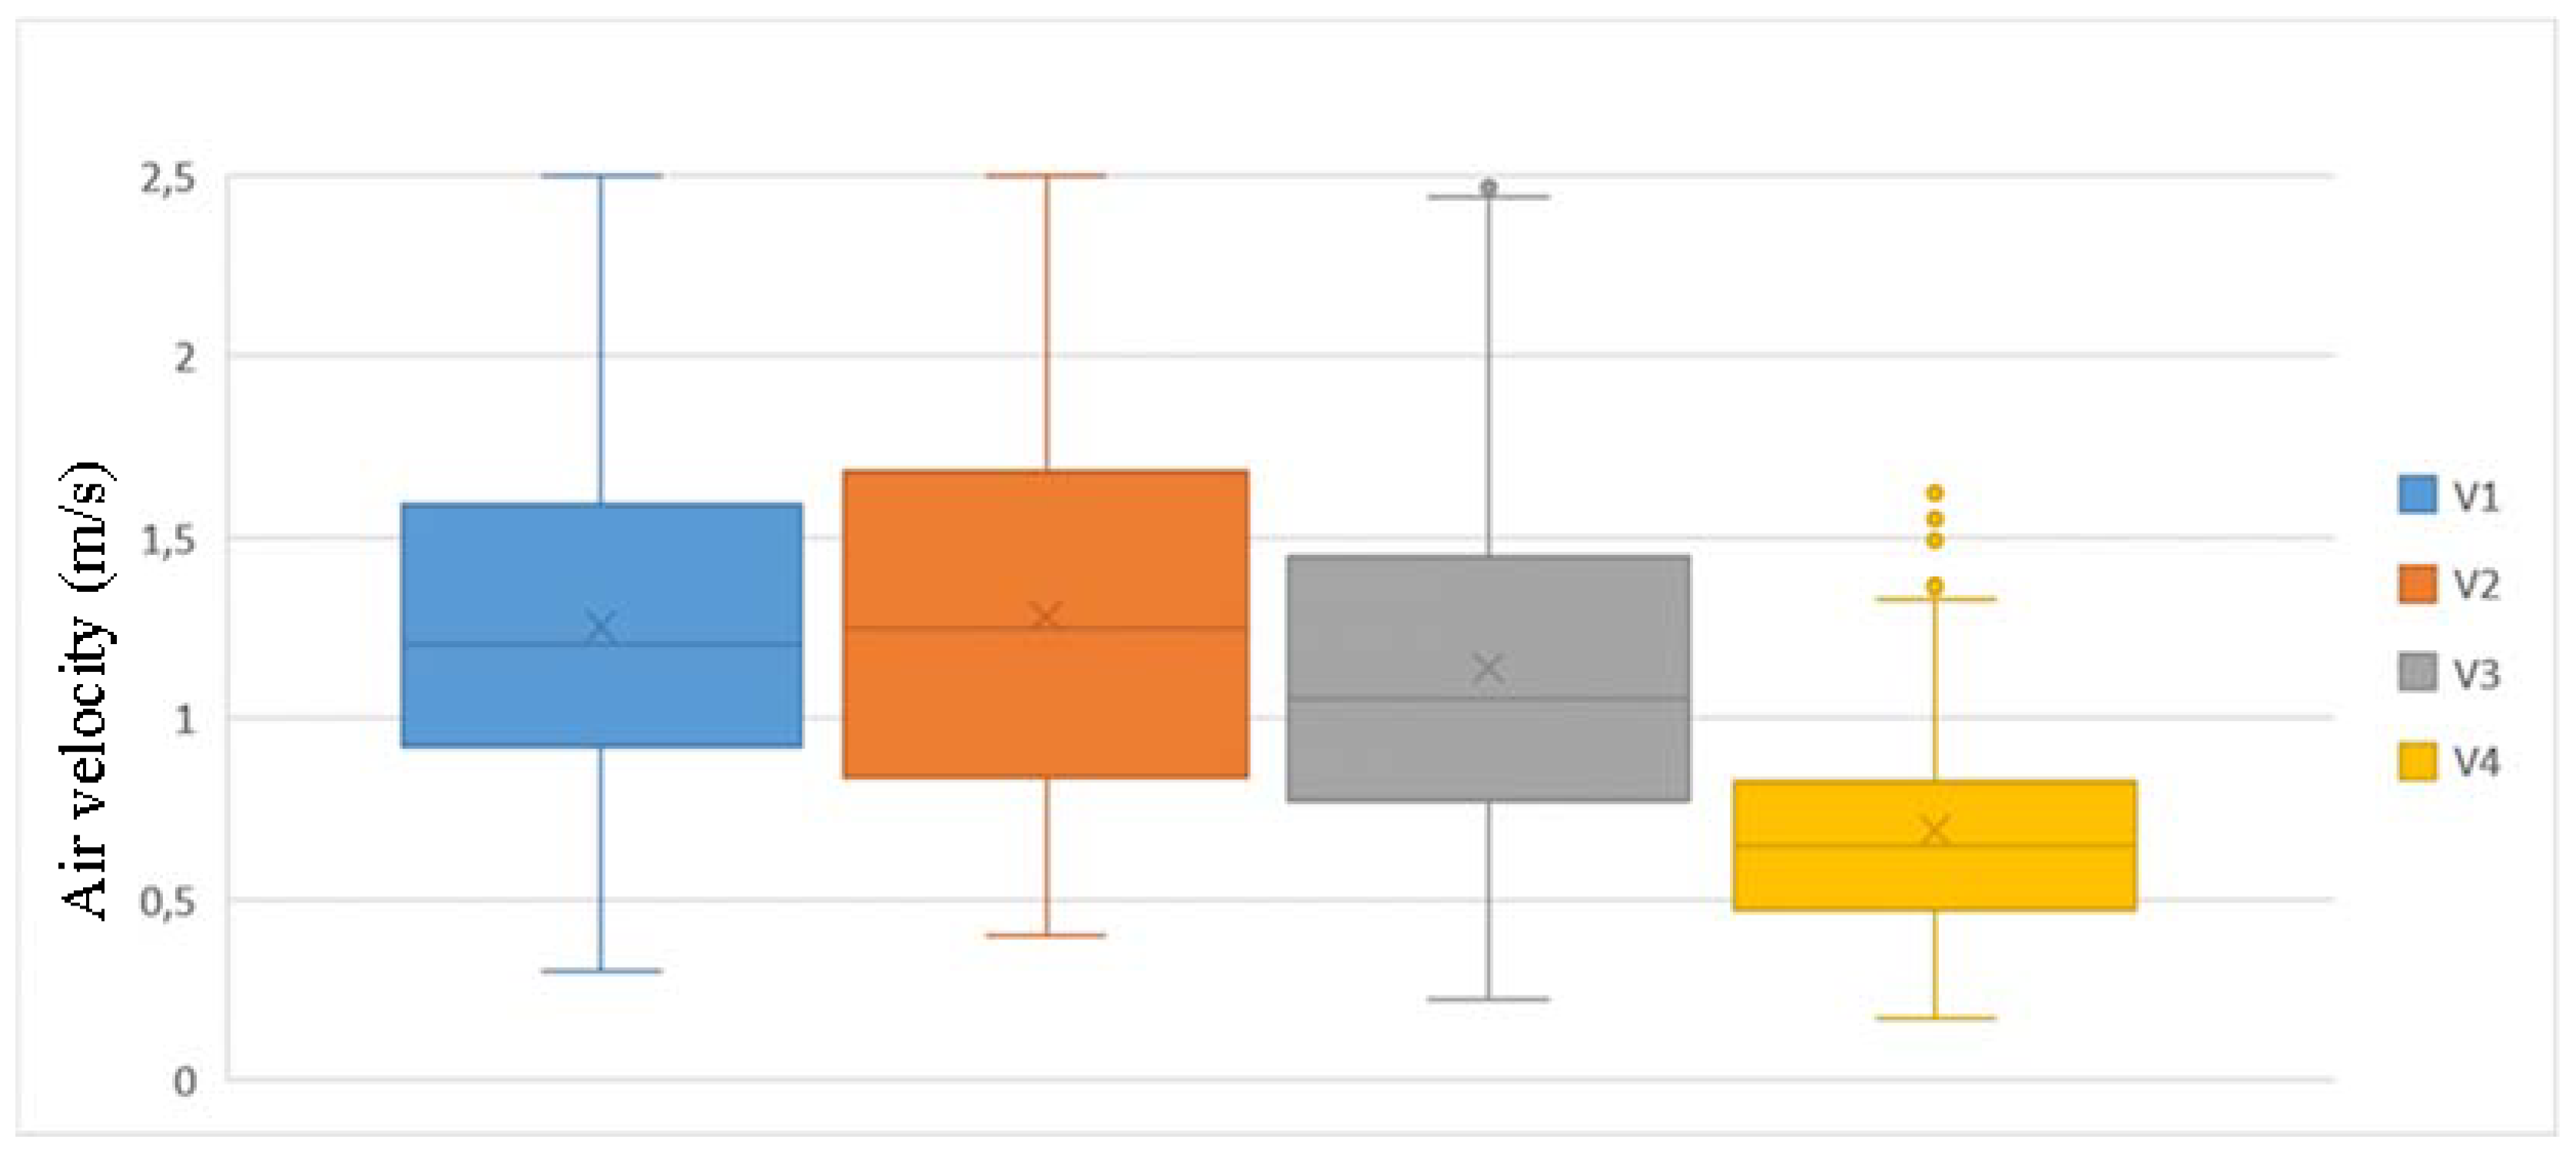
Figure 8 shows the results of the air velocity measurements for cross ventilation executed at the same moment as the first tracer gas test in Table 3. The median value on the different positions equals 1.21 m/s, 1.25 m/s, 1.05 m/s, and 0.65 m/s. Only the velocity at position V4 (see set up in Figure 6) has a deviating value. This air velocity results in an ACR of 4.21 ± 0.13 h−1. A good agreement with the result from the tracer gas decay method was found (see line 1 in Table 4).
It can be concluded that these ACR are rather low caused by the large installation depth of the windows in the façade. In the cross ventilation case, the ACR depends, as expected, greatly on wind direction and velocity. The ACR in these lecture rooms can be increased and made more reliable and stable by adding mechanical exhaust. However, this measure will also increase the fan energy.
3.2. Room Air Temperature Profile
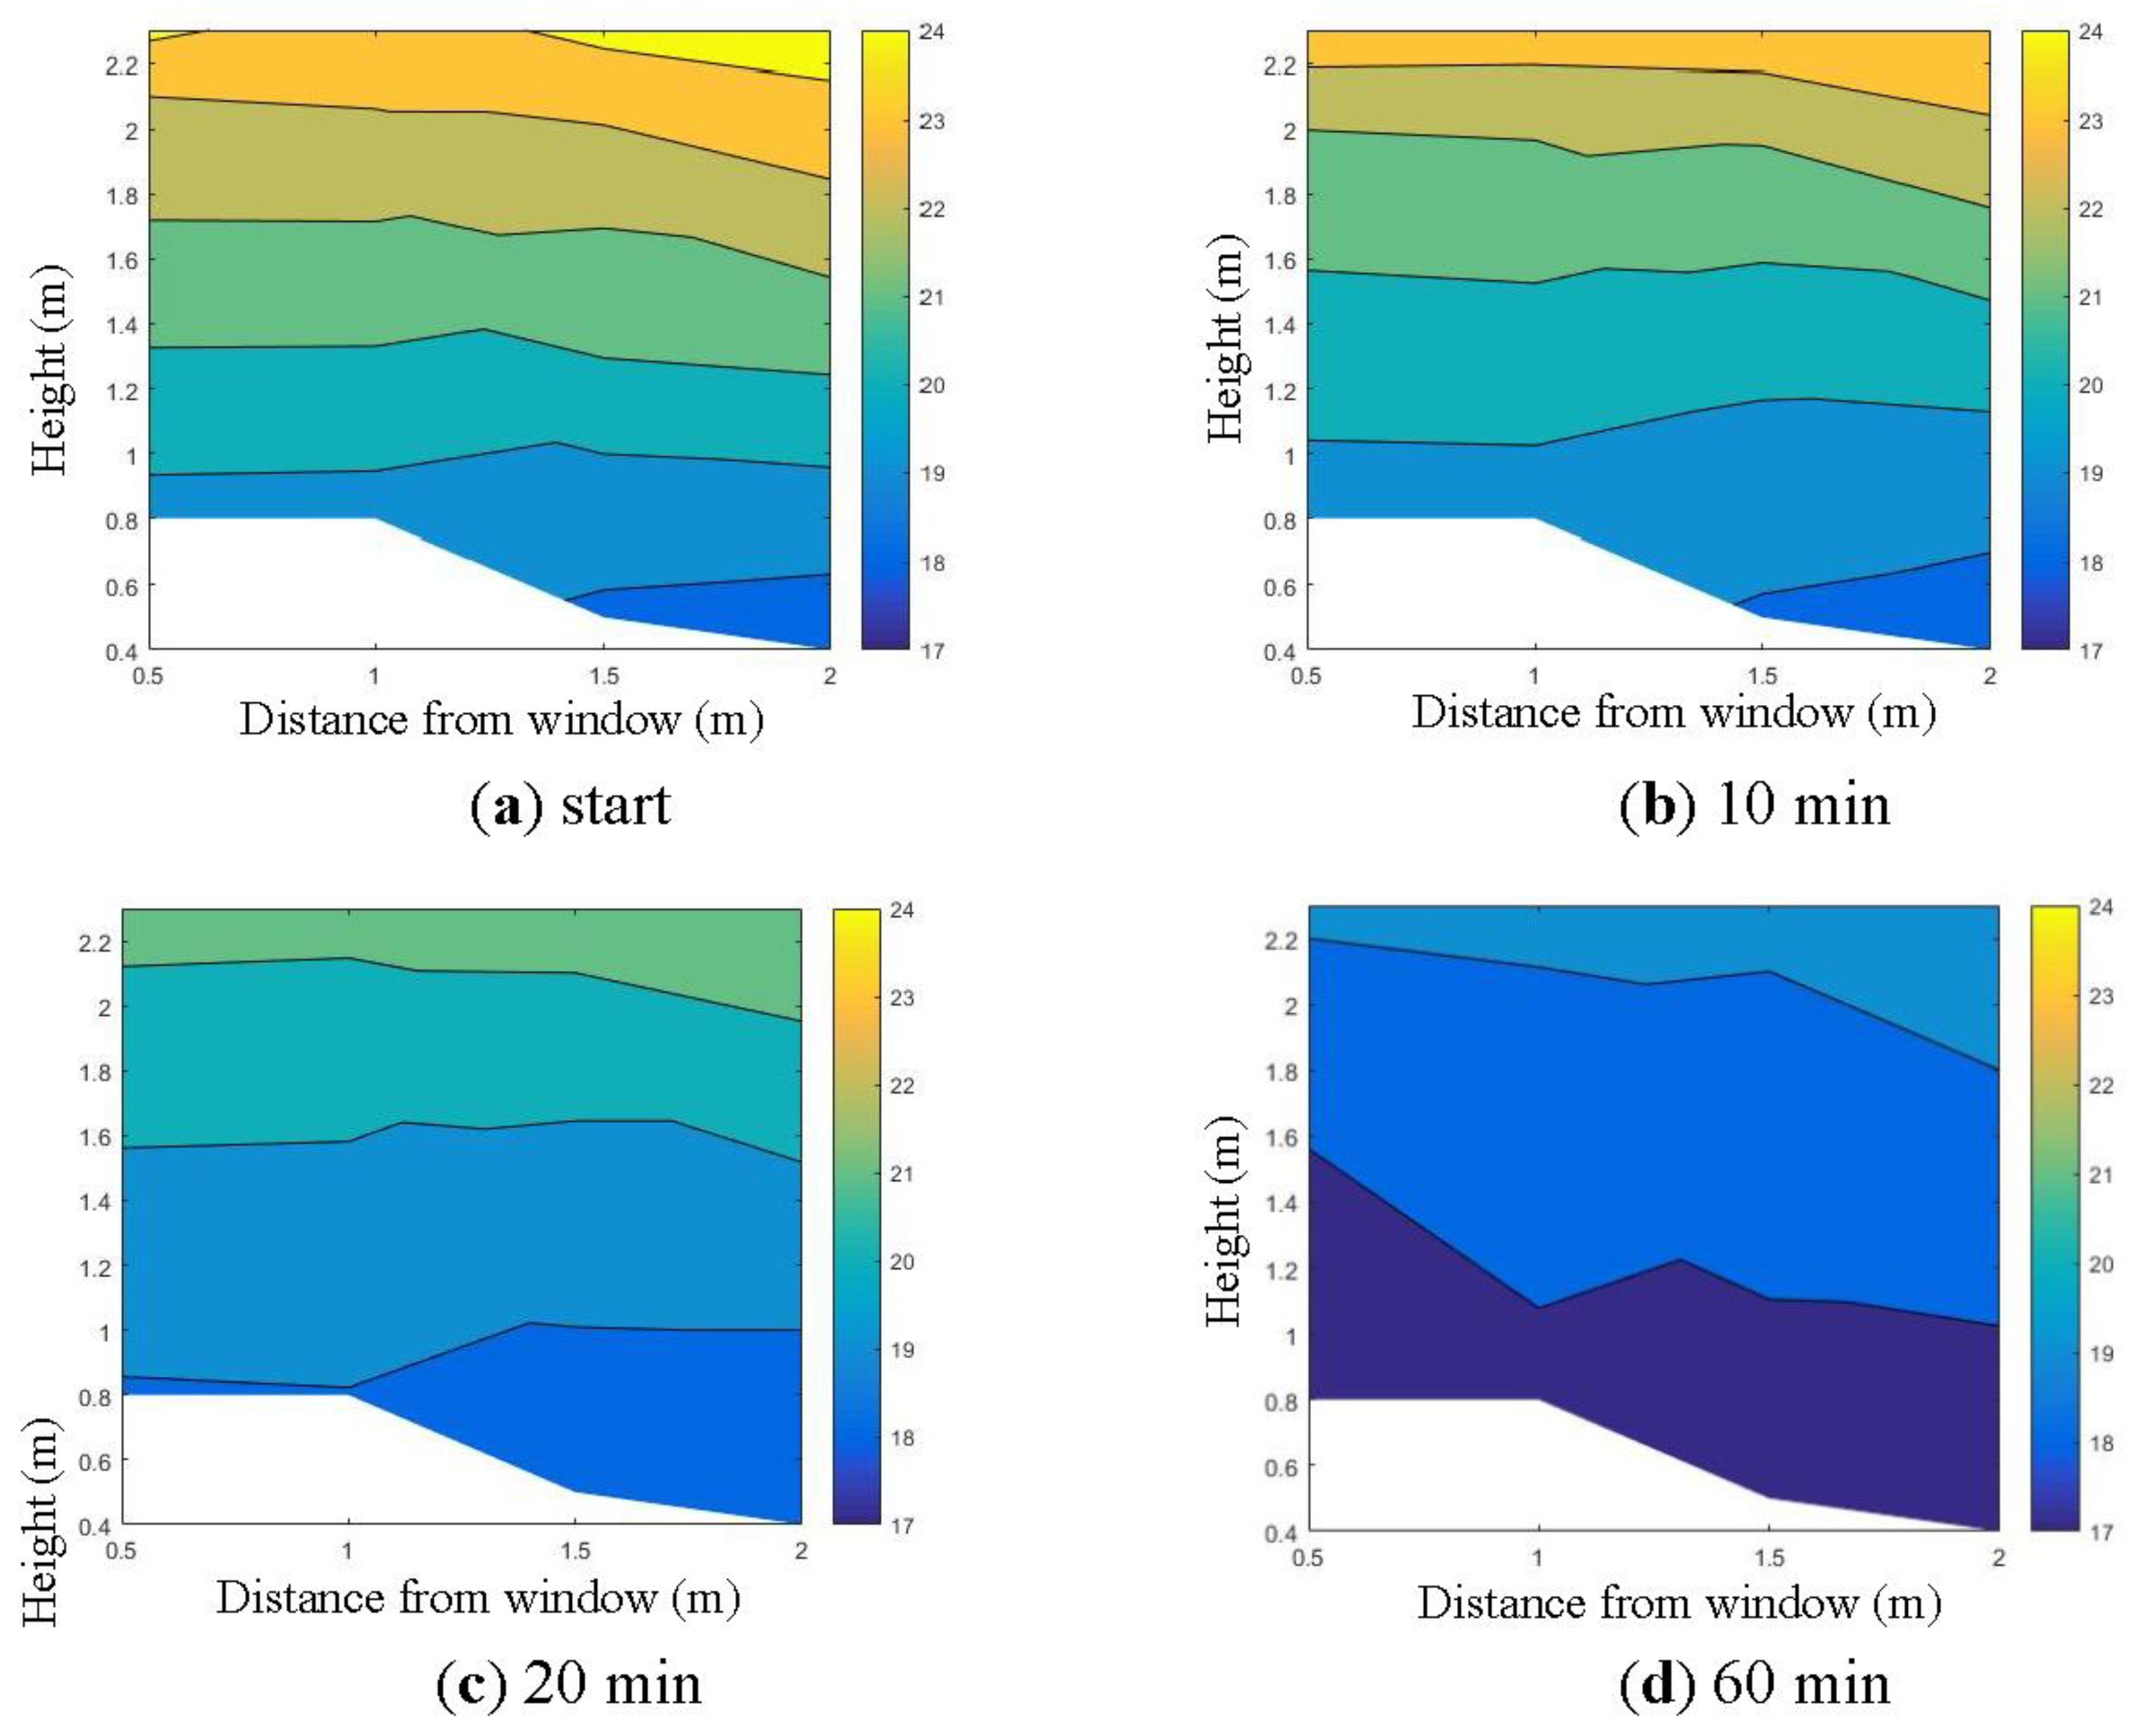
Figure 9 shows the air temperatures measured in the center plane (i.e., plane 2 on Figure 7) at the start and 10, 20, and 60 min after opening the window in case of cross ventilation. The horizontal axis shows the distance to the window (starting at 0.5 m), the vertical axis shows the height from the floor (starting at 0.4 m). The local weather conditions (wind velocity and direction) and the average indoor–outdoor temperature difference during the test are summarized in Table 5.
The stratification at the start changes to a more uniform air distribution after 60 min. The air in the whole lecture room is cooled down: in the upper zone by almost 5 °C, in the lower zone by only 1 °C. This conclusion is in line with the conclusions of [32] who noticed in a full scale test room with a transition flow with a limited ceiling attachment length during most of the time with a long-term unstable behavior. However, due to the stratified initial conditions, it is hard to derive general conclusions from the results.
3.3. Operation of Ventilative Cooling
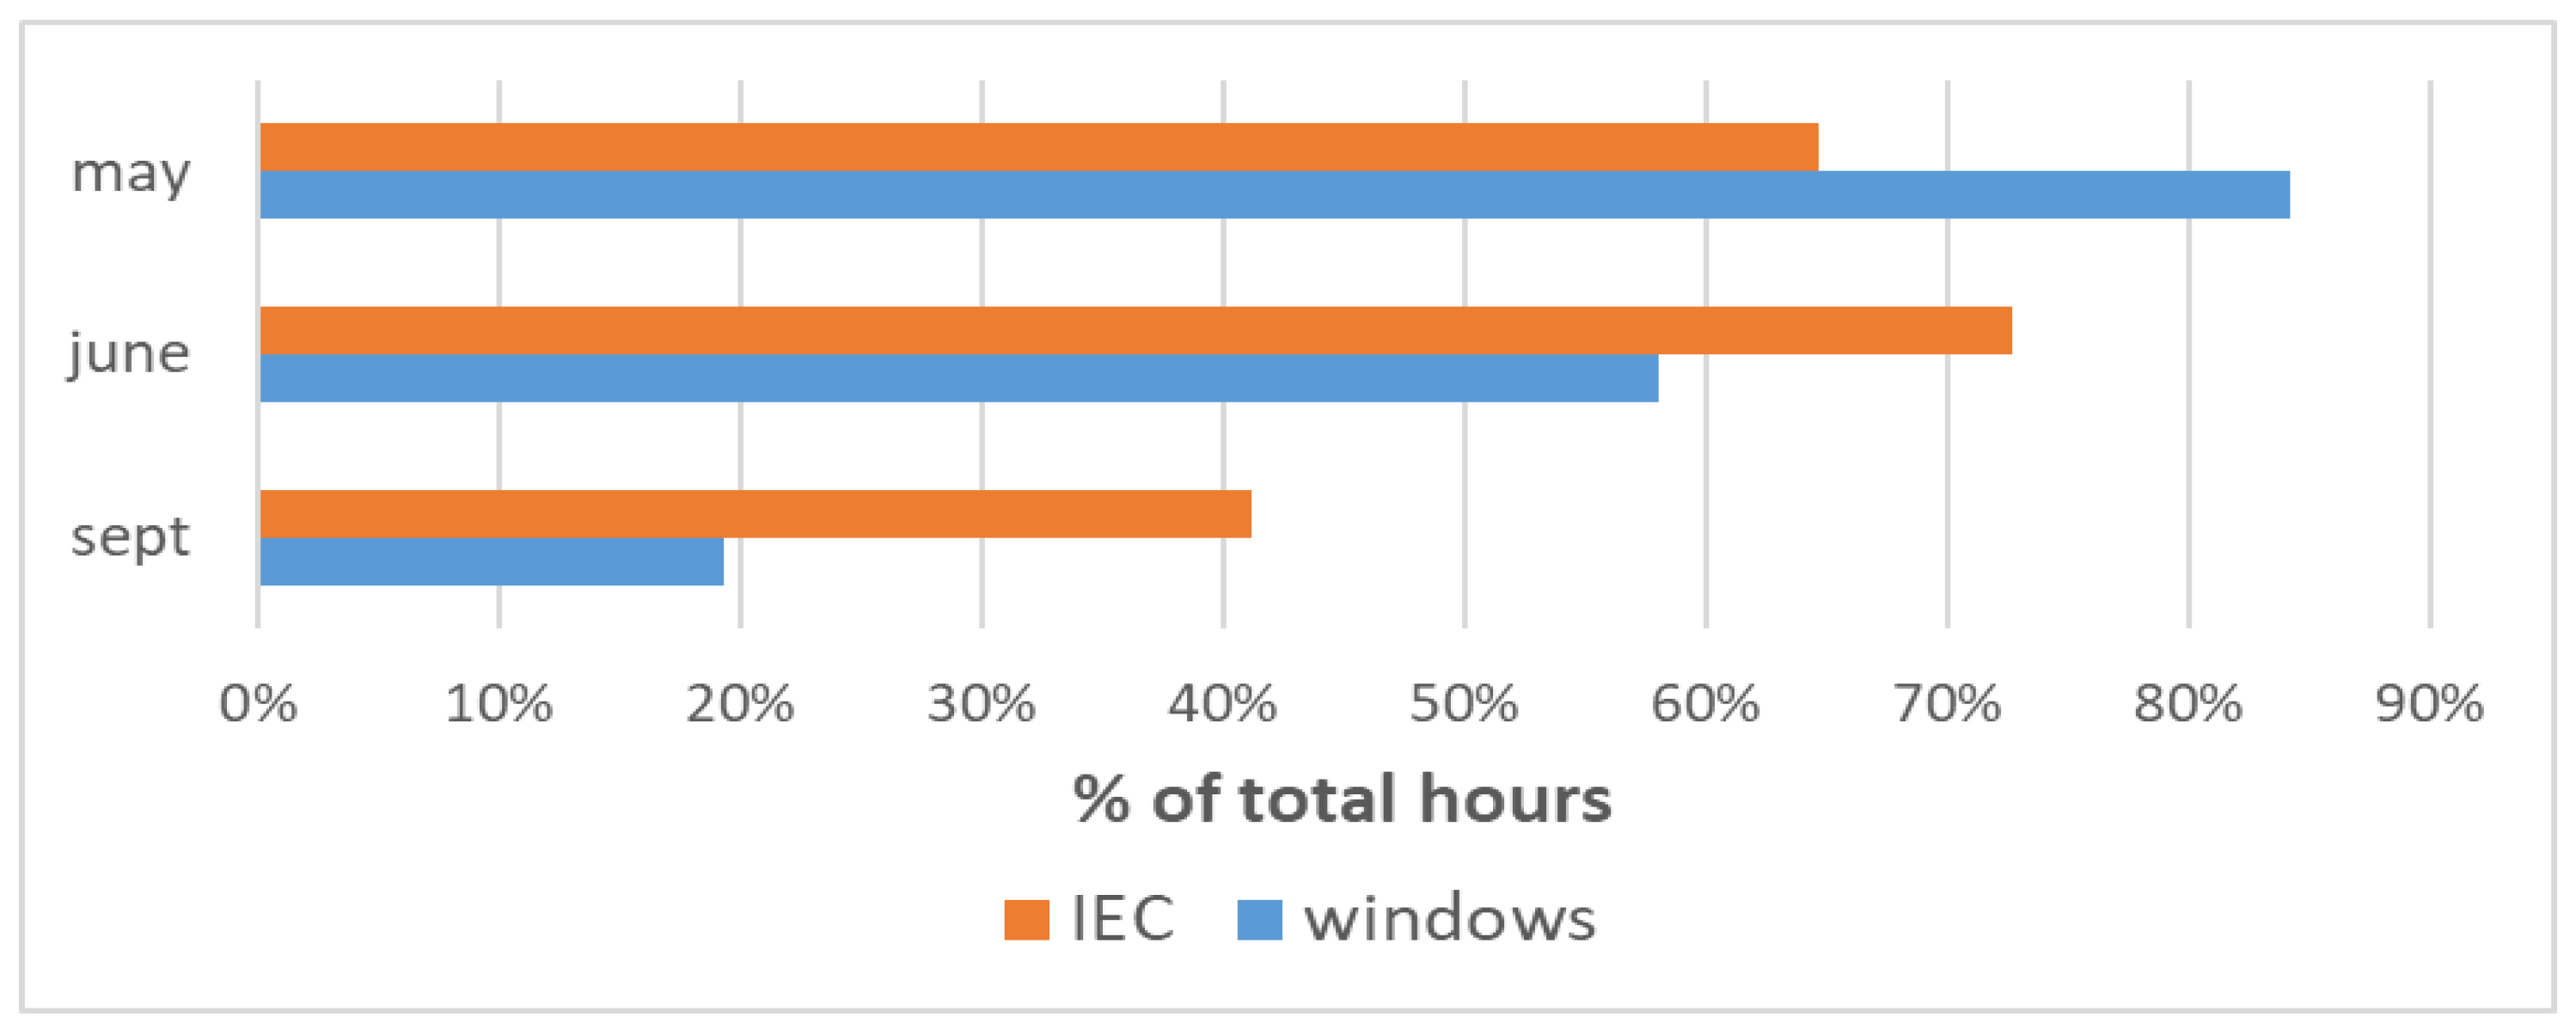
Figure 10 presents the ratio of operation time of the windows to the possible total opening hours by night (22 h tot 6 h) and the ratio of the operation of the IEC to the operation hours of the AHU by day. IEC and nighttime ventilation are in use during 66% respectively 45% of the time. This finding confirms the conclusions of the prediction simulations of thermal summer comfort in [22]. High internal heat gains cause the need of ventilative cooling during more than half of the occupied hours in the cooling season. In addition, this observation has the effect that the fan energy is increased due to (1) the AHU running at maximum airflow when IEC is in operation and (1) a higher pressure loss caused by the air flowing through the heat exchanger.
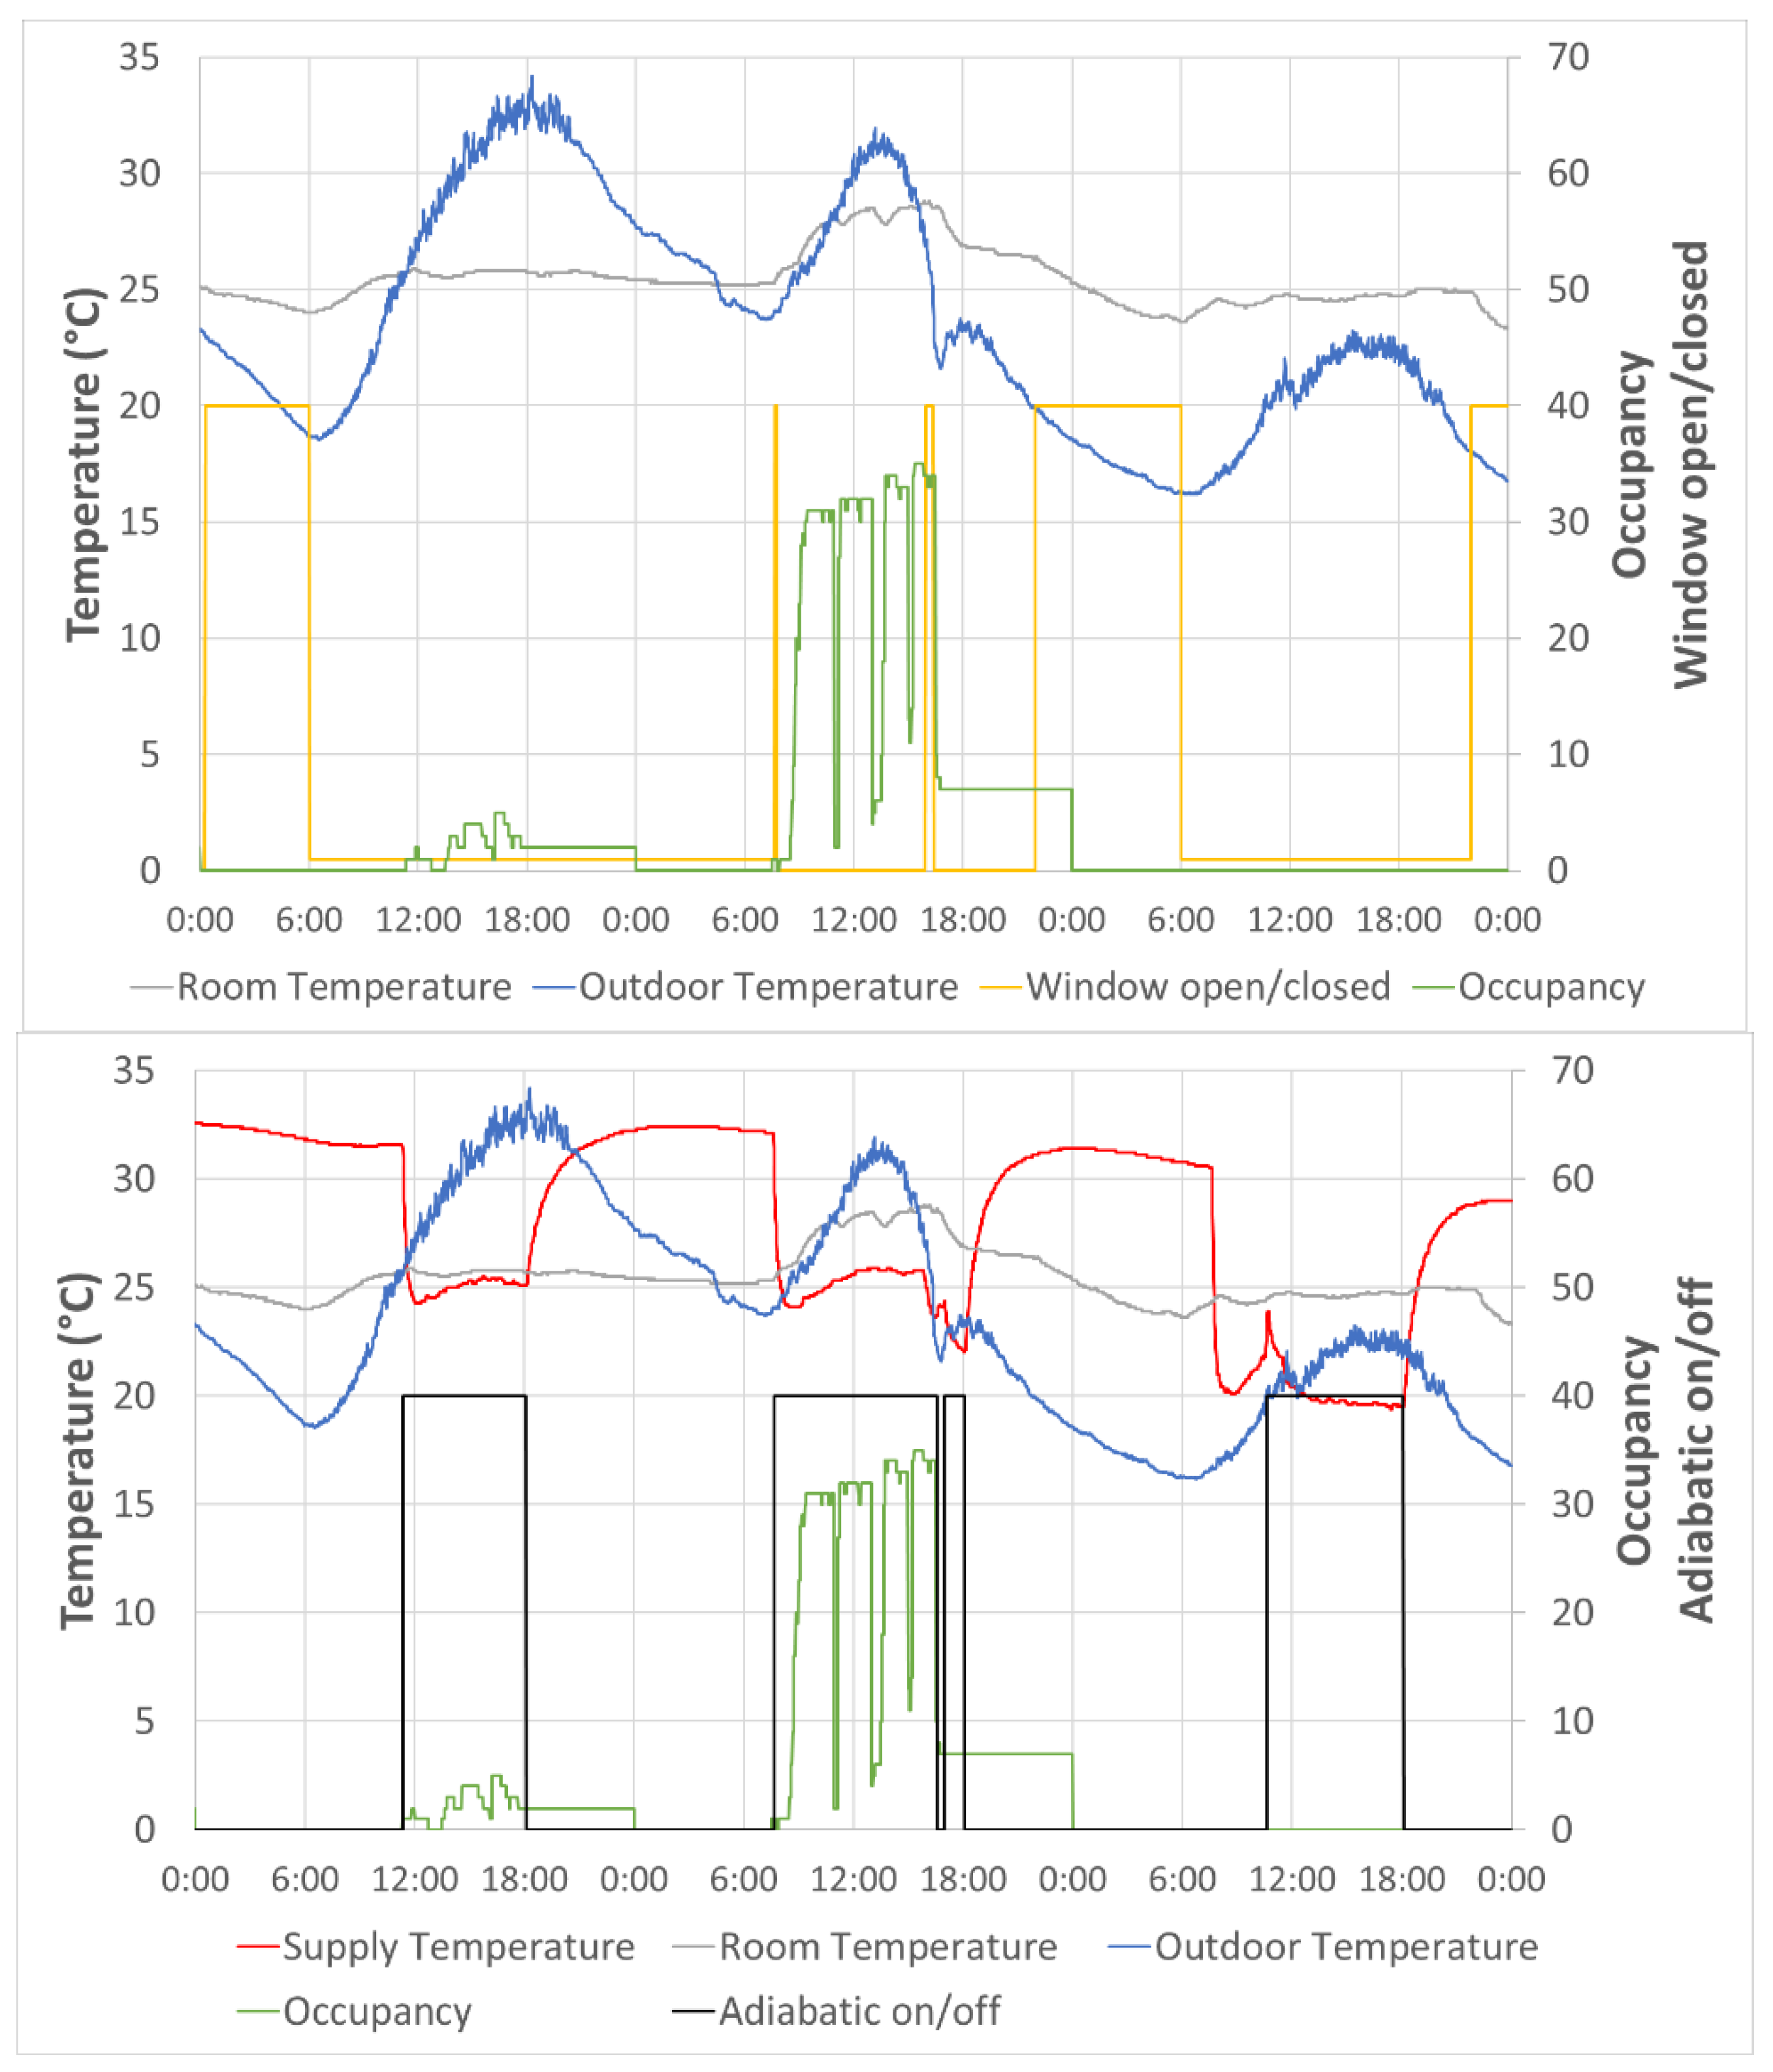
In addition, Figure 11 shows the operation of the windows for night ventilation respectively indirect evaporative cooling during extremely warm days in June 2017. In that period, IEC operates the whole day during operation and can lower the supply temperature significantly compared to the outdoor temperature. Natural night ventilation only operated very short time the second night in between two hot summer days because the requirement that the outdoor temperature has to more than 2 °C lower than the room temperature was not fulfilled. This finding confirms the findings of other studies (e.g., [11,33]) that night ventilation cannot guarantee good thermal comfort during the whole year and especially not during heat waves.
3.4. Thermal Comfort
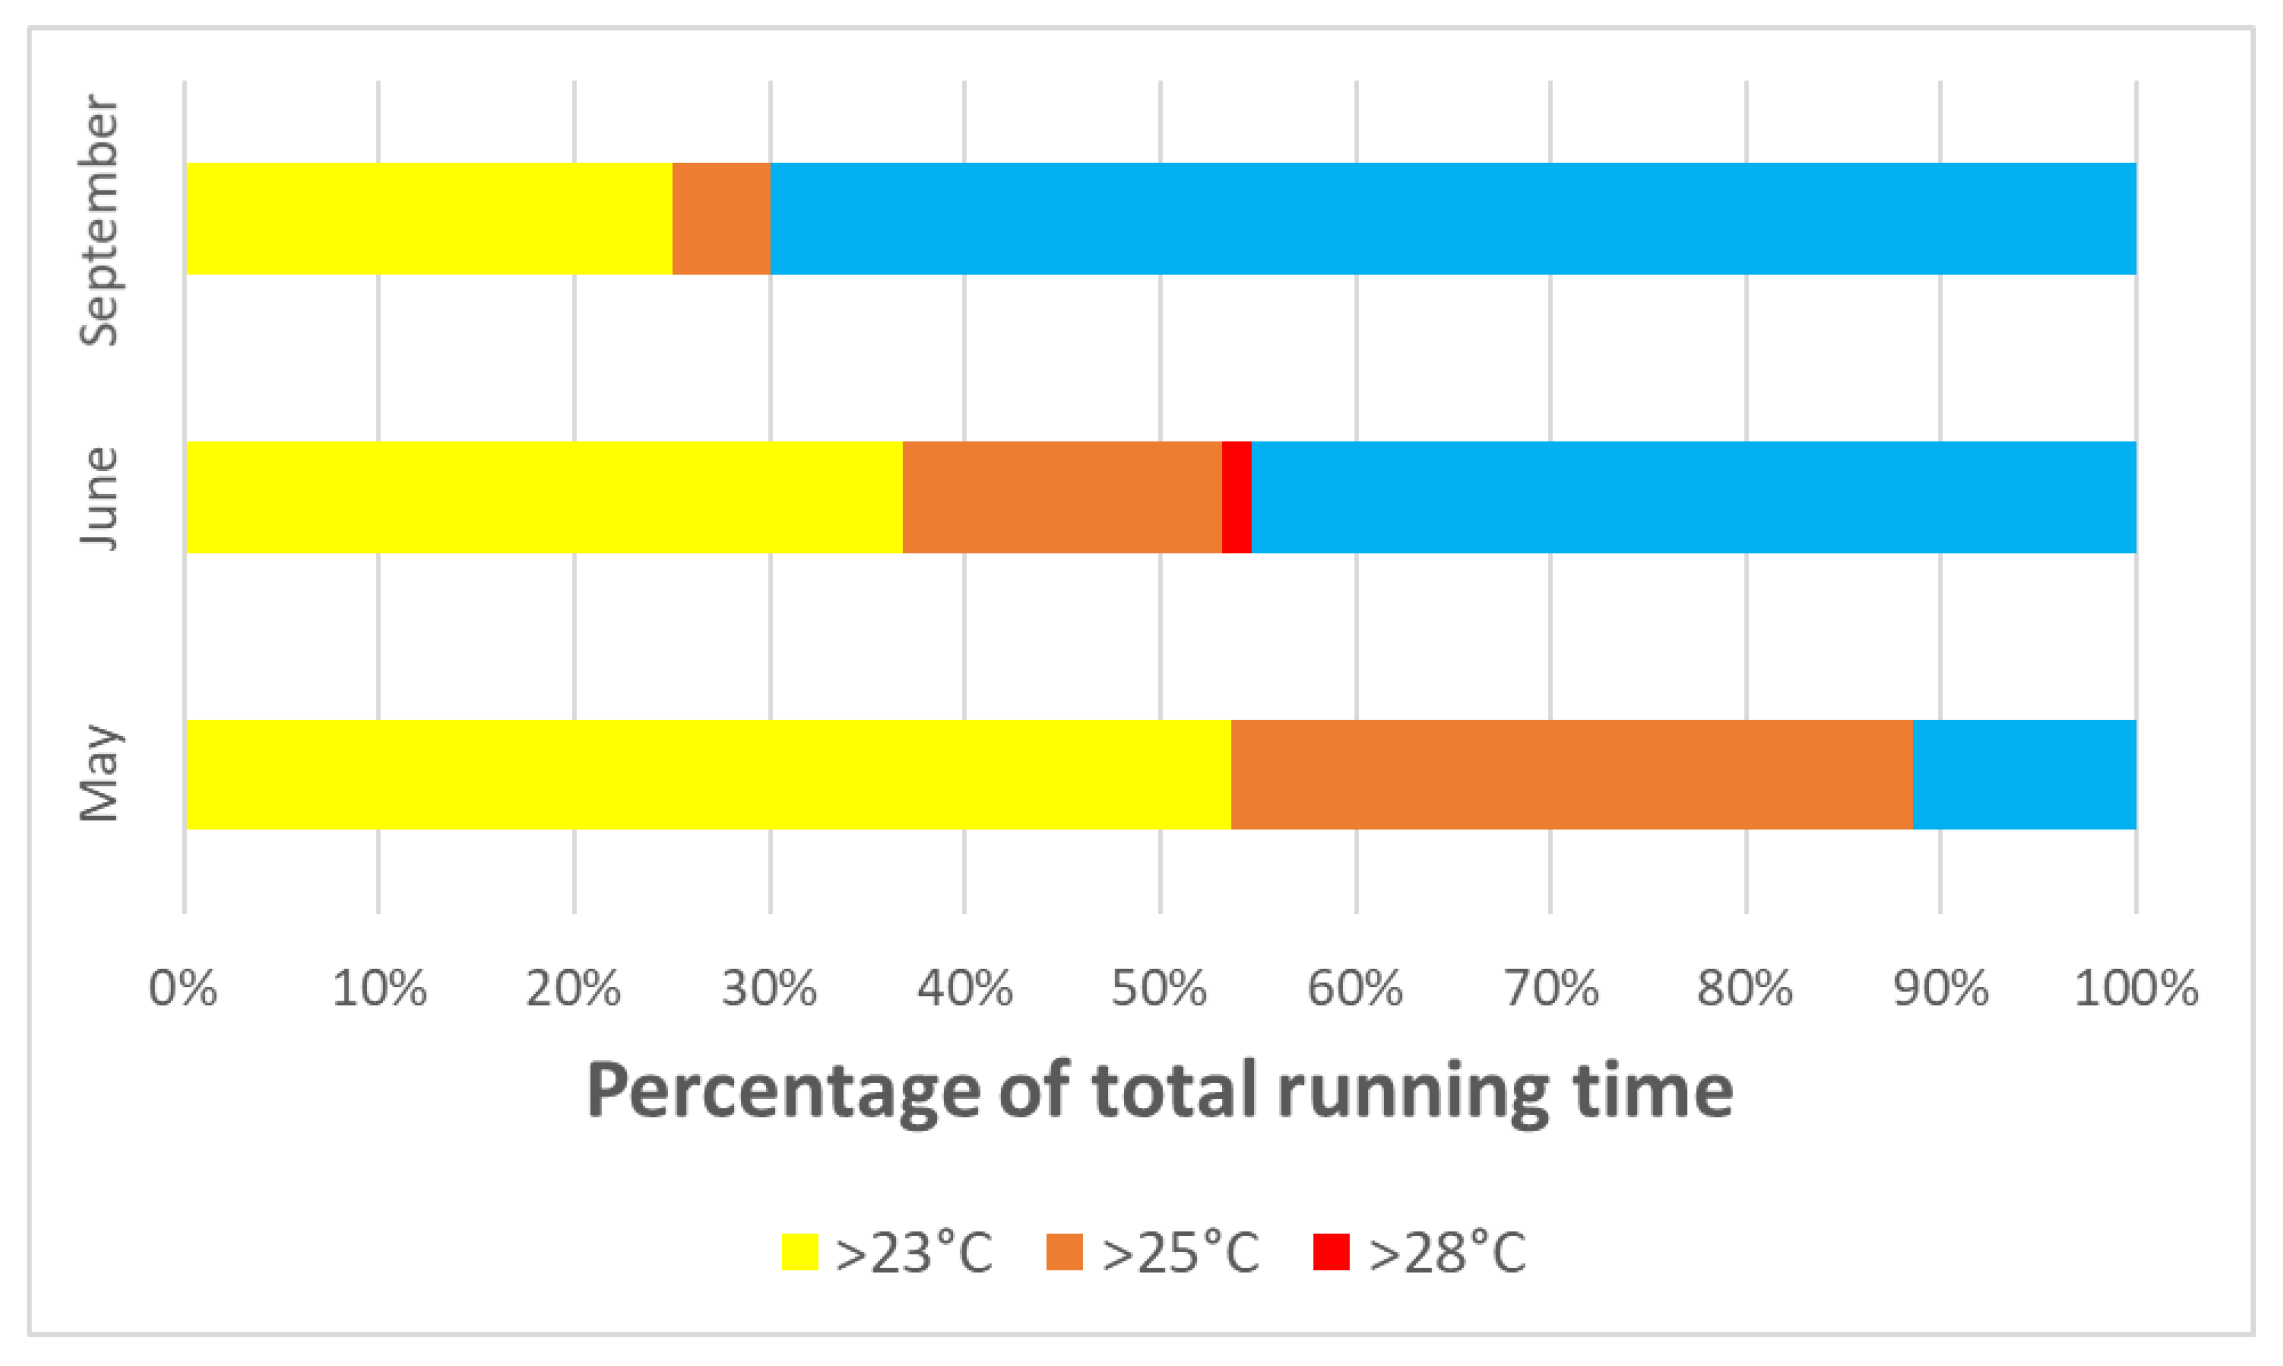
Figure 12 presents hourly indoor operative temperature in this lecture room. The percentage of hours of exceedance per month above 23 °C, 25 °C, and 28 °C are shown. Furthermore, the number of occupied hours of exceedance of a particular indoor temperature above a threshold value is commonly taken as an overheating performance indicator. In this lecture room, during operation of the AHU, 5.1% and 0.3% of the hours in 2017 exceeded 25 °C respectively 28 °C. This means good thermal comfort according to EN 15251 [24].
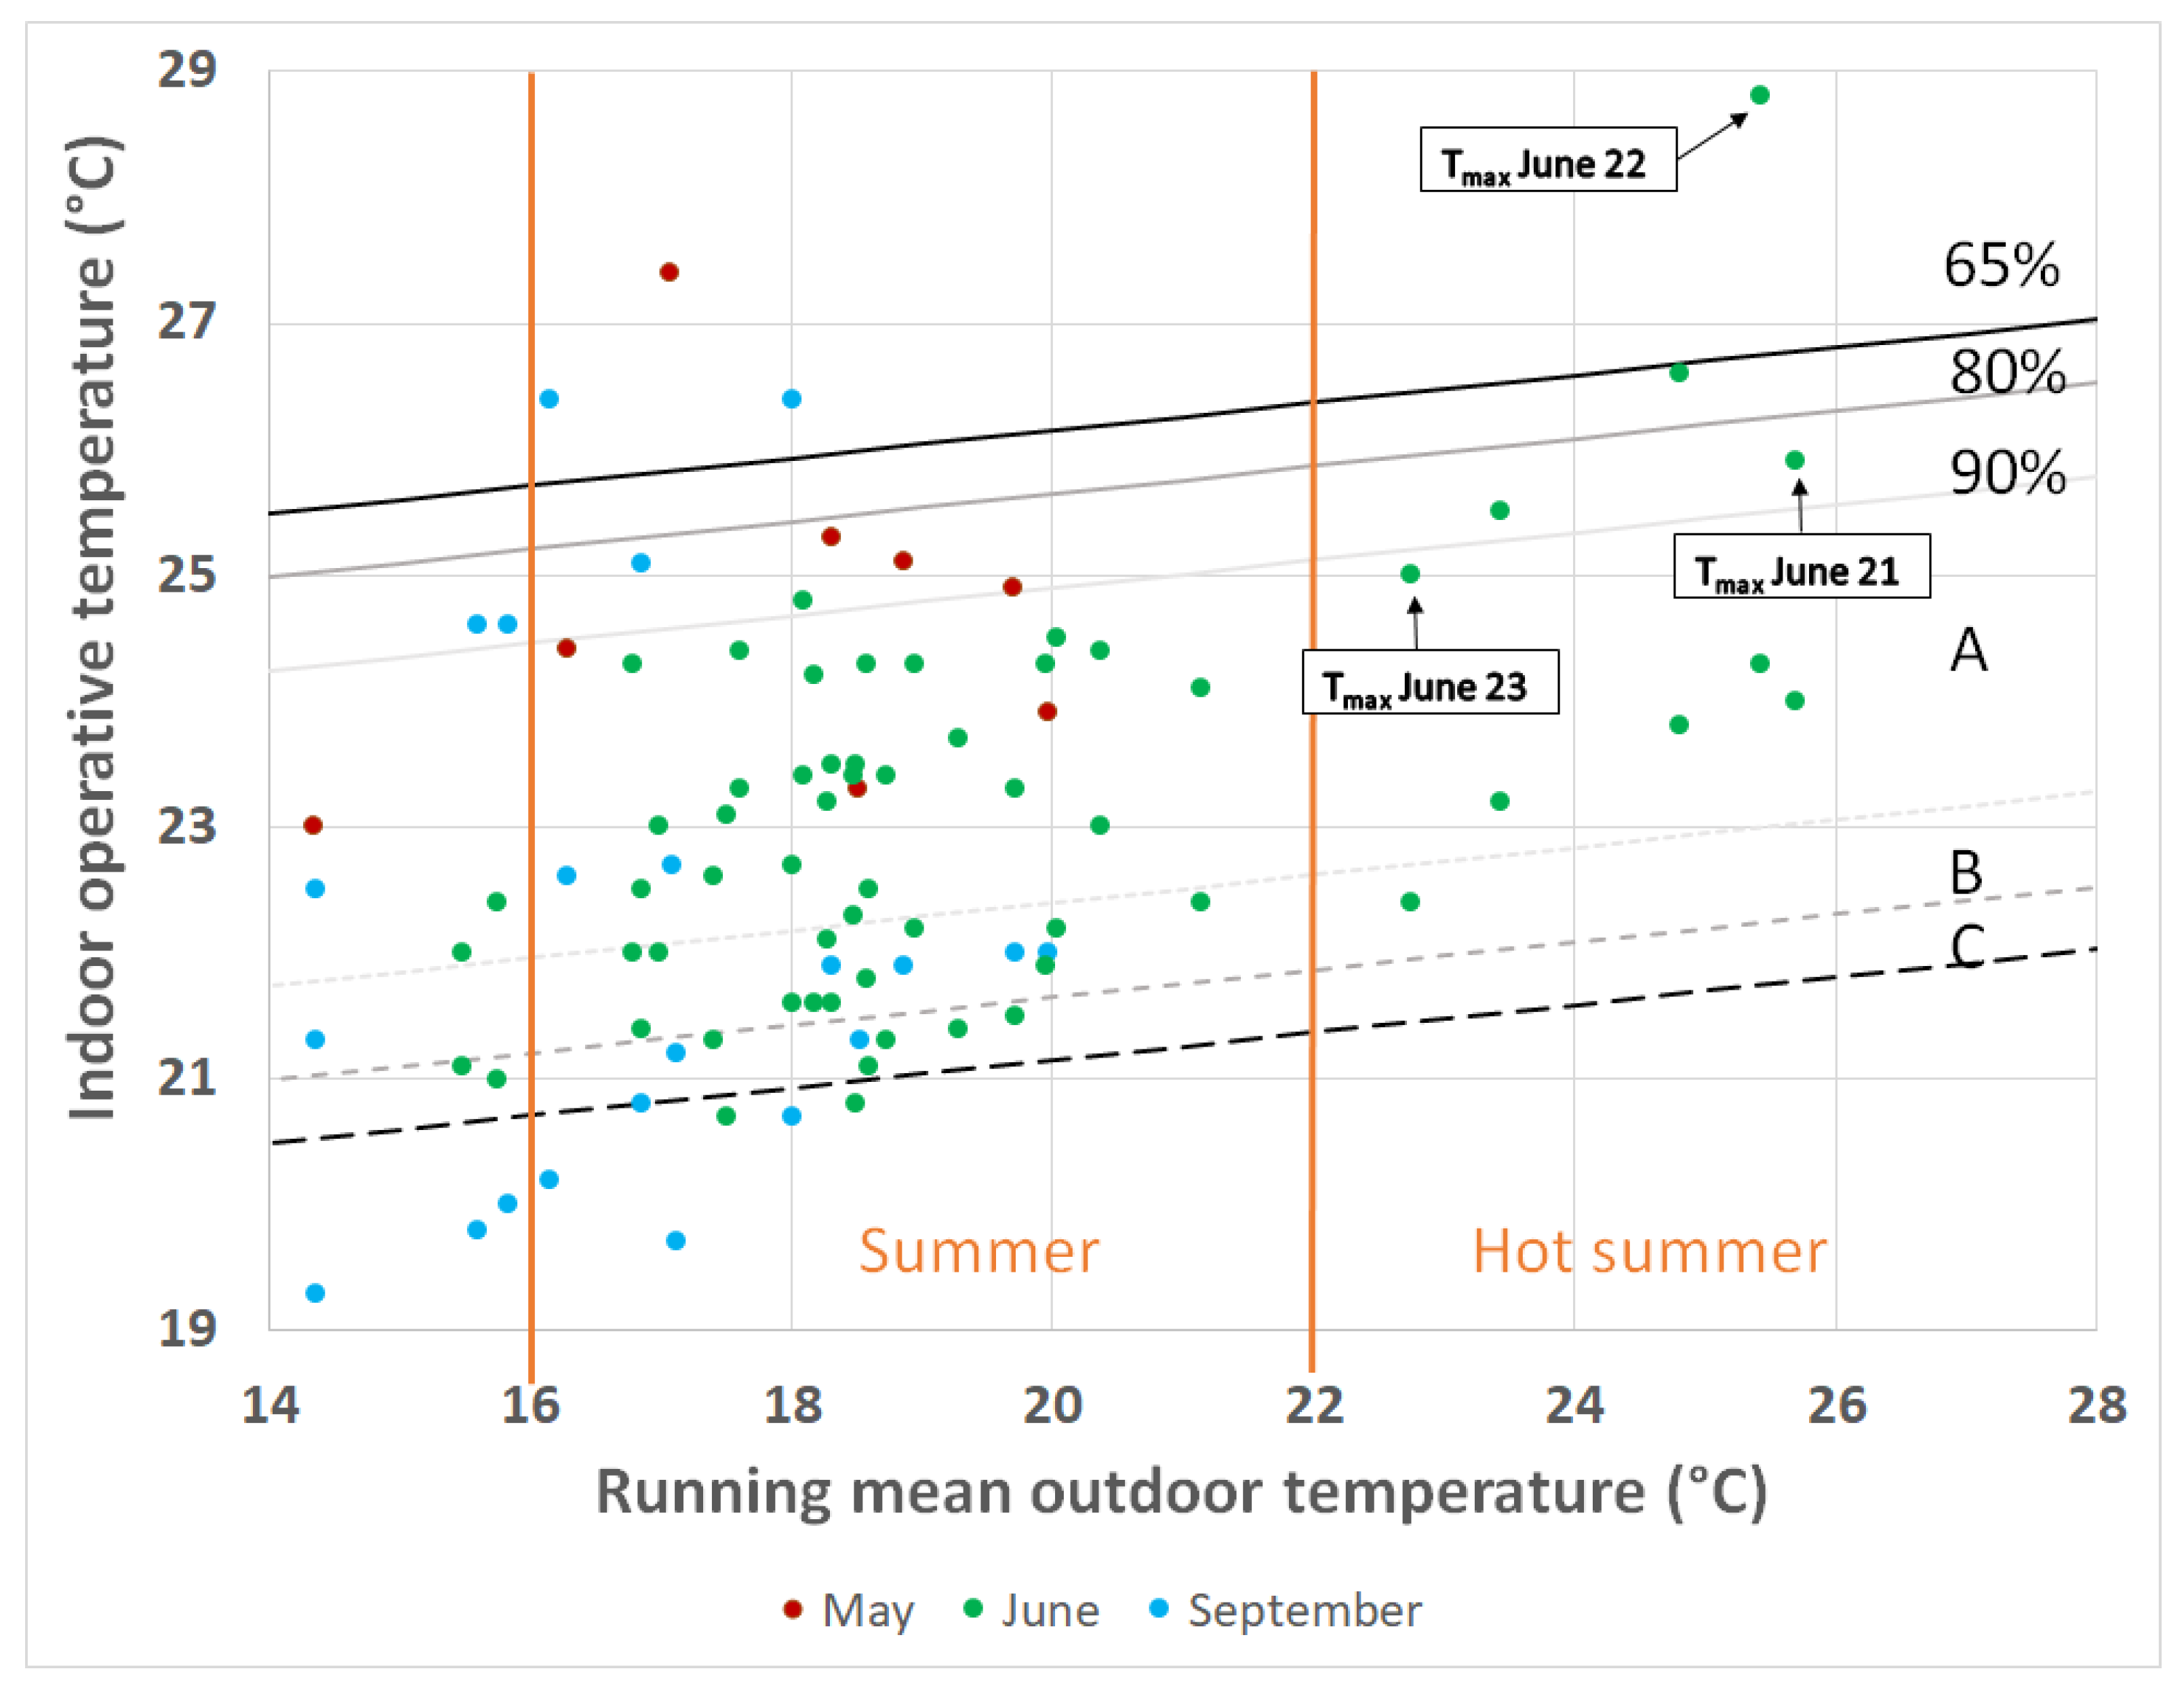
Thermal comfort in this lecture rooms is also evaluated as a function of the running mean outdoor temperature as defined by the Dutch adaptive temperature limits indicator [34] (see Figure 13). The maximum indoor temperatures during extremely warm days in June 2017, as discussed before, are indicated in Figure 13. This graph shows that summer comfort is generally good. Only in hot summer and/or periods with high occupancy, high indoor temperatures are monitored. In addition, very low temperatures are noticed in September in the morning.
4. Conclusions and Lessons Learned
The test lecture rooms of KU Leuven Ghent Technology Campus are one the demonstration cases of IEA EBC Annex 62: Ventilative Cooling. Two different principles of ventilative cooling are implemented in this building: (1) natural night ventilation, (2) AHU with indirect evaporative cooling (IEC). Thermal comfort in this nZEB school building and the performances of its ventilative cooling systems were evaluated.
Good thermal summer comfort was measured in the test lecture rooms at the Technology campus Ghent of KU Leuven (Belgium). Only during heat waves and/or periods with high occupancy rates, high indoor temperatures were monitored. Both nighttime ventilation and indirect evaporative cooling operate very well. IEC can lower the supply temperature by day significantly compared to the outdoor temperature. IEC is in use during more than half of the occupied hours in the cooling season due to high internal heat gains in the lecture rooms.
The ACR of the nighttime ventilation is rather low and, in case of cross ventilation, depends a lot on wind direction and velocity. The ACR in these lecture rooms can be increased and made more reliable and stable by adding mechanical exhaust. However, this measure will also increase the fan energy. The room air temperature profile showed that the air in the whole lecture room is cooled down by opening of the windows.
The extensive data monitoring system was of great value to detect malfunctions, to improve the control of the building systems and optimize the whole building performance. Monitoring showed e.g., that the windows for night ventilation opened and closed a lot at night during the first weeks. This was due to (1) poor translation of the signal of the rain sensor and (2) peaks in the wind velocity. These parameters are part of the control of the windows. This malfunctioning was discovered and solved by analyzing the monitoring results.
Furthermore, attention has to be paid to the users. Many different teachers give classes in these lecture rooms. Most of them are not used to automate blinds, ventilation and ventilative cooling. It is important to educate and inform the users about the operation of the automated system to come to a comfortable and energy efficient building.
Author Contributions
H.B. and A.V. designed the experiments; B.M. performed the experiments; B.M. and H.B. analyzed the data; H.B. and A.V. wrote the paper.
Funding
This research received no external funding.
Conflicts of Interest
The authors declare no conflicts of interest.
References
- EPBD. The Revised Energy Performance of Buildings Directive (EU) 2018/844. Available online: https://eur-lex.europa.eu/eli/dir/2018/844/oj (accessed on 29 June 2018).
- EPBD. Directive 2010/31/EU on the Energy Performance of Buildings (Recast). Available online: https://eur-lex.europa.eu/eli/dir/2010/31/oj (accessed on 29 June 2018).
- Heiselberg, P. Ventilative Cooling Design Guide, IEA EBC Annex 62; Aalborg University: Aalborg, Denmark, 2018. [Google Scholar]
- IEA EBC Annex 62 Ventilative Cooling|Venticool. Available online: http://venticool.eu/iea-ecbcs-annex-62-ventilative-cooling/ (accessed on 22 August 2018).
- Santamouris, M.; Kolokotsa, D. Passive cooling dissipation techniques for buildings and other structures: The state of the art. Energy Build. 2013, 57, 74–94. [Google Scholar] [CrossRef]
- Geros, V.; Santamouris, M.; Karatasou, S.; Tsangrassoulis, A.; Papanikolaou, N. On the cooling potential of night ventilation techniques in the urban environment. Energy Build. 2005, 37, 243–257. [Google Scholar] [CrossRef]
- Givoni, B. Passive and Low Energy Cooling of Buildings; Van Nostrand Reinhold: New York, NY, USA, 1994. [Google Scholar]
- Blondeau, P.; Sperandio, M.; Allard, F. Night ventilation for building cooling in summer. Sol. Energy 1997, 61, 327–335. [Google Scholar] [CrossRef]
- Pfafferott, J.; Herkel, S.; Jäschke, M. Design of passive cooling by night ventilation: Evaluation of a parametric model and building simulation with measurements. Energy Build. 2003, 35, 1129–1143. [Google Scholar] [CrossRef]
- Kubota, T.; Chyee, D.T.H.; Ahmad, S. The effects of night ventilation technique on indoor thermal environment for residential buildings in hot-humid climate of Malaysia. Energy Build. 2009, 41, 829–839. [Google Scholar] [CrossRef]
- Artmann, N.; Manz, H.; Heiselberg, P. Climatic potential for passive cooling of buildings by night-time ventilation in Europe. Appl. Energy 2007, 84, 187–201. [Google Scholar] [CrossRef]
- Kim, M.; Kim, J.; Kwon, O.; Choi, A.; Jeong, J. Energy conservation potential of an indirect and direct evaporative cooling assisted 100% outdoor air system. Build. Serv. Eng. Res. Technol. 2011, 32, 345–360. [Google Scholar] [CrossRef]
- Joudi, K.A.; Mehdi, S.M. Application of indirect evaporative cooling to variable domestic cooling load. Energy Convers. Manag. 2000, 41, 1931–1951. [Google Scholar] [CrossRef]
- Costelloe, B.; Finn, D. Thermal effectiveness characteristics of low approach indirect evaporative cooling systems in buildings. Energy Build. 2007, 39, 1235–1243. [Google Scholar] [CrossRef] [Green Version]
- Kolokotroni, M.; Heiselberg, P. Ventilative Cooling: State-of-the-Art Review; Aalborg University: Aalborg, Denmark, 2015. [Google Scholar]
- Williamson, T.; Erell, E. The Implications for Building Ventilation of the Spatial and Temporal Variability of Air Temperature in the Urban Canopy Layer. Int. J. Vent. 2008, 7, 23–35. [Google Scholar] [CrossRef]
- Kolokotroni, M.; Giannitsaris, I.; Watkins, R. The effect of the London urban heat island on building summer cooling demand and night ventilation strategies. Sol. Energy 2005, 80, 383–392. [Google Scholar] [CrossRef]
- Ghiaus, C.; Allard, F.; Santamouris, M.; Georgakis, C.; Nicol, F. Urban environment influence on natural ventilation potential. Build. Environ. 2006, 41, 395–406. [Google Scholar] [CrossRef]
- Artmann, N.; Gyalistras, D.; Manz, H.; Heiselberg, P. Impact of climate warming on passive night cooling potential. Build. Res. Inf. 2008, 36, 111–128. [Google Scholar] [CrossRef]
- O’Sullivan, P.; O’Donnovan, A. Ventilative Cooling Case Studies, IEA EBC Annex 62; Aalborg University: Aalborg, Denmark, 2018. [Google Scholar]
- EN ISO 13790. Energy Performance of Buildings—Calculation of Energy Use for Space Heating and Cooling; CEN: Brussels, Belgium, 2008. [Google Scholar]
- Breesch, H.; Wauman, B.; Klein, R.; Versele, A. Design of a new nZEB test school building. REHVA J. 2016, 53, 17–20. [Google Scholar]
- Flemish Government Decree of 7 December 2007—Decree Concerning Energy Performances in School Buildings 2007. Available online: http://www.ejustice.just.fgov.be/eli/decreet/2007/12/07/2008035085/staatsblad (accessed on 21 September 2018).
- EN 15251. Indoor Environmental Input Parameters for Design and Assessment of Energy Performance of Buildings Addressing Indoor Air Quality, Thermal Environment, Lighting and Acoustics; CEN: Brussels, Belgium, 2007. [Google Scholar]
- Irving, S.; Ford, B.; Etheridge, D. AM10 Natural Ventilation in Non Domestic Buildings; CIBSE: London, UK, 2005. [Google Scholar]
- Martin, A.; Fletcher, J. Night Cooling Strategies: Final Report 11621/4; BSRIA: Bracknell, UK, 1996. [Google Scholar]
- EN ISO 12569. Thermal Insulation in Buildings—Determination of Air Change in Buildings—Tracer Gas Dilution Method; CEN: Brussels, Belgium, 2001. [Google Scholar]
- Decrock, D.; Vanvalckenborgh, G. Evaluation of the Cooling Potential of Natural Night Ventilation in the Test Lecture Rooms (in Dutch); KU Leuven: Ghent, Belgium, 2017. [Google Scholar]
- Andriamamonjy, A.; Klein, R. A modular, open system for testing ventilation and cooling strategies in extremely low energy lecture rooms. In Proceedings of the 36th AIVC Conference, Madrid, Spain, 23–24 September 2015. [Google Scholar]
- Kottek, M.; Grieser, J.; Beck, C.; Rudolf, B.; Rubel, F. World Map of the Köppen-Geiger climate classification updated. Meteorol. Z. 2006, 15, 259–263. [Google Scholar] [CrossRef]
- 2017—KMI. Available online: https://www.meteo.be/meteo/view/nl/35424421-2017.html (accessed on 22 August 2018).
- Leenknegt, S. Numerical and Experimental Analysis of Passive Cooling through Night Ventilation; KU Leuven: Leuven, Belgium, 2013. [Google Scholar]
- Breesch, H.; Janssens, A. Performance evaluation of passive cooling in office buildings based on uncertainty and sensitivity analysis. Sol. Energy 2010, 84. [Google Scholar] [CrossRef]
- Van Der Linden, A.C.; Boerstra, A.C.; Raue, A.K.; Kurvers, S.R.; de Dear, R. Adaptive temperature limits: A new guideline in The Netherlands A new approach for the assesment of building performance with respect to thermal indoor climate. Energy Build. 2006, 38, 8–17. [Google Scholar] [CrossRef]
Figure 1.
Section (left) and floor plan (right) of the test lecture rooms on Katholieke Universiteit Leuven (KU Leuven) Technology campus Ghent.
Figure 1.
Section (left) and floor plan (right) of the test lecture rooms on Katholieke Universiteit Leuven (KU Leuven) Technology campus Ghent.

Figure 2.
Typical occupancy profile in the lecture rooms during one course week (Monday to Friday).

Figure 3.
Ventilation system (supply in green, return in brown) of the test lecture rooms on KU Leuven Technology campus Ghent.
Figure 3.
Ventilation system (supply in green, return in brown) of the test lecture rooms on KU Leuven Technology campus Ghent.

Figure 4.
Principle of natural night ventilation (left) and detail of motorized window (1.29 × 1.38 m², maximum opening angle of 8.8°) (right).
Figure 4.
Principle of natural night ventilation (left) and detail of motorized window (1.29 × 1.38 m², maximum opening angle of 8.8°) (right).

Figure 5.
Control strategy flowchart of AHU during occupancy (left) and natural night ventilation (right).
Figure 5.
Control strategy flowchart of AHU during occupancy (left) and natural night ventilation (right).

Figure 6.
Test setup tracer gas measurement (left) and air velocity measurement (position of the sensors) (right).
Figure 6.
Test setup tracer gas measurement (left) and air velocity measurement (position of the sensors) (right).

Figure 7.
Test setup air temperature measurements: horizontal distances (left) and heights (right) [28].
Figure 7.
Test setup air temperature measurements: horizontal distances (left) and heights (right) [28].

Figure 8.
Boxplots of air velocity for cross ventilation (wind velocity = 1.9 m/s, wind direction = WNW and temperature difference = 4.3 °C).
Figure 8.
Boxplots of air velocity for cross ventilation (wind velocity = 1.9 m/s, wind direction = WNW and temperature difference = 4.3 °C).

Figure 9.
Air temperature profile in the room at the start, after 10, 20, and 60 min for cross ventilation.
Figure 9.
Air temperature profile in the room at the start, after 10, 20, and 60 min for cross ventilation.

Figure 10.
Percentage of hours of operation of windows by night and indirect evaporative cooling (IEC) by day from May to September 2017.
Figure 10.
Percentage of hours of operation of windows by night and indirect evaporative cooling (IEC) by day from May to September 2017.

Figure 11.
Operation of windows (above) and IEC (below) during an extremely warm period (21–23 June 2017).
Figure 11.
Operation of windows (above) and IEC (below) during an extremely warm period (21–23 June 2017).

Figure 12.
Percentage of hours above threshold values for internal temperatures in the lecture room on the first floor (May–September 2017).
Figure 12.
Percentage of hours above threshold values for internal temperatures in the lecture room on the first floor (May–September 2017).

Figure 13.
Thermal comfort evaluation according to the adaptive temperature limits method [34].
Figure 13.
Thermal comfort evaluation according to the adaptive temperature limits method [34].


Table 1.
Building properties.
| Property | Value | Unit |
|---|---|---|
| U-value Wall | 0.15 | W/m2 K |
| U-value Roof | 0.14 | W/m2 K |
| U-value Floor | 0.15 | W/m2 K |
| U-value Window | 0.65 | W/m2 K |
| g-value Window | 0.52 | (-) |
| n50 1st floor | 0.41 | 1/h |
| n50 2nd floor | 0.29 | 1/h |
Table 2.
Measurements heights (plane 2) of test set up air temperatures.
| Position A2 | Position B2 | Position C2 | Position D2 | Position E2 |
|---|---|---|---|---|
| 0.8 m | 0.8 m | 0.5 m | 0.4 m | 0.4 m |
| 1.9 m | 1.9 m | 0.8 m | 0.5 m | 0.6 m |
| 2.1 m | 2.1 m | 1.3 m | 0.7 m | 0.7 m |
| 2.2 m | 2.2 m | 1.9 m | 1.3 m | 1.9 m |
| 2.3 m | 2.3 m | 2.3 m | 2.3 m | 2.3 m |
Table 3.
Properties of the sensors.
| Parameter | Type Sensor | Accuracy |
|---|---|---|
| Air temperature | Omega PT100 | ±0.10 °C |
| Air velocity | TSI 8475 | 3% of reading and 1% measurement range (0.05–2.50 m/s) |
| Room temperature | SE CSTHR PT1000 | ±0.1 °C |
| Supply temperature | SE CSTHK HX | ±0.4 °C |
| Occupancy | Acurity Crosscan Camera | ±5% |
| Outdoor temperature | Vaisala HMS82 | ±0.3 °C at 20 °C |
| Wind velocity | Ultrasonic 2D Anemometer | ±0.1 m/s (0–5 m/s) |
| Wind direction | Ultrasonic 2D Anemometer | ±1° |
Table 4.
Measured air changes rates (ACR) with tracer gas decay during spring 2017.
| Ventilation Mode | ACR (h-1) | Wind Velocity (m/s) | Wind Direction | Ti − Te (°C) |
|---|---|---|---|---|
| Cross ventilation | 4.18 ± 0.42 | 1.9 | WNW | 4.3 |
| Cross ventilation | 3.76 ± 0.38 | 2.1 | ESE | 1.6 |
| Cross ventilation | 3.04 ± 0.30 | 2.2 | ESE | 2.4 |
| Single sided | 2.05 ± 0.21 | 2.3 | SSW | No data |
| Single sided | 2.00 ± 0.20 | 2.68 | S | No data |
| Single sided | 1.17 ± 0.12 | 1.45 | SSW | 5.1 |
| Single sided | 1.56 ± 0.16 | 1.78 | S | 8.6 |
Table 5.
Local weather conditions during test of room air temperature profile (plane 2).
| Ventilation Mode | Wind Velocity (m/s) | Wind Direction | ΔT (°C) |
|---|---|---|---|
| Cross ventilation | 0.78 | SW | 8.0 |
© 2018 by the authors. Licensee MDPI, Basel, Switzerland. This article is an open access article distributed under the terms and conditions of the Creative Commons Attribution (CC BY) license (http://creativecommons.org/licenses/by/4.0/).
Share and Cite
MDPI and ACS Style
Breesch, H.; Merema, B.; Versele, A. Ventilative Cooling in a School Building: Evaluation of the Measured Performances. Fluids 2018, 3, 68. https://doi.org/10.3390/fluids3040068
AMA Style
Breesch H, Merema B, Versele A. Ventilative Cooling in a School Building: Evaluation of the Measured Performances. Fluids. 2018; 3(4):68. https://doi.org/10.3390/fluids3040068
Chicago/Turabian StyleBreesch, Hilde, Bart Merema, and Alexis Versele. 2018. "Ventilative Cooling in a School Building: Evaluation of the Measured Performances" Fluids 3, no. 4: 68. https://doi.org/10.3390/fluids3040068