Article

Evaluation of Turmeric Powder Adulterated with Metanil Yellow Using FT-Raman and FT-IR Spectroscopy

United States Department of Agriculture/Agricultural Research Service, Environmental Microbial and Food Safety Laboratory, Bldg. 303, Beltsville Agricultural Research Center East, 10300 Baltimore Ave., Beltsville, MD 20705-2350, USA
*
Author to whom correspondence should be addressed.
Foods 2016, 5(2), 36; https://doi.org/10.3390/foods5020036
Submission received: 14 April 2016 / Revised: 6 May 2016 / Accepted: 11 May 2016 / Published: 17 May 2016
(This article belongs to the Special Issue Microbial, Chemical and Physical Contamination of Food Products)

Abstract

:
Turmeric powder (Curcuma longa L.) is valued both for its medicinal properties and for its popular culinary use, such as being a component in curry powder. Due to its high demand in international trade, turmeric powder has been subject to economically driven, hazardous chemical adulteration. This study utilized Fourier Transform-Raman (FT-Raman) and Fourier Transform-Infra Red (FT-IR) spectroscopy as separate but complementary methods for detecting metanil yellow adulteration of turmeric powder. Sample mixtures of turmeric powder and metanil yellow were prepared at concentrations of 30%, 25%, 20%, 15%, 10%, 5%, 1%, and 0.01% (w/w). FT-Raman and FT-IR spectra were acquired for these mixture samples as well as for pure samples of turmeric powder and metanil yellow. Spectral analysis showed that the FT-IR method in this study could detect the metanil yellow at the 5% concentration, while the FT-Raman method appeared to be more sensitive and could detect the metanil yellow at the 1% concentration. Relationships between metanil yellow spectral peak intensities and metanil yellow concentration were established using representative peaks at FT-Raman 1406 cm−1 and FT-IR 1140 cm−1 with correlation coefficients of 0.93 and 0.95, respectively.

1. Introduction

Turmeric (Curuma long L.) is a herbaceous root commonly used for food seasoning as well as for medicinal purposes. Turmeric has a long history of medicinal use in Asian countries [1,2] and is used in root, oil, and powder forms. Its medicinal value is mainly due to its content of curcumin (diferuloyol methane) [3,4,5,6,7], with attributed medical properties including anti-inflammatory [8,9,10,11,12], anticarcinogenic [13,14,15,16], antioxidant [17,18,19], and wound-healing [20,21,22] effects. Curcumin has also been reported to have promise for development of therapies for Alzheimer’s disease [23].
The curcumin content in turmeric varies. Studies have shown that factors such as nutrient and acidity content in soil [24,25], fertilizer, soil type and cultivar [26,27,28] affects the curcumin content in turmeric. Reported curcumin concentrations in turmeric range from 0.3% to 8.6% [3,8,29,30,31]. Curcumin is isolated from turmeric for medicinal and cosmetic purposes. Although whole, dried, or fresh turmeric are typically free of contamination, turmeric powder can be adulterated with different chemical powders used as substitutes for curcumin [32]. Studies have reported the mixing of Curcuma zedoaria, a wild relative of turmeric, into turmeric powder due to its close resemblance with turmeric [32,33]. Similarly, metanil yellow (C18H14N3NaO3S) is a toxic azo dye that has been added to turmeric powder to mimic the appearance of curcumin [34,35,36] when the actual curcumin content is low [37]. Toxicologically, metanil yellow is classified as a CII category substance by the Joint FAO/WHO Expert committee on Food Additives, and it implies that it is a compound for which virtually no information on long-term toxicity is available [38]. Toxicity is categorized into four classes according to the toxicity of chemicals, where Category I chemicals are the most toxic and poisonous, and Category IV chemicals are least toxic and poisonous. Studies on rats show that long term consumption of metanil yellow causes neurotoxicity [39], hepatocellular carcinoma [40,41,42], tumor development [43], deleterious effect on gastric mucin [44], and lymphocytic leukemia [45].
A variety of conventional methods have been effectively used for detection of metanil yellow in food stuffs. Ion-pair liquid chromatography detected with 99% linearity the presence of azo dyes, such as metanil yellow, in the range of 0.05 ppm to 10 ppm in food [46]. Similarly other methods such as high performance liquid chromatography-electrospray ionization tandem mass spectrometry [47], high performance capillary electrophoresis [48], and micellar chromatographic method [49] have been used for detection of metanil yellow and other dyes in food and beverages. Despite their high accuracies and satisfactory detection limits, these conventional methods are limited in practicality due to their operational complexity and sample-destructive nature. In contrast, the relative simplicity of optical methods has driven their increasing use for safety and quality detection of foods and food products [50,51,52,53,54]. This study made use of FT-Raman and FT-IR spectroscopy for evaluation of metanil yellow in turmeric powder. Although FT-IR and FT-Raman spectroscopy have not been previously reported for detection of metanil yellow adulteration in food, these spectroscopy methods have been widely used for detection of other food adulterants. Lohumi et al. (2014) used FT-NIR and FT-IR spectroscopy to detect starch adulteration in onion powder [55]. Similarly, studies have reported analysis of starch-adulterated garlic powder [56] and detection of palm oil in extra virgin olive oil [57] using FT-IR spectroscopy, detection of hazelnut oil in olive oil using FT-Raman and FT-MIR spectroscopy [58], and adulteration of virgin olive oil using FT-Raman spectroscopy [59]. FT-IR and FT-Raman spectroscopy are also used for detection of chemical contamination in spices. Schulz et al. (2003) applied FT-IR and FT-Raman spectroscopy for detection of carcinogenic compounds (methyleugenol and estragole) in basil [60]. Similarly, FT-IR was applied for detection and quantification of food colorants such as Tartrazine, Sunset yellow, Szorubine, Quinoline-yellow, Allura red, and Sudan II in saffron [61].
This study presents a comprehensive study of FT-Raman and FT-IR spectra of metanil yellow, turmeric powder, and turmeric adulterated with metanil yellow at different concentrations. The primary objectives of this study are to:
1
Study the FT-Raman and FT-IR spectra of metanil yellow and turmeric powder
2
Identify the FT-Raman and FT-IR spectral fingerprint of metanil yellow to distinguish it from the spectral signal of turmeric powder
3
Evaluate turmeric adulterated with metanil yellow at different concentrations and determine the minimum concentrations detectable by the FT-Raman and FT-IR methods
4
Quantitatively evaluate the concentration of metanil yellow mixed with turmeric using FT-Raman and FT-IR methods

2. Materials and Methods

2.1. Sample Preparation

Metanil yellow (70% dye, Aldrich, Carson City, NV, USA), organic turmeric powder (Norway, IA, USA), and de-ionized water (Thermo Scientific, St. Louis, MO, USA) were used to prepare sample mixtures. The high solubility of metanil yellow in water was used to obtain nicely mixed samples by first adding 0.5 g of de-ionized water at room temperature to 0.01 g of metanil yellow, followed by 3 min of vortex mixing. An appropriate amount of turmeric powder was then added to the metanil yellow to achieve the targeted sample concentration. Samples were prepared in this way for eight concentrations of metanil yellow: 30%, 25%, 20%, 15%, 10%, 5%, 1%, and 0.01% (w/w). Three replicates of each concentration were prepared for FT-Raman analysis, and three replicates were similarly prepared for FT-IR analysis.

2.2. FT-Raman and FT-IR Spectral Acquisition

A Fourier Transform spectroscopy (Thermo Scientific, Madison, WI, USA) that consisted of FT-IR module (Nicolet 6700, Thermo Scientific, Madison, WI, USA) and FT-Raman module (NXR-FT Raman module, Thermo Scientific, Madison, WI, USA) was utilized for collection of spectral data from samples. Each spectroscopy was designed with a separate operation chamber. The FT-IR module consisted of a triglycine sulfate (DTGS) detector with KBr beam splitter for collection of sample spectra in the spectral range of 650 cm−1 to 4000 cm−1. The attenuated total reflection (ATR) technique was utilized for FT-IR spectral collection. A small amount of the sample was placed on the Germanium crystal of the ATR device pressurized by pointed tip to ensure uniformity in surface area of contact between the Germanium crystal and sample. A background spectra was first acquired with the empty Germanium crystal prior to spectral collection of the sample. The crystal plate and pointed pressure tip of the ATR device was cleaned thoroughly using cotton soaked with methanol after spectral acquisition of each sample. An average of 32 successive scans at 4 cm−1 intervals were acquired and saved (“comma separated values” format) for further analysis. The FT-IR spectral signal of three replicate samples were acquired at each concentration level.
FT-Raman spectroscopy utilized a Germanium detector and CaF2 beam splitter for spectral acquisition in the spectral range of 100 cm−1 to 3700 cm−1. The Germanium detector was cooled by liquid nitrogen to reduce dark current noise and enhance signal-to-noise ratio. A Nuclear Magnetic Resonance (NMR) tube sampling accessory was used to hold the NMR tube in the FT-Raman compartment. Samples were put in NMR tubes (5 mm diameter, 50 mm length) to fill approximately one fourth of each tube’s length. Each sample tube was clamped in the NMR sampling accessory inside the FT-Raman compartment one at a time. The accessory was designed to move in horizontal and vertical directions using two stepper motors. Horizontal movement ensured the alignment of the NMR tube with the laser, and vertical movement was used to achieve the best laser focus. A laser source of 1064 nm (laser power 1 W) was used for sample excitation. An average of 32 successive scans at 8 cm−1 intervals were acquired and saved (“comma separated values” format) for further analysis. The FT-Raman spectral signal of three replicate samples were acquired at each concentration level.
The overall system was controlled by OMNIC software provided by Thermo Scientific (Madison, WI, USA). Prior to collection of the spectral signal, OMNIC software was adjusted to operate in FT-IR module (for FT-IR spectral collection) and FT-Raman module (for FT-Raman spectral collection).

2.3. Processing of Spectra Signal

Pre-treatments for the FT-Raman and FT-IR spectra were performed using Matlab (MathWorks, Natick, MA, USA). The raw FT-Raman spectral data were first treated for noise removal by applying a Savitzky-Golay filter, fitting a 5th order polynomial with 3-point interval by linear least squares method. Polynomial curve fitting was then used for removal of the fluorescence background, which is important even though the FT-Raman technique utilizing 1064 cm−1 is reportedly affected less by fluorescence background compared to other Raman techniques. Although other methods are available, the polynomial fitting method was utilized in this study because of its simplicity [50,51]: a polynomial curve is generated to fit the background fluorescence signal, and this curve is subtracted from the Raman spectra to remove the fluorescence background from the Raman spectral data. A 6th order polynomial curve was generated to fit the background fluorescence signal in the range of 850 cm−1 to 2800 cm−1. Since all the spectral peaks of metanil yellow, turmeric, and mixture samples were inside this spectral range, all further analysis used only the corrected FT-Raman data from this region.
Similarly, the raw FT-IR spectra were first pre-treated for noise removal by a Savitzky-Golay filter using a 5th order polynomial with 3-point interval to fit the spectral signal by linear least squares method. Multiplicative Scatter Correction (MSC) was utilized to remove the baseline drift from the FT-IR spectra of mixture samples.
Two spectral analysis methods were compared for evaluating metanil yellow concentration in the mixture samples. First, the spectral peak intensity of metanil yellow after data-pretreatment was correlated with the actual concentration of metanil yellow in the mixture sample. The second approach was a band ratio method, whereby a ratio was obtained of the intensity at a peak representative of metanil yellow against the intensity of a neutral spectral band, and the ratio was correlated with metanil yellow concentration in the sample mixtures. The neutral band was selected as being one not exhibiting any sharp peaks due to metanil yellow, turmeric powder, or any other chemical constituents. Each of these two methods was applied using the FT-Raman spectral measurements and, separately, using the FT-IR spectral measurements.

3. Results and Discussion

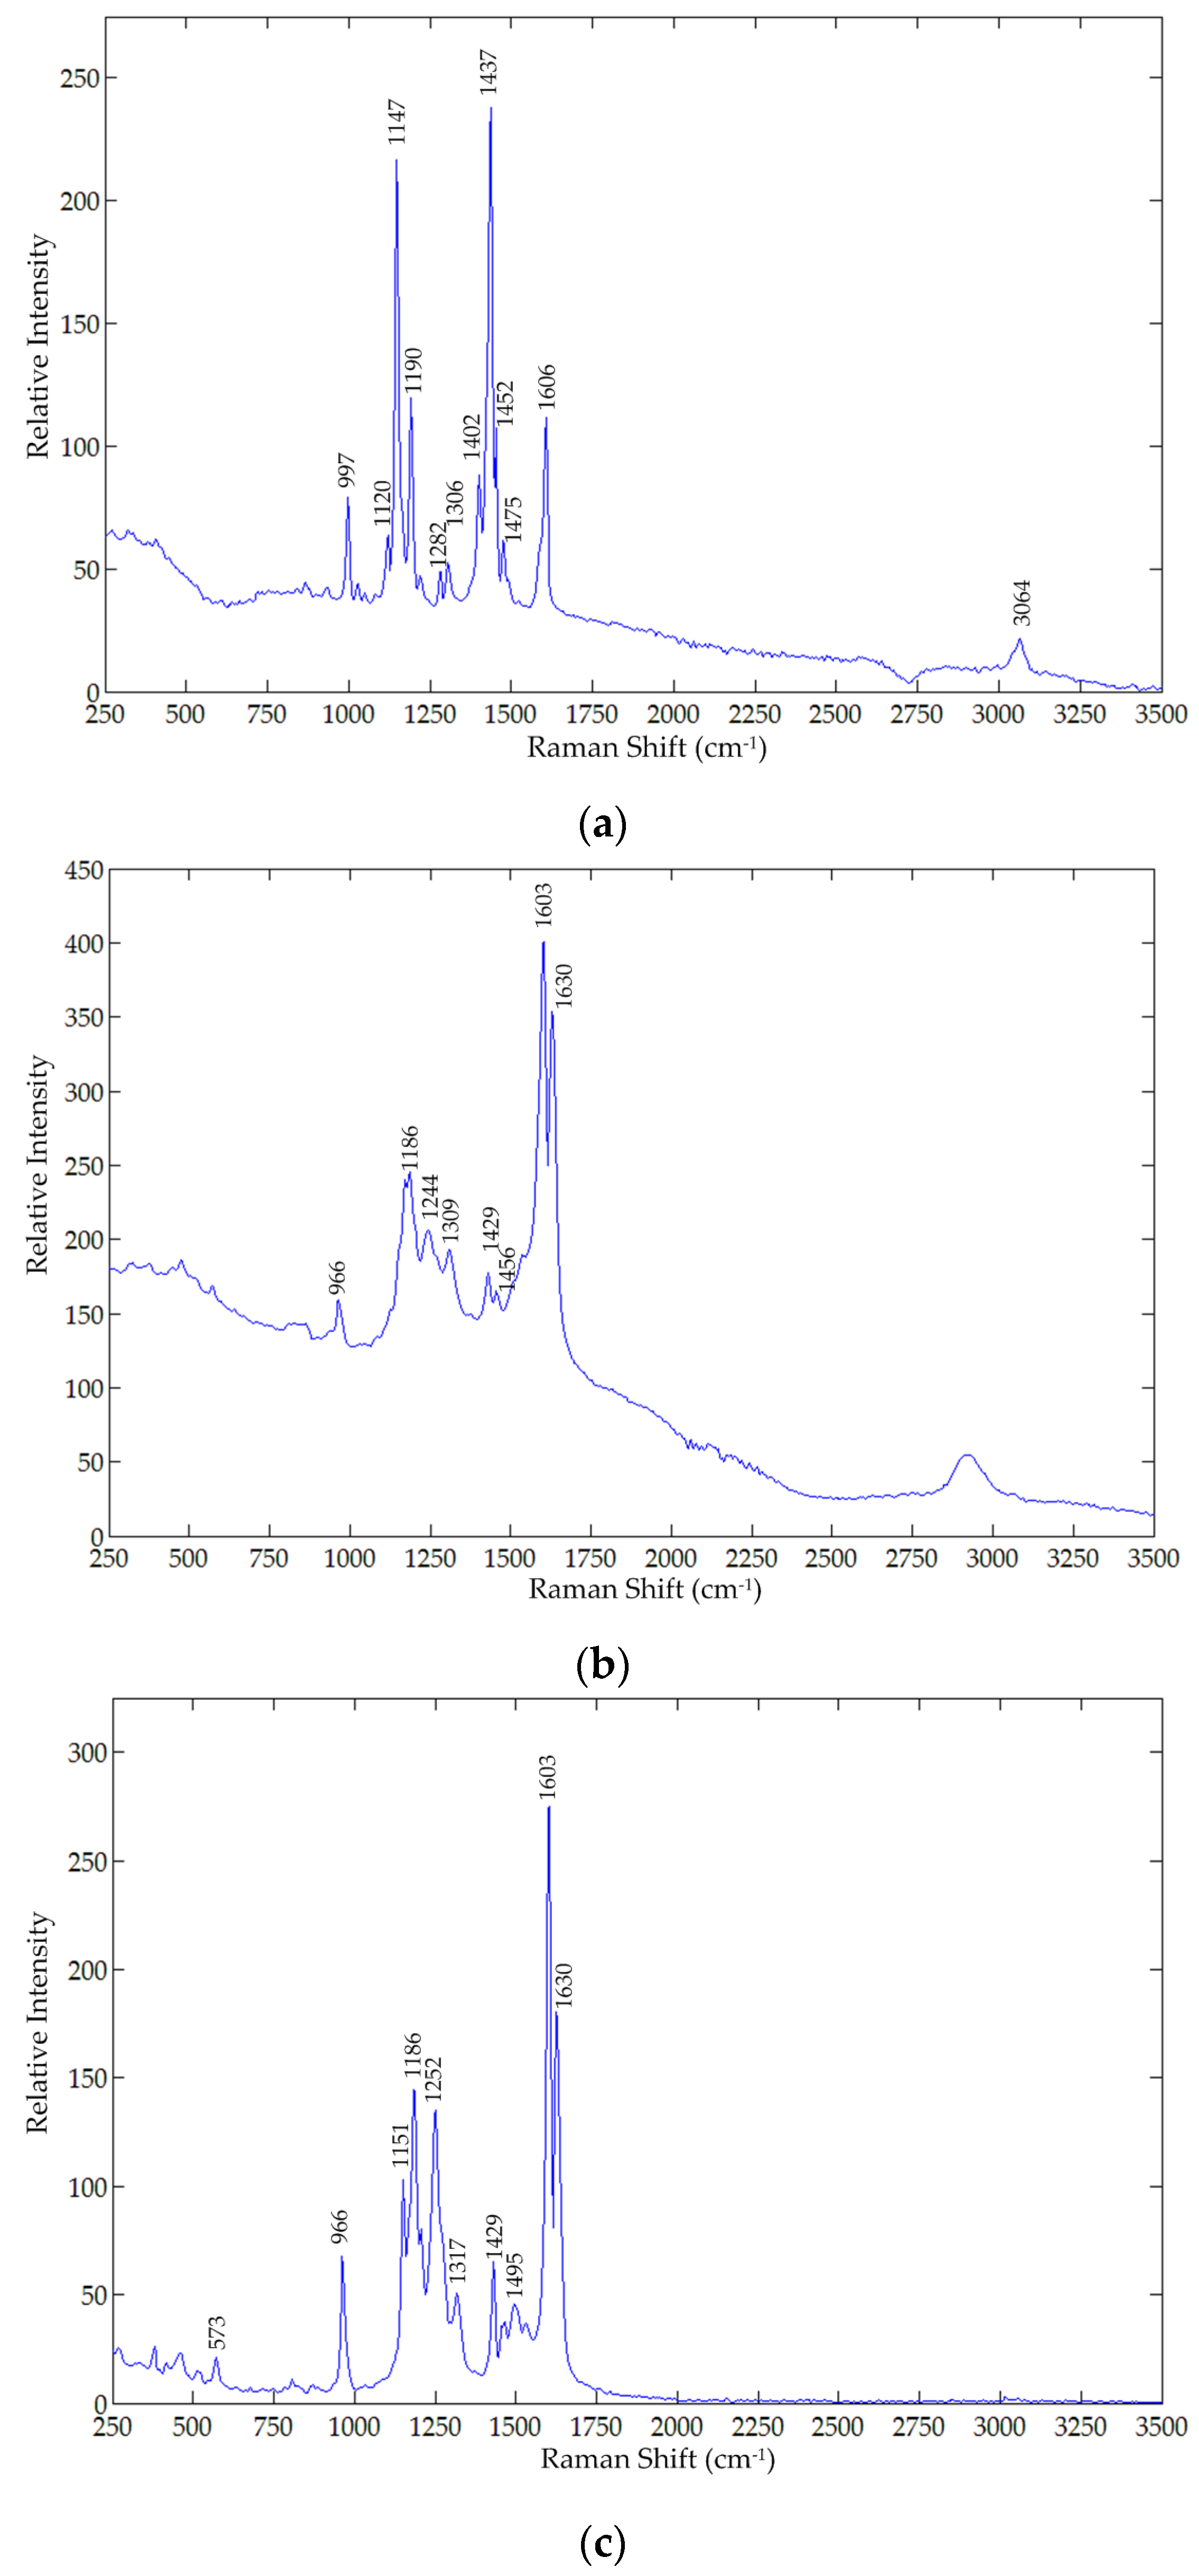
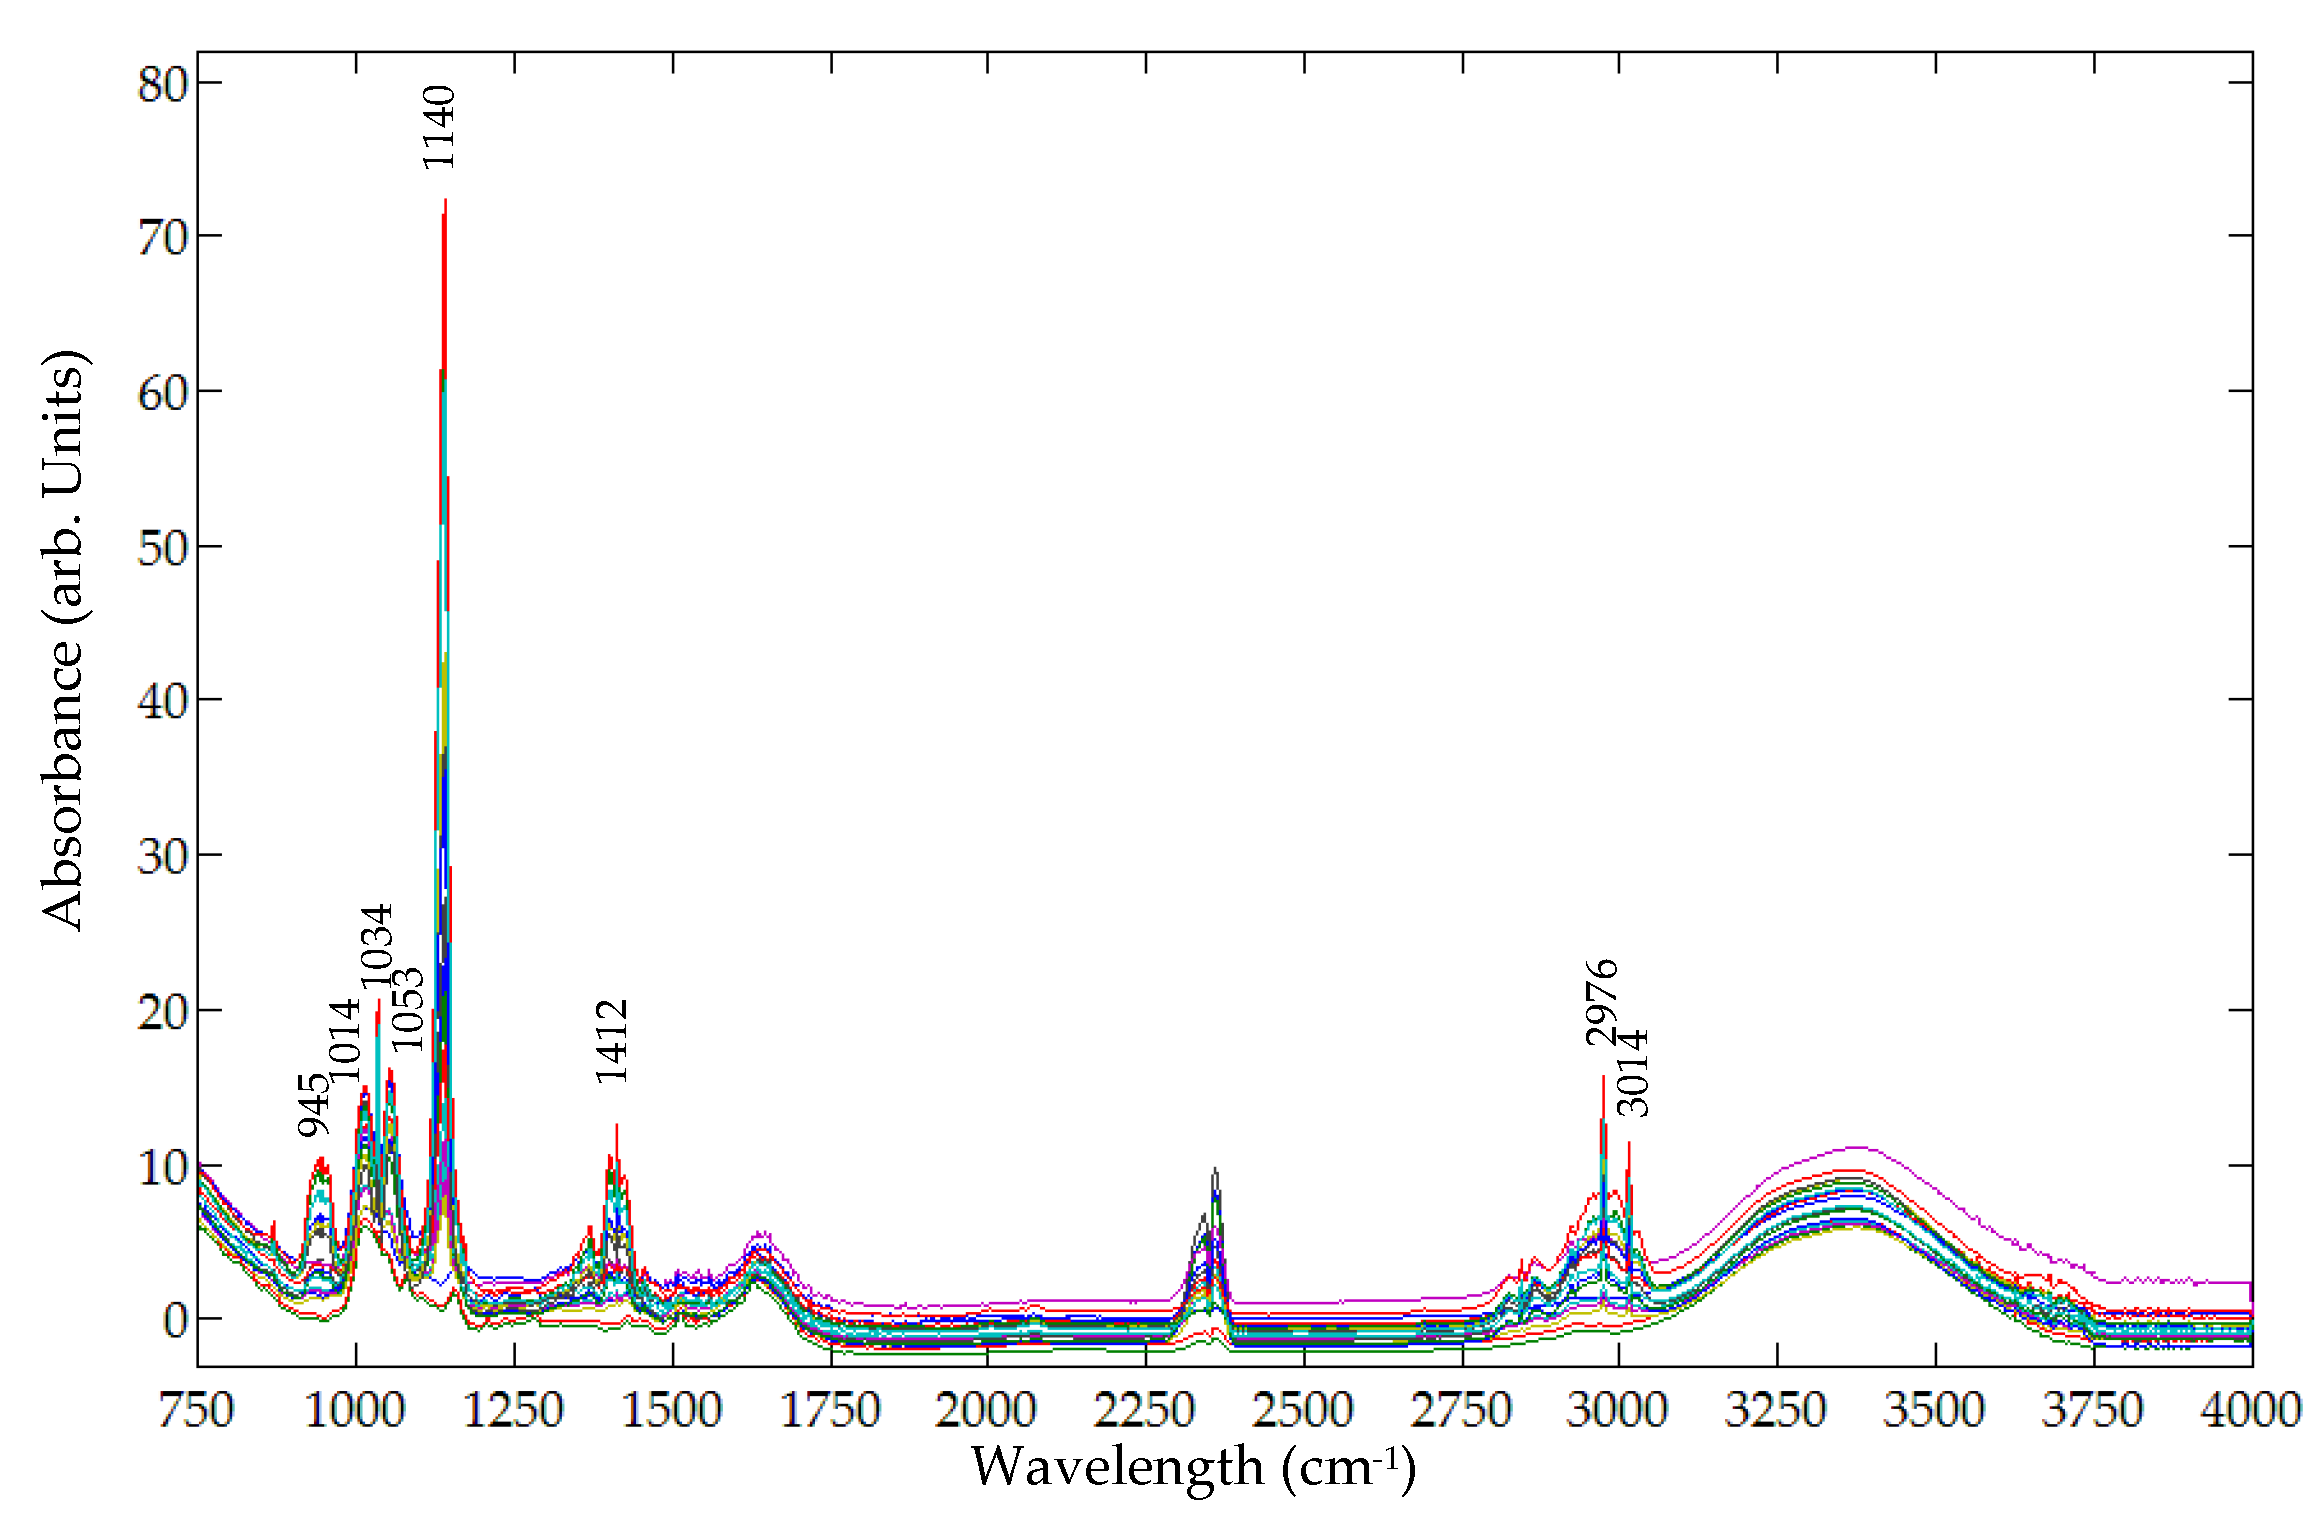
3.1. Spectral Interpretation

The comparable degree of extended conjugation in both metanil yellow and curcumin/turmeric is responsible for the similar yellow color present in each chemical substance. However, the chemical composition in each is very different. Metanil yellow contains three nitrogen atoms (N=N and –NH) and one sulfate (SO3) group; it contains no methylene (CH2) or methyl (CH3) groups, and no oxygens except for those on the sulfate site (Figure 1a). Curcumin/Turmeric contains six oxygen atoms, two of which are in carbonyl groups (C=O), no nitrogen or sulfur atoms, two methyl groups, and one single methylene site at the center of the molecule between the two carbonyl sites (Figure 1b). Either one of the ketones in the O=C–CH2–C=O site can also be in the enol form, O=C–CH–C–OH, which extends the degree of conjugation but does not change the chemical composition of curcumin/turmeric.
Both chemicals contain substituted aromatic compounds. In metanil yellow, the three aromatic rings (I, II, and III) are not identical: I is monosubstituted; II is di (1,4-)-substituted, and III is di (1,3-)-substituted. In Curcumin/Turmeric, the two rings (A and B) are structurally identical and are tri (1,3,4-)-substituted.
Because the chemical structure of the two compounds are so dissimilar, the vibrational modes specific to precisely their discretely different chemical structures will be different. Figure 2 and Figure 3 show the FT-Raman and FT-IR spectra, respectively, of metanil yellow, turmeric, and curcumin powder (Aldrich, Carson City, NV, USA). Table 1 presents the vibrational modes of metanil yellow and turmeric in the Infrared (IR) and Raman frequency range. The assignment of structural components to vibrational frequencies is critical in this study because structurally different components can coincidentally have vibrational modes that appear in close or even the same frequency ranges. Experimental evidence is required to assign the spectral regions and their relative intensities, and to determine which intensities co-vary with concentration. The experimental spectral regions most unique to each component, and preferably with the highest relative intensity, can be used to fingerprint the presence of metanil yellow in curcumin/turmeric. Because of the abundance of spectral information collected in this experiment, further analysis of the data already collected can be used as confirmatory evidence in the fingerprint data.
In metanil yellow, sharp vibrational modes specific to the N=N site (IR 1597 cm−1, 1140 cm−1; Raman 1606 cm−1, 1452 cm−1, 1437 cm−1, and 1147 cm−1) [62,63,64] are most definitive to its identification and quantitation. Additionally, peaks due to ring breathing in ring II (IR and Raman 997 cm−1), and sulfate (IR 1043 cm−1) [65] are confirmatory of metanil yellow presence. Because metanil yellow lacks any CH3 or CH2 sites, peaks near 3000 cm−1 (IR 3014 cm−1 and 2976 cm−1) would be CH sites, but assigning the peaks to any specific CH site would be far from definitive. The site that results in the unique CH bending peak (IR 1188 cm−1 and Raman 1190 cm−1), however, most likely correlates to one of these CH stretching frequencies. Peaks above 3100 cm−1 are too broad, and often moisture dependent as well, to be analytically useful. The CH bending vibrational modes on aromatic sites below 950 cm−1 will be different between metanil yellow and curcumin/turmeric and could be confirmative evidence of its presence.
In turmeric, vibrational modes between 1740 cm−1 and 1628 cm−1 cannot be present in metanil yellow because the carbonyl group and conjugated carbonyl groups are only present in turmeric components. An example where structurally dissimilar sites can have similar vibrational modes is methyl deformation (IR 1187 cm−1, Raman 1186 cm−1) versus C–H bending in metanil yellow (IR 1188 cm−1, Raman 1190 cm−1). Two other vibrational modes fully discrete from metanil yellow are from aromatic (Ar) bending at Ar–O and Ar–O (CH3) (Raman 1534 cm−1) and CH bending at O=C–CH2–C=O (IR 1379 cm−1 and Raman 1374 cm−1).
Curcumin is a chemically purified fraction of turmeric. Vibrational spectroscopy can identify a structural difference between curcumin and turmeric based upon which vibrational modes are no longer present in the purified fraction. Curcumin has only one vibrational mode for C=O (IR 1628 cm−1, Raman 1630 cm−1) whereas turmeric also has two other C=O peaks (IR 1739 cm−1 and 1681 cm−1). The changes in the Ar–CH vibrational modes between the two below 950 cm−1 in both IR and Raman spectra suggest turmeric may contain structural analogs of curcumin as well. The Ar–OH and Ar–O–CH3 site at 1,3,4- on both rings A and B could be a 1,2,4- at A or B, or the methyl group could be at the 3- site instead of, or even in addition to, the 4- site. Additional chemical and spectroscopic analyses would be required to confirm the identity of the other components in turmeric. Quantitative analysis is required to determine the mole ratio of components. Although the chemical structure of curcumin can be determined precisely, the ratio of curcumin to that of other components in turmeric depends on variables including botanical and horticultural factors [3,8,24,25,26,27,28,29,30,31].

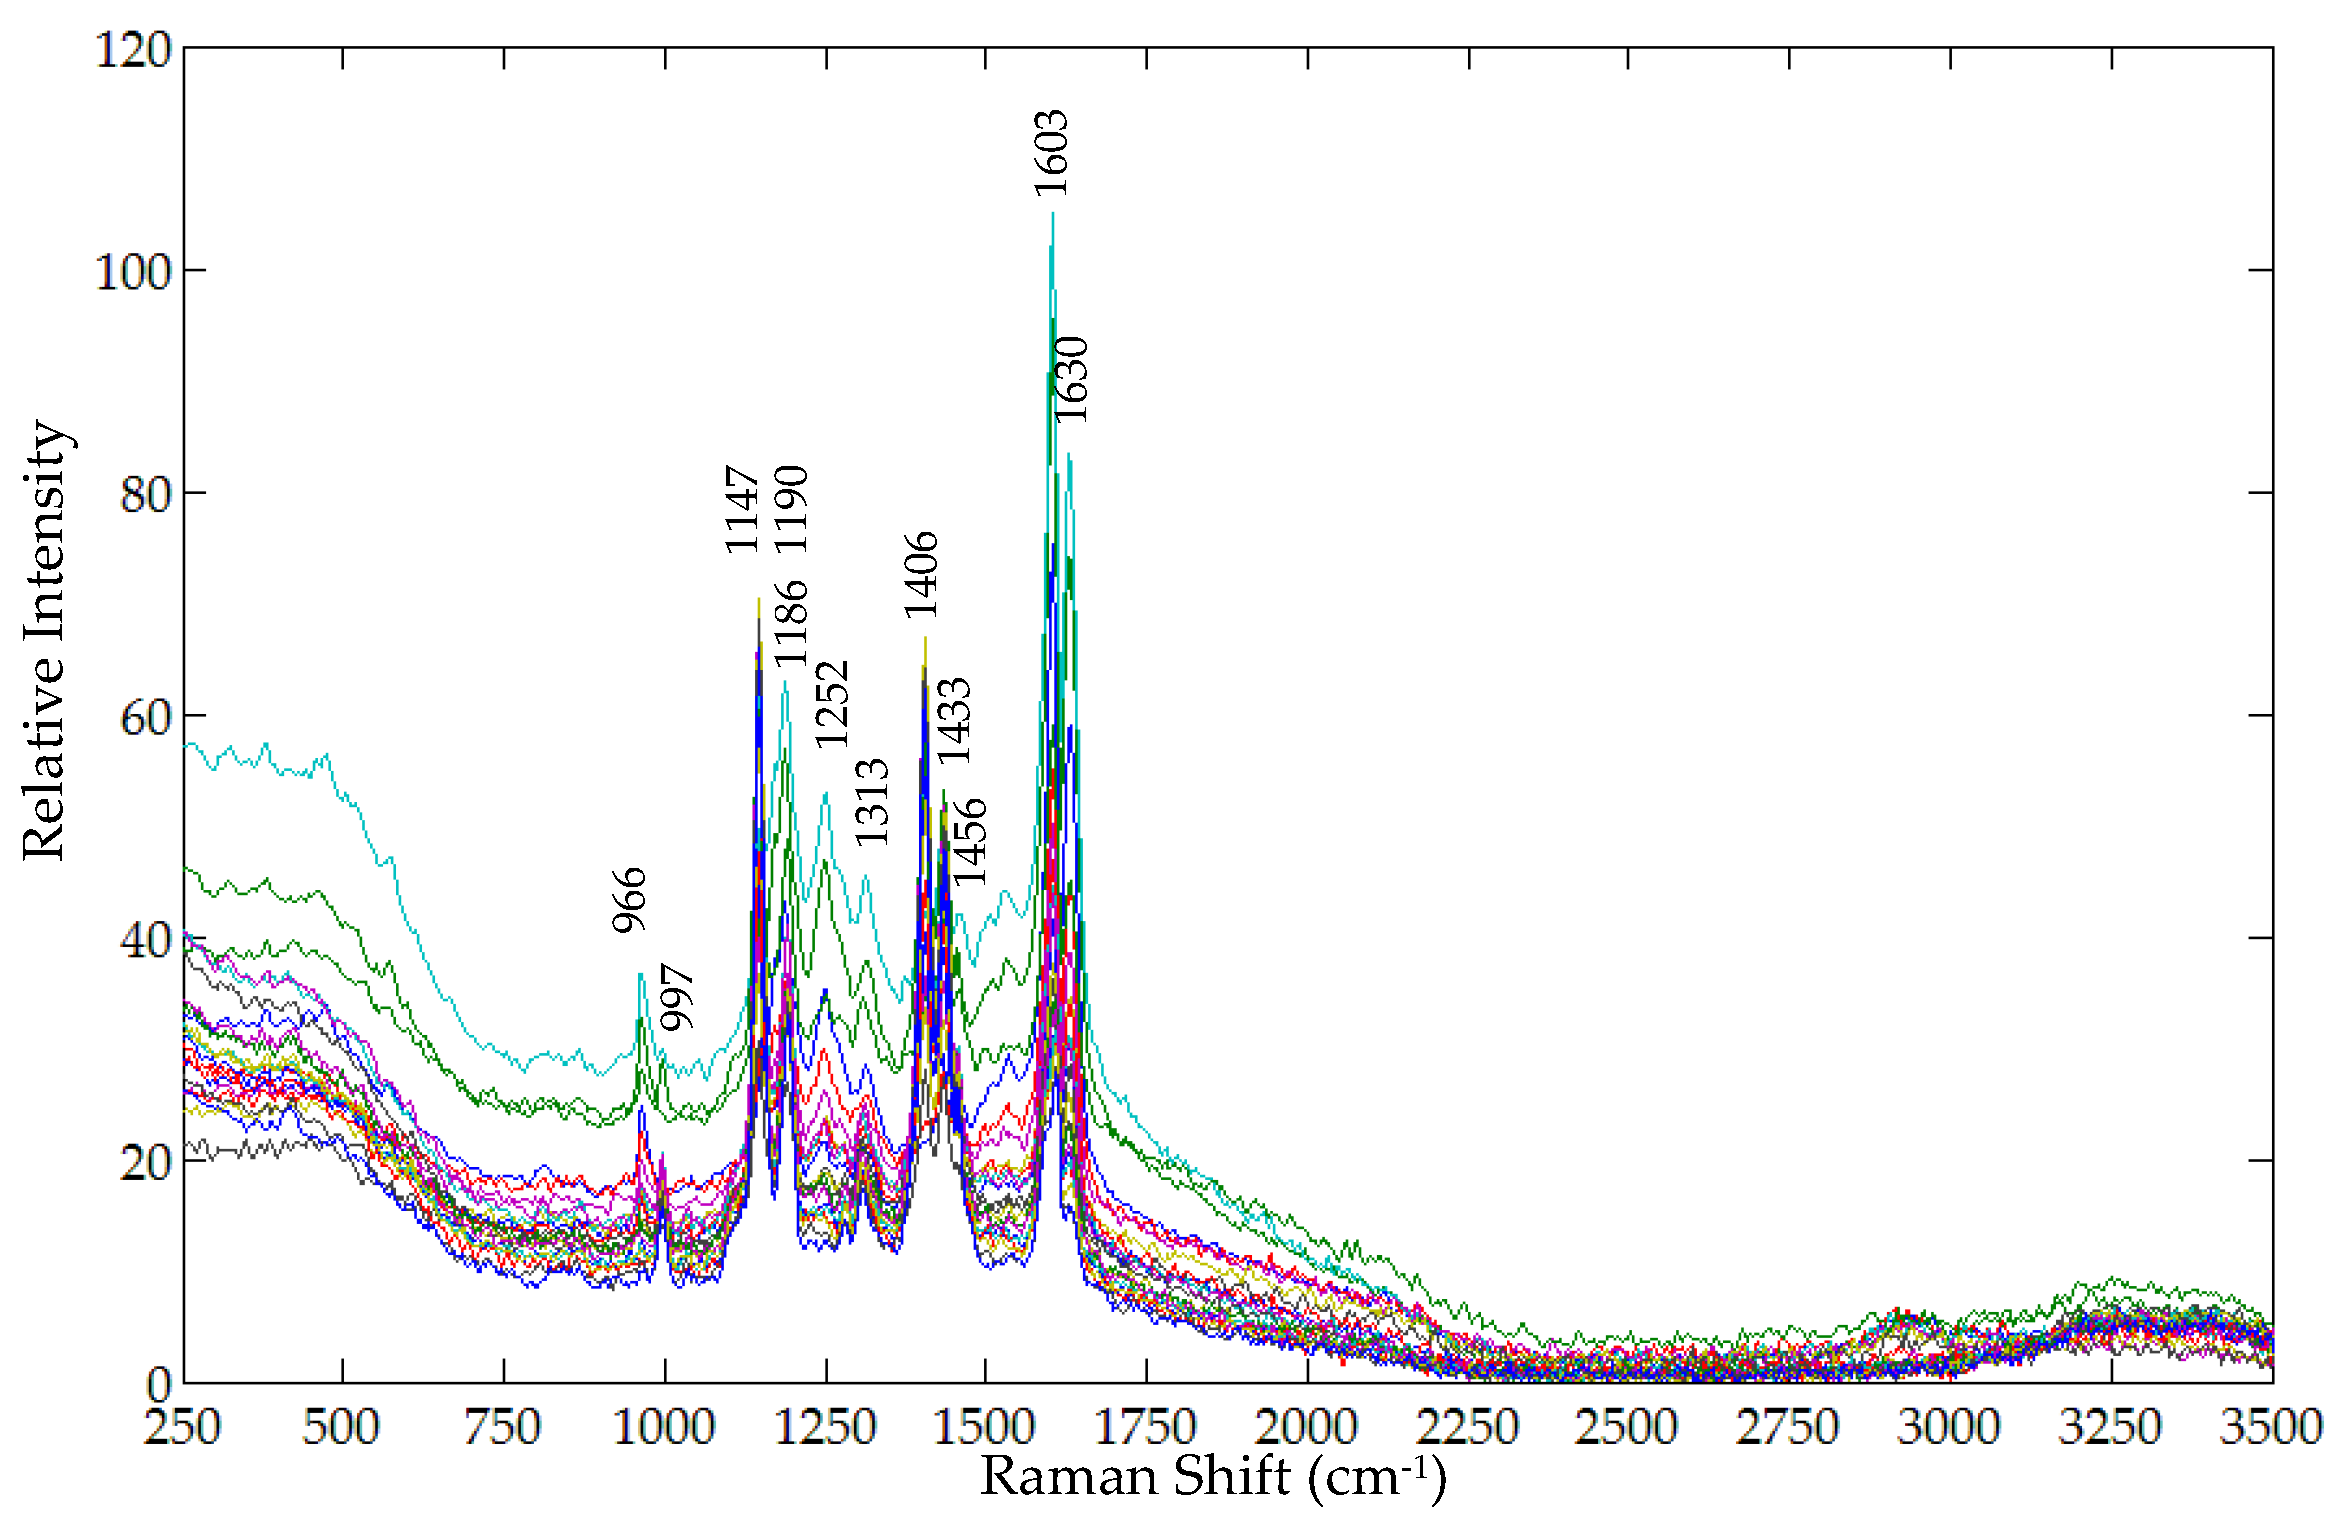
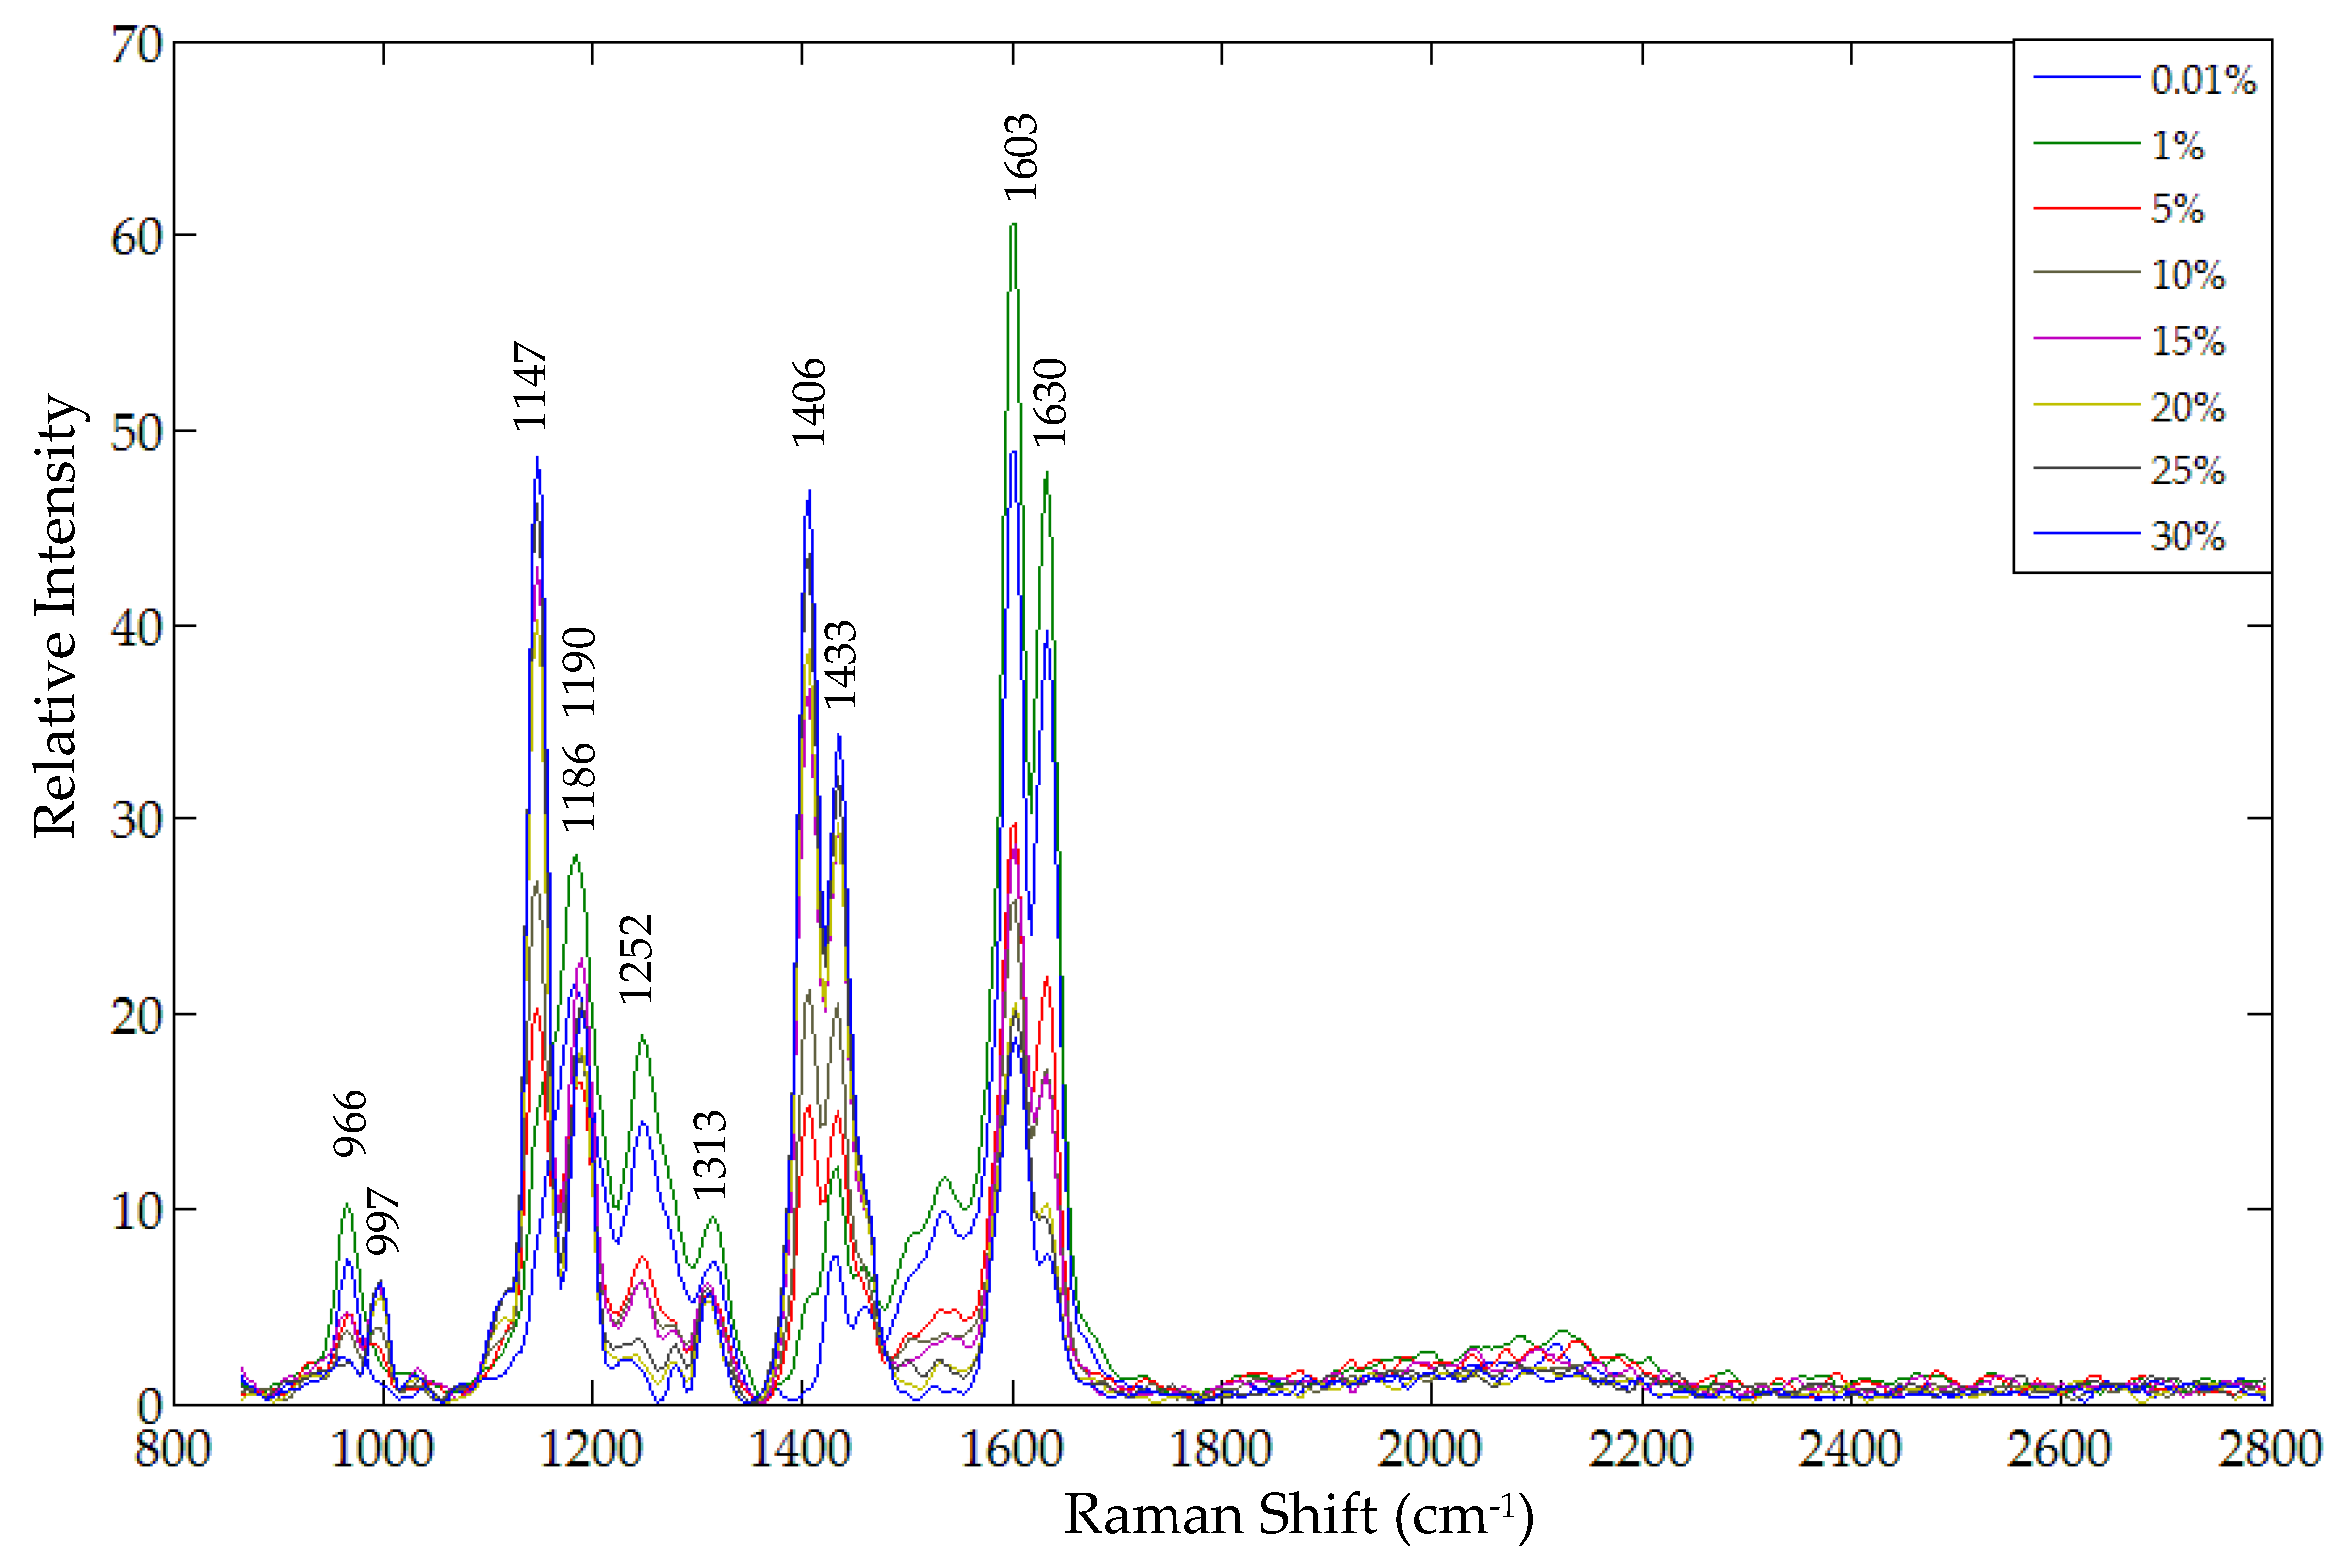
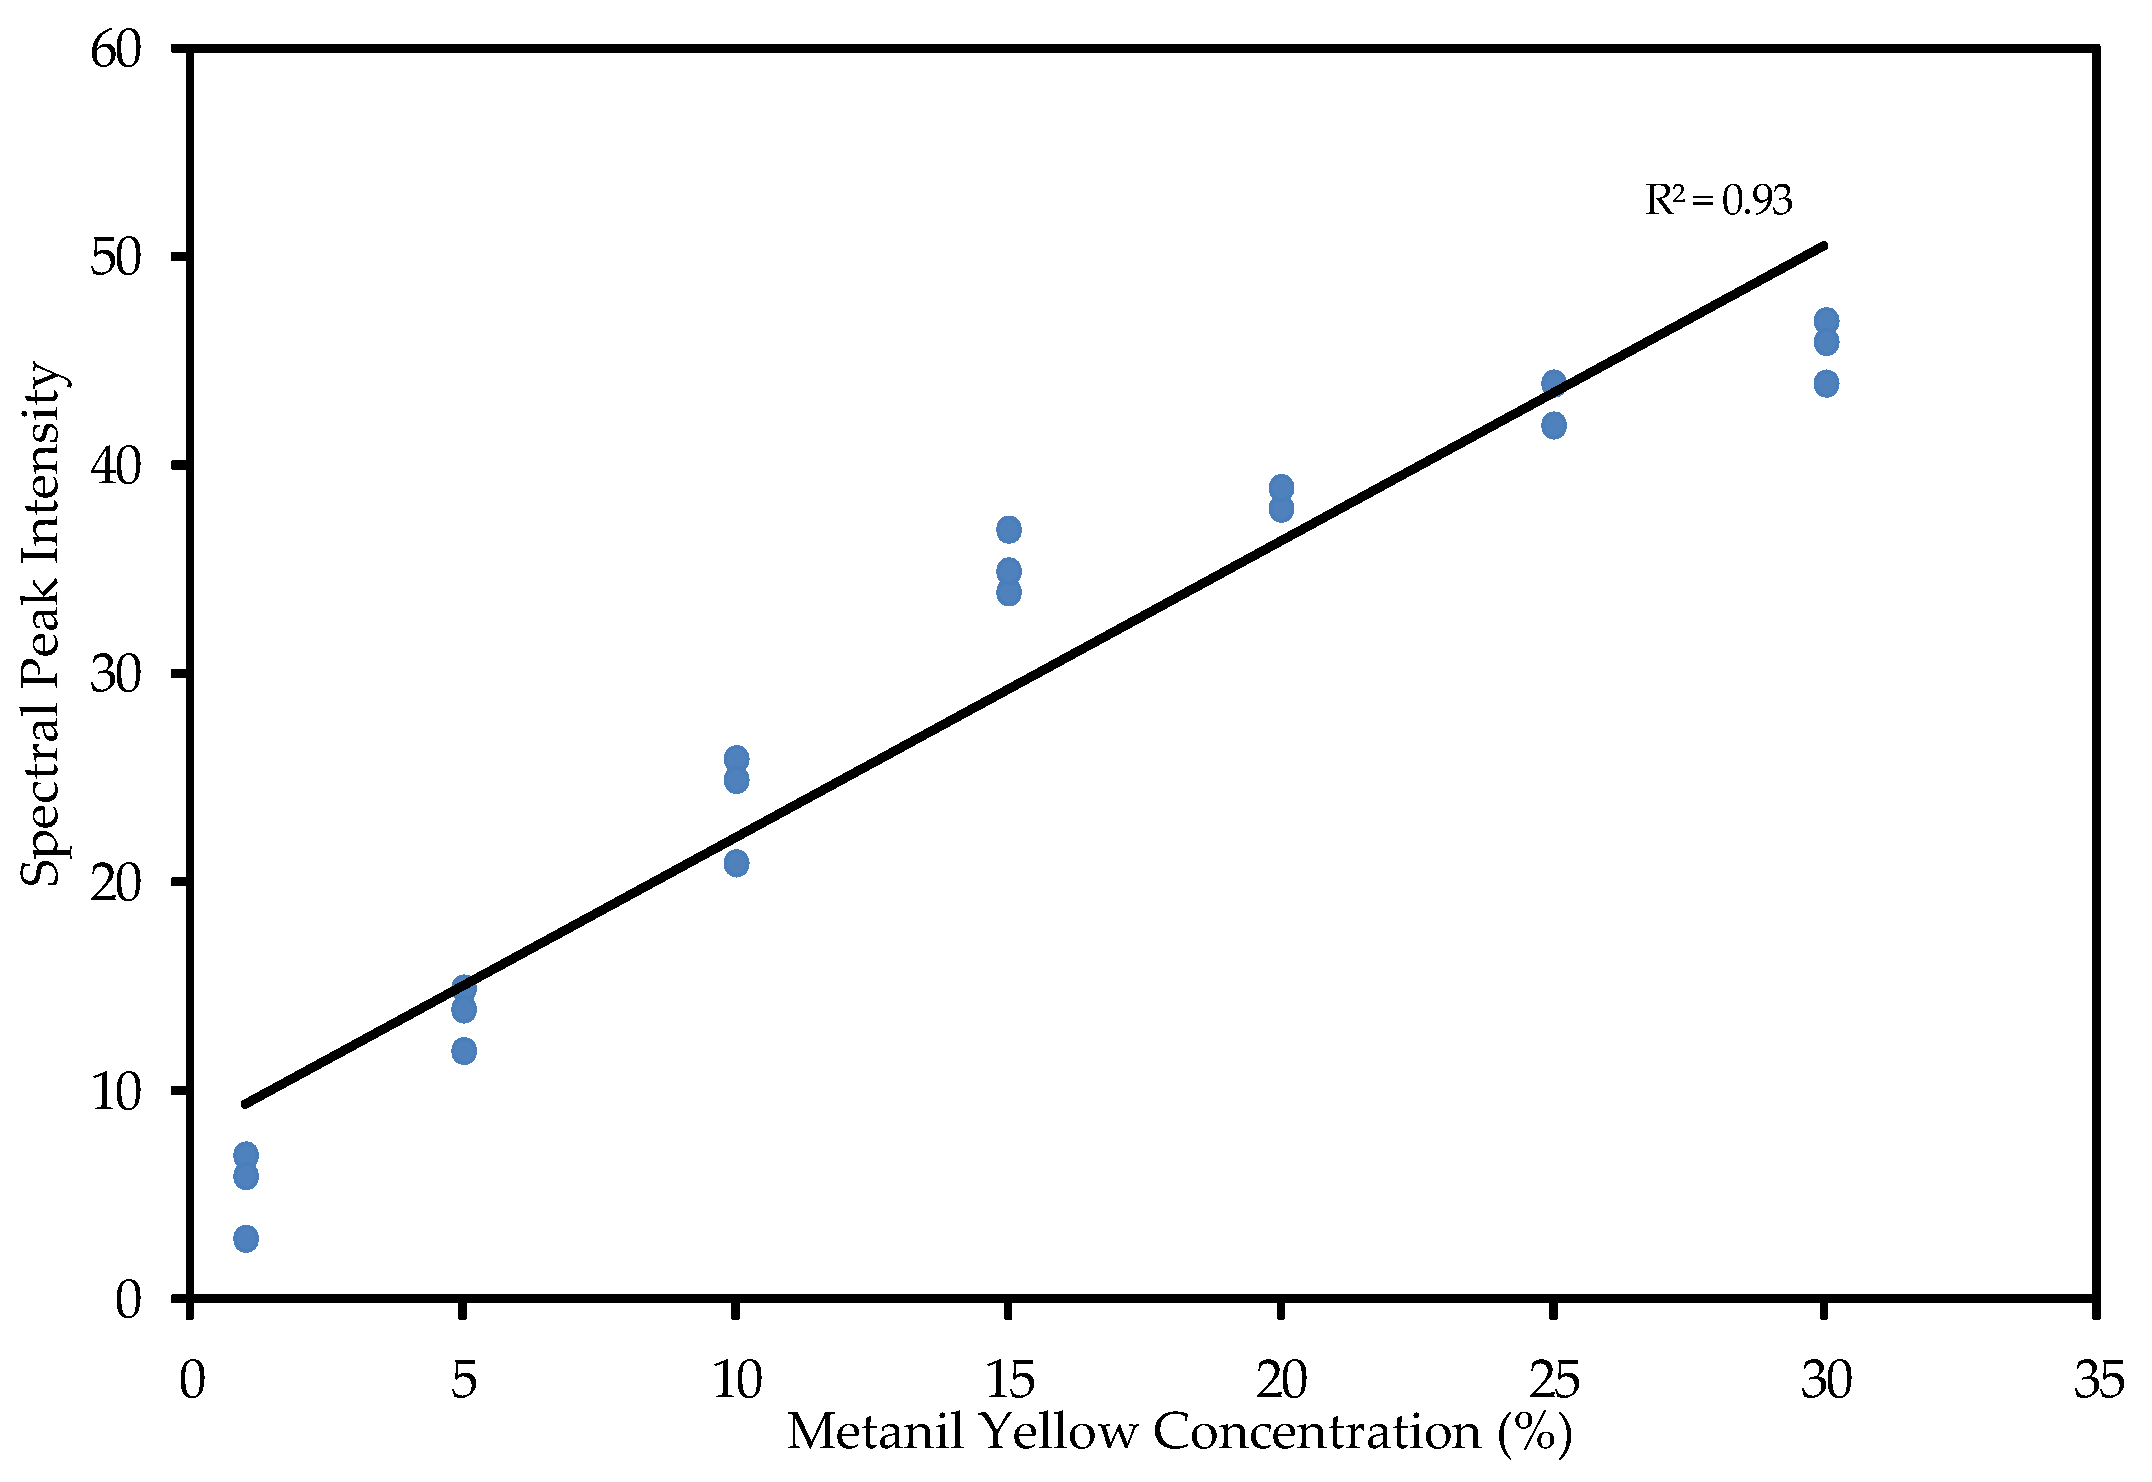
3.2. Evaluation of Metanil Yellow in Mixture by FT-Raman

Figure 4 shows the original FT-Raman spectra in the 250 cm−1 to 3500 cm−1 region for all twenty-four sample mixtures (three replicates for each of eight concentrations). A majority of the FT-Raman peaks of turmeric and metanil yellow are exhibited by the mixture samples. However, the FT-Raman peaks of turmeric at 1244 cm−1 and of metanil yellow at 1120 cm−1, 1282 cm−1, and 1475 cm−1 are not seen in the mixture sample spectra at any concentration. Similarly, FT-Raman peaks of metanil yellow at 1402 cm−1, 1437 cm−1, and 1452 cm−1 have shifted to 1406 cm−1, 1433 cm−1, and 1452 cm−1, respectively, in the mixture spectra.
The FT-Raman spectra were first smoothed using a Savitzky-Golay filter (5th order polynomial curve at 3-point intervals) to remove noise. Each spectrum was then corrected to remove the underlying fluorescence background by subtracting a 6th order polynomial function fitted to the spectral fluorescence. During the spectral correction it was observed that the 6th order polynomial curve best fit the spectral region of 850 cm−1 to 2800 cm−1. Since all the spectral peaks of metanil yellow and turmeric were located in this range, only this region was utilized for spectral correction and further analysis. Figure 5 shows the corrected spectra of representative samples at each of the concentration levels.
As discussed earlier, the FT-Raman spectral peaks due to N=N (at 1606 cm−1, 1452 cm−1, 1437 cm−1, and 1147 cm−1), at 997 cm−1 (ring breathing in ring II), and at 1402 cm−1 due to S=O stretching can be utilized for identification of metanil yellow. Although each of these spectral peaks are representative peaks of metanil yellow, a few of them happen to overlap with those of turmeric powder. For example, the metanil yellow peak at 1606 cm−1 (due to N=N) is very close to the turmeric peak at 1603 cm−1 (due to C=C stretching). Similarly, the metanil yellow peak at 1437 cm−1 shifted to a new position at 1433 cm−1 (Figure 5), which is also in close proximity to the turmeric peak at 1429 cm−1 (Figure 2b). Because the metanil peaks at 997 cm−1, 1406 cm−1, and 1147 cm−1 did not overlap with any turmeric peaks, these three peaks were initially considered as representative FT-Raman peaks for metanil yellow. In addition to uniqueness or non-overlap of each compound’s characteristic peaks, selection criteria for representative peaks also included the spectral intensity of the characteristic peaks. Although the metanil yellow peaks at 997 cm−1 and 1147 cm−1 did not overlap with those of turmeric powder, the mixture samples only exhibited these key peaks for the higher concentrations of metanil yellow (Figure 5). Consequently, the FT-Raman peak at 1406 cm−1 was the final selection for representing metanil yellow. The intensity at 1406 cm−1 is high for samples with high concentrations of metanil yellow and the intensity reduces gradually with decreasing concentration, showing a relative relationship between peak intensity and metanil yellow concentration in the samples. The minimum concentration of metanil yellow for which the peak at 1406 cm−1 was detectable was 1%.
The spectral peak position is utilized to identify and distinguish chemicals in a mixture sample, while the intensity of the spectral signal can be utilized to evaluate the chemical concentration in the mixture. Two models, one based on spectral peak intensity at 1406 cm−1 and the other on the ratio of the peak intensity against intensity at a neutral band, were developed for evaluating metanil yellow concentration in turmeric powder. The first model evaluated the intensity of the metanil yellow peak at 1406 cm−1 after fluorescence removal against the metanil yellow concentrations of the samples. Figure 6 shows the relation between the metanil yellow’s peak intensity and its actual concentration for samples at seven different concentrations, with a correlation coefficient of 0.93.
For the second model, a neutral FT-Raman band—one without any sharp peaks from metanil yellow or turmeric powder—was selected for use with the metanil yellow peak at 1406 cm−1 in a band ratio calculation. Several neutral bands were tested for band ratio calculation. For the mixture samples, the ratio of the intensities at these two bands was correlated to actual metanil yellow concentration with a much lower correlation coefficient.

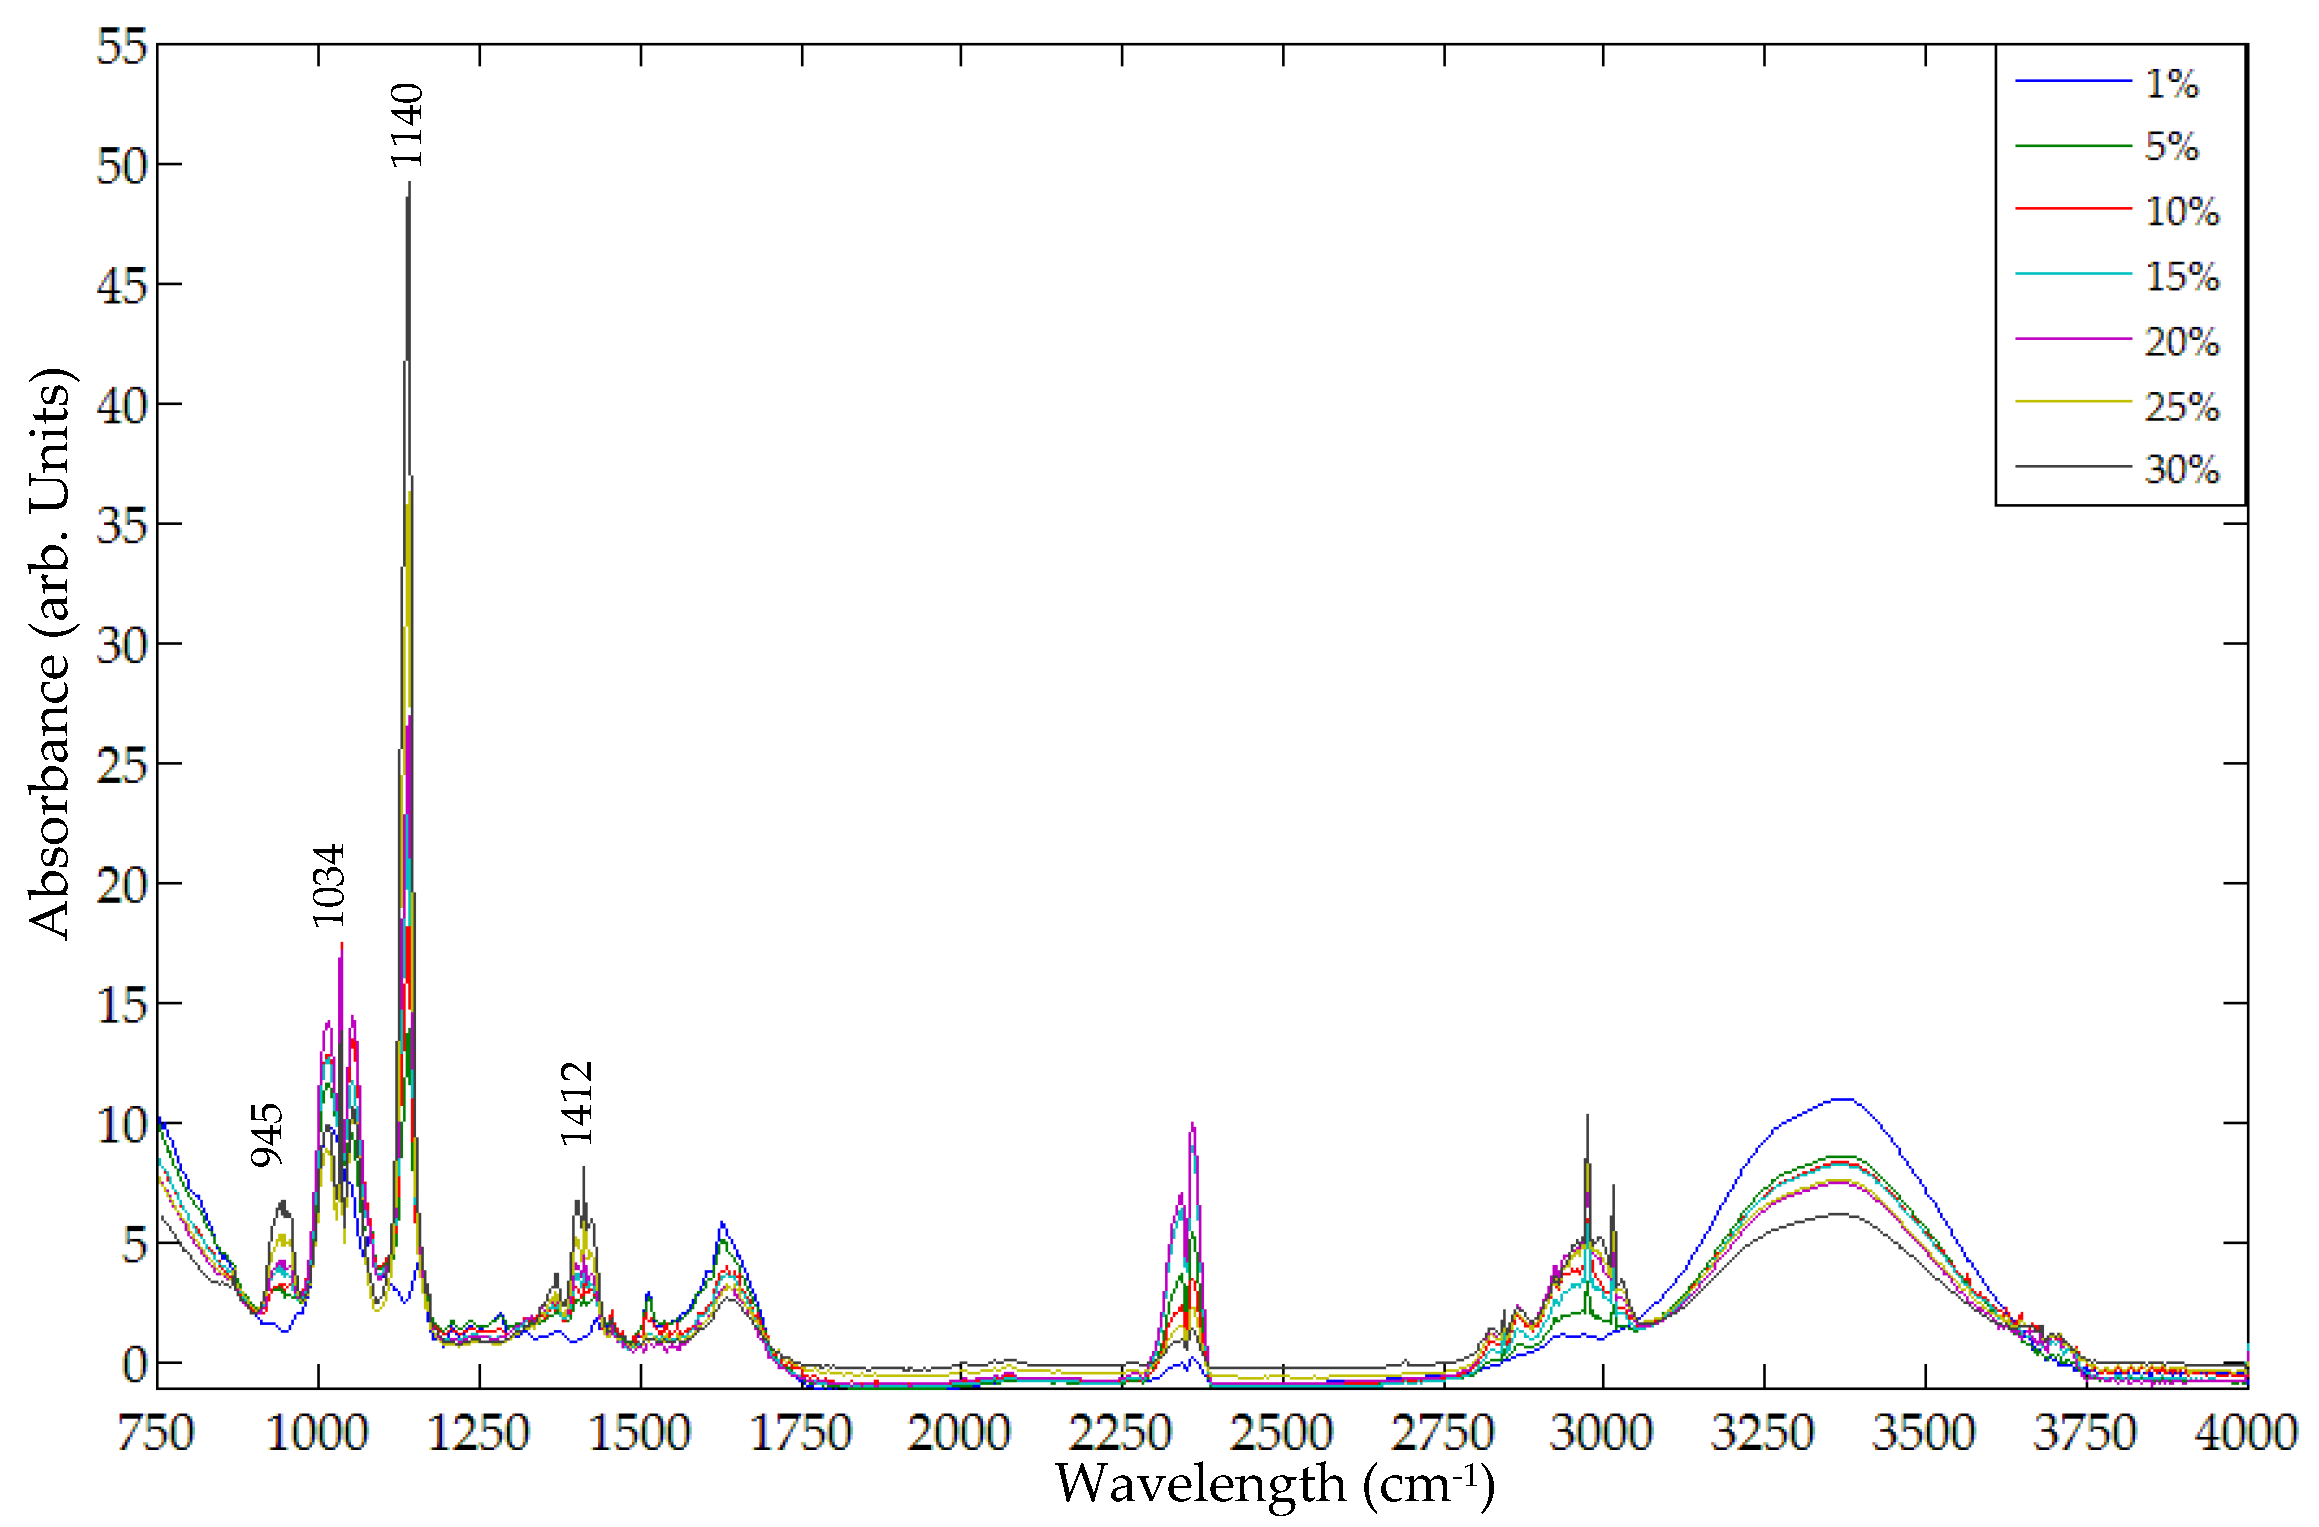
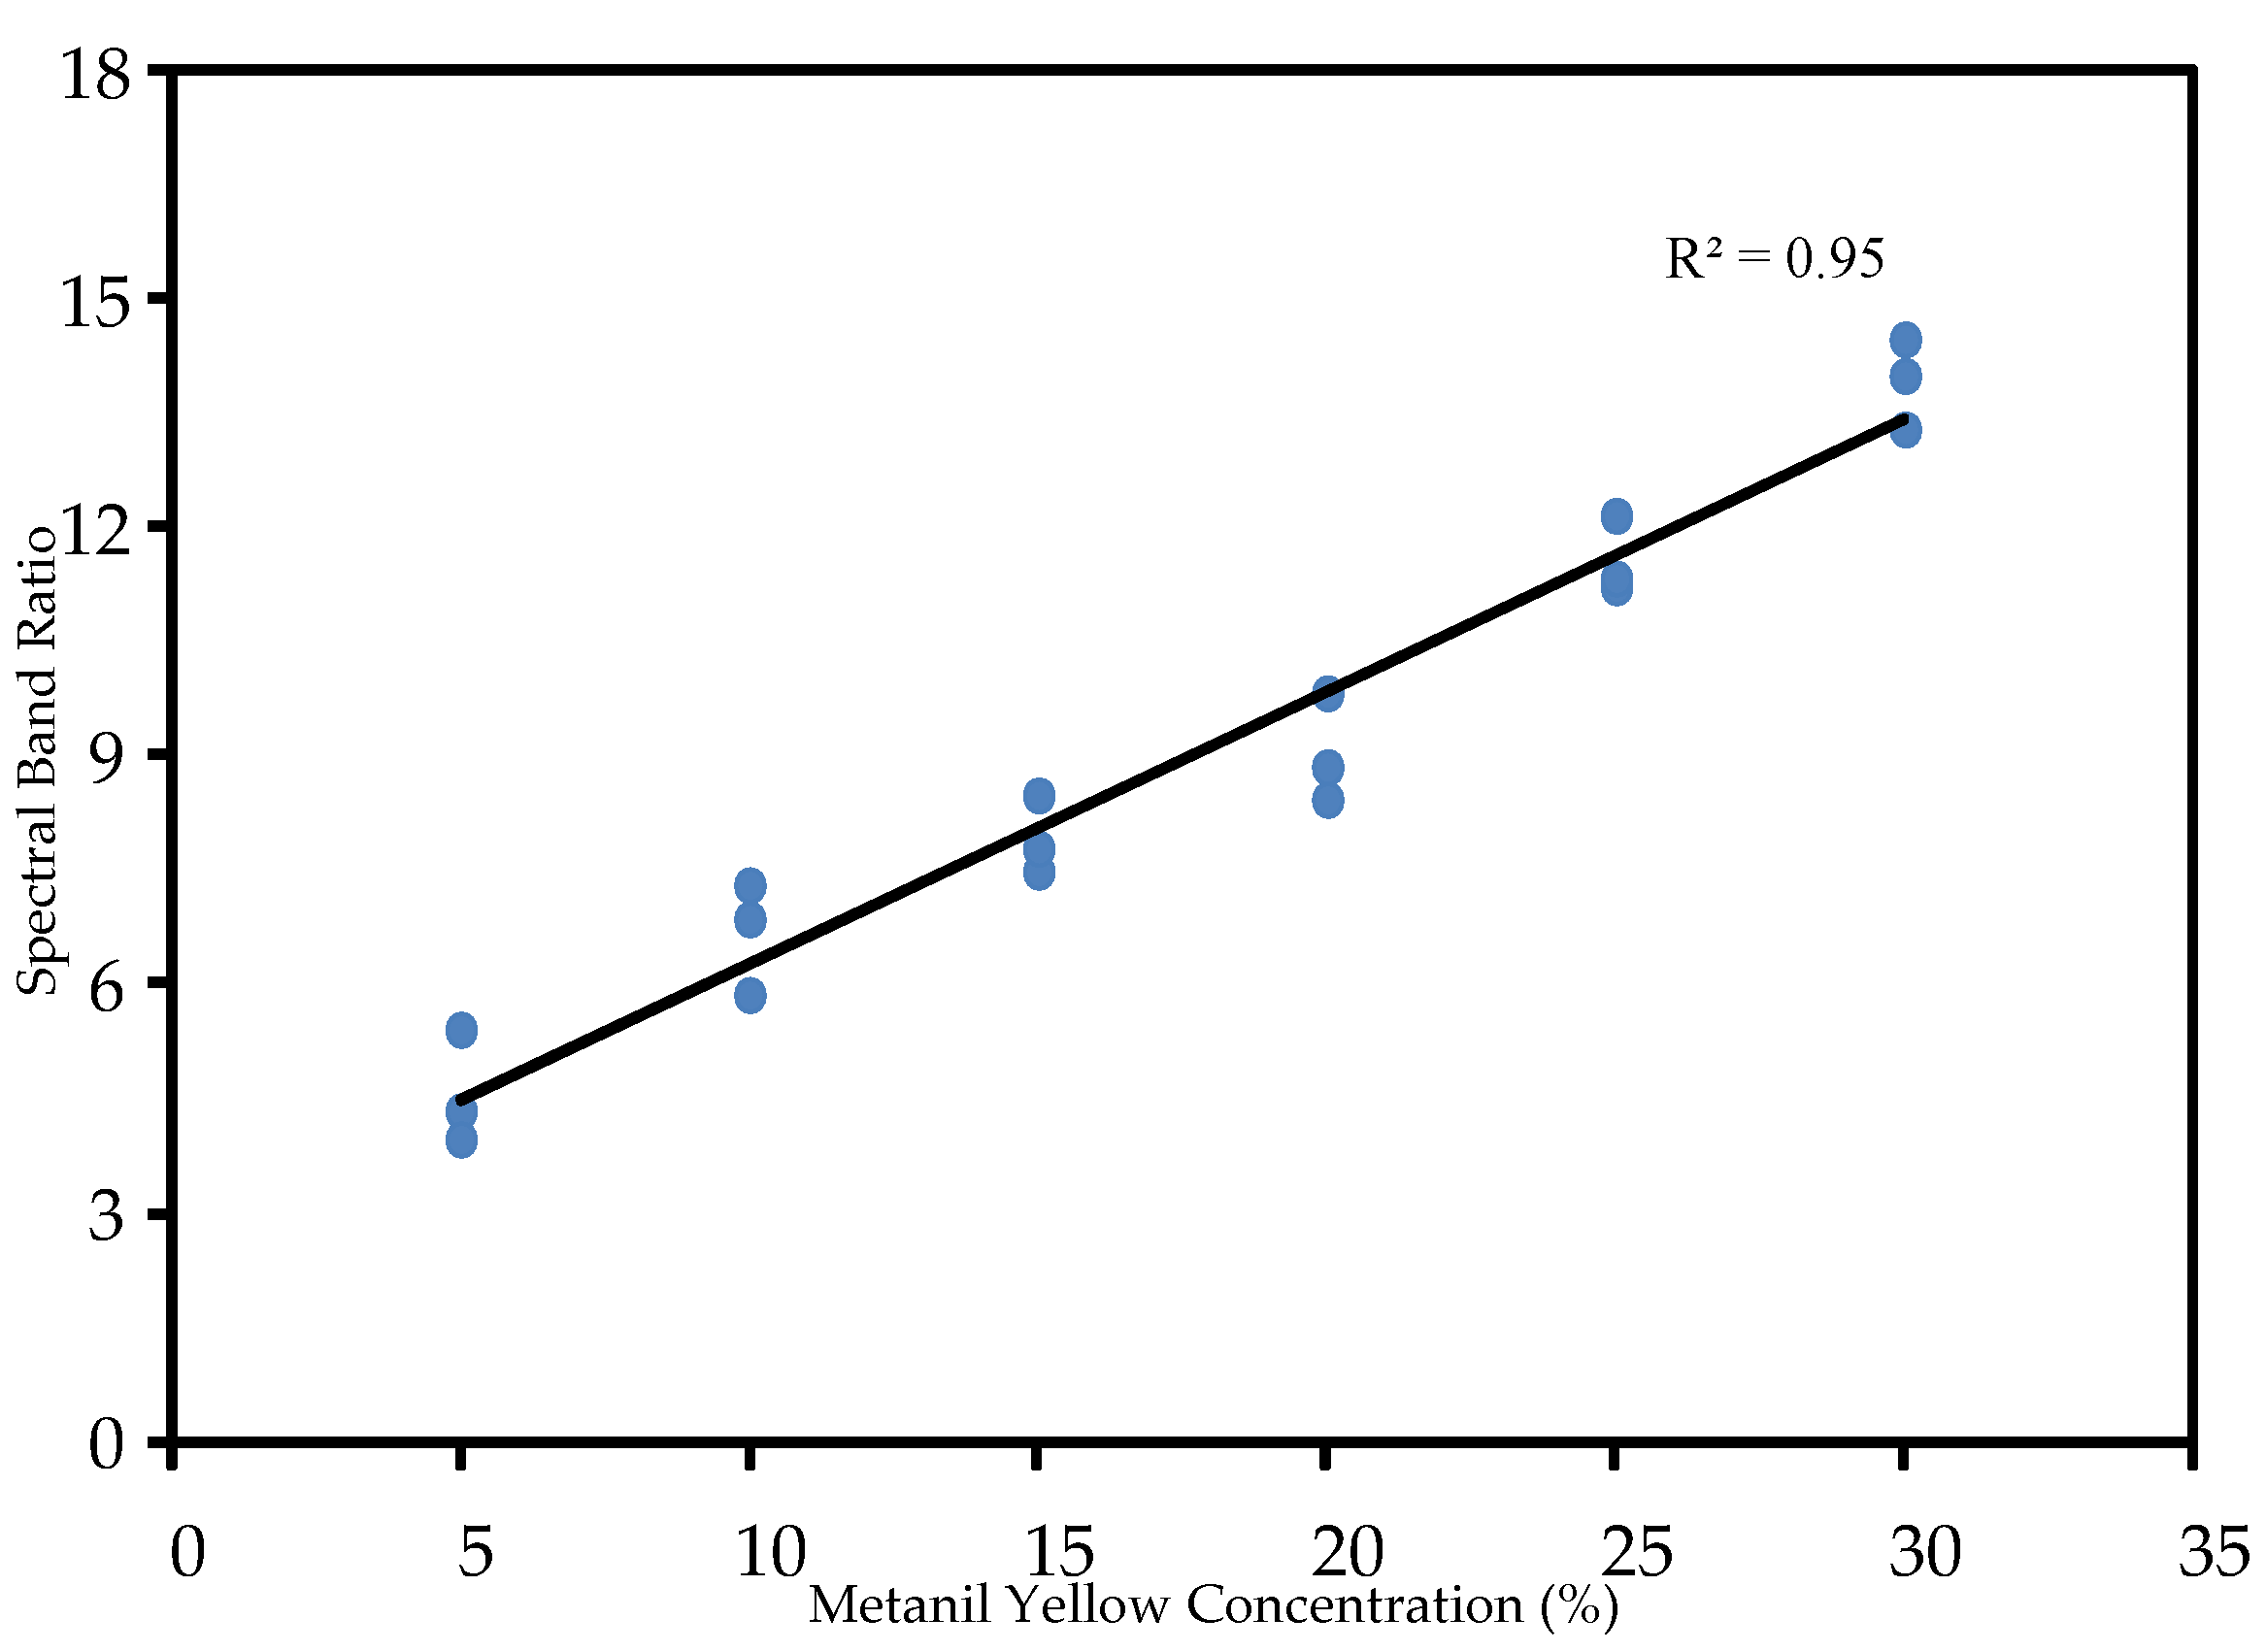
3.3. Evaluation of Metanil Yellow in Mixture by FT-IR

A Nicolet 6700 FT-IR spectrometer was utilized to acquire FT-IR spectra in the spectral range of 650 cm−1 to 4000 cm−1. Figure 7 shows the original FT-IR sample spectra, each acquired as an average of 32 successive scans. Both metanil yellow and turmeric exhibit FT-IR peaks that may be utilized for detecting metanil yellow in mixture with turmeric. The metanil yellow peaks at 997 cm−1 and 1597 cm−1 due to the N=N site (Figure 3a) are not present in the FT-IR spectra of the sample mixtures (Figure 7). Since the peak at 1140 cm−1 (due to the N=N site in metanil yellow) shows high intensity in the sample spectra (Figure 7) and does not overlap with any peaks of turmeric powder (Figure 3b), this FT-IR peak was selected for identifying metanil yellow in the mixture sample.
Figure 8 shows the representative FT-IR spectra of mixture samples at seven different concentration levels after noise removal using a Savitzky-Golay filter. The spectral peak at 1140 cm−1 is readily visible for sample concentrations from 30% to 5%, but vanishes at 1%. This illustrates that the 1140 cm−1 peak can be used to detect metanil yellow in turmeric as low as 5%.
The relation between the 1140 cm−1 peak intensity and metanil yellow concentration was evaluated. For all sample spectra, baseline drift was removed using the Multiplicative Scatter Correction (MSC) method. The spectral signal after baseline drift removal was utilized to develop concentration evaluation models.
Similar to the FT-Raman analysis, two models were developed for evaluation of metanil yellow concentration using the FT-IR spectra. The first model correlated the spectral peak intensity at 1140 cm−1 with actual metanil yellow concentrations. The result shows that the spectral peak intensity at 1140 cm−1 is highly correlated with metanil yellow concentration (correlation coefficient of 0.88). The second model was developed using spectral band ratio. The spectral band ratio was obtained using the spectral peak intensity at 1140 cm−1 and the spectral intensity of a neutrally positioned spectral band—one where the spectra are flat and lack sharp peaks for metanil yellow and for turmeric or its other constituents. Several such bands were selected and tested. The best result was obtained using the band ratio of 1140 cm−1 against 966 cm−1. It can be seen in the Figure 3a,b and Figure 8 that the spectral band at 966 cm−1 does not represent any chemical in the sample and has no sharp peaks. The ratio was correlated with the actual concentration of metanil yellow in the sample mixtures. The correlation coefficient of the band ratio method was found to be 0.95, higher than that for the spectral peak intensity method, as shown in Figure 9.

4. Conclusions

This study utilized FT-Raman spectroscopy and FT-IR spectroscopy techniques for the detection of metanil yellow in turmeric powder. FT-Raman and FT-IR spectra of metanil yellow, turmeric, and curcumin were acquired and analyzed. The FT-Raman spectral peak at 1406 cm−1 and FT-IR spectral peak at 1140 cm−1 were selected as representative peaks for metanil yellow. FT-Raman and FT-IR spectral analysis of sample mixtures of metanil yellow in turmeric at eight different concentrations showed that the FT-Raman method was able to detect metanil yellow at 1% concentration, while detection by the FT-IR method was limited to 5% concentration. For both FT-IR and FT-Raman analysis, two models were developed to evaluate metanil yellow concentration. The first model simply correlated a single peak intensity (FT-Raman 1106 cm−1 and FT-IR 1140 cm−1) to the actual sample concentration. The second model used a ratio of peak intensity and intensity at a neutral band. The band ratio model performed better for the FT-IR analysis (correlation coefficient of 0.95), while the peak intensity model was superior (correlation coefficient of 0.93) for the FT-Raman analysis. The results show that FT-Raman and FT-IR spectroscopy can be utilized for detection of chemical contaminants in food powders such as carcinogenic metanil yellow in turmeric.

Author Contributions

S.D. and K.C. conceived and designed the experiments; S.D. performed the experiments, J.Q. and M.K. helped in the experiment; S.D., W.S., and K.C. analyzed the data; S.D. and D.C. wrote the paper.

Conflicts of Interest

The authors declare no conflict of interest.

References

  1. Tayyem, R.F.; Heath, D.D.; Al-Delaimy, W.K.; Rock, C.L. Curcumin Content of Turmeric and Curry Powders. Nutr. Cancer 2006, 55, 126–131. [Google Scholar] [CrossRef] [PubMed]
  2. Li, S.; Yuan, W.; Deng, G.; Wang, P.; Yang, P.; Aggarwal, B.B. Chemical Composition and Product Quality Control of Turmeric (Curcuma longa L.). Pharm. Crops 2011, 2, 28–54. [Google Scholar] [CrossRef]
  3. Jayaprakasha, G.K.; Rao, L.J.M.; Sakariah, K.K. Improved HPLC Method for the Determination of Curcumin, Demethoxycurcumin, and Bisdemethoxycurcumin. J. Agric. Food Chem. 2002, 50, 3668–3672. [Google Scholar] [CrossRef] [PubMed]
  4. Suryanarayana, P.; Saraswat, M.; Mrudula, T.; Krishna, T.P.; Krishnaswamy, K.; Reddy, G.B. Curcumin and Turmeric Delay Streptozotocin-Induced Diabetic Cataract in Rats. Investig. Ophthalmol. Vis. Sci. 2005, 46, 2092–2099. [Google Scholar] [CrossRef] [PubMed]
  5. Hermann, P.T.A.; Martin, A.W. Pharmacology of Curcuma longa. Planta Med. 1991, 57, 1–7. [Google Scholar]
  6. Nakamura, Y.; Ohto, Y.; Murakami, A.; Osawa, T.; Ohigashi, H. Inhibitory effects of curcumin and tetrahydrocurcuminoids on tumor promoter-induced reactive oxygen species generation in leukocytes in vitro and in vivo. Jpn. J. Cancer Res. 1998, 89, 361–370. [Google Scholar] [CrossRef] [PubMed]
  7. Osawa, T.; Sugiyama, Y.; Inayoshi, M.; Kawakishi, S. Antioxidative activity of tetrahydrocurcuminoids. Biosci. Biotechnol. Biochem. 1995, 59, 1609–1612. [Google Scholar] [CrossRef] [PubMed]
  8. Joe, B.; Vijakumar, M.; Lokesh, B.R. Biological Properties of Curcumin-Cellular and Molecular Mechanisms of Action. Crit. Rev. Food Sci. Nutr. 2004, 44, 97–111. [Google Scholar] [CrossRef] [PubMed]
  9. Holt, P.R.; Katz, S.; Kirshoff, R. Curcumin Therapy in Inflammatory Bowel Disease: A Pilot Study. Dig. Dis. Sci. 2005, 50, 2191–2193. [Google Scholar] [CrossRef] [PubMed]
  10. Srimal, R.C.; Dhawan, B.N. Pharmacology of diferuloyl methane (curcumin), a non-steroidal anti-inflammatory agent. J. Pharm. Pharmacol. 1973, 25, 447–452. [Google Scholar] [CrossRef] [PubMed]
  11. Cronin, J.R. Curcumin: Old spice is a new medicine. J. Altern. Complement. Ther. 2003, 9, 34–38. [Google Scholar] [CrossRef]
  12. Labban, L. Medicinal and pharmacological properties of Turmeric (Curcuma longa): A review. Int. J Pharm. Biomed. Sci. 2014, 5, 17–23. [Google Scholar]
  13. Duvoix, A.; Blasius, R.; Delhalle, S.; Schnekenburger, M.; Morceau, F.; Henry, E.; Dicato, M.; Diederich, M. Chemopreventive and therapeutic effects of curcumin. Cancer Lett. 2005, 223, 181–190. [Google Scholar] [CrossRef] [PubMed]
  14. Yu, H.; Huang, Q. Enhanced in vitro anti-cancer activity of curcumin encapsulated in hydrophobically modified starch. Food Chem. 2010, 119, 669–674. [Google Scholar] [CrossRef]
  15. Mahesar, R.K.; Singh, A.K.; Gaddipati, J.; Srimal, R.C. Multiple biological activities of curcumin: A short review. Life Sci. 2006, 78, 2081–2087. [Google Scholar] [CrossRef] [PubMed]
  16. Li, M.; Zhang, Z.; Hill, D.L.; Wang, H.; Zhang, R. Curcumin, a Dietary Component, Has Anticancer, Chemosensitization, and Radiosensitization Effects by Down-regulating the MDM2 Oncogene through the PI3K/mTOR/ETS2 Pathway. Cancer Res. 2007, 67, 1988–1996. [Google Scholar] [CrossRef] [PubMed]
  17. Ruby, A.J.; Kuttan, G.; Babu, K.D.; Rajasekharan, K.N.; Kuttan, R. Anti-tumour and antioxidant activity of natural curcuminoids. Cancer Lett. 1995, 94, 79–83. [Google Scholar] [CrossRef]
  18. Ak, T.; Gulcin, I. Antioxidant and radical scavenging properties of curcumin. Chem. Biol. Interact. 2008, 174, 27–37. [Google Scholar] [CrossRef] [PubMed]
  19. Priyadarsini, K.I.; Maity, D.K.; Naik, G.H.; Kumar, M.S.; Unnikrishnan, M.K.; Satav, J.G.; Mohan, H. Role of phenolic O-H and methylene hydrogen on the free radical reactions and antioxidant activity of curcumin. Free Radic. Biol. Med. 2003, 35, 475–484. [Google Scholar] [CrossRef]
  20. Sidhu, G.S.; Singh, A.K.; Thaloor, D.; Banaudha, K.K.; Patnaik, G.K.; Srimal, R.C.; Maheshwari, R.K. Enhancement of wound healing by curcumin in animals. Wound Repair Regen. 1998, 6, 167–177. [Google Scholar] [CrossRef] [PubMed]
  21. Panchatcharam, M.; Miriyala, S.; Gayathri, V.S.; Suguna, L. Curcumin improves wound healing by modulating collagen and decreasing reactive oxygen species. Mol. Cell. Biochem. 2006, 290, 87–96. [Google Scholar] [CrossRef] [PubMed]
  22. Gopinath, D.; Ahmed, M.R.; Gomathi, K.; Chitra, K.; Sehgal, P.K.; Jayakumar, R. Dermal wound healing processes with curcumin incorporated collagen films. Biomaterials 2004, 25, 1911–1917. [Google Scholar] [CrossRef]
  23. Hamaguchi, T.; Ono, K.; Yamada, M. Review: Curcumin and Alzheimer’s disease. CNS Neurosci. Ther. 2010, 16, 285–297. [Google Scholar] [CrossRef] [PubMed]
  24. Hossain, M.A.; Ishimine, Y. Growth, yield and quality of turmeric (Curcuma longa L.) cultivated on dark-red soil, gray soil and red soil in Okinawa, Japan. Plant Prod. Sci. 2005, 8, 482–486. [Google Scholar] [CrossRef]
  25. Sasikumar, B. Genetics resources of Curcuma: Diversity, characterization and utilization. Plant Genet. Resour. Charact. Util. 2005, 3, 230–251. [Google Scholar] [CrossRef]
  26. Akamine, H.; Hossain, M.; Ishimine, Y.; Yogi, K.; Hokama, K.; Iraha, Y.; Aniya, Y. Effects of application of N, P and K alone or in combination on growth, yield and curcumin content of turmeric (Curcuma longa L.). Plant Prod. Sci. 2007, 10, 151–154. [Google Scholar] [CrossRef]
  27. Govindarajan, V.S.; Stahl, W.H. Turmeric-chemistry, technology, and quality. Crit. Rev. Food Sci. Nutr. 1980, 12, 199–301. [Google Scholar] [CrossRef] [PubMed]
  28. Siviero, A.; Gallo, E.; Maggini, V.; Gori, L.; Mugelli, A.; Firenzuoli, F.; Vannacci, A. Curcumin, a golden spice with a low bioavailability. J. Herb. Med. 2015, 5, 57–70. [Google Scholar] [CrossRef]
  29. Velagudhan, K.C.; Muralidharan, V.K.; Amalraj, V.A.; Gautam, P.L.; Mandal, S.; Kumar, D. Curcuma Genetic Resources; National Bureau of Plant Genetic Resources ICAR Regional Station: Thrissur, Kerala, India, 1999. [Google Scholar]
  30. Milobedzka, J.; Kostanecki, S.V.; Lampe, V. Zur Kenntnis des Curcumins. Ber. Dtsch. Chem. Ges. 1910, 43, 2163–2170. [Google Scholar] [CrossRef]
  31. Heath, D.D.; Khwaja, F.; Rock, C.L. Curcumin content of turmeric and curry powders. FASEB J. 2004, 18, 4–5. [Google Scholar]
  32. Sasikumar, B.; Syamkumar, S.; Remya, R.; Zachariah, T.J. PCR based detection of adulteration in the market samples of turmeric powder. Food Biotechnol. 2004, 18, 299–306. [Google Scholar] [CrossRef]
  33. Sen, A.R.; Gupta, P.S.; Dastidar, N.G. Detection of Curcuma zedoaria and Curcuma aromatic in Curcuma longa (Turmeric) by thin-layer chromatography. Analyst 1974, 99, 153–155. [Google Scholar] [CrossRef]
  34. Nath, P.P.; Sarkar, K.; Tarafder, P.; Mondal, M.; Das, K.; Paul, G. Practice of using Metanil yellow as food color to process food in unorganized sector of West Bengal—A case study. Int. Food Res. J. 2015, 22, 1424–1428. [Google Scholar]
  35. Dixit, S.; Purshottam, S.K.; Khanna, S.K.; Das, M. Surveillance of the quality of turmeric powders from city markets of India on the basis of curcumin content and the presence of extraneous colors. Food Addit. Contam. 2009, 26, 1227–1231. [Google Scholar] [CrossRef]
  36. Tripathi, M.; Khanna, S.K.; Das, M. Surveillance on use of synthetic colors in eatables vis a vis prevention of food adulterations act of India. Food Control 2007, 18, 211–219. [Google Scholar] [CrossRef]
  37. Balasubramanian, N.; Kumar, K.R.; Anandswamy, B. Packaging and storage studies on ground turmeric (C. long L.) in flexible consumer packages. Indian Spices 1979, 16, 10–13. [Google Scholar]
  38. Srivastava, L.P.; Khanna, S.K.; Singh, G.B.; Krishna Murti, C.R. In vitro studies on the biotransformation of metanil yellow. Environ. Res. 1982, 27, 185–189. [Google Scholar] [CrossRef]
  39. Nagaraja, T.N.; Desiraju, T. Effects of chronic consumption of Metanil yellow by developing and adult rats on brain regional levels of noradrenaline, dopamine and serotonin, on acetylcholine esterase activity and on operant conditioning. Food Chem. Toxicol. 1993, 31, 41–44. [Google Scholar] [CrossRef]
  40. Fernandes, C.; Lalitha, V.S.; Rao, K.V.K. Enhancing effect of malachite green on the development of hepatic preneoplastic lesion induced by N-nitrosodiethylamine in rats. Carcinogenesis 1991, 12, 839–845. [Google Scholar] [CrossRef] [PubMed]
  41. Fernandes, C.; Rao, K.V. Dose related promoter effect of metanil yellow on the development of hepatic pre-neoplastic lesions induced by N-nitrosodiethylamine in rats. Indian J. Med. Res. 1994, 100, 140–149. [Google Scholar] [PubMed]
  42. Rao, K.V.K.; Fernandes, C. Progressive effects of malachite green at varying concentrations on the development of N-nitrosodiethylamine hepatic induced preneoplastic lesion in rats. Tumori 1996, 82, 280–286. [Google Scholar] [PubMed]
  43. Gupta, S.; Sundarrajan, M.; Rao, K.V.K. Tumor promotion by Metanil yellow and Malachite green during rat hepatocarcinogenesis is associated with dysregulated expression of cell cycle regulatory proteins. Teratog. Carcinog. Mutagen. Suppl. 2003, 1, 301–312. [Google Scholar] [CrossRef] [PubMed]
  44. Raza, H.; Khanna, S.K.; Singh, G.B. Metanil yellow and gastric mucin. Ind. J. Exp. Biol. 1978, 16, 383–384. [Google Scholar]
  45. Prasad, O.M.; Rastogi, P.M. Haematological changes induced by feeding a common food color, Metanil yellow, in Albino mice. Toxicol. Lett. 1983, 16, 103–107. [Google Scholar] [CrossRef]
  46. Fuh, M.R.; Chia, K.J. Determination of sulphonated azo dyes in food by ion-pair liquid chromatography with photodiode array and electrospray mass spectrometry detection. Talanta 2002, 56, 663–671. [Google Scholar] [CrossRef]
  47. Feng, F.; Zhao, Y.; Yong, W.; Sun, L.; Jiang, G.; Chu, X. Highly sensitive and accurate screening of 40 dyes in soft drinks by liquid chromatography-electrospray tandem mass spectrometry. J. Chromatogr. B 2011, 879, 1813–1818. [Google Scholar] [CrossRef] [PubMed]
  48. Chen, L.; Hu, J.; Zhang, W.; Zhang, J.; Guo, P.; Sun, C. Simultaneous determination of nine banned azo dyes in foodstuffs and beverages by high-performance capillary electrophoresis. Food Anal. Methods 2015, 8, 1903–1910. [Google Scholar] [CrossRef]
  49. Ashok, V.; Agrawal, N.; Durgbanshi, A.; Esteve-Romero, J.; Bose, D. A novel micellar chromatographic procedure for the determination of Metanil yellow in food stuffs. Anal. Methods 2015, 7, 9324–9330. [Google Scholar] [CrossRef]
  50. Qin, J.; Chao, K.; Kim, M.S. Raman chemical imaging system for food safety and quality inspection. Trans. ASABE 2010, 53, 1873–1882. [Google Scholar] [CrossRef]
  51. Dhakal, S.; Li, Y.; Peng, Y.; Chao, K.; Qin, J.; Guo, L. Prototype Instrument Development for Non-Destructive Detection of Pesticide Residue in Apple Surface Using Raman Technology. J. Food Eng. 2014, 123, 94–103. [Google Scholar] [CrossRef]
  52. Dhakal, S.; Wu, J.; Chen, J.; Peng, Y. Prediction of Egg’s Freshness using Backward Propagation Neural Network. Appl. Eng. Agric. 2011, 27, 279–285. [Google Scholar] [CrossRef]
  53. Peng, Y.; Dhakal, S. Optical Methods and Techniques for Meat Quality Inspection. Trans. ASABE 2015, 58, 1370–1386. [Google Scholar]
  54. Kim, M.S.; Chen, Y.R.; Mehl, P.M. Hyperspectral reflectance and fluorescence imaging system for food quality and safety. Trans. ASABE 2001, 44, 721–729. [Google Scholar]
  55. Lohumi, S.; Lee, S.; Lee, W.H.; Kim, M.S.; Mo, C.; Bae, H.; Cho, B.K. Detection of starch adulteration in onion powder by FT-NIR and FT-IR spectroscopy. J. Agric. Food Chem. 2014, 62, 9246–9251. [Google Scholar] [CrossRef] [PubMed]
  56. Lohumi, S.; Lee, S.; Cho, B.K. Optimal variable selection for Fourier transform infrared spectroscopic analysis of starch-adulterated garlic powder. Sens. Actuators B 2015, 216, 622–628. [Google Scholar] [CrossRef]
  57. Rohman, A.; Man, Y.B.C. Fourier transform infrared (FTIR) spectroscopy for analysis of extra virgin olive oil adulterated with palm oil. Food Res. Int. 2010, 43, 886–892. [Google Scholar] [CrossRef]
  58. Baeten, V.; Pierna, J.A.F.; Dardenne, P.; Meurens, M.; Garcia-Gonzalez, D.L.; Aparicio-Ruiz, R. Detection of presence of hazelnut oil in olive oil by FT-Raman and FT-MIR spectroscopy. J. Agric. Food Chem. 2005, 53, 6201–6206. [Google Scholar] [CrossRef] [PubMed]
  59. Baeten, V.; Meurens, M.; Morales, M.T.; Aparicio, R. Detection of virgin olive oil adulteration by Fourier Transform Raman Spectroscopy. J. Agric. Food Chem. 1996, 44, 2225–2230. [Google Scholar] [CrossRef]
  60. Schulz, H.; Schrader, B.; Quilitzsch, R.; Preffer, S.; Kruger, H. Rapid classification of basil chemotypes by various vibrational spectroscopy methods. J. Agric. Food Chem. 2003, 51, 2475–2481. [Google Scholar] [CrossRef] [PubMed]
  61. Karimi, S.; Feizy, J.; Mehrjo, F.; Farrokhnia, M. Detection and quantification of food colorant adulteration in saffron sample using chemometric analysis of FT-IR spectra. RSC Adv. 2016, 6, 23085–23093. [Google Scholar] [CrossRef]
  62. Zheng, Y.B.; Payton, J.L.; Chung, C.H.; Liu, R.; Cheunkar, S.; Pathem, B.K.; Yang, Y.; Jensen, L.; Weiss, P.S. Surface-enhanced Raman spectroscopy to probe reversibly photoswitchable azobenzene in controlled nanoscale environments. Nano Lett. 2011, 11, 3447–3452. [Google Scholar] [CrossRef] [PubMed]
  63. Sett, P.; De, A.K.; Chattopadhyay, S.; Mallick, P.K. Raman excitation profile of diphenylamine. Chem. Phys. 2002, 276, 211–224. [Google Scholar] [CrossRef]
  64. Yamada, O.; Hiura, H.; Igarashi, T.; Kaneko, N.; Takahashi, H. Configuration-sensitive infrared bands and vibrational assignments of S-alkyldithizones based on isotopic substitutions. Spectrochim. Acta 1988, 44, 1409–1415. [Google Scholar] [CrossRef]
  65. Mainreck, N.; Brezillon, S.; Sockalingum, G.D.; Manfait, M.; Wegrowski, Y. Rapid characterization of glycosaminoglycans using a combined approach by infrared and Raman microspectroscopies. J. Pharm. Sci. 2011, 100, 441–450. [Google Scholar] [CrossRef] [PubMed]
Figure 1. Chemical structure of: Metanil yellow (a), and Curcumin/Turmeric (b).
Foods 05 00036 g001
Figure 2. FT-Raman spectra of: (a) Metanil yellow; (b) Turmeric powder; (c) Curcumin.
Foods 05 00036 g002
Figure 3. Fourier Transform-Infra Red (FT-IR) spectra of: (a) Metanil yellow; (b) Turmeric powder; (c) Curcumin.
Foods 05 00036 g003
Figure 4. Original FT-Raman spectra of mixture samples at all concentration levels.
Foods 05 00036 g004
Figure 5. Corrected FT-Raman spectra for representative samples at each concentration level.
Foods 05 00036 g005
Figure 6. Linear relation between FT-Raman spectral peak intensity and corresponding sample concentration.
Foods 05 00036 g006
Figure 7. Original FT-IR spectra of mixture samples for all concentration levels.
Foods 05 00036 g007
Figure 8. Representative FT-IR spectra of mixture samples at all concentration levels.
Foods 05 00036 g008
Figure 9. Linear relation between FT-IR spectral peak intensity and sample concentration.
Foods 05 00036 g009
Table 1. Assignment of FT-Raman and FT-IR spectral bands [62,63,64,65].
Metanil YellowTurmeric
Infra Red (IR) (cm−1)Raman (cm−1)AssignmentIR (cm−1)Raman (cm−1)Assignment
3342 brO–H str intermolecular bonded
3064ν (C–H)3073O–H str alcohol
30303043ν(C–H)
3014 sharp3017
2976 sharp2974
29562959
2923 weak2926 weak2924
2874
28542855
1739C=O stretching
1681Conjugated C=O stretching
16281630Disubstituted C=C stretching
1597 sharp1606 sharpν(N–N) stretching (III)16031603C=C stretching
15811591ν(C–C) stretching (III)1585
1534δ(Ar–O + Ar–O–R) bending
15141524 weakν(C–C) stretching (III)1512
1505
14931496 weakν(C–C) stretching (I)
1475ν(N=N), δCH1465CH bending
1455 weak1452 sharpν(N=N), δCH14511456
14311437 sharpν(N=N)14311429
14121417ν(N=N) stretching (I)
14001402S=O str
13791374C–H bending in O=C–CH2–C=O
1371S=O str
1343S=O str
1325νas(SO2)1318
13041306νC–C stretching (III)1309
1282νC–N stretching1282
1264 weakν(C–Nazo)δ(C–H)1268COH + CO(CH3) stretching
12321243 weakνC–X stretching (I)12341244CH bending
12231218 weakδ(N–H)
12071202C–O–(CH3) stretching
11881190δ(C–H)11871186CH3 deformation
1171ν(C–Nazo)δ(C–H)1173CH bending
1156
1140 sharp1147 sharpν(C–Nazo)δ(C–H)
1115 sharp112011251126
10821084 weakβCH bending (II) ip10761084
10471052 weak1045
1034νs(SO3)10321028C–O stretching
10231026 weak
997997 sharpRing breathing (II)
969966=CH wag trans
945
936935 weak930938
908γCH wagging (I,II) op901
882 weakγCH wagging (II) op888Ar CH bending
870 weak866 weakγCH wagging (I) op870860Ar CH bending
845842 weakγCH wagging (II) op856Ar CH bending
830γCH wagging (III) op837
810813 weak1,4-Ar CH bending813812Ar CH bending

