Tree Lab: Portable Genomics for Early Detection of Plant Viruses and Pests in Sub-Saharan Africa

 , , , , , ,
Abstract
:1. Introduction
2. Materials and Methods
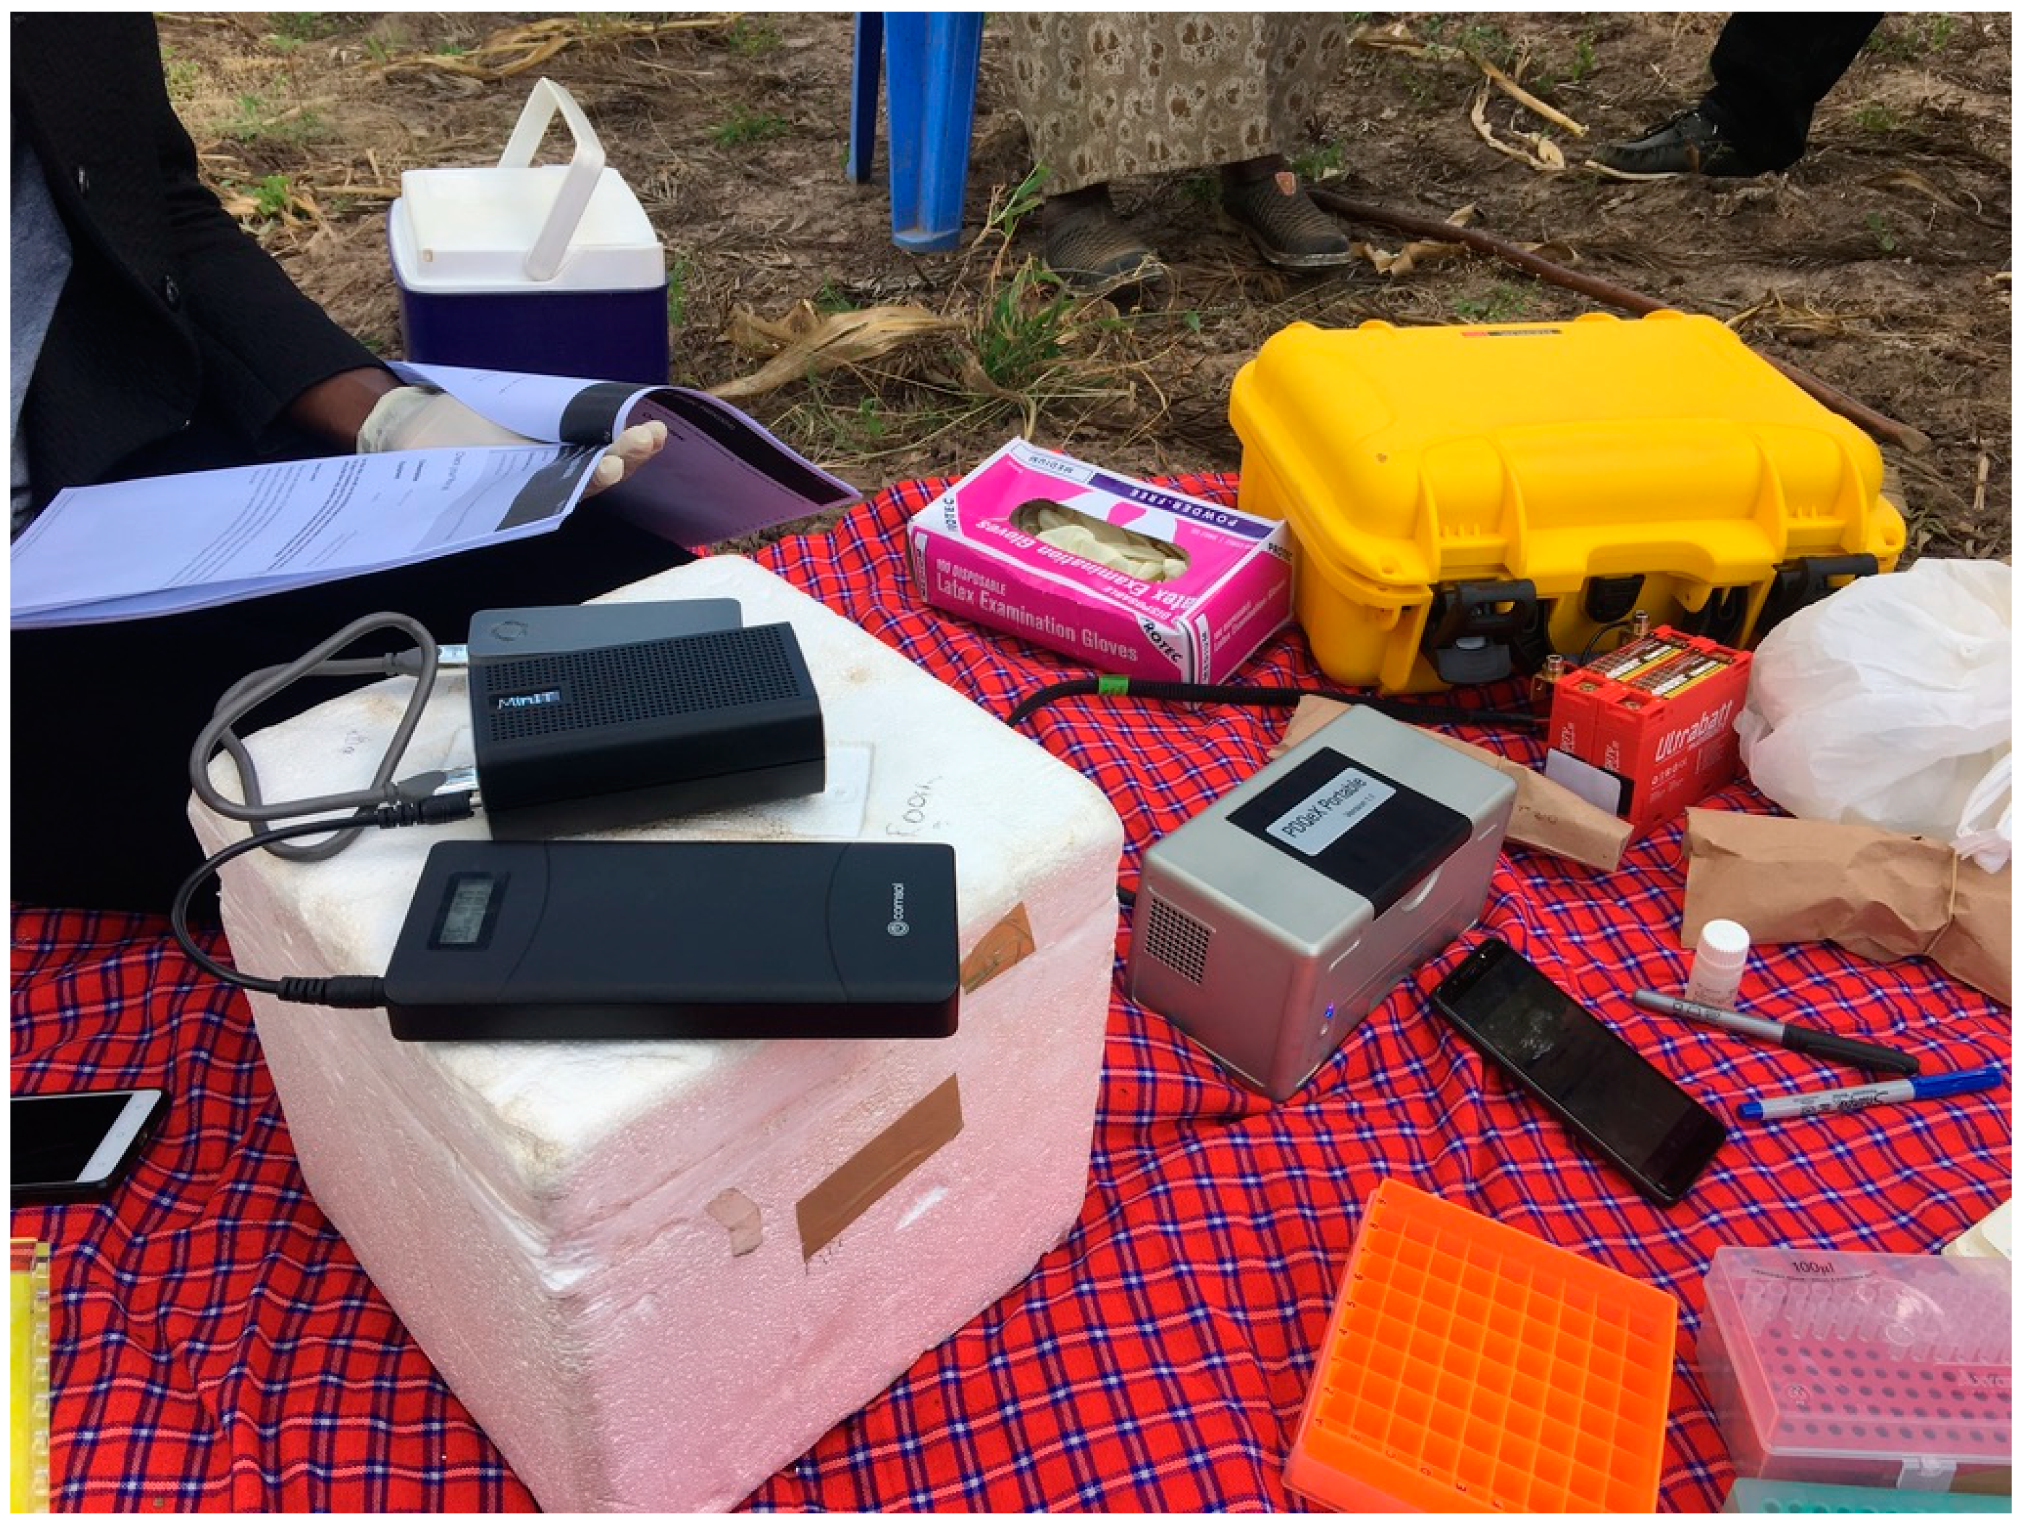
2.1. Tree Lab Locations
2.2. Sample Selection
2.3. DNA Extraction
2.4. Library Preparation and Sequencing
2.5. Tree Lab Data Analyses
2.6. Post Tree Lab Data Analyses
2.7. Assembly
2.8. Blast
2.9. Blastn Analysis—MEGAN
2.10. Blastn Analysis—Kraken
3. Results
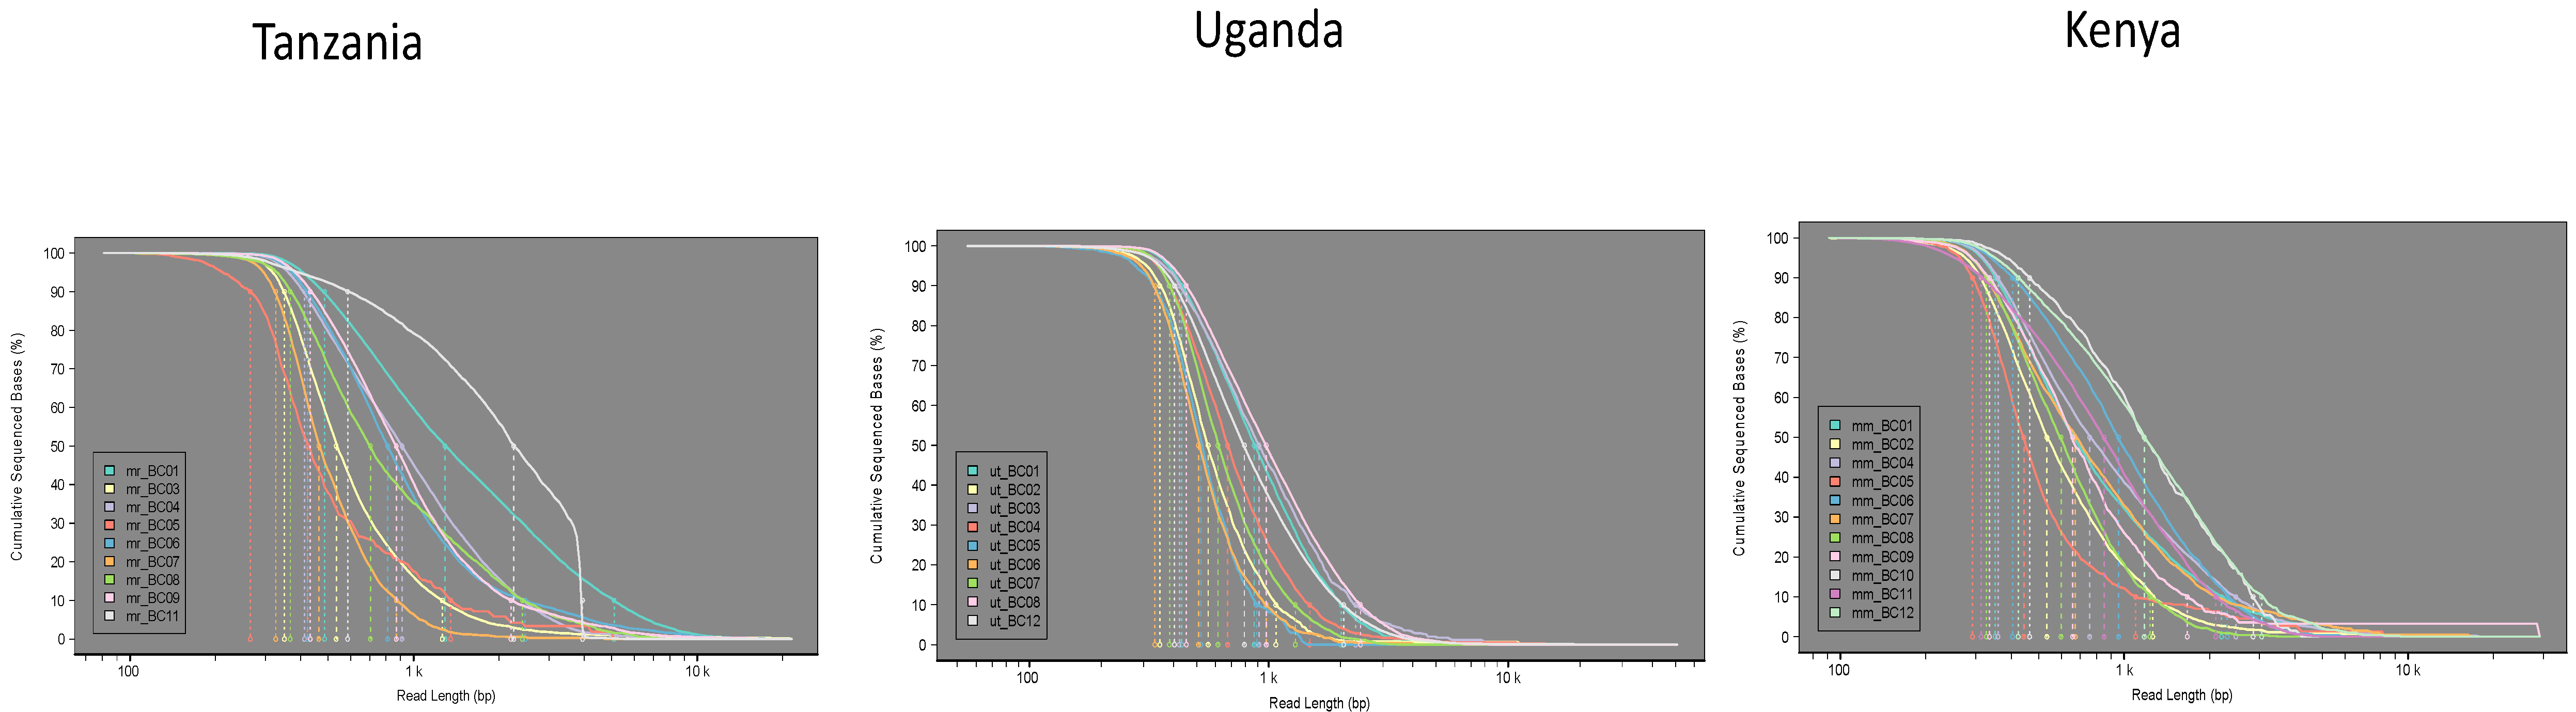
3.1. Tree Lab
3.2. Post Tree Lab Data Analyses
3.3. MEGAN Results
3.4. Kraken2 Results
4. Discussion
5. Executive Summary
Supplementary Materials
Author Contributions
Funding
Acknowledgments
Conflicts of Interest
References
- Quick, J.; Loman, N.J.; Duraffour, S.; Simpson, J.T.; Severi, E.; Cowley, L.; Ouédraogo, N.; Williams, V.; Amburgey, L.; Winona, E.; et al. Real-time, portable genome sequencing for Ebola surveillance. Nature 2016, 530, 228–232. [Google Scholar] [CrossRef] [PubMed]
- Faria, N.R.; Sabino, E.C.; Nunes, M.R.; Alcantara, L.C.J.; Loman, N.J.; Pybus, O.G. Mobile real-time surveillance of Zika virus in Brazil. Genome Med. 2016, 8, 97. [Google Scholar] [CrossRef] [PubMed]
- Quick, J.; Grubaugh, N.D.; Pullan, S.T.; Claro, I.M.; Smith, A.D.; Gangavarapu, K.; Burton, D.R.; Sabino, S.A.; Baylis, N.R.; Faria, M.; et al. Multiplex PCR method for MinION and Illumina sequencing of Zika and other virus genomes directly from clinical samples. Nat. Protoc. 2017, 12, 1261–1276. [Google Scholar] [CrossRef] [PubMed] [Green Version]
- Calus, S.T.; Ijaz, U.Z.; Pinto, A.J. NanoAmpli-Seq: A workflow for amplicon sequencing for mixed microbial communities on the nanopore sequencing platform. Gigascience 2018, 7, giy140. [Google Scholar] [CrossRef] [PubMed]
- Boykin, L.; Ghalab, A.; De Marchi, B.R.; Savill, A.; Wainaina, J.M.; Kinene, T.; Tairo, F.; Rodrigues, M.; Kehoe, J.; Ndunguru, F.; et al. Real time portable genome sequencing for global food security. F1000Research 2018, 7, 1101. [Google Scholar] [CrossRef] [Green Version]
- Stanton, J.A.L.; Muralidhar, A.; Rand, C.J.; Saul, D.J. Rapid extraction of DNA suitable for NGS workflows from bacterial cultures using the PDQeX. BioTechniques 2019, 66, 208–213. [Google Scholar] [CrossRef] [PubMed]
- Holmes, A.S.; Roman, M.G.; Hughes-Stamm, S. In-field collection and preservation of decomposing human tissues to facilitate rapid purification of STR typing. Forensic Sci. Int. Genet. 2018, 36, 124–129. [Google Scholar] [CrossRef] [PubMed]
- Wick, R.R. Porechop. Available online: https://github.com/rrwick/Porechop (accessed on 13 July 2018).
- Kearse, M.; Moir, R.; Wilson, A.; Stones-Havas, S.; Cheung, M.; Sturrock, S.; Buxton, S.; Cooper, A.; Markowitz, S.; Duran, C.; et al. Geneious Basic: An integrated and extendable desktop software platform for the organization and analysis of sequence data. Bioinformatics 2012, 28, 1647–1649. [Google Scholar] [CrossRef] [PubMed]
- Altschul, S.F.; Gish, W.; Miller, W.; Myers, E.W.; Lipman, D.J. Basic local alignment search tool. J. Mol. Biol. 1990, 215, 403–410. [Google Scholar] [CrossRef]
- Gringer/Bioinfscripts: Tree Lab/Global River Release. Available online: https://doi.org/10.5281/zenodo.596663 (accessed on 6 June 2019).
- Huson, D.H.; Beier, S.; Flade, I.; Górska, A.; El-Hadidi, M.; Mitra, S.; Tappu, R.; Ruscheweyh, H.J.; Tappu, R. MEGAN community edition-interactive exploration and analysis of large-scale microbiome sequencing data. PLoS Comput. Biol. 2016, 12, e1004957. [Google Scholar] [CrossRef] [PubMed]
- Wood, D.E.; Salzberg, S.L. Kraken: Ultrafast metagenomic sequence classification using exact alignments. Genome Biol. 2014, 15, R46. [Google Scholar] [CrossRef] [PubMed]
- Maxikraken2_1903_140GB (March 2019, 140GB). Available online: https://lomanlab.github.io/mockcommunity/mc_databases.html#maxikraken2_1903_140gb-march-2019-140gb (accessed on 12 April 2019).
- The Seed (Amendments) Regulations. Gazette of the United Republic of Tanzania No. 3, Vol. 98 5–13. 2017.


| 1. Sample Collection Plants |
| Envelopes |
| 4 fine Sharpie markers |
| Notebook |
| Scissors |
| Canvas sling bag to carry sample collection equipment |
| Gloves |
| 2. Sample collection whiteflies |
| Pooter |
| 70% ETOH |
| Eppendorf tubes |
| Transfer pipette to get the whitefly from the pooter to the Eppendorf tube |
| 3. Lab under a tree/disease diagnostic camp |
| Blanket/floor covering |
| Hard flat surface- raised |
| 4. Sample homogenization |
| 1 microfuge tube/sample |
| 1 mL tips with fine tip sealed to form pestle for crushing |
| Tip disposal/waste bags |
| 1.5 mL racks for holding |
| p10, p1000, p200 pipette (one set of pipettes)- tips for all 1 box |
| 5. DNA extraction |
| 2 MicroGEM kits (transported at ambient temperature) |
| PDQeX phytoGEM kit for plants |
| PDQex Universal kit for insects |
| Reagents lyophilized into 200 µL tubes |
| Rack for 200 µL microcentrifuge tubes |
| Nuclease free water |
| PDQeX thermal device |
| PDQeX Extraction tubes |
| Mobile phone being used as a remote controller- MicroGEM PDQeX app |
| Battery 2 12 V batteries put together |
| 6. Save the DNA for later quantification using fluorometry (e.g, Qubit). |
| 7. Library prep |
| Printed library prep protocol or iPad |
| Library kit |
| 200 µL tubes |
| 1.5 mL tubes |
| Ampure beads |
| Magnetic rack |
| Tube stands for the 0.2 mL |
| Tris and sodium chloride |
| Nuclease free water |
| Styrofoam cooler and cold packs |
| Flow cell |
| MinIT |
| Laptop Power bank—one with a pin plug not just USB output |
| Laptop- with MinKNOW installed |
| Sample | Barcode | Variety | Severity Score | Tissue Type | Total Reads | Max. Seq Length | CMV Blast Hits | Max. CMV Length | Min CMV Length | % CMV Reads | Canu Contigs |
|---|---|---|---|---|---|---|---|---|---|---|---|
| Tanzania | |||||||||||
| 1 | 1 | Kilati—Local Variety | 4 | Leaf | 61,317.0 | 26,107.0 | 125.0 | 2808.0 | 196.0 | 0.204 | 0 |
| 3 | 3 | Kilati—Local Variety | 4 | Leaf | 21,468.0 | 16,098.0 | 14.0 | 815.0 | 288.0 | 0.065 | 0 |
| 4 | 4 | Kasuxsali—Local Variety | 3 | Leaf | 31,300.0 | 17,624.0 | 21.0 | 941.0 | 129.0 | 0.067 | 12 |
| 5 | 5 | Mkombozi—Virus Resistant | 1 | Leaf | 2117.0 | 24,665.0 | 7.0 | 815.0 | 198.0 | 0.331 | 0 |
| 6 | 6 | Mkombozi—Virus Resistant | 1 | Leaf | 27,178.0 | 12,340.0 | 8.0 | 826.0 | 85.0 | 0.029 | 0 |
| 7 | 7 | Mkombozi— Virus Resistant | 1 | Leaf | 5634.0 | 17,003.0 | 5.0 | 484.0 | 243.0 | 0.089 | 0 |
| 8 | 8 | Whitefly close to Mkombozi—Virus Resistant | 1 | 1× Whitefly, in EtOH | 6237.0 | 8753.0 | 26.0 | 828.0 | 52.0 | 0.417 | 0 |
| 9 | 9 | Whitefly close to Mkombozi—Virus Resistant | 1 | 1× Whitefly, in EtOH | 25,289.0 | 17,900.0 | 3.0 | 0.0 | 0.0 | 0 | 2 |
| 10 | 10 | Whitefly close to Mkombozi—Virus Resistant | 1 | 1× Whitefly, in EtOH | 798.0 | 23,259.0 | 21.0 | 815.0 | 187.0 | 2.632 | 0 |
| 11 | 11 | ACMV—Positive Control DNA | 10,966.0 | 28,541.0 | 4311.0 | 1598.0 | 31.0 | 39.312 | 0 | ||
| 12 | 12 | EACMV—Positive Control DNA | 1797.0 | 22,871.0 | 9.0 | 830.0 | 191.0 | 0.501 | 0 | ||
| None | None | Porechop unable to match to Rapid Barcode | 449,981.0 | 276,793.0 | 8136.0 | 2757.0 | 28.0 | 1.808 | |||
| Uganda | |||||||||||
| 1 * | 1 | R39-B1-UG15F289P503 | 4 | Leaf from stem 1 | 24,343.0 | 24,373.0 | 20.0 | 1222.0 | 123.0 | 0.082 | 2 |
| 1.1 * | 2 | R39-B1-UG15F289P503 | 4 | Phloem, stem 1—top | 5135.0 | 50,184.0 | 0.0 | 0.0 | 0.0 | 0 | 0 |
| 1.2 * | 3 | R39-B1-UG15F289P503 | 4 | Phloem, stem 1—mid | 4010.0 | 9768.0 | 0.0 | 0.0 | 0.0 | 0 | 0 |
| 1.3 * | 4 | R39-B1-UG15F289P503 | 4 | Phloem, stem 1—bottom | 10,314.0 | 48,265.0 | 1.0 | 402.0 | 402.0 | 0.010 | 0 |
| 5 | 5 | Kwatempale from Sarah’s Farm | 4 | Leaf | 3012.0 | 66,062.0 | 11.0 | 604.0 | 107.0 | 0.365 | 0 |
| 6 | 6 | Kwatempale from Sarah’s Farm | 5 | Leaf | 5074.0 | 5243.0 | 1.0 | 235.0 | 235.0 | 0.020 | 0 |
| 7 | 7 | Wild Plant from Naomi’s Farm | 3 | Leaf | 16,386.0 | 45,024.0 | 6.0 | 1121.0 | 352.0 | 0.037 | 0 |
| 9 | 8 | Sick branch from NAROCass1 from Naomi’s Farm | 3 | Leaf | 37,822.0 | 20,509.0 | 15.0 | 2021.0 | 166.0 | 0.040 | 12 |
| WF5 | 9 | Whitefly from sample 5 | 4 | 1× Whitefly, no EtOH | 347.0 | 41,599.0 | 0.0 | 0.0 | 0.0 | 0 | 0 |
| WF7 | 10 | Whitefly from sample 7 | 3 | 1× Whitefly, no EtOH | 2613.0 | 2613.0 | 0.0 | 0.0 | 0.0 | 0 | 0 |
| WF8 | 11 | Whitefly from sample 8 | 1 | 1× Whitefly, no EtOH | 705.0 | 15,596.0 | 0.0 | 0.0 | 0.0 | 0 | 0 |
| None * | None | Porechop unable to match to Rapid Barcode | 196,290.0 | 267,436.0 | 59.0 | 1677.0 | 42.0 | 0.030 | |||
| Kenya | |||||||||||
| 1 | 1 | Local | 1 | Leaf | 43,049.0 | 39,851.0 | 1.0 | 123.0 | 123.0 | 0.002 | 1 |
| 2 | 2 | Local | 1 | Leaf | 15,890.0 | 66,540.0 | 0.0 | 0.0 | 0.0 | 0 | 0 |
| 4 | 4 | Local | 1 | Leaf | 38,291.0 | 53,843.0 | 3.0 | 890.0 | 251.0 | 0.008 | 1 |
| 5 | 5 | Local | 1 | Leaf | 9213.0 | 44,230.0 | 0.0 | 0.0 | 0.0 | 0 | 0 |
| L1 * | 6 | Stem from CMB infected plant | 4 | Leaf | 28,450.0 | 18,287.0 | 219.0 | 2228.0 | 98.0 | 0.770 | 3 |
| L2 * | 7 | Stem from CMB infected plant | 4 | Leaf | 17,320.0 | 42,191.0 | 76.0 | 2127.0 | 78.0 | 0.439 | 0 |
| S1 * | 8 | Stem from CMB infected plant | 4 | Phloem, 22.5cm from tip | 16,310.0 | 24,566.0 | 10.0 | 1485.0 | 269.0 | 0.061 | 0 |
| S2 * | 9 | Stem from CMB infected plant | 4 | Phloem, 52.3cm from tip | 5346.0 | 54,245.0 | 0.0 | 0.0 | 0.0 | 0 | 0 |
| R1 * | 10 | Stem from CMB infected plant | 4 | Root 1, under outer bark | 7336.0 | 15,689.0 | 0.0 | 0.0 | 0.0 | 0 | 0 |
| R2 * | 11 | Stem from CMB infected plant | 4 | Root 2, under outer bark | 21,576.0 | 24,853.0 | 0.0 | 0.0 | 0.0 | 0 | 0 |
| H1 * | 12 | Leaf from Healthy Plant | 1 | Leaf | 44,295.0 | 33,307.0 | 0.0 | 0.0 | 0.0 | 0 | 3 |
| None | None | Porechop unable to match to Rapid Barcode | 245,390.0 | 265,898.0 | 75.0 | 2404.0 | 28.0 | 0.031 | |||
| Totals | 492,466.0 | 56,958.3 | |||||||||
| Total Reads | Reads Classified | Manihot esculenta | EACMV | ACMV | TLCV | Begomo-associated DNA-III | Bemisia tabaci | Bemisia afer | Candidatus Portiera aleyrodidarum | Other | |
|---|---|---|---|---|---|---|---|---|---|---|---|
| Tanzania | |||||||||||
| 1 | 61,317 | 23,481 | 15,862 | 63 | - | 1 | |||||
| 3 | 21,468 | 5407 | 3509 | 5 | |||||||
| 4 | 31,309 | 10,561 | 6462 | 2 | 5 | 1 | |||||
| 5 | 2117 | 325 | 144 | 2 | 3 | 3 | |||||
| 6 | 27,178 | 2127 | 76 | 1 | 521 | 67 | 802 | ||||
| 7 | 5634 | 1141 | 669 | 1 | |||||||
| 8 | 6237 | 1449 | 88 | 5 | 912 | 15 | |||||
| 9 | 25,289 | 2303 | 126 | 2 | 506 | 57 | 905 | ||||
| 10 | 789 | 166 | 66 | 3 | 11 | 2 | |||||
| 11 | 10,966 | 7843 | 69 | 3 | 616 | 2 | |||||
| 12 | 1797 | 356 | 171 | 2 | 13 | 7 | |||||
| Uganda | |||||||||||
| 1 | 18,853 | 5662 | 3073 | 11 | 1 | ||||||
| 1.1 | 5135 | 876 | 402 | ||||||||
| 1.2 | 4010 | 1034 | 591 | ||||||||
| 1.3 | 10,314 | 1933 | 864 | 1 | |||||||
| 5 | 3012 | 556 | 255 | 1 | 7 | ||||||
| 6 | 5074 | 758 | 39 | 1 | |||||||
| 7 | 16,386 | 4608 | 2666 | 4 | |||||||
| 9 | 37,822 | 12,768 | 7268 | 10 | |||||||
| WF5 | 347 | 51 | 20 | 10 | |||||||
| WF7 | 243 | 48 | 21 | ||||||||
| WF8 | 705 | 128 | 35 | 9 | 1 | ||||||
| Kenya | |||||||||||
| 1 | 43,049 | 10,283 | 9947 | 1 | 1 | 1 | |||||
| 2 | 15,890 | 2968 | 2854 | ||||||||
| 4 | 38,291 | 8648 | 8836 | 1 | 1 | ||||||
| 5 | 8213 | 1959 | 1887 | ||||||||
| L1 | 28,450 | 9968 | 9580 | 45 | 81 | SLCV (1) | |||||
| L2 | 17,320 | 4367 | 2050 | 29 | 4 | ||||||
| S1 | 16,310 | 3718 | 1933 | 5 | 1 | 1 | |||||
| R1 | 7336 | 2303 | 1016 | ||||||||
| R2 | 21,578 | 6810 | 2000 | ||||||||
| H1 | 44,295 | 15,537 | 8389 | 1 |
© 2019 by the authors. Licensee MDPI, Basel, Switzerland. This article is an open access article distributed under the terms and conditions of the Creative Commons Attribution (CC BY) license (http://creativecommons.org/licenses/by/4.0/).
Share and Cite
Boykin, L.M.; Sseruwagi, P.; Alicai, T.; Ateka, E.; Mohammed, I.U.; Stanton, J.-A.L.; Kayuki, C.; Mark, D.; Fute, T.; Erasto, J.; et al. Tree Lab: Portable Genomics for Early Detection of Plant Viruses and Pests in Sub-Saharan Africa. Genes 2019, 10, 632. https://doi.org/10.3390/genes10090632
Boykin LM, Sseruwagi P, Alicai T, Ateka E, Mohammed IU, Stanton J-AL, Kayuki C, Mark D, Fute T, Erasto J, et al. Tree Lab: Portable Genomics for Early Detection of Plant Viruses and Pests in Sub-Saharan Africa. Genes. 2019; 10(9):632. https://doi.org/10.3390/genes10090632
Chicago/Turabian StyleBoykin, Laura M., Peter Sseruwagi, Titus Alicai, Elijah Ateka, Ibrahim Umar Mohammed, Jo-Ann L. Stanton, Charles Kayuki, Deogratius Mark, Tarcisius Fute, Joel Erasto, and et al. 2019. "Tree Lab: Portable Genomics for Early Detection of Plant Viruses and Pests in Sub-Saharan Africa" Genes 10, no. 9: 632. https://doi.org/10.3390/genes10090632