Natural Radioactivity of Laterite and Volcanic Rock Sample for Radioactive Mineral Exploration in Mamuju, Indonesia


 , ,
, ,
Abstract
:1. Introduction
2. Materials and Methods
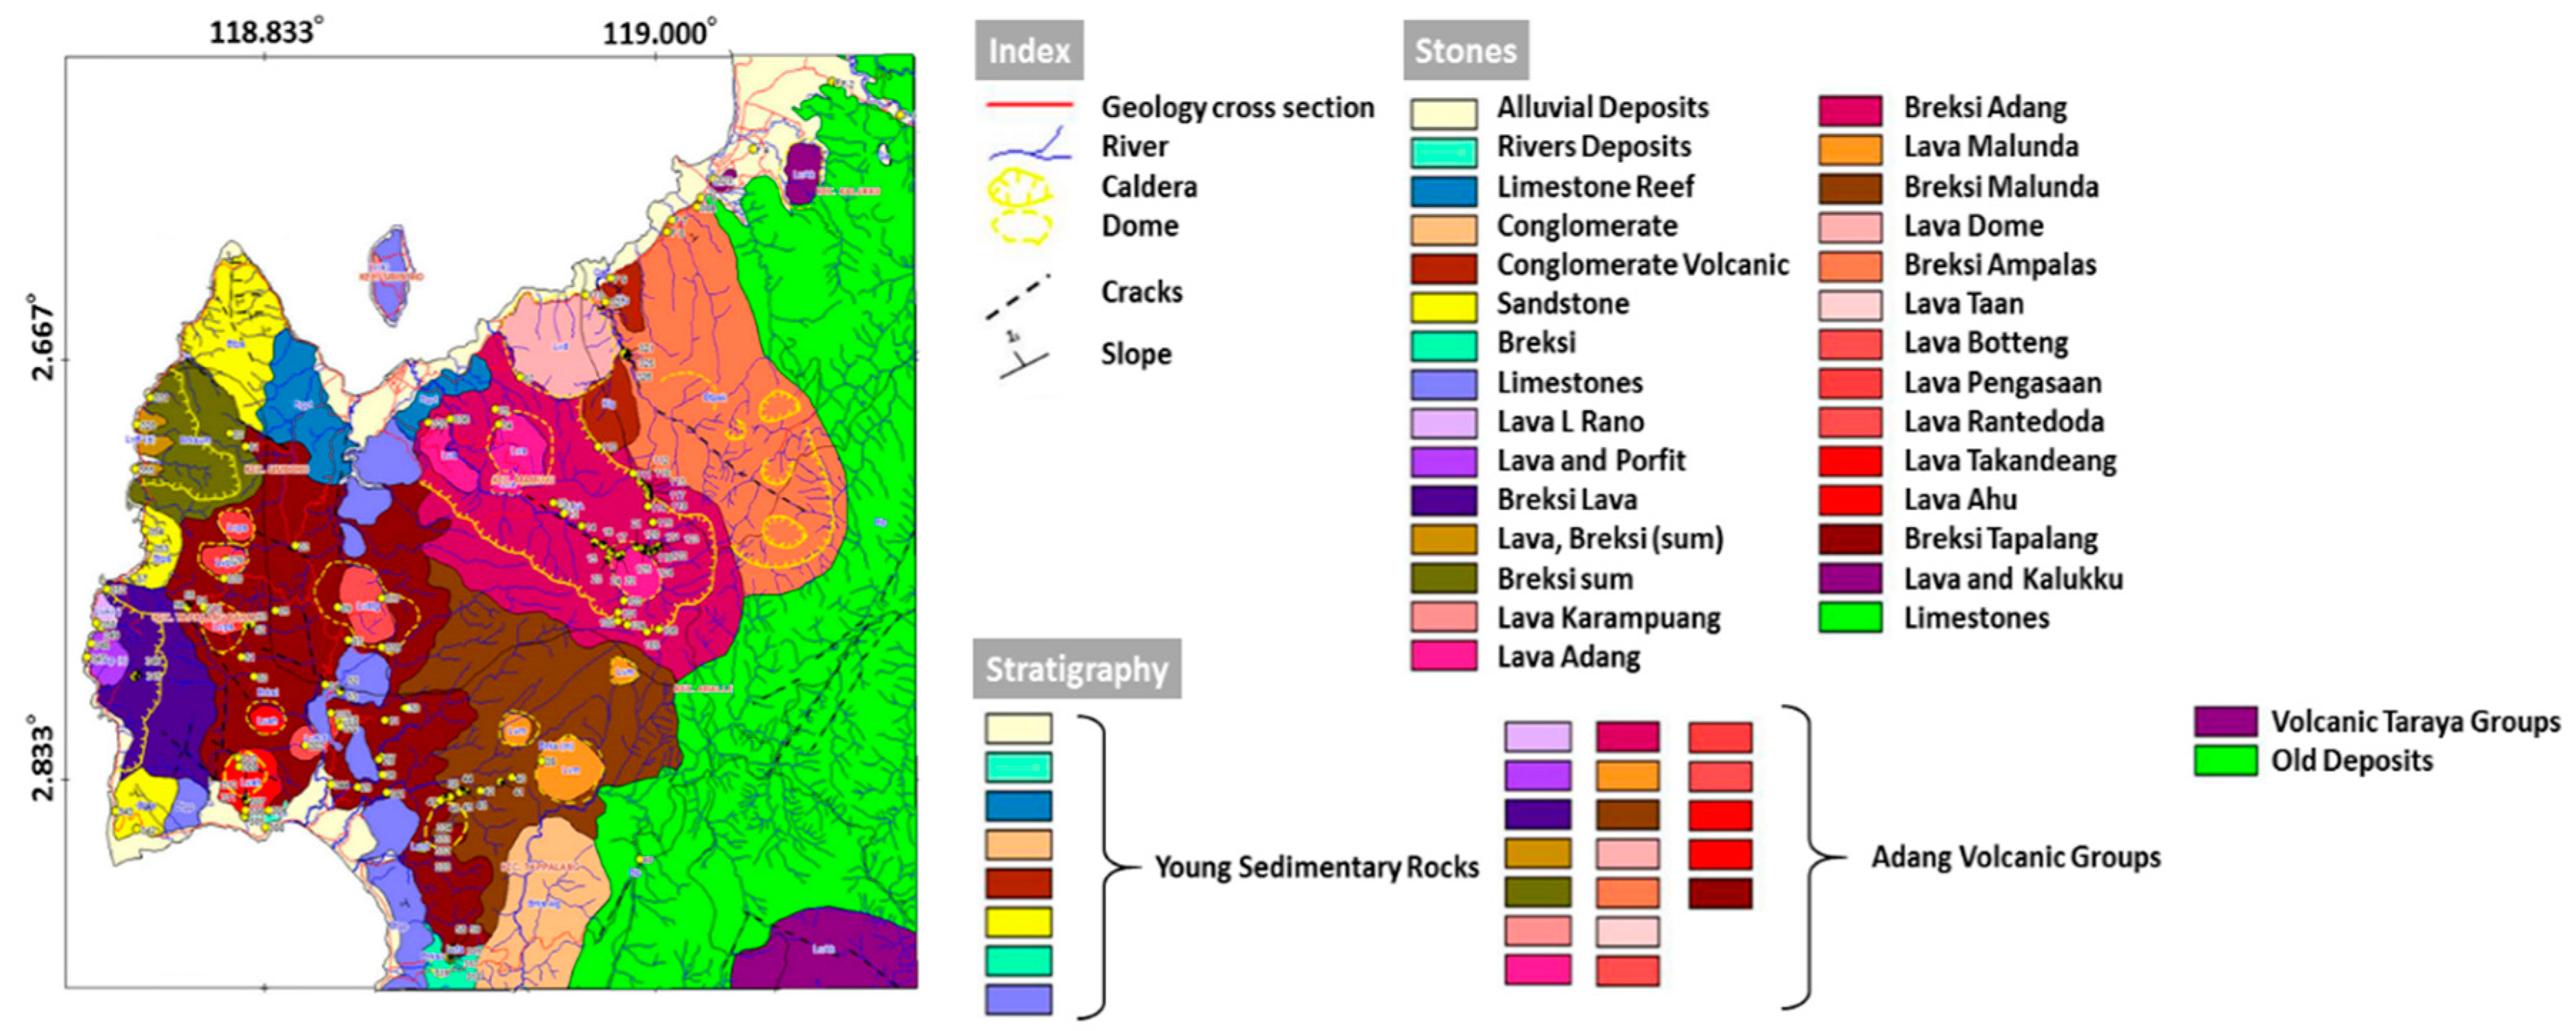
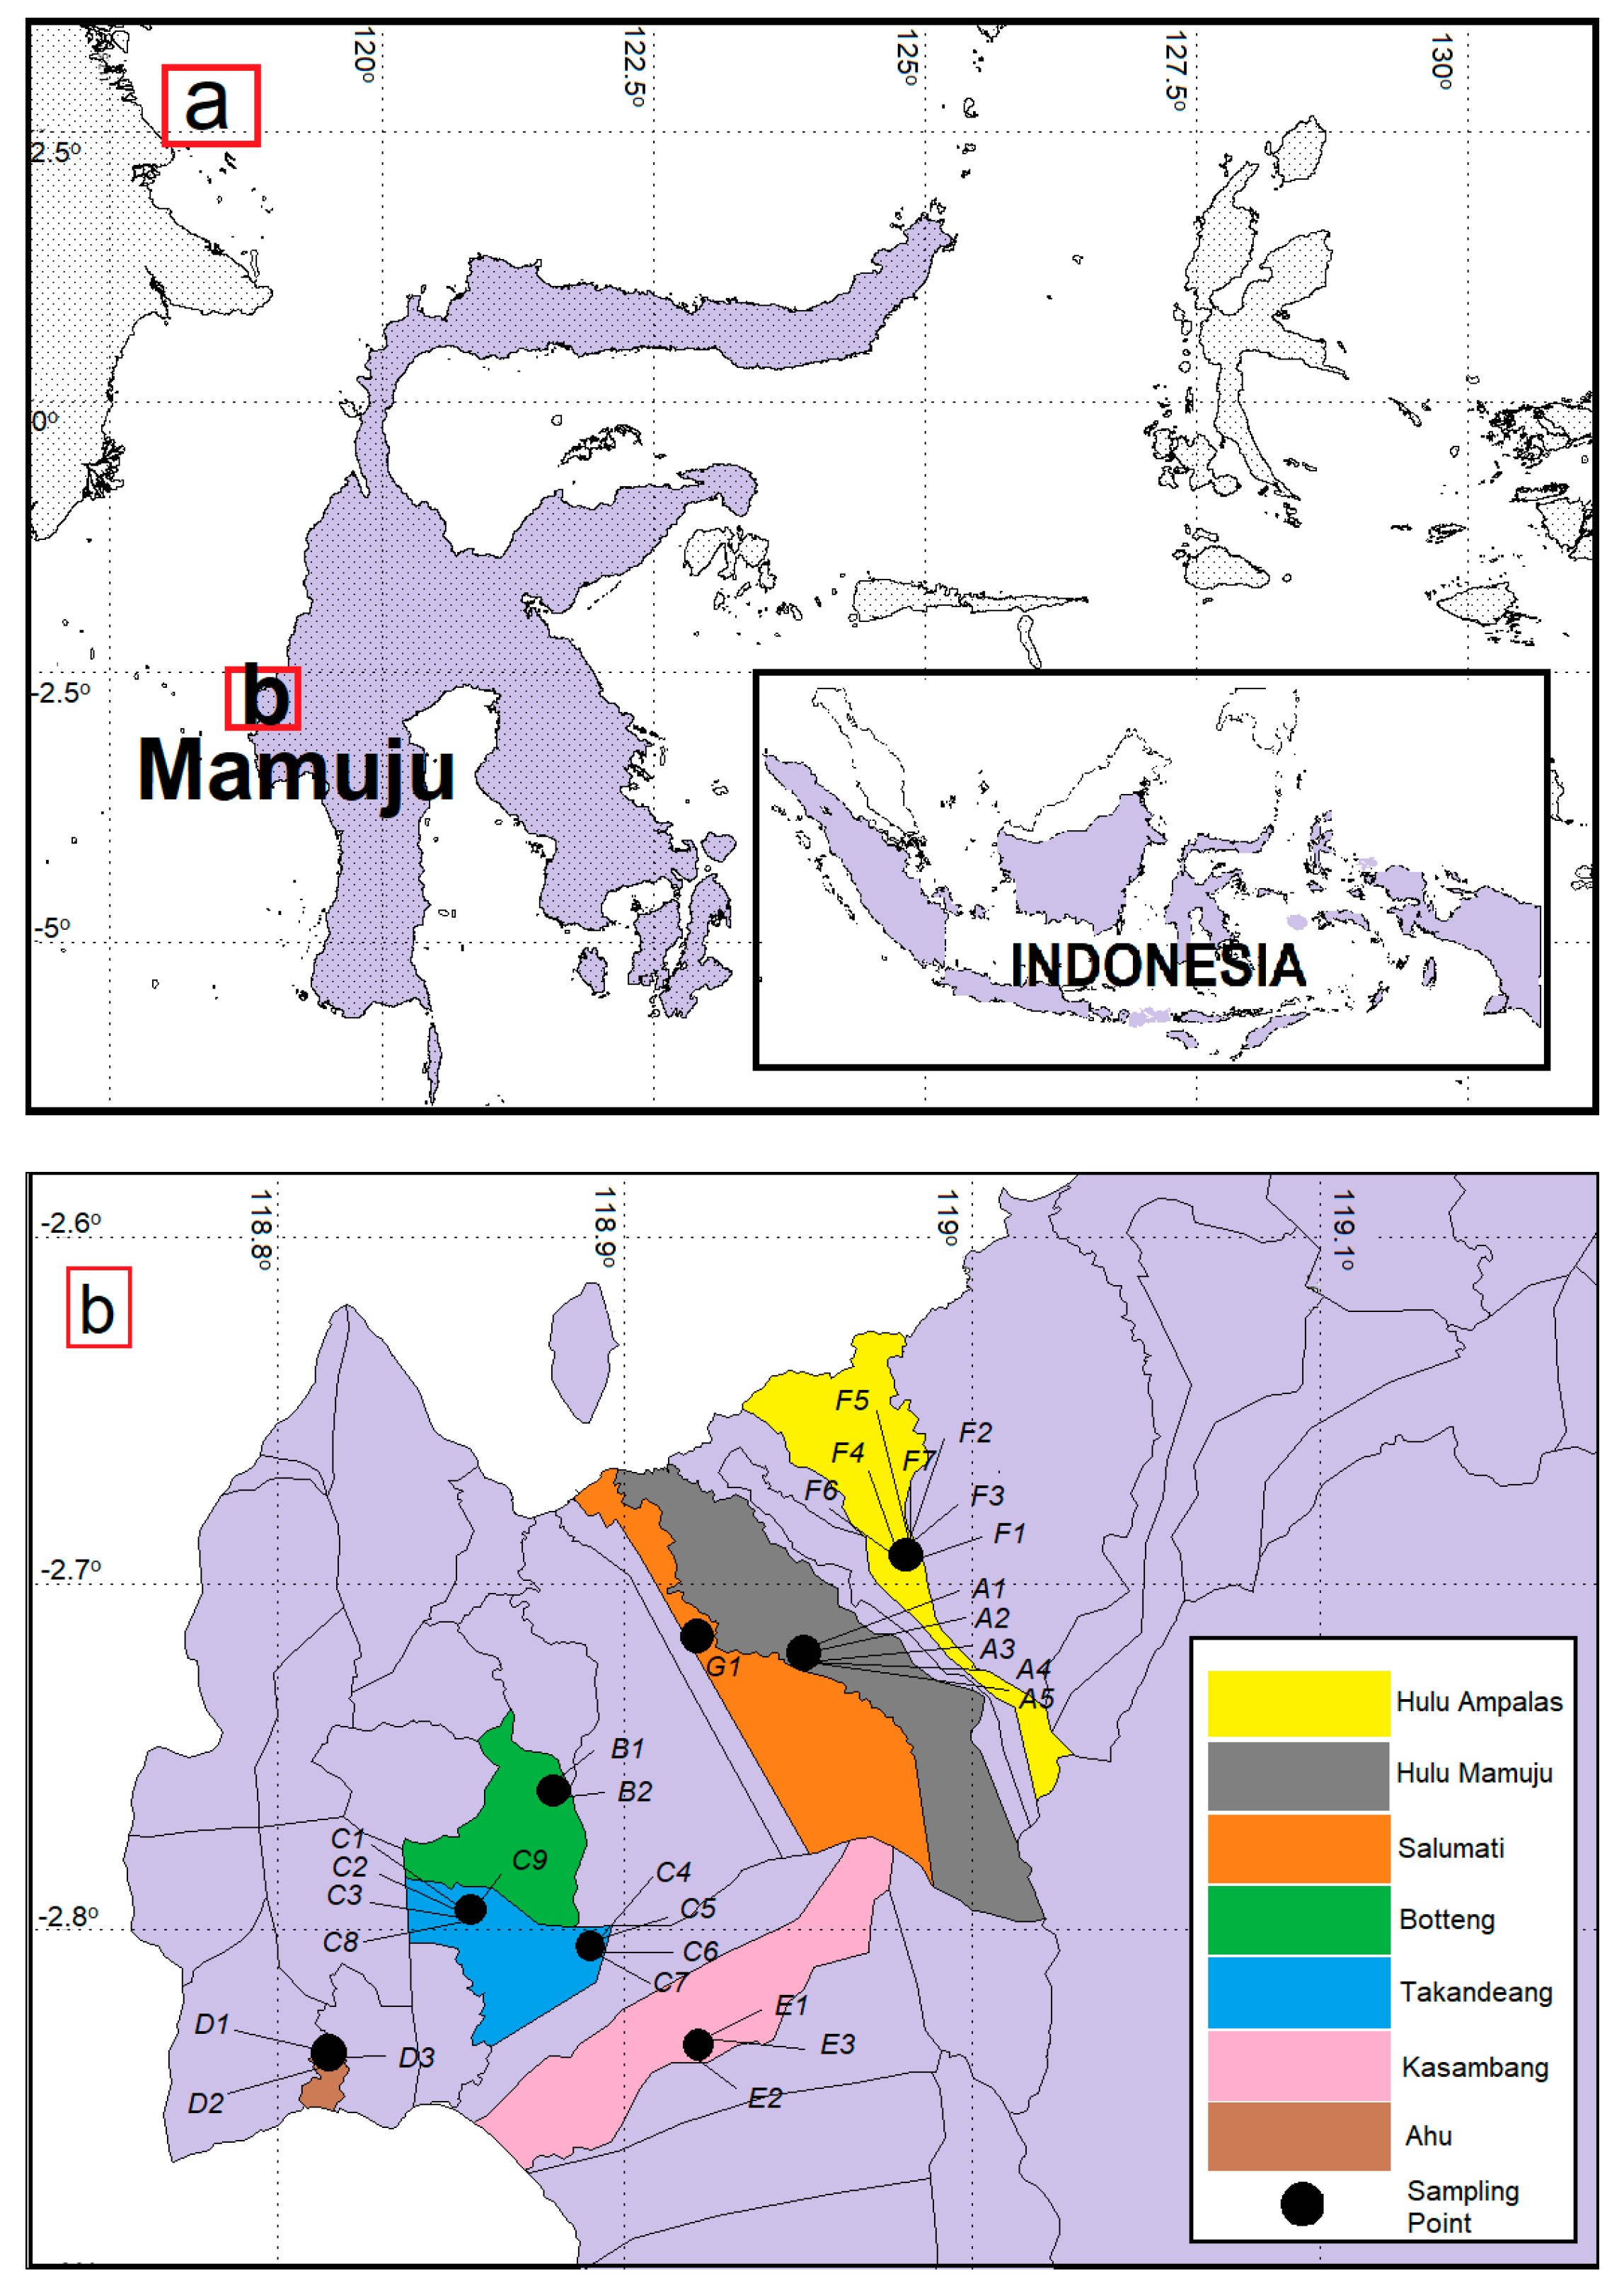
2.1. Study Area
2.2. Identification of Elements
2.3. Radioactivity Measurement
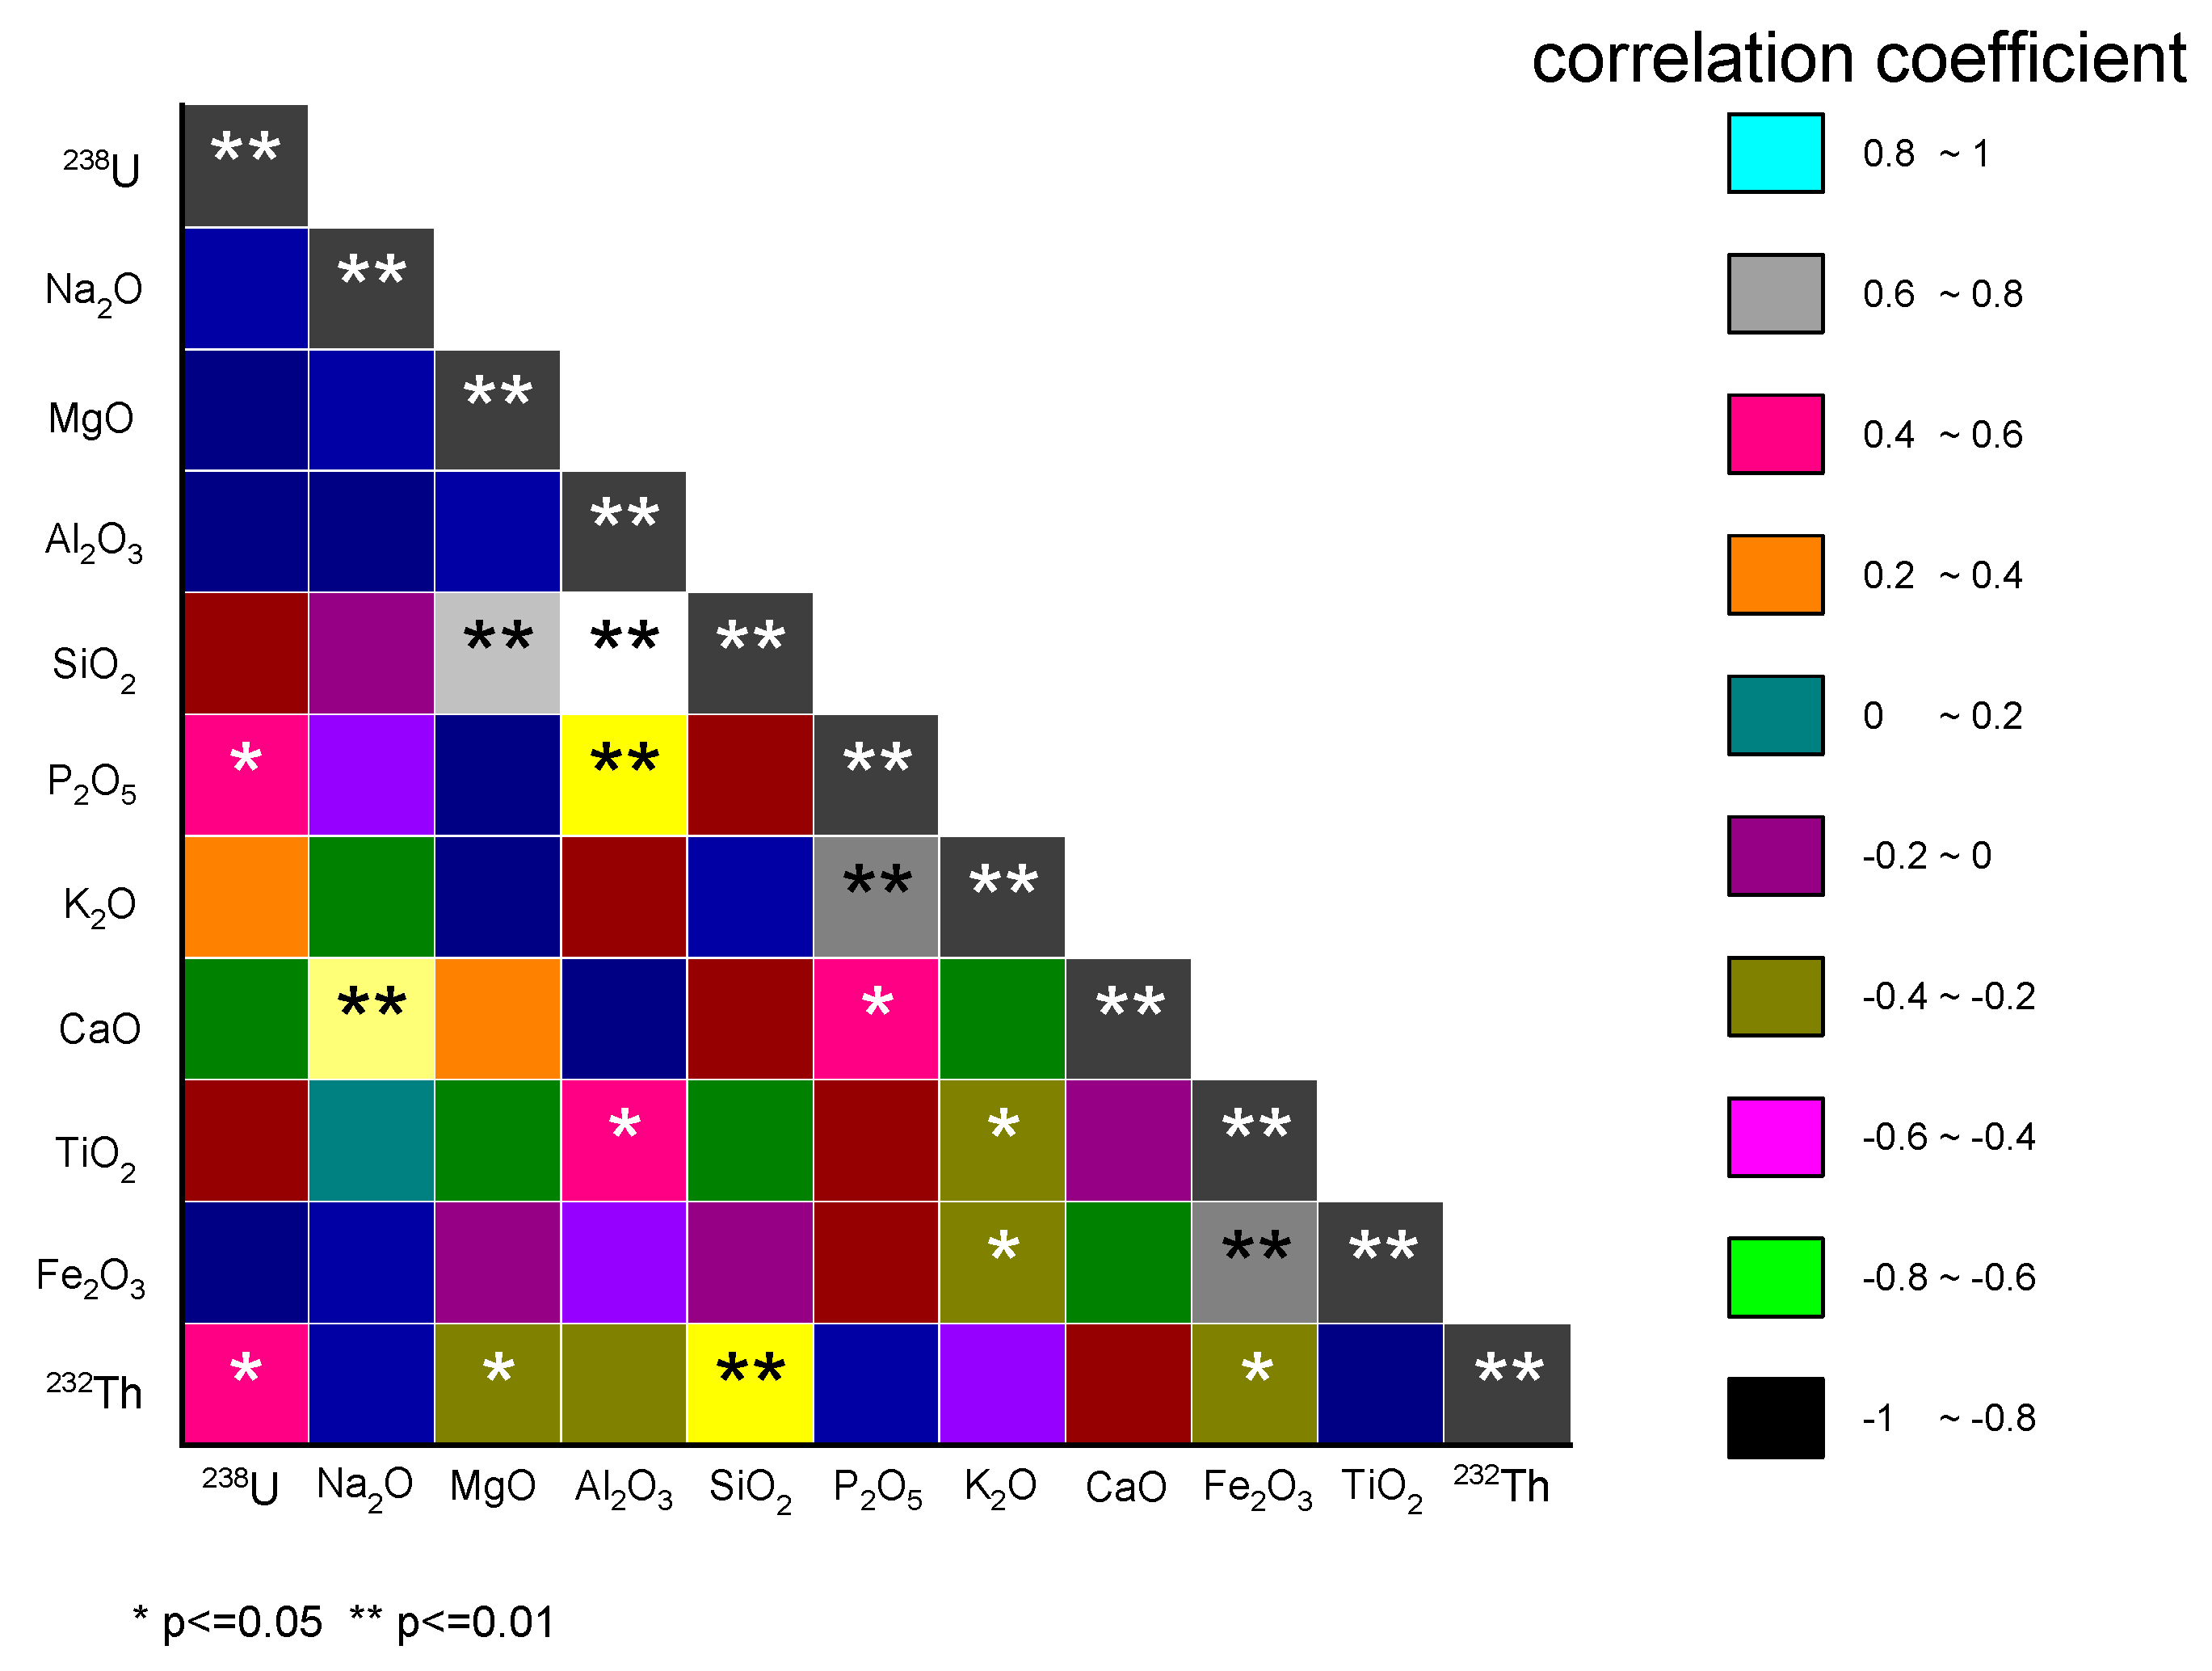
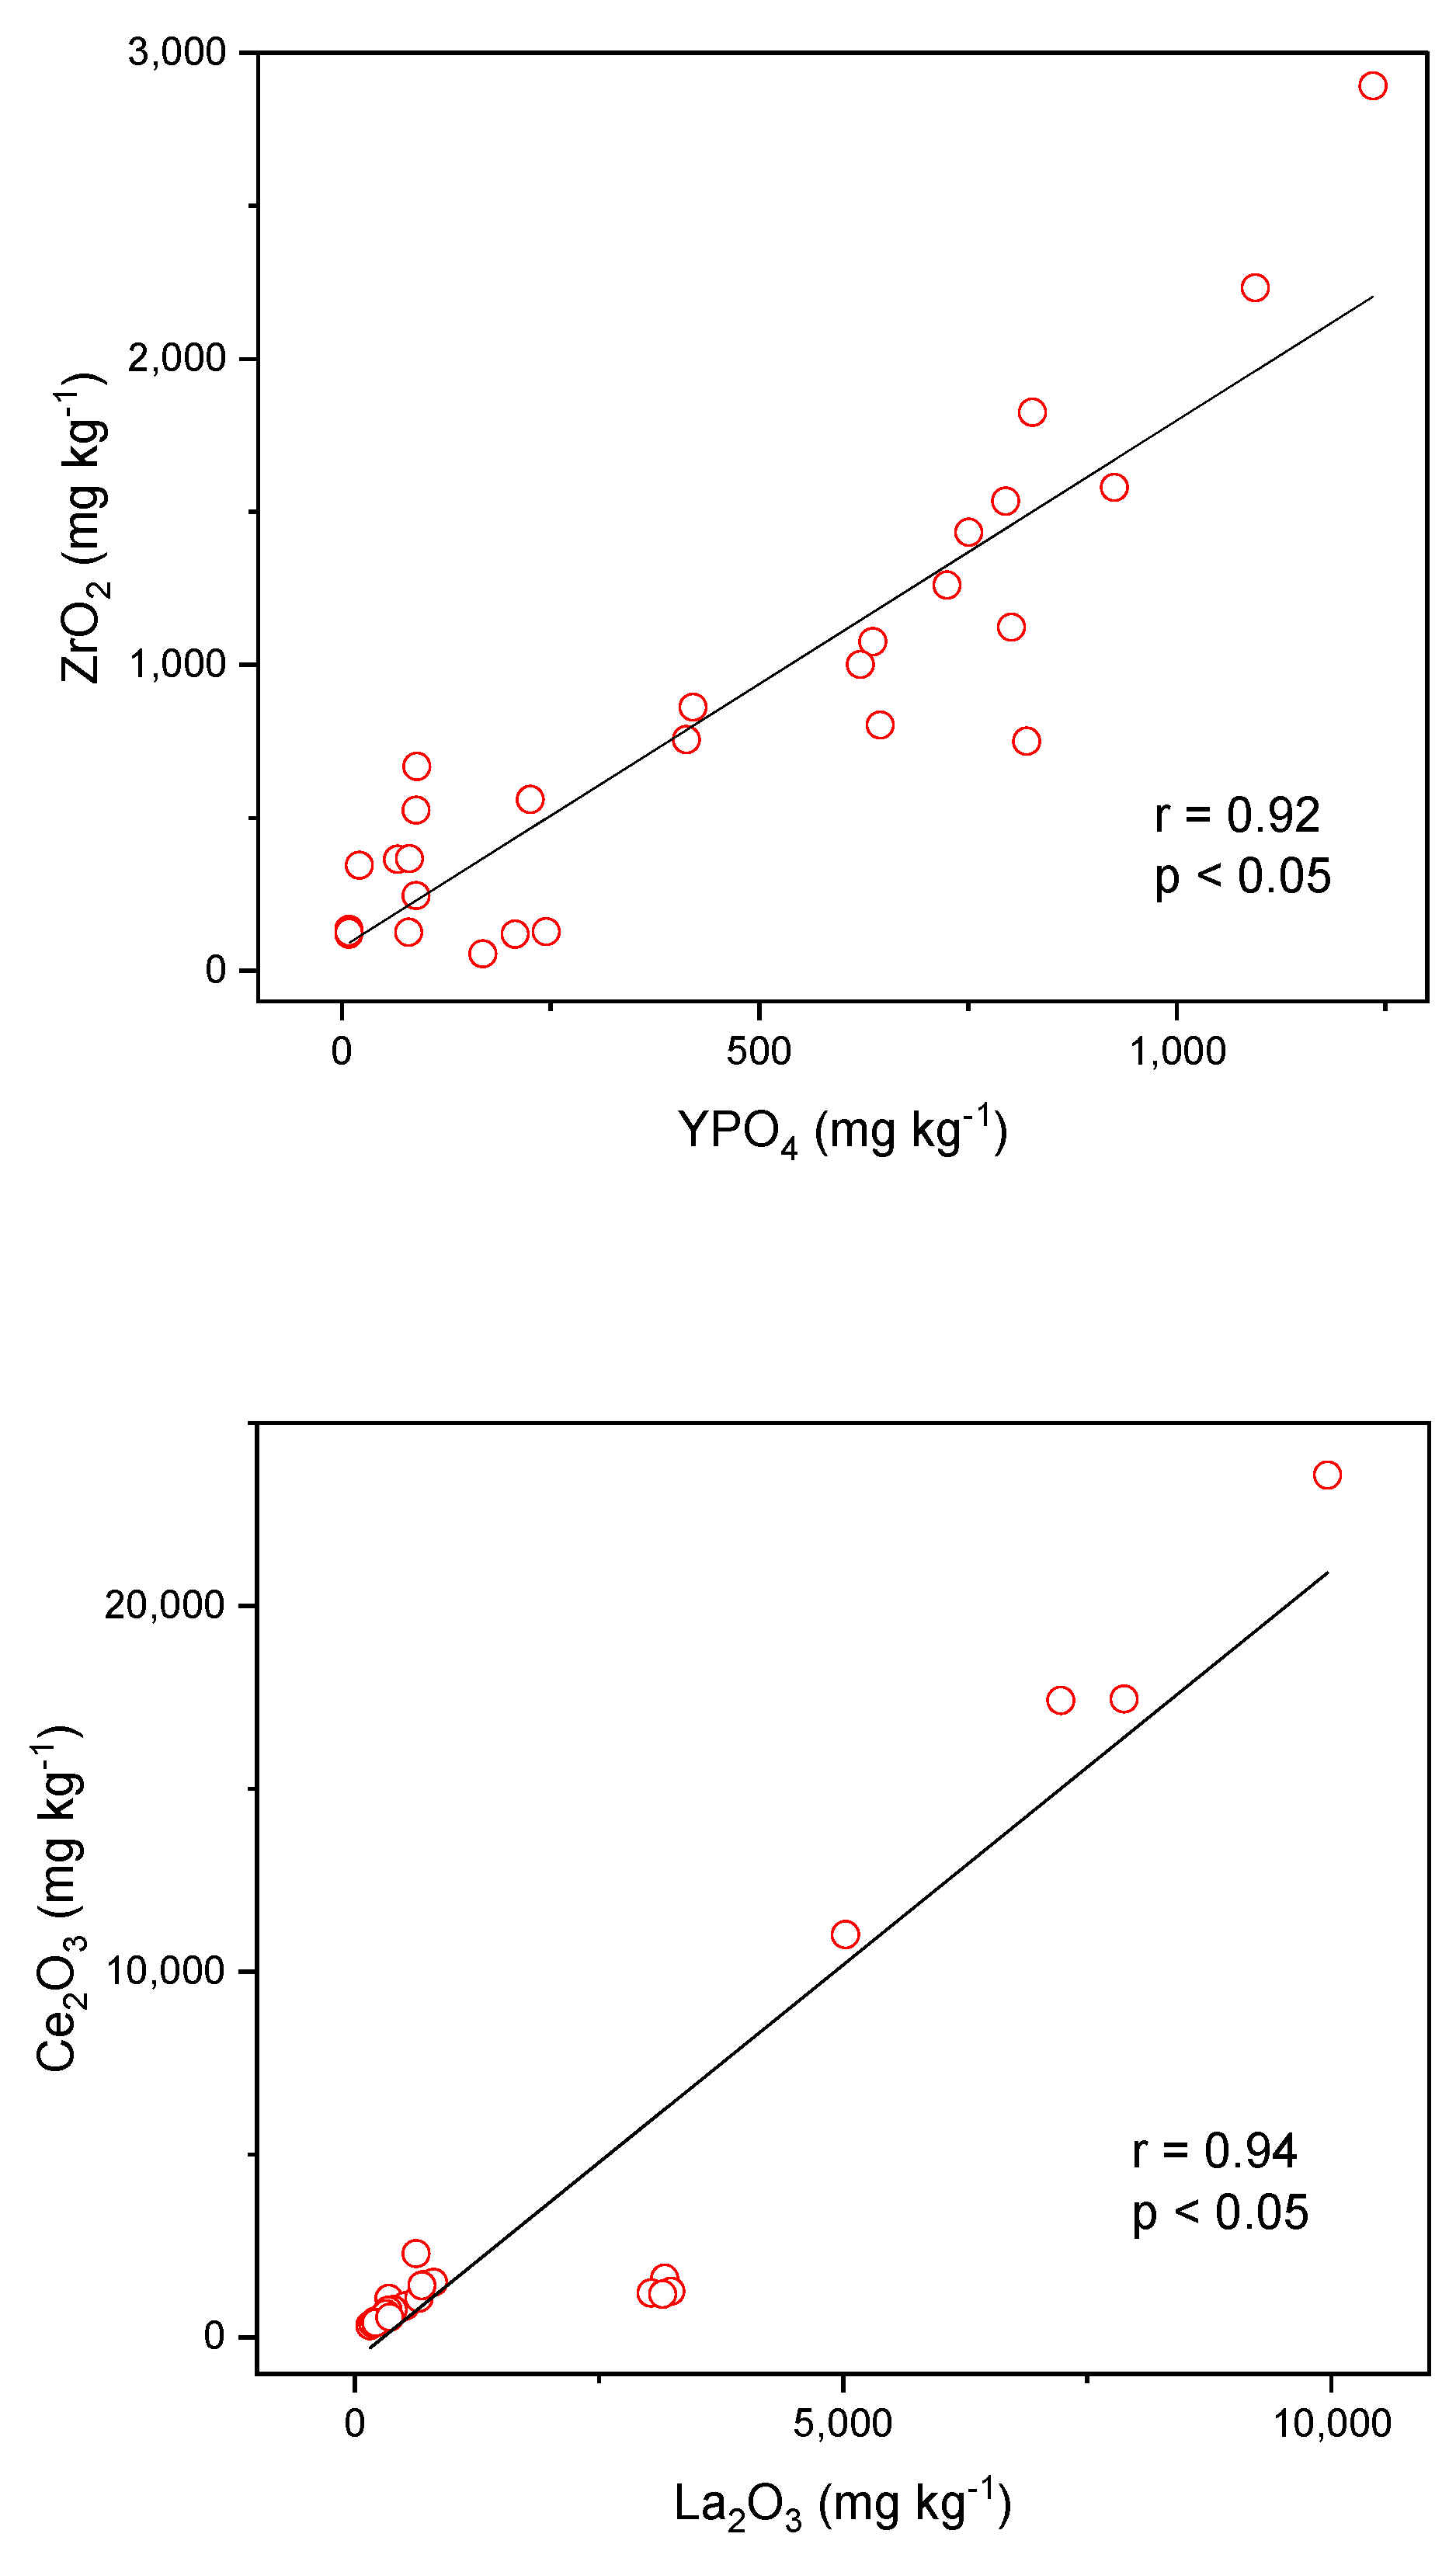
2.4. Statistical Analysis
3. Results
4. Discussion
5. Conclusions
Author Contributions
Funding
Conflicts of Interest
References
- Alatas, Z.; Lusiyanti, Y.; Sofiati, P.; Dwi, R.; Viria, S. Cytogenetic response of population in high natural radiation areas in Mamuju regency, West Sulawesi. J. Sains Indones. Nucl. Tech. 2012, 13, 1–5. [Google Scholar]
- Eka, D.N.; Hosoda, M.; Kusdiana; Winarni, I.D.; Prihantoro, A.; Suzuki, T.; Tamakuma, Y.; Akata, N.; Tokonami, S. Dose assessment of radium-226 in drinking water from Mamuju, a high background radiation area of Indonesia. Radiat. Environ. Med. 2020, 9, 79–83. [Google Scholar]
- Heri, S.; Sukadana, I.G.; Sumaryanto, A. Radiometric mapping for naturally occurring radioactive material (NORM) assessment in Mamuju, West Sulawesi. IAJ 2014, 40, 33–39. [Google Scholar]
- Sukadana, I.G.; Indrastomo, F.; Syaeful, H. Geology and radionuclide ratio mapping for radioactive mineral exploration in Mamuju, West Sulawesi. In Proceedings of the Seminar Nasional Teknologi Energi Nuklir, Bali, Indonesia, 15–16 October 2015; Volume 1, pp. 140–147. [Google Scholar]
- Sukadana, I.G.; Heri, S. Identification of mineralization type and specific radioactive minerals. J. East China Univ. Technol. 2016, 39, 36–45. [Google Scholar]
- Ratman, N.; Atmawinata, S. Geology Map of Mamuju-Sulawesi, 1st ed.; Pusat Penelitian dan Pengembangan Geologi: Bandung, Indonesia, 1993. [Google Scholar]
- Indrastomo, F.D.I.; Gde, S.; Saepuloh, A.; Harsolumakso, A.H.; Datu, K. Volcanostratigraphy interpretation of mamuju area based on landsat-8 imagery analysis. Eksplorium 2016, 36, 71–88. [Google Scholar] [CrossRef]
- Cuney, M.; Emetz, A.; Mercadier, J.; Mykchaylov, V.; Shunko, V.; Yuslenko, A. Uranium deposits associated with na-metasomatism from central Ukraine: A review of some of the major deposits and genetic constraints. Ore Geol. Rev. 2012, 44, 82–106. [Google Scholar] [CrossRef]
- Min, M.; Chen, J.; Wang, J.; Wei, G.; Fayek, M. Mineral paragenesis and textures associated with sandstonehosted roll-front uranium deposits, Nw China. Ore Geol. Rev. 2005, 26, 51–69. [Google Scholar] [CrossRef]
- Cuney, M. The extreme diversity of uranium deposits. Miner. Depos. 2009, 44, 3–9. [Google Scholar] [CrossRef]
- Salman, A.; Ahmed, Z.; Allam, K.; El-Sharkawy, S. A comparative study for 235U radioactivity concentration calculation methods in phosphate samples. Radiat. Prot. Environ. 2019, 42, 5. [Google Scholar] [CrossRef]
- Liu, C. Determination of uranium isotopic ratio (235U/238U) using extractive electrospray ionization tandem mass spectrometry. J. Anal. At. Spec. 2011, 26, 2045–2051. [Google Scholar] [CrossRef] [Green Version]
- Ivanovich, M.; Harmon, R.S. Uranium Series Disequilibrium: Applications to Earth, Marine, and Environmental Sciences; Clarendon Press: Oxford, UK, 1992. [Google Scholar]
- Mishra, S.; Kasar, S.; Takamasa, A.; Veerasamy, N.; Sahoo, S.K. Measurement of uranium distribution coefficient and 235U/238U ratio in soils affected by Fukushima dai-ichi nuclear power plant accident. J. Environ. Radioact. 2019, 198, 36–42. [Google Scholar] [CrossRef]
- Karangelos, D.; Anagnostakis, M.; Hinis, E.; Simopoulos, S.; Zunic, Z. Determination of depleted uranium in environmental samples by gamma-spectroscopic techniques. J. Environ. Radioact. 2004, 76, 295–310. [Google Scholar] [CrossRef]
- Hartono, U.S. Geology Sulawesi, 1st ed.; LIPI Press: Jakarta, Indonesia, 2013. [Google Scholar]
- Saleh, I.H.; Abdel-Hakim, A.A. Determination of depleted uranium using a high-resolution gamma-ray spectrometer and its applications in soil and sediments. J. Taibah Univ. Sci. 2016, 10, 205–211. [Google Scholar] [CrossRef]
- El-Gamal, A.; Saleh, I.H. Radiological and mineralogical investigation of accretion and erosion coastal sediments in Nile Delta region, Egypt. J. Oceanogr. Mar. Sci. 2012, 3, 41–55. [Google Scholar]
- Reguigui, N. Gamma Ray Spectrometry. Practical Information. 2006. Available online: https://www.researchgate.net/profile/Nafaa_Reguigui/publication/259533588_Gamma_Ray_Spectrometry/links/0046352c6cf29942b0000000.pdf (accessed on 18 September 2020).
- McKean, J.W.; Sheather, S.J. Encyclopedia of Physical Science and Technology, 3rd ed.; 2003; Available online: https://www.kriso.ee/encyclopedia-physical-science-technology-3rd-edition-db-9780122274107.html (accessed on 18 September 2020).
- United Nations Scientific Committee on the Effects of Atomic Radiation. UNSCEAR 2008 Report, Sources and Effects of Ionizing Radiation. Volume I: Annex B Exposures of the Public and Workers from Various Sources of Radiation; UNSCEAR: New York, NY, USA, 2010. [Google Scholar]
- Gaafar, I.; El-Shershaby, A.; Zeidan, I.; El-Ahll, L.S. Natural radioactivity and radiation hazard assessment of phosphate mining, Quseir-Safaga area, Central Eastern Desert, Egypt. NRIAG J. Astron. Geophys. 2016, 5, 160–172. [Google Scholar] [CrossRef] [Green Version]
- Vakanjac, B.; Rutherford, N.; Vakanjac, V.R.; Đumić, T.; Djordjević-Milošević, S. Distribution of Uranium and Rare Elements in Radioactive Phosphate-Bearing Anomalies in Southeast Mongolia. Minerals 2020, 10, 307. [Google Scholar] [CrossRef] [Green Version]
- Abdulqader, S.M.; Vakanjac, B.; Kovacevic, J.; Naunovic, Z.; Zdjelarevic, N. Natural radioactivity of intrusive-metamorphic and sedimentary rocks of the Balkan Mountain range (Serbia, Stara Planina). Minerals 2018, 8, 6. [Google Scholar] [CrossRef] [Green Version]


| Sample No. | Samples Code | Sedimentation Type | Rock Type | Rocks Name | GPS (UTM) | Location | ||
|---|---|---|---|---|---|---|---|---|
| Zone | East (m) | North (m) | ||||||
| 1 | A1 | Structure | Lava phonolite | Lava phonolite | 50 S | 721,567.00 | 9,696,880.00 | Hulu Mamuju |
| 2 | A2 | Structure | Lava phonolite | Lava phonolite | 50 S | 721,530.00 | 9,696,892.00 | Hulu Mamuju |
| 3 | A3 | Structure | Lava phonolite | Lava phonolite | 50 S | 721,774.00 | 9,696,416.00 | Hulu Mamuju |
| 4 | A4 | Structure | Lava phonolite | Lava phonolite | 50 S | 721,575.00 | 9,696,825.00 | Hulu Mamuju |
| 5 | A5 | Structure | Lava phonolite | Lava phonolite | 50 S | 721,827.00 | 9,696,745.00 | Hulu Mamuju |
| 6 | B1 | Strata | Phonolitoid | Phonolitoid | 50 S | 707,790.00 | 9,692,800.00 | Botteng |
| 7 | B2 | Strata | Phonolitoid | Phonolite | 50 S | 707,412.02 | 9,694,718.92 | Botteng |
| 8 | C1 | Structure | Autobreksi | Phonolite | 50 S | 705,746.00 | 9,688,196.00 | Takandeang |
| 9 | C2 | Structure | Autobreksi | Phonolite | 50 S | 705,746.00 | 9,688,196.00 | Takandeang |
| 10 | C3 | Structure | Autobreksi | Phonolite | 50 S | 705,746.00 | 9,688,196.00 | Takandeang |
| 11 | C4 | Laterite | Phonolitoid | Phonolitoid | 50 S | 709,486.00 | 9,689,203.00 | Rante Dunia |
| 12 | C5 | Laterite | Phonolitoid | Phonolitoid | 50 S | 709,486.00 | 9,689,203.00 | Rante Dunia |
| 13 | C6 | Laterite | Phonolitoid | Phonolitoid | 50 S | 709,486.00 | 9,689,203.00 | Rante Dunia |
| 14 | C7 | Laterite | Phonolitoid | Phonolitoid | 50 S | 709,486.00 | 9,689,203.00 | Rante Dunia |
| 15 | C8 | Structure | Autobreksi | Phonolite | 50 S | 705,746.00 | 9,688,196.00 | Takandeang |
| 16 | D1 | Laterite | Igneous | Phonolitee | 50 S | 703,255.00 | 9,689,161.00 | Ahu |
| 17 | C9 | Laterite | Igneous | Phonolite | 50 S | 704,674.00 | 9,689,566.00 | Takandeang |
| 18 | E1 | Strata | Sediment | Breksi | 50 S | 711,782.00 | 9,680,503.00 | Kasambang |
| 19 | E2 | Strata | Igneous | Phonolitoid | 50 S | 702,282.00 | 9,680,381.00 | kasambang |
| 20 | E3 | Strata | Igneous | Phonolitoid | 50 S | 712,050.00 | 9,680,507.00 | kasambang |
| 21 | D2 | Structure | Igneous | Phonolitoid | 50 S | 703,401.28 | 9,686,395.53 | Ahu |
| 22 | D3 | Strata | Igneous | Phonolitoid | 50 S | 703,734.50 | 9,685,494.98 | Ahu |
| 23 | F1 | Strata | Igneous | Phonolitoid | 50 S | 722,408.00 | 9,702,740.00 | Hulu Ampalas |
| 24 | F2 | Strata | Igneous | Phonolitoid | 50 S | 722,336.00 | 9,702,587.00 | Hulu Ampalas |
| 25 | F3 | Strata | Igneous | Phonolitoid | 50 S | 722,343.00 | 9,702,489.00 | Hulu Ampalas |
| 26 | F4 | Strata | Igneous | Phonolitoid | 50 S | 722,356.00 | 9,702,673.00 | Hulu Ampalas |
| 27 | F5 | Strata | Igneous | Phonolitoid | 50 S | 722,493.00 | 9,703,606.00 | Hulu Ampalas |
| 28 | F6 | Strata | Igneous | Phonolitoid | 50 S | 722,295.00 | 9,702,362.00 | Hulu Ampalas |
| 29 | F7 | Strata | Igneous | Phonolitoid | 50 S | 722,396.00 | 9,704,904.00 | Hulu Ampalas |
| 30 | G1 | Strata | Igneous | Phonolitoid | 50 S | 705,443.00 | 9,689,232.00 | Salumati |
| Sample | Na2O | MgO | Al2O3 | SiO2 | P2O5 | K2O | CaO | TiO2 | Fe2O3 |
|---|---|---|---|---|---|---|---|---|---|
| % | % | % | % | % | % | % | % | % | |
| 1 | 7.5 ± 0.2 | 0.3 ± 0.1 | 2.8 ± 0.1 | 11.6 ± 0.4 | 1.6 ± 0.1 | 2.8 ± 0.2 | 2.9 ± 0.2 | 3.2 ± 0.1 | 13.6 ± 0.6 |
| 2 | 6.5 ± 0.2 | 0.4 ± 0.1 | 16.4 ± 0.5 | 44.9 ± 1.4 | 1.1 ± 0.1 | 13.5 ± 0.5 | 0.5 ± 0.1 | 1.6 ± 0.2 | 10.1 ± 0.6 |
| 3 | 2.2 ± 0.1 | 0.4 ± 0.1 | 2.9 ± 0.1 | 10.9 ± 0.3 | 1.0 ± 0.1 | 3.3 ± 0.2 | 2.4 ± 0.2 | 0.6 ± 0.1 | 6.3 ± 0.4 |
| 4 | 2.0 ± 0.1 | 0.3 ± 0.1 | 2.9 ± 0.1 | 10.8 ± 0.3 | 0.8 ± 0.1 | 3.4 ± 0.2 | 2.8 ± 0.2 | 1.4 ± 0.1 | 14.3 ± 0.8 |
| 5 | 2.4 ± 0.1 | 0.4 ± 0.1 | 4.2 ± 0.1 | 14.2 ± 0.4 | 0.9 ± 0.1 | 5.1 ± 0.4 | 0.2 ± 0.1 | 0.2 ± 0.1 | 4.4 ± 0.3 |
| 6 | 4.3 ± 0.1 | 1.1 ± 0.1 | 7.2 ± 0.2 | 27.0 ± 0.8 | 1.1 ± 0.1 | 0.5 ± 0.1 | 4.5 ± 0.3 | 2.1 ± 0.1 | 11.7 ± 0.6 |
| 7 | 3.5 ± 0.1 | 0.3 ± 0.1 | 8.7 ± 0.2 | 10.9 ± 0.3 | 0.9 ± 0.1 | 0.7 ± 0.1 | 0.5 ± 0.1 | 3.6 ± 0.3 | 25.0 ± 1.8 |
| 8 | 3.8 ± 0.1 | 3.6 ± 0.1 | 14.8 ± 0.5 | 61.1 ± 1.8 | 0.2 ± 0.1 | 0.3 ± 0.1 | 2.1 ± 0.2 | 2.0 ± 0.2 | 10.9 ± 0.6 |
| 9 | 3.2 ± 0.1 | 4.5 ± 0.2 | 12.8 ± 0.5 | 50.7 ± 1.6 | 0.2 ± 0.1 | 0.2 ± 0.1 | 1.6 ± 0.2 | 1.6 ± 0.2 | 9.8 ± 0.6 |
| 10 | 3.6 ± 0.1 | 4.3 ± 0.2 | 14.4 ± 0.5 | 56.6 ± 1.7 | 0.2 ± 0.1 | 0.3 ± 0.1 | 2.0 ± 0.2 | 1.9 ± 0.2 | 9.9 ± 0.6 |
| 11 | 0.6 ± 0.1 | 0.5 ± 0.1 | 23.6 ± 0.7 | 39.5 ± 1.2 | 0.2 ± 0.1 | 0.9 ± 0.1 | 0.2 ± 0.1 | 2.9 ± 0.2 | 19.5 ± 1.1 |
| 12 | 0.4 ± 0.1 | 0.5 ± 0.1 | 22.4 ± 0.7 | 38.1 ± 1.2 | 0.2 ± 0.1 | 1.0 ± 0.1 | 0.2 ± 0.1 | 2.8 ± 0.2 | 18.7 ± 1.0 |
| 13 | 1.2 ± 0.1 | 0.9 ± 0.1 | 29.6 ± 0.8 | 47.9 ± 1.4 | 0.3 ± 0.1 | 0.9 ± 0.1 | 0.2 ± 0.1 | 2.7 ± 0.2 | 17.1 ± 1.0 |
| 14 | 0.8 ± 0.1 | 0.7 ± 0.1 | 29.4 ± 0.8 | 46.7 ± 1.4 | 0.2 ± 0.1 | 0.9 ± 0.1 | 0.2 ± 0.1 | 2.8 ± 0.2 | 19.0 ± 1.0 |
| 15 | 3.1 ± 0.1 | 5.5 ± 0.2 | 15.2 ± 0.5 | 58.6 ± 1.7 | 0.2 ± 0.1 | 0.2 ± 0.1 | 1.9 ± 0.2 | 2.0 ± 0.2 | 11.9 ± 0.6 |
| 16 | 5.9 ± 0.2 | 1.3 ± 0.1 | 15.4 ± 0.5 | 51.3 ± 1.6 | 1.0 ± 0.1 | 10.0 ± 0.5 | 5.4 ± 0.4 | 1.0 ± 0.1 | 8.8 ± 0.6 |
| 17 | 7.6 ± 0.2 | 2.4 ± 0.1 | 11.8 ± 0.4 | 48.8 ± 1.6 | 1.7 ± 0.1 | 3.0 ± 0.2 | 5.5 ± 0.4 | 1.9 ± 0.2 | 17.5 ± 1.0 |
| 18 | 3.4 ± 0.1 | 0.5 ± 0.1 | 6.4 ± 0.2 | 28.1 ± 1.0 | 0.7 ± 0.1 | 5.2 ± 0.3 | 2.4 ± 0.2 | 1.6 ± 0.1 | 13.6 ± 0.9 |
| 19 | 6.9 ± 0.2 | 1.1 ± 0.1 | 11.9 ± 0.4 | 52.3 ± 1.6 | 1.0 ± 0.1 | 5.5 ± 0.3 | 3.5 ± 0.3 | 1.4 ± 0.1 | 15.8 ± 1.0 |
| 20 | 6.8 ± 0.2 | 1.2 ± 0.1 | 11.3 ± 0.4 | 47.9 ± 1.5 | 1.3 ± 0.1 | 7.0 ± 0.4 | 4.3 ± 0.3 | 1.7 ± 0.1 | 17.6 ± 1.0 |
| 21 | 4.2 ± 0.1 | 4.2 ± 0.1 | 12.4 ± 0.5 | 53.4 ± 1.7 | 0.5 ± 0.1 | 0.9 ± 0.1 | 3.3 ± 0.2 | 1.8 ± 0.1 | 9.6 ± 0.6 |
| 22 | 2.0 ± 0.1 | 2.8 ± 0.1 | 9.2 ± 0.3 | 38.4 ± 1.3 | 0.5 ± 0.1 | 1.0 ± 0.1 | 2.4 ± 0.2 | 1.2 ± 0.1 | 10.7 ± 0.6 |
| 23 | 0.3 ± 0.1 | 1.8 ± 0.1 | 14.9 ± 0.5 | 62.8 ± 1.8 | 1.5 ± 0.2 | 10.5 ± 0.1 | 1.3 ± 0.2 | 1.9 ± 0.1 | 5.5 ± 0.4 |
| 24 | 0.3 ± 0.1 | 2.6 ± 0.1 | 13.1 ± 0.4 | 52.7 ± 1.6 | 1.6 ± 0.2 | 8.8 ± 0.4 | 1.4 ± 0.1 | 2.3 ± 0.2 | 7.3 ± 0.5 |
| 25 | 0.3 ± 0.1 | 0.5 ± 0.1 | 10.9 ± 0.3 | 44.3 ± 1.4 | 0.6 ± 0.1 | 8.8 ± 0.4 | 0.3 ± 0.1 | 1.1 ± 0.1 | 4.7 ± 0.3 |
| 26 | 0.3 ± 0.1 | 0.9 ± 0.1 | 9.6 ± 0.3 | 49.0 ± 1.5 | 1.1 ± 0.1 | 7.5 ± 0.4 | 0.6 ± 0.1 | 1.2 ± 0.1 | 19.8 ± 1.1 |
| 27 | 0.3 ± 0.1 | 0.6 ± 0.1 | 10.5 ± 0.3 | 74.7 ± 1.8 | 1.2 ± 0.1 | 6.7 ± 0.4 | 0.5 ± 0.1 | 1.2 ± 0.1 | 5.2 ± 0.4 |
| 28 | 0.6 ± 0.1 | 3.5 ± 0.1 | 15.1 ± 0.6 | 58.0 ± 1.6 | 0.9 ± 0.1 | 10.1 ± 0.5 | 0.9 ± 0.1 | 1.4 ± 0.1 | 9.5 ± 0.6 |
| 29 | 2.7 ± 0.1 | 2.7 ± 0.1 | 15.1 ± 0.6 | 55.1 ± 1.6 | 1.3 ± 0.1 | 6.4 ± 0.4 | 4.2 ± 0.3 | 1.4 ± 0.1 | 11.1 ± 0.6 |
| 30 | 5.4 ± 0.2 | 3.4 ± 0.1 | 16.3 ± 0.6 | 55.1 ± 1.6 | 0.4 ± 0.1 | 1.3 ± 0.1 | 1.9 ± 0.2 | 1.6 ± 0.1 | 11.5 ± 0.6 |
| Samples | Rb2O | YPO4 | ZrO2 | La2O3 | Ce2O3 | Nd2O3 | Sm2O3 |
|---|---|---|---|---|---|---|---|
| µg·g−1 | µg·g−1 | µg·g−1 | µg·g−1 | µg·g−1 | µg·g−1 | µg·g−1 | |
| 1 | 175 ± 11 | 1094 ± 103 | 2232 ± 213 | 5025 ± 501 | 11,010 ± 1090 | 2921 ± 290 | 347 ± 32 |
| 2 | 504 ± 27 | 1235 ± 119 | 2892 ± 276 | 630 ± 61 | 2284 ± 225 | 524 ± 51 | 34 ± 3 |
| 3 | 301 ± 15 | 725 ± 69 | 1261 ± 125 | 9959 ± 989 | 23,570 ± 2257 | 5734 ± 571 | 647 ± 59 |
| 4 | 340 ± 17 | 795 ± 75 | 1535 ± 149 | 7232 ± 719 | 17,410 ± 1723 | 4466 ± 445 | 486 ± 47 |
| 5 | 337 ± 17 | 925 ± 90 | 1580 ± 155 | 7878 ± 778 | 17,450 ± 1723 | 4445 ± 432 | 555 ± 52 |
| 6 | 307 ± 15 | 827 ± 80 | 1825 ± 181 | 391 ± 37 | 728 ± 71 | *BLD | 73 ± 6 |
| 7 | 22 ± 2 | 80 ± 7 | 126 ± 12 | 701 ± 69 | 1433 ± 142 | 206 ± 19 | 102 ± 9 |
| 8 | 74 ± 5 | 89 ± 7 | 246 ± 23 | 438 ± 42 | 792 ± 78 | 137 ± 12 | 81 ± 7 |
| 9 | 48 ± 3 | *BLD | 126 ± 12 | 352 ± 33 | 639 ± 62 | 122 ± 11 | 59 ± 4 |
| 10 | 65 ± 5 | *BLD | 136 ± 13 | 442 ± 42 | 773 ± 76 | 167 ± 15 | 79 ± 6 |
| 11 | 381 ± 17 | *BLD | 120 ± 11 | 3174 ± 315 | 1610 ± 160 | 1172 ± 115 | 310 ± 29 |
| 12 | 397 ± 18 | 636 ± 60 | 1076 ± 104 | 3238 ± 321 | 1260 ± 125 | 1171 ± 115 | 293 ± 27 |
| 13 | 342 ± 16 | 89 ± 8 | 525 ± 51 | 3036 ± 301 | 1206 ± 120 | 1069 ± 101 | 293 ± 27 |
| 14 | 415 ± 19 | 21 ± 2 | 345 ± 32 | 3153 ± 314 | 1179 ± 116 | 1083 ± 103 | 290 ± 27 |
| 15 | 54 ± 3 | 90 ± 8 | 668 ± 63 | 393 ± 38 | 694 ± 68 | 156 ± 14 | 75 ± 6 |
| 16 | 2563 ± 235 | *BLD | 126 ± 12 | 808 ± 79 | 1497 ± 146 | 277 ± 25 | 32 ± 3 |
| 17 | 199 ± 15 | 208 ± 19 | 120 ± 11 | 453 ± 44 | 782 ± 76 | 84 ± 8 | 64 ± 6 |
| 18 | 953 ± 92 | 169 ± 15 | 56 ± 5 | 349 ± 33 | 1059 ± 104 | 44 ± 3 | 80 ± 8 |
| 19 | 1611 ± 149 | 67 ± 6 | 365 ± 34 | 521 ± 51 | 859 ± 83 | 74 ± 6 | 55 ± 5 |
| 20 | 674 ± 61 | 81 ± 8 | 366 ± 34 | 659 ± 64 | 1069 ± 105 | 54 ± 5 | 84 ± 8 |
| 21 | 191 ± 17 | 245 ± 21 | 128 ± 12 | 396 ± 37 | 759 ± 74 | 185 ± 17 | 79 ± 7 |
| 22 | 779 ± 71 | 226 ± 21 | 560 ± 55 | 690 ± 69 | 1414 ± 138 | 328 ± 31 | 46 ± 4 |
| 23 | 462 ± 45 | 820 ± 81 | 750 ± 73 | 326 ± 31 | 671 ± 66 | 175 ± 16 | 71 ± 6 |
| 24 | 651 ± 61 | 413 ± 40 | 756 ± 74 | 343 ± 33 | 737 ± 72 | 199 ± 18 | 85 ± 8 |
| 25 | 448 ± 42 | 725 ± 71 | 1261 ± 125 | 159 ± 15 | 313 ± 30 | 60 ± 5 | 41 ± 4 |
| 26 | 303 ± 29 | 621 ± 60 | 1001 ± 98 | 206 ± 19 | 436 ± 42 | 79 ± 7 | 80 ± 8 |
| 27 | 244 ± 21 | 802 ± 79 | 1123 ± 111 | 182 ± 17 | 372 ± 35 | 116 ± 10 | 34 ± 3 |
| 28 | 501 ± 49 | 645 ± 59 | 803 ± 80 | 322 ± 31 | 637 ± 61 | 150 ± 14 | 62 ± 6 |
| 29 | 822 ± 80 | 751 ± 72 | 1433 ± 141 | 215 ± 20 | 396 ± 38 | 63 ± 5 | 52 ± 5 |
| 30 | 969 ± 93 | 421 ± 40 | 862 ± 85 | 361 ± 35 | 541 ± 52 | 27 ± 2 | *BLD |
| Samples | Gamma Spectrometry | XRF | ||||
|---|---|---|---|---|---|---|
| 238U | 232Th | 40K | 235U | Total U | Total Th | |
| Bq·kg−1 | Bq·kg−1 | Bq·kg−1 | Bq·kg−1 | µg·g−1 | µg·g−1 | |
| 1 | 79,333 ± 6347 | 36,756 ± 2940 | 3078 ± 246 | 3598 ± 255 | 5363 ± 590 | 7633 ± 840 |
| 2 | 110,767 ± 8861 | 288,639 ± 23,091 | 23,088 ± 1847 | 4564 ± 412 | 5209 ± 573 | 52,730 ± 5300 |
| 3 | 15,667 ± 1253 | 211,271 ± 16,902 | 100 ± 8 | 660 ± 60 | 1444 ± 159 | 30,900 ± 3100 |
| 4 | 20,494 ± 1640 | 178,440 ± 14,275 | 100 ± 7 | 867 ± 81 | 1197 ± 132 | 29,210 ± 2903 |
| 5 | 50,113 ± 4000 | 261,266 ± 20,901 | 2182 ± 175 | 2165 ± 201 | 2084 ± 229 | 33,660 ± 3650 |
| 6 | 128,699 ± 10,296 | 1435 ± 115 | 77 ± 6 | 5663 ± 526 | 5450 ± 550 | 513 ± 51 |
| 7 | 2210 ± 177 | 1703 ± 136 | 669 ± 54 | 100 ± 8 | 505 ± 56 | 663 ± 66 |
| 8 | 565 ± 45 | 1374 ± 110 | 419 ± 34 | 25 ± 1 | 593 ± 58 | 644 ± 63 |
| 9 | 2230 ± 178 | 1919 ± 154 | 495 ± 40 | 111 ± 8 | 216 ± 21 | 506 ± 49 |
| 10 | 864 ± 69 | 984 ± 79 | 1280 ± 102 | 39 ± 2 | 194 ± 18 | 611 ± 60 |
| 11 | 1009 ± 81 | 2736 ± 219 | 633 ± 51 | 46 ± 3 | 153 ± 15 | 861 ± 85 |
| 12 | 990 ± 79 | 2619 ± 209 | 645 ± 52 | 47 ± 3 | 146 ± 14 | 864 ± 86 |
| 13 | 855 ± 68 | 2751 ± 220 | 639 ± 51 | 38 ± 3 | 108 ± 10 | 658 ± 63 |
| 14 | 815 ± 65 | 2594 ± 208 | 636 ± 52 | 35 ± 2 | 113 ± 11 | 713 ± 70 |
| 15 | 426 ± 34 | 959 ± 77 | 69 ± 6 | 16 ± 1 | 212 ± 20 | 611 ± 60 |
| 16 | 864 ± 69 | 576 ± 46 | 2290 ± 183 | 43 ± 3 | 117 ± 11 | 349 ± 32 |
| 17 | 373 ± 30 | 537 ± 43 | 674 ± 54 | 18 ± 1 | 64 ± 6 | 246 ± 23 |
| 18 | 539 ± 43 | 1005 ± 80 | 1540 ± 123 | 24 ± 2 | 73 ± 7 | 694 ± 67 |
| 19 | 864 ± 69 | 984 ± 79 | 1280 ± 102 | 35 ± 2 | 107 ± 10 | 314 ± 31 |
| 20 | 768 ± 61 | 1212 ± 95 | 1490 ± 119 | 35 ± 2 | 105 ± 10 | 1032 ± 99 |
| 21 | 14,738 ± 1179 | 826 ± 66 | 159 ± 13 | 621 ± 52 | 1446 ± 140 | 434 ± 41 |
| 22 | 5553 ± 444 | 1052 ± 84 | 318 ± 25 | 241 ± 19 | 1001 ± 99 | 394 ± 37 |
| 23 | 10,659 ± 853 | 553 ± 44 | 2594 ± 208 | 421 ± 38 | 801 ± 80 | 195 ± 18 |
| 24 | 22,538 ± 1804 | 623 ± 50 | 2320 ± 186 | 992 ± 71 | 2012 ± 199 | 229 ± 20 |
| 25 | 37,553 ± 3004 | 521 ± 42 | 3098 ± 248 | 1625 ± 141 | 2465 ± 23 | 143 ± 13 |
| 26 | 19,293 ± 1543 | 430 ± 34 | 1658 ± 133 | 821 ± 69 | 1209 ± 120 | 116 ± 10 |
| 27 | 92,009 ± 7361 | 471 ± 38 | 1668 ± 133 | 3956 ± 355 | 5306 ± 529 | 134 ± 12 |
| 28 | 9109 ± 729 | 585 ± 47 | 2296 ± 184 | 373 ± 31 | 925 ± 91 | 249 ± 23 |
| 29 | 27,420 ± 2194 | 954 ± 76 | 1491 ± 119 | 1115 ± 99 | 2496 ± 242 | 228 ± 20 |
| 30 | 29,154 ± 2332 | 680 ± 54 | 280 ± 22 | 1341 ± 121 | 2597 ± 251 | 405 ± 40 |
| Ave. | 22,882 ± 1602 | 33,549 ± 2348 | 1909 ± 134 | 988 ± 78 | 1457 ± 117 | 5531 ± 443 |
| WA | 37 ± 4 | 33 ± 3 | 400 ± 24 | - | - | - |
© 2020 by the authors. Licensee MDPI, Basel, Switzerland. This article is an open access article distributed under the terms and conditions of the Creative Commons Attribution (CC BY) license (http://creativecommons.org/licenses/by/4.0/).
Share and Cite
Rosianna, I.; Nugraha, E.D.; Syaeful, H.; Putra, S.; Hosoda, M.; Akata, N.; Tokonami, S. Natural Radioactivity of Laterite and Volcanic Rock Sample for Radioactive Mineral Exploration in Mamuju, Indonesia. Geosciences 2020, 10, 376. https://doi.org/10.3390/geosciences10090376
Rosianna I, Nugraha ED, Syaeful H, Putra S, Hosoda M, Akata N, Tokonami S. Natural Radioactivity of Laterite and Volcanic Rock Sample for Radioactive Mineral Exploration in Mamuju, Indonesia. Geosciences. 2020; 10(9):376. https://doi.org/10.3390/geosciences10090376
Chicago/Turabian StyleRosianna, Ilsa, Eka Djatnika Nugraha, Heri Syaeful, Sugili Putra, Masahiro Hosoda, Naofumi Akata, and Shinji Tokonami. 2020. "Natural Radioactivity of Laterite and Volcanic Rock Sample for Radioactive Mineral Exploration in Mamuju, Indonesia" Geosciences 10, no. 9: 376. https://doi.org/10.3390/geosciences10090376