Article

Implications of Landslide Typology and Predisposing Factor Combinations for Probabilistic Landslide Susceptibility Models: A Case Study in Lajedo Parish (Flores Island, Azores—Portugal)

by
Rui Fagundes Silva
1,2,*,
Rui Marques
1,2 and
João Luís Gaspar
2
1
Centre for Information and Seismovolcanic Surveilance of the Azores, University of the Azores, Rua Mãe de Deus, 9500-501 Ponta Delgada, Portugal
2
Research Institute for Volcanology and Risk Assessment, University of the Azores, Rua Mãe de Deus, 9500-501 Ponta Delgada, Portugal
*
Author to whom correspondence should be addressed.
Geosciences 2018, 8(5), 153; https://doi.org/10.3390/geosciences8050153
Submission received: 22 March 2018 / Revised: 24 April 2018 / Accepted: 25 April 2018 / Published: 27 April 2018
(This article belongs to the Special Issue Natural Hazards and Risks Assessment)

Abstract

:
The main objective of this study is to better understand and quantify the consequences for landslide susceptibility assessment caused by (i) the discrimination (or not) of landslide typology and (ii) the use of different predisposing factor combinations. The study area for this research was Lajedo parish (Flores Island, Azores—Portugal). For the landslide susceptibility modeling, 12 predisposing factors and a historical landslide inventory with a total of 474 individual landslide rupture areas were used as inputs, and the Information Value method was then applied. It was concluded that susceptibility models developed specifically for each landslide typology achieve better results when compared to the model developed for the total inventory, which suffers from a bias caused by the strong spatial abundance of one landslide typology. A total of 4095 susceptibility models were tested for each typology, and the best models were selected according to their goodness of fit. The best model for both falls and slides has seven predisposing factors, some of which do not correspond to the factors that have the best individual discriminatory capabilities. The number of expected and observed unique terrain conditions for each model allowed us to conclude that with the successive addition of predisposing factors, there is an inability of the territory to generate new observed unique terrain conditions. This consequence was directly related to the inability to increase the goodness of fit of the computed models. For each landslide typology, the predictive capacity of the best susceptibility model was assessed by computing the Prediction Rate Curves and the Area Under the Curve.

1. Introduction

Landslides are responsible for significant economic and social impacts in many areas of the world. They cause the death of people and animals, and destruction or damage of residential and industrial infrastructures and agricultural areas [1]. The identification of areas that are susceptible to landslides is important for land-use and emergency planning [2]. Risk assessment of the multi-hazards in an area can focus on selection of appropriate sites for urban development and can prevent the migration of people and urban sprawl to dangerous places [3,4]. Thus, regardless of some uncertainties, the production and validation of susceptibility, vulnerability, and risk maps make an important contribution to public safety [2].
Soeters and van Westen (1996) [5] defined landslide susceptibility as the likelihood of a landslide occurring in an area based on the local terrain conditions, not considering their return period or magnitude.
A landslide susceptibility analysis corresponds to the basis of hazard mapping, which is one of the essential key steps of quantitative risk mapping [2]. Evaluation of landslide susceptibility is based on the principle that future landslides have a greater likelihood of occurrence under conditions that are similar to those that caused landslides in the past [2,5,6]. There are different methods that can be used for landslide susceptibility assessment [2,7]. Therefore, landslide susceptibility analysis, based on statistical and probabilistic methods, takes into account the relationships between predisposing factors and the landslides’ spatial distribution.
The development of landslide susceptibility models has been improved due to the development of Geographic Information Systems (GIS) and the increase in computational capability [8]. Nowadays, it is possible to integrate different types and formats of input data into high-definition terrain models, even with a large number of predisposing factors, enabling the analysis of larger areas.
For the same study area, different susceptibility maps can be generated, and the computed results are dependent on several factors. Some studies regarding landslide susceptibility analysis have explored this variability and the corresponding uncertainties, examples of which can be found in the papers by Thiery et al. [9], Felicísimo et al. [10], Steger et al. [11], Zêzere et al. [12], and Steger & Glade [13]. This research is based on (i) errors in landslide inventories derived from the cartographic process; (ii) the feature type representing the landslides (polygon versus point); (iii) landslide typology discrimination; (iv) the combination of different predisposing factors; (v) the type and dimension of the terrain mapping unit; (vi) the influence of the statistical method that is applied; and (vii) the influence of restricting the landslide susceptibility models to specific sectors (with a higher density of landslides) of the study area, instead of using the entire study area.
This study’s main objectives are to better understand and quantify the consequences pertaining to the goodness of fit of landslide susceptibility models caused by: (i) the discrimination (or not) of landslide typology and (ii) the use of different predisposing factor combinations. Furthermore, the influence of the number of observed unique terrain conditions, generated by different predisposing factor combinations, was calculated along with how they improve the goodness of fit of the computed susceptibility models.

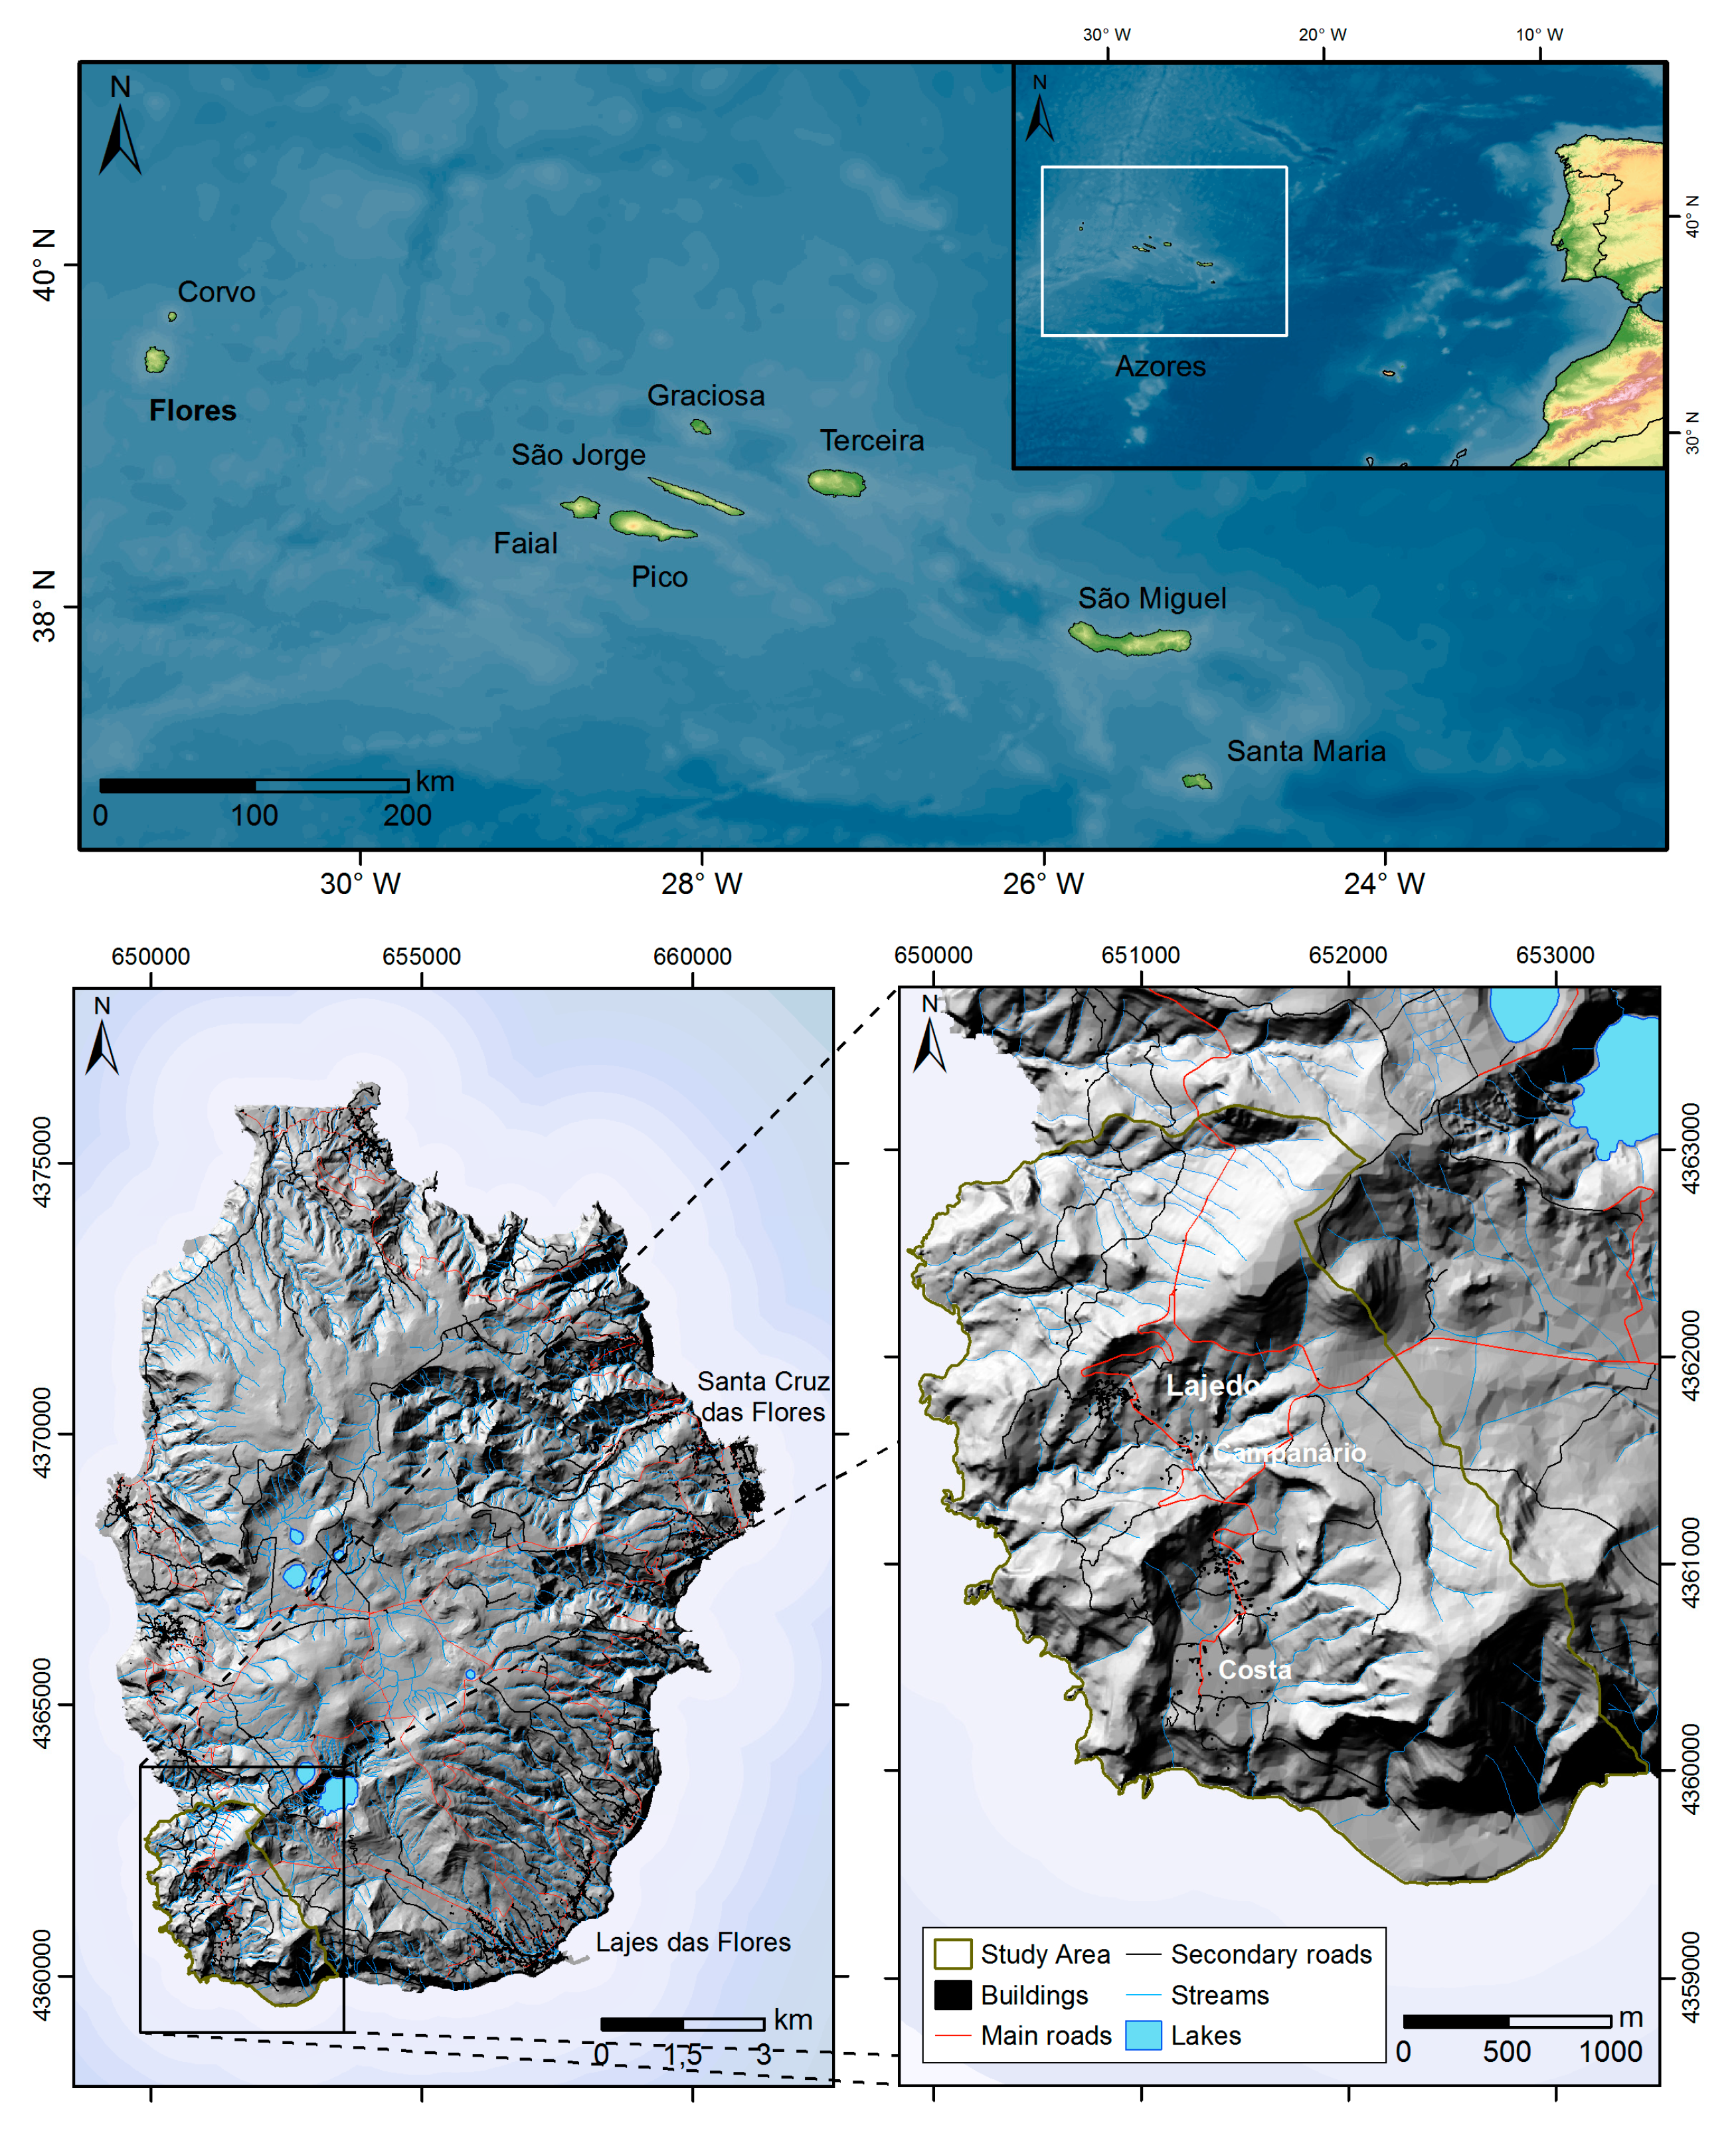
2. Study Area General Setting

The Azores archipelago is located in the North Atlantic Ocean and is composed of nine volcanic islands (Figure 1). From a geodynamic point of view, the archipelago is located in the triple junction between the Eurasian, African, and North American tectonic plates. Due to its tectonic setting, both seismic and volcanic events occur frequently. However, landslides are the most frequent type of geological hazard, due mainly to the volcanic constitution and morphology of the islands.
The study region covers an area of 7.73 km2 and roughly corresponds to the Lajedo parish of the Lajes das Flores municipality, located at the southwest sector of Flores Island (Figure 1), which has a population of 93 inhabitants [14]. Since its settlement in the 16th century, the study area has been recurrently affected by landslides, including a large event of geomorphological instability that occurred in July 1799 [15,16], affecting an area of 116,160 m2 [17]. This event caused an 18 m decrease in mountain height in the area and destroyed cultivated land used for growing wheat and yams.
Silveira (1848–1849) [16] and Macedo (1871) [17] described another landslide occurrence on the 29th of December 1800, at Campanário, that destroyed agricultural and pasture lands and caused the appearance of a “black spring” of cold water that flowed continuously for three years. Two other events of geomorphological instability were reported by Silveira (1848–1849) [16] on the night of the 16–17th of October 1845, and on the 8th of March 1846, both triggered by earthquakes. The author correlates these landslides with the presence of the hydrothermal spring “Água Quente” at the Costa locality. This has not been proven, however, perhaps the author wanted to emphasize the hydrological context of the area or its influence on the occurrence of the landslides.
More recently, on the 22nd of May 1980, a massive fall was triggered, forming a deposit along the coast of the island that was 1000 m wide and 400 m in length. This event triggered a local tsunami with a run-up of 5 m [18]. Landslides are most commonly triggered by rainfall episodes and cause damage to houses, roads, infrastructure, and communications, like those that occurred on the 3rd of December, 2010, and on the 30th of October 2012, when several landslides were triggered in Lajedo.
The volcanic products in the study area have very different ages. The oldest rocks are between 2.2 Ma and 0.80 Ma, and result from submarine and aerial volcanic activity. They include basalts and havaites, volcaniclastic deposits, breccias and tuffs, and are extremely weathered, at times exhibiting clayish levels. The youngest volcanic formations and structures, resulting from subaerial volcanism, range from 0.67 Ma to 0.002 Ma and include basaltic, hawaiitic, mugearitic, and benmoreitic lavas, as well as scoria cones and phreatomagmatic deposits [19,20].
The study area has a variable altitude between 0 and 680 m, with a prominent flat zone above 400 m. Inside the study area there are seven exoreic watersheds and one endorheic watershed, and the main streams have very narrow and embedded valleys. Along almost the whole coastline there is a very steep sea cliff, and at the Costa locality there is a fossilized sea cliff with a marine abrasion platform at the base.

3. Data and Methods

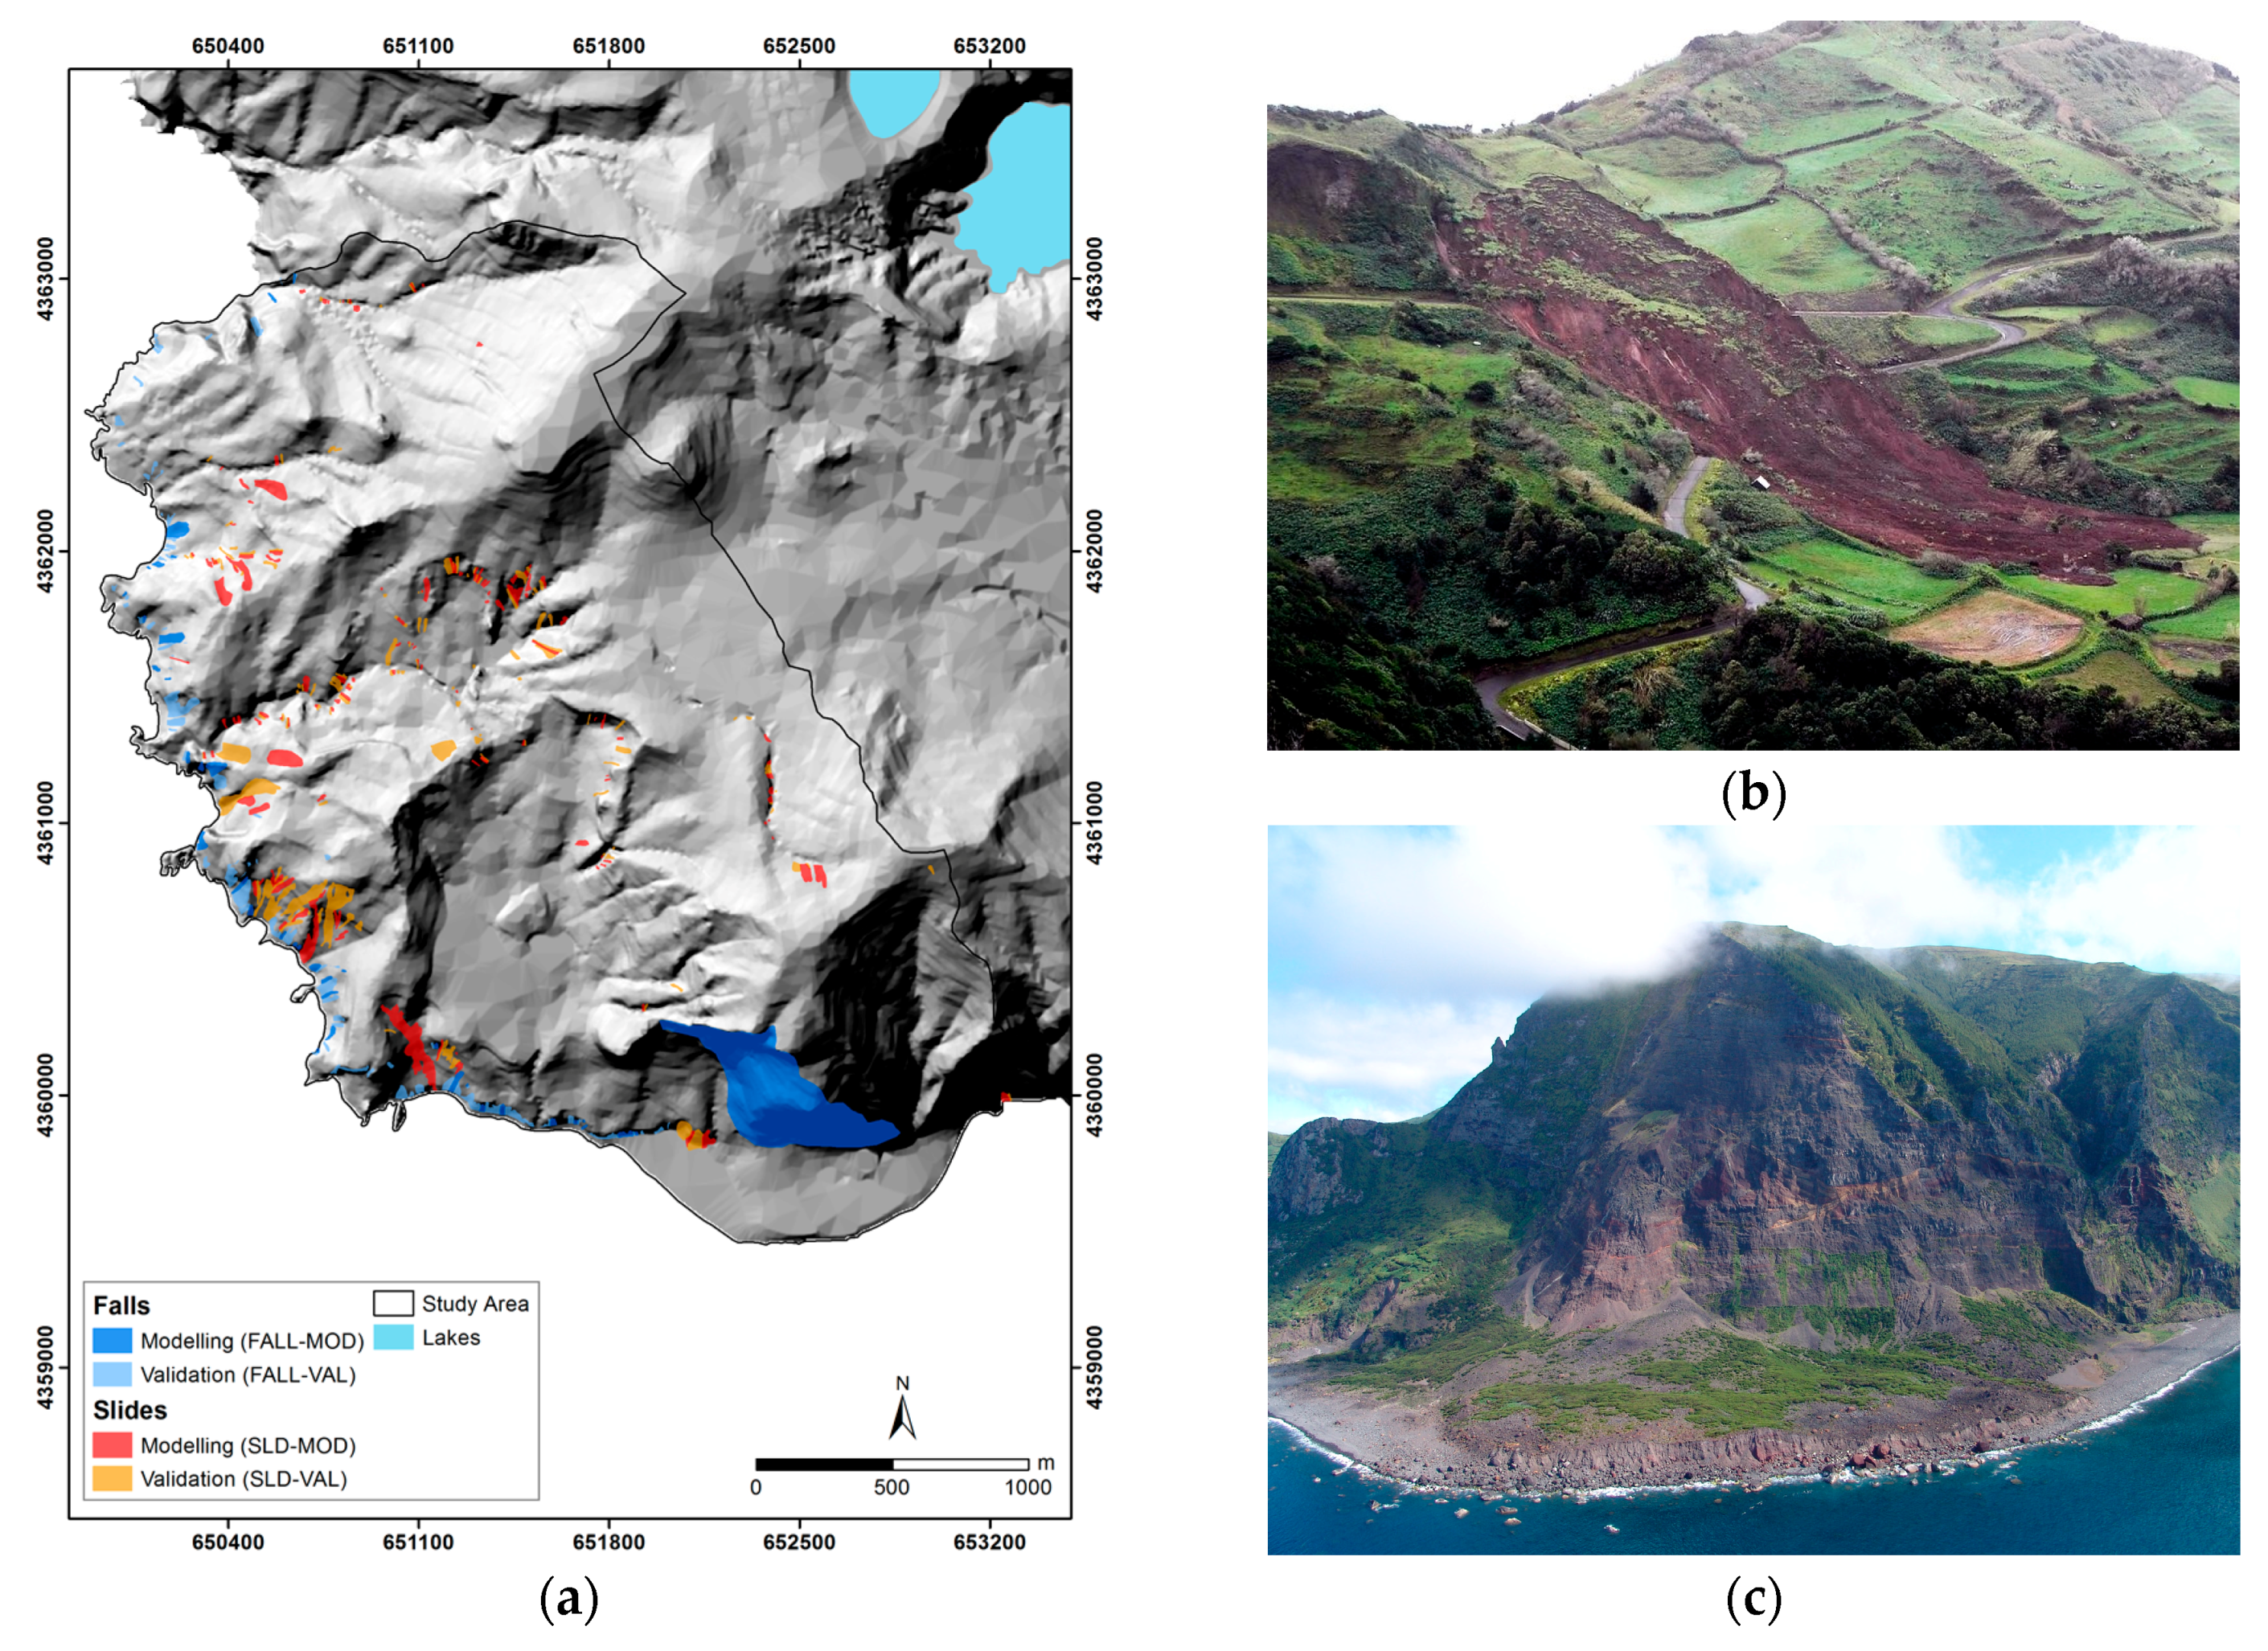
3.1. The Landslide Inventory

The construction of the landslide inventory was based on a 1:1000 scale using image interpretation (aerial photos and satellite images) and fieldwork. The geo-referenced digital orthophotomap of Flores Island, from 2004 and with 0.6 m resolution, was utilized, along with geo-referenced Google Earth images from 2013 with a resolution of 0.4 m. The images were combined with contour lines spaced at 10 m height intervals. Landslides were identified using a 1:1000 scale based on interpretation of distinctive changes in the morphology, vegetation, and draining conditions of the studied slopes. Extensive fieldwork was also carried out in November 2016 to map and validate the landslides that were inventoried using image interpretation. The landslide inventory includes 474 landslides (LAND-TOT), 171 of which are slides (SLD-TOT) and 303 of which are falls (FALL-TOT) (Figure 2a). All the landslides were mapped as polygons using the external contour of the scars, totaling an area of 409,259.3 m2 (Table 1). The slides are mostly shallow (rupture depth < 3 m) and occur predominantly along the steep slopes of stream channels (Figure 2b), while the falls are mainly present along the sea cliffs (Figure 2c).

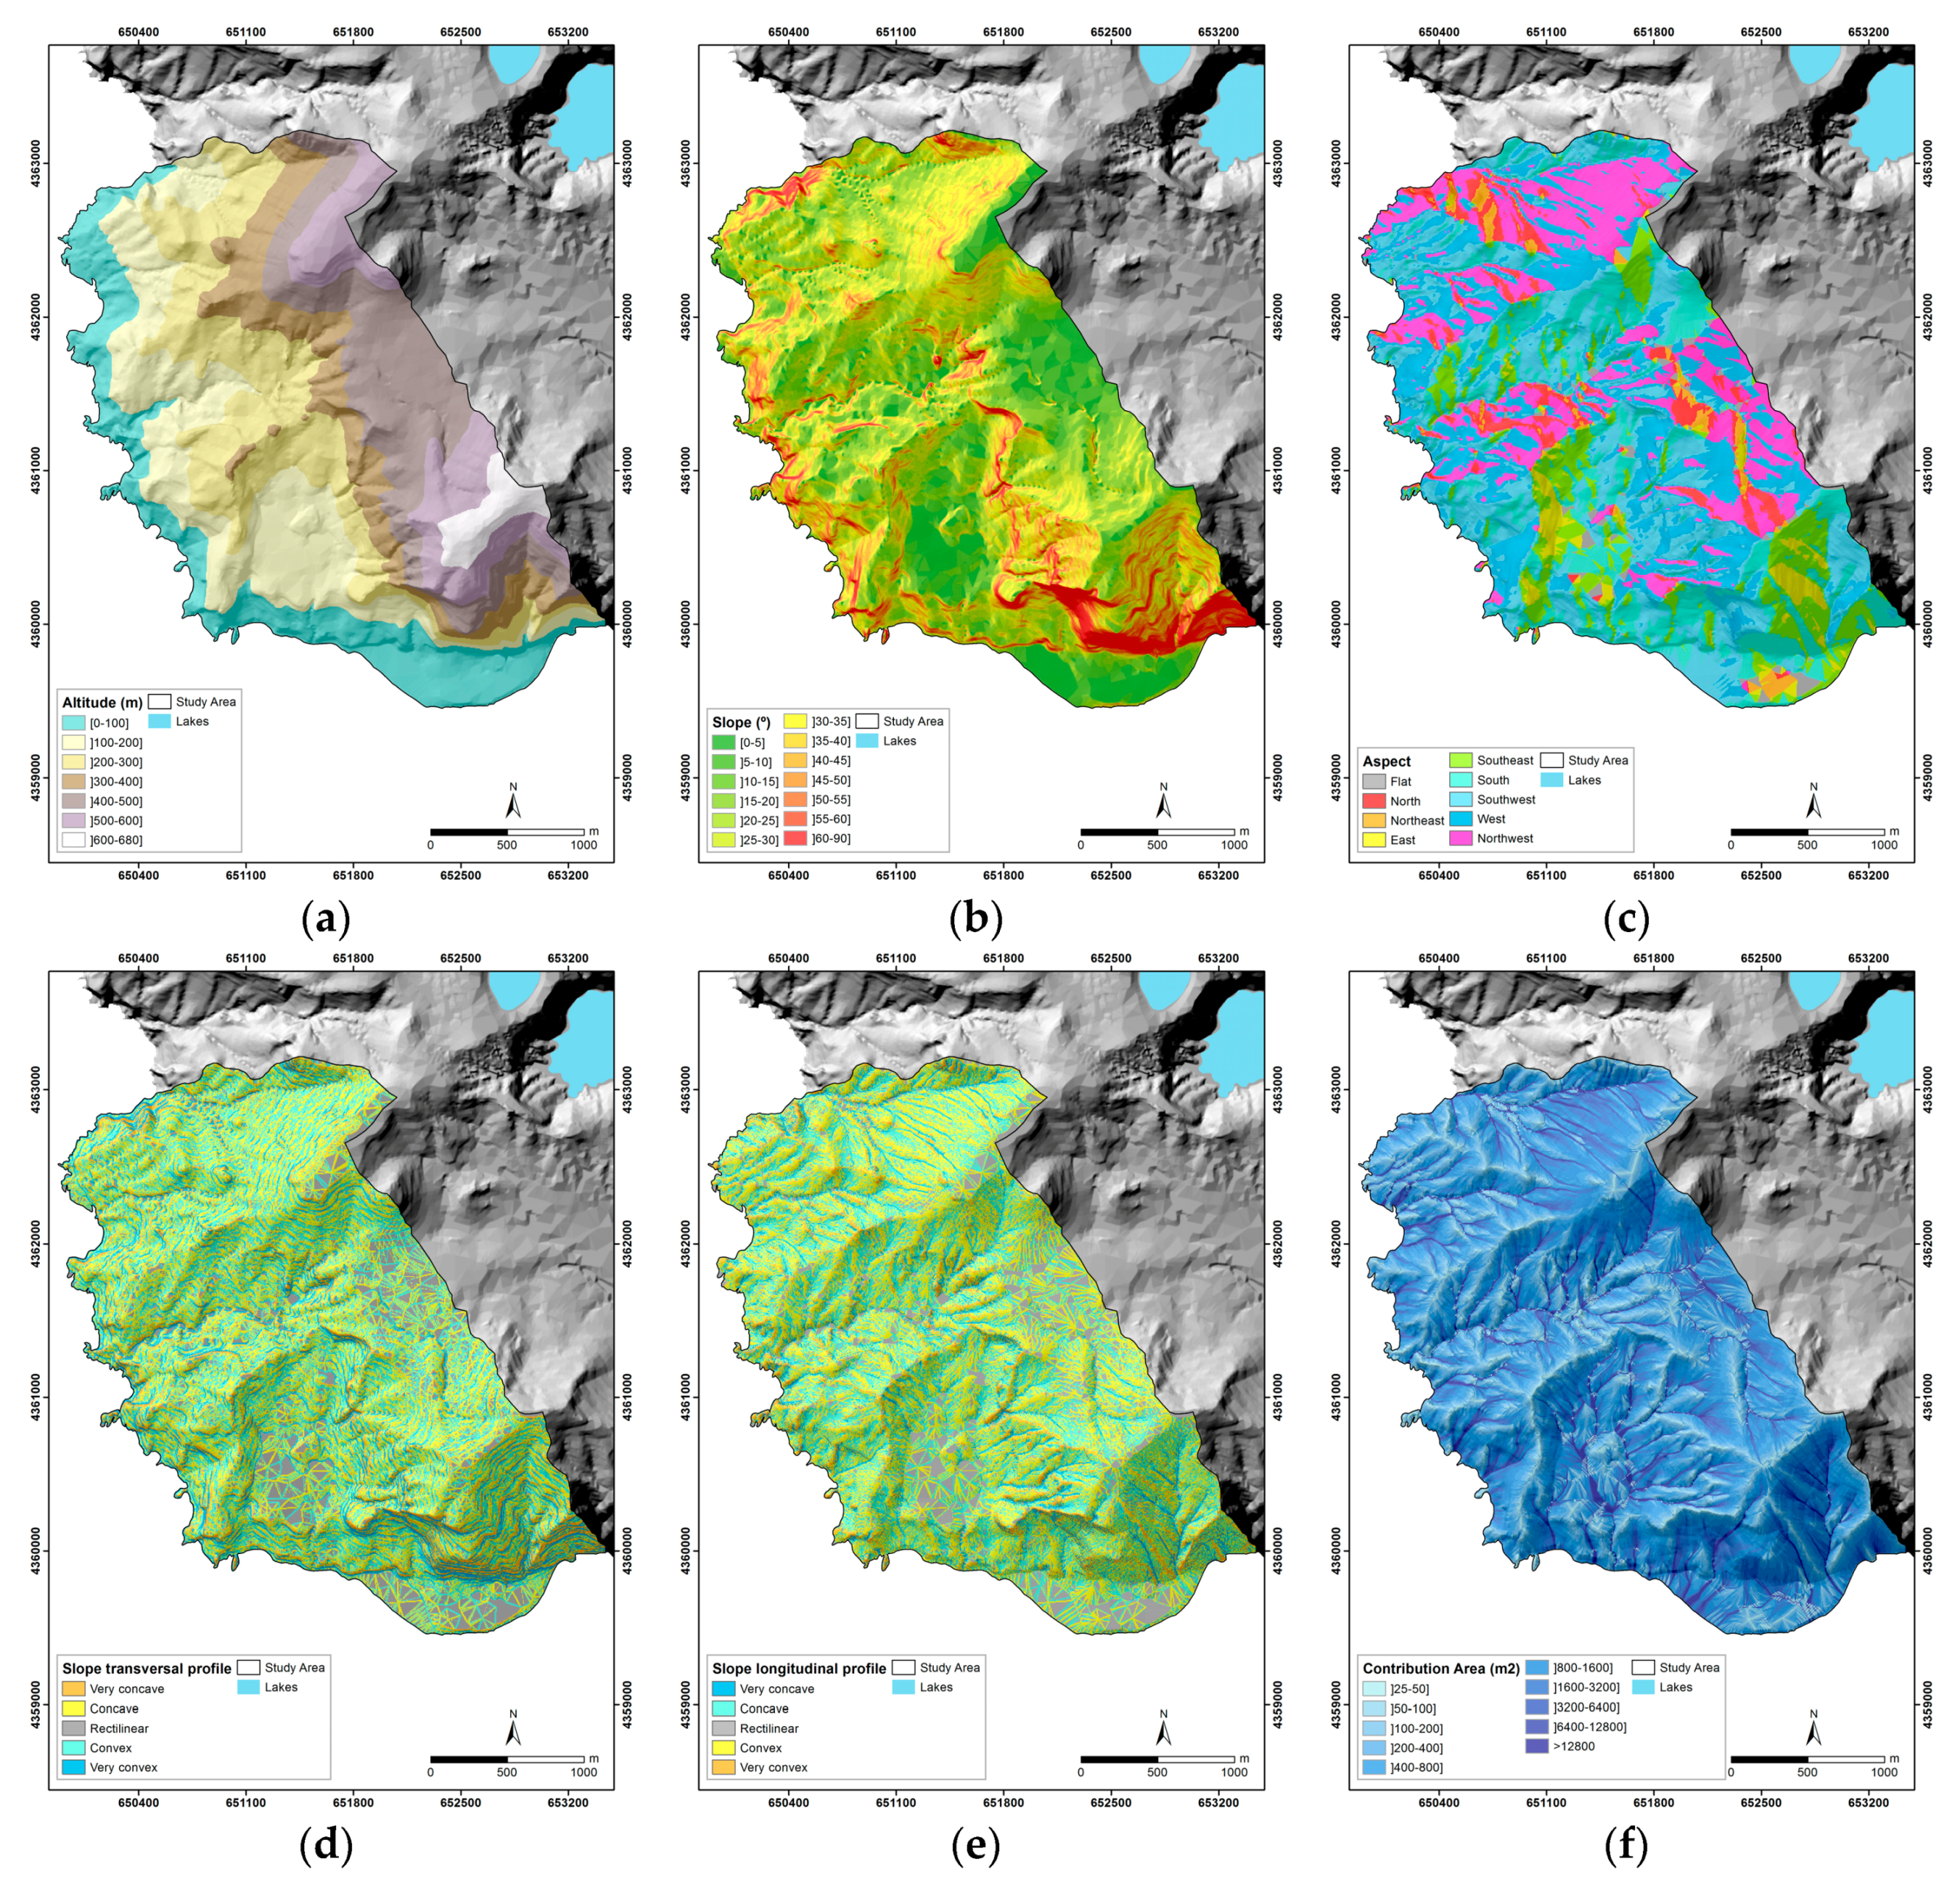
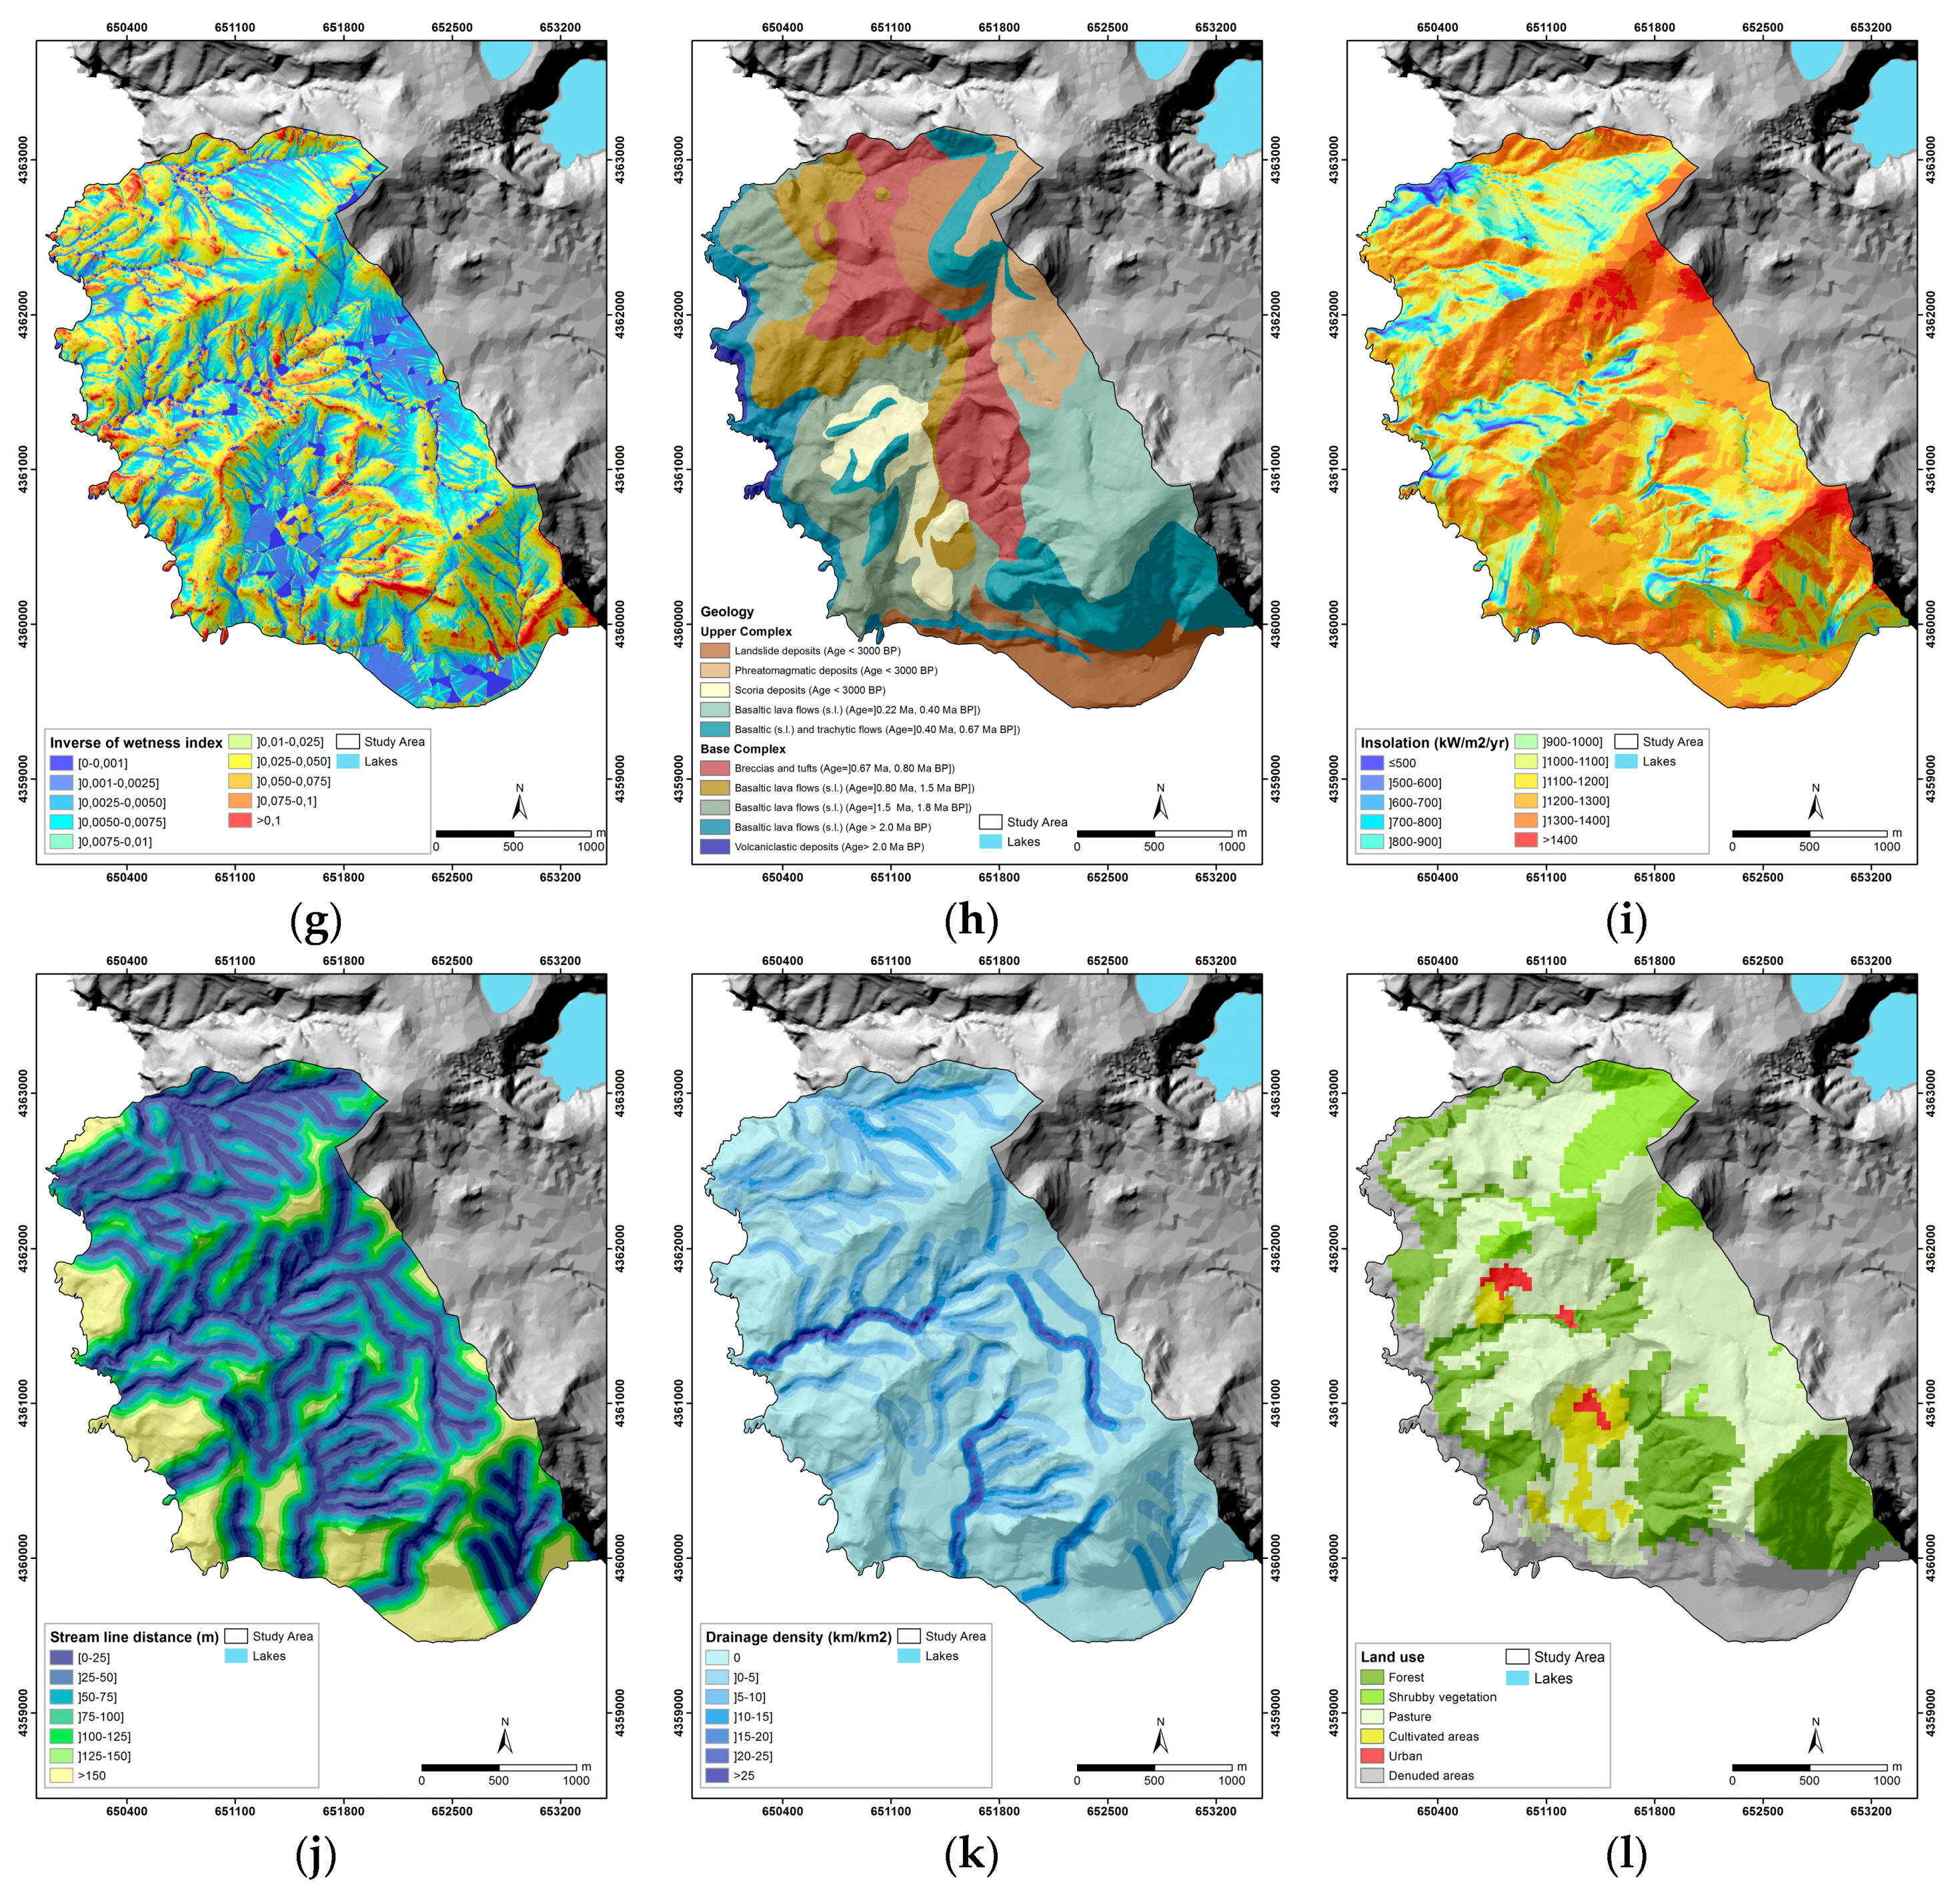
3.2. Predisposing Factors

The landslide susceptibility models were developed based on 12 predisposing factors, the classes of which were used as the independent variables (Figure 3, Table 2). The altitude (7 classes), slope angle (13 classes), slope aspect (9 classes), slope transversal profile (5 classes), slope longitudinal profile (5 classes), and insolation (11 classes) were derived from the digital elevation model (DEM) using ESRI ArcGIS v.10.4.1. The DEM was prepared using both contour lines (10 m equidistance) and spot heights from the 1:25,000 topographic map as input data [21], and the Triangular Irregular Network (TIN) as the interpolation method. The stream line distance (7 classes) was assessed using buffer distances to the center of the stream channel, and the drainage density (7 classes) was calculated using 100 × 100 m windows. The contributing area (10 classes) and the inverse of the wetness index (10 classes) were calculated using TauDEM 5.3 with D-Infinity algorithms [22]. The geology (10 classes) was based on the simplification of the Geological Map of Flores Island [19], and the land use (6 classes) corresponds to the Land Use Map of Flores Island [23]. All predisposing factors were presented as raster datasets with a pixel size of 5 m × 5 m, resulting in a total of 308,979 pixels for each factor.

3.3. Information Value

The landslide susceptibility models were developed using a bivariate probabilistic approach—the Information Value method [24]. When compared with more complex bivariate and multivariate methods, the Information Value method also achieves very good results [25,26,27]. This method is based on the Bayesian Theory and has two complementary steps.
In the first step, the importance of the presence of each class i (independent variable), of all the predisposing factors, in the spatial occurrence of landslides (dependent variable) is weighted (i.e., the Information Value, Ii, is calculated), based on Equation (1):
I i = ln ( S i N i S N )
where: Si = the number of pixels with landslides within the factor class i; Ni = the number of pixels present in the factor class i; S = the total number of pixels within landslides; and N = the total number of pixels in the study area.
Finally, the Information Value of each pixel j, Ij, is given by Equation (2):
I j = i = 1 n X i j . I i
where n = the number of independent variables; and Xij = 0 or 1 if the variable is not present or is present in the pixel j, respectively.
When Ii > 0 ⇒ (Si/Ni) > (S/N) the presence of class i promotes landsliding activity, and when Ii < 0 ⇒ (Si/Ni) < (S/N) the presence of class i inhibits landsliding activity. These relationships between the presence of class i and the inhibition or promotion of landsliding activity increase with the distance of the Ii value to zero.
If Ii = 0 ⇒ (Si/Ni) = (S/N), or is near zero, there is no relationship between the presence of class i and the occurrence of landslides. When Si = 0, it is caused by a mathematical impossibility and, for those cases, Ii was considered to be equal to the lowest value of Ii calculated for the remaining classes of predisposing factors to which class i belongs.

3.4. Evaluation of the Importance of Landslide Typology Discrimination

For the analysis of the predisposing factors’ influence on the landslides’ spatial distribution, the predisposing factors were hierarchically ordered according to their ability to discriminate the terrain units with or without landslides. Each predisposing factor was crossed individually with the each landslide’s typology (falls: FALL-TOT; slides: SLD-TOT). The predisposing factor hierarchy was determined based on the Area Under the Curve (AUC) of the Success Rate Curve (SRC) [28]. The AUC is a common metric used to compare different curves and is calculated through the trapezoidal rule [29,30]. The AUC ranges from 0–1 and the higher the AUC, the better the goodness of fit of the susceptibility model.
In order to assess the importance of landslide typology discrimination in the susceptibility analysis, all the landslide predisposing factors proposed for the modeling were considered. This analysis was based on the following steps: (i) creation of a model that takes into consideration LAND-TOT, later validated with the same landslide group, and with the FALL-TOT and SLD-TOT groups, individually; (ii) development of a specific model using FALL-TOT, subsequently validated with the same group; and (iii) development of a specific model using SLD-TOT, validated with the same group.

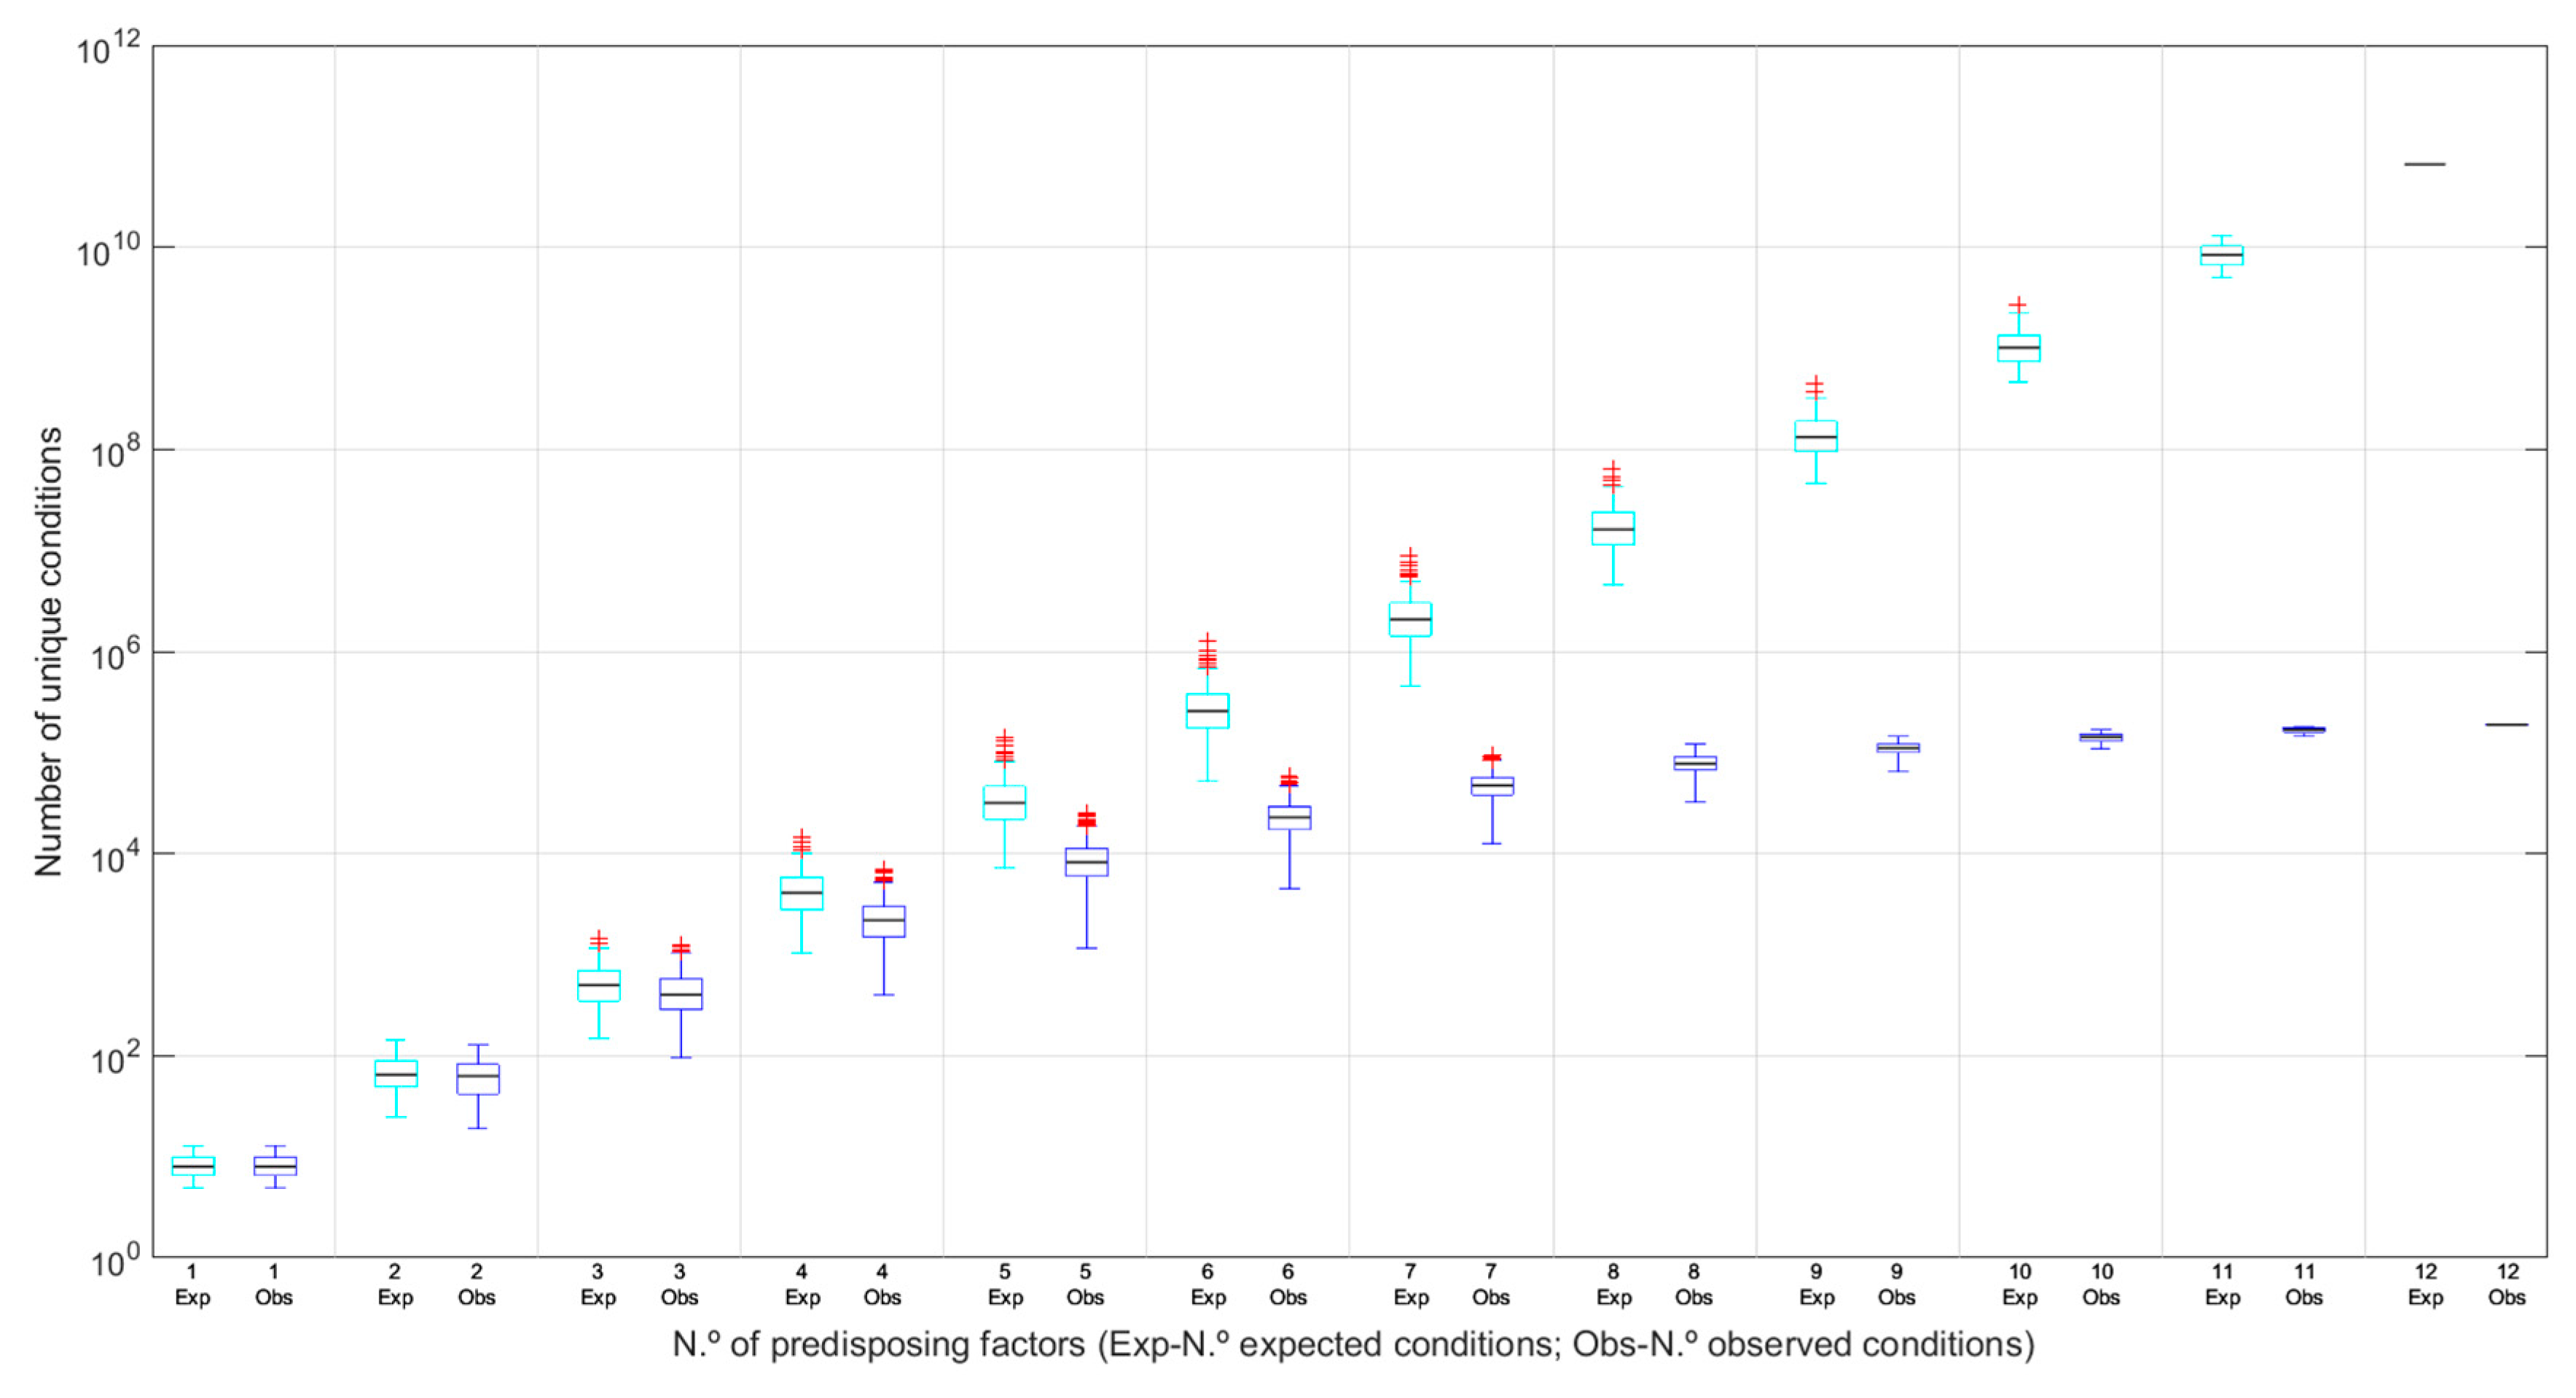
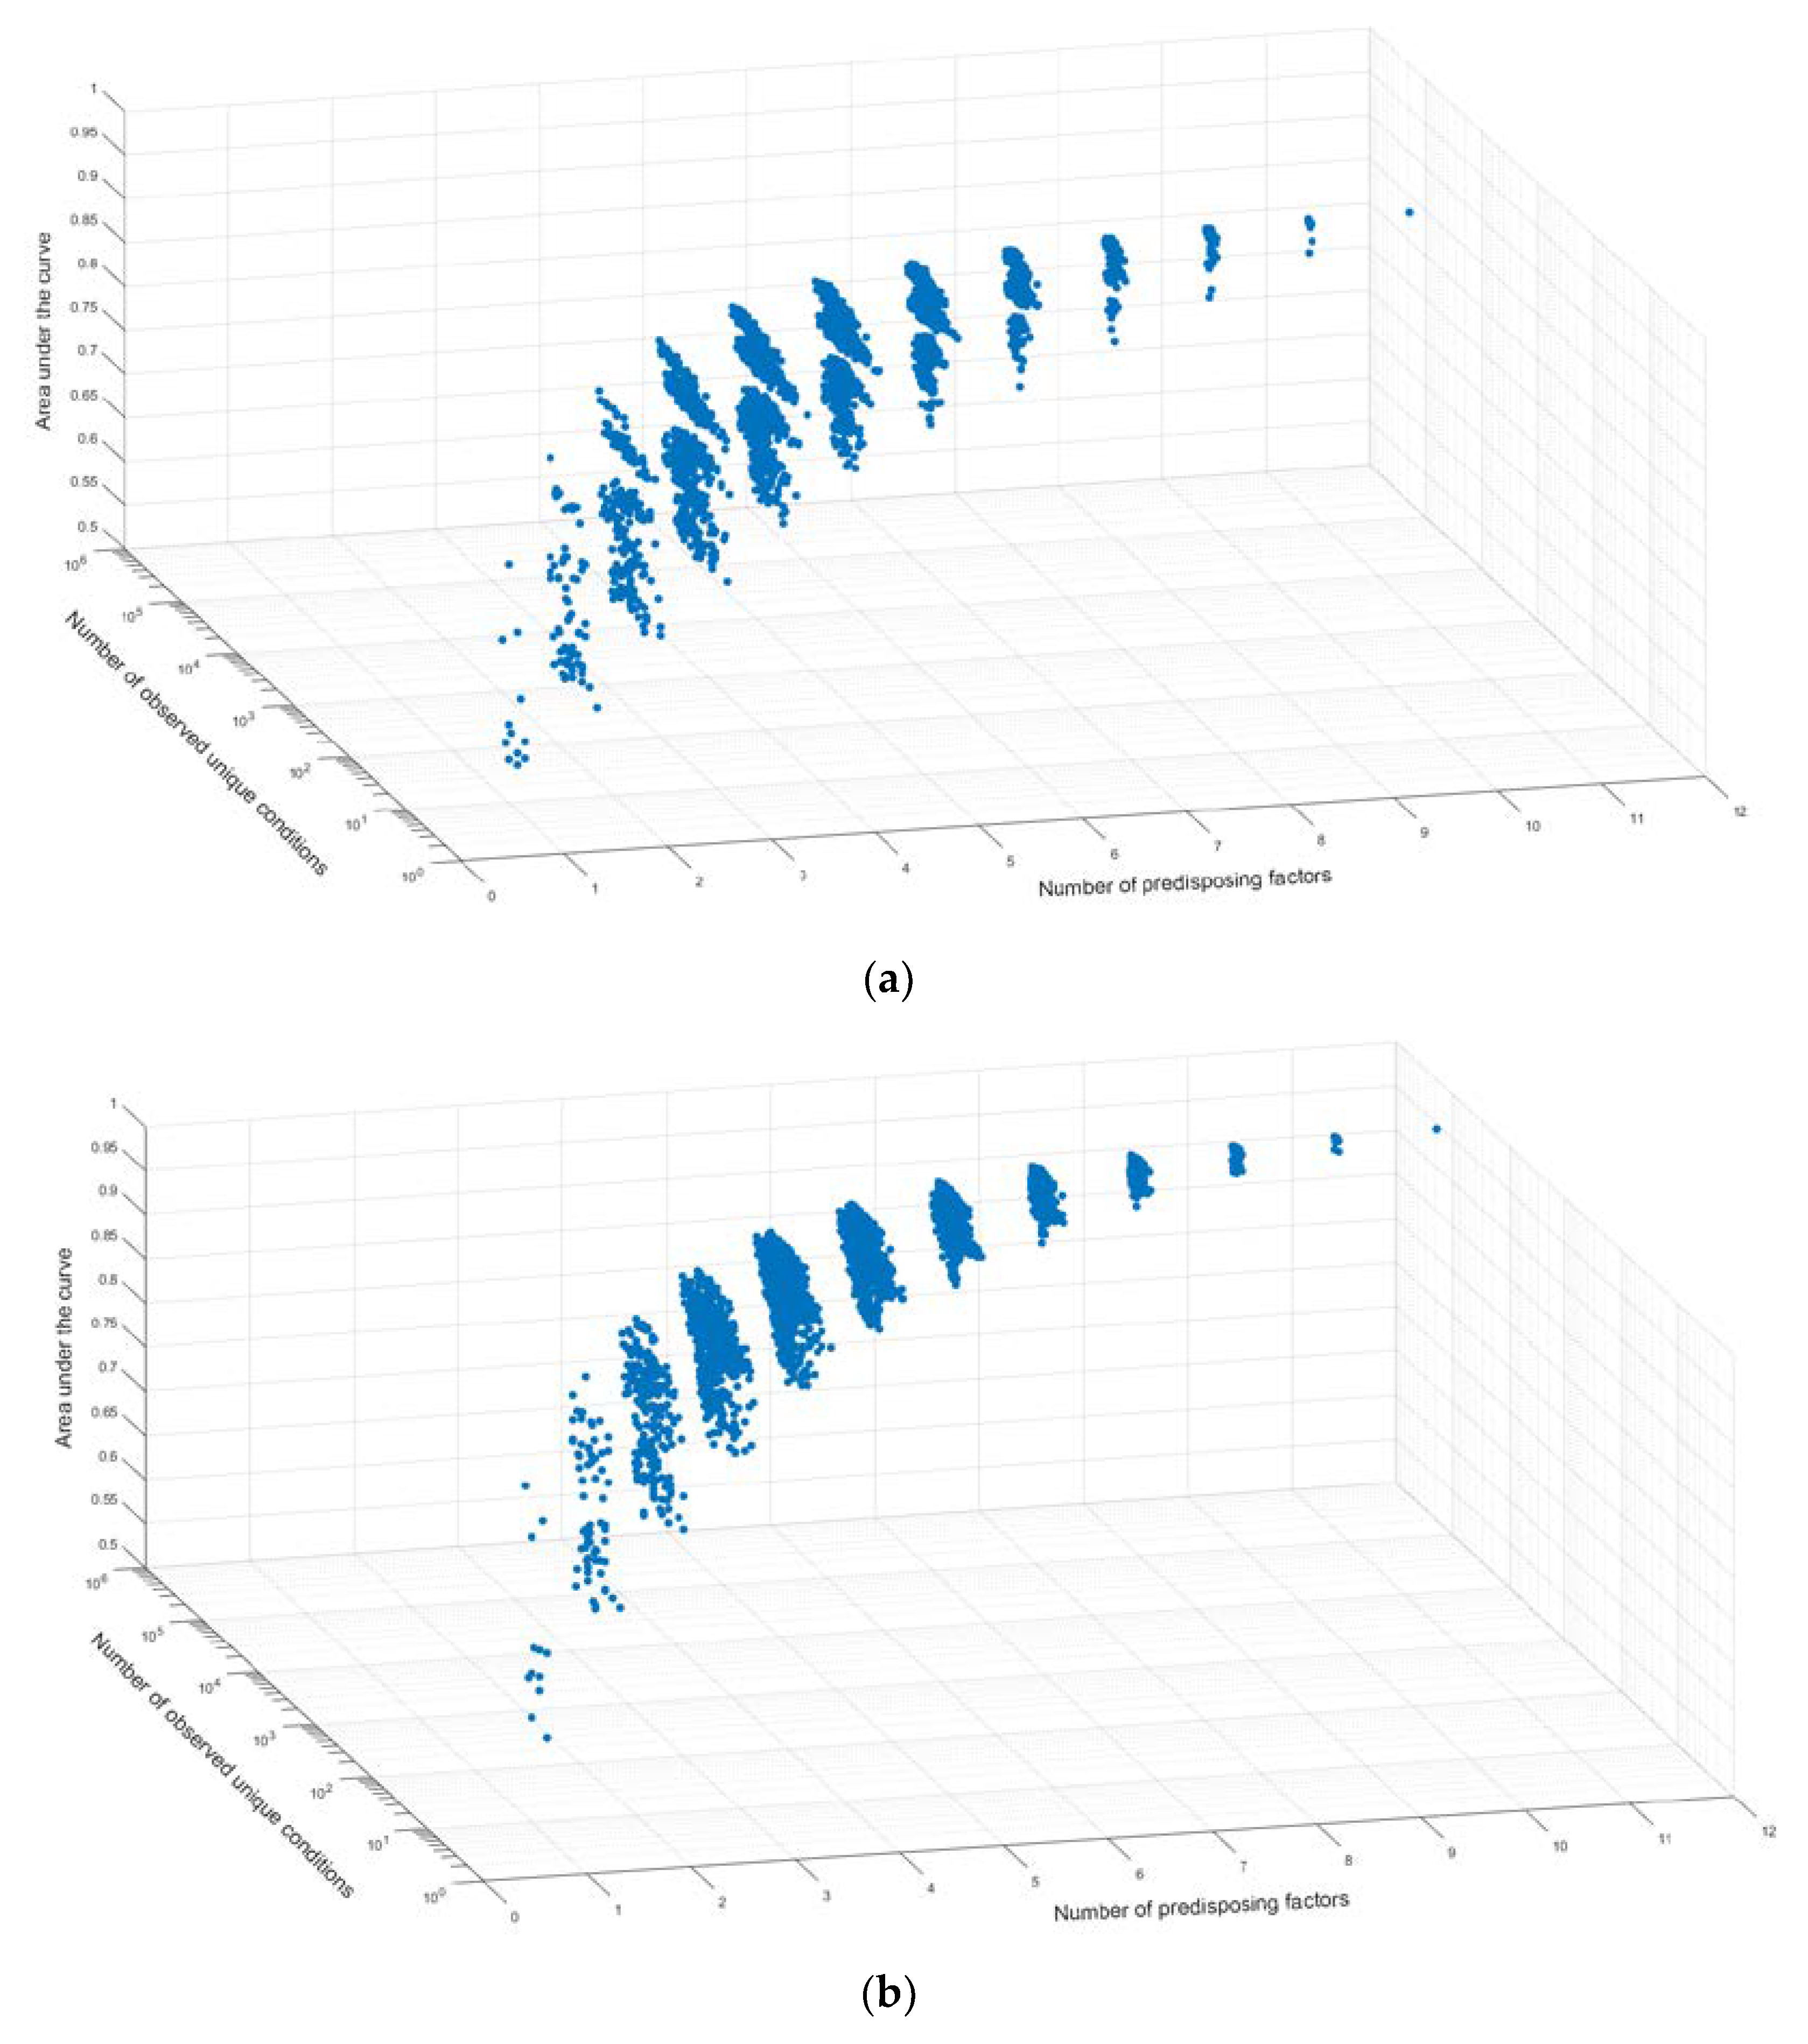
3.5. Selection of the Best Combination of Predisposing Factors

The contribution of the different predisposing factors to the occurrence of landslides varies from region to region [31] due to the geological, geomorphological, climatological, and environmental differences between regions. For this reason, there is no general agreement about the best combination of predisposing factors to use for landslide susceptibility assessment.
In order to find the best predisposing factor combination for the study area, all the possible combinations that could be obtained using the 12 relevant landslide predisposing factors were studied: n N C n N ; n = { 1 , 2 , 3 , N } N = 12 . A total of 4095 different susceptibility models were computed for each landslide typology (Table 3).
For all the studied combinations, the goodness of fit of the generated susceptibility models was assessed using the SRC and by calculating their AUC. The combination with the highest AUC value for each landslide typology was selected as being the best combination of predisposing factors for the study area.

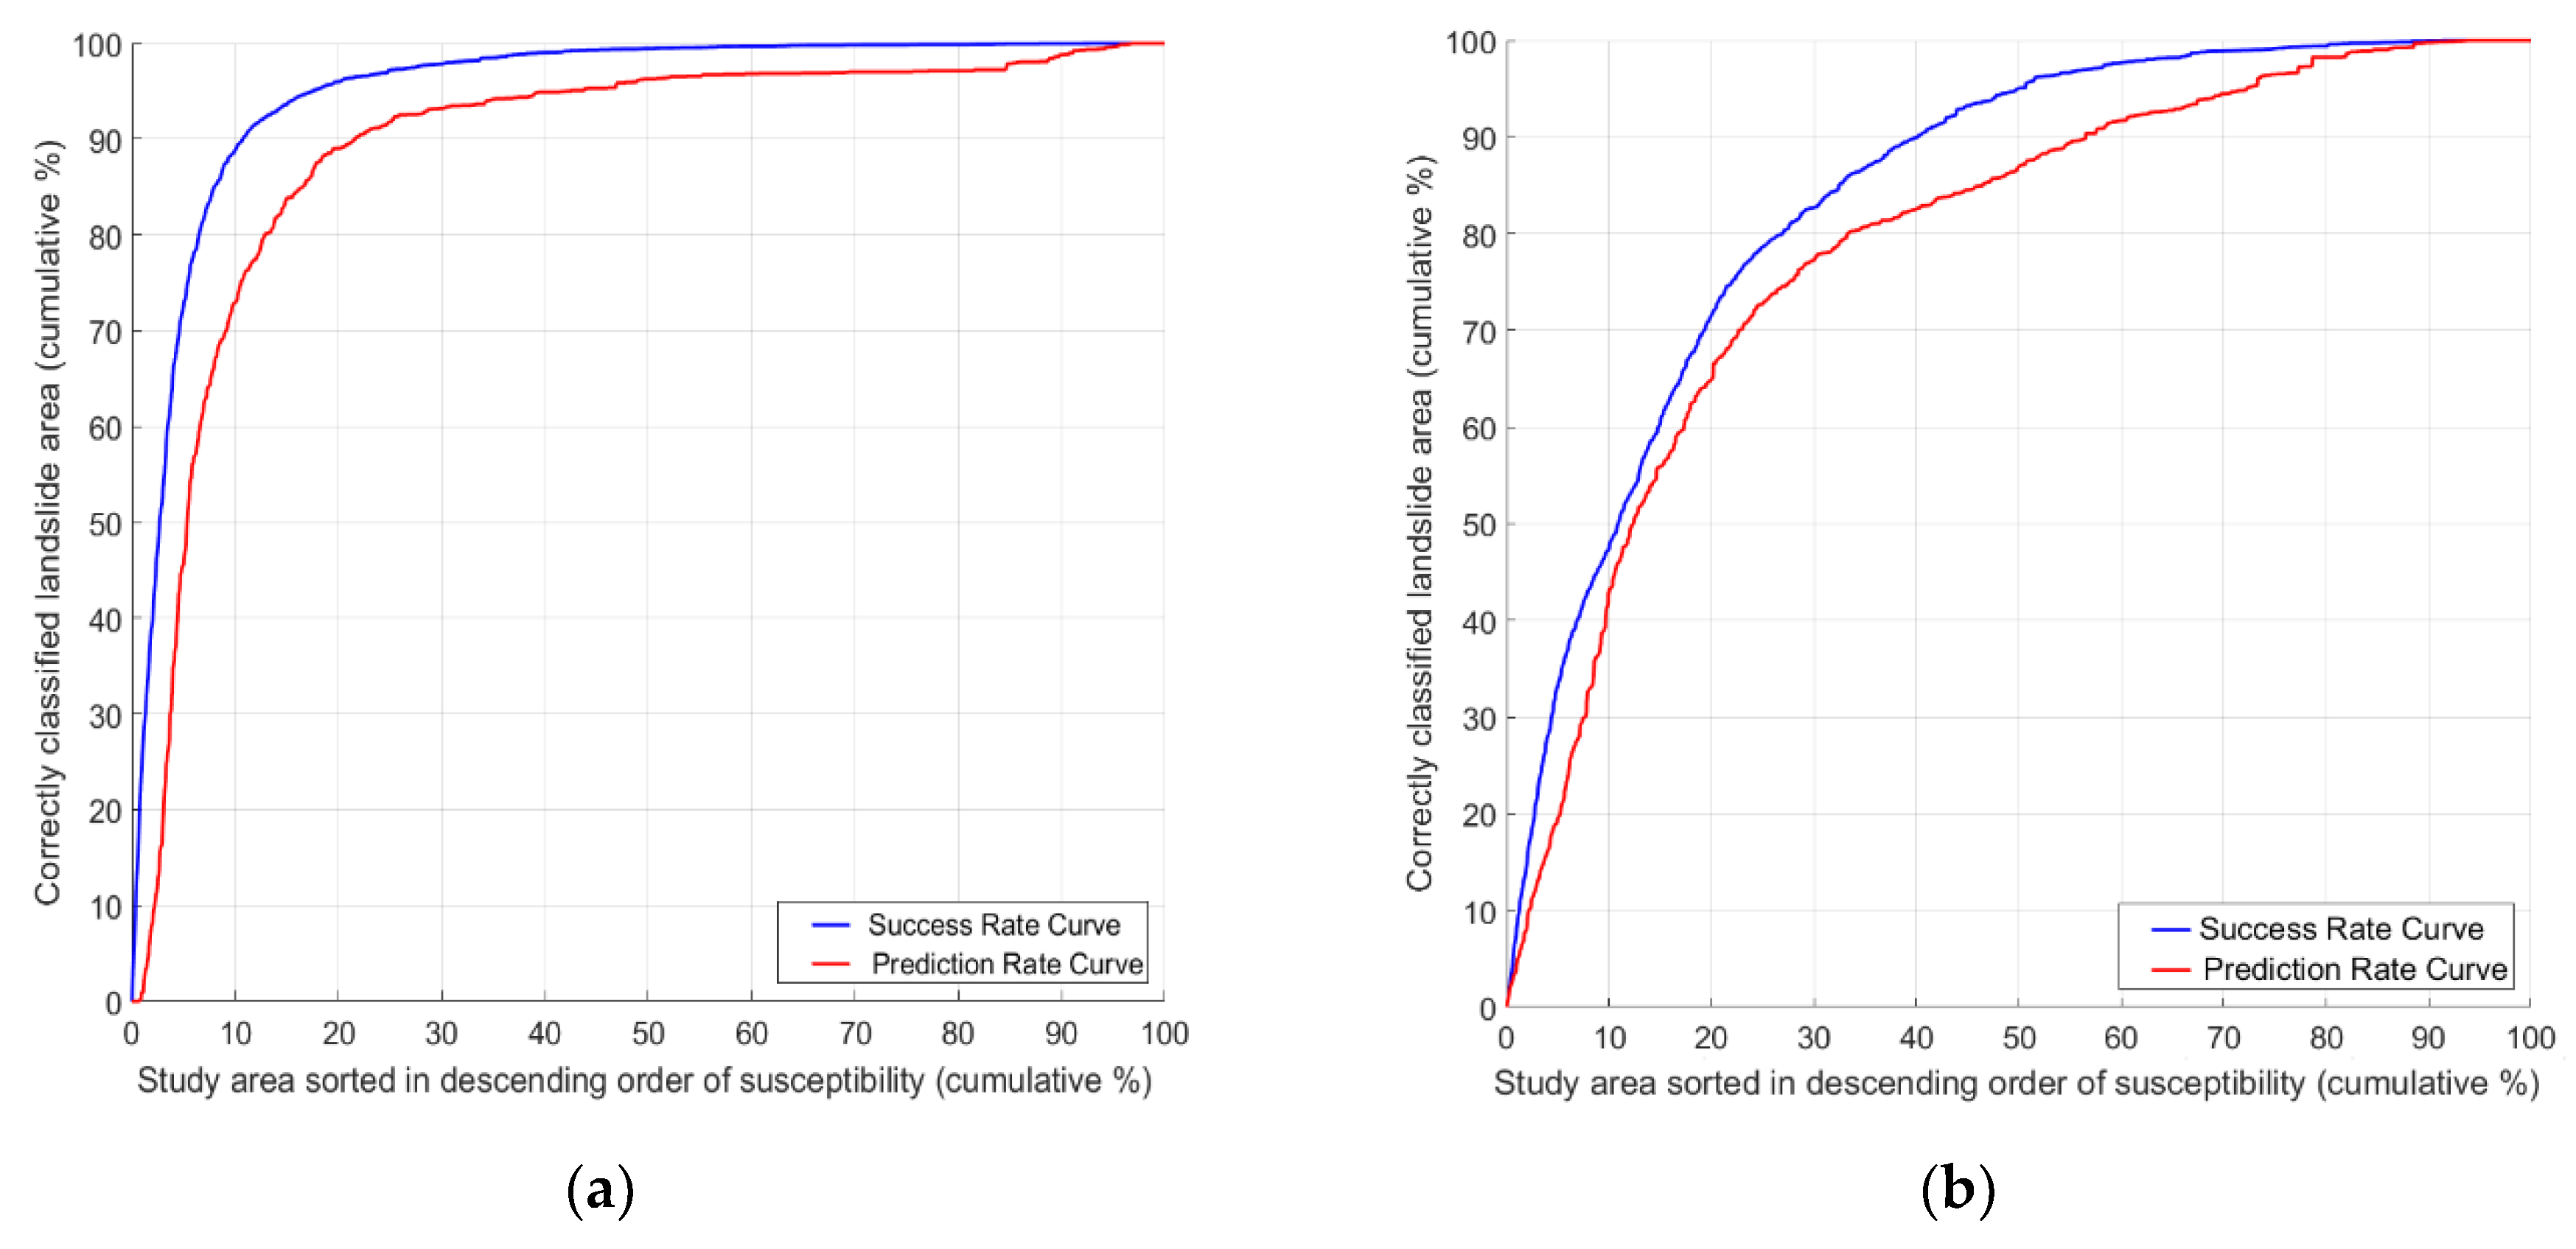
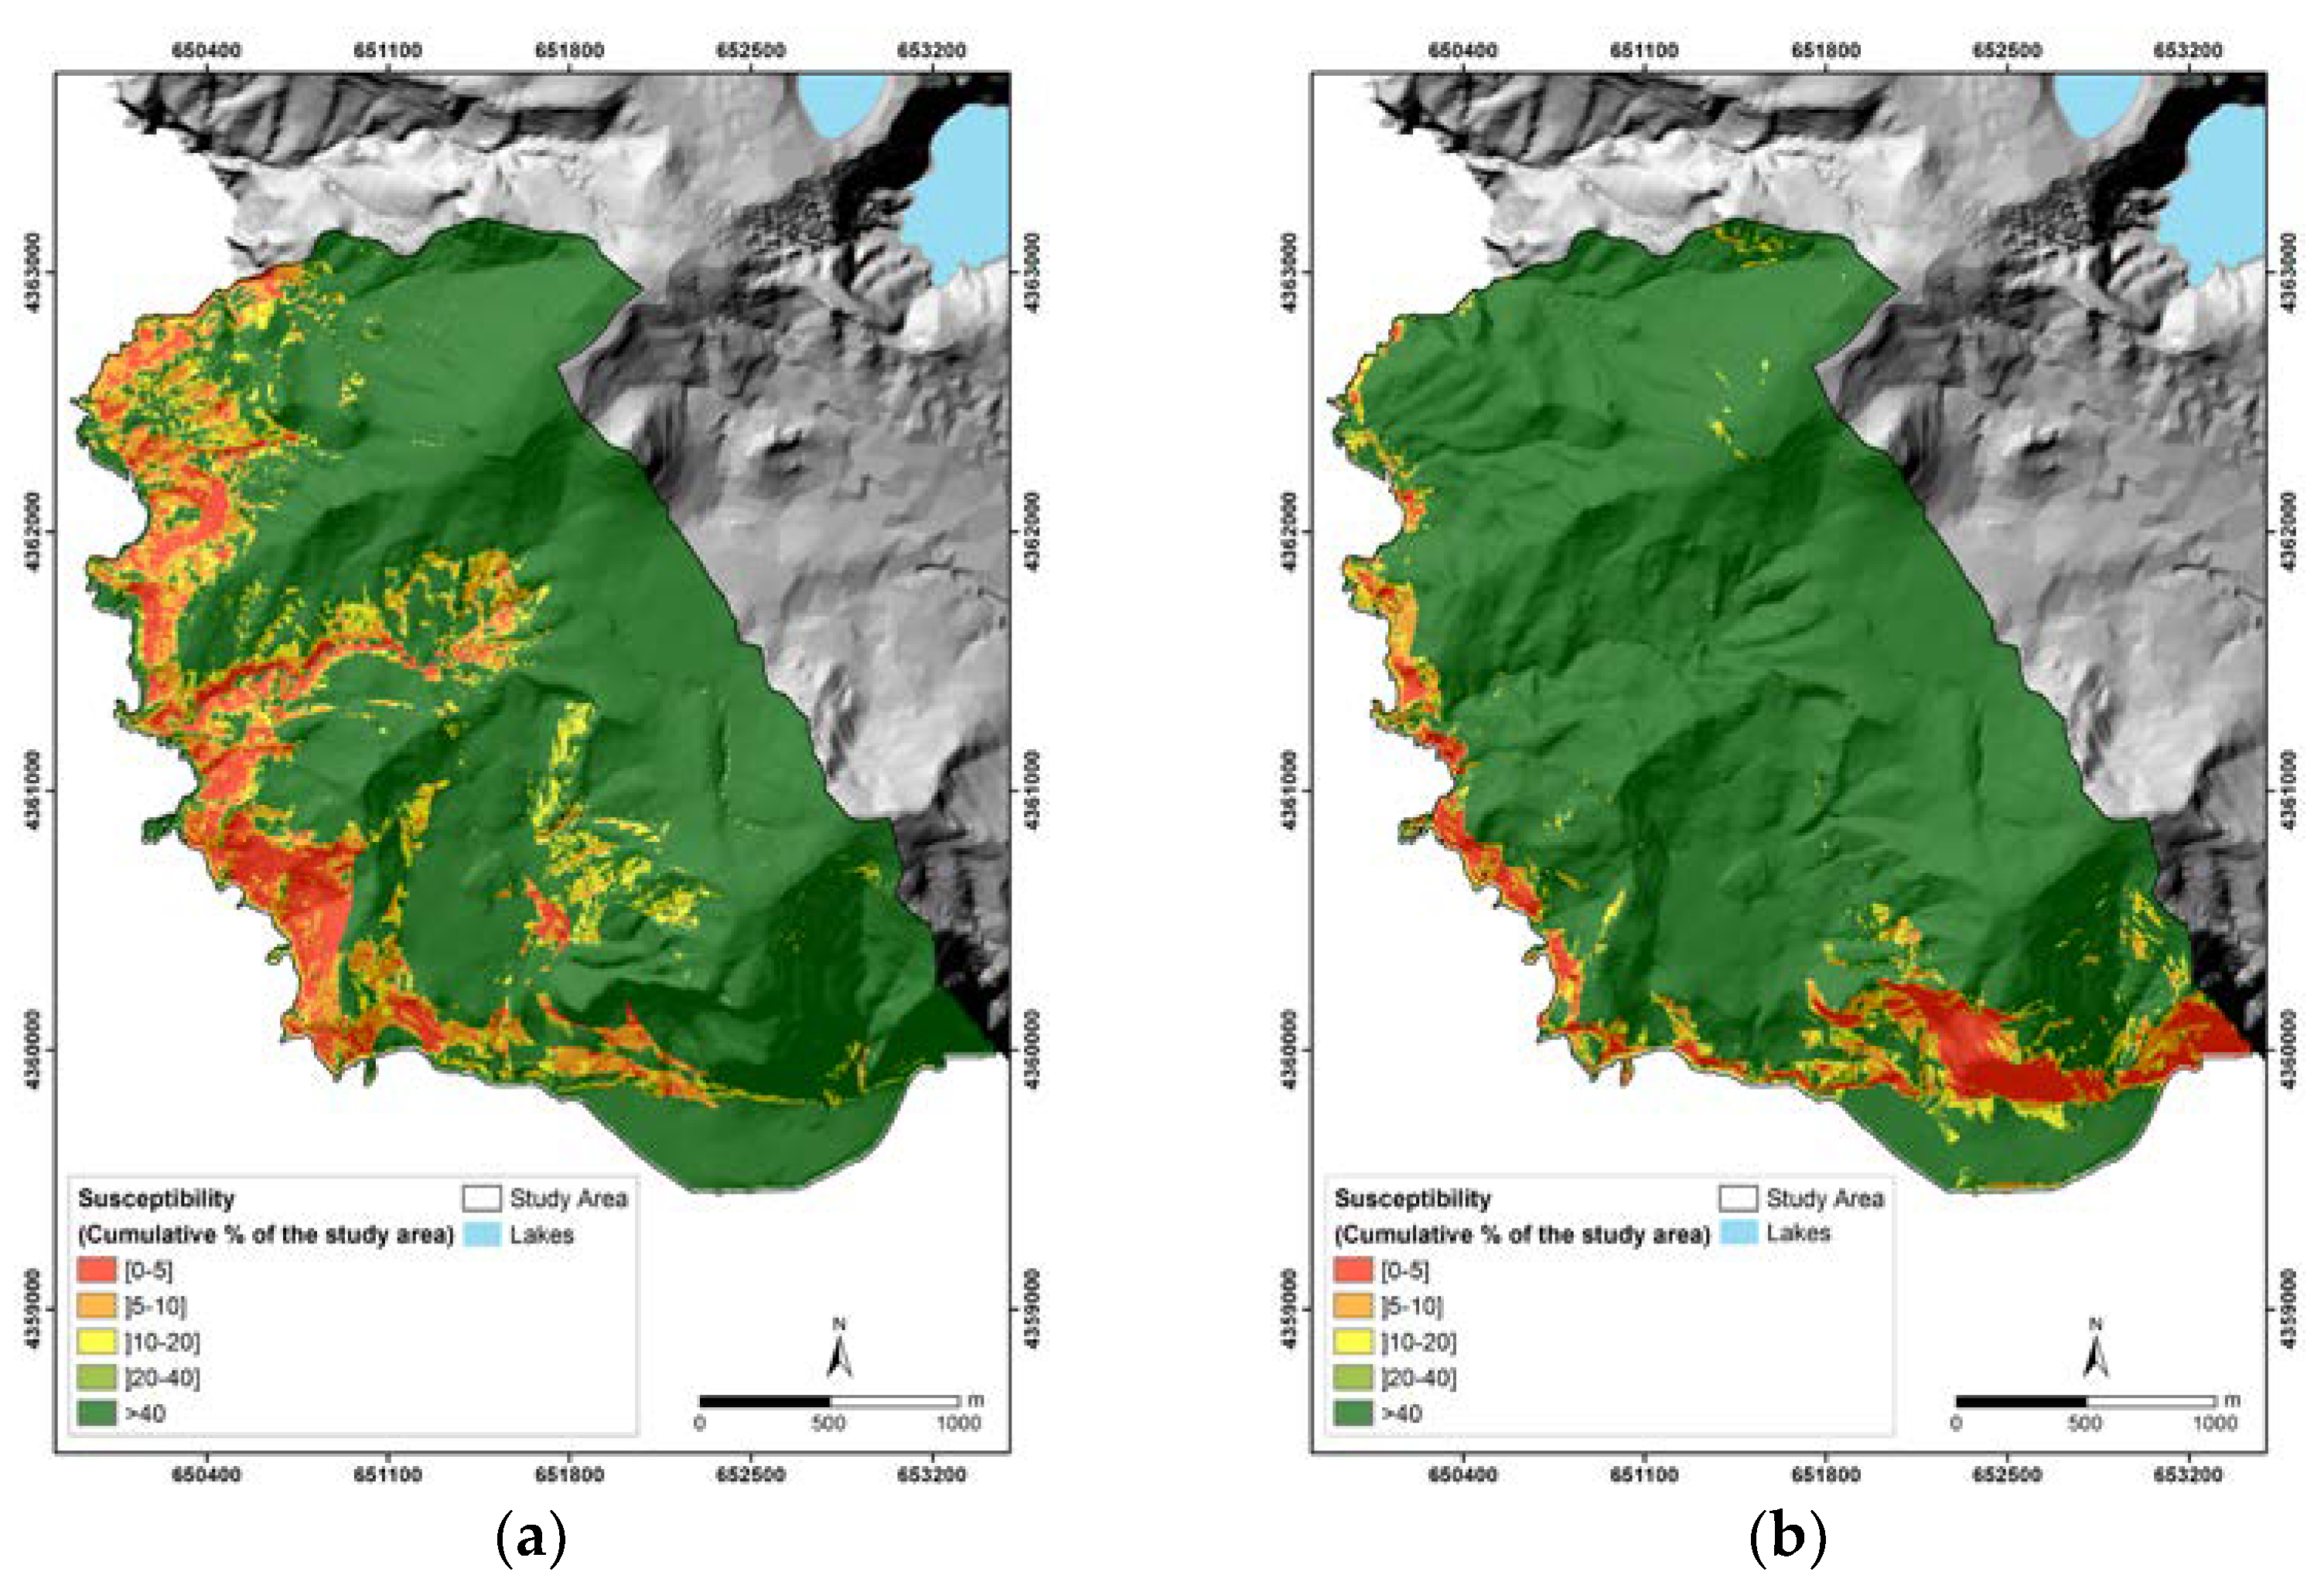
3.6. Predictive Capacity Assessment of the Landslide Susceptibility Maps

The prediction capacity of the models was assessed using the Prediction Rate Curve (PRC) [28] and by calculating their AUC. For the definition of the PRC, it is necessary that the group used to validate the susceptibility map be independent from the group of landslides used to compute the susceptibility model. For this purpose, a random partition for the definition of modeling (MOD) and validation (VAL) of the landslide groups was used.

4. Results and Discussion

The fall (FALL-TOT) and slide (SLD-TOT) inventories and their respective modeling groups (FALL-MOD and SLD-MOD) were cross-tabulated with each predisposing factor class to compute the Ii values (Equation (1)). The obtained results (Table 2) support the following: (i) the inventories, for both typologies, can be considered statistically robust because the obtained Ii values for FALL-TOT and FALL-MOD, as well as for SLD-TOT and SLD-MOD, are very similar (i.e., there is not much variability in the statistical relationships between the landslides and the independent variables with the suppression of 50% of the inventory elements); and (ii) there are significant differences in the computed Ii values for different landslide typologies, which reinforces the importance of considering the landslide typologies independently for modeling landslide susceptibility, as shown by other authors (e.g., the research by Zêzere [32]). Landslide typologies have specific mechanical and hydrological behaviors and, as such, are influenced differently by particular predisposing factors [33,34].
Table 4 shows the AUC values of the SRC obtained for each predisposing factor that allows their hierarchisation. The results allow us to conclude that the slope and geology have importance in the spatial discrimination of the areas where both types of landslide typology occur. The slope occupies the first hierarchical position for the falls, and the third position for the slides. Geology occupies the third hierarchical position for the falls and the first for the slides. Land use and altitude factors occupy the second hierarchical position for both falls and slides. Drainage density occupies the lower hierarchical position for both typologies, as well as the contribution area and the slope transversal profile for the falls, and the stream line distance and the inverse of the wetness index for the slides, revealing their low capacity to discriminate the areas where these landslide typologies occur.
To reinforce the importance of differentiating the landslide typologies for susceptibility analysis, the methodology described in Section 3.4 was applied. In Figure 4 it can be seen that the model obtained for the LAND-TOT group and validated with itself has an AUC of the SRC = 0.853. When this model is validated, considering the FALL-TOT and SLD-TOT groups independently, it can be seen that falls have a better goodness of fit to the LAND-TOT model (AUC of the SRC = 0.938) than slides (AUC of the SRC = 0.721). This difference is justified by the greater spatial abundance of falls in the study area, which promotes the computation of a model that is highly constrained by the statistical relationships between the independent variables and the falls and, consequently, the bias of the model. Due to this fact, during the validation process of the obtained model for LAND-TOT, when this model is used, the AUC of the SRC increases only in the FALL-TOT group, and the AUC of the SRC decreases only in the SLD-TOT group.
The models developed specifically for FALL-TOT and SLD-TOT, and validated with these same groups, show a less significant improvement in the goodness of fit for the falls model (AUC = 0.945) and a very significant improvement for the slides model (AUC = 0.832). The goodness of fit of the model specifically developed for the falls shows a lesser degree of improvement, which is directly associated with the exclusion of the “statistical noise” produced by the slides in the model developed with LAND-TOT, which itself is dominated by the statistical relationships between the predisposing factors and the falls. On the other hand, the model developed specifically for the slides shows a very significant improvement in its goodness of fit to the input data, since it is the only way that the statistical relationships between the predisposing factors and the slides could overlap in the model due to the lesser spatial abundance of slides compared to falls.
Figure 5 shows the susceptibility maps obtained with all predisposing factors, considering the LAND-TOT (Figure 5a), the FALL-TOT (Figure 5b), and the SLD-TOT (Figure 5c). To enable comparisons, the classification of the maps was based on the same criteria; the study area was classified using the cumulative percentage of the area in decreasing order of susceptibility. The susceptibility map produced for the LAND-TOT shows clear similarities with the map obtained for FALL-TOT; however, the map developed for SLD-TOT shows considerable differences when compared with the other two for the reasons stated above. It is important to note that the terrain conditions that are propitious for the occurrence of falls are much more restricted in terms of space than those that provide conditions associated with slides. Therefore, if the landslide typologies were not separated, the areas of higher susceptibility to slides would never be expressed on the map.
All the SRCs resulting from the susceptibility models generated for both landslide typologies are presented in Figure 6. The SRC is represented by red lines and corresponds to the model obtained from the best combination of predisposing factors for falls (Figure 6a) and slides (Figure 6b), with an AUC of 0.95 and 0.84, respectively. For both landslide typologies, the best susceptibility models were developed with seven predisposing factors: slope angle, slope aspect, insolation, drainage density, contributing area, geology, and land use. It is important to note that the best models achieved are not exclusively obtained from the combination of predisposing factors with higher discrimination capacity (Table 4). This shows that, contrary to what some authors have attempted (e.g., Zêzere et al. [35], Blahut et al. [36] and Piedade et al. [37]), adding predisposing factors successively to the model, in decreasing order of their discrimination ability, does not guarantee that the best combination of factors to produce the best landslide susceptibility model is found.
The results presented in Figure 6 show an important variation in the goodness of fit of the models resulting from the number of predisposing factors used to compute the models. In general, the goodness of fit of the models developed for falls (AUC of the SRC = [0.61, 0.95]) is better than that of the models developed for slides (AUC of the SRC = [0.54, 0.84]) as a consequence of falls being associated with a more restricted range of terrain conditions when compared with the wider variability of conditions under which slides occur in the study area.
In plotting the AUC of the SRC versus the number of predisposing factors used for modelling, it becomes clear that there is an increase in the goodness of fit average of the models with an increase in the number of predisposing factors for both typologies (Figure 7). Associated with this increase, there is a clear decrease in the variability and consequently a stagnation of the best result obtained for the models.
In order to understand the reason for the decrease of the variability of the models’ goodness of fit and the stagnation of the best result obtained with an increase in the number of factors, the number of expected and observed unique terrain conditions for each model was calculated (Figure 8). The analysis of the results shows that the number of expected unique terrain conditions exhibits a regular exponential growth with the increase of predisposing factors. However, the increasing trend of the observed unique terrain conditions behaves very differently. The growth rate of the observed unique conditions decreases with the successive inclusion of predisposing factors, moving away from the expected growth trend of the unique terrain conditions. This disparity in the growth rates is even higher after the addition of the seventh predisposing factor. This can be explained by the natural conditional dependence between some of the predisposing factors which prevents the development of observed unique conditions even when they are expected theoretically. Due to the fact that a statistical method is used in this study, the violation of conditional independence between predisposing factors used in the susceptibility assessment is negligible when it is intended to support the hierarchisation of susceptibility for a given area [36].
Figure 9 shows the values of the AUC of the SRC according to the number of predisposing factors used in each model and the observed unique terrain conditions. For both landslide typologies, the inability of the territory to generate new unique conditions with the addition of predisposing factors clearly decreases the variability of the results and increases the goodness of fit of the susceptibility models.
In Figure 10, the SRC and the PRC of the best landslide susceptibility models developed for falls (Figure 10a) and slides (Figure 10b) are presented.
The results show that the SRC and PRC for both landslide typologies have a similar pattern and the differences between the curves are small due to the statistical robustness of the landslide inventory. The AUCs of the SRC are 0.95 and 0.89 for falls and slides, respectively; values that, according to Guzzetti (2005) [38], are typical of excellent susceptibility models. The AUCs of the PRC are 0.84 and 0.79 for falls and slides, respectively. For falls and slides, the 25% of the study area that is recognized as more susceptible includes 97% and 79% of the unstable area, respectively.
The final landslide susceptibility maps for falls and slides (Figure 11) show that the areas of higher susceptibility to falls are located along very steep sea cliffs that are composed of fractured rocks, under conditions that are very restricted in the study area (Figure 11a). On the other hand, the highest susceptibility areas to slides occupy wider areas along incised stream valleys and other steep slopes composed of older and very weathered materials (Figure 11b).

5. Conclusions

The results obtained in this paper demonstrate that the influence and the weight of the predisposing factors for landslide susceptibility analysis are very different depending on the landslide typology, and support the importance of discriminating landslides by typology.
It was also verified that, if one of the landslide typologies has greater spatial abundance in the study area, and if the susceptibility models are computed based on a total inventory, the statistical relationships between the predisposing factors and landslides will be controlled by the dominant landslide typology. In these cases, the model will suffer a bias as strong as the difference in spatial abundance between the different landslide typologies. Thus, discrimination of landslides by typology is the only way to ensure that the computed statistical relationships between the predisposing factors and the landslides are preserved.
By applying the Information Value method to all of the 4095 possible predisposing factor combinations for each typology, it was concluded that the best combination for both typologies included seven predisposing factors: slope angle, slope aspect, insolation, drainage density, contributing area, geology, and land use. For falls and slides, the best fitted models have an Area Under the Curve of the Success Rate Curve of 0.95 and 0.84, respectively. It is important to note that these models are not exclusively the result of a combination of predisposing factors with the best spatial discrimination capacity, but rather are formed by a combination of factors with heterogeneous degrees of discriminative capacity. Thus, systematically adding predisposing factors to the susceptibility models, in reverse order to their spatial discriminant capacity, does not mean that the best possible combination of factors will be obtained in order to compute the best fitted susceptibility model.
Another conclusion of this work is that, with an increasing number of predisposing factors used to compute the susceptibility models, the number of unique terrain conditions observed and the goodness of fit of the susceptibility models tend to increase in a non-linear way. Nevertheless, there is a clear attenuation of the average goodness of fit of the models with the increase in the number of predisposing factors. Related to this increase, there is a clear decrease in the variability and a stagnation of the best result obtained for the models. It was concluded that this trend is related to the inability of the territory to generate the observed unique terrain conditions with the ongoing addition of predisposing factors. Therefore, at a certain point, the increase in predisposing factors will only increase the computational weight, and therefore the time required to generate the resulting landslide susceptibility model.
Authorities and decision makers need landslide susceptibility maps for land-use and emergency planning, and therefore the implications of landslide typology and predisposing factor combinations on probabilistic landslide susceptibility models should be quantified. Landslide susceptibility maps can also support the implementation of site-specific risk mitigation measures and prioritize detailed geotechnical investigations.

Author Contributions

Conceptualization, R.F.S., R.M. and J.L.G.; Methodology,R.F.S., R.M. and J.L.G.; Validation, Rui R.F.S., R.M. and J.L.G.; Writing-Original Draft Preparation, R.F.S., R.M. and J.L.G.

Funding

This research is supported by the Operational Program of the Azores 2020 through the project DECISIONLARM “Development and implementation of a decision support system for alert and alarm to landslides with the use of kinematic and hydrological monitoring and hydrological and geotechnical modeling” (ACORES-01-0145-FEDER-000055). The project is coordinated by the Regional Civil Engineering Laboratory (LREC) in co-promotion with the Centre for Information and Seismovolcanic Surveilance of the Azores (CIVISA).

Acknowledgments

The authors are grateful to the journal reviewers whose comments and suggestions helped to improve the manuscript.

Conflicts of Interest

The authors declare no conflict of interest.

References

  1. Schuster, R.L. Socio-economic significance of landslides. In Landslides Investigation and Mitigation; Turner, A.K., Schuster, R.L., Eds.; Transportation Research Board, National Academy Press: Washington, DC, USA, 1996; pp. 12–35. [Google Scholar]
  2. Guzzetti, F.; Carrara, A.; Cardinali, M.; Reichenbach, P. Landslide hazard evaluation: A review of current techniques and their application in a multi-scale study, Central Italy. Geomorphology 1999, 31, 181–216. [Google Scholar] [CrossRef]
  3. Bathrellos, G.D.; Skilodimou, H.D.; Chousianitis, K.; Youssef, A.M.; Pradhan, B. Suitability estimation for urban development using multi-hazard assessment map. Sci. Total Environ. 2017, 575, 119–134. [Google Scholar] [CrossRef] [PubMed]
  4. Youssef, A.M.; Pradhan, B.; Sefry, S.A.; Abu Abdullah, M.M. Use of geological and geomorphological parameters in potential suitability assessment for urban planning development at Wadi Al-Asla basin, Jeddah, Kingdom of Saudi Arabia. Arab. J. Geosci. 2015, 8, 5617–5630. [Google Scholar] [CrossRef]
  5. Soeters, R.; Van Westen, C.J. Slope Instability, recognition, analysis and zonation. In Landslides Investigation and Mitigation; Turner, A., Schuster, R., Eds.; Transportation and Research Board, National Research Council, National Academy Press: Washington, DC, USA, 1996; pp. 129–177. [Google Scholar]
  6. Zêzere, J.L.; Reis, E.; Garcia, R.; Oliveira, S.; Rodrigues, M.L.; Vieira, G.; Ferreira, A.B. Integration of spatial and temporal data for the definition of different landslide hazard scenarios in the area north of Lisbon (Portugal). Nat. Hazards Earth Syst. 2004, 4, 133–146. [Google Scholar] [CrossRef]
  7. Crozier, M.J.; Glade, T. Landslide hazard and risk: Issues, concepts and approach. In Landslide Risk Assessment; Glade, T., Anderson, M.G., Crozier, M.J., Eds.; John Wiley: Chichester, UK, 2005; pp. 1–40. [Google Scholar]
  8. Reichenbach, P.; Rossi, M.; Malamud, B.; Mihir, M.; Guzzetti, F. A review of statistically-based landslide susceptibility models. ‎Earth-Sci. Rev. 2018, 180, 60–91. [Google Scholar] [CrossRef]
  9. Thiery, Y.; Malet, J.-P.; Sterlacchini, S.; Puissant, A.; Maquaire, O. Landslide susceptibility assessment by bivariate methods at large scales: Application to a complex mountainous environment. Geomorphology 2007, 92, 38–59. [Google Scholar] [CrossRef] [Green Version]
  10. Felicísimo, A.; Cuatero, A.; Remondo, J.; Quirós, E. Mapping landslide susceptibility with MLR, MARS, CART and MAXENT methods: A comparative study. Landslides 2013, 10, 175–189. [Google Scholar] [CrossRef]
  11. Steger, S.; Brenning, A.; Bell, R.; Glade, T. The impact of systematically incomplete and positionally inaccurate landslide inventories on statistical landslide susceptibility models. Nat. Hazards Earth Syst. 2016, 16, 2729–2745. [Google Scholar] [CrossRef]
  12. Zêzere, J.L.; Pereira, S.; Melo, R.; Oliveira, S.C.; Garcia, R.A.C. Mapping landslide susceptibility using data-driven methods. Sci. Total Environ. 2017, 589, 250–267. [Google Scholar] [CrossRef] [PubMed]
  13. Steger, S.; Glade, T. The Challenge of “Trivial Areas” in Statistical Landslide Susceptibility Modelling. In Advancing Culture of Living with Landslides; Mikos, M., Tiwari, B., Yin, Y., Sassa, K., Eds.; Springer: Cham, Switzerland, 2017; pp. 803–808. [Google Scholar]
  14. INE. Regional Government of the Azores. Census 2011: Definitive Results: XV General Population Census: V General Housing Census; INE: Lisbon, Portugal, 2012; p. 98. [Google Scholar]
  15. Camões, J.A. Works—Memory of Flores Island; Lajes das Flores, Portugal, Municipality of Lajes das Flores: Lajes das Flores, Portugal, 2006; p. 57. First published 1822. (In Portuguese) [Google Scholar]
  16. Silveira, J.A. Annals of the Municipality of Lajes das Flores; Municipality of Lajes das Flores: Lajes das Flores, Portugal, 1970; p. 58. (In Portuguese) [Google Scholar]
  17. Macedo, A.L.S. History of the Four Islands that Form the Horta District; Regional Government of the Azores: Azores, Portugal, 1981. (In Portuguese)
  18. Borges, P.; Andrade, C.; Freitas, M.C. Historical Tsunamis on the Faial Island (Azores–Portugal). In Earthquake 1998—Azores, A Decade Later; Oliveira, C.S., Costa, A., Nunes, J.C., Eds.; Regional Government of the Azores/SPRHI: Azores, Portugal, 2008; pp. 707–716. (In Portuguese) [Google Scholar]
  19. Azevedo, J.M. Geology and Hydrogeology of the Flores Island, Azores. Ph.D. Thesis, Coimbra University, Coimbra, Portugal, 1999. (In Portuguese). [Google Scholar]
  20. Azevedo, J.M.; Portugal Ferreira, M.R. The volcanotectonic evolution of Flores Island, Azores (Portugal). J. Volcanol. Geotherm. Res. 2006, 156, 90–102. [Google Scholar] [CrossRef]
  21. Instituto Geográfico do Exército (IGeoE). Cartography of the Flores Island (Azores). 1:25,000 Scale; IGeoE: Lisbon, Portugal, 2000. (In Portuguese) [Google Scholar]
  22. Tarboton, D.G.; Sazib, N.; Dash, P. TauDEM 5.3: Quick Start Guide to Using the Taudem Arcgis Tool Box. Available online: http://hydrology.usu.edu/taudem/taudem5/TauDEM53GettingStartedGuide.pdf (accessed on 10 March 2018).
  23. SRAM. Occupation Map of the Soil of the Autonomous Region of the Azores No.8—Flores Island. Scale 1:50,000; Regional Secretariat for the Environment and the Sea of the Regional Government of the Azores: Azores, Portugal, 2007. (In Portuguese)
  24. Yin, K.; Yan, T. Statistical prediction models for slope instability of metamorphosed rocks. In Proceedings of the Fifth International Symposium on Landslides, Rotterdam, The Netherlands, 10–15 July 1988; pp. 1269–1272. [Google Scholar]
  25. Cruz de Oliveira, S.; Rocha, J.; Zêzere, J.L.; Garcia, R.A.C.; Piedade, A. Evaluation of susceptibility to rotational landslides by applying statistical methods. In Cartografia e Geodesia 2009; LIDEL: Lisbon, Portugal, 2009; pp. 530–539. [Google Scholar]
  26. Marques, R.; Amaral, P.; Zêzere, J.L.; Queiroz, G.; Goulart, C. A Comparative Study of Different Probabilistic Methods for the Evaluation of Susceptibility to the Occurrence of Landslides: A Case Study from the Ribeira Quente Valley (S. Miguel, Azores); Publications of the Portuguese Association of Geomorphology: Porto, Portugal, 2009; pp. 183–190. (In Portuguese) [Google Scholar]
  27. Marques, R. Study of Landslides in the Povoação Municipality (São Miguel Island, Azores): Inventory, Characterization and Susceptibility Analysis. Ph.D. Thesis, Geosciences Department, University of the Azores, Ponta Delgada, Portugal, 2013. (In Portuguese). [Google Scholar]
  28. Chung, C.; Fabbri, A. Probabilistic prediction models for landslide hazard mapping. Photogramm. Eng. Rem. S 1999, 65, 1389–1399. (In Portuguese) [Google Scholar]
  29. Fratinni, P.; Crosta, G.; Carrara, A. Techniques for evaluating the performance of landslide susceptibility models. Eng. Geol. 2010, 111, 62–72. [Google Scholar] [CrossRef]
  30. Pereira, S.; Zêzere, J.L.; Bateira, C. Technical Note: Assessing predictive capacity and conditional independence of landslide predisposing factors for shallow landslide susceptibility models. Nat. Hazards Earth Syst. 2012, 12, 979–988. [Google Scholar] [CrossRef] [Green Version]
  31. Glade, T.; Crozier, M.J. The nature of landslide impact. In Landslide Hazard and Risk; John Wiley: Chichester, UK, 2005; pp. 43–74. [Google Scholar]
  32. Zêzere, J.L. Landslide susceptibility assessment considering landslide typology. A case study in the area north of Lisbon (Portugal). Nat. Hazards Earth Syst. 2002, 2, 73–82. [Google Scholar] [CrossRef]
  33. Cruden, D.M.; Varnes, D.J. Landslides types and processes. In Landslides Investigation and Mitigation; Special Report 247; Transportation Research Board, National Research Council: Washington, DC, USA, 1996; pp. 36–75. [Google Scholar]
  34. Crozier, M.J. Landslides: Causes, Consequences & Environment; Croom Helm Pub.: London, UK, 1986; 252p. [Google Scholar]
  35. Zêzere, J.L.; Oliveira, S.C.; Garcia, R.A.C; Reis, E. Weighting predisposing factors for shallow slides susceptibility assessment at the regional scale. In Landslides and Engineered Slopes. From the Past to the Future; Chen, Z., Zhang, J., Li, Z., Wu, F., Ho, K., Eds.; Taylor & Francis Group: London, UK, 2008; pp. 1831–1837. [Google Scholar]
  36. Blahut, J.; van Westen, C.J.; Sterlacchini, S. Analysis of landslide inventories for accurate prediction of debris-flow source areas. Geomorphology 2010, 119, 36–51. [Google Scholar] [CrossRef]
  37. Piedade, A.; Zêzere, J.L.; Garcia, R.A.C.; Oliveira, S.C. Sensitive analysis of predisposing factors to geomorphological instability in the area north of Lisbon. In Proceedings of the V National Congress of Geomorphology; Bateira, C., Soares, L., Gomes, A., Chaminé, H.I., Eds.; Publications of the Portuguese Association of Geomorphology: Porto, Portugal, 2010; pp. 59–63. [Google Scholar]
  38. Guzzetti, F. Landslide Hazard and Risk Assessment—Concepts, Methods and Tools for the Detection and Mapping of Landslides, for Landslides Susceptibility Zonation and Hazard Assessment, and for Landslide Risk Evaluation. Ph.D. Thesis, University of Bonn, Bonn, Germany, 2005. [Google Scholar]
Figure 1. Location of the study area on Flores Island in the Azores archipelago.
Geosciences 08 00153 g001
Figure 2. (a) Landslide inventory map; (b) Example of a slide at Lajedo (photo by the authors); (c) Example of a fall at Costa (photo by the authors).
Geosciences 08 00153 g002
Figure 3. Landslide predisposing factors considered for the susceptibility analysis: (a) altitude; (b) slope angle; (c) slope aspect; (d) slope transversal profile; (e) slope longitudinal profile; (f) contribution area; (g) inverse of the wetness index; (h) geology; (i) insolation; (j) stream lines distance; (k) drainage density; and (l) land use.
Geosciences 08 00153 g003aGeosciences 08 00153 g003b
Figure 4. Success Rate Curves (SRCs) and their Areas Under the Curve (AUCs) for the different models.
Geosciences 08 00153 g004
Figure 5. Landslide susceptibility maps for: (a) LAND-TOT group; (b) FALL-TOT group; (c) SLD-TOT group.
Geosciences 08 00153 g005
Figure 6. Success Rate Curves (SRCs) resulting from the 4095 susceptibility models computed for: (a) falls and (b) slides.
Geosciences 08 00153 g006
Figure 7. Susceptibility models’ goodness of fit versus the number of predisposing factors used for modeling for: (a) falls and (b) slides.
Geosciences 08 00153 g007
Figure 8. Expected and observed number of unique terrain conditions for different numbers of predisposing factors used in the susceptibility models.
Geosciences 08 00153 g008
Figure 9. Variation susceptibility models’ goodness of fit relative to the number of predisposing factors used in the susceptibility models and the observed unique terrain conditions for: (a) falls and (b) slides.
Geosciences 08 00153 g009
Figure 10. Success and Prediction Rate Curves for the best landslide susceptibility models, developed for: (a) falls and (b) slides.
Geosciences 08 00153 g010
Figure 11. Final landslide susceptibility maps computed for: (a) falls and (b) slides.
Geosciences 08 00153 g011
Table 1. Landslide inventory resume.
TypologySubsetsNo of LandslidesInstability Area (m2)Density (no Landslides/km2)No of Pixels (5 m × 5 m)
Falls (FALL)Modeling (FALL-MOD)43185,991.45.67424
Validation (FALL-VAL)12862,569.516.62459
Total (FALL-TOT)171248,560.922.19883
Slides (SLD)Modeling (SLD-MOD)15273,481.419.73106
Validation (SLD-VAL)15187,216.919.53313
Total (SLD-TOT)303160,698.439.26419
Total (LAND-TOT)474409,259.361.316,302
Table 2. Predisposing factor classes and their Information Values (Ii), computed using FALL-TOT (Ii F-TOT), FALL-MOD (Ii F-MOD), SLD-TOT (Ii S-TOT) and SLD-MOD (Ii S-MOD) as dependent variables.
Predisposing FactorsClassesFallSlide
Ii F-TOTIi F-MODIi S-TOTIi S-MOD
Altitude (m)[0–100]0.8830.3350.6810.640
]100–200]−0.424−0.3070.6280.730
]200–300]−0.383−0.097−0.390−0.691
]300–400]0.3040.590−0.404−0.611
]400–500]−0.2200.066−2.288 *−2.331 *
]500–600]−1.455 *−1.169 *−1.073 *−0.550
]600–680]−1.455 *−1.169 *−2.774 *−2.331 *
Slope angle (°)[0–5]−5.230 *−5.232 *−2.042 *−1.904 *
]5–10]−5.232 *−4.946 *−2.315 *−1.906 *
]10–15]−1.713 *−1.538 *−1.456 *−0.901
]15–20]−2.247 *−2.105 *−0.462−0.091
]20–25]−1.924 *−2.090 *−0.0710.128
]25–30]−1.096 *−1.391 *0.1740.254
]30–35]−0.574−0.9040.3690.303
]35–40]0.115−0.3330.5640.350
]40–45]0.6250.2580.6960.509
]45–50]1.063 **0.8830.8530.636
]50–55]1.536 **1.580 **0.527−0.007
]55–60]1.640 **1.703 **0.371−0.195
]60–90]2.548 **2.786 **−0.542−0.605
AspectFlat−3.270 *−4.243 *−2.301 *−1.671 *
North−2.515 *−3.695 *0.4350.831
Northeast−1.393 *−4.243 *−0.730−0.481
East−3.270 *−2.984 *−0.880−0.704
Southeast−0.606−0.425−0.0720.524
South0.5580.6600.2330.207
Southwest0.6290.6340.209−0.360
West−0.164−0.349−0.093−0.067
Northwest−2.046 *−2.774 *−0.422−0.461
Slope transversal profileVery concave0.7560.7490.6630.698
Concave−0.044−0.0860.1870.196
Rectilinear−1.753 *−1.687 *−1.065 *−0.898 *
Convex−0.121−0.107−0.127−0.167
Very convex0.8620.920−0.164−0.177
Slope longitudinal profileVery concave1.075 **1.175 **0.2010.109
Concave−0.551−0.674−0.0240.000
Rectilinear−2.479 *−2.462 *−1.270 *−1.121 *
Convex−0.450−0.5850.0210.031
Very convex1.082 **1.158 **0.4420.396
Contribution Area (m2)]25–50]−1.578 *−1.351 *−1.534 *−1.060 *
]50–100]−0.838−0.795−1.719 *−1.330 *
]100–200]−0.634−0.677−0.812−0.651
]200–400]−0.416−0.529−0.182−0.256
]400–800]−0.031−0.0490.1570.043
]800–1600]0.4270.4950.054−0.055
]1600–3200]0.4610.5410.1680.300
]3200–6400]0.031−0.4970.2980.478
]6400–12800]−0.762−1.0380.7791.156 **
>12800−0.626−0.6470.3510.415
Inverse of wetness index[0–0.001]−4.661 *−5.474 *−0.959−0.560
]0.001–0.0025]−1.466 *−1.689 *0.0950.298
]0.0025–0.0050]−0.600−0.968−0.1050.155
]0.0050–0.0075]−0.502−0.601−0.0670.041
]0.0075–0.0100]−0.206−0.3060.026−0.152
]0.0100–0.0250]0.0730.0330.212−0.065
]0.0250–0.0500]0.2730.3270.1480.044
]0.0500–0.0750]0.5430.613−0.072−0.127
]0.0750–0.1000]0.6910.754−0.301−0.475
>0.11.185 **1.300 **−0.664−0.672
GeologyLandslide deposits (Age < 3000 BP)0.4220.354−0.636−0.814
Phreatomagmatic deposits (Age < 3000 BP)−1.617 *−3.216 *−2.706 *−2.507 *
Scoria deposits (Age < 3000 BP)−1.617 *−3.216 *−0.536−1.908 *
Basaltic lava flows (s.l.) (Age = [0.22 Ma, 0.40 Ma BP])−1.558 *−1.273 *−0.998−0.617
Basaltic (s.l.) and trachytic flows (Age = ]0.40 Ma, 0.67 Ma BP])1.229 **1.514 **−2.706 *−2.507 *
Breccias and tuffs (Age = ]0.67 Ma, 0.80 Ma BP])−1.617 *−3.216 *−0.761−0.877
Basaltic lava flows (s.l.) (Age = [0.80 Ma, 1.5 Ma BP])−1.617 *−3.216 *0.4590.787
Basaltic lava flows (s.l.) (Age = [1.5 Ma, 1.8 Ma BP])−1.028 *−1.949 *1.114 **1.131 **
Basaltic lava flows (s.l.) (Age > 2.0 Ma BP)1.199 **0.1850.9080.443
Volcaniclastic deposits (Age> 2.0 Ma BP)1.084 **0.760−0.745−2.507 *
Insolation (kW/m2/year)≤5000.356−1.448 *−0.743−0.982
]500–600]−0.470−0.8290.492−0.229
]600–700]−0.634−0.9390.336−0.068
]700–800]0.2790.3260.5530.484
]800–900]0.3420.405−0.0550.010
]900–1000]0.6860.8230.2490.518
]1000–1100]0.7430.8090.2250.263
]1100–1200]0.052−0.011−0.239−0.353
]1200–1300]−0.418−0.5470.0620.147
]1300–1400]−0.866−0.898−0.154−0.417
>1400−1.816 *−1.530 *−2.676 *−0.982
Drainage density (km/km2){0}0.4100.395−0.043−0.221
]0–5]−1.417 *−1.718 *−0.2380.132
]5–10]−0.969−0.7860.2380.242
]10–15]0.6000.8350.008−0.101
]15–20]−1.452 *−1.390 *0.6610.734
]20–25]−3.303 *−3.711 *0.8770.758
>25−1.188 *−1.509 *−0.1590.210
Stream line distance (m)[0–25]−1.030 *−0.9530.2060.405
]25–50]−0.796−0.739−0.165−0.071
]50–75]−0.416−0.307−0.216−0.362
]75–100]0.0530.0730.0710.022
]100–125]0.4250.389−0.2660.123
]125–150]0.7820.761−0.629−0.624
>1500.9870.9260.292−0.436
Land useUrban−1.735 *−1.460 *−3.435 *−0.093
Cultivated areas−1.735 *−1.460 *−0.0720.466
Pasture−1.735 *−1.460 *−0.308−0.093
Forest−1.136 *−1.222 *0.4860.246
Shrubby vegetation−1.735 *−1.460 *−3.435 *−0.093
Denuded areas1.696 **1.674 **0.2610.189
* Ii < 1, the presence of the class distinctly inhibits landsliding activity. ** Ii > 1, the presence of the class distinctly promotes landsliding activity.
Table 3. Number of landslide susceptibility models obtained with different numbers of predisposing factors.
No of Predisposing Factors123456789101112Total
No of Models1266220495792924792495220661214095
Table 4. Areas Under the Curve (AUC) for the Success Rate Curves (SRCs) and the hierarchy of each predisposing factor.
Predisposing FactorsFallsSlides
HierarchyAUCHierarchyAUC
Altitude70.67220.703
Slope angle10.87530.678
Slope aspect60.70070.581
Slope transversal profile120.61260.587
Slope longitudinal profile50.70280.568
Insolation90.66190.566
Stream lines distance40.704100.565
Drainage density100.658110.552
Contribution area110.61850.588
Inverse of the wetness index80.669120.548
Geology30.82310.772
Land use20.85540.631

