Article

Site Characterization by Dynamic In Situ and Laboratory Tests for Liquefaction Potential Evaluation during Emilia Romagna Earthquake

by
Antonio Cavallaro
1,*,
Piera Paola Capilleri
2 and
Salvatore Grasso
2
1
Italian National Research Council (CNR), IBAM, Via Biblioteca n. 4, 95124 Catania, Italy
2
Department of Civil Engineering and Architecture (DICAr), University of Catania, Via S. Sofia n. 4, 95125 Catania, Italy
*
Author to whom correspondence should be addressed.
Geosciences 2018, 8(7), 242; https://doi.org/10.3390/geosciences8070242
Submission received: 14 February 2018 / Revised: 30 May 2018 / Accepted: 9 June 2018 / Published: 29 June 2018

Abstract

:
To investigate the geotechnical soil properties of Emilia Romagna Region, a large series of in situ tests, laboratory tests and geophysical tests have been performed, particularly at the damaged city of Scortichino—Bondeno. Deep site investigations have been undertaken for the site characterization of the soil also along the Burana-Scortichino levee. Borings, Piezocone tests (CPTU) and dynamic in situ tests have been performed. Among them, Multichannel Analysis of Surface Waves test (MASW) and Seismic Dilatometer Marchetti Tests (SDMT) have been also carried out, with the aim to evaluate the soil profile of shear wave velocity (Vs). Resonant Column Tests (RCT) were also performed in laboratory on reconstituted solid cylindrical specimens. The Seismic Dilatometer Marchetti Tests were performed up to a depth of 32 m. The results show a very detailed and stable shear wave profile. The shear wave profiles obtained by SDMT have been compared with other laboratory tests. A comparison between the in situ small shear strain, laboratory shear strain and shear strain obtained by empirical correlations, was also performed. Finally, using the results of SDMT tests, soil liquefaction phenomena have been analyzed with a new procedure based on SDMT, using the soil properties obtained by field and laboratory tests.

1. Introduction

On 20 May 2012 an earthquake of magnitude ML = 5.9 struck the Emilia Romagna Region (Italy), with epicenter in the municipality of Finale Emilia and the hypocenter at a depth of about 6.3 km. On 29 May 2012 a new and very strong earthquake of magnitude ML = 5.8 occurred, creating panic and disruption in many cities such as Ferrara, Modena, Reggio Emilia, Bologna and Rovigo; the epicenter was located in the area between Mirandola, Medolla and San Felice Panaro. The earthquakes caused 27 deaths, with about 12,000 buildings severely damaged; heavy damages occurred also to monuments and to cultural heritage.
Significant and widespread liquefaction effects, which caused damage to buildings and infrastructures, were also observed during the seismic events of May 2012 in various areas of Emilia-Romagna Region. These phenomena mainly involved the old river bed deposits and the ancient levees of the Reno River, principally near the two villages of San Carlo (Municipality of Sant’Agostino) and Mirabello. Phenomena of minor extension were observed also in other sites (e.g., Dodici Morelli, San Felice Panaro, etc.), in similar geo-morphological conditions, including also the Burana-Scortichino levee.
The paper illustrates the relevance of the Seismic Dilatometer Marchetti Test (SDMT) as an alternative or integration to other in situ tests for liquefaction studies. The novelties of this work are: (i) to review the available knowledge on sand liquefiability assessment by use of SDMT; (ii) to use new tentative CRR-Kd correlations for evaluating the liquefaction resistance from SDMT, to be used according to the Seed & Idriss [1] “simplified procedure”. When using semi-empirical procedures for evaluating liquefaction potential during earthquakes, it is important to use redundant correlations. The SDMT has the advantage, in comparison with CPT and SPT tests, by measuring independent parameters, Kd and Vs. Hence “matched” independent evaluations of liquefaction resistance can be obtained from Kd and from Vs according to recommended CRR-Kd and CRR-Vs correlations. CPT and SPT based correlations should be supported by large databases, while SDMT correlations are based on a limited database.
Similar studies have been conducted in other European seismic areas characterized by the presence of buildings of particular architectural value [2,3,4,5,6,7,8,9,10].

2. Geology and Seismicity of the Area

The area affected by the earthquake sequence of the Emilia Romagna Region in May 2012 is located to the south of the Po Valley; this basin lies between the Alps and the Northern Apennines. The main shock took place on 20 May causing seven deaths and significant damage to historic buildings, churches, industrial buildings and leaving 7000 people homeless. On 29 May another strong earthquake hit the Region, causing other damages and casualties [11].
The area is covered by alluvial deposits (Holocene) and deposits of fluvial-lacustrine soil. The southern part of the Province of Ferrara, where reside the investigated sites, is crossed by the river Reno. The Reno is an ancient river whose course on the plain varied over the centuries. Crespellani et al. [12], citing Cazzola [13], relate how the physical environment shapes were visibly modeled by man in the Emilian plain through interventions for flood defense. As a result, the plain is crisscrossed by ancient drainages and streams that cross the land. Over time, farming settled occupying the natural bumps built by rivers and their branches abandoned, extending to the surrounding areas even with the landfills. In many areas, the murky waters of the rivers were diverted in the areas bounded by levees, which currently occupy a large part of the territory. From the 60 s onwards, the considerable development of industrial activity and urban expansion led to even use areas—land filled and levees—that were reclaimed for agricultural use. The study area appears rather flat and characterized by lithological units trending sub-horizontal.
Various site investigation studies enabled also soil characterization affected by the earthquake sequence of May 2012 [14,15,16].

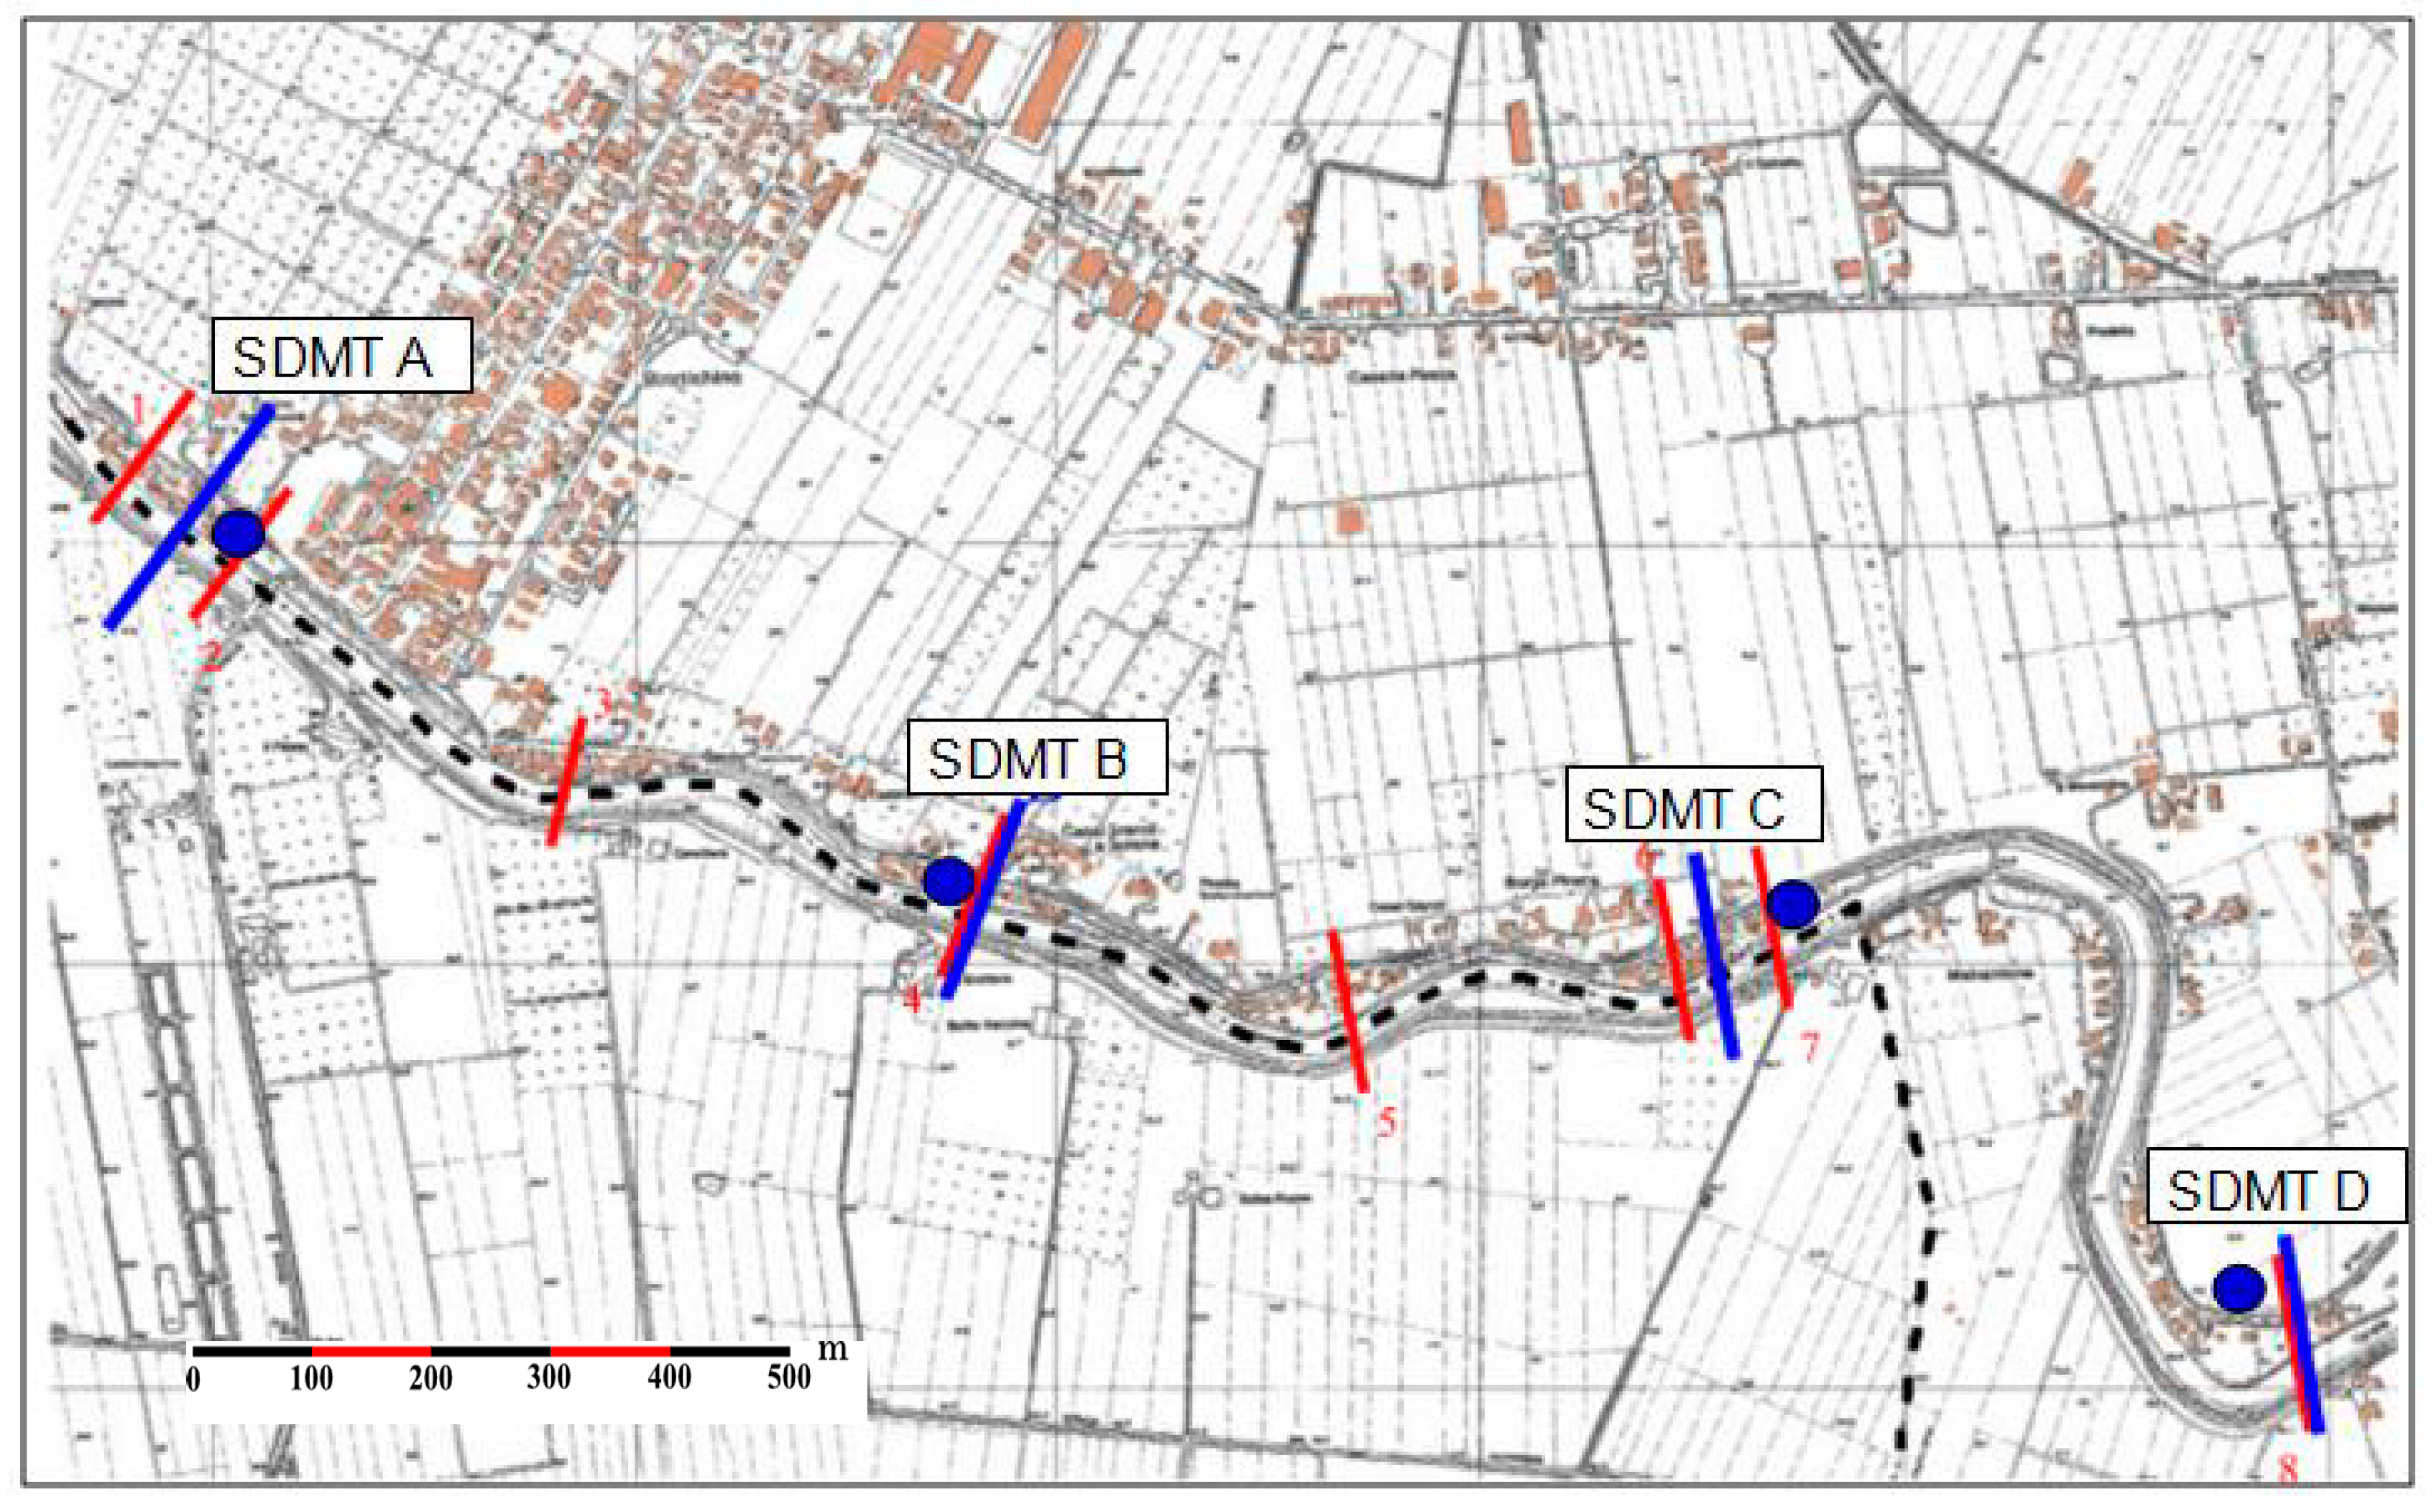
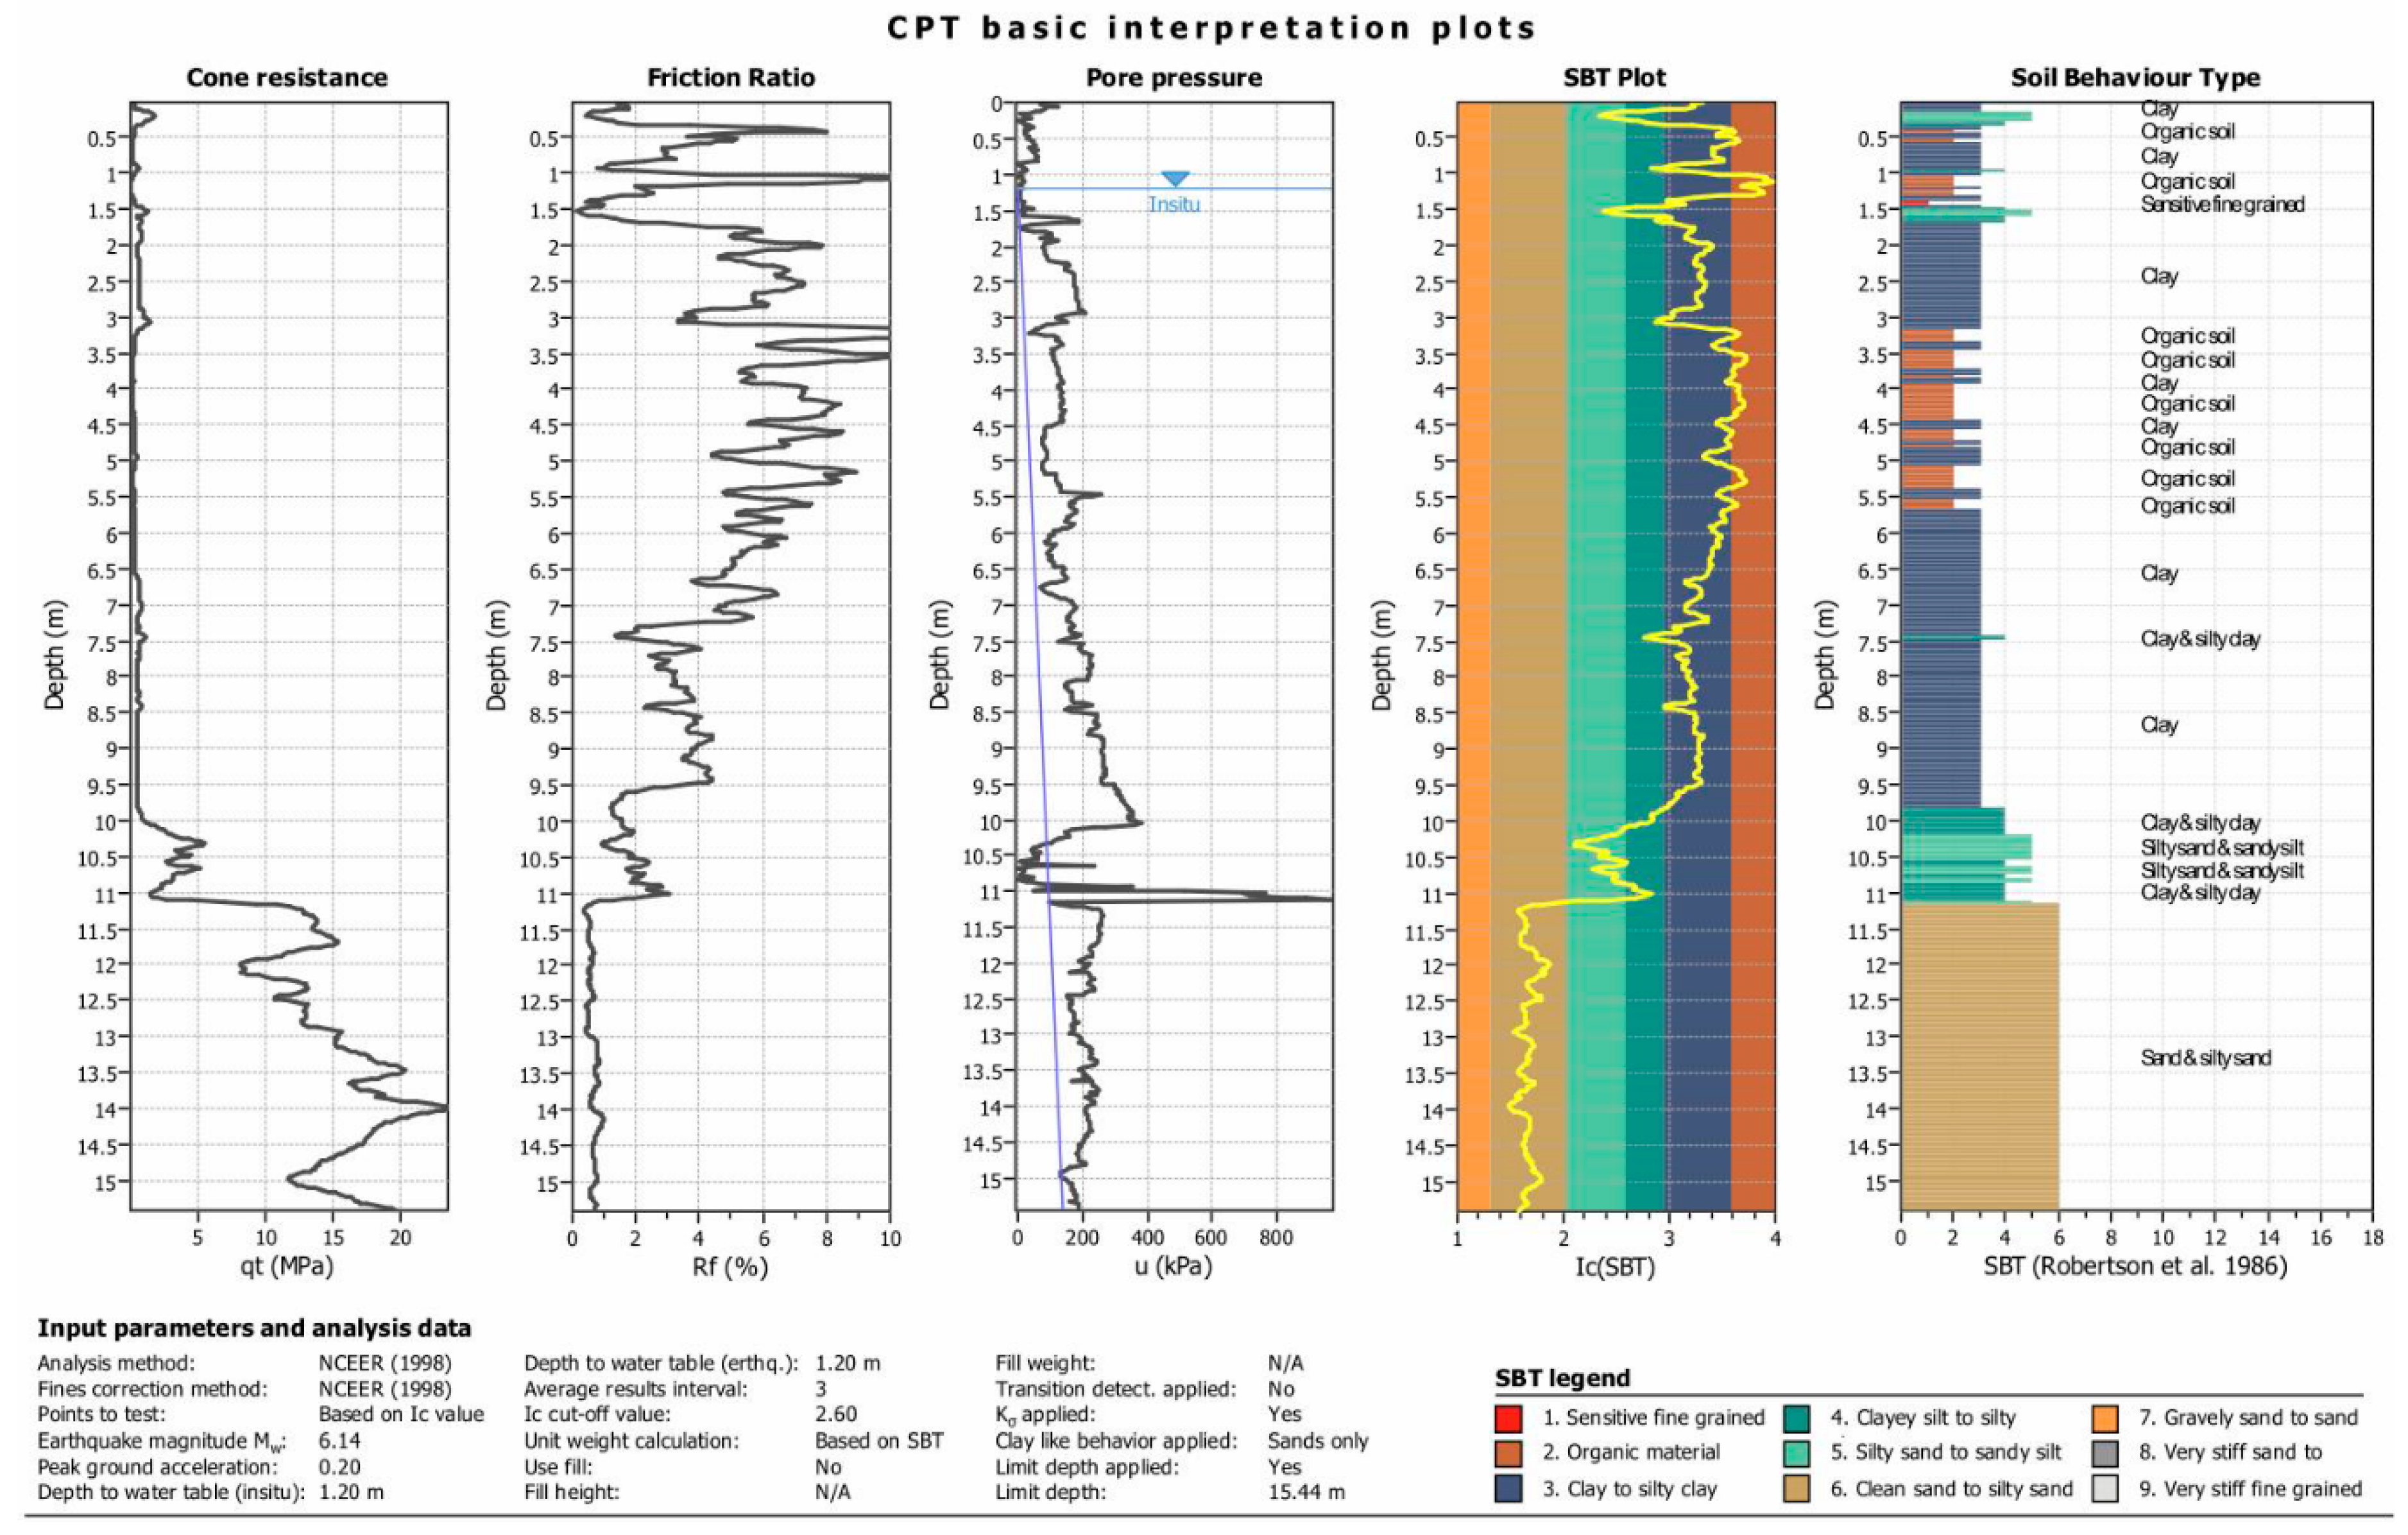
3. Investigation Program and Basic Soil Properties

The investigated area reaches the maximum depth of 40 m. The area pertaining to the investigation program (CPTU and SDMT field tests) is shown in Figure 1. Figure 2 shows the results obtained by one of the cone penetration tests performed on Scortichino—Bondeno area. The data reported in Figure 2 clearly indicate the presence of cohesive strata of soils from the top to the depth of about 10.00 m and of uncohesive soils from about 10.00 m to the bottom of the boreholes. This indication is also confirmed by comparing the penetration resistance from electric Piezocone tests (CPTU) performed at different locations over the investigated area (Figure 1). The qc profile with depth clearly shows the existence of layers with very different mechanical characteristics. The upper silty clay presents meager mechanical characteristics with qc of about 0.1 to 2.0 MPa. The deeper sandy soil presents qc values of about 1 to 23.65 MPa.
The basic soil properties of the Scortichino—Bondeno (Table 1) area are based on the three CPTU test results [17,18,19,20,21]: from the top to the depth of about −1.00 m there is the presence of a debris soil layer overall the area; from −1.00 m to −1.50 m depth there is the presence of a cohesive soil layer with qc values of about 0.49 MPa, fs = 0.01 MPa, U = 0.00 MPa, Cu = 22 kPa, OCR = 10; from −1.50 m to −3.20 m depth there is the presence of a cohesive soil layer with qc of about 0.83 MPa, fs = 0.04 MPa, U = 0.11 MPa, Cu = 45 kPa, OCR = 10; from −3.20 m to −6.50 m depth there is the presence of a cohesive soil layer, of probably organic nature, with qc of about 0.36 MPa, fs = 0.03 MPa, U = 0.08 MPa, Cu = 17 kPa, OCR = 3; from −6.50 m to −10.00 m depth there is the presence of a cohesive soil layer with qc of about 0.62 MPa, fs = 0.02 MPa, U = 0.15 MPa, Cu = 29 kPa, OCR = 3; from −10.00 m to −11.00 m depth there is the presence of a sandy soil layer with qc of about 3.30 MPa, fs = 0.06 MPa, U = 0.03 MPa, Dr = 27%, ϕ’ = 31°; from −11.00 m to −12.00 m depth there is the presence of a thickened sandy soil layer with qc of about 11.19 MPa, fs = 0.06 MPa, U = 0.20 MPa, Dr = 76%, ϕ’ = 37°; from −12.00 m to −12.80 m depth there is the presence of a sandy soil layer with qc of about 11.53 MPa, fs = 0.06 MPa, U = 0.08 MPa, Dr = 73%, ϕ’ = 37°; from −12.80 m to −15.40 m depth there is the presence of a sandy soil layer with qc of about 16.80 MPa, fs = 0.12 MPa, U = 0.07 MPa, Dr = 85%, ϕ’ = 39°. The water table level is at the depth of about −1.2 m.

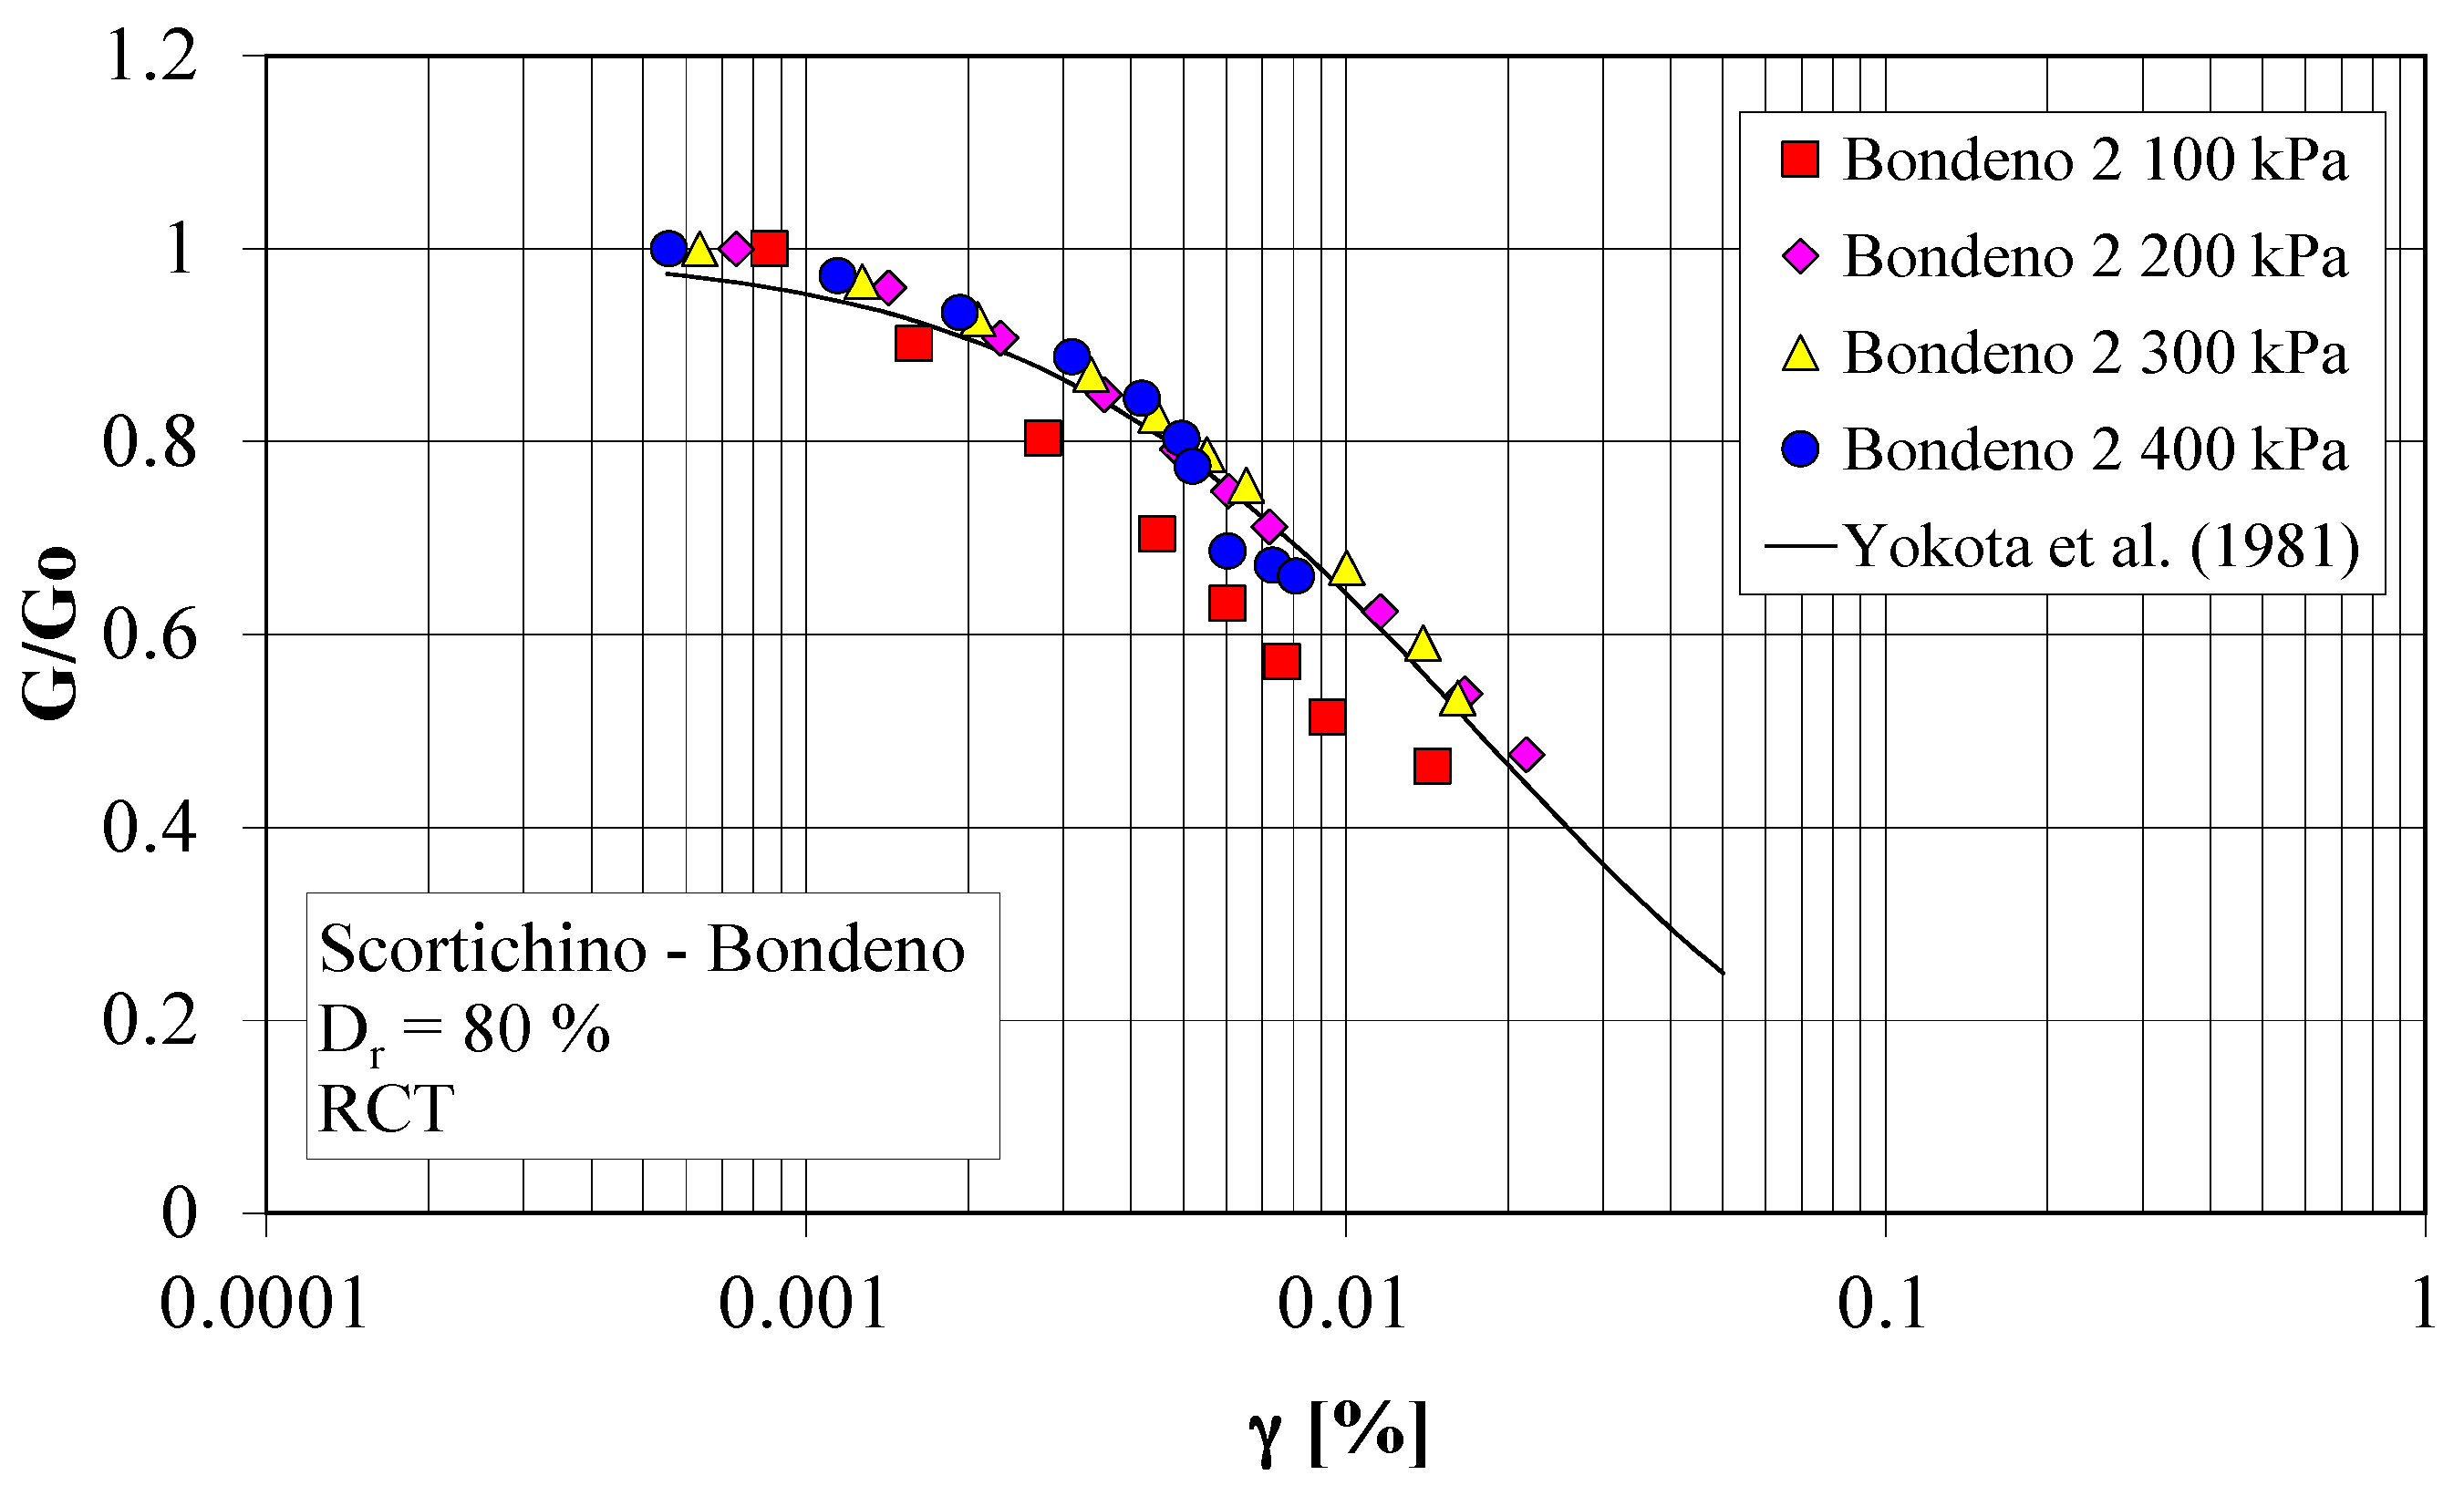
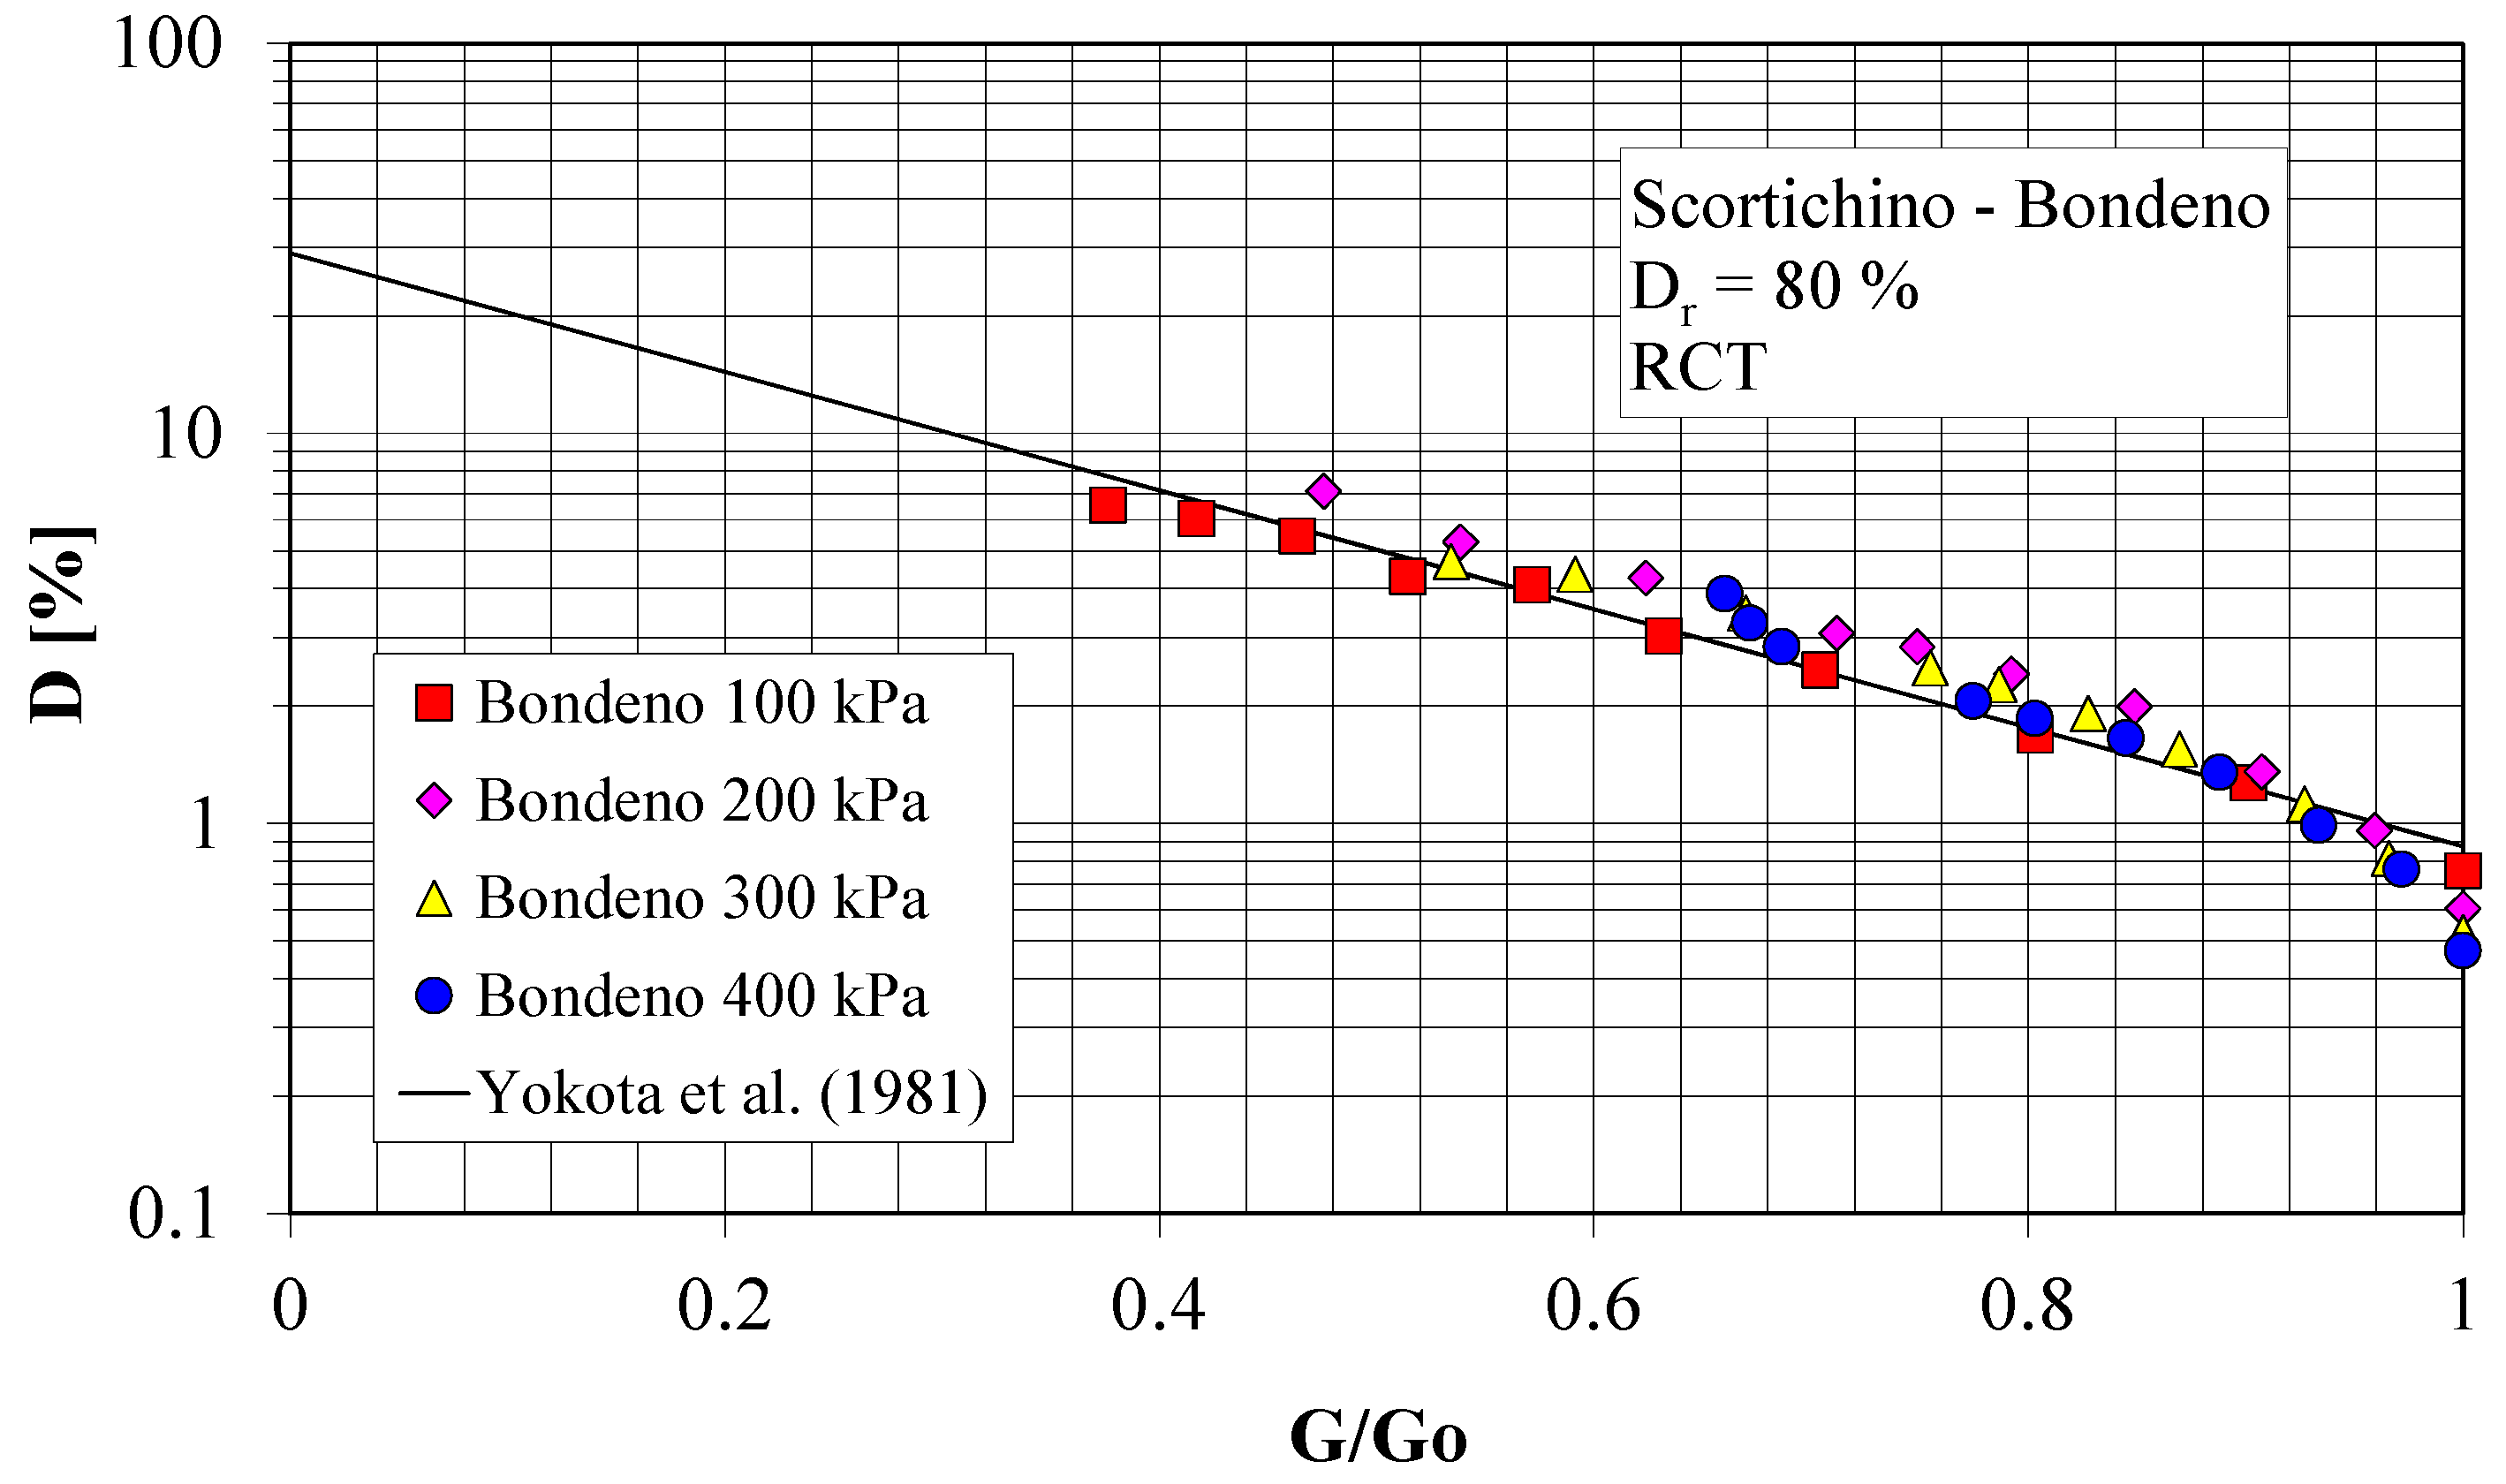
4. Shear Modulus and Damping Ratio

The small strain (γ ≤ 0.001%) shear modulus, Go, was determined from SDMT tests and from the Multichannel Analysis of Surface Waves (MASW) test. The equivalent shear modulus (Geq) was determined in the laboratory by means of a Resonant Column test (RCT) performed with a Resonant Column apparatus. Moreover it was attempted to assess Go by means of empirical correlations, based either on penetration test results or on laboratory test results [22,23,24]. The SDMT provides a simple means for determining the initial elastic stiffness at very small strains and in situ shear strength parameters at high strains in natural soil deposits [25,26,27,28]. Shear waves are generated by striking a horizontal plank at the surface that is oriented parallel to the axis of a geophone connected by a co-axial cable with an oscilloscope [29,30].
The measured arrival times at consecutive depths provide pseudo interval Vs profiles for horizontally polarized vertically propagating shear waves. The small strain shear modulus Go is determined by the theory of elasticity by the well-known relationships:
Go = ρVs2
where: ρ = mass density.
A summary of SDMT parameters is shown in Figure 3 where:
-
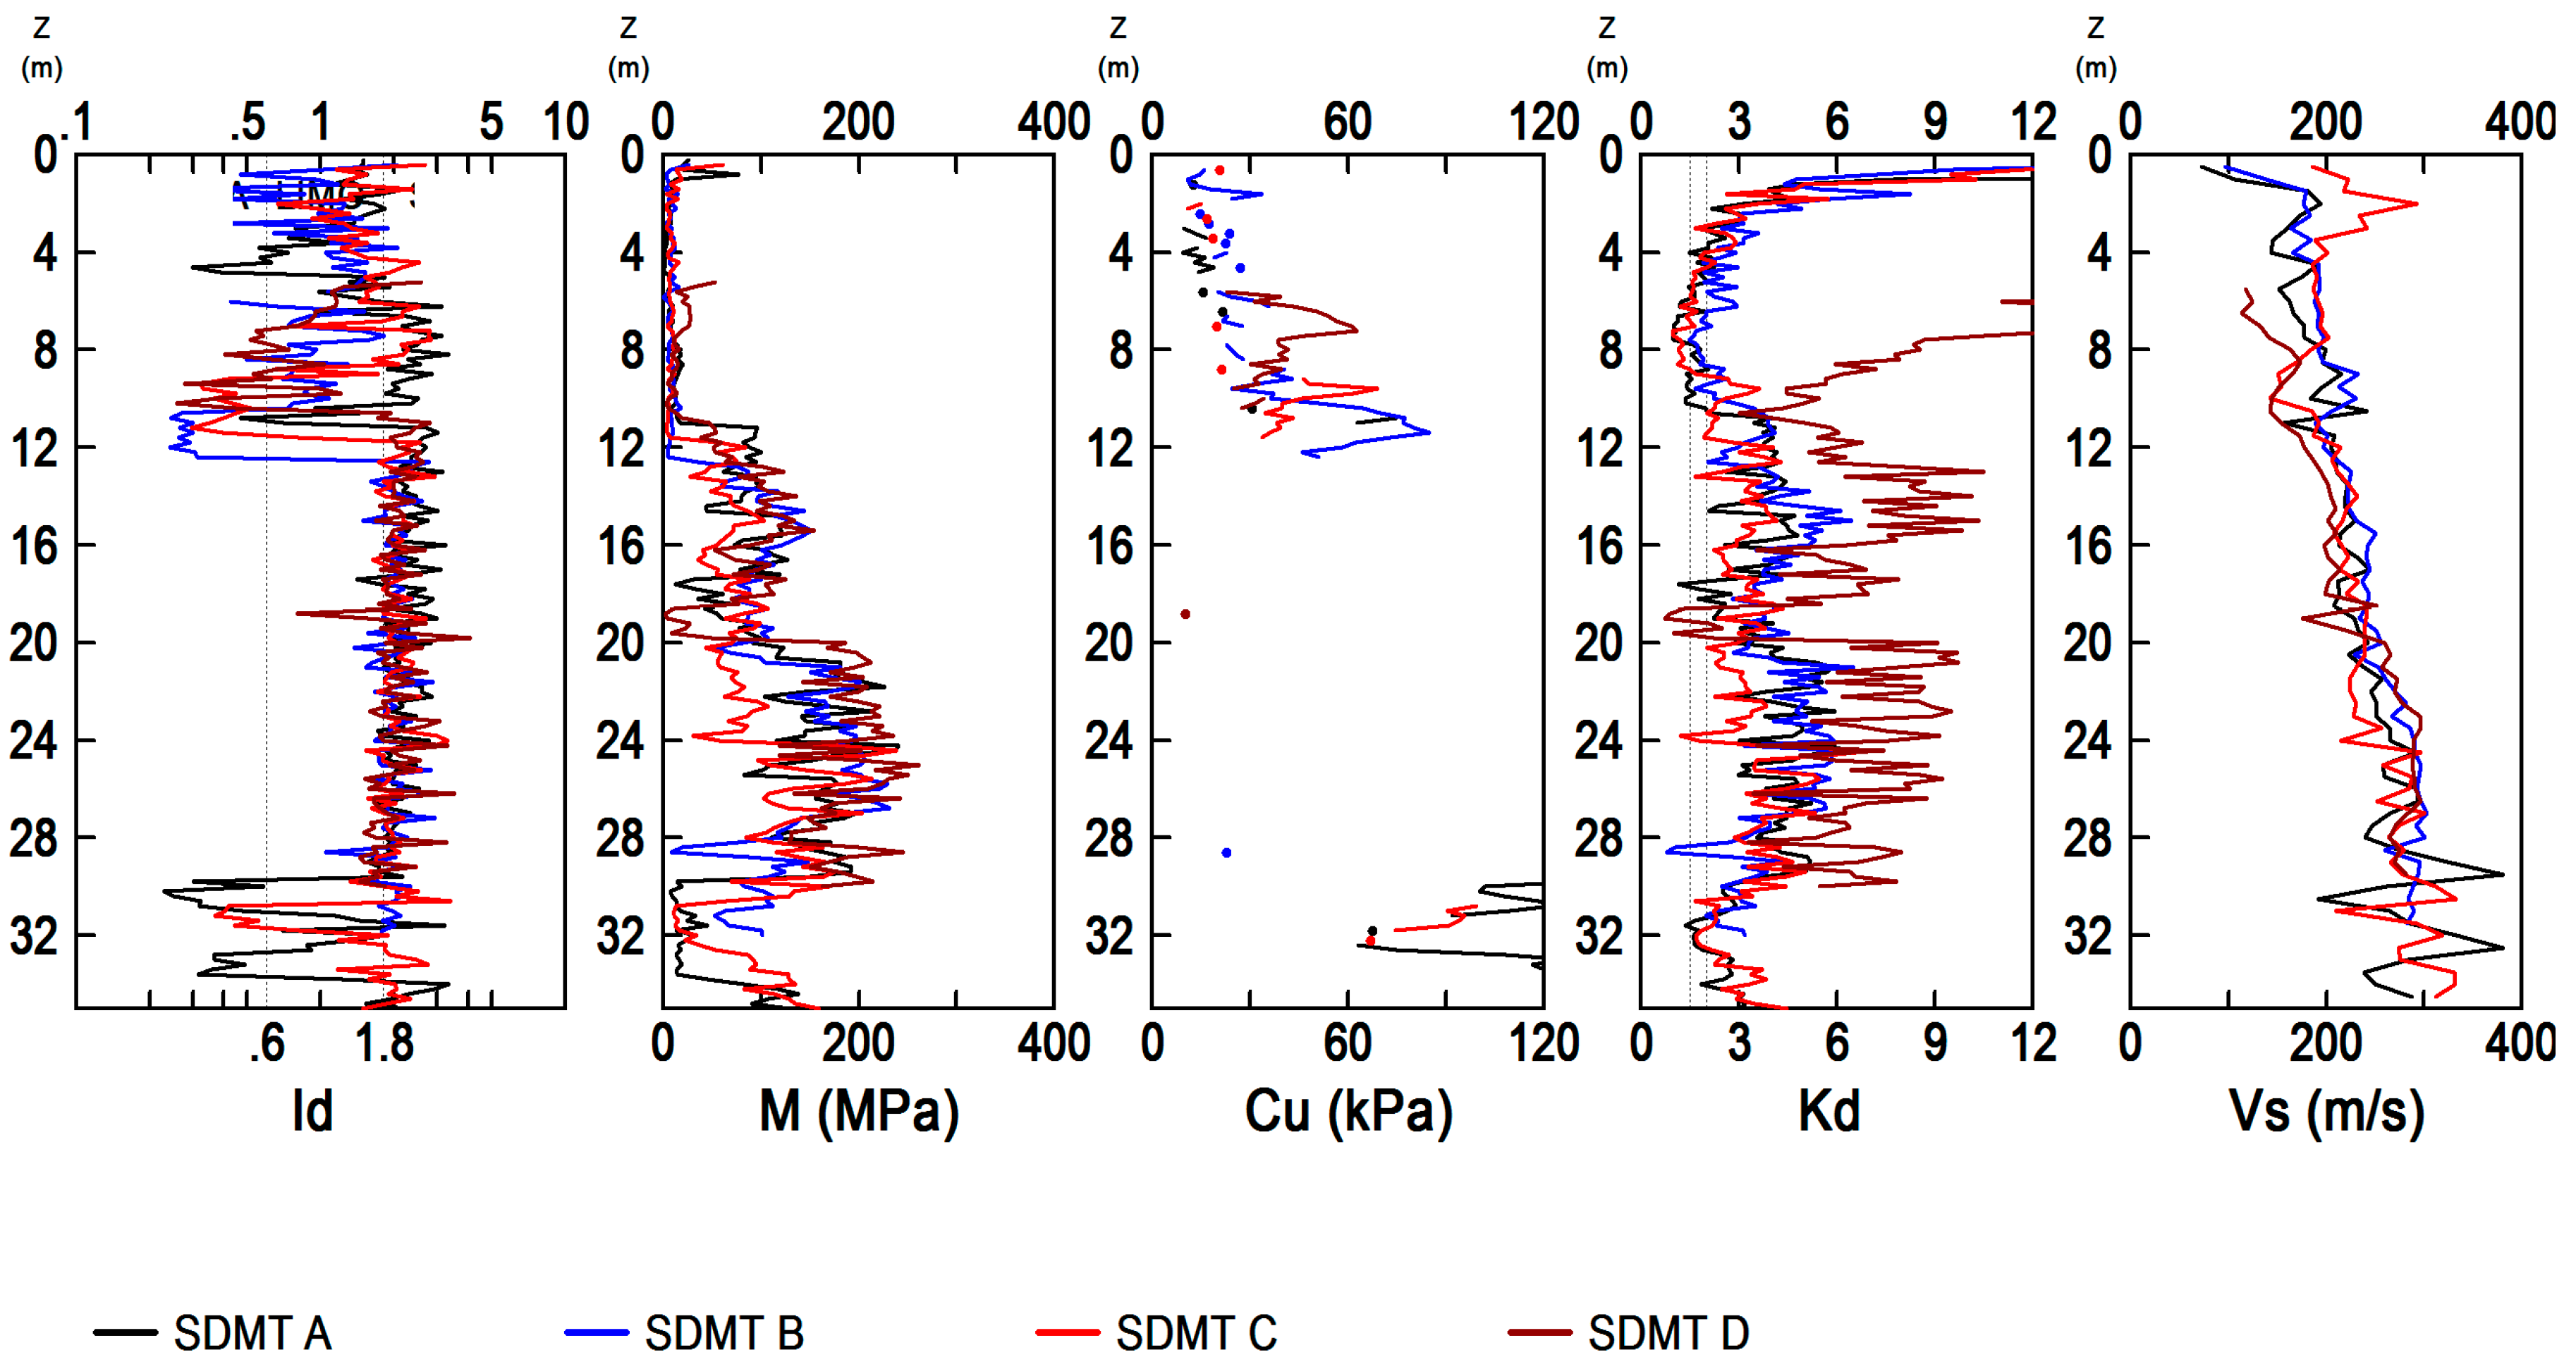
Id: Material Index; gives information on soil type (sand, silt, clay);
-
M: Vertical Drained Constrained Modulus;
-
Cu: Undrained Shear Strength;
-
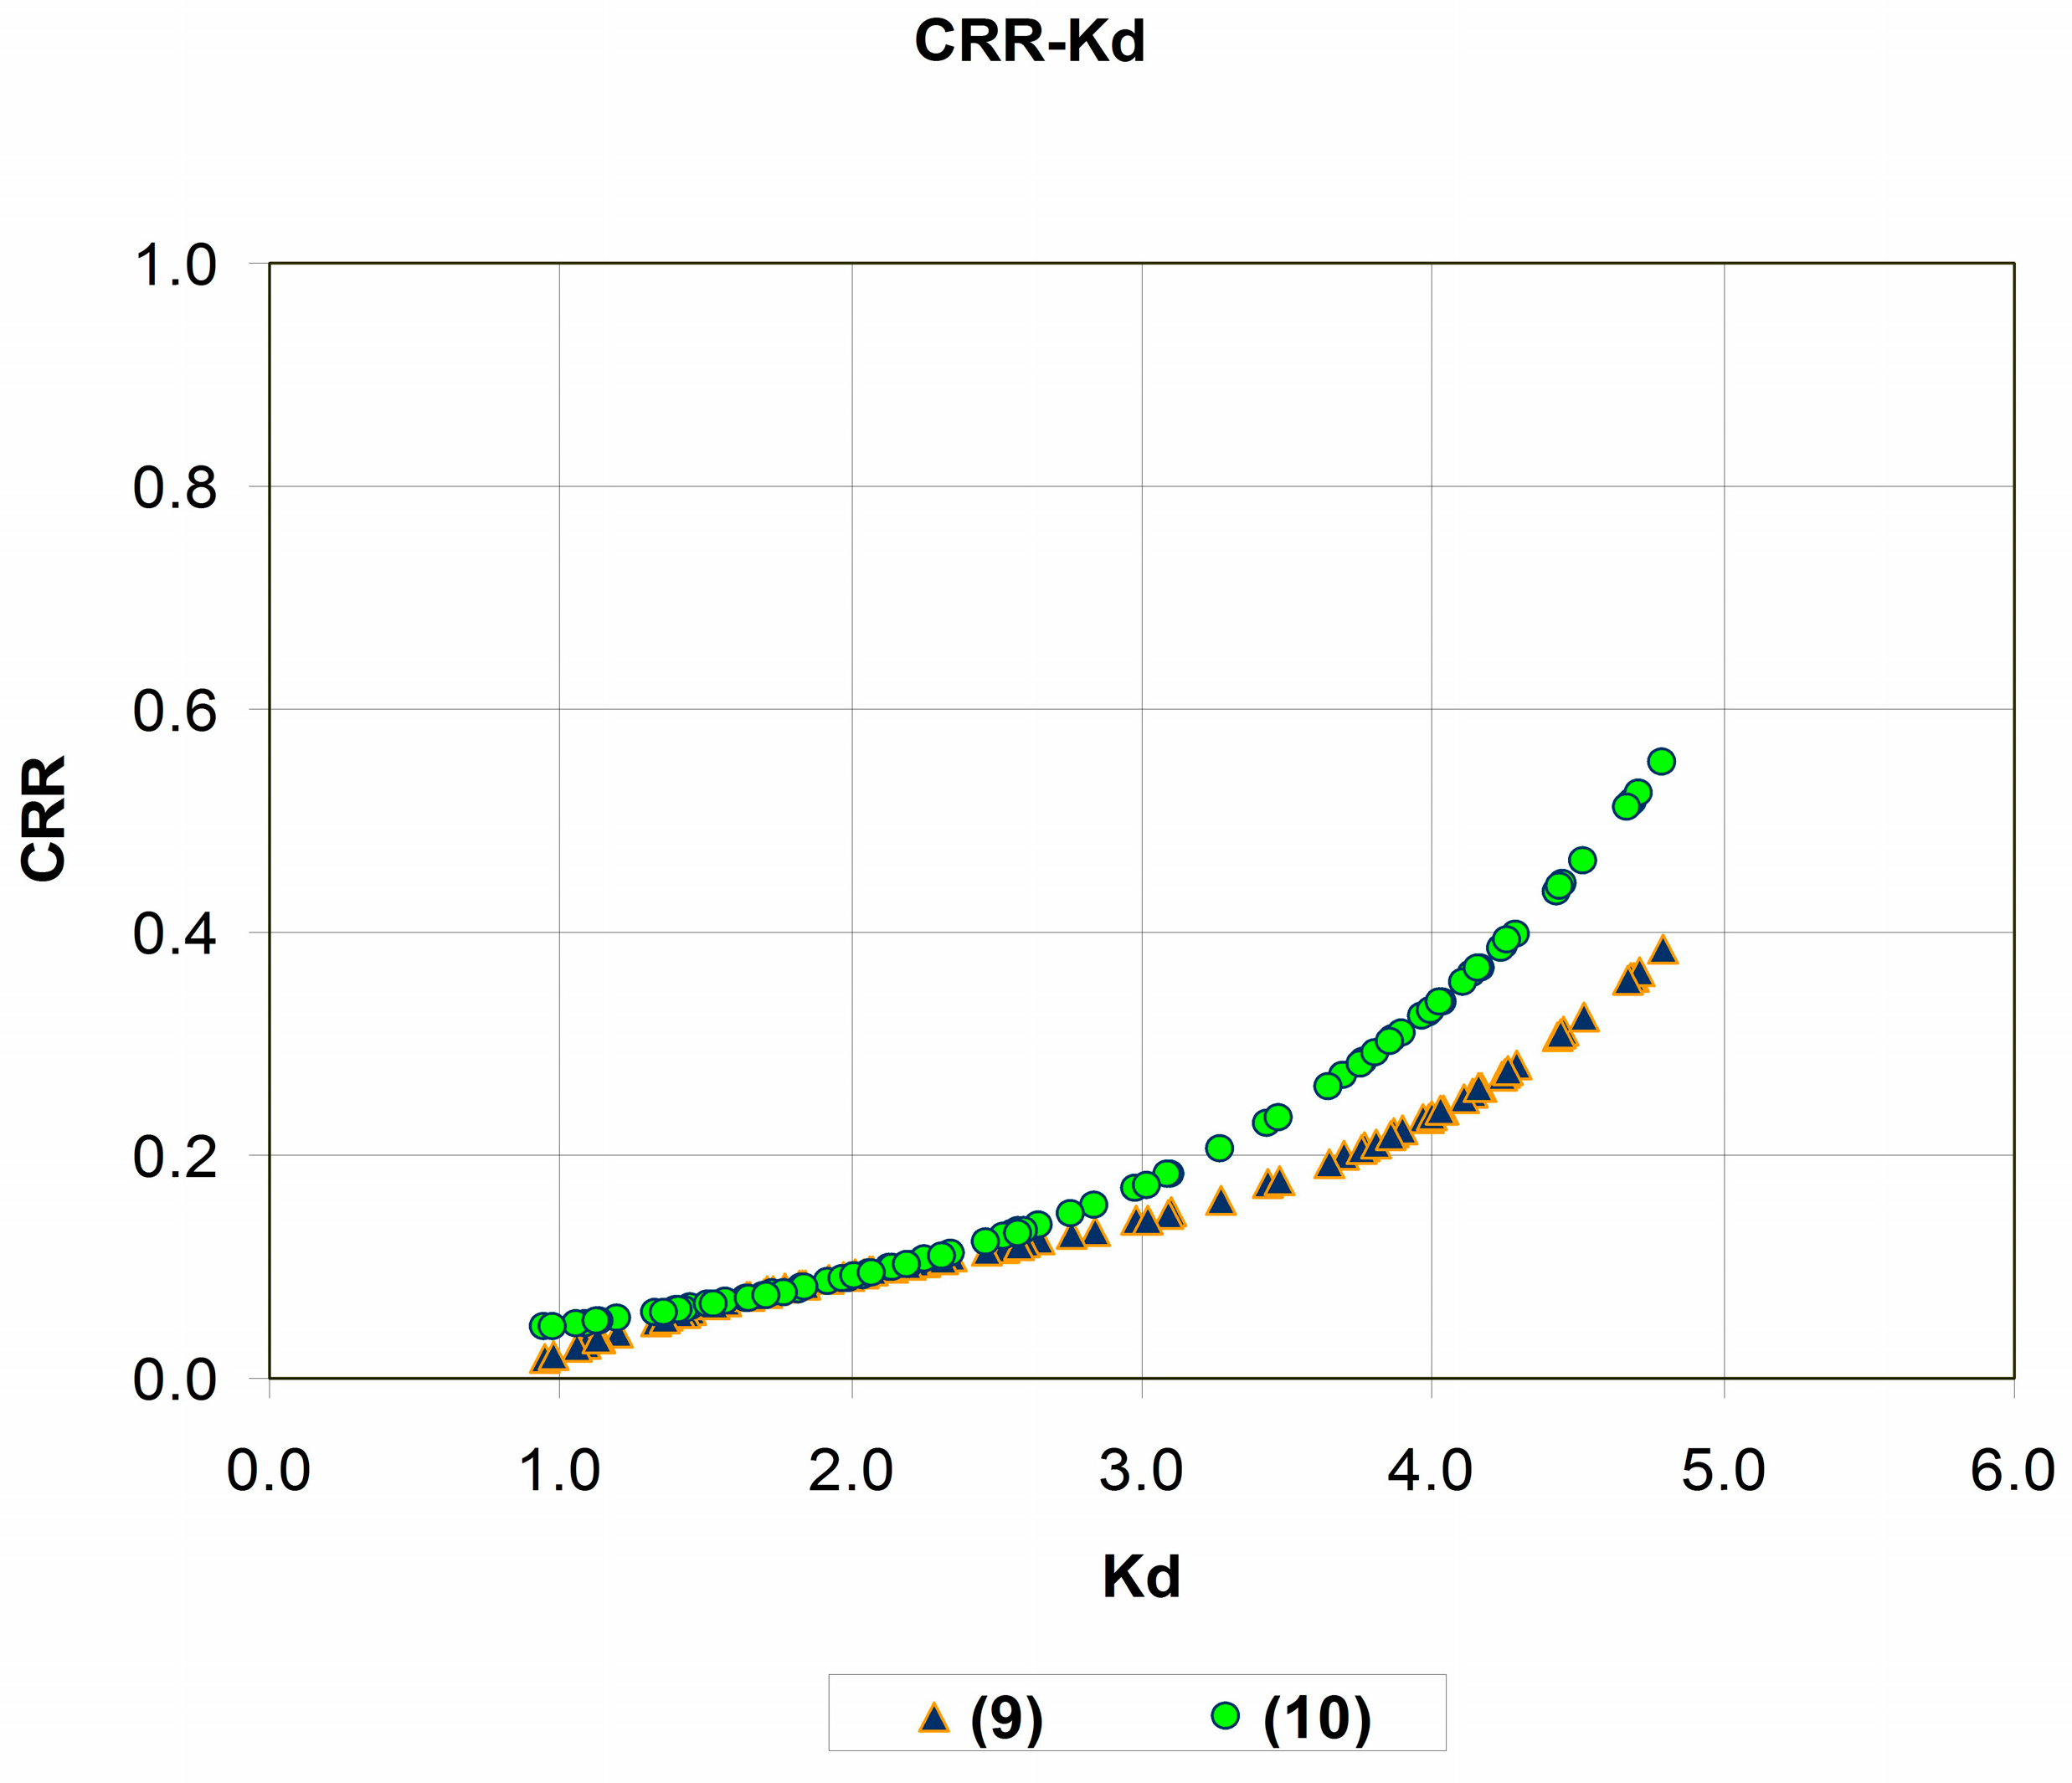
Kd: Horizontal Stress Index; the profile of Kd is similar in shape to the profile of the overconsolidation ratio OCR. Kd = 2 indicates in clays OCR = 1, Kd > 2 indicates overconsolidation. A first glance at the Kd profile is helpful to “understand” the deposit;
-
Vs: Shear Wave Velocity.
Figure 4 shows the values of Go obtained in situ from MASW and SDMT tests and Go values measured in the laboratory from RCT performed on sandy reconstituted solid cylindrical specimens which were isotropically reconsolidated to the best estimate of the in situ mean effective stress. The Go values are plotted in Figure 4 against depth. In the case of laboratory tests, the Go values are determined at shear strain levels of less than 0.001%. It is possible to observe that quite a good agreement exists between the laboratory and in situ test results. The laboratory test conditions and the obtained small strain shear modulus Go are listed in Table 2. In the present work solid cylindrical specimens were reconstituted by using tapping [31]. The mold is assembled and a little depression is applied to let the membrane adhere to the inside surfaces. The material is placed into the mold using a funnel-pouring device.
It is possible to obtain different values of relative density changing the height of deposition. In order to realize high values of relative density it could be necessary to beat delicately the mold surface during the deposition. Each sample has been reconstituted with fresh sand. Each specimen was subjected to an isotropic load achieved in a Plexiglas pressure cell, using an air pressure source. The axial strain was measured by using a high-resolution proximity transducer, which monitors the aluminum top-cap displacement. Shear strain was measured by monitoring the top rotation with a couple of high-resolution proximity transducers. During a resonant column test, the proximity transducers are not able to appraise the value of the targets displacements, because of the high frequency of the oscillations. The rotation on the top of the specimen is measured by means of an accelerometer. The dry reconstituted specimens were isotropically submitted to a confining stress to simulate the real pressure conditions. The size of solid cylindrical specimens is: Diameter = 50 mm and Height = 100 mm.
Quite a good agreement exists between the laboratory and in situ test results. Ratio of Go (Lab) to Go (Field) by SDMT and MASW was equal to about 0.90 at the depth of 25.5 m.
Upper strata show Go values by SDMT of about 45 MPa. In the cohesive strata Go values are between 50 and 90 MPa. Uncohesive soils show Go values increasing with depth from 90 to 165 MPa. It is worthy to note that MASW tests results show the existence of transition layers from soft to stiff layers because of the occurrence of refraction phenomena. In the transition strata from cohesive to uncohesive strata the Go values by MASW rapidly vary from 70 to 165 MPa with depth. Higher values of Go were obtained by RCT respect to SDMT probably caused by higher sample density value during the RCT. The experimental results of specimens obtained by RCT were used to determine the empirical parameters in the equation proposed by Yokota et al. [32] (Figure 5) to describe the shear modulus decay with shear strain level:
G ( γ ) G o = 1 1 + α γ ( % ) β
in which:
G(γ) = strain dependent shear modulus;
γ = shear strain;
α, β = soil constants.
The Expression (2) allows the complete shear modulus degradation with strain level [33].
The values of α = 70 and β = 1.050 were obtained for the Scortichino—Bondeno area.
As suggested by Yokota et al. [32], the inverse variation of damping ratio with respect to the normalized shear modulus has an exponential form as reported in Figure 6 for the Scortichino—Bondeno area:
D ( γ ) ( % ) = η e x p [ λ G ( γ ) G o ]
in which:
D(γ) = strain dependent damping ratio;
γ = shear strain;
η, λ = soil constants.
The values of η = 29 and λ = 3.50 were obtained for the Scortichino—Bondeno area.
The Equation (3) reaches maximum value Dmax = 29% for G(γ)/Go = 0 and minimum value Dmin = 0.87% for G(γ)/Go = 1.
Therefore, Equation (3) can be re-written in the following normalised form:
D ( γ ) D ( γ ) m a x = e x p [ λ G ( γ ) G o ]
These parameters were obtained from the damping values assessed by means of the steady-state method.

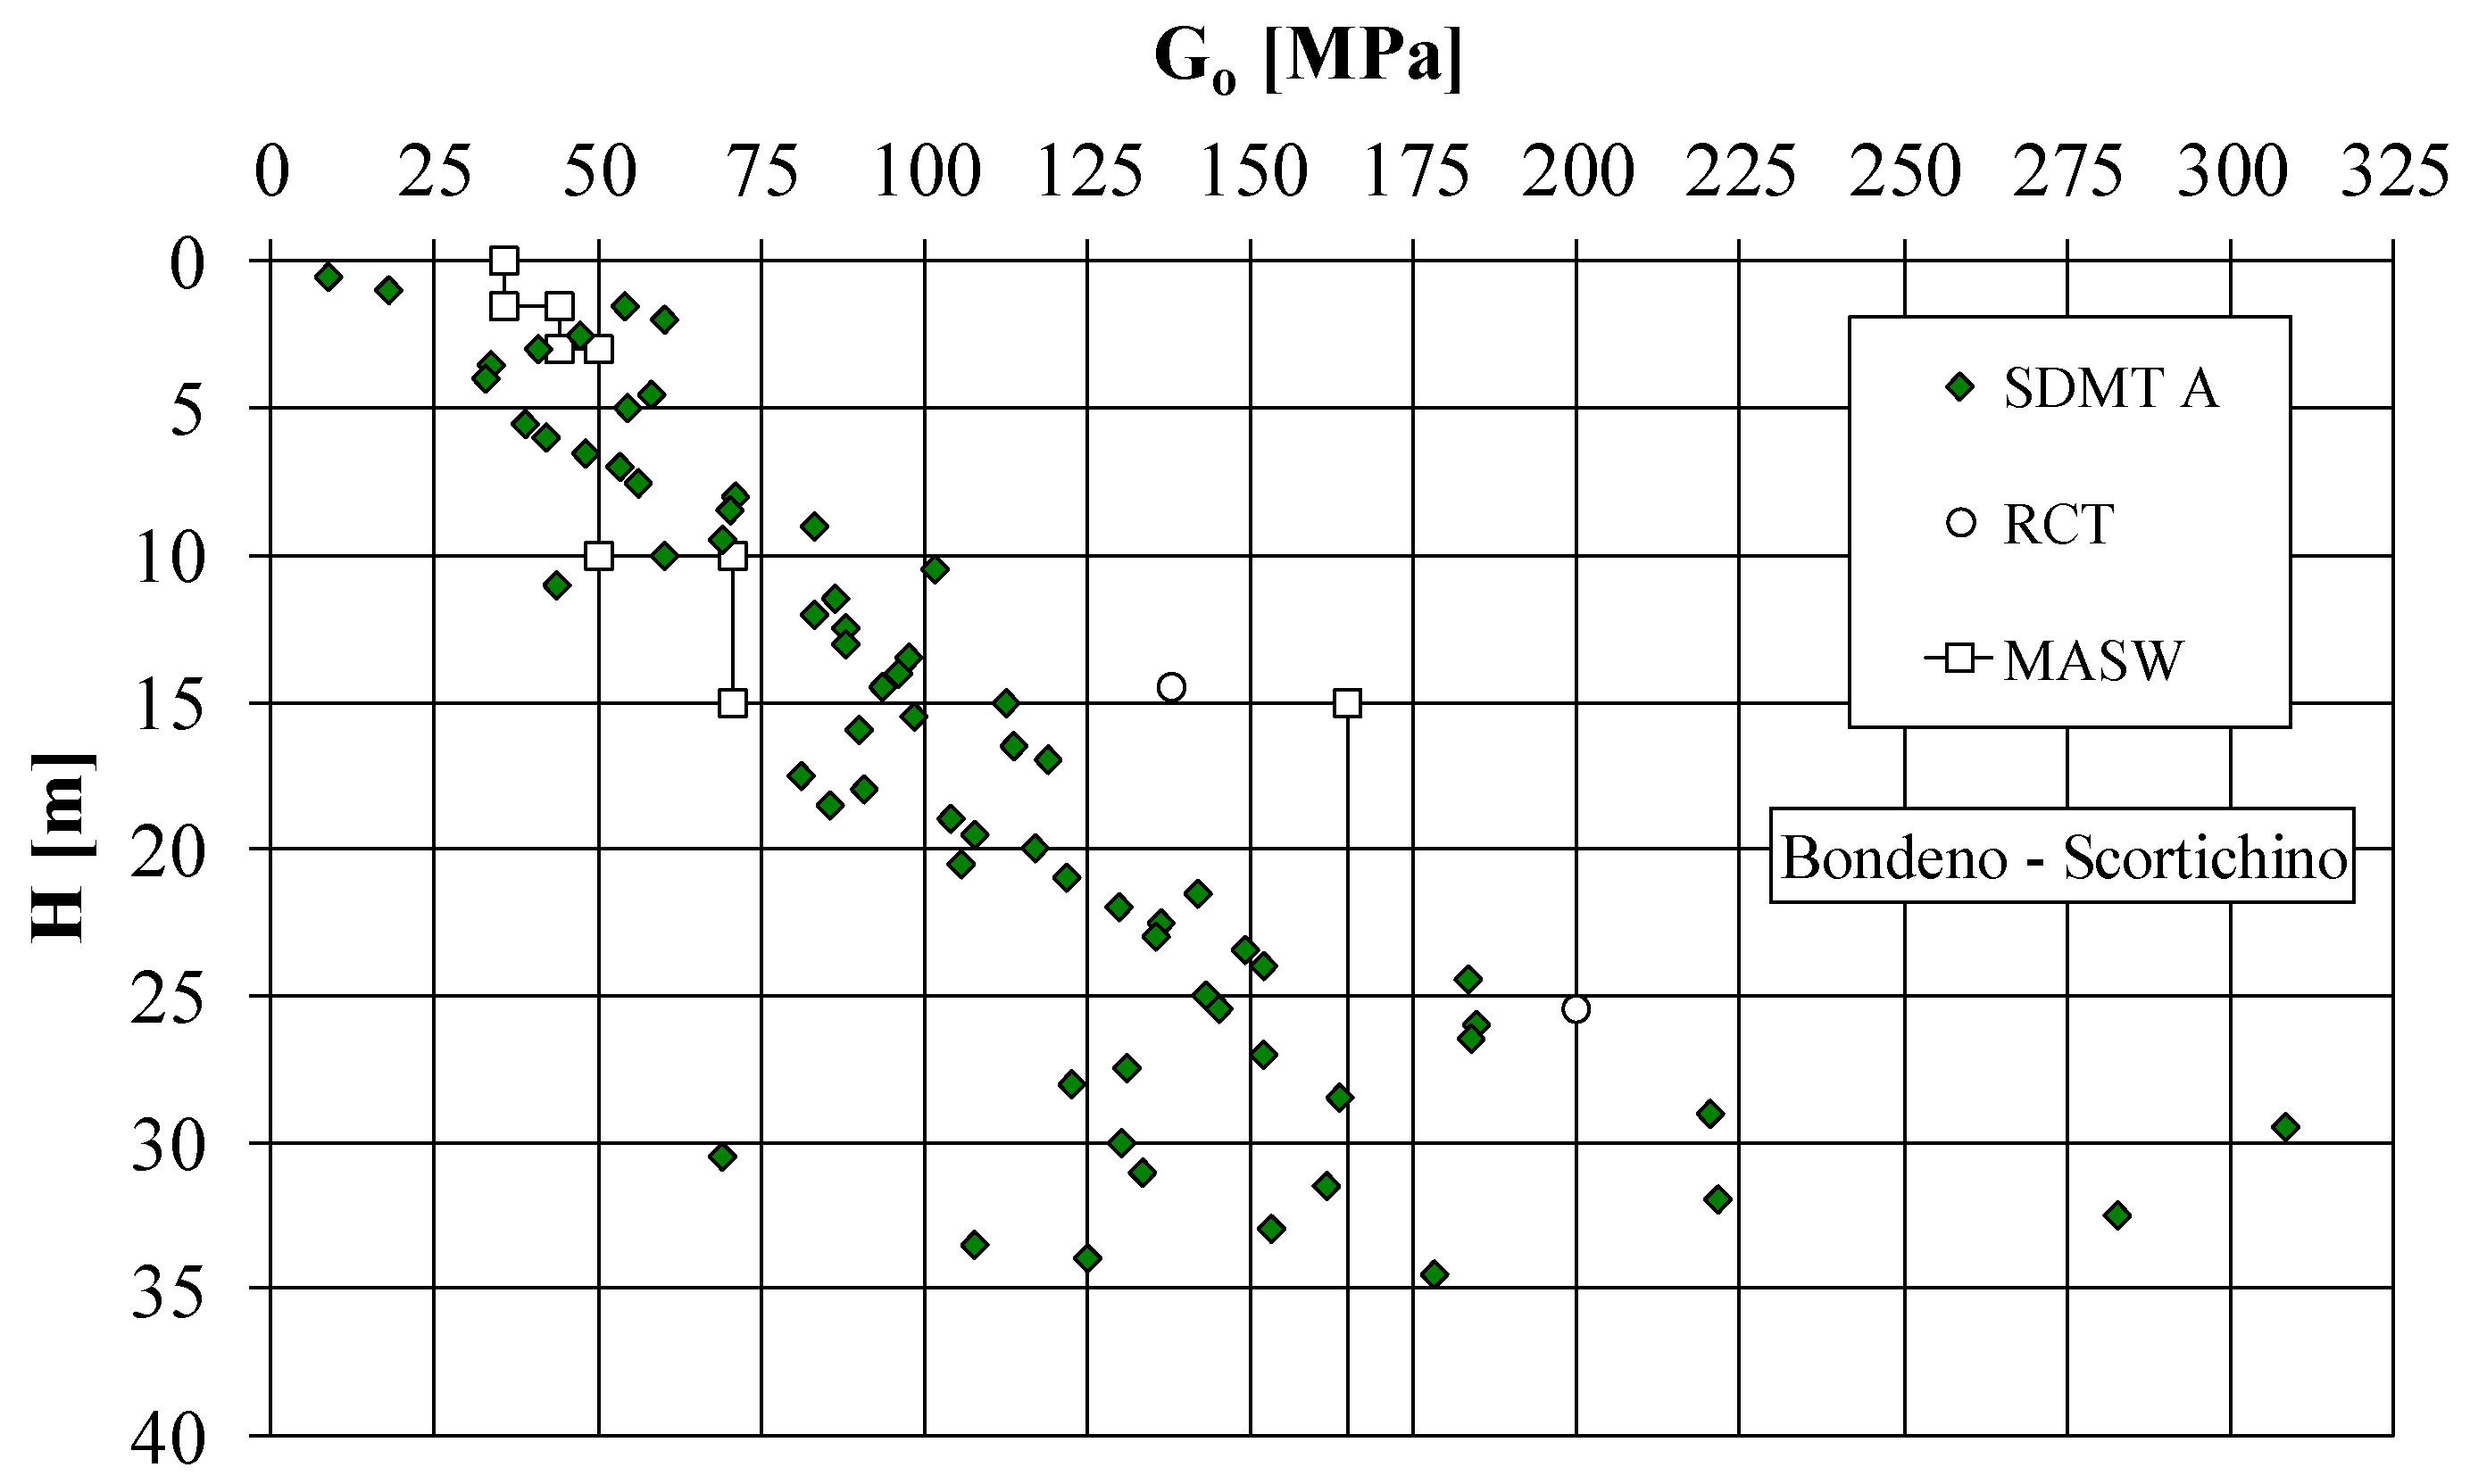
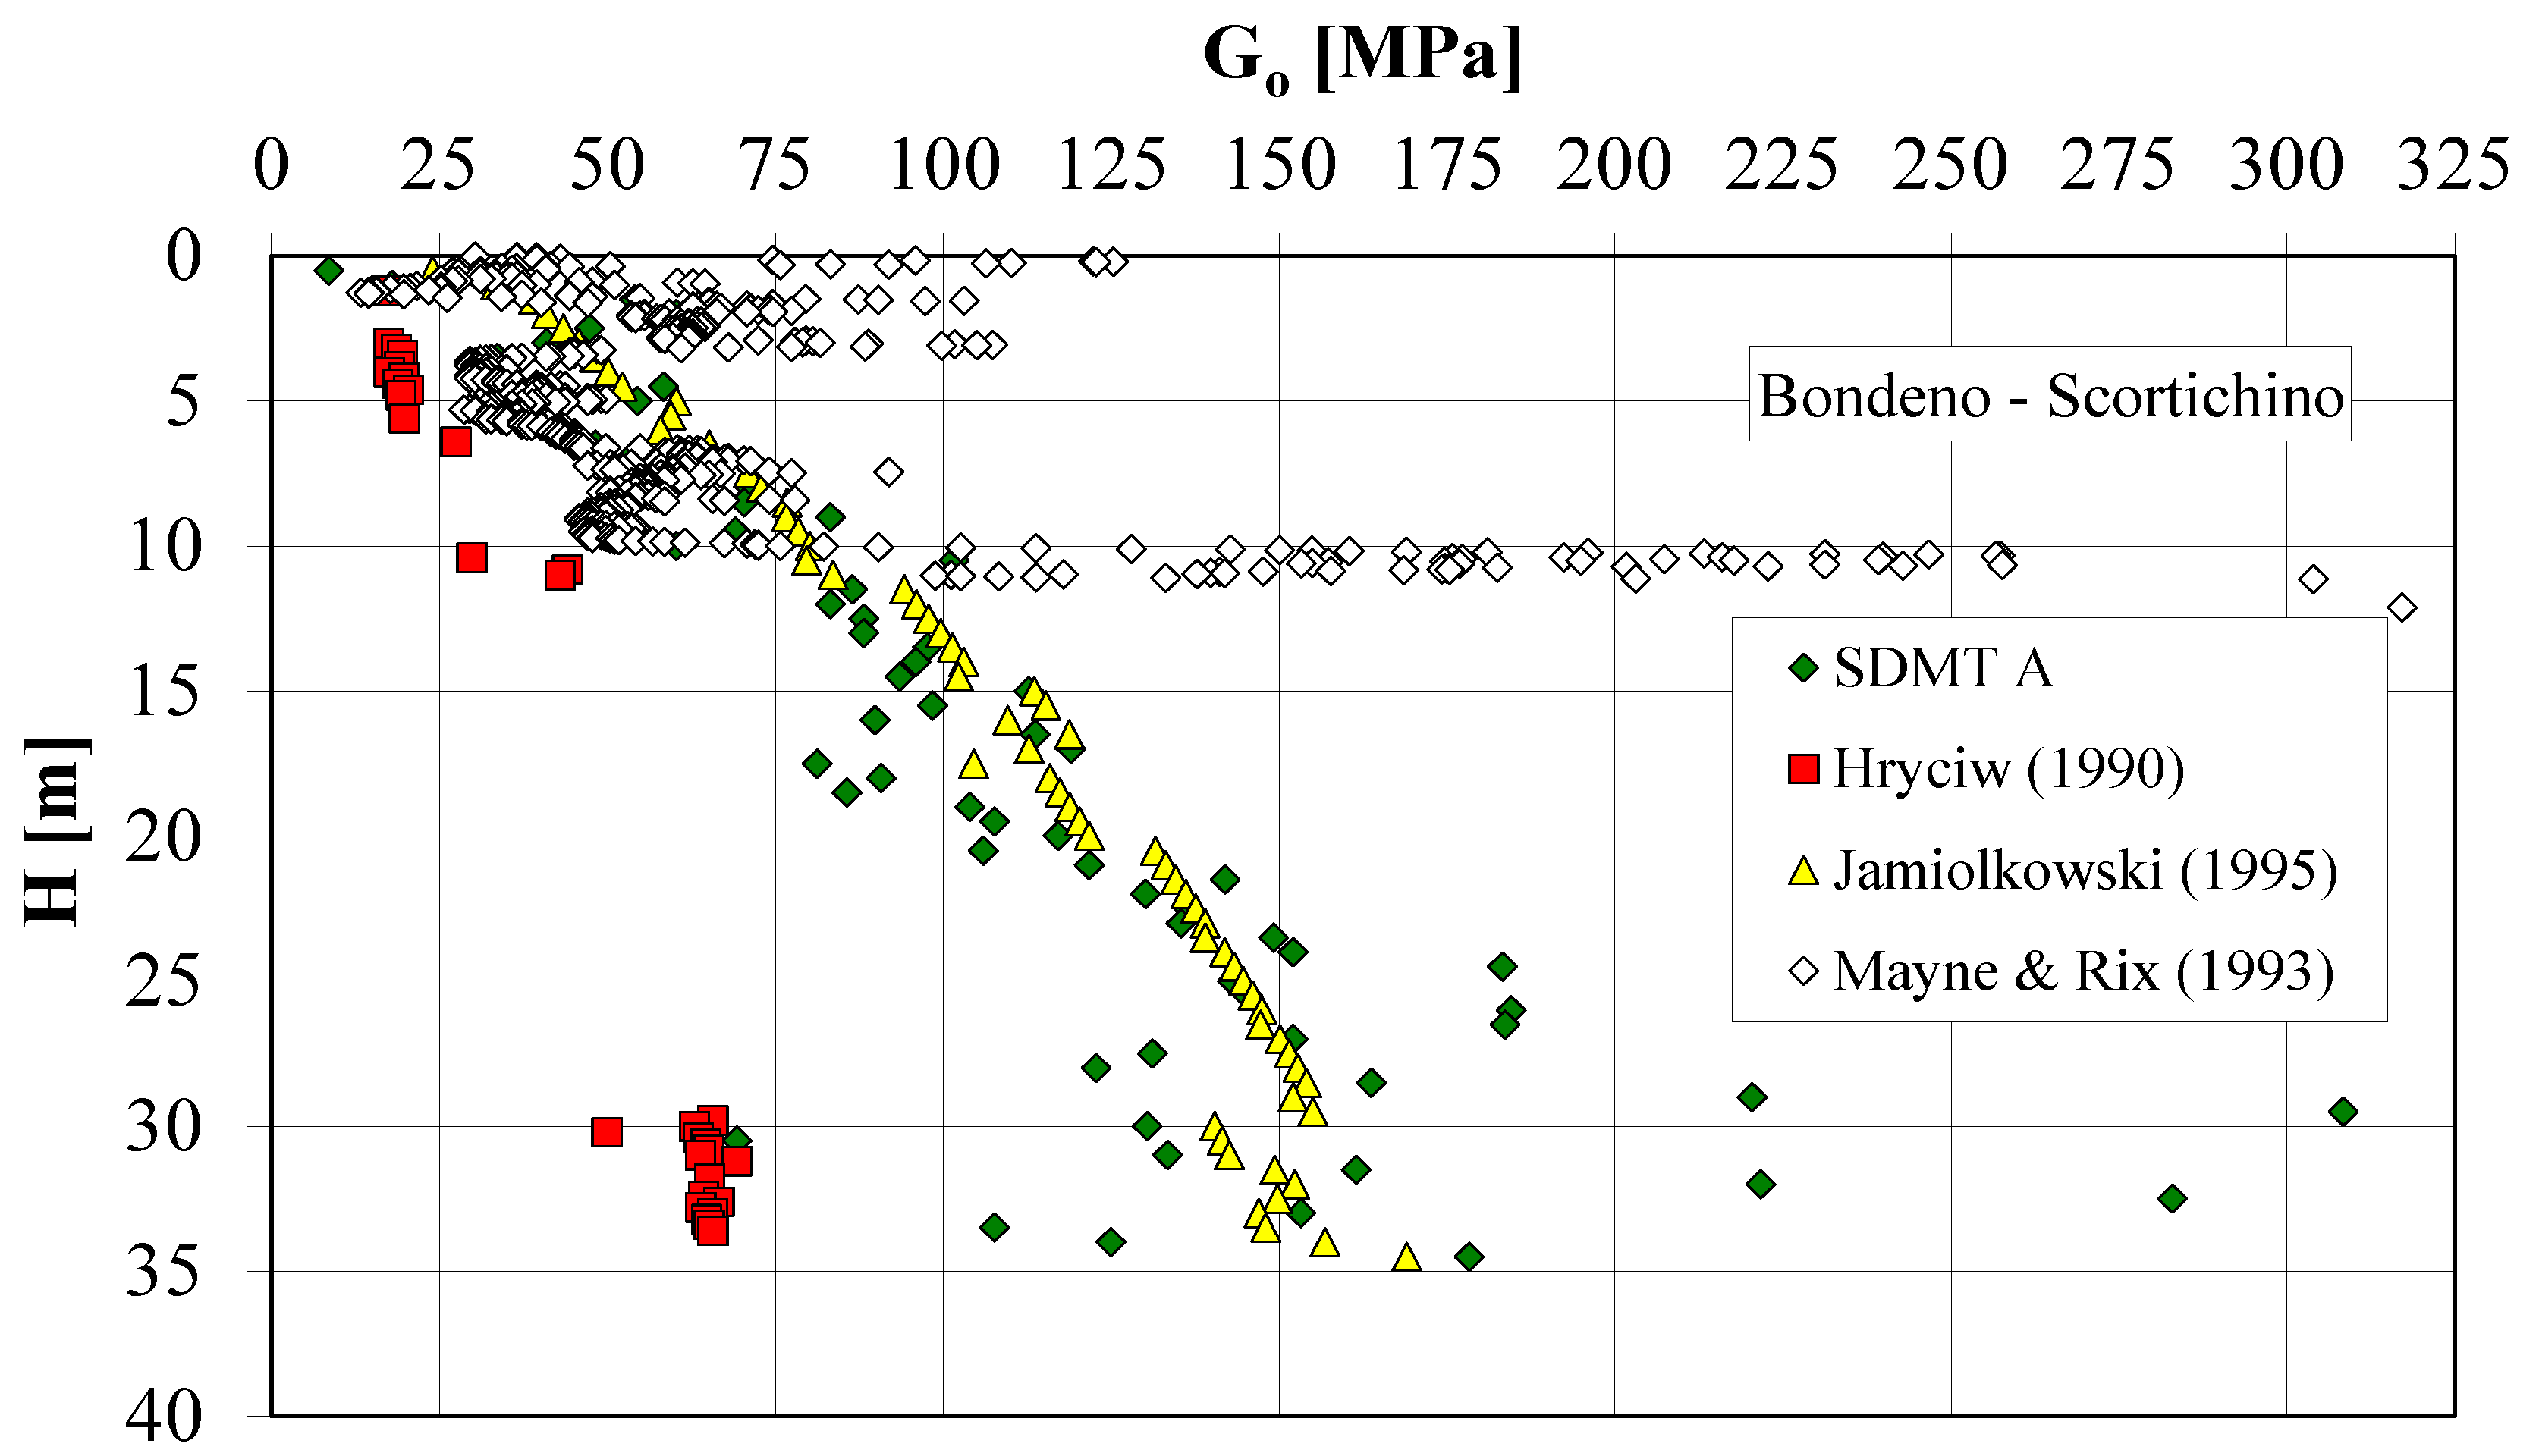
5. Evaluation of Go from Penetration Tests

It was also attempted to evaluate the small strain shear modulus by means of the following empirical correlations based on penetration tests results or laboratory results available in literature.
(a) Hryciw [22]
G o = 530 ( σ v / p a ) 0.25 γ D / γ w 1 2.7 γ D / γ w K o 0.25 ( σ v p a ) 0.5
where: σ’v and pa are expressed in the same unit; pa = 1 bar is a reference pressure; γD and Ko are respectively the unit weight and the coefficient of earth pressure at rest, as inferred from SDMT results according to Marchetti [34].
(b) Mayne and Rix [23]
G o = 406 q c 0.696 e 1.13
where: Go and qc are both expressed in [kPa] and e is the void ratio. Equation (6) is applicable to clay deposits only.
(c) Jamiolkowski et al. [24]
G o = 600 σ m 0.5 p a 0.5 e 1.3
where: σ’m = (σ’v + 2 · σ’h)/3; pa = 1 bar is a reference pressure; Go, σ’m and pa are expressed in the same unit. The values of parameters of Equation (7) are equal to the average values from laboratory tests performed on quaternary Italian clays and reconstituted sands. A similar equation was proposed by Shibuya and Tanaka [35] for Holocene clay deposits. Equation (7) incorporates a term for the void ratio; the coefficient of earth pressure at rest only appears in Equation (5). However only Equation (5) tries to obtain all the input data from the SDMT results. The Go values obtained with the methods above indicated are plotted against depth in Figure 7. The method by Jamiolkowski et al. [24] was applied considering a given profile of void ratio and Ko. The coefficient of earth pressure at rest was inferred from SDMT. The method by Mayne and Rix [23] was applied only to the cohesive strata, disregarding the high values of qc encountered in the sandy layers that exist for a depth higher of 10 m. Consequently, the obtained Go values, in the transition zone, resulted to be quite high using the Mayne and Rix [23] equation. The SDMT material index indicated the presence of sandy layers for a deeper depth than 10 m and at the same depths the dilatometer modulus greatly increases [27,28]. However, the method by Hryciw [22] was not capable of detecting these stiff strata as shown in Figure 7. On the whole considering the Go results obtained directly by SDMT, Equation (7) seems to provide the most accurate trend of Go with depth, as shown comparing the data in Figure 7. It is worthwhile to point out that the considered Hryciw [22] equation underestimates Go values for depths deeper than 20 m.

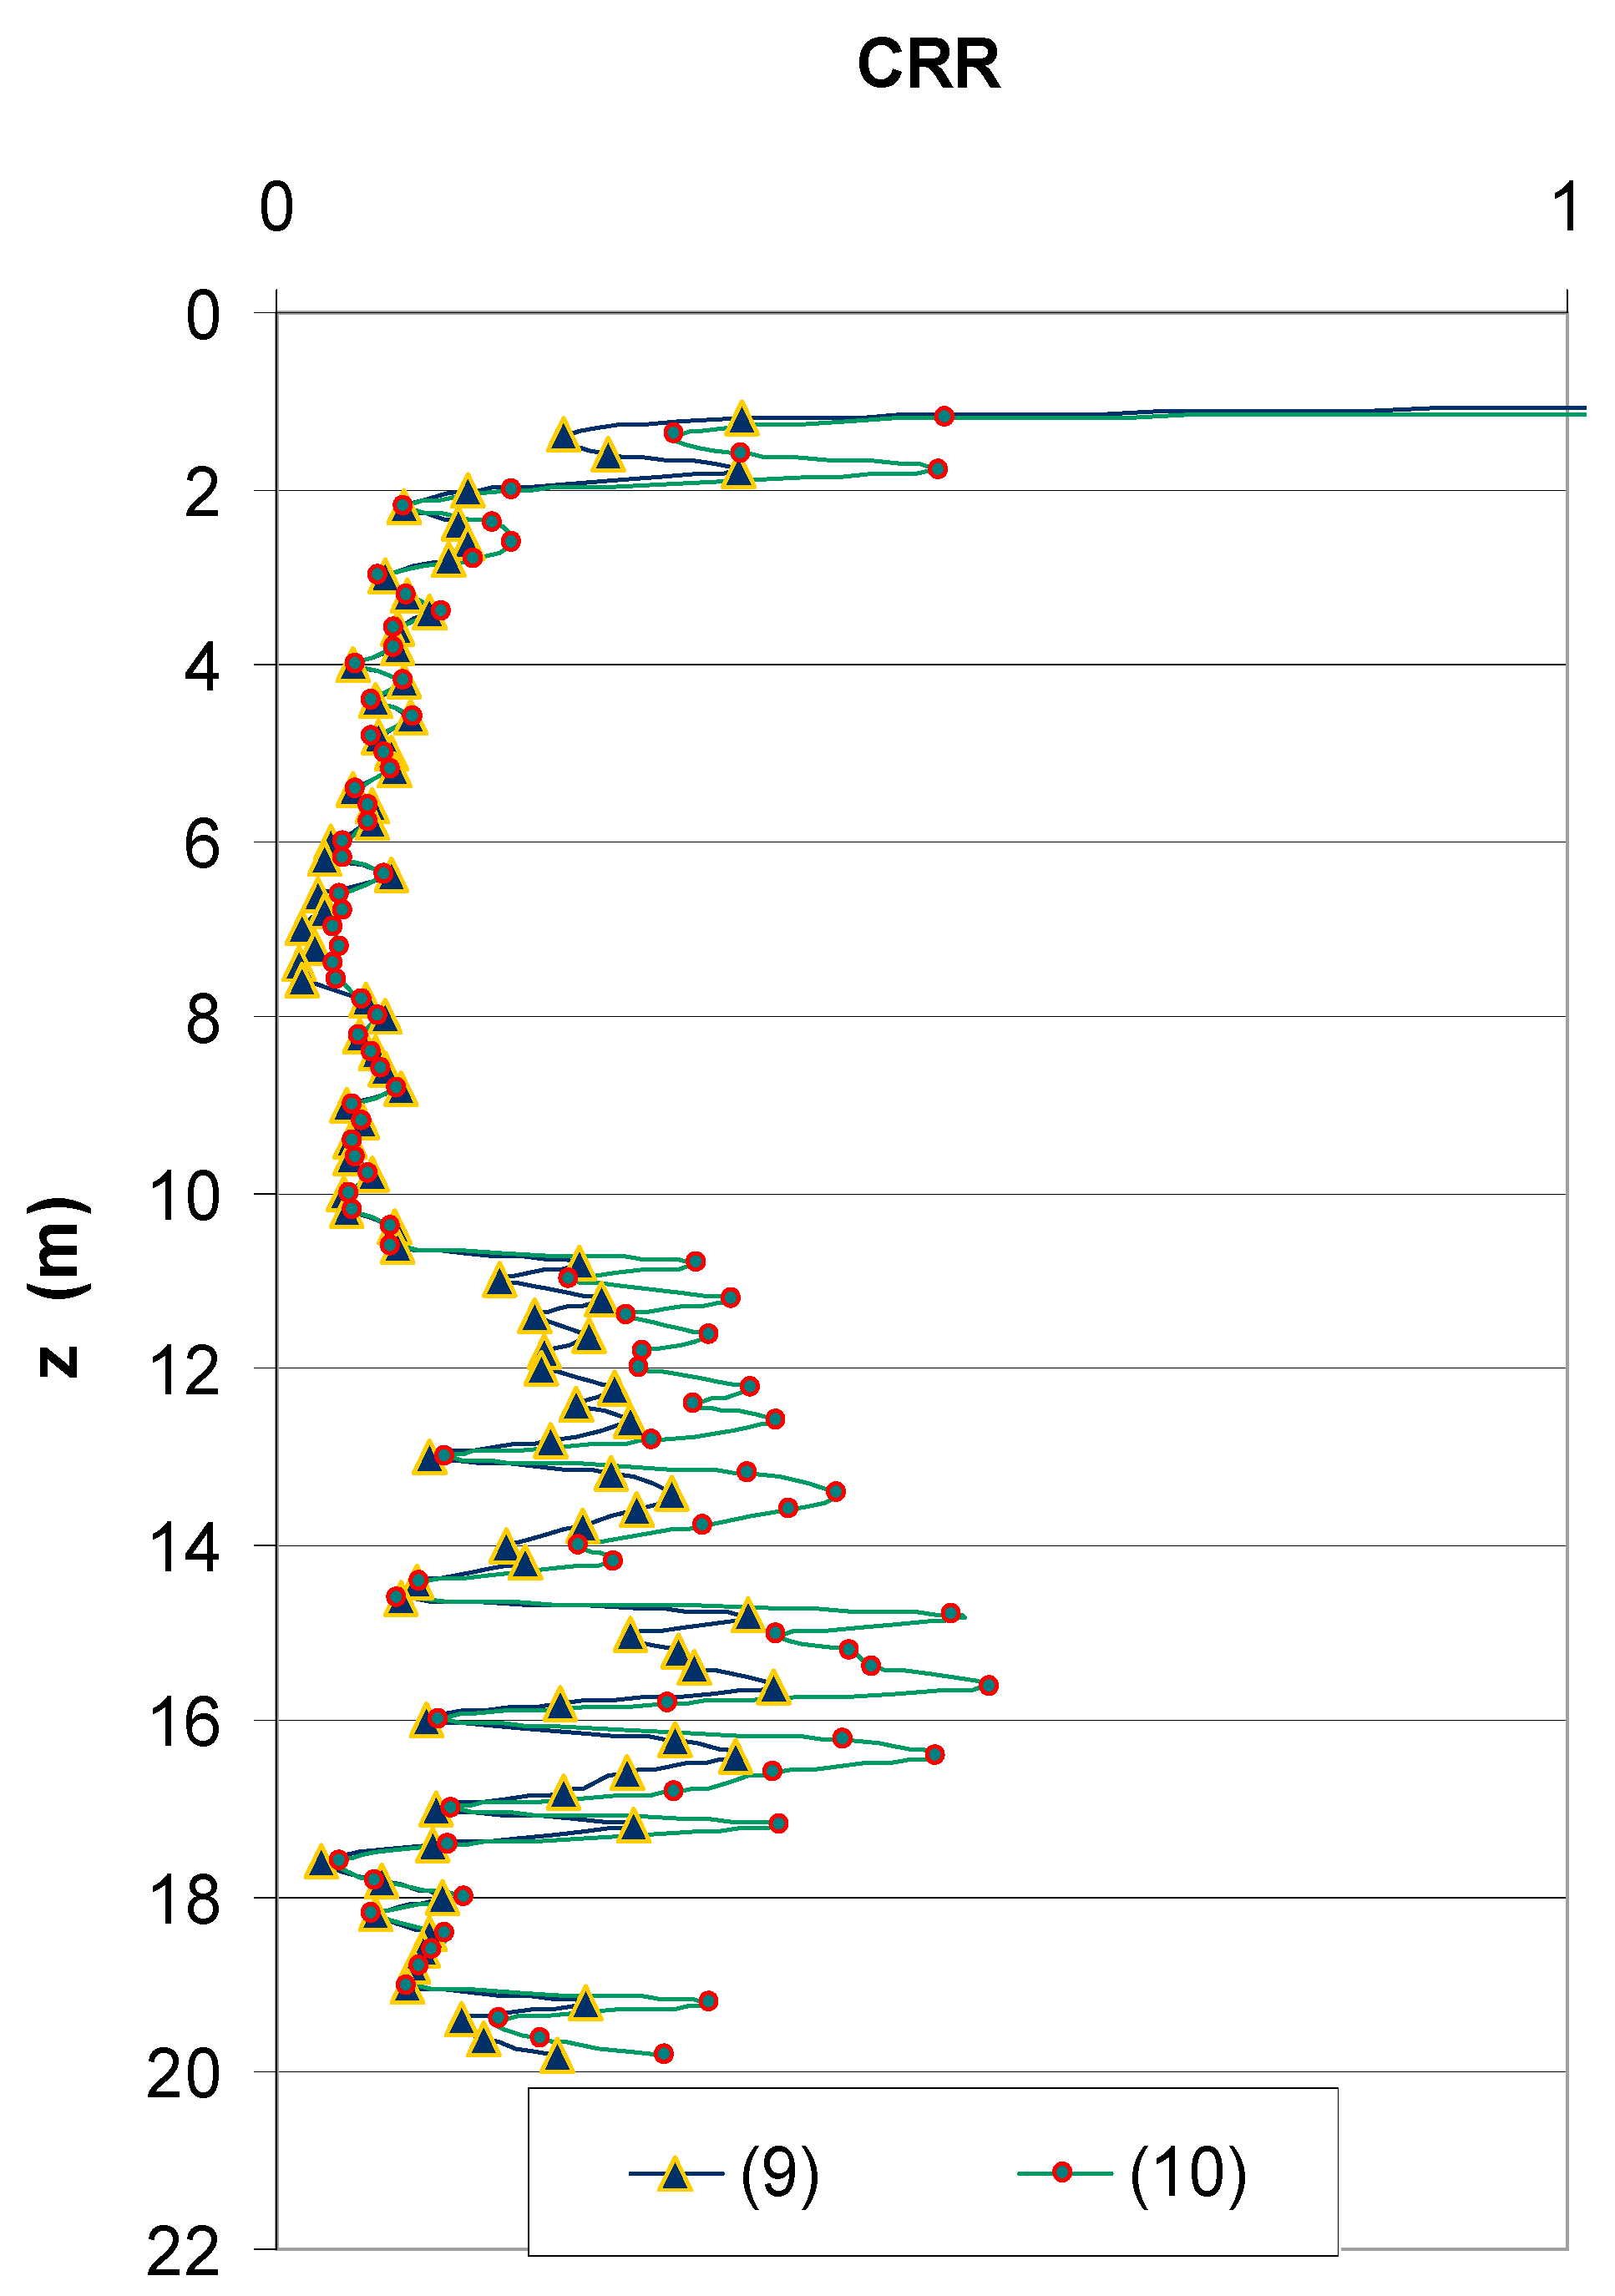
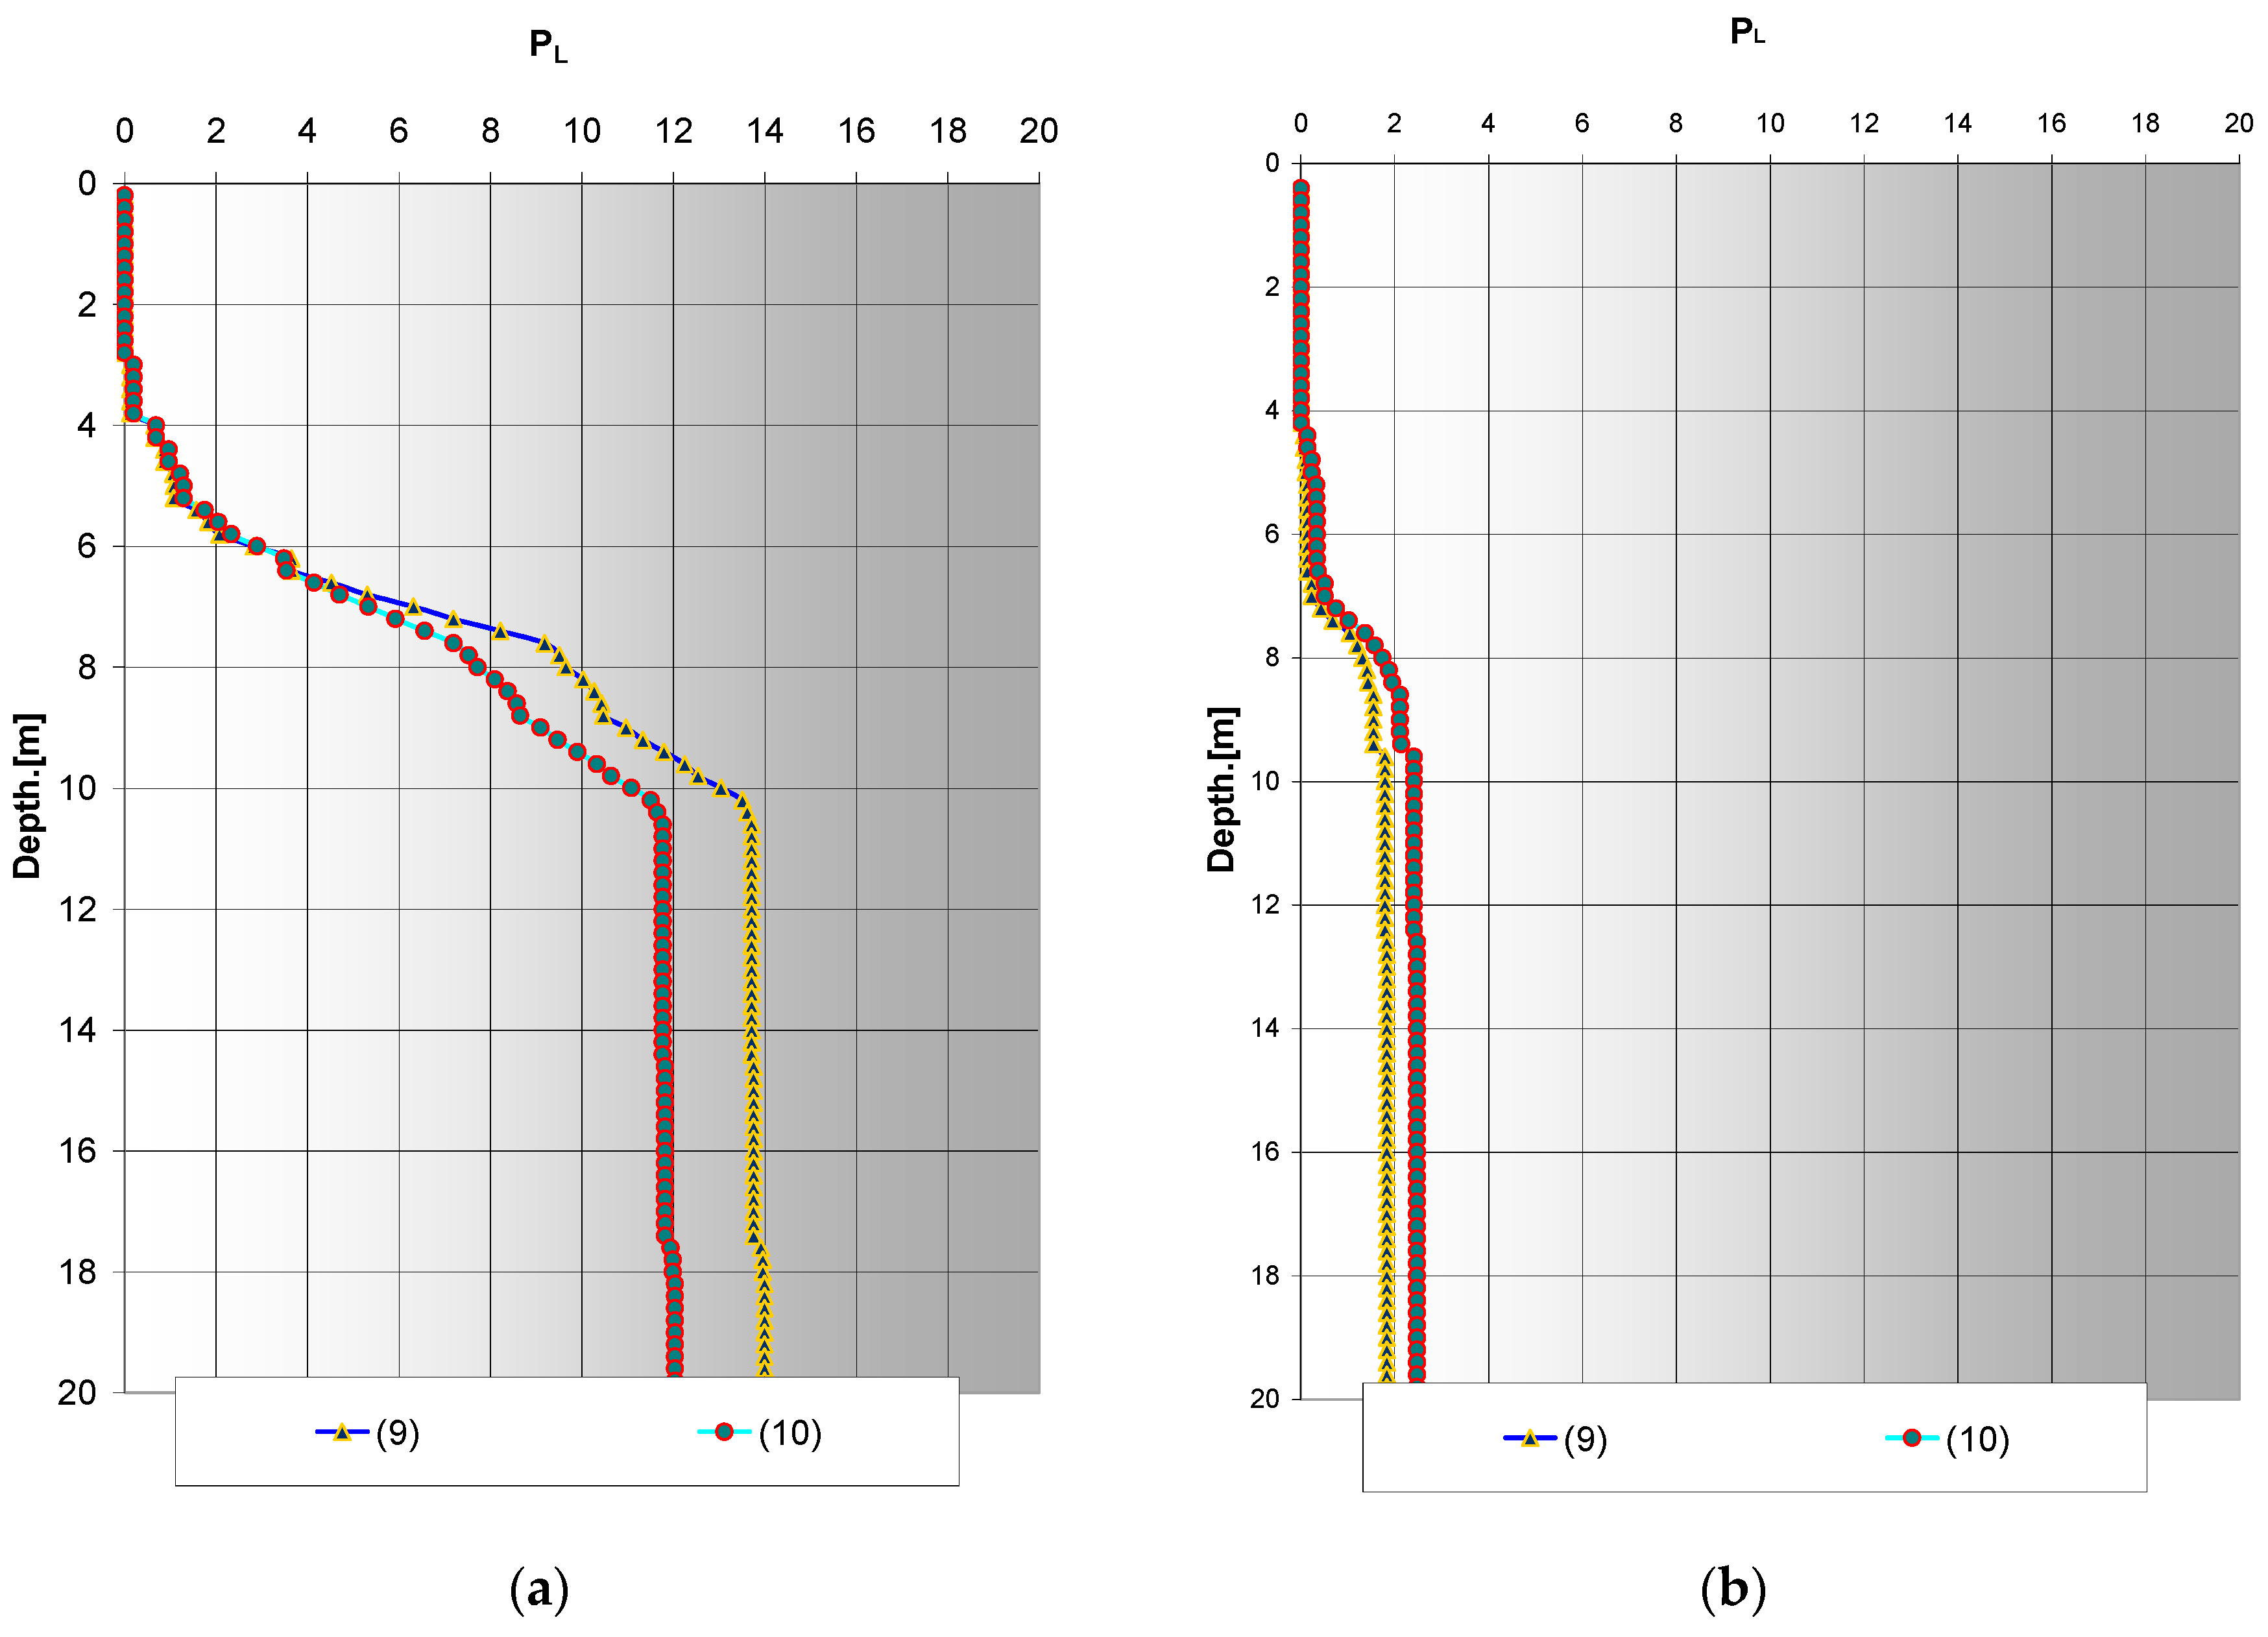
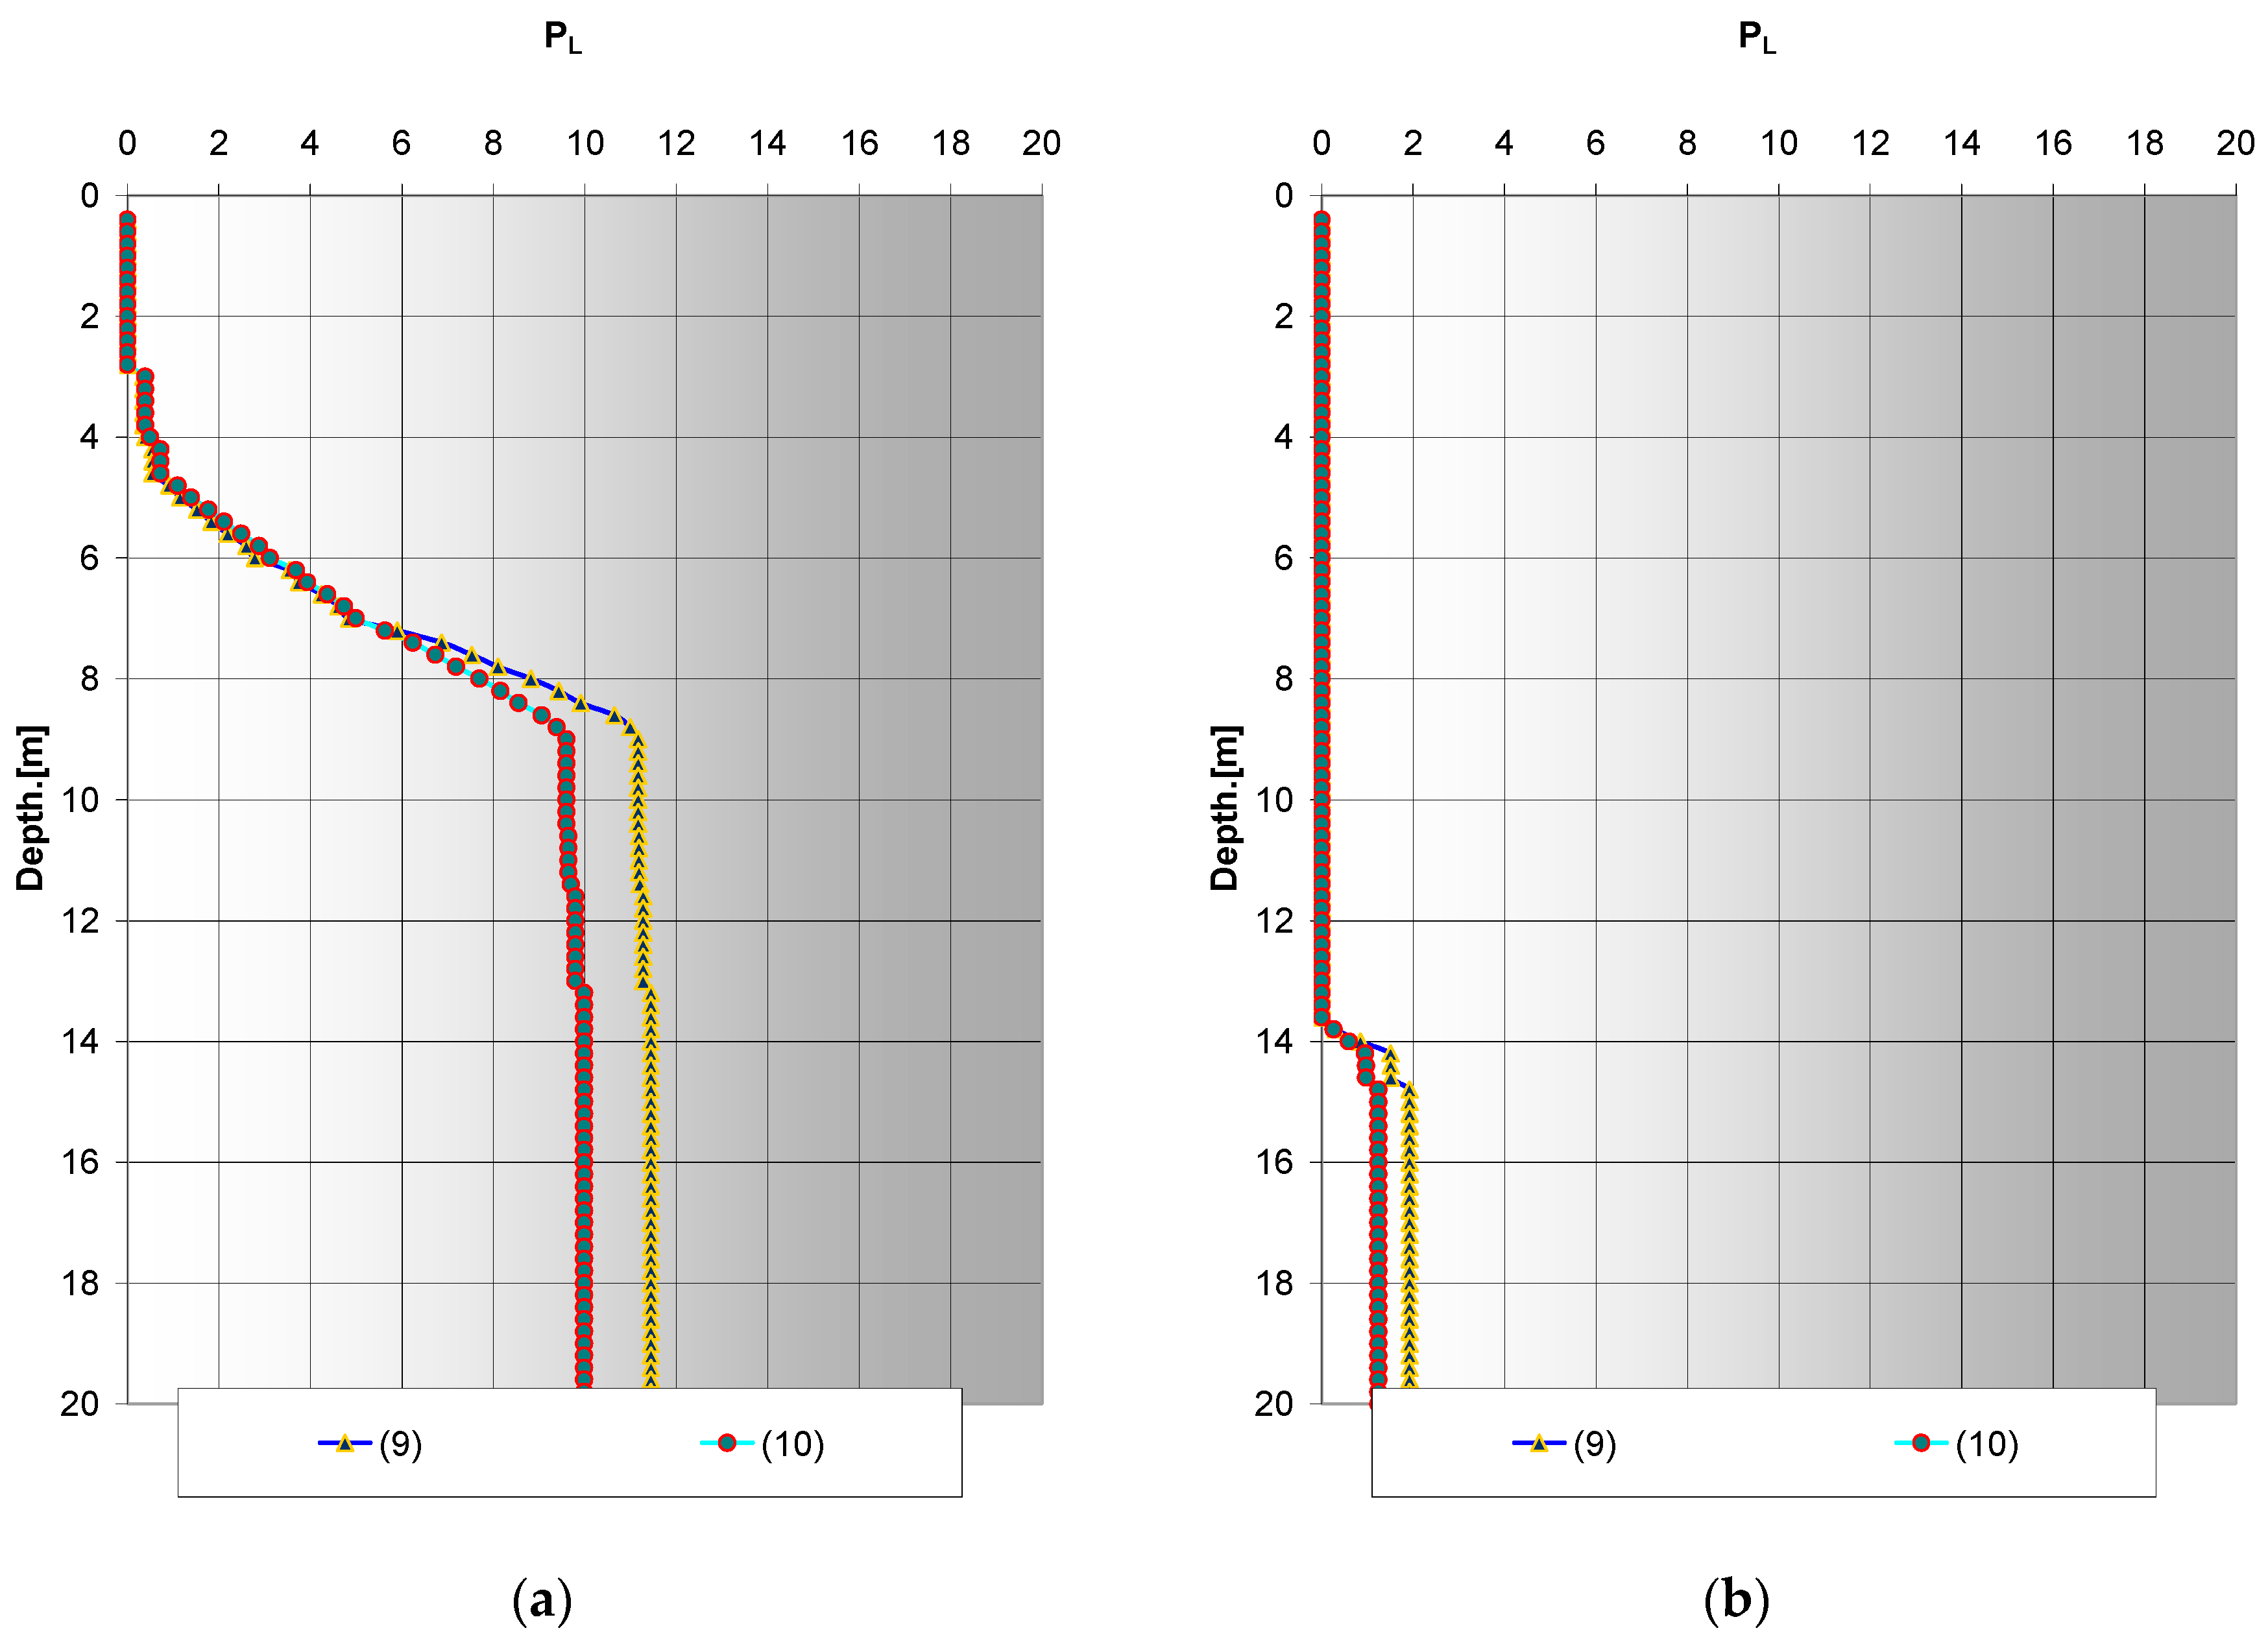
6. SDMT-Based Procedure for Evaluating Soil Liquefaction

The traditional procedure, introduced by Seed & Idriss [1], has been applied for evaluating the liquefaction resistance of soils. This method requires the calculation of the cyclic stress ratio CSR, and cyclic resistance ratio CRR. If CSR is greater than CRR, liquefaction may be. The cyclic stress ratio CSR is calculated by the following equation [1]:
CSR = τav/σ’vo = 0.65 (amax/g) (σvo/σ’vo) rd
where τav = average cyclic shear stress, amax = peak horizontal acceleration at the ground surface generated by the earthquake, g = acceleration of gravity, σvo and σ’vo = total and effective overburden stresses and rd = stress reduction coefficient depending on depth. The rd has been evaluated according to Liao and Whitman [36]. Marchetti [37] and later studies [38,39], suggested that the horizontal stress index Kd from DMT (Kd = (po − uo)/σ’vo) is a suitable parameter to evaluate the liquefaction resistance of sands by CRR. Previous CRR-Kd curves were formulated by Marchetti [37], Robertson & Campanella [38] and Reyna & Chameau [39]—the last one including liquefaction field performance data-points (Imperial Valley, South California). A new tentative correlation for evaluating CRR from Kd, to be used according to the Seed & Idriss [1] “simplified procedure”, was formulated by Monaco et al. [40] by combining previous CRR-Kd correlations with the vast experience incorporated in current methods based on CPT and SPT (supported by extensive field performance data-bases), translated using the relative density DR as intermediate parameter. Additional CRR-Kd curves were derived by translating current CRR-CPT and CRR-SPT curves (namely the “Clean Sand Base Curves” recommended by the ‘96 and ‘98 NCEER workshops, Youd & Idriss [41]) into “equivalent” CRR-Kd curves via relative density. DR values corresponding to the normalized penetration resistance in the CRR-CPT and CRR-SPT curves, evaluated using current correlations (DR-qc by Baldi et al. [42] and Jamiolkowski et al. [43], DR-NSPT by Gibbs & Holtz [44]), were converted into Kd values using the Kd-DR correlation by Reyna & Chameau [39]. The “equivalent” CRR-Kd curves derived in this way from CPT and SPT plot in a relatively narrow range, very close to the Reyna & Chameau [39] curve. The CRR-Kd curve is approximated by the equation:
CRR = 0.0107 Kd3 − 0.0741 Kd2 + 0.2169 Kd − 0.1306
and was proposed by Monaco et al. [40] as “conservative average” interpolation of the curves derived from CPT and SPT. An additional CRR-Kd curve was derived by translating current CRR-CPT and CRR-SPT curves into “equivalent” CRR-Kd curve via relative density. New tentative CRR-Kd curve approximated by the equation:
CRR = 0.0308 e(0.6054 Kd)
has been proposed by the authors as interpolation of the Kd curves derived from SPT and CPT. Figure 8 shows the evaluation of CRR, for SDMT A, according to different correlations given by Equations (9) and (10). Equation (9), given by Monaco et al. [40], provides lower values than those obtained using Equation (10).
Figure 9 shows the variation with depth of CRR given by correlation with SDMT A, performed at Scortichino test site. CSR has been evaluated assuming in Equation (8) amax = 0.264 g. The ratio CRR to CSR is called the liquefaction resistance factor (FSL). Then it is possible to evaluate the liquefaction potential index PL [45], given by the following expression:
P L = 20 F ( z ) w ( z ) d z 0
where w(z) = 10 − 0.5z and F(z) is a function of the liquefaction resistance factor (FSL) and its values are: F(z) = 0 for FSL ≥ 1 and F(z) = 1 − FSL for FSL < 1. If the liquefaction potential index PL is greater than 5 liquefaction can occur.
Figure 10 and Figure 11 show the evaluation of the liquefaction potential index, PL, obtained from Kd data respectively for SDMT A, B, C, D of Figure 1.

7. Discussion

The SDMT tests performed show some different results in terms of predicting liquefaction phenomena. The SDMT A shows the presence of silt layer up to the depth of about 4.0 m. Silty sands and sands can be recognized at a depth between 4.0 and 28.0 m. The water table is at the depth of about 6.00 m. According to the soil profile it is possible to observe absence of liquefaction up to the depth of about 7.0 m. At a greater depth, as reported in Figure 10a, the liquefaction potential index PL values (>5) predict liquefaction phenomena. In the case of SDMT B up to the depth of about 12.0 m it is possible to recognize silt and silty clay layers. The water table is at the depth of about 8.00 m. So, according to Figure 10b, it is possible to observe absence of liquefaction due to the liquefaction potential index PL values (<5) obtained through Equations (9) and (10). The SDMT C test results show a comparable situation of SDMT A, with a water table at the depth of about 8.00 m. The SDMT D test results show a comparable situation of SDMT B, excluding liquefaction phenomena according to the liquefaction potential index PL values (<5) obtained through Equations (9) and (10).

8. Conclusions

In this paper in situ and laboratory tests and also geophysical tests were performed at the city of Scortichino—Bondeno to investigate the geotechnical soil properties of Emilia Romagna Region. Borings, Piezocone tests (CPTU) and dynamic in situ tests (MASW and SDMT) have been performed with the aim to evaluate the soil profile of shear wave velocity (Vs). Resonant Column Tests were performed in laboratory on reconstituted solid cylindrical specimens. The experimental results were used to determine two equations to draw the shear modulus decay with shear strain level and the inverse variation of damping ratio with respect to the normalised shear modulus. Moreover empirical correlations, based on in situ and laboratory results, were also used to evaluate the small strain shear modulus. On the basis of the obtained results it is possible to draw that the method by Mayne and Rix [23] can be applied only to the cohesive strata and the method by Hryciw [22] is not capable of detecting stiff strata, while the method by Jamiolkowski et al. [24] seems to provide the most accurate trend of Go with depth. A good agreement of Go values was obtained by MASW and SDMT. SDMT gives also the possibility to use two independent measurements Vs and Kd for evaluating soil liquefaction. New tentative CRR-Kd correlations have been used for evaluating the liquefaction resistance from SDMT, according to the Seed & Idriss [1] “simplified procedure”. The SDMT tests performed at Scortichino site, Italy, show that especially in the area of SDMT A (near the damaged Scortichino city) and SDMT C, liquefaction potential index PL is high and almost always greater than 5, predicting liquefaction phenomena, as demonstrated by the liquefaction phenomena of 20 May and 29 May 2012. Results obtained are also in agreement with other studies performed in the same area [46,47].

Author Contributions

This paper presents the results of a working group and it is not easy to define a specific area of individual contribution. Nonetheless, P.P.C. and A.C. worked with greater attention on the performance of laboratory tests and on their interpretation based on in-situ tests, while S.G. was more involved in studying and applying methods for the evaluation of the potential liquefaction of soils, including the new SDMT procedure based on Vs and Kd.

Funding

This research received no external funding.

Conflicts of Interest

The authors declare no conflict of interest.

References

  1. Seed, H.B.; Idriss, I.M. Simplified Procedure for Evaluating Soil Liquefaction Potential. J. Geotech. Eng. Div. 1971, 97, 1249–1273. [Google Scholar]
  2. Capilleri, P.; Cavallaro, A.; Maugeri, M. Static and Dynamic Characterization of Soils at Roio Piano (AQ). Ital. Geotech. J. 2014, 35, 38–52. [Google Scholar]
  3. Castelli, F.; Cavallaro, A.; Grasso, S.; Ferraro, A. In Situ and Laboratory Tests for Site Response Analysis in the Ancient City of Noto (Italy). In Proceedings of the 1st IMEKO TC4 International Workshop on Metrology for Geotechnics, Benevento, Italy, 17–18 March 2016; pp. 85–90. [Google Scholar]
  4. Castelli, F.; Cavallaro, A.; Grasso, S. SDMT Soil Testing for the Local Site Response Analysis. In Proceedings of the 1st IMEKO TC4 International Workshop on Metrology for Geotechnics, Benevento, Italy, 17–18 March 2016; pp. 143–148. [Google Scholar]
  5. Castelli, F.; Cavallaro, A.; Grasso, S.; Lentini, V. Seismic Microzoning from Synthetic Ground Motion Earthquake Scenarios Parameters: The Case Study of the City of Catania (Italy). Soil Dyn. Earthq. Eng. 2016, 88, 307–327. [Google Scholar] [CrossRef]
  6. Castelli, F.; Cavallaro, A.; Ferraro, A.; Grasso, S.; Lentini, V. A Seismic Geotechnical Hazard Study in the Ancient City of Noto (Italy). In Proceedings of the 6th Italian Conference of Researchers in Geotechnical Engineering (CNRIG), Bologna, Italy, 22–23 September 2016; Volume 158, pp. 535–540. [Google Scholar]
  7. Cavallaro, A.; Massimino, M.R.; Maugeri, M. Noto Cathedral: Soil and Foundation Investigation. Constr. Build. Mater. 2003, 17, 533–541. [Google Scholar] [CrossRef]
  8. Cavallaro, A.; Castelli, F.; Ferraro, A.; Grasso, S.; Lentini, V. Site Response Analysis for the Seismic Improvement of a Historical and Monumental Building: The Case Study of Augusta Hangar. In Bulletin of Engineering Geology and the Environment; Springer: Berlin, Germany, 2017; pp. 1–32. [Google Scholar]
  9. Cavallaro, A.; Cessari, L.; Gigliarelli, E. Site Characterization by in Situ and Laboratory Tests for the Structural & Architectural Restoration of Saint Nicholas Church, Nicosia, Cyprus. In Proceedings of the 2nd International Symposium on Geotechnical Engineering for the Preservation of Monuments and Historic Sites, Napoli, Italy, 30–31 May 2013; pp. 241–247. [Google Scholar]
  10. Cavallaro, A.; Grasso, S.; Ferraro, A. A Geotechnical Engineering Study for the Safeguard, Restoration and Strengthening of Historical Heritage. In Proceedings of the 6th Italian Conference of Researchers in Geotechnical Engineering (CNRIG), Bologna, Italy, 22–23 September 2016; Volume 158, pp. 134–139. [Google Scholar]
  11. Martelli, L. I Terremoti del 20 e 29 Maggio 2012 in Emilia: Considerazioni Generali e Prime Analisi. Microzonazione Sismica Geologia, Geofisica e Prove Sismiche per la Microzonazione di un Comune di Medie Dimensioni: L’Esperienza di Forlì, Ordine dei Geologi; Consulta Provinciale di Forlì: Rome, Italy, 2012. [Google Scholar]
  12. Crespellani, T.; Facciorusso, J.; Ghinelli, A.; Madiai, C.; Renzi, S.; Vannucchi, G. Rapporto Preliminare sui Diffusi Fenomeni di Liquefazione Verificatisi Durante il Terremoto in Pianura Padana Emiliana del Maggio 2012; Università degli Studi di Firenze: Firenze, Italy, 2012. [Google Scholar]
  13. Cazzola, F. La Ricchezza della Terra. L’Agricoltura Emiliana fra Tradizione e Innovazione. Storia d’Italia. Le Regioni dall’Unità ad Oggi, l’Emilia-Romagna; Finzi, R., Einaudi, G., Eds.; Torino, Italy, 1977; pp. 53–123. Available online: http://www.francocazzola.it/storia-dell-agricoltura/item/53-la-ricchezza-della-terra-l%E2%80%99agricoltura-emiliana-fra-tradizione-e-innovazione (accessed on 22 June 2018).
  14. Maugeri, M.; Abate, G.; Aversa, S.; Boldini, D.; Dezi, F.; Fioravante, V.; Ghinelli, A.; Massimino, M.R.; Santucci De Magistris, F.; Sica, S.; et al. Linee di Indirizzo per Interventi su Edifici Industriali Monopiano Colpiti dal Terremoto della Pianura Padana Emiliana del Maggio 2012 non Progettati con Criteri Antisismici: Aspetti Geotecnici; Dipartimento della Protezione Civile: Rome, Italy, 2013.
  15. Fioravante, V.; Giretti, D.; Abate, G.; Aversa, S.; Boldini, D.; Capilleri, P.P.; Cavallaro, A.; Chamlagain, D.; Crespellani, T.; Dezi, F.; et al. Earthquake Geotechnical Engineering Aspects: The 2012 Emilia Romagna Earthquake (Italy). In Proceedings of the 7th International Conference on Case Histories in Geotechnical Engineering, Chicago, IL, USA, 29 April–4 May 2013. [Google Scholar]
  16. Vannucchi, G.; Crespellani, T.; Facciorusso, J.; Ghinelli, A.; Madiai, C.; Puliti, A.; Renzi, S. Soil Liquefaction Phenomena Observed in Recent Seismic Events in Emilia-Romagna Region, Italy. Int. J. Earthq. Eng. 2012, 2, 20–30. [Google Scholar]
  17. Douglas, B.J.; Olsen, R.S. Soil Classification Using the Electric Cone Penetrometer. In Proceedings of the ASCE Geotechnical Division Symposium on Cone Penetration Testing and Experience, St. Louis, MO, USA, 26–30 October 1981. [Google Scholar]
  18. Olsen, R.S.; Farr, J.V. Site Characterization Using the Cone Penetrometer Test. In Proceedings of the International Symposium (IN SITU ’86), Blacksburg, VA, USA, 23–25 June 1986. [Google Scholar]
  19. Robertson, P.K.; Campanella, R.G. Interpretazion of Cone Penetration Test. Part I (Sand); Part II (Clay). Can. Geotech. J. 1983, 20, 718–733. [Google Scholar] [CrossRef]
  20. Robertson, P.K.; Campanella, R.G. Estimating Liquefaction Potential of Sands Using the Flat Plate Dilatometer. ASTM Geotech. Test. J. 1986, 9, 38–40. [Google Scholar]
  21. Schmertmann, J.H. Guidelines for Cone Penetration Test Performance and Design; Report FHWA-TS-78-209; U.S. Department of Transportation, Federal Highway Admstration: Washington, DC, USA, 1978. [Google Scholar]
  22. Hryciw, R.D. Small Strain Shear Modulus of Soil by Dilatometer. J. Geotech. Eng. Div. 1990, 116, 1700–1715. [Google Scholar] [CrossRef]
  23. Mayne, P.W.; Rix, G.J. Gmax-qc Relationships for Clays. Geotech. Test. J. 1993, 16, 54–60. [Google Scholar]
  24. Jamiolkowski, M.; Lo Presti, D.C.F.; Pallara, O. Role of In-Situ Testing in Geotechnical Earthquake Engineering. In Proceedings of the 3rd International Conference on Recent Advances in Geotechnical Earthquake Engineering and Soil Dynamic, St. Louis, MO, USA, 2–7 April 1995; Volume II, pp. 1523–1546. [Google Scholar]
  25. Marchetti, S.; Monaco, P.; Totani, G.; Marchetti, D. In Situ Tests by Seismic Dilatometer (SDMT). In From Research to Practice in Geotechnical Engineering; ASCE Geotechnical Special Publication No. 180; John, H., Schmertmann, H., Eds.; American Society of Civil Engineers: Reston, VA, USA, 2008; pp. 292–311. [Google Scholar]
  26. Cavallaro, A.; Ferraro, A.; Grasso, S.; Maugeri, M. Site Response Analysis of the Monte Po Hill in the City of Catania. In Proceedings of the 2008 Seismic Engineering International Conference Commemorating the 1908 Messina and Reggio Calabria Earthquake (MERCEA’08), Reggio Calabria, Italy, 8–11 July 2008; Volume 1020, pp. 240–251. [Google Scholar]
  27. Cavallaro, A.; Grasso, S.; Maugeri, M.; Motta, E. An Innovative Low-Cost SDMT Marine Investigation for the Evaluation of the Liquefaction Potential in the Genova Harbour (Italy). In Proceedings of the 4th International Conference on Geotechnical and Geophysical Site Characterization (ISC’4), Porto de Galinhas, Brazil, 18–21 September 2012; Volume 1, pp. 415–422. [Google Scholar]
  28. Cavallaro, A.; Grasso, S.; Maugeri, M.; Motta, E. Site Characterization by in Situ and Laboratory Tests of the Sea Bed in the Genova Harbour (Italy). In Proceedings of the 4th International Conference on Geotechnical and Geophysical Site Characterization (ISC’4), Porto de Galinhas, Brazil, 18–21 September 2012; Volume 1, pp. 637–644. [Google Scholar]
  29. Martin, G.K.; Mayne, P.W. Seismic Flat Dilatometers Tests in Connecticut Valley Vaeved Clay. ASTM Geotech. Test. J. 1997, 20, 357–361. [Google Scholar]
  30. Martin, G.K.; Mayne, P.W. Seismic Flat Dilatometers Tests in Piedmont Residual Soils. In Geotechnical Site Characterization; Balkema: Rotterdam, The Netherlands, 1998; Volume 2, pp. 837–843. [Google Scholar]
  31. Drnevich, V.P.; Hardin, B.O.; Shippy, D.J. Modulus and Damping of Soils by Resonant Column Method. In Dynamic Geotechnical Testing; ASTM STP: West Conshohocken, PA, USA, 1978; Volume 654, pp. 91–125. [Google Scholar]
  32. Yokota, K.; Imai, T.; Konno, M. Dynamic Deformation Characteristics of Soils Determined by Laboratory Tests. OYO Tec. Rep. 1981, 3, 13–37. [Google Scholar]
  33. Cavallaro, A.; Grasso, S.; Maugeri, M. Volcanic Soil Characterisation and Site Response Analysis in the City of Catania. In Proceedings of the 8th National Conference on Earthquake Engineering, San Francisco, CA, USA, 18–22 April 2006; pp. 835–844. [Google Scholar]
  34. Marchetti, S. In Situ Tests by Flat Dilatometer. J. Geotech. Eng. Div. 1980, 106, 299–321. [Google Scholar]
  35. Shibuya, S.; Tanaka, H. Estimate of Elastic Shear Modulus in Holocene Soil Deposits. Soils Found. 1996, 36, 45–56. [Google Scholar] [CrossRef]
  36. Liao, S.S.C.; Whitman, R.V. Catalogue of Liquefaction and Non-Liquefaction Occurrences during Earthquakes; Department of Civil Engineering, Massachusetts Institute of Technology: Cambridge, MA, USA, 1986. [Google Scholar]
  37. Marchetti, S. Detection of Liquefiable Sand Layers by Means of Quasi-Static Penetration Tests. In Proceedings of the 2nd European Symposium on Penetration Testing, Amsterdam, The Netherlands, 24–27 May 1982; Volume 2, pp. 689–695. [Google Scholar]
  38. Robertson, P.K.; Campanella, R.G.; Gillespie, D.; Greig, J. Use of Piezometer Data. In Proceedings of the International Symposium (IN SITU ’86), Blacksburg, VA, USA, 23–25 June 1986. [Google Scholar]
  39. Reyna, F.; Chameau, J.L. Dilatometer Based Liquefaction Potential of Sites in the Imperial Valley. In Proceedings of the 2nd International Conference on Recent Advanced in Geotechnical Earthquake Engineering and Soil Dynamic, St. Louis, MO, USA, 11–15 March 1991; pp. 385–392. [Google Scholar]
  40. Monaco, P.; Marchetti, S.; Totani, G.; Calabrese, M. Sand Liquefiability Assessment by Flat Dilatometer Test (DMT). In Proceedings of the 16th International Conference of Soil Mechanics and Geotechnical Engineering, Osaka, Japan, 12–16 September 2005; Volume 4, pp. 2693–2697. [Google Scholar]
  41. Youd, T.L.; Idriss, I.M. Liquefaction Resistance of Soils: Summary Report from the 1996 NCEER and 1998 NCEER/NSF Workshops on Evaluation of Liquefaction Resistance of Soils. J. Geotech. Geoenviron. Eng. 2001, 127, 297–313. [Google Scholar] [CrossRef]
  42. Baldi, G.; Bellotti, R.; Ghionna, V.; Jamiolkowski, M.; Pasqualini, E. Interpretation of CPT and CPTUs. 2nd part: Drained Penetration of Sands. In Proceedings of the 4th International Geotechnical Seminar on Field Instrumentation and In Situ Measurements, Singapore, 25–27 November 1986; pp. 143–156. [Google Scholar]
  43. Jamiolkowski, M.; Baldi, G.; Bellotti, R.; Ghionna, V.; Pasqualini, E. Penetration Resistance and Liquefaction of Sands. In Proceedings of the XI ICSMFE, San Francisco, CA, USA, 12–16 August 1985; Volume 4, pp. 1891–1896. [Google Scholar]
  44. Gibbs, K.J.; Holtz, W.G. Research on Determining the Density of Sands by Spoon Penetration Testing. In Proceedings of the IV ICSMFE, London, UK, August 1957; Volume 1, pp. 35–39. [Google Scholar]
  45. Iwasaki, T.; Tatsuoka, F.; Tokida, K.; Yasuda, S. A Practical Method for Assessing Soil Liquefaction Potential Based on Case Studies at Various Sites in Japan. In Proceedings of the 2nd International Conference on Microzonation for Safer Construction, Research and Application, San Francisco, CA, USA, 26 November–1 December 1978; Volume 2, pp. 885–896. [Google Scholar]
  46. Chiaradonna, A.; Tropeano, G.; D’Onofrio, A.; Silvestri, F. Analisi Dinamiche in Tensioni Efficaci con il Codice ‘SCOSSA’. In Proceedings of the Incontro Annuale dei Ricercatori di Geotecnica, Cagliari, Italy, 24–26 June 2015. [Google Scholar]
  47. Tonni, L.; Gottardi, G.; Amoroso, S.; Bardotti, R.; Bonzi, L.; Chiaradonna, A.; D’Onofrio, A.; Fioravante, V.; Ghinelli, A.; Giretti, D.; et al. Analisi dei Fenomeni Deformativi Indotti dalla Sequenza Sismica Emiliana del 2012 su un Tratto di Argine del Canale Diversivo di Burana (FE). Rivista Italiana di Geotecnica 2015, 2, 28–58. [Google Scholar]
Figure 1. Lay-out of SDMT investigation program. Red lines represent sections along boring locations (8) along the levee; blue lines and blue points represent respectively sections and SDMT tests location in terms of coordinates: SDMT A 44°87′80.4″ N 11°32′26.0″ E, SDMT B 44°87′38.0″ N 11°33′37.9″ E, SDMT C 44°87′32.3″ N 11°34′62.1″ E, SDMT D 44°86′88.7″ N 11°35′29.7″ E.
Geosciences 08 00242 g001
Figure 2. Static cone penetration test results.
Geosciences 08 00242 g002
Figure 3. Summary of SDMTs in Scortichino—Bondeno area.
Geosciences 08 00242 g003
Figure 4. Go from laboratory and in situ tests.
Geosciences 08 00242 g004
Figure 5. G/Go-γ curves from RCT tests.
Geosciences 08 00242 g005
Figure 6. D-G/Go curves from RCT tests.
Geosciences 08 00242 g006
Figure 7. Go from different empirical correlations.
Geosciences 08 00242 g007
Figure 8. CRR-Kd curves given by different correlations for SDMT test A.
Geosciences 08 00242 g008
Figure 9. CRR with depth, from Kd data from SDMT test A, at Scortichino test site.
Geosciences 08 00242 g009
Figure 10. Evaluation of Liquefaction potential Index PL from Kd data: (a) SDMT A; (b) SDMT B.
Geosciences 08 00242 g010
Figure 11. Evaluation of Liquefaction potential Index PL from Kd data: (a) SDMT C; (b) SDMT D.
Geosciences 08 00242 g011
Table 1. Basic Soil Properties of the Scortichino—Bondeno Area.
Depth [m]qc [MPa]fs [MPa]U [MPa]Cu [kPa]Dr [%]ϕ’ [°]OCR [-]
from −0.80 m to −1.00 m-------
from −1.00 m to −1.50 m0.490.010.0022--10
from −1.50 m to −3.20 m0.830.040.1145--10
from −3.20 m to −6.50 m0.360.030.0817--3
from −6.50 m to −10.00 m0.620.020.1529--3
from −10.00 m to −11.00 m3.300.060.03-2731-
from −11.00 m to −12.00 m11.190.060.20-7637-
from −12.00 m to −12.80 m11.530.060.08-7337-
from −12.80 m to −15.40 m16.800.120.07-8539-
Table 2. Test Condition for Scortichino—Bondeno Specimens.
Test No.σ’vc [kPa] Dr [%]Go [MPa]
110080138
220080200
330080257
440080294

