Surface Level Synthetic Ground Motions for M7.6 2001 Gujarat Earthquake

1
Department of Civil Engineering, Indian Institute of Technology Hyderabad, Sangareddy, Telangana 502285, India
2
Institute of Seismological Research, Department of Science and Technology, Government of Gujarat, Raisan, Gandhinagar, Gujarat 382009, India
*
Author to whom correspondence should be addressed.
Geosciences 2018, 8(12), 429; https://doi.org/10.3390/geosciences8120429
Submission received: 29 September 2018
/
Revised: 17 November 2018
/
Accepted: 20 November 2018
/
Published: 22 November 2018
(This article belongs to the Section Natural Hazards)
Abstract
:The 2001 Gujarat earthquake was one of the most destructive intraplate earthquakes ever recorded. It had a moment magnitude of 7.6 and had a maximum felt intensity of X on the Modified Mercalli Intensity scale. No strong ground motion records are available for this earthquake, barring PGA values recorded on structural response recorders at thirteen sites. In this paper, synthetic ground motions are generated at surface level using the stochastic finite-fault method. Available PGA data from thirteen stations are used to validate the synthetic ground motions. The validated methodology is extended to various sites in Gujarat. Response spectra of synthetic ground motions are compared with the prescribed spectra based on the seismic zonation given in the Indian seismic code of practice. Ground motion characteristics such as peak ground acceleration, peak ground velocity, frequency content, significant duration, and energy content of the ground motions are analyzed. Response spectra of ground motions for towns situated in the highest zone, seismic zone 5, exceeded the prescribed spectral acceleration of 0.9 g for the maximum considered earthquake. The response spectra for towns in seismic zone 5 exhibit peaks in the low period ranges, indicating high vulnerability of low rise structures designed as per the provisions of the Indian seismic code of practice. The response spectra for towns situated in seismic zone 3 were considerably lower than the prescribed maximum spectral acceleration of 0.4 g. The substantial damage reported in towns situated in seismic zone 3 is due to poor construction practices and non-compliance with provisions of seismic design standards.
1. Introduction
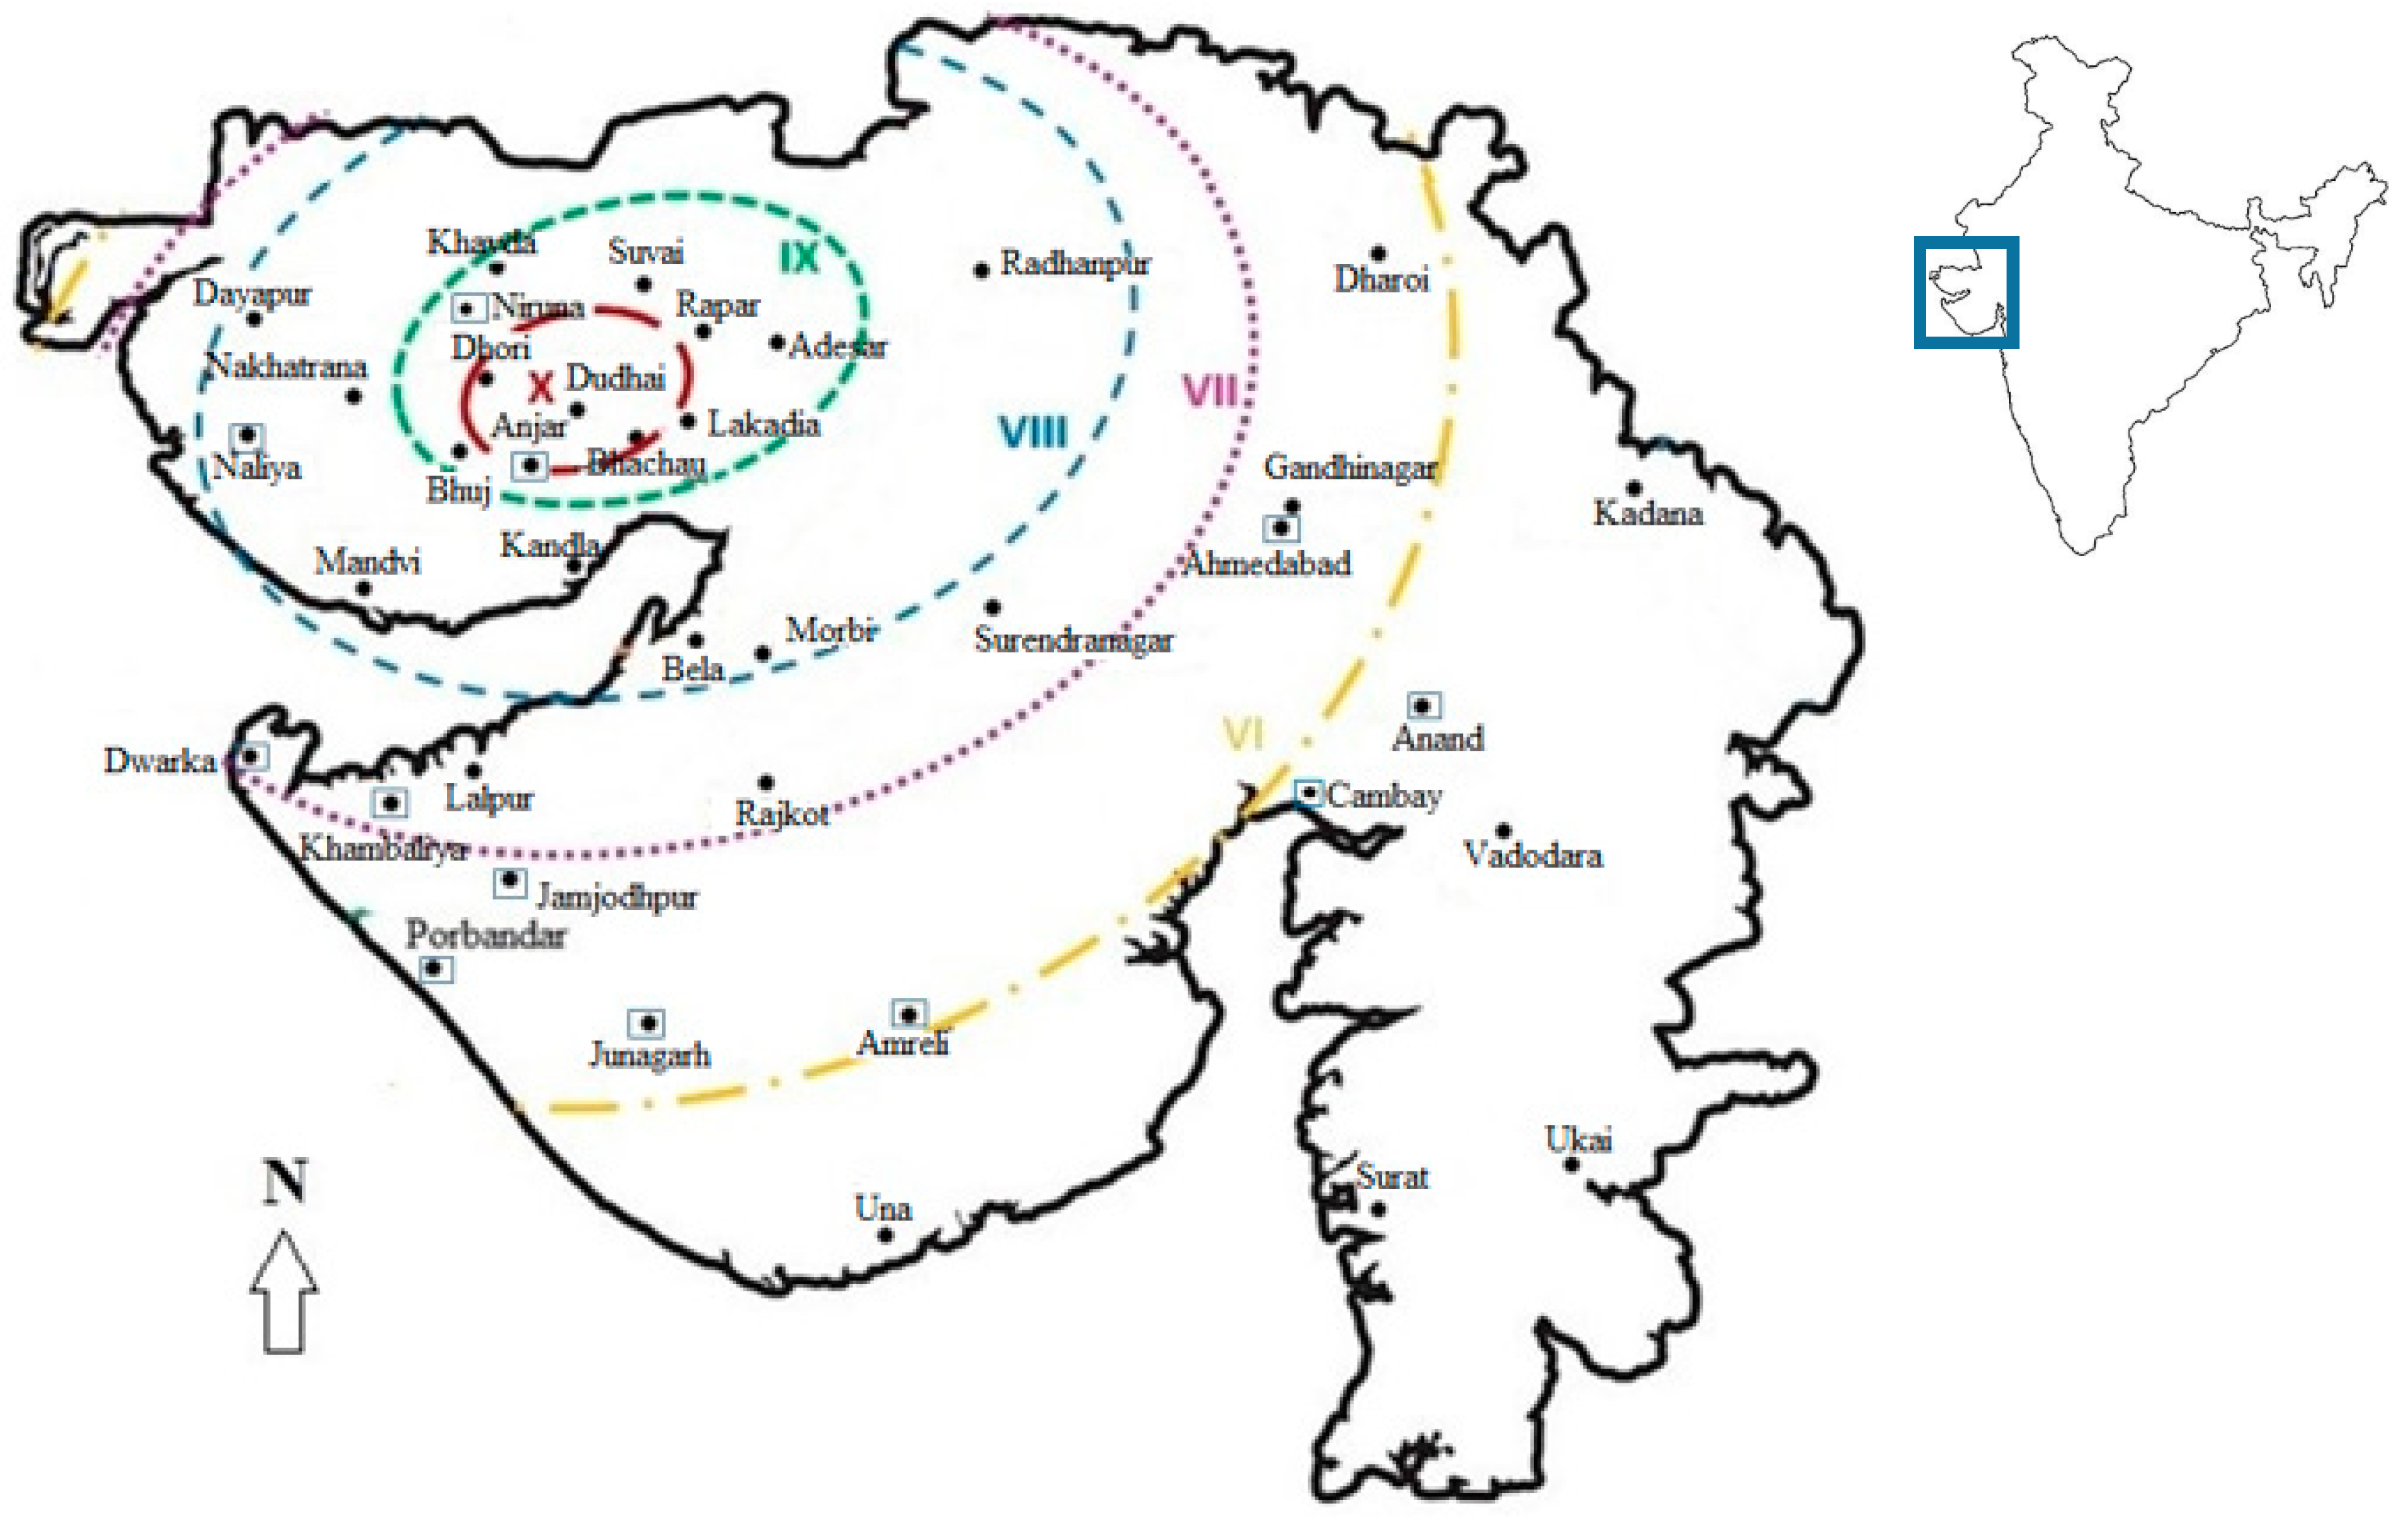
The 7.6 earthquake which struck Gujarat on 26 January, 2001 was the largest intraplate earthquake in India [1]. The maximum felt intensity was X on the Modified Mercalli Intensity (MMI) scale [2]. The earthquake mechanism was shallow oblique reverse faulting [1] with the epicenter about 9 km southwest of the village of Chobari in the Kutch region of Gujarat, India [3]. The earthquake caused widespread damage in the province of Gujarat. In the Kutch region, several towns were completely destroyed. Overall, it is estimated that the earthquake caused 13,819 deaths, damaged over a million structures, and the consequent economic loss was close to US$ 10 billion [4,5,6]. While the main fault rupture did not reach the surface, extensive secondary features, such as liquefaction in the form of sand blows/boils, craters and ground fissures were observed in the epicentral area [7] to a maximum environmental seismic intensity [8] degree of VIII. Figure 1 shows the isoseismal map for the Bhuj earthquake of January 26, 2001, based on damage surveys [9].
Damage in the epicentral region of the 2001 Gujarat earthquake was not uniform and often inconsistent [10]. Isoseismals for the earthquake [2] for seismic zone 5 show that some towns (e.g., Bhachau, Rapar, Dudhai and Adesar) witnessed complete destruction while other towns (e.g., Nakhatrana, Naliya, Khavda, and Mandvi) witnessed relatively less damage. A relationship between the building typology and ground motion characteristics can aid in understanding the unusual damage pattern in the region. However, ground motion data from this earthquake is not available and is limited to PGA recordings at thirteen stations [11]. The modified stochastic finite-fault technique has been used earlier [3] to estimate ground motions at these thirteen stations and the PGA values of the synthetic ground motions were validated with recorded PGAs from 13 stations (marked in boxes in Figure 1). However, the ground motions were generated at rock surface, and may not be representative of the actual motions experienced at the surface level, which may be obtained only after accounting for soil amplification. Only surface level ground motions can help to understand the actual damage pattern observed in the earthquake.
In this paper, ground motions are estimated using the modified stochastic finite-fault method, at surface level for various sites which experienced damage in the 2001 Gujarat earthquake. The validation study performed at 13 stations where actual PGA values are available constrains the source and dispersion parameters used in the method. Essential characteristics of these synthetic ground motions are correlated with isoseismals and reconnaissance reports of the 2001 Gujarat earthquake.
1.1. Seismotectonics of Gujarat
Physio-graphically, the Gujarat region comprises three distinct zones: Kutch, Saurashtra and Mainland Gujarat. The Gujarat region is a junction of three tectonic rifts: Kutch, Cambay and Narmada with many active faults [12,13,14]. These rifts were formed by rifting along major Precambrian trends. The rifting occurred at successive stages during the northward movement of the Indian plate after the breakup from Gondwanaland in the Late Triassic or Early Jurassic. The rifting developed around the Saurashtra horst. The Kutch rifting took place in the Late Triassic–Early Jurassic, Cambay rifting in Early Cretaceous, and Narmada rifting in the Late Cretaceous [12]. The rifting ceased in the Late Cretaceous era during the pre-collision stage of the Indian plate. The Kutch rift basin became a shear zone during the post-collision compressive regime of the Indian plate, with strike-slip movements along subparallel rift faults. The Kutch mainland fault along the rift axis became the active principal fault. The eastern part of this fault, where it overhangs the South Wagad fault, is the most strained region [13]. The epicenter of the 2001 Gujarat earthquake and its aftershocks are located in the Kutch region.
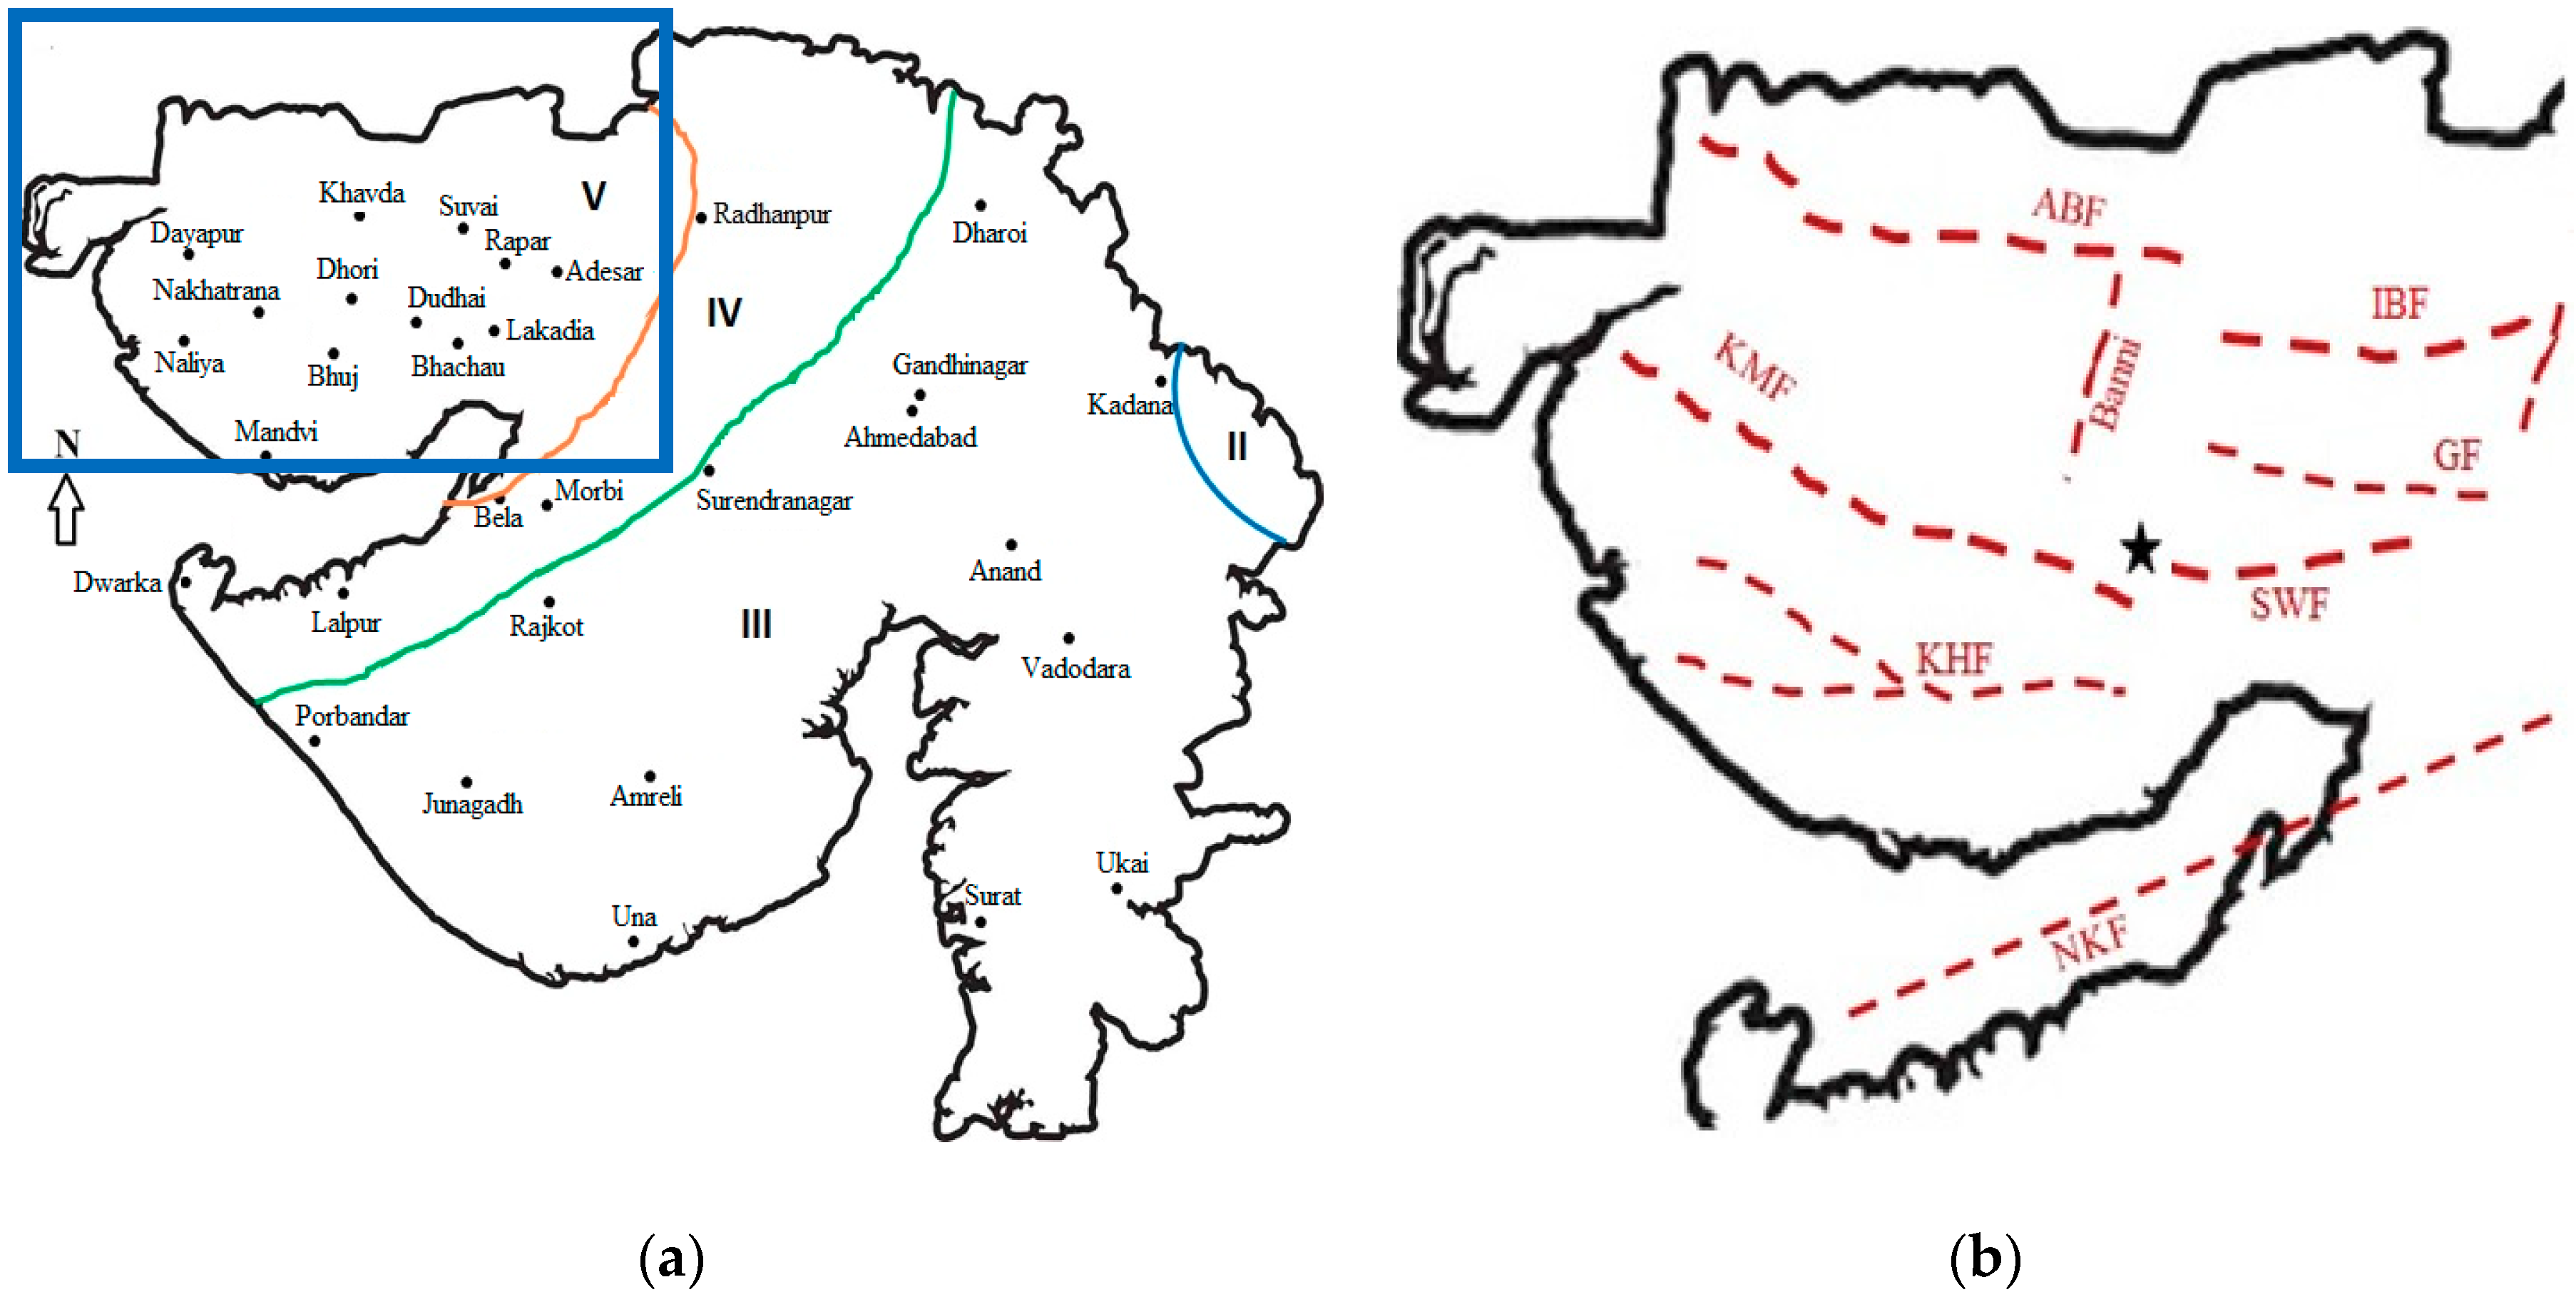
The overall earthquake hazard in Gujarat ranges from low to high, and based on the estimated hazard level, the seismic zoning map of India [15] has assigned four seismic zones to Gujarat (Figure 2a), ranging from Zone II (low) to Zone V (high). As the Kutch region has the highest earthquake hazard it lies in the Zone V, with a pseudo-spectral acceleration (PSA) at Maximum Considered Earthquake (MCE) level of 0.9 g and can expect earthquake damage corresponding to Modified Mercalli Intensity (MMI) level of IX or more. A belt of 60 km–70 km width around this zone, which covers areas of northern part of Saurashtra and areas along the eastern borders of Kutch, lies in Zone IV (PSA at MCE level is 0.625 g) of the seismic zoning map. Earthquakes arising in Kutch and local earthquakes along North Kathiawar fault in northern Saurashtra can lead to intensity (MMI) of VIII in this Zone. Due to moderate local earthquakes or strong Kutch earthquakes, Mainland Gujarat which lies in Zone III (PSA at MCE level is 0.4 g) can expect intensity (MMI) level of VII.
Among the three zones, presently the Kutch region is seismically most active. The Kutch region of Gujarat is one of the most earthquake prone intra-continental regions in the world and the mean return period of earthquakes in the Kutch region has been estimated to be 13.34 years [16]. This region has witnessed major intraplate earthquakes in the past [7,17]. Some major earthquakes which have struck the Kutch region are the 1668 Indus delta earthquake, 1819 Kutch earthquake, and 1845 Lakhpat earthquakes. Several moderate earthquakes (5 < M < 6) have also occurred in the region, e.g., 1956 Anjar earthquake ( 6.0). Figure 2b shows some of the major faults in the Kutch region, the Kutch Mainland fault (KMF), Katrol Hill Fault (KHF), Allah Bund Fault (ABF), Island Belt Fault (IBF), Gedi Fault (GF) and the North Kathiawar Fault (NKF). The epicenter of the 2001 Gujarat earthquake is also marked in Figure 2b. It may be observed that the key faults in the Kutch region trend in the east-west direction. The epicentral region of the 2001 earthquake lies at a distance of 400km from the Indian-Eurasian plate boundary. It is known that both the India–Eurasian plate collision processes and the dilatational perturbations in the ambient strain field due to past earthquakes in the Kutch region have loaded contiguous regions which contributed to the 2001 Gujarat earthquake [18]. These observations indicate the high seismic hazard potential for the Kutch region.
1.2. Methodology for Generation of Synthetic Accelerograms
Strong motion records from major earthquakes in Gujarat are not available. In such regions where a historical database of strong ground motions is unavailable, modified records may be obtained by either generation of synthetic records or by scaling natural records obtained from other regions. In this study, the modified stochastic finite fault method [19] is used to generate synthetic ground motions. Subsequently, the synthetic ground motions are used to derive response spectra. The procedure to obtain synthetic ground motions using the modified stochastic method [19] is now described. In the stochastic point source model [20] acceleration spectrum, of shear waves at a distance, from a seismic source with the moment, may be estimated as
where is the frequency, is the radiation pattern, is amplification due to the free surface, is the reduction factor that accounts for the partitioning of energy into two horizontal components, is the density, is the shear wave velocity, is the corner frequency, is the quality factor, is the geometrical spreading term, and is spectral decay parameter called kappa [21]. The stochastic point source model was extended [22] to large seismic sources by dividing entire fault into smaller sub-faults and considering each sub-fault as a point source. The contributions from all sub-faults are summed after accounting for the time delay to obtain the ground motion acceleration, from the entire fault,
where are the contribution from each sub-fault, and () are the number of sub-faults along the length and width of the entire fault and is the relative delay time for the wave from sub-fault to reach the point under observation. The stochastic finite-fault method was improved [19] to introduce the concept of dynamic corner frequency. The corner frequency is a function of time, and during the fault rupture process, the corner frequency depends on the cumulative ruptured area. The rupture history of the fault controls the frequency content of the simulated time series of each sub-fault. The dynamic corner frequency of the sub-fault, , is defined as [19]:
where is the cumulative number of ruptured sub-faults at time t, is the stress drop and is the average seismic moment of sub-faults (= ). At the time the rupture ends, , the entire fault is ruptured, i.e., and thus, the corner frequency of the complete fault is described as
To conserve the total radiated energy from sub-faults at high frequencies and to balance the level of the spectrum of the sub-faults, a scaling factor, , was defined as [19]:
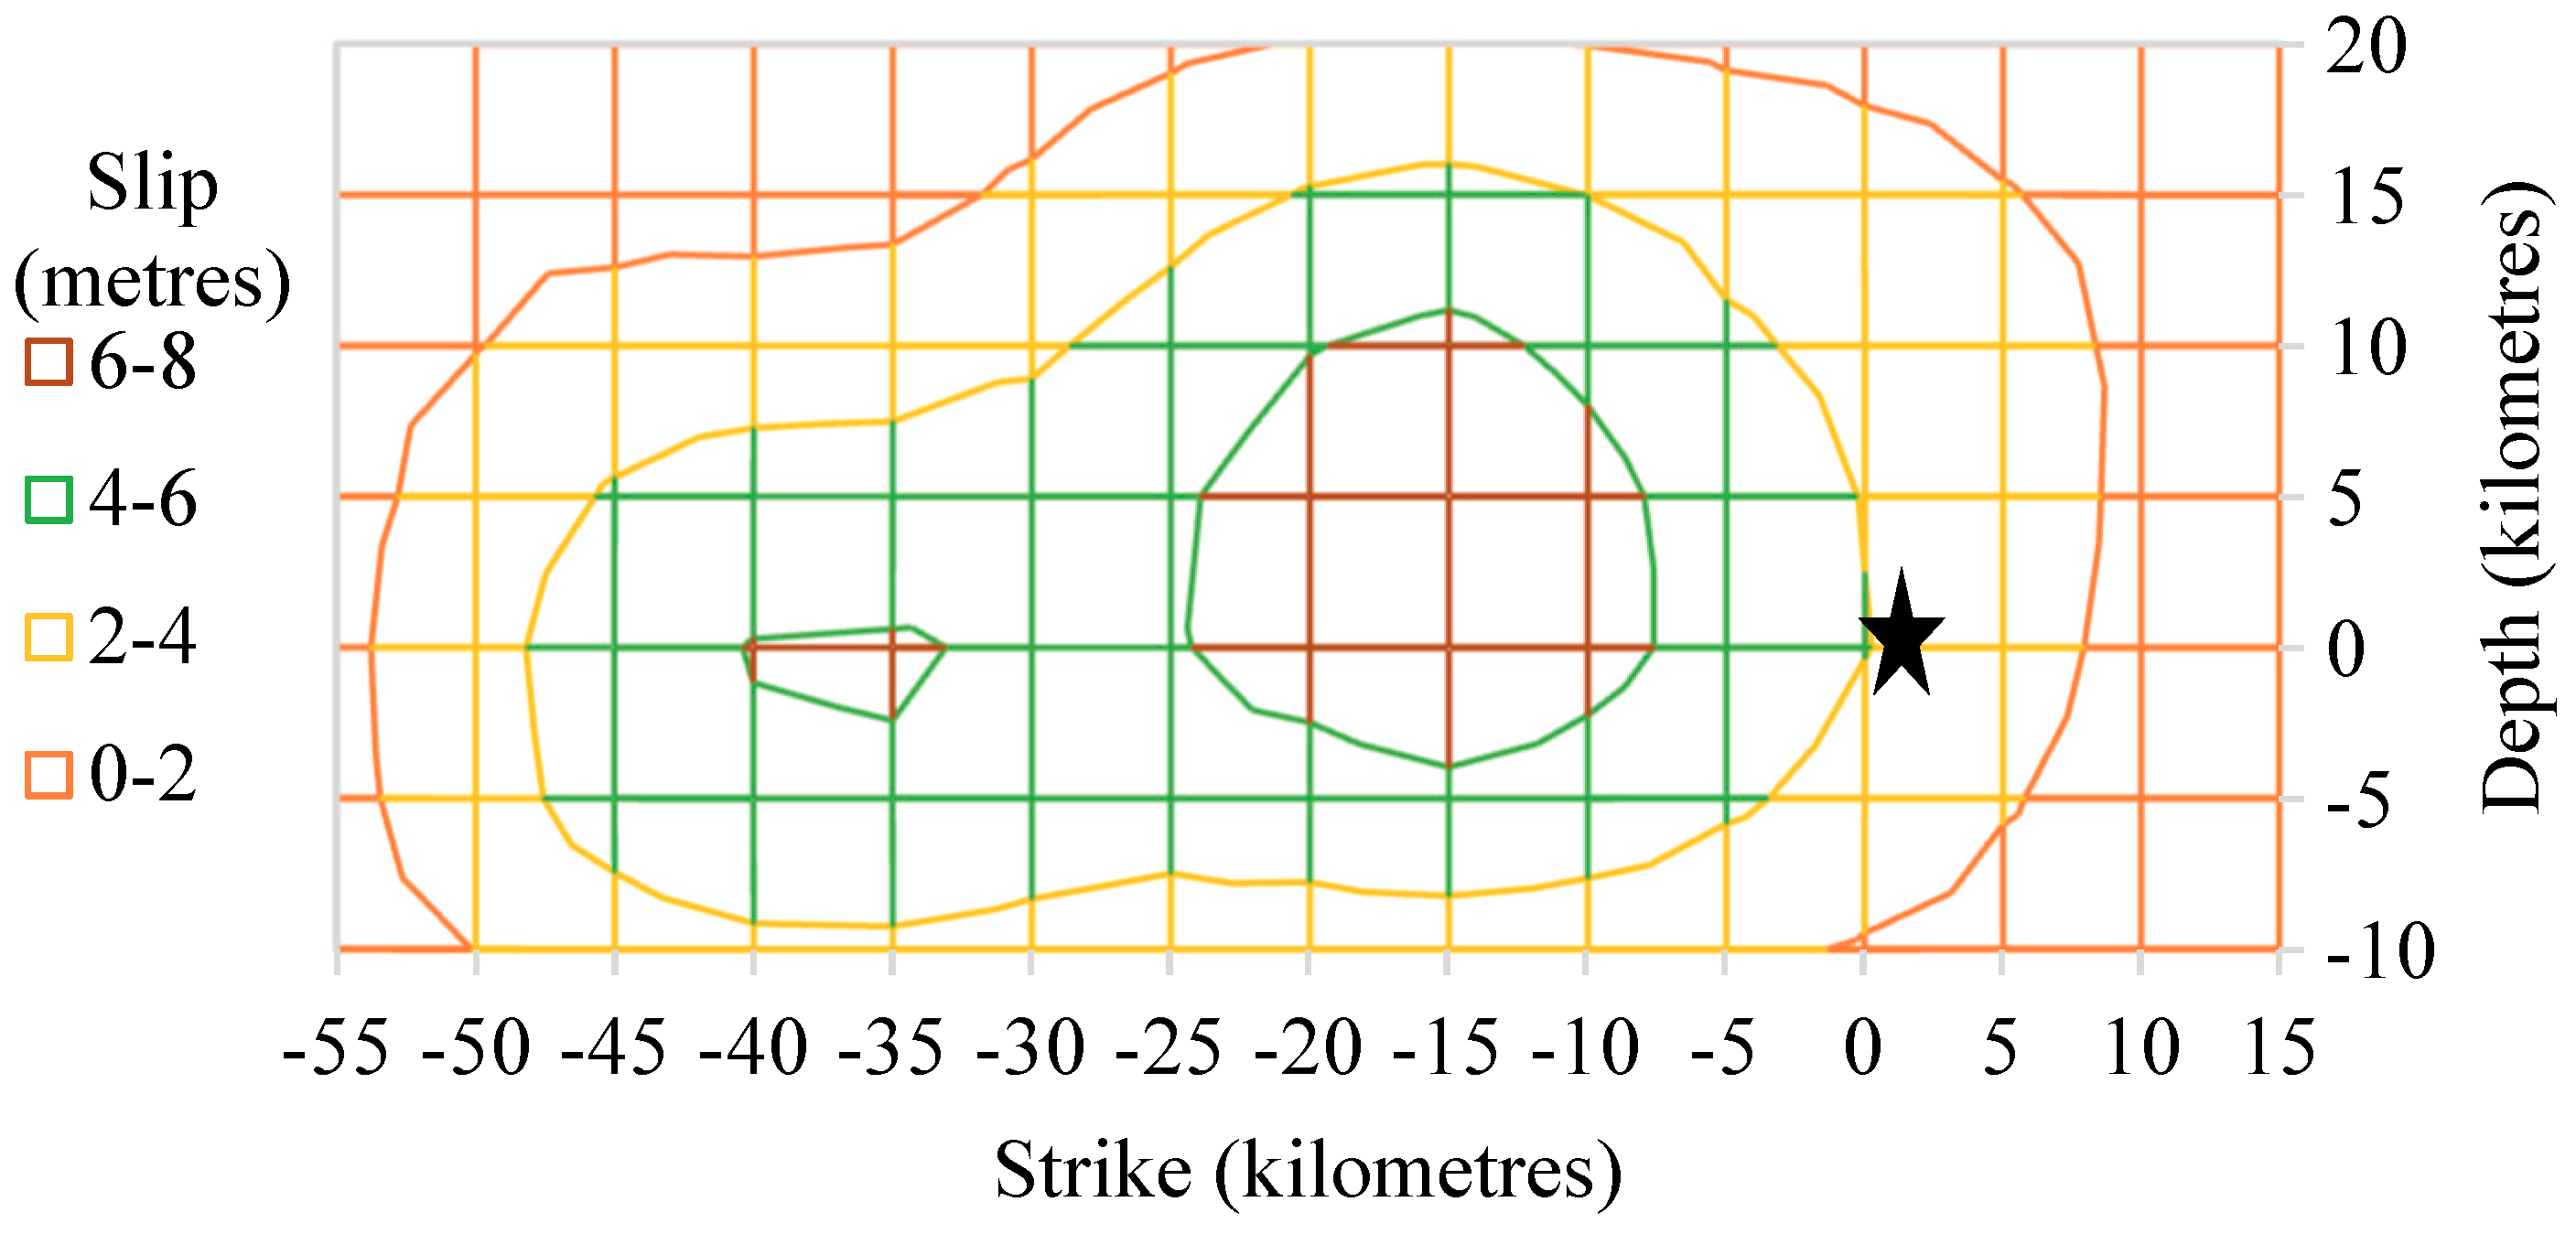
To generate ground motions for the 2001 Gujarat earthquake, EXSIM software, which is based on stochastic finite-fault method [19] is used. Details of the source characteristics and damage pattern of the earthquake are available in literature [18,23,24,25,26,27,28]. The 2001 Gujarat earthquake ( 7.6) being an intraplate earthquake, has been estimated as a high-stress drop event. The aftershock analysis of the earthquake implied a high-stress drop of 126–246 bars of the main event [23]. A stress drop of 200 bars was suggested [25] on the basis of stochastic finite-fault modelling of the earthquake. A stress drop of 150–200 bars has been suggested [29] using stochastic point source modelling of the earthquake. As stress drop is a calibration factor in EXSIM, in this study, the simulations were tried for stress drops of 100, 125, 150 and 160 bars. PGA values obtained with 125 bars were closest to actual PGA values, and the stress drop of 125 bars was used for simulations. The stress drop value satisfies the intensity observations and the structural response recorder observations [3]. The duration model for eastern North America [30] was adopted since the predicted ground motions for the 2001 Gujarat earthquake seem close to ground motions from earthquakes in central or eastern North America (e.g., [3,31]). Based on inversion of teleseismic waves, the fault dimensions have been estimated [32] as 75 km × 35 km. The parameters and the slip distribution data for the ruptured fault of the 2001 earthquake were obtained from the study [32]. Figure 3 shows the slip distribution as estimated [32]. Slip is estimated in meters. The geometric spreading parameters and the frequency dependent attenuation relation developed for the region [31] was used in the model.
Table 1 shows the model parameters used in the modified stochastic finite fault method for generation of ground motions at bedrock level. The coordinates of the earthquake are as reported by USGS [33]. The model also includes the pulsing area, to account for the slip behavior of earthquake ruptures where the slip may occur only on the part of the fault at any particular time [19]. PGA data in the 2001 Gujarat earthquake was recorded at a variety of soil conditions. The PGA data was corrected [11] to a common geological site condition. The National Earthquakes Hazard Reduction Program (NEHRP), B/C boundary (Shear Wave Velocity, = 760 m/s) of U.S. national seismic hazard maps [34], were chosen to represent the common site condition. The correction factors, to = 760 m/s site condition, were determined using factors from reference [35]. The surface geology at each recording site was determined at a scale of 1: 2,000,000 [36] using the classification scheme of Quaternary sediments (Q) as NEHRP C, and rock (R).
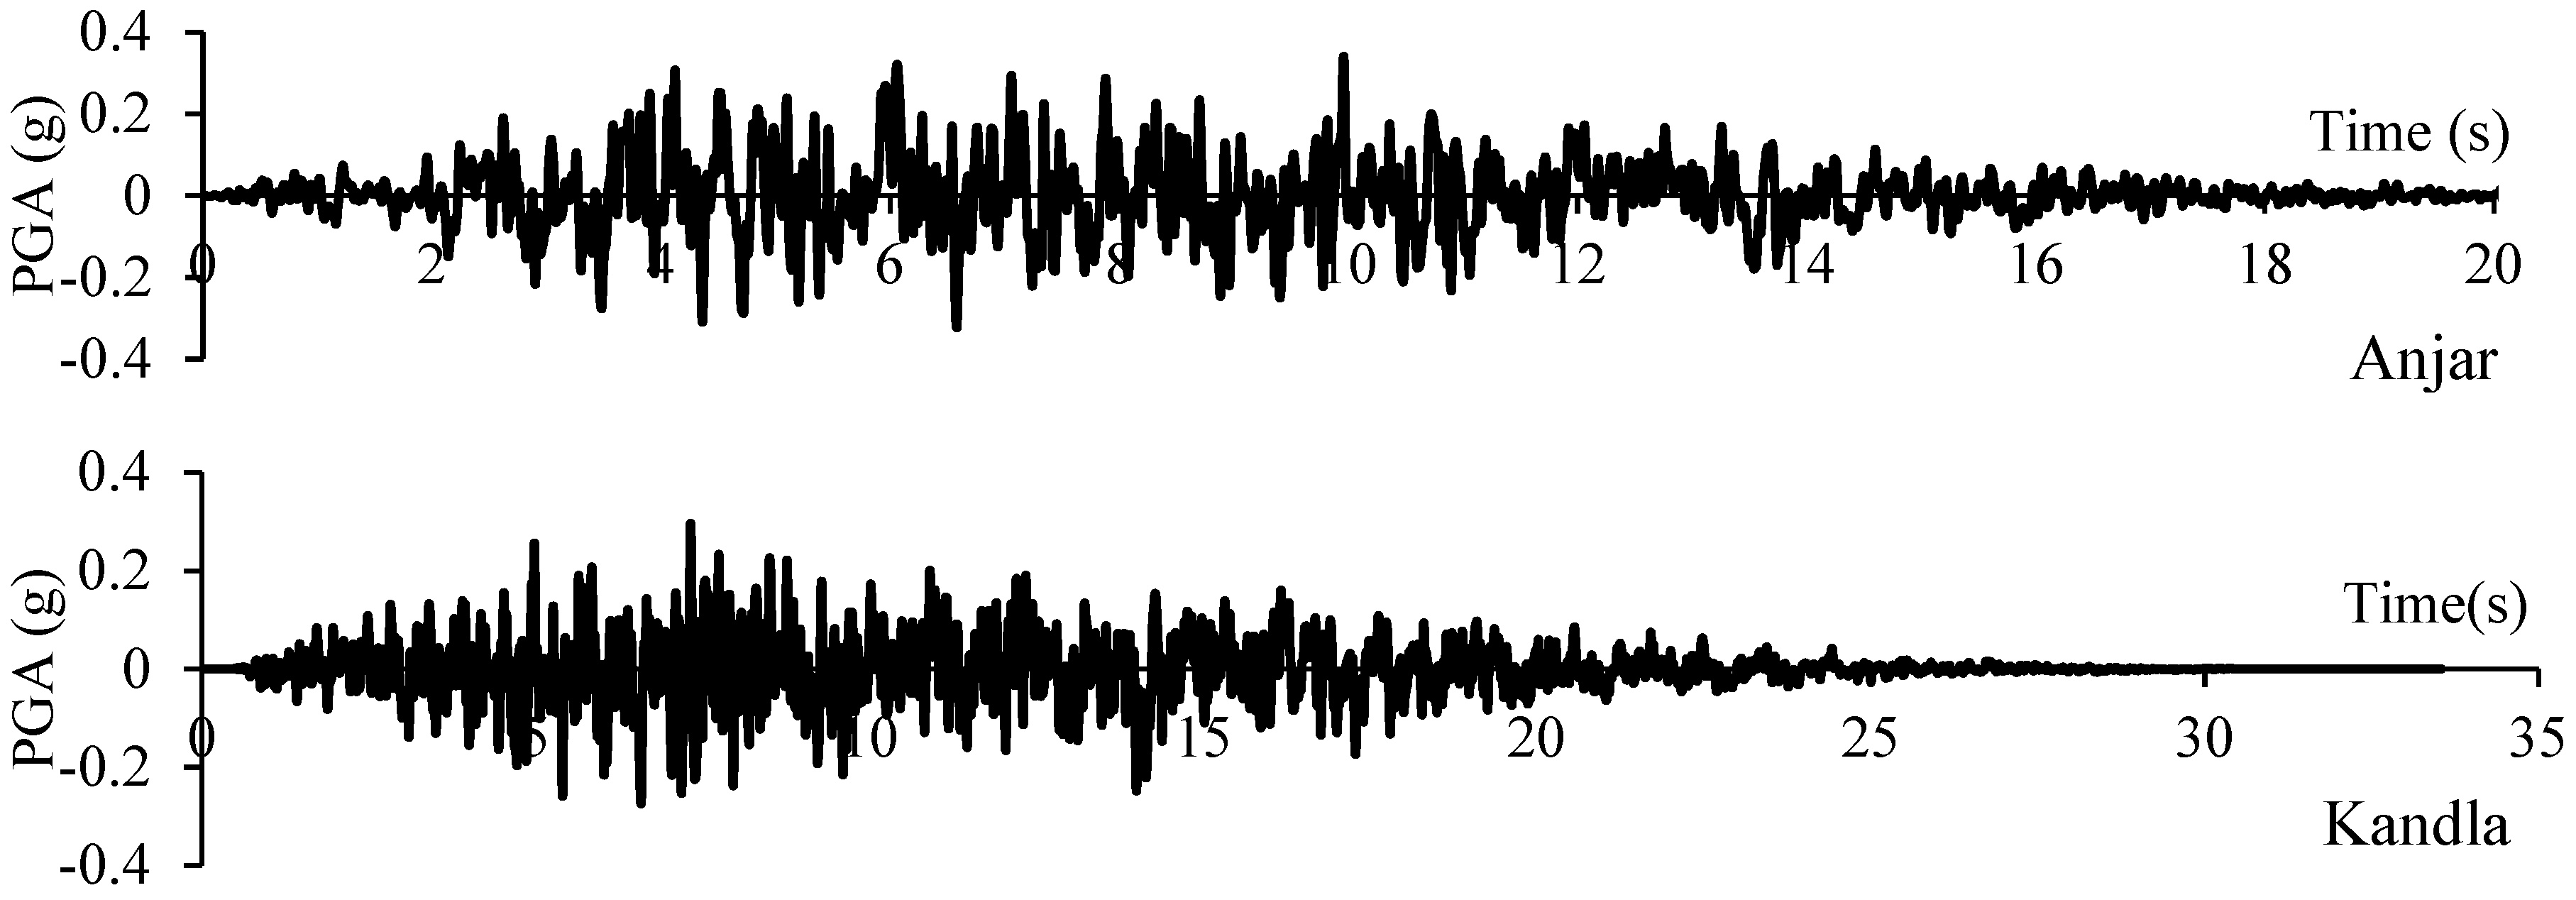
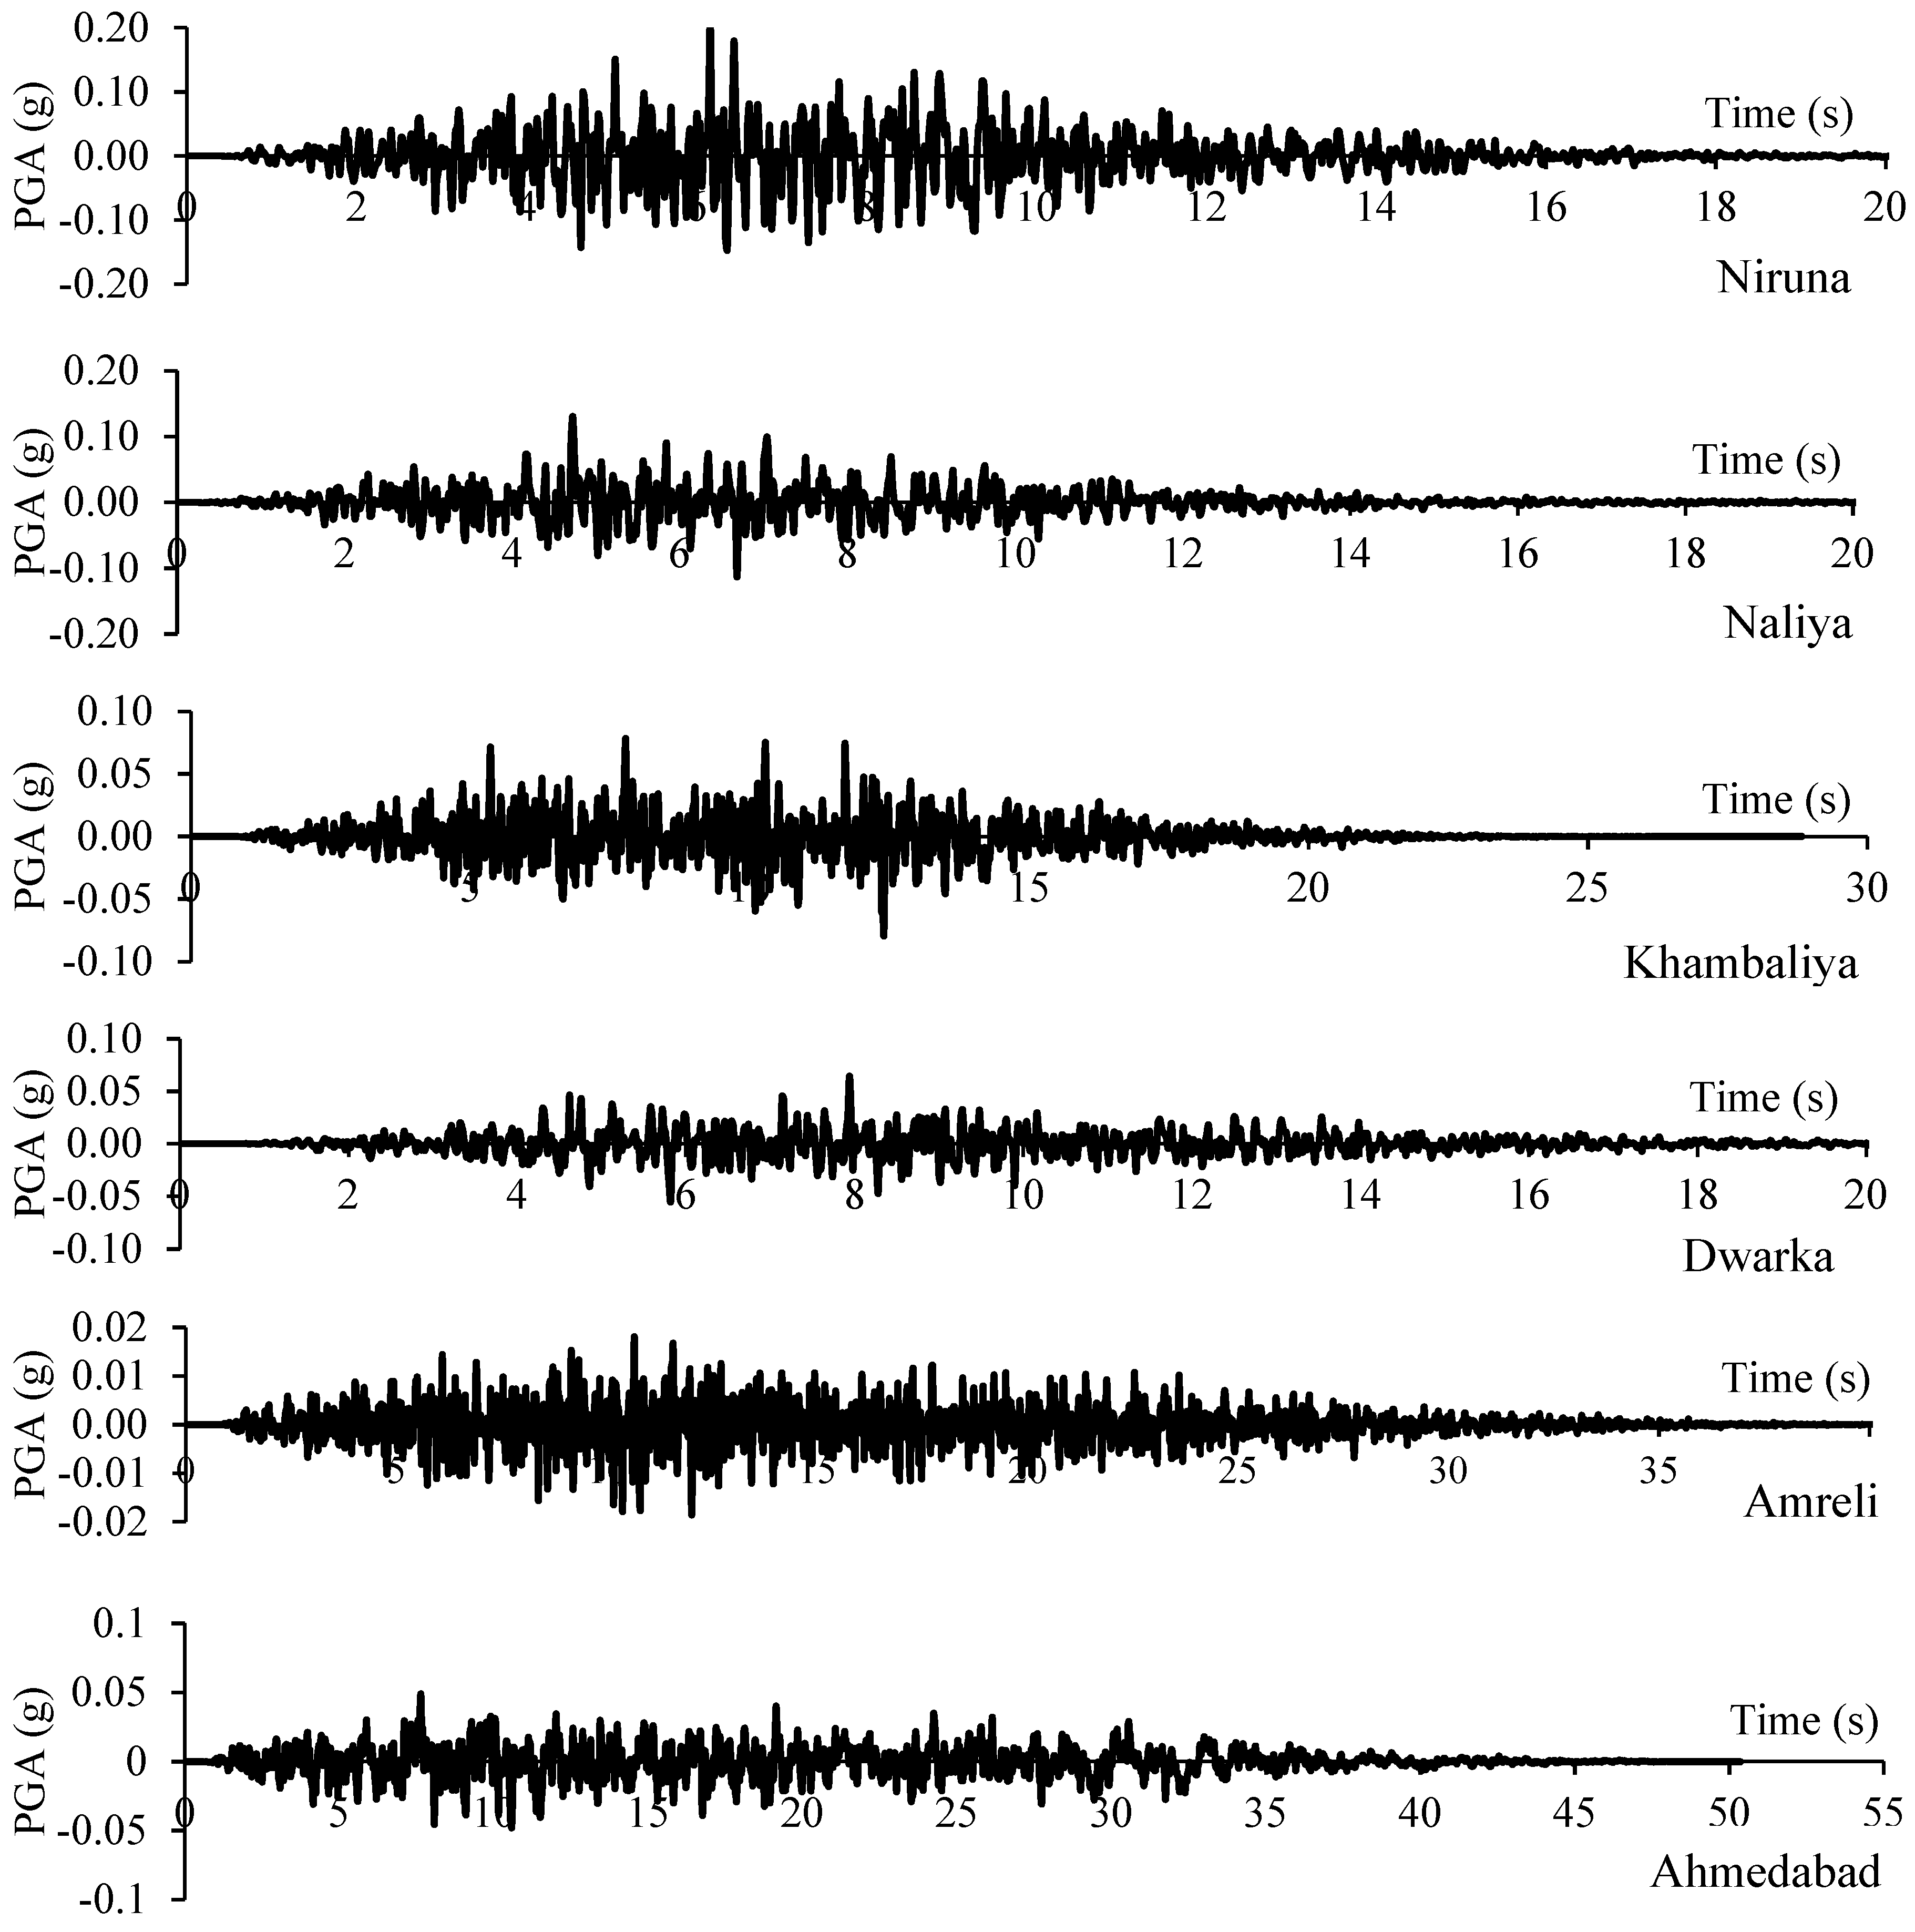
Table 2 shows the PGA values of the synthetic accelerograms and the corrected values [11] for B/C boundary condition. The simulations were conducted at hard rock sites with a shear wave velocity of 2900 m/s. The simulations were also carried out at generic rock using crustal amplification factors estimated for eastern North America [38] at the NEHRP B/C boundary ( = 760 m/s). The values at Anjar, Naliya, Junagarh, Ahmedabad, and Anand are comparable at the NEHRP B/C conditions ( = 760 m/s). The corresponding residuals at these sites are 0.016, 0.007, −0.009, 0 and −0.012, respectively. The values at Khambaliya, Jamjodhpur, and Amreli compare well with PGAs estimated at these sites for hard rock conditions. The corresponding residuals at these sites are −0.032, 0.015, and −0.006, respectively. These sites are hard rock sites situated on Deccan basalt. The values at Kandla, Niruna, Dwarka, Porbandar and Cambay are different than estimated from simulated ground motions, perhaps because correction factors [11] are not suited for quaternary sites in Gujarat. The corresponding residuals at these sites are −0.120, −0.119, −0.138, −0.89 and 0.081, respectively. Figure 4 shows the simulated ground motions at some sites at the bedrock level.
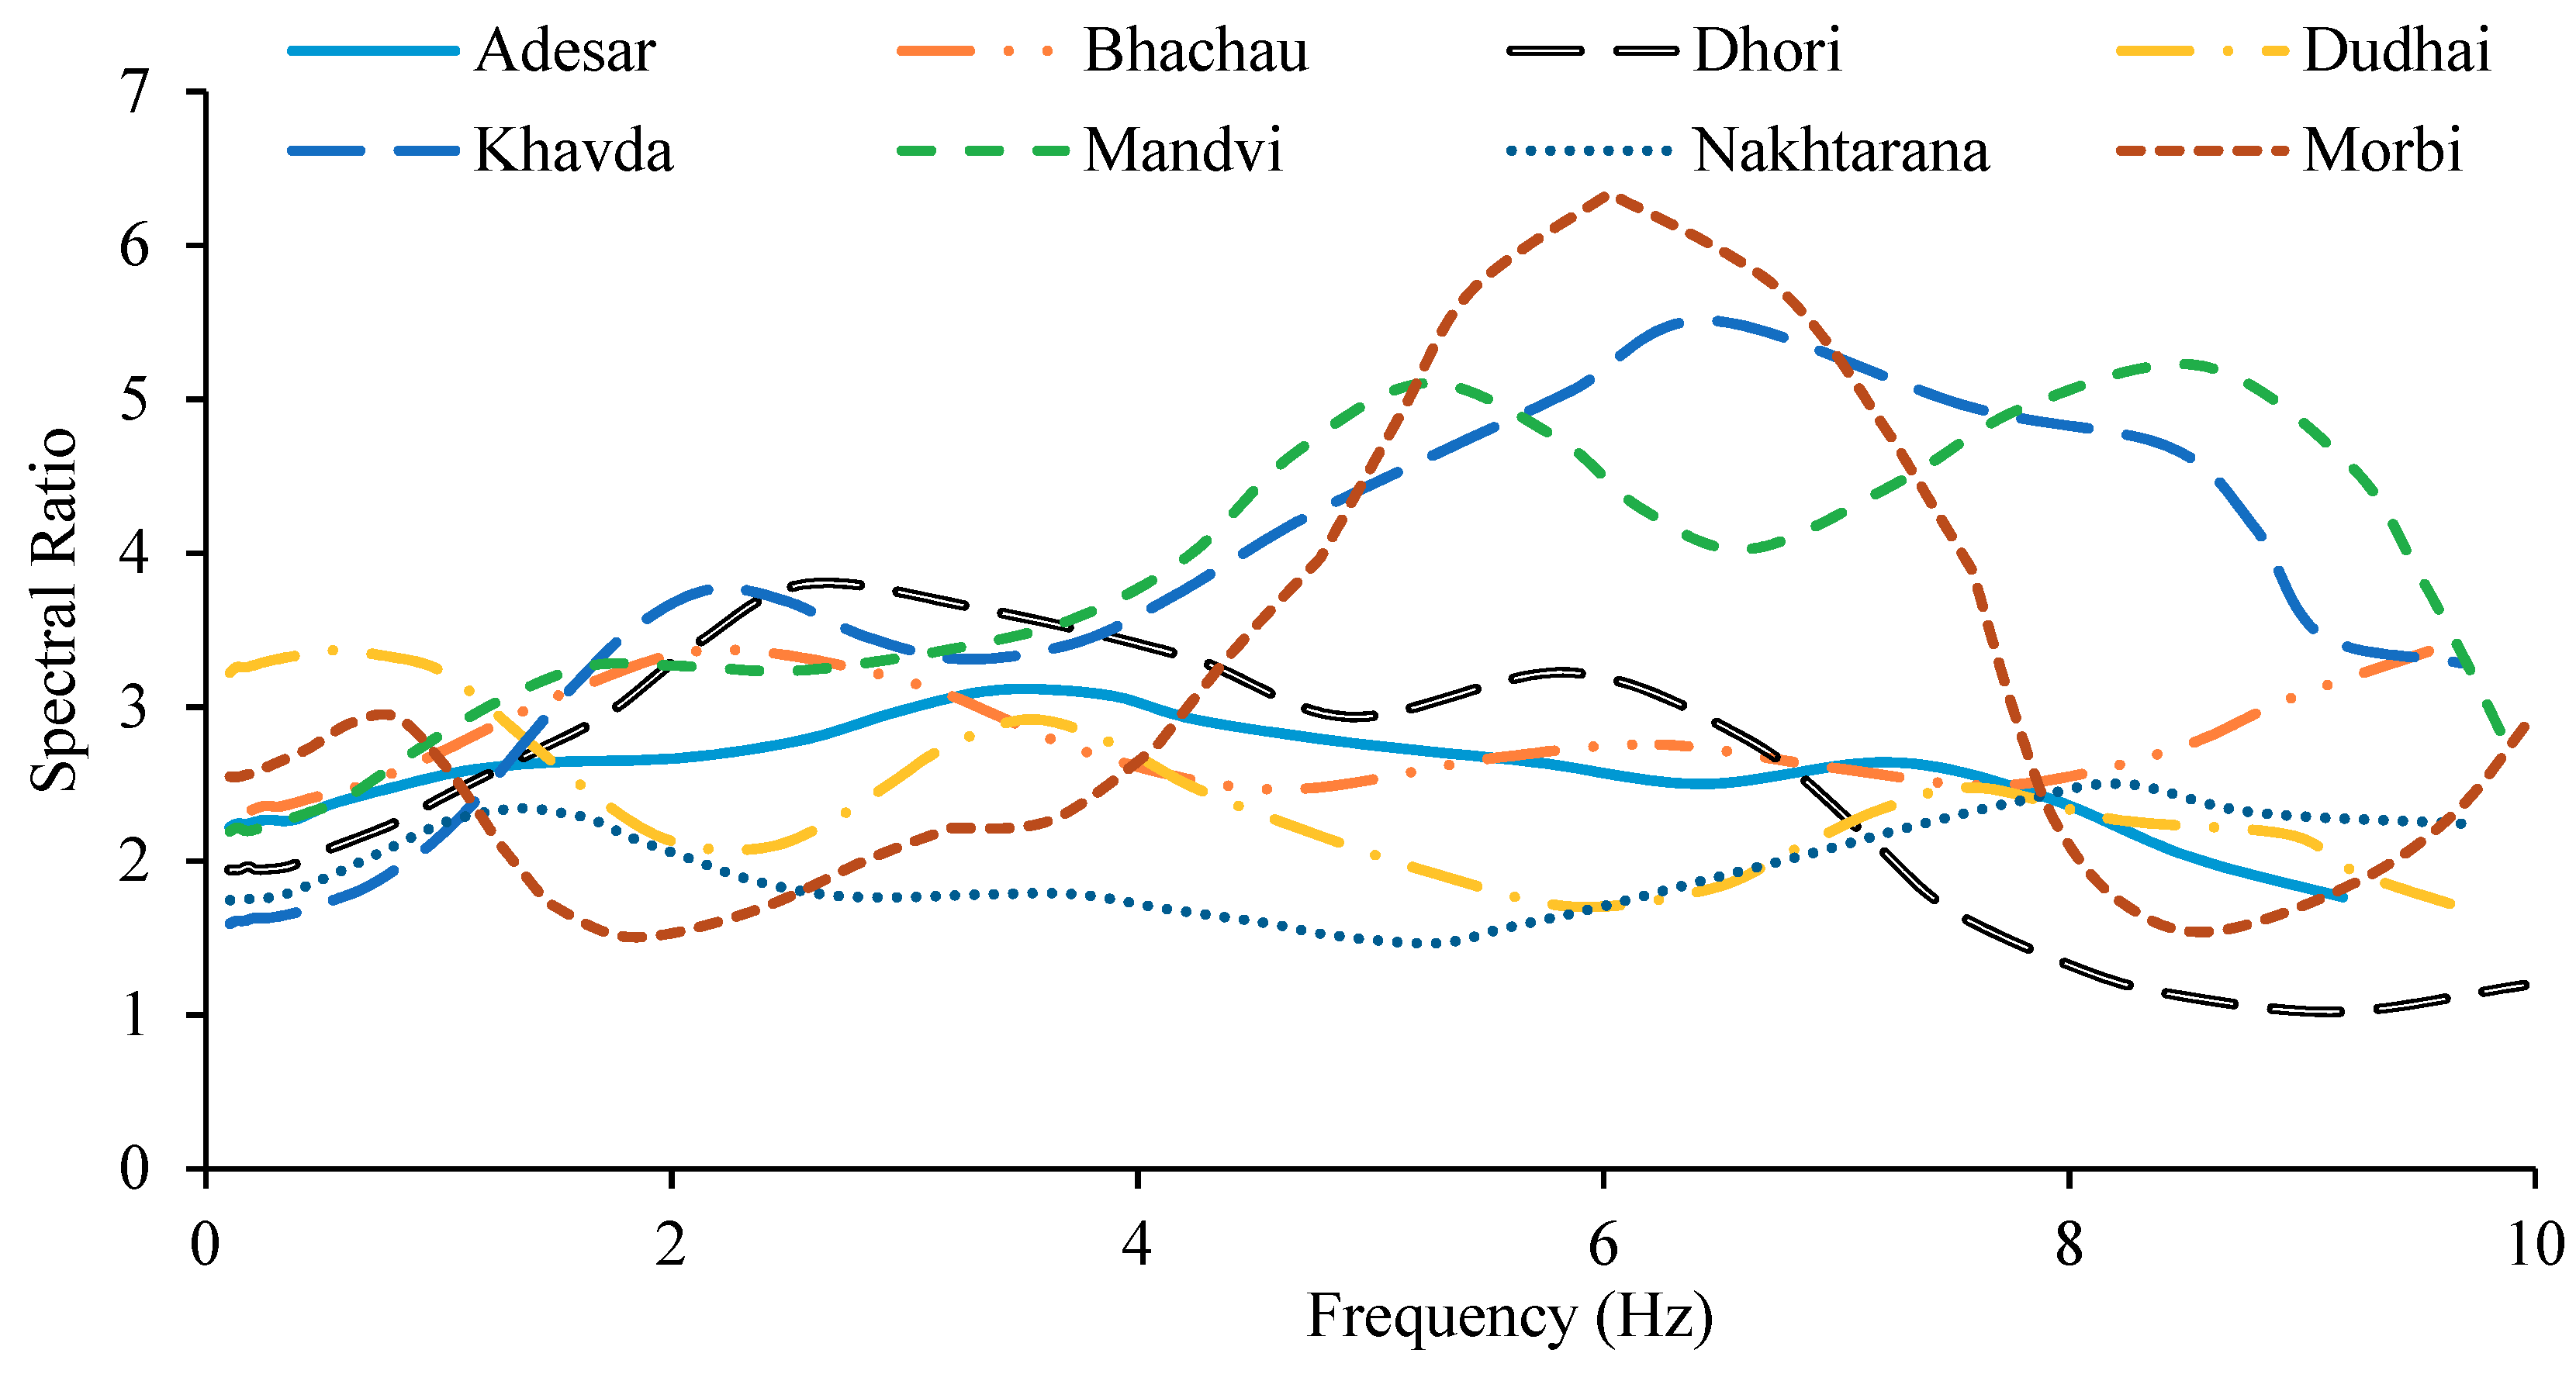
Results from Table 2 indicate a reasonable match between recorded PGAs and PGAs of synthetic ground motions. The validated methodology is extended to obtain synthetic ground motions at various sites across Gujarat. After validation of PGAs at rock level, surface level strong ground motions are obtained by incorporating local site effects in the EXSIM code. The site amplification functions have been estimated by reference [39] using the horizontal-to-vertical spectral ratio (HVSR) technique by observing local earthquake data. Figure 5 shows plots of soil amplification functions at some sites in Gujarat. Ground motions are amplified significantly at various frequency levels. Soil amplification functions corresponding to each particular site are used to generate ground motions using EXSIM at bedrock level and amplified to surface level.
2. Results: Surface Level Ground Motions and Response Spectra
The modified stochastic finite-fault method is used to derive synthetic ground motions at surface level for various towns (where site amplification functions were available) across various seismic zones V, IV and III [15]. Table 3 shows the list of towns and characteristics of the synthetic ground motions generated for these towns. Due to the variations of Gauss white noise (series of random pulses) used in the EXSIM method, the synthetic ground motion is different for each realization, and hence the presented results are the average of ten realizations. The varied local soil conditions are accounted using crustal and soil amplification factors. Parameters for the model were obtained in the previous section by validating PGA at 13 sites. From the synthetic accelergrams, ground motion characteristics such as, peak ground acceleration, predominant period, Fourier and response spectra are obtained.
Table 3 includes the name of the recording station, site classification and epicentral distance of the station. Site classification for strong motion stations in Gujarat has been performed [40] using the fundamental period from average horizontal-to-vertical response spectral ratios. Sites were classified into seven classes based on the fundamental period, as per the scheme proposed by [41]. Class I, II, III, and IV correspond to ground motions having fundamental periods in the range of 0–0.2 s, 0.2–0.4 s, 0.4–0.6 s and above 0.6 s, respectively. Class V, VI and VII correspond to sites with non-unique peaks in H/V. The peak ground acceleration (PGA), peak ground velocity (PGV), and the peak ground ratio for ground motions are also tabulated. The significant duration is the interval of time over which a proportion (percentage) of the total Arias Intensity is accumulated (default is the interval between the 5% and 95% thresholds). The frequency content in the ground motion is represented using single parameter estimates such as, predominant period, and mean period, . The predominant period is the period at which the maximum spectral acceleration occurs in an acceleration response spectrum calculated at 5% damping. The mean period, represents the average frequency content and is estimated by equation [6] where are the Fourier amplitudes, and represent the discrete Fourier transform frequencies between 0.25 and 20 Hz [42].
Overall, from Table 3, it is observed that PGA and PGV of generated earthquake ground motions decrease with increasing distance from the epicenter. There are some exceptions to this trend, due to directivity and liquefaction effects. The Dhori village, which is situated close to the western edge of the fault, experienced higher PGA (0.74 g) and PGV level (0.63 m/s) due to the effect of western directivity. Previous research [43] has also reported western directivity of the fault rupture and seismic energy propagation in the 2001 Gujarat earthquake. The significant duration of the seismic motion is only 6 s, and the Arias Intensity is very high (5.02 m/s). These observations indicate a high concentration of seismic energy. Further, from Table 3, we also observe that Mandvi, a coastal town situated at 111 km from the epicenter, experienced high PGA, possibly due to soil amplification. The port town of Kandla also observed higher damage due to liquefaction [9], as compared to other towns situated at similar distances. Another general observation from Table 3: the estimates of frequency content, such as predominant period, indicate that the frequency level of ground motions is close to fundamental frequency levels of low rise 1–2 story structures. The mean period estimates reveal that the average frequency content in ground motions are closer to fundamental frequency levels of 3–4 story structures.
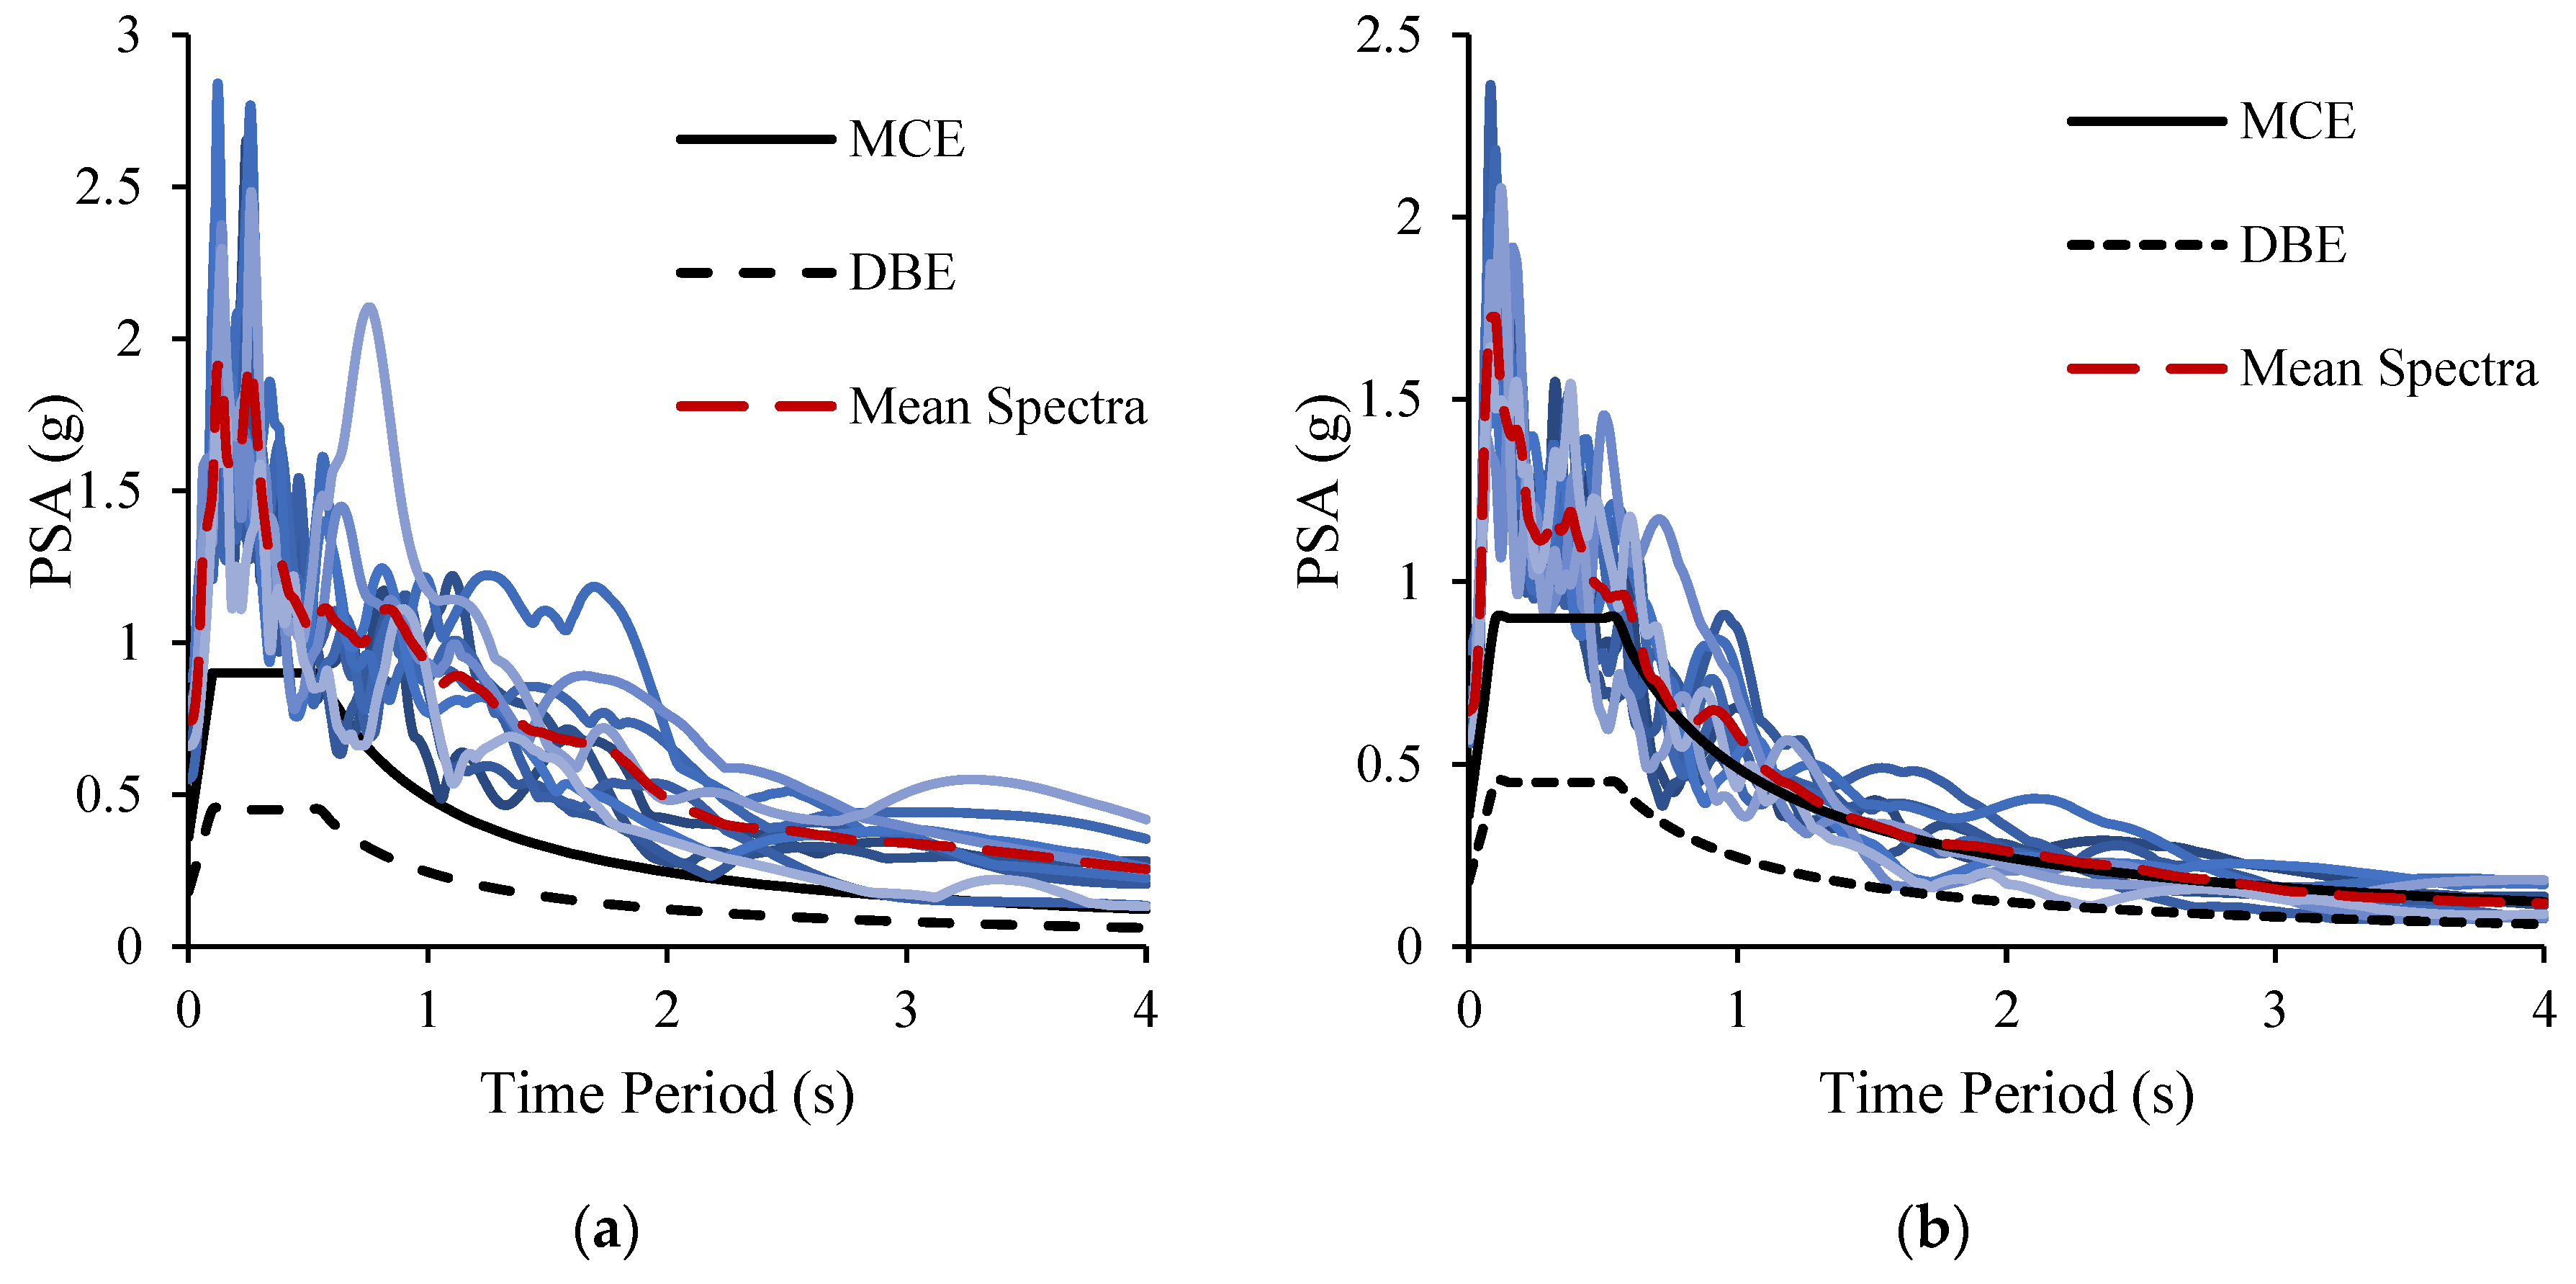
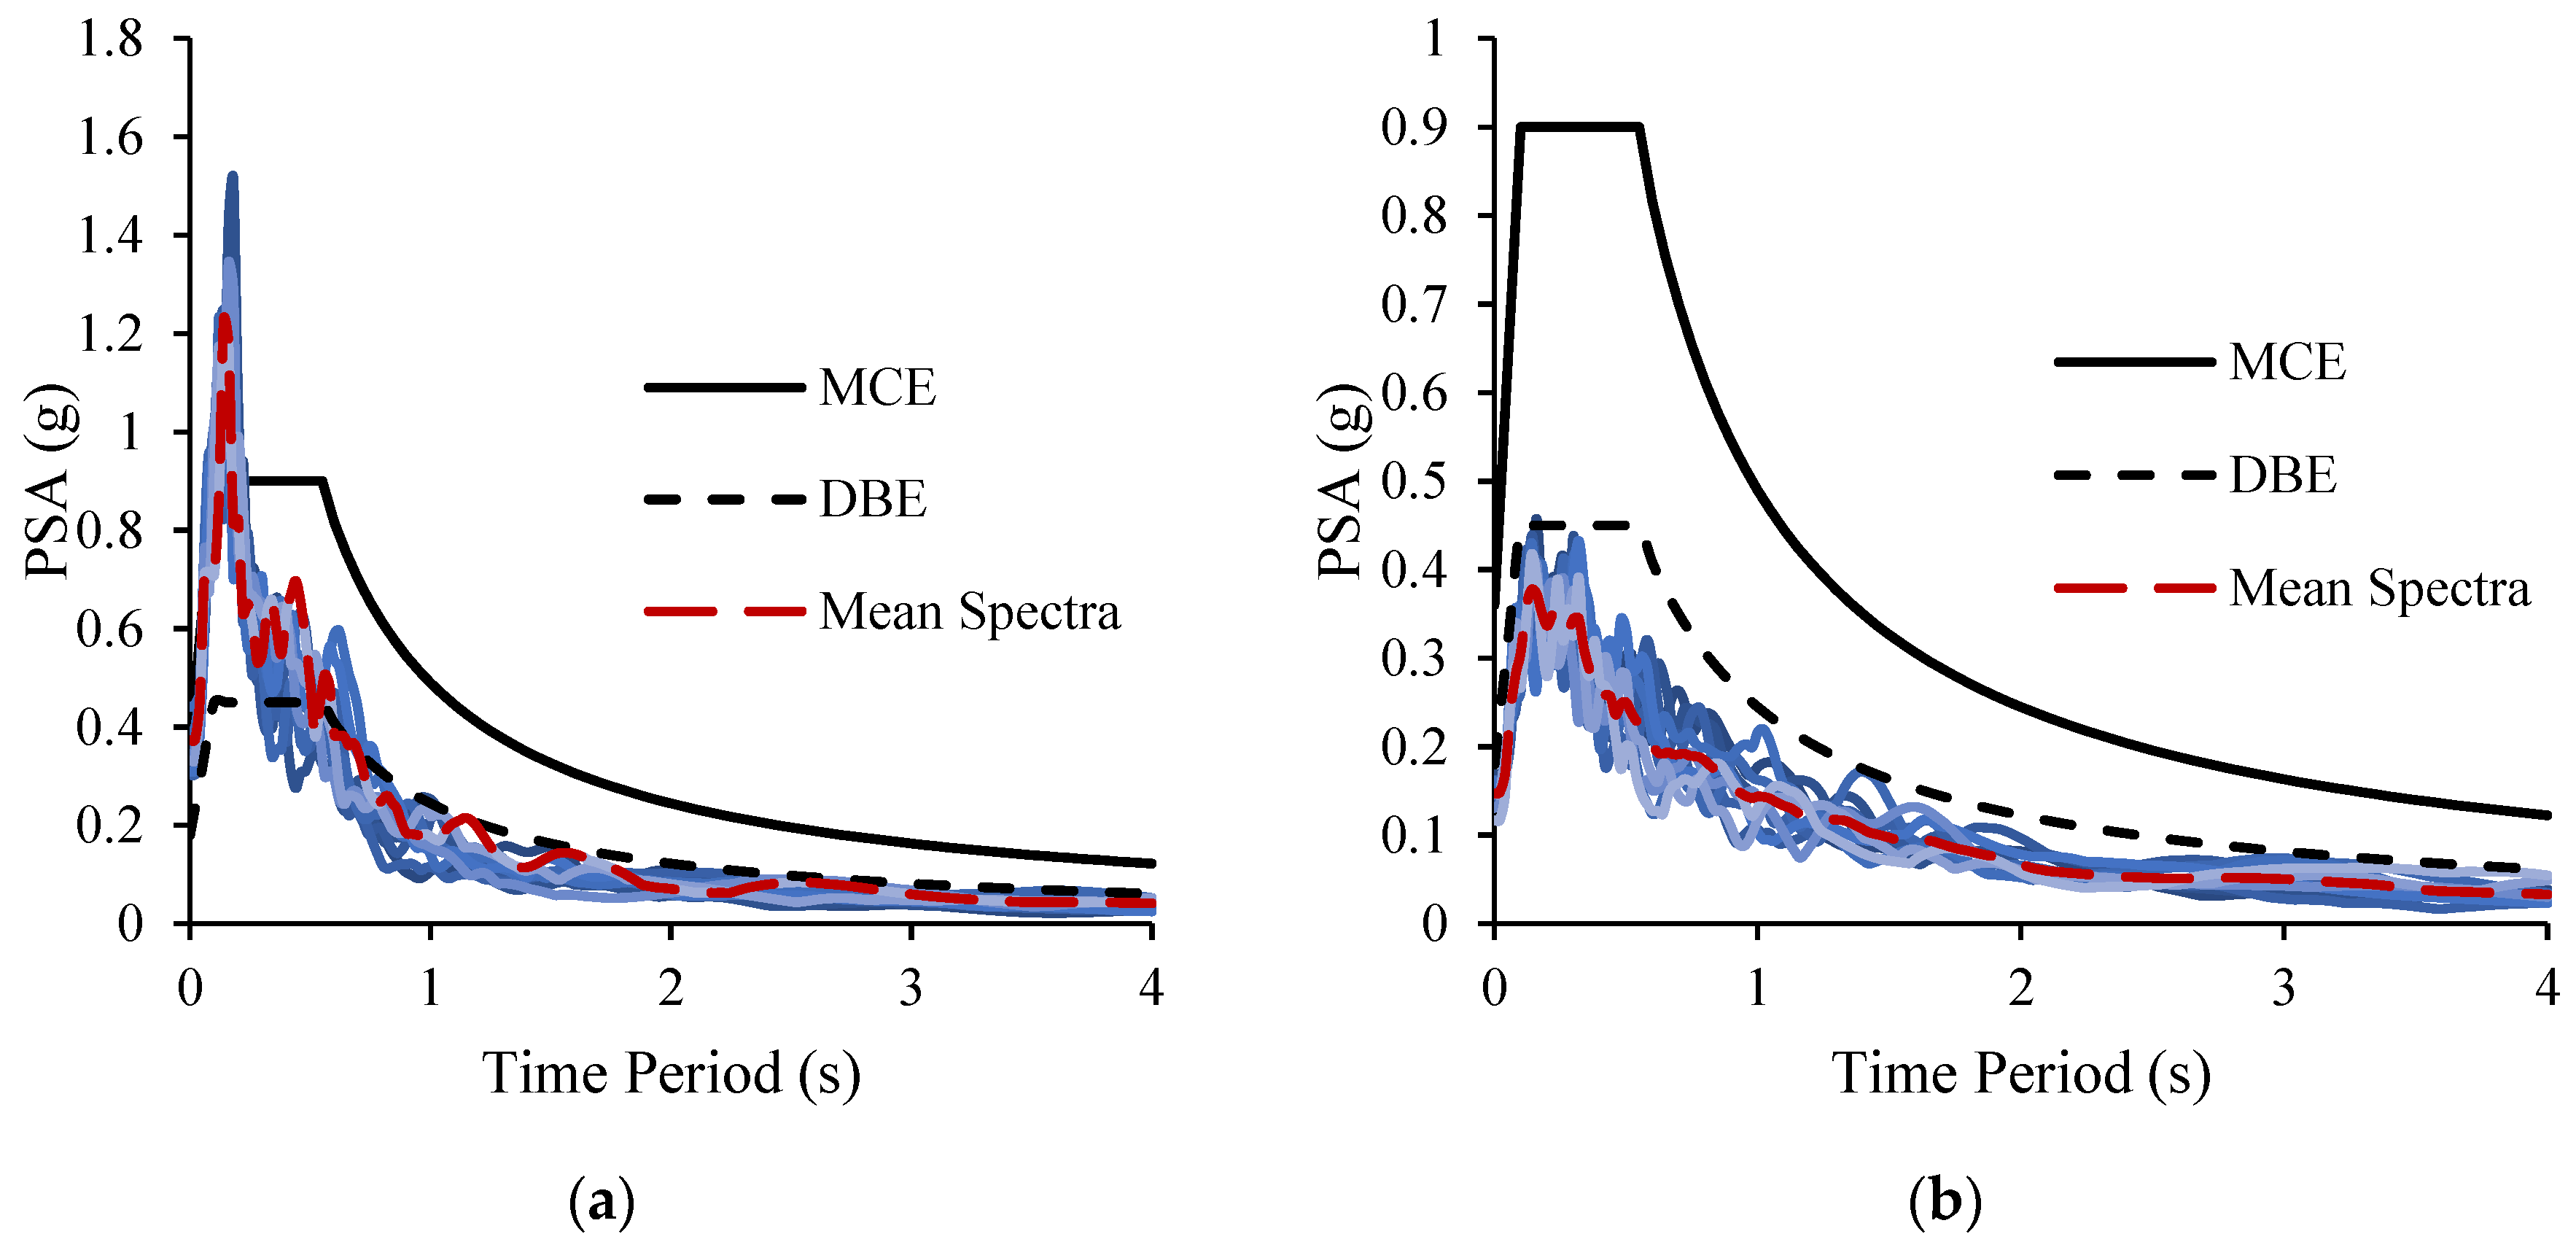
Figure 6, Figure 7, Figure 8 and Figure 9 show plots of the pseudo-spectral acceleration (PSA) at 5% damping for various sites situated in Zone 5. In these figures, the prescribed design response spectra for Zone 5, corresponding to the Maximum Considered Earthquake (MCE) and Design Basis Earthquake (DBE) from the Indian code of design practice [15], which forms the basis of seismic design of structures in India is also shown for comparison, in bold and dashed lines, respectively. The mean of the response spectra derived from ten synthetic ground motions is also shown. The MCE and DBE represent the 2% and the 10% probabilities, respectively of being exceeded in 50 years. Figure 6 shows response spectra for two towns, Dudhai and Bhachau located at epicentral distances of 15 km and 19 km, respectively. The two towns lie in Seismic Zone 5 of the Indian code where the code prescribes a maximum spectral acceleration of 0.9 g. At these small epicentral distances, the response spectra exceed both the MCE and DBE level response spectra. The mean response spectra for Dudhai (Figure 6a) exceeds the MCE level. The mean response spectra for Bhachau (Figure 6b) exceeds the MCE level till a period of 1 s and lie around the MCE level in the period range of 1–4 s. In both towns, even structures designed as per the seismic provisions of the code would not have survived the extreme level of seismic forces imposed on them. The response spectra also exhibit sharp peaks in the low period region indicating destruction of low rise structures. The predominant period for the synthetic ground motions at Dudhai and Bhachau is 0.21 s and 0.1 s, respectively, indicating the presence of high-frequency content, due to the 2001 Gujarat earthquake. For these two towns, the predominant frequencies were reported [39] as 10 Hz and 8.9 Hz, respectively. The predominant form of construction in these towns consisted of low rise unreinforced masonry and reinforced concrete structures, which are susceptible to high-frequency ground motions. In both towns, most (> 75%) buildings constructed with infield-stone, clay and unburnt-brick witnessed total damage [2]. In both towns, many (> 50%) ordinary brick structures, buildings of the large block and prefabricated type, half-timbered structures witnessed total damage. In both towns, many (> 50%) reinforced buildings and well-built wooden structures were destroyed [2]. In the town of Bhachau, even well-built reinforced concrete structures were totally devastated. The observations for both towns are consistent with the response spectra derived from synthetic ground motions. Both towns were assigned an MMI intensity level X [2].
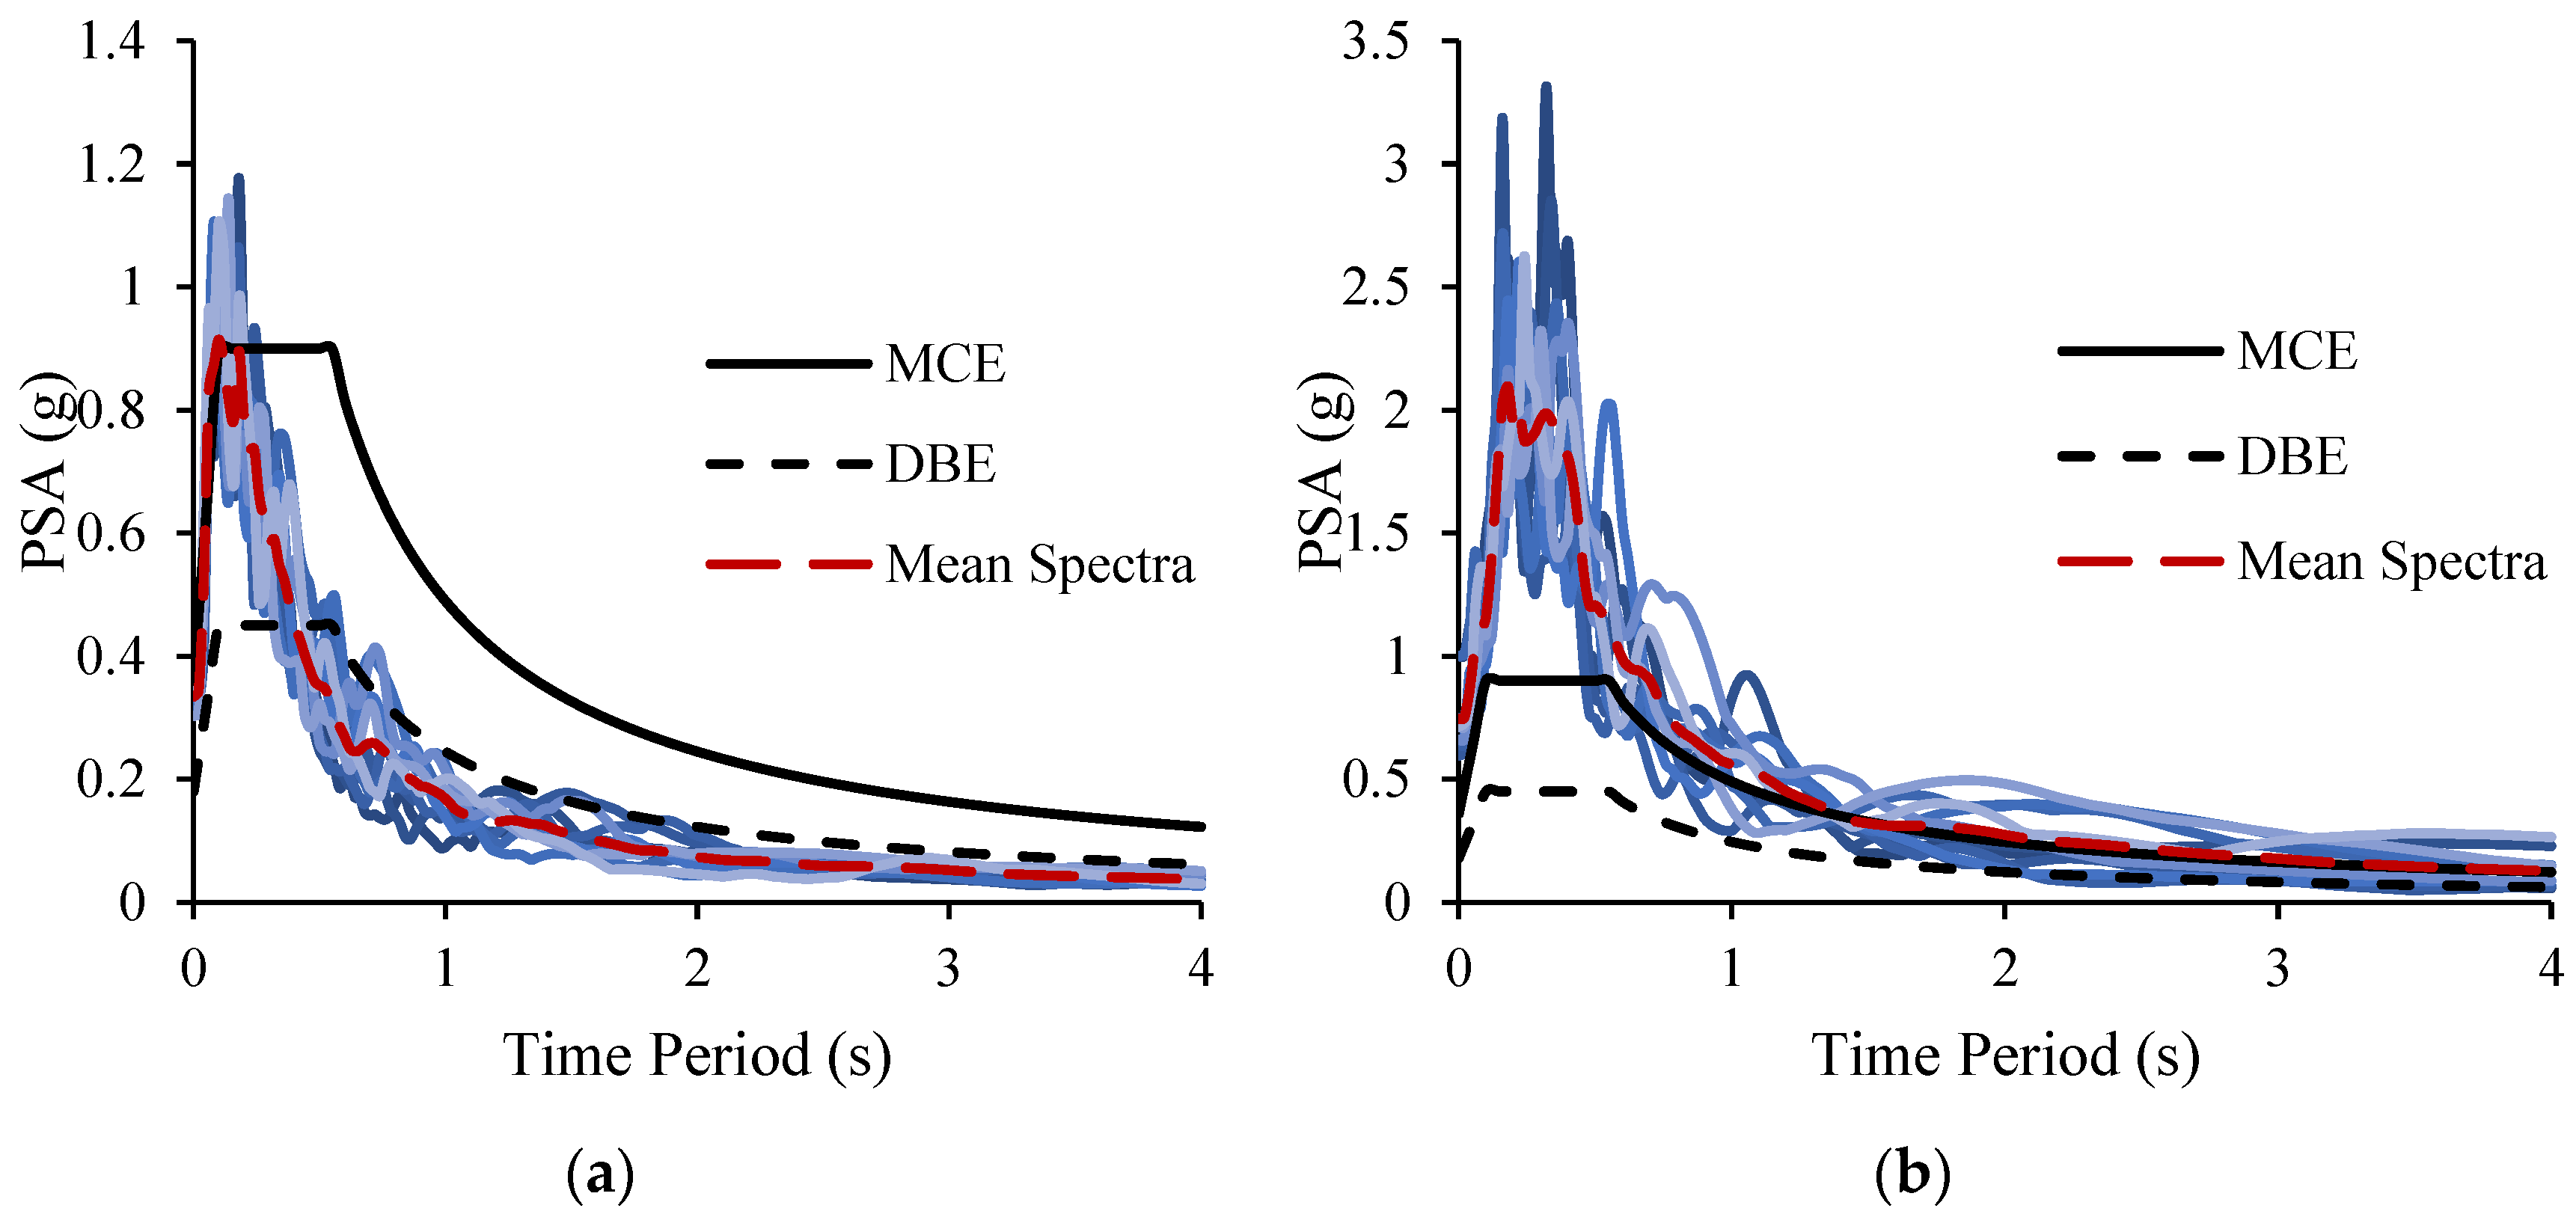
Next, ground motions at Rapar and Dhori, two towns located at epicentral distances of 46 km and 49 km are analyzed. The towns are located in Seismic Zone 5 of the Indian code with a maximum spectral acceleration equal to 0.9 g. Figure 7 shows response spectra at these two sites. The response spectra at Rapar (Figure 7a) exceeds the DBE level in the period range of 0–0.6 s and lie below the DBE level from 0.5–4 s. The predominant frequency of ground motions at Rapar is observed to be 0.11 s, respectively, thus indicating the presence of high-frequency content. The predominant frequency reported [39] for Rapar is 9.6 Hz. These observations indicate a hazard to low rise structures. While the epicentral distance of Dhori and Rapar is comparable, the response spectra at Dhori (Figure 7b) are observed to be much higher. It is clearly seen that the mean of the response spectra exceeds the DBE level across all time periods, indicating high hazard even to structures designed as per seismic code prescribed design procedures. Further, the response spectra exceed the MCE level till a period of 0.8 s and lie around the MCE level in the period range of 0.8–4 s. The primary reason for the high response spectra and high observed damage in Dhori is the westward directivity of seismic energy radiating from the ruptured fault. The predominant frequency for ground motions at Dhori is observed to be 0.26 s, and the significant duration is only 6 s, indicating a concentration of seismic energy. The response spectra exhibit sharp peaks at low time periods, which indicates that low rise structures would not survive. The predominant form of construction in these towns consisted of low rise unreinforced masonry and reinforced concrete structures, which are susceptible to high-frequency ground motions. In Rapar town, most (> 75%) buildings constructed with infield-stone, clay and unburnt-brick witnessed total damage, while many (> 50%) ordinary brick structures, buildings of the large block and prefabricated type, half-timbered structures witnessed total damage [2]. Also, many (> 50%) reinforced buildings and well-built wooden structures were destroyed. Damage surveys from Dhori town indicated that low rise structures were completely damaged. The observations are consistent with response spectra derived from synthetic ground motions. Overall, both towns were assigned MMI intensity level X [2].
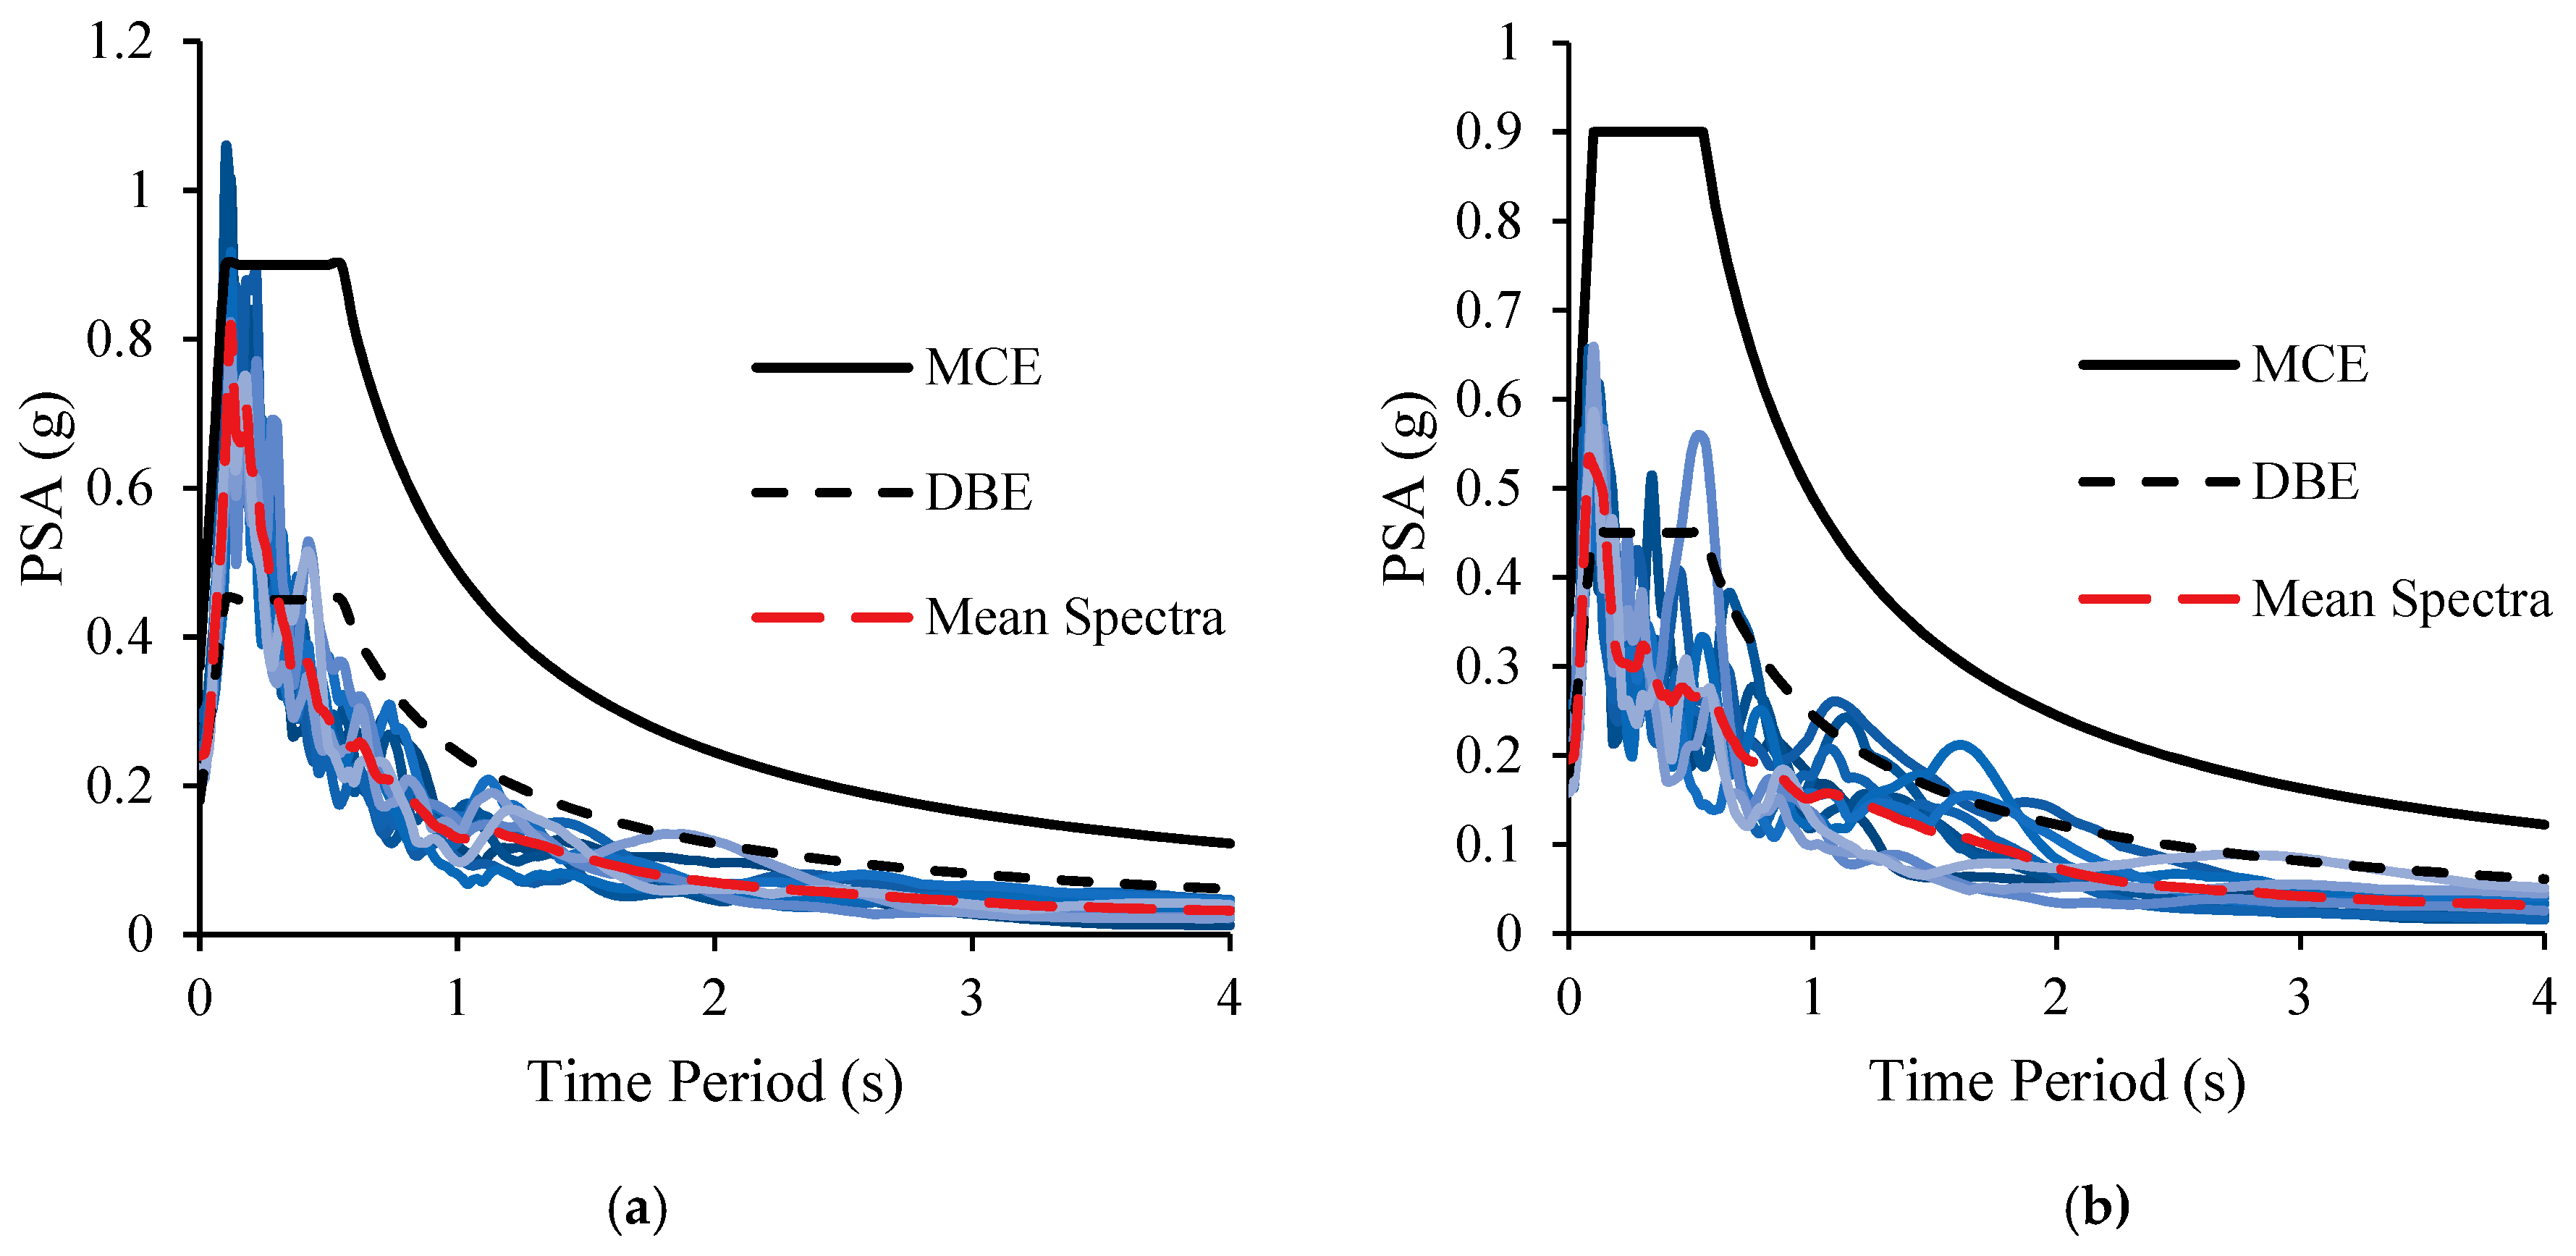
The two towns of Khavda and Adesar are located further away at epicentral distances equal to 73 km and 78 km. Figure 8 shows the response spectra for the two towns. The two towns are located in Seismic Zone 5 of the Indian code with a maximum spectral acceleration equal to 0.9 g. The predominant periods for ground motions at Khavda and Adesar is observed to be 0.15 s and 0.19 s, respectively. The predominant frequency reported for the towns of Khavda and Adesar is 6.5 Hz and 3.5 Hz, respectively [39]. The response spectra at Khavda (Figure 8a) exceeded even the MCE level till a time period of 0.2 s and lay below the MCE level from 0.2–4 s. The mean response spectra exceed the DBE level till a time period of 0.6 s and lie below the DBE level from 0.4–4 s. The town is situated towards “west” of the fault: the westward directivity of the fault rupture and propagation in seismic energy is believed to be the reason for high spectral acceleration and high observed damage. In Khavda town, many (> 50%) buildings constructed with infield-stone, clay and unburnt-brick witnessed heavy damage and a few (~5%) were completely destroyed [2]. They reported that many (> 50%) ordinary brick structures, buildings of the large block and prefabricated type, half-timbered structures witnessed moderate damage. Also, many (> 50%) reinforced buildings and well-built wooden structures witnessed slight damage. These observations are consistent with the response spectra derived for the town of Khavda. Damage corresponding to intensity level VIII was assigned to this town [2]. For the Adesar town, although the derived response spectra (Figure 8b) lie below the DBE level, the town was assigned a high MMI intensity level of X [2] on the basis of observed damage to prevalent structures. In Adesar town, most (> 75%) buildings constructed with infield-stone, clay and unburnt-brick witnessed total damage, while many (> 50%) ordinary brick structures, buildings of the large block and prefabricated type, half-timbered structures witnessed total damage [2]. Also, many (> 50%) reinforced buildings and well-built wooden structures were destroyed.
The towns of Mandvi and Nakhatrana towns are at more considerable epicentral distances of 111 km and 155 km, respectively. The two towns are in Seismic Zone 5 of the Indian code with a maximum spectral acceleration equal to 0.9 g. Although Mandvi is at a considerable distance from the epicenter, the observed response spectra are high and exhibit “peaky” behavior (Figure 9a). The response spectra exceed the DBE level until a time period of 0.4 s, indicating a hazard to low rise structures. The predominant period for ground motions at Mandvi is observed to be 0.14 s indicating the presence of high-frequency content which mainly affects low rise structures, such as unreinforced masonry structures. The predominant frequency is 5.3 Hz [39]. The significant duration is only 9 s, indicating a high concentration of seismic energy. Further, as the spectra exceed the DBE level in the range of 0 s to 0.4 s, it implies that well-designed low-rise masonry and reinforced concrete structures would have experienced immense damage. The coastal town experienced soil amplification as well, and experienced damage corresponding to intensity (MMI) level VII [2]. Figure 9b shows that the mean response spectra at Nakhatrana exceeds the DBE level in the low period range of 0–0.2 s and lies below the DBE level at all other periods. The predominant period of ground motions at Nakhatrana is observed to be 0.13 s, indicating the presence of high-frequency waves. Nakhtarana town experienced damage corresponding to intensity (MMI) level VII [2]. Reconnaissance surveys [2] show that in both Mandvi and Nakhtarana towns, many (> 50%) buildings constructed with infield-stone, clay and unburnt-brick witnessed heavy damage and a few (~5%) were completely destroyed. They reported that many (> 50%) ordinary brick structures, buildings of the large block and prefabricated type, half-timbered structures witnessed moderate damage. Also, many (> 50%) reinforced buildings and well-built wooden structures witnessed slight damage.
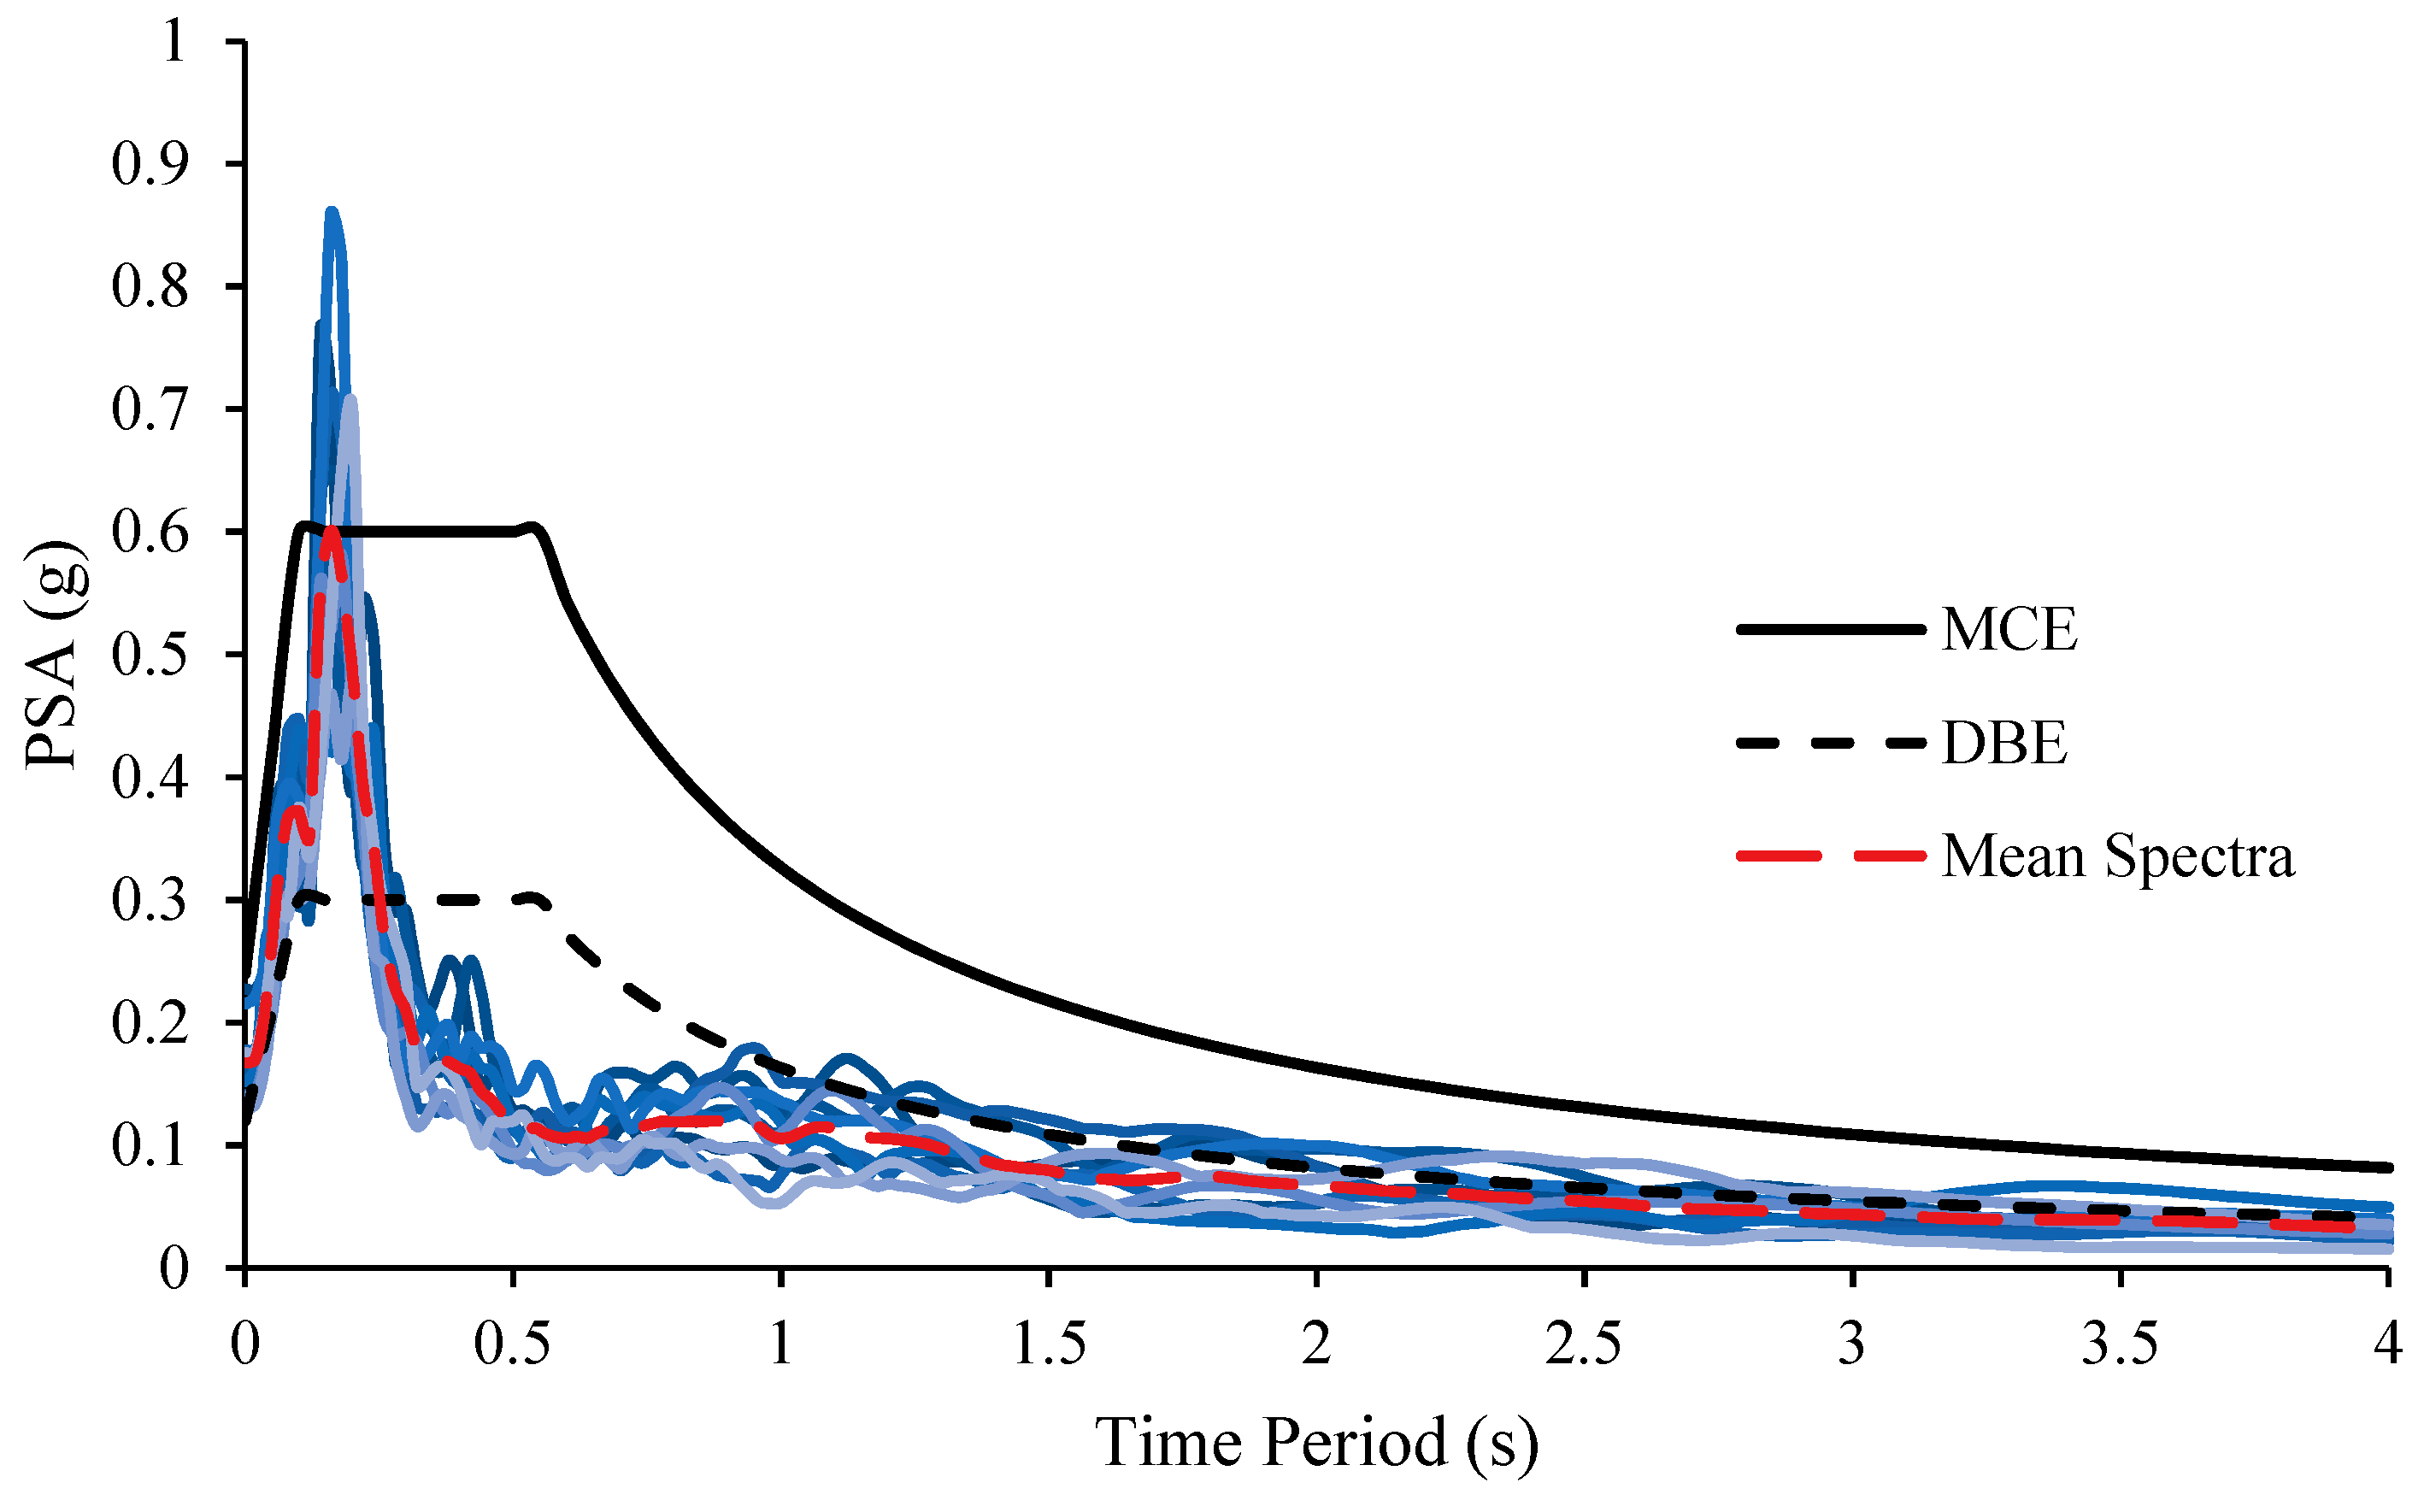
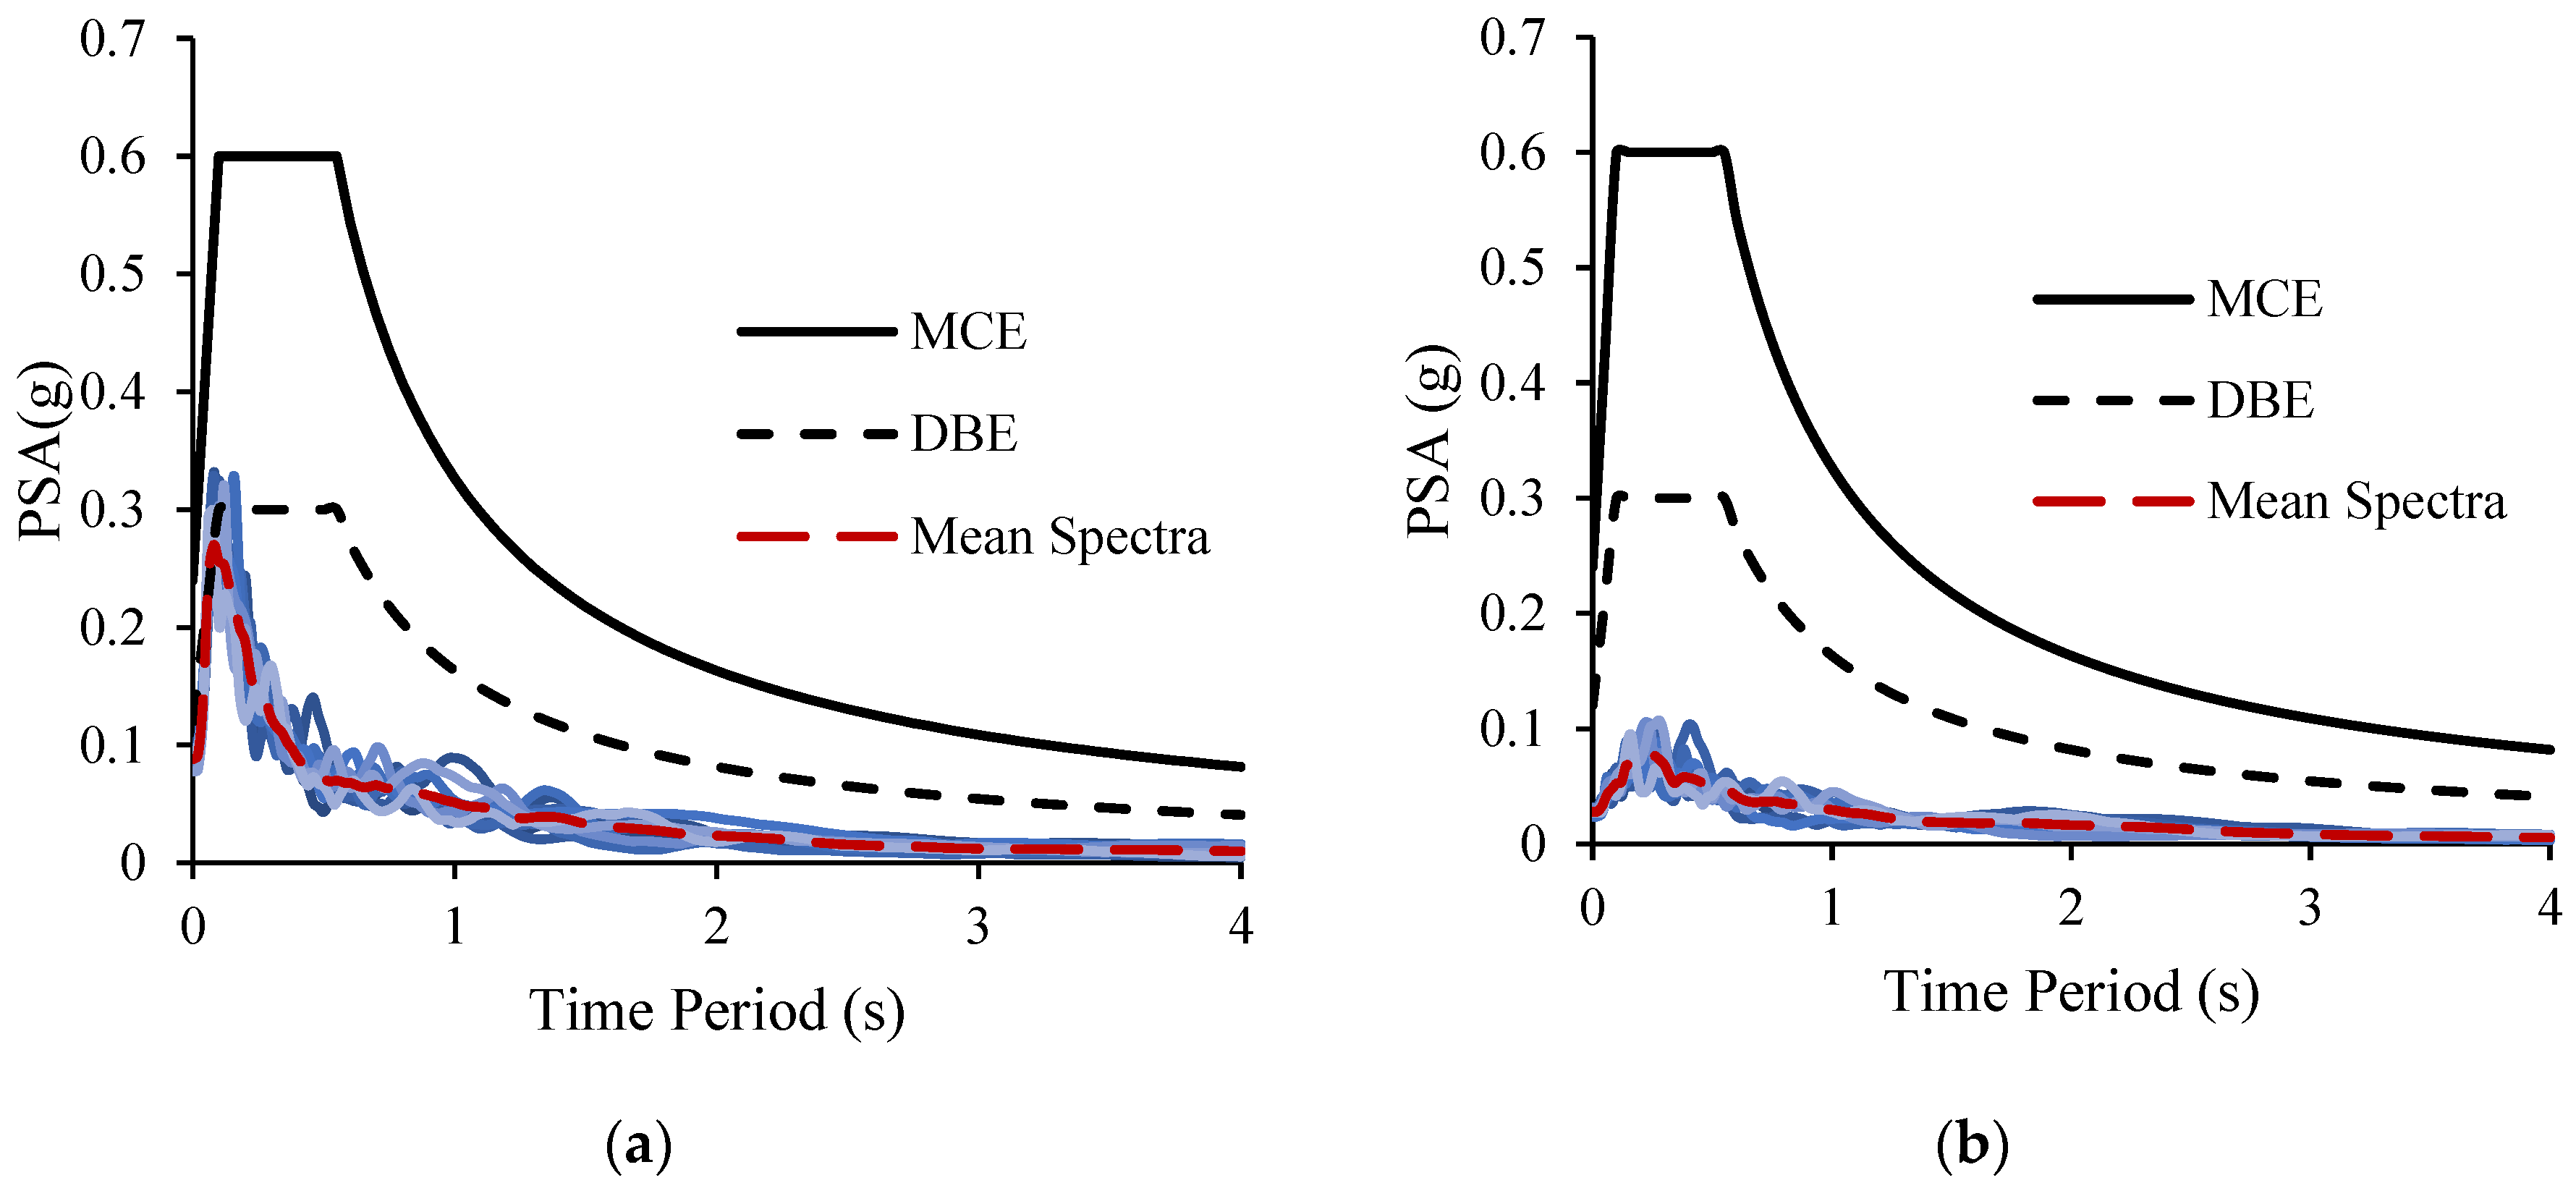
Figure 10 shows the response spectra for ground motions generated for Morbi town situated in seismic zone 4 [15] with a maximum spectral acceleration equal to 0.6 g. The response spectra exhibit very peaky behavior at short periods, followed by a sharp drop. The mean response spectra exceed the DBE level in the period range of 0.3 s, indicating the hazard to low rise structures, particularly, 1–3 story structures. The town experienced damage corresponding to intensity (MMI) level VII [2]. The Morbi town has unconsolidated soil cover [9] which caused amplification of ground motions. Several three story structures collapsed in Morbi town. In Morbi, many (> 50%) buildings constructed with infield-stone, clay and unburnt-brick witnessed heavy damage and a few (~5%) were completely destroyed [2]. Many (> 50%) ordinary brick structures, buildings of the large block and prefabricated type, half-timbered structures witnessed moderate damage. Also, many (> 50%) reinforced buildings and well-built wooden structures witnessed slight damage. These observations are consistent with the derived response spectra for Morbi town. Figure 11 shows the pseudo-spectral acceleration (PSA) at 5% damping for Lalpur and Dwarka, two towns located in Seismic Zone 4 [15] with a maximum spectral acceleration equal to 0.6 g. The mean response spectra at Lalpur and Dwarka does not cross the DBE and MCE levels. However, damage surveys indicate damage in Dwarka port area due to amplification of ground motion, surface wave generation and their trapping by the weathered surficial layer of the island [9]. The response spectra for ground motions generated for other towns in Zone 4 lie below the code prescribed levels and hence are not discussed in detail.
The response spectra for towns in Zone 3 having MCE level of 0.45 g [15] were typically much lower than the DBE levels. These towns were assigned low-intensity(MMI) levels of IV. However, the damage to multistory structures in cities situated far away from the epicenter, e.g., Ahmedabad and Surat, could be attributed to deficient structural designs or poor construction practices. Indeed, the damage surveys [2] report the failure of columns at the ground-story level of these buildings. There were no walls at the ground story level which was intended for parking. As the stiffness of the ground story was much less as compared to the upper stories, the buildings collapsed due to the soft story effect. The damage to buildings in these cities was also partly influenced by the presence of alluvium soil at some locations. In areas having thick layers of alluvium soil, more damage was observed to multistory buildings as compared to similar structures in areas having hard rock [2,9]. The predominant frequency for Ahmedabad was reported as 2 Hz [39] which corresponds to structures with 4–5 stories. Ahmedabad was assigned a damage intensity (MMI) of VII and VI while Surat was assigned a damage intensity (MMI) level of VI.
Despite the response spectra being much lower than the code prescribed spectra, other towns in Zone 3 such as Rajkot, Gandhinagar, Surendranagar, Viramgam experienced structural damage corresponding to intensity (MMI) level of VI indicating deficiencies in design and construction practices.
3. Discussion
The response spectra of ground motions for towns situated at small epicentral regions, such as Dudhai and Bhachau, exceed both the MCE and DBE levels, and exhibit sharp peaks in the low frequency region. These observations conform with damage surveys which indicate that in such towns, most low rise structures witnessed total devastation and many reinforced concrete buildings were damaged. The effect of western directivity of the fault rupture is observed in some towns which experienced high PGAs. In towns situated at more considerable epicentral distances, such as Mandvi and Nakhtarana, the response spectra of ground motions exceeded the DBE level mostly in the short period ranges, causing damage to many low rise structures made of infield-stone, clay, brick and reinforced concrete. In Mandvi, the effect of soil amplification caused higher structural damage. Response spectra for towns situated very far away from the epicenter were much lower than the DBE levels: Observed damage in these towns is attributed to poor quality of construction and deficiency in the seismic design of structures. In these towns, several reinforced concrete structures were damaged due to the soft story effect.
4. Conclusions
The 2001 Gujarat earthquake was one of the most destructive intraplate earthquakes ever recorded. The maximum felt intensity was X on the Modified Mercalli Intensity (MMI) scale, and a large percentage of buildings in the Kutch region were damaged. However, no strong ground motion records are available for this earthquake. Only PGA values are available from structural response recorders at thirteen sites. In this paper, synthetic ground motions for the 2001 Gujarat scenario earthquake were generated, using the modified stochastic finite-fault method. Available recorded data are used to validate PGA values of the synthetic ground motions. Upon validation, ground motions at other locations were also generated and analyzed. The characteristics of the ground motions such as peak ground acceleration (PGA), peak ground velocity (PGV), frequency content, significant duration, and energy content were also analyzed. Ground motions have low values of , i.e., they contain high frequency content. Such waves could be particularly damaging to low rise structures.
Response spectra of ground motions for towns situated in Seismic Zone 5 exceeded even the code prescribed “maximum considered earthquake” spectra levels. The code spectra for Zone 5 thus seem un-conservative. The same was observed [44] while studying the effect of geological settings on response spectra. Their study shows that the acceleration response spectrum in the current Indian code for Gujarat region underestimates the seismic forces at short periods. Further, the response spectra show peaks in low period ranges. Consequently, low rise structures in the Kutch region, designed as per existing seismic codes of India, are highly vulnerable to damage under such scenario earthquakes. Response spectra for towns situated in seismic zone 3 did not exceed the code prescribed levels. Structural damage observed in such towns in seismic zone 3, far away from the epicenter, may not be attributed to the observed low seismic intensity (MMI) levels but rather to poor construction practices and non-adherence of structural designs to seismic code standards.
Author Contributions
Conceptualization, J.V. and K.S.; methodology, J.V, K.S. and S.C.; validation, J.V, K.S. and S.C.; formal analysis, J.V.; investigation, J.V.; resources, K.S.; writing—original draft preparation, J.V.; writing—review and editing, K.S. and S.C.; supervision, K.S.;
Funding
This research received no external funding.
Conflicts of Interest
The authors declare no conflict of interest.
References
- Nagamani, D.; Mandal, P. Estimation of earthquake source parameters in the Kachchh seismic zone, Gujarat, India, using three component S-wave spectra. J. Earth Syst. Sci. 2017, 126, 74. [Google Scholar] [CrossRef]
- Sinvhal, A.; Bose, P.R.; Prakash, V.; Bose, A.; Saraf, A.K.; Sinvhal, H. Isoseismals for the Kutch earthquake of 26th January 2001. J. Earth Syst. Sci. 2003, 112, 375–383. [Google Scholar] [CrossRef]
- Chopra, S.; Kumar, D.; Rastogi, B.K. Estimation of strong ground motions for 2001 Bhuj (Mw 7.6), India Earthquake. Pure Appl. Geophys. 2010, 167, 1317–1330. [Google Scholar] [CrossRef]
- Gupta, H.K.; Harinarayana, T.; Kousalya, M.; Mishra, D.C.; Mohan, I.; Purnachandra Rao, N.; Raju, P.S.; Rastogi, B.K.; Reddy, P.R.; Sarkar, D. Bhuj earthquake of 26 January 2001. J. Geol. Soc. India 2001, 72, 245–252. [Google Scholar]
- Gupta, H.K.; Purnachandra Rao, N.; Rastogi, B.K.; Sarkar, D. The deadliest intraplate earthquake: Perspectives. Science 2001, 291, 2101–2102. [Google Scholar] [CrossRef] [PubMed]
- Rastogi, B.K.; Gupta, H.K.; Mandal, P.; Satyanarayana, H.V.S.; Kousalya, M.; Raghavan, R.; Jain, R.; Sarma, A.N.S.; Kumar, N.; Satyamurty, C. The deadliest stable continental region earthquake occurred near Bhuj on 26 January 2001. J. Seismol. 2001, 5, 609–615. [Google Scholar] [CrossRef]
- Rajendran, K.; Rajendran, C.P.; Thakkar, M.; Tuttle, M.P. The 2001 Kutch (Bhuj) earthquake: Coseismic surface features and their significance. Curr. Sci. 2001, 80, 1397–1405. [Google Scholar]
- Michetti, A.M.; Esposito, E.; Guerrieri, L.; Porfido, S.; Serva, L.; Tatevossian, R.; Vittori, E.; Audemard, F.; Azuma, T.; Clague, J.; Comerci, V. Environmental seismic intensity scale-ESI 2007. Mem. Descr. Della Carta Geol. d’Italia 2007, 74, 41. [Google Scholar]
- Narayan, J.P.; Sharma, M.L. Effect of Local Geology on Damage Severity during Bhuj, India earthquake. In Proceedings of the Thirteenth World Conference on Earthquake Engineering, Vancouver, BC, Canada, 1–4 August 2004. Paper No.2042. [Google Scholar]
- Chatelain, J.L.; Guillier, B.; Parvez, I.A. False Site Effects: The Anjar Case, following the 2001 Bhuj (India) Earthquake. Seismol. Res. Lett. 2008, 79, 816–819. [Google Scholar] [CrossRef]
- Cramer, C.H.; Kumar, A. 2001 Bhuj, India, earthquake engineering seismoscope recordings and Eastern North America ground-motion attenuation relations. Bull. Seismol. Soc. Am. 2003, 93, 1390–1394. [Google Scholar] [CrossRef]
- Biswas, S.K. Regional tectonic framework, structure and evolution of the western marginal basins of India. Tectonophysics 1987, 135, 307–327. [Google Scholar] [CrossRef]
- Biswas, S.K. A review of structure and tectonics of Kutch basin, western India, with special reference to earthquakes. Curr. Sci. 2005, 88, 1592–1600. [Google Scholar]
- Talwani, P.; Gangopadhyay, A. Tectonic Framework of the Kutch Earthquake of 26 January 2001. Seismol. Res. Lett. 2001, 72, 336–345. [Google Scholar] [CrossRef]
- Bureau of Indian Standards. IS 1893 Indian Standard Criteria for Earthquake Resistant Design of Structures: Part 1– General Provisions and Buildings; BIS: New Delhi, India, 2002.
- Yadav, R.B.S.; Tripathi, J.N.; Rastogi, B.K.; Chopra, S. Probabilistic assessment of earthquake hazard in Gujarat and adjoining region of India. Pure and Appl. Geophy. 2008, 165, 1813–1833. [Google Scholar] [CrossRef]
- Quittmeyer, R.C.; Jacob, K.H. Historical and modern seismicity of Pakistan, Afghanistan, northwestern India, and southeastern Iran. Bull. Seismol. Soc. Am. 1979, 69, 773–823. [Google Scholar]
- Bendick, R.; Bilham, R.; Fielding, E.; Gaur, V.K.; Hough, S.E.; Kier, G.; Kulkarni, M.N.; Martin, S.; Mukul, M. The 26 January 2001 ‘‘Republic Day’’ Earthquake, India. Seismol. Res. Lett. 2001, 72, 328–335. [Google Scholar] [CrossRef]
- Motazedian, D.; Atkinson, G.M. Stochastic finite-fault modeling based on dynamic corner frequency. Bull. Seismol. Soc. Am. 2005, 95, 995–1010. [Google Scholar] [CrossRef]
- Boore, D. Stochastic simulation of high-frequency ground motions based on seismological models of the radiated spectra. Bull. Seismol. Soc. Am. 1983, 73, 1865–1894. [Google Scholar]
- Anderson, J.; Hough, S. A model for the shape of the Fourier amplitude spectrum of acceleration at high frequencies. Bull. Seismol. Soc. Am. 1984, 74, 1969–1993. [Google Scholar]
- Beresnev, I.A.; Atkinson, G.M. Modeling finite fault radiation from the ωn spectrum. Bull. Seismol. Soc. Am. 1997, 87, 67–84. [Google Scholar]
- Negishi, H.; Mori, J.; Sato, T.; Singh, R.; Kumar, S.; Hirata, N. Size and orientation of the fault plane for the 2001 Gujarat, India earthquake (Mw 7.7) from aftershock observations: A high stress drop event. Geophy. Res. Lett. 2002, 29, 1949. [Google Scholar] [CrossRef]
- Schweig, E.; Gomberg, J.; Petersen, M.; Ellis, M.; Bodin, P.; Mayrose, L.; Rastogi, B.K. The Mw 7.7 Bhuj Earthquake: Global lessons for earthquake hazard in intra-plate regions. J. Geol. Soc. India 2003, 61, 277–282. [Google Scholar]
- Singh, S.K.; Bansal, B.K.; Bhattacharya, S.N.; Pacheco, J.F.; Dattarayam, R.S.; Ordaz, M.; Suresh, G.; Kamal; Hough, S.E. Estimation of Ground Motion for Bhuj (26 January 2001; Mw 7.6) and for future Earthquakes in India. Bull. Seismol. Soc. Am. 2003, 93, 353–370. [Google Scholar] [CrossRef]
- Rastogi, B.K. Damage due to the Mw 7.7 Kutch, India earthquake of 2001. Tectonophysics 2004, 390, 85–103. [Google Scholar] [CrossRef]
- Mandal, P.; Rastogi, B.K.; Satyanarayana, H.V.S.; Kousalya, M.; Vijayraghvan, R.; Satyamurthy, C.; Raju, I.P.; Sarma, A.N.S.; Kumar, N. Characterization of causative fault system for the 2001 Bhuj earthquake of Mw 7.7. Tectonophysics 2004, 378, 105–121. [Google Scholar] [CrossRef]
- Gahalaut, V.K.; Burgmann, R. Constraints on the Source Parameters of the 26 January 2001 Bhuj, India, Earthquake from Satellite Images. Bull. Seismol. Soc. Am. 2004, 94, 2407–2413. [Google Scholar] [CrossRef]
- Bodin, P.; Horton, S. Source parameters and tectonic implications of aftershocks of the Mw 7.6 Bhuj earthquake of January 26, 2001. Bull. Seismol. Soc. Am. 2004, 94, 818–827. [Google Scholar] [CrossRef]
- Atkinson, G.M.; Boore, D.M. Ground Motion Relations for Eastern North America. Bull. Seismol. Soc. Am. 1995, 85, 17–30. [Google Scholar]
- Bodin, P.; Malagnini, L.; Akinci, A. Ground-Motion Scaling in the Kachchh Basin, India, Deduced from Aftershocks of the 2001 Mw 7.6 Bhuj Earthquake. Bull. Seismol. Soc. Am. 2004, 94, 1658–1669. [Google Scholar] [CrossRef]
- Yagi, Y.; Kikuchi, K. Western India Earthquake. Available online: http://equake-rc.info/static/srcmod_archives/s2001BHUJINyagi.html (accessed on 1 June 2016).
- USGS. Available online: https://earthquake.usgs.gov/earthquakes/eventpage/usp000a8ds (accessed on 26 January 2001).
- Frankel, A.; Mueller, C.; Barnhard, T.; Perkins, D.; Leyendecker, E.V.; Dickman, N.; Hanson, S.; Hopper, M. Seismic-Hazard Maps for the Conterminous United States; U.S. Geological Survey: Reston, VA, USA, 1997; scale 1: 7,000,000. [Google Scholar]
- Joyner, W.B.; Boore, D.M. Recent developments in earthquake ground motion estimation. In Proceedings of the 6th International Conference on Seismic Zonation, Palm Springs, CA, USA, 12–15 November 2000. [Google Scholar]
- Geologic Map of India. Sixth Eds, Geological Survey of India; GSI: Kolkata, India, 1962; scale 1: 2,000,000. [Google Scholar]
- Boore, D.M.; Joyner, W.B. Site amplifications for generic rock sites. Bull. Seismol. Soc. Am. 1997, 87, 327–341. [Google Scholar]
- Atkinson, G.M.; Boore, D.M. Earthquake ground motion prediction equations for Eastern North America. Bull. Seismol. Soc. Am. 2006, 96, 2181–2205. [Google Scholar] [CrossRef]
- Chopra, S.; Kumar, D.; Rastogi, B.K.; Choudhury, P.; Yadav, R.B.S. Estimation of site amplification functions in Gujarat region, India. Nat. Hazards 2013, 65, 1135–1155. [Google Scholar] [CrossRef]
- Choudhury, P.; Chopra, S.; Roy, K.S. Site Classification for Strong Motion Stations in Gujarat, India using response spectral ratio. Soil Dyn. Earthq. Eng. 2016, 87, 138–150. [Google Scholar] [CrossRef]
- Di Alessandro, C.; Bonilla, L.F.; Boore, D.M.; Rovelli, A.; Scotti, O. Predominant-Period Site Classification for Response Spectra Prediction Equations in Italy. Bull. Seismol. Soc. Am. 2012, 102, 680–695. [Google Scholar] [CrossRef]
- Rathje, E.M.; Abrahamson, N.A.; Bray, J.D. Simplified Frequency Content Estimates of Earthquake Ground Motions. ASCE J. Geotech. Geoenvironmental Eng. 1998, 124, 150–159. [Google Scholar] [CrossRef]
- Hough, S.E.; Martin, S.; Bilham, R.; Atkinson, G.M. The 26 January 2001 M. 7.6 Bhuj, India, Earthquake: Observed and Predicted Ground Motions. Bull. Seismol. Soc. Am. 2002, 92, 2061–2079. [Google Scholar] [CrossRef]
- Chopra, S.; Choudhury, P. A study of response spectra for different geological conditions in Gujarat, India. Soil Dyn. Earthq. Eng. 2011, 31, 1551–1564. [Google Scholar]
Figure 1.
Isoseismal Map for 2001 Gujarat Earthquake. The intensity is on the MMI scale. (Inset: Map of India – Gujarat is highlighted).
Figure 1.
Isoseismal Map for 2001 Gujarat Earthquake. The intensity is on the MMI scale. (Inset: Map of India – Gujarat is highlighted).

Figure 2.
(a) Seismic Zones in Gujarat [15]—the Kutch region is highlighted; (b) Map showing major faults in the Kutch region (Zone V). The epicenter of the 2001 Gujarat earthquake is shown as a star.
Figure 2.
(a) Seismic Zones in Gujarat [15]—the Kutch region is highlighted; (b) Map showing major faults in the Kutch region (Zone V). The epicenter of the 2001 Gujarat earthquake is shown as a star.

Figure 3.
The slip distribution on the fault plane used in the present study [32]. The hypocenter of the 2001 Gujarat earthquake is shown as a star on the fault plane.
Figure 3.
The slip distribution on the fault plane used in the present study [32]. The hypocenter of the 2001 Gujarat earthquake is shown as a star on the fault plane.

Figure 4.
Synthetic Ground Motions at Rock Level.


Figure 5.
Site amplification plots for various sites.

Figure 6.
Response Spectra for (a) Dudhai (D = 15 km) and (b) Bhachau (D = 19 km).

Figure 7.
Response Spectra for (a) Rapar (D = 46 km) and (b) Dhori (D = 49 km).

Figure 8.
Response Spectra for (a) Khavda (D = 73 km) and (b) Adesar (D = 78 km).

Figure 9.
Response Spectra for (a) Mandvi (D = 111 km) and (b) Nakhatrana (D = 155 km).

Figure 10.
Response Spectra for Morbi (Zone 4).

Figure 11.
Response Spectra for (a) Lalpur and (b) Dwarka (Zone 4).


Table 1.
Model Parameters for 2001 Gujarat earthquake used in the present study.
| Magnitude, | 7.6 | [33] |
| Latitude, longitude | 23.42° N, 70.23° E | [33] |
| Hypocenter depth | 16 km | [33] |
| Fault strike, dip | 78°, 58° | [32] |
| Fault length, width | 75 km, 35 km | [32] |
| Slip distribution | [32] | |
| Depth of top of rupture | 10 km | [28] |
| No. of faults along strike, dip | 15, 7 | [32] |
| Hypocenter location on the fault plane | 11, 5 | [32] |
| Shear wave velocity | 3.7 km/s | Hard Rock |
| Density | 2.8 gm/cm3 | Hard Rock |
| Stress drop | 100, 125, 150 and 160 bars | [3] |
| Inelastic attenuation Q(f) | 790 | [29] |
| Geometric spreading | [29] | |
| Duration properties | , , , , , , | [30] |
| Pulsing percent | 50% | [19] |
| Crustal amplification | Hard Rock | [37] |
| Crustal amplification | B/C boundary | [38] |
Table 2.
Comparison of PGA values – Present Study and Recorded [11].
Table 2.
Comparison of PGA values – Present Study and Recorded [11].
| S. No. | Site | Site Class (NEHRP) | Epicentral Distance (km) | Recorded PGA (g) | Recorded PGA (g) Vs = 760 m/s (Corrected to B/C) | PGA (g) of Simulated GM Vs = 760 m/s B/C (NEHRP) | PGA (g) of Simulated GM Vs = 2900 m/s (Hard Rock) | Residuals |
|---|---|---|---|---|---|---|---|---|
| 1 | Anjar | C | 44 | 0.65 | 0.580 | 0.564 | 0.315 | 0.016 |
| 2 | Kandla | C | 53 | 0.35 | 0.326 | 0.446 | 0.241 | −0.120 |
| 3 | Niruna | D | 97 | 0.32 | 0.241 | 0.360 | 0.208 | −0.119 |
| 4 | Naliya | C | 147 | 0.29 | 0.215 | 0.222 | 0.123 | 0.007 |
| 5 | Khambaliya | A | 150 | 0.072 | 0.143 | 0.192 | 0.104 | −0.032 |
| 6 | Jamjodhpur | A | 166 | 0.088 | 0.088 | 0.128 | 0.073 | 0.015 |
| 7 | Dwarka | D | 188 | 0.085 | 0.061 | 0.199 | 0.107 | −0.138 |
| 8 | Porbandar | D | 206 | 0.076 | 0.054 | 0.143 | 0.076 | −0.089 |
| 9 | Junagarh | A | 216 | 0.075 | 0.075 | 0.084 | 0.049 | −0.009 |
| 10 | Amreli | A | 225 | 0.039 | 0.039 | 0.080 | 0.045 | −0.006 |
| 11 | Ahmedabad | D | 238 | 0.11 | 0.080 | 0.080 | 0.046 | 0 |
| 12 | Cambay | D | 266 | 0.20 | 0.143 | 0.062 | 0.038 | 0.081 |
| 13 | Anand | D | 288 | 0.058 | 0.041 | 0.053 | 0.032 | −0.012 |
Table 3.
Average Characteristics of Synthetic Ground Motions (Surface Level).
| S. No. | Station | Site Class | Distance (km) | PGA (g) | PGV (m/s) | AI (m/s) | Duration (s) | ||
|---|---|---|---|---|---|---|---|---|---|
| 1 | Dudhai | III | 15 | 0.74 | 0.87 | 7.58 | 0.21 | 0.55 | 12.81 |
| 2 | Bhachau | III | 19 | 0.64 | 0.54 | 6.14 | 0.10 | 0.31 | 18.08 |
| 3 | Suvai | II | 34 | 0.38 | 0.32 | 2.11 | 0.22 | 0.35 | 21.38 |
| 4 | Lakadia | V | 36 | 0.42 | 0.53 | 3.20 | 0.18 | 0.50 | 21.73 |
| 5 | Rapar | I | 46 | 0.33 | 0.18 | 2.29 | 0.11 | 0.19 | 22.80 |
| 6 | Dhori | III | 49 | 0.74 | 0.63 | 5.02 | 0.26 | 0.40 | 5.92 |
| 7 | Khavda | II | 73 | 0.35 | 0.18 | 1.97 | 0.15 | 0.23 | 12.24 |
| 8 | Bela | II | 77 | 0.12 | 0.12 | 0.36 | 0.19 | 0.41 | 21.39 |
| 9 | Adesar | II | 78 | 0.15 | 0.13 | 0.47 | 0.19 | 0.38 | 22.88 |
| 10 | Mandvi | VII | 111 | 0.24 | 0.17 | 0.76 | 0.14 | 0.26 | 9.26 |
| 11 | Dayapur | I | 141 | 0.13 | 0.09 | 0.18 | 0.16 | 0.29 | 7.80 |
| 12 | Nakhatrana | V | 155 | 0.20 | 0.16 | 0.38 | 0.13 | 0.33 | 8.31 |
| 13 | Naliya | VI | 192 | 0.14 | 0.11 | 0.16 | 0.13 | 0.39 | 8.07 |
| 14 | Morbi | I | 93 | 0.16 | 0.12 | 0.57 | 0.17 | 0.25 | 21.13 |
| 15 | Dwarka | VI | 183 | 0.03 | 0.03 | 0.01 | 0.25 | 0.46 | 9.95 |
© 2018 by the authors. Licensee MDPI, Basel, Switzerland. This article is an open access article distributed under the terms and conditions of the Creative Commons Attribution (CC BY) license (http://creativecommons.org/licenses/by/4.0/).
Share and Cite
MDPI and ACS Style
Vemuri, J.; Kolluru, S.; Chopra, S. Surface Level Synthetic Ground Motions for M7.6 2001 Gujarat Earthquake. Geosciences 2018, 8, 429. https://doi.org/10.3390/geosciences8120429
AMA Style
Vemuri J, Kolluru S, Chopra S. Surface Level Synthetic Ground Motions for M7.6 2001 Gujarat Earthquake. Geosciences. 2018; 8(12):429. https://doi.org/10.3390/geosciences8120429
Chicago/Turabian StyleVemuri, Jayaprakash, Subramaniam Kolluru, and Sumer Chopra. 2018. "Surface Level Synthetic Ground Motions for M7.6 2001 Gujarat Earthquake" Geosciences 8, no. 12: 429. https://doi.org/10.3390/geosciences8120429
Note that from the first issue of 2016, this journal uses article numbers instead of page numbers. See further details here.