Unsteady Seepage Behavior of an Earthfill Dam During Drought-Flood Cycles


1
Nanjing Hydraulic Research Institute, State Key Laboratory of Hydrology-Water Resources and Hydraulic Engineering, Guangzhou Road 223, Nanjing 210029, China
2
Department of Hydraulic Engineering, Faculty of Civil Engineering and Geosciences, Delft University of Technology, Building 23, Stevinweg 1, 2628 CN Delft, The Netherlands
3
Hydraulic Engineering and River Basin Development, IHE Delft, Westvest 7, 2611 AX Delft, The Netherlands
*
Author to whom correspondence should be addressed.
Geosciences 2019, 9(1), 17; https://doi.org/10.3390/geosciences9010017
Submission received: 6 December 2018
/
Revised: 21 December 2018
/
Accepted: 24 December 2018
/
Published: 28 December 2018
(This article belongs to the Special Issue River, Urban, and Coastal Flood Risk)
Abstract
:Climate change with extreme hydrological conditions, such as drought and flood, bring new challenges to seepage behavior and the stability of earthfill dams. Taking a drought-stricken earthfill dam of China as an example, the influence of drought-flood cycles on dam seepage behavior is analyzed. This paper includes a clay sample laboratory experiment and an unsteady finite element method seepage simulation of the mentioned dam. Results show that severe drought causes cracks on the surface of the clay soil sample. Long-term drought causes deeper cracks and induces a sharp increase of suction pressure, indicating that the cracks would become channels for rain infiltration into the dam during subsequent rainfall, increasing the potential for internal erosion and decreasing dam stability. Measures to prevent infiltration on the dam slope surface are investigated, for the prevention of deep crack formation during long lasting droughts. Unsteady seepage indicators including instantaneous phreatic lines, equipotential lines and pore pressure gradient in the dam, are calculated and analyzed under two assumed conditions with different reservoir water level fluctuations. Results show that when the water level changes rapidly, the phreatic line is curved and constantly changing. As water level rises, equipotential lines shift upstream, and the pore pressure gradient in the dam’s main body is larger than that of steady seepage. Furthermore, the faster the water level rises, the larger the pore pressure gradient is. This may cause internal erosion. Furthermore, the case of a cracked upstream slope is modelled via an equivalent permeability coefficient, which shows that the pore pressure gradient in the zone beneath the cracks increases by 5.9% at the maximum water level; this could exacerbate internal erosion. In addition, results are in agreement with prior literature that rapid drawdown of the reservoir water level is detrimental to the stability of the upstream slope based on embankment slope stability as calculated by the Simplified Bishop Method. It is concluded that fluctuations of reservoir water level should be strictly controlled during drought-flood cycles; both the drawdown rate and the fill rate must be regulated to avoid the internal erosion of earthfill dams.
1. Introduction
Influenced by global climate change, regional extreme hydrologic events have occurred frequently in recent years. The frequency, intensity and uncertainty of drought and flood disasters have increased significantly. For instance, dry season rainfall and river discharges are decreasing, while wet season flows are intensifying [1,2]. Severe drought and waterlogging, and the rapid transition between these states, which can be seen as extreme hydrological conditions, have a significant impact on the safe operation of earthfill dams. Severe drought draws down reservoirs and causes cracking in the upstream clay slope or bed blanket; these cracks may destroy the seepage prevention layer and cause internal erosion of the dam. Rapid change from drought to flood brings a sharp rise in reservoir water level. Both such rapid rise of the phreatic line and reverse seepage in the case of sudden drawdown can lead to internal erosion of the dam and instability of the dam slope [3,4]. Research on slope instability due to rapid drawdown is plentiful [3,5,6,7], but works on unsteady seepage and slope stability during rapid filling, and especially during wet-dry cycles with crack formation, are scarce [8,9]. The research carried out here seeks to help fill in this knowledge gap.
Under extreme hydrological conditions, soil characteristics and unsteady seepage through dams are complex problems due to the influence of cracks and unsaturation. According to a study of cracks on a dam slope and unsaturated soil characteristics under severe drought conditions, it is found that the key factor that affected the crack width was not soil water content, but water content gradient [3,10]. To study soil characteristics under dry-wet cycles, Zhang [11] combined many experimental data sets to determine how the moisture absorption-desorption curve varies with the number of dry-wet cycles. By introducing a function related to the number of dry-wet cycles, a method for predicting soil water characteristic curves after multiple dry-wet cycles was proposed. During a dry-wet cycle, reservoir water level changes rapidly. The mutual recharge of water inside and outside the dam causes the seepage rate within the dam to constantly change, resulting in unsaturated unsteady seepage [12].
Because pore water pressure in a dam cannot dissipate quickly, rapid drawdown is known as one of the most dangerous conditions for the upstream slope [13]. F.O. Jones et al. [14] found that 30% of landslides in Roosevelt Lake in the United States from 1941 to 1953 occurred when the water level dropped suddenly by 10–20 m. In Japan, about 60% of landslides occur during rapid drawdown of reservoirs [15]. Thus far, seepage and stability characteristics of embankment dams have been analyzed during rapid drawdown. Based on unsaturated seepage theory, the pore-water pressures, the stability of the dam upstream slope and the relationship with reservoir drawdown rate or permeability coefficient have been analyzed. Timothy et al. [6] used the San Luis Dam upstream slide to evaluate the pore-water pressures at failure and progression of the phreatic surface through the fine-grained core for drawdown stability analyses, and Berilgen [7] and Zhong et al. [16] studied the seepage and stability of homogeneous and clay core dams under various drawdown rates; their results show that the safety factor of the slope decreases due to the sudden drop of the water level, while the stability of dam slope increases with dissipation of excess pore water pressure. The more intense precipitation is, the smaller the safety factor of the slope is. Taking into account the influence of permeability, the relation among reservoir drawdown rate, permeability, and dam slope stability was also studied [8,17]. It was found that when the water level drops, decrease of the permeability coefficient also results in a significant reduction of the safety factor of the slope. However, rapid reservoir filling is also an important cause of internal erosion. Li [9] discusses fluctuations of the phreatic surface for an earth-rock dam with a clay core during reservoir filling.
In this paper, a specific earthfill dam struck by severe drought is taken as an example. First, the basic characteristics of the clay material used to build the dam, are studied experimentally during dry-wet cycles, and the suction pressure of the clay is measured with heat-conduction sensors. Cracking and its relationship to suction pressure are measured during wet-dry cycles, to provide a proxy to the behavior of cracks in clay during long-term droughts. Results of the analysis indicate that cracks would become channels for rain infiltration into the dam (lowering the strength of clay layer on the upstream slope face); therefore, measures to seal an exposed dam slope and retain moisture should be enacted to prevent cracking during droughts.
In addition to the laboratory experiment, the nonlinear relationship between the soil permeability coefficient and the suction pressure is investigated via an unsteady finite element seepage analysis, and unsteady seepage through the dam under two assumed conditions with different reservoir water level behaviors are analyzed. It is found that rapid drawdown of the reservoir water level decreases the stability of the upstream slope. It is also found that rapid filling of the reservoir increases the pore pressure gradient in the dam’s upstream blanket, which may cause internal erosion. Additionally, we model the situation where the dam upstream slope is cracked, with crack location and extent corresponding to field measurements. This analysis shows that cracks increase the pore pressure gradient in the zone beneath the cracks, potentially exacerbating internal erosion. As a result, during the filling of the reservoir, internal erosion is a threat, while stability of the upstream dam slope is a danger during drawdown. Therefore, the rate of change of reservoir water level should be strictly controlled during drought-flood cycles, while measures should also be taken to prevent and repair cracks.
2. Field Measurements of Dam during Drought
Baiguishan reservoir is located in the middle of the Huaihe basin in China (Figure 1). It is a large annual regulation reservoir used primarily for flood control, taking into account the comprehensive utilization of irrigation, industrial and urban water. The total reservoir capacity is 922 million m3, the normal storage level is 103.00 m (Chinese national datum) and the dead water level is 97.50 m. The flood protection standard is designed for the 100 years event, with a corresponding flood water level of 106.19 m. The warning flood level is 109.56 m, with a return period of 2000 years.
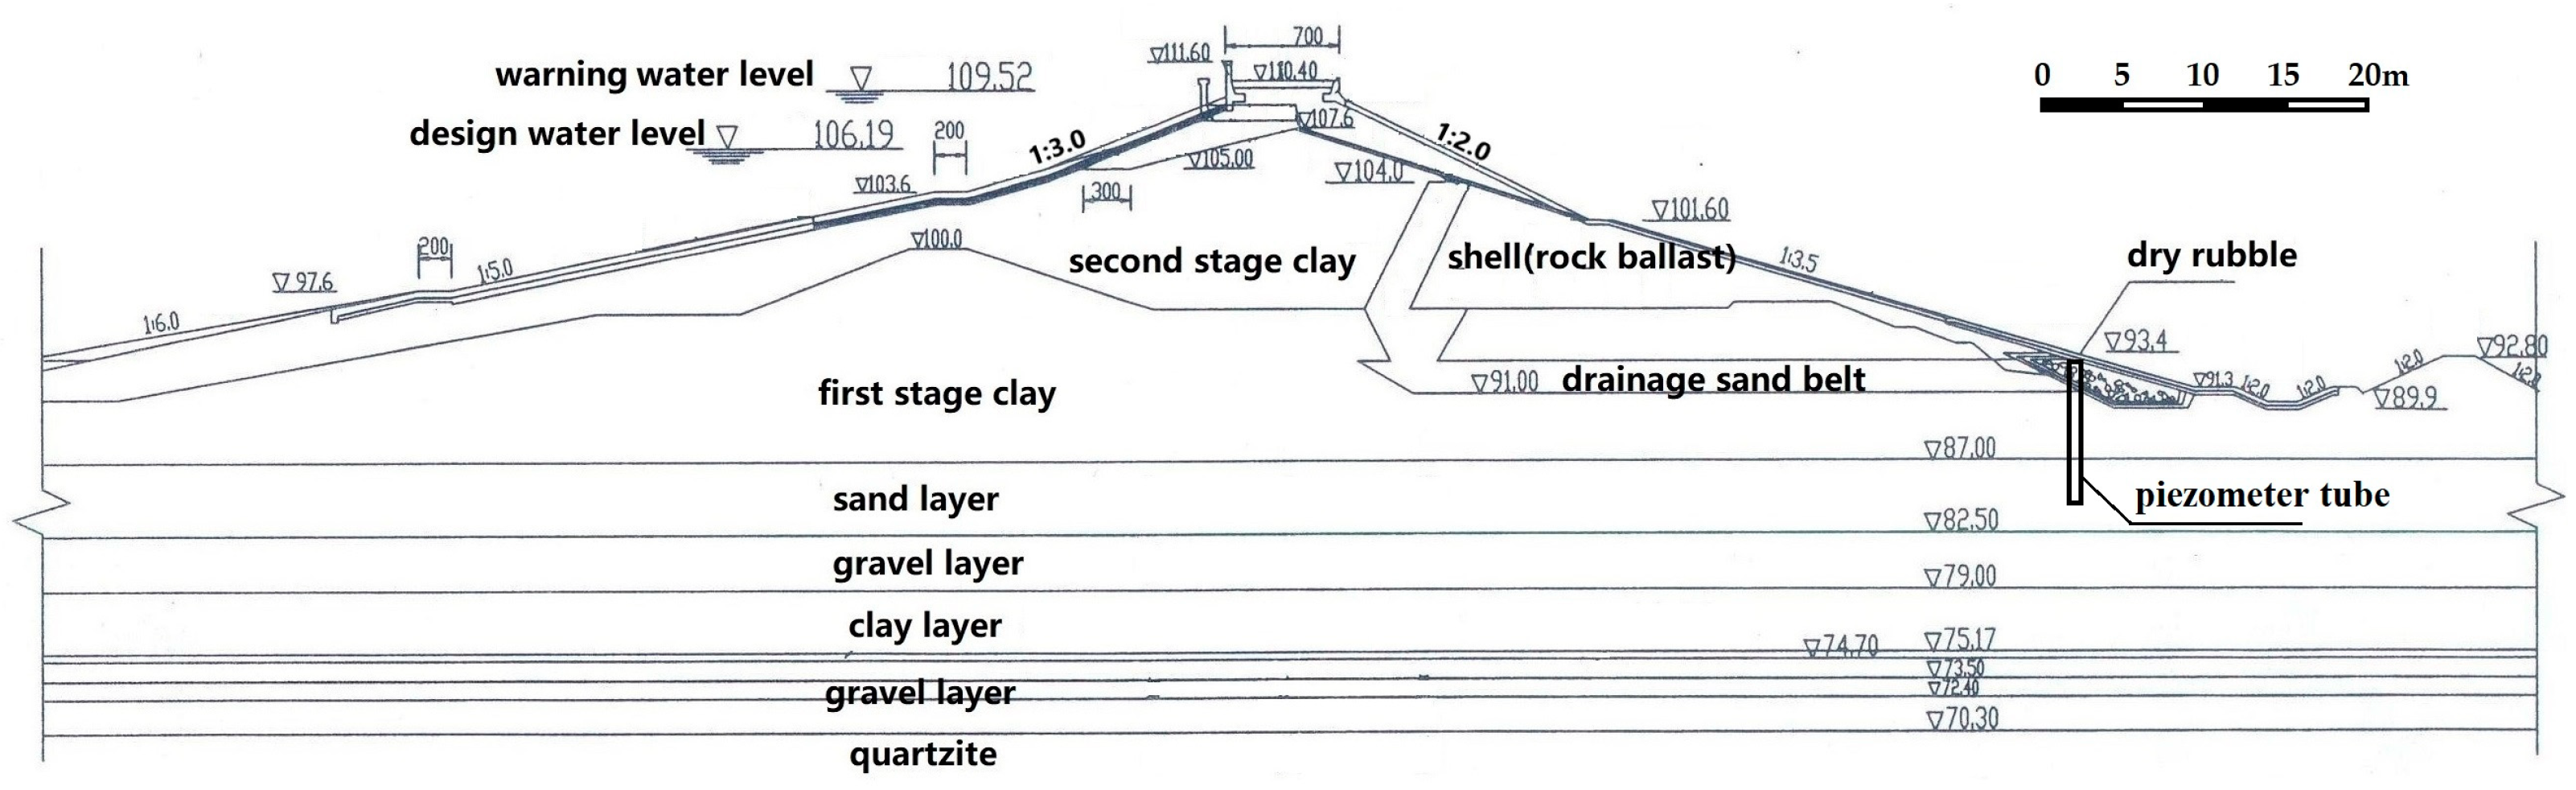
The dam is a 1545.4 m long earthfill dam (Figure 2). The crest is 7.0 m wide, at an elevation of 110.40m. The maximum dam height is 24m. The upper reaches of the dam are covered with a clay blanket, which is 85–100 m wide and 1.0–3.0 m thick. A sand belt is built into the dam’s downstream body as a drainage layer, and there are gravel filter layers between the sand and clay/rock layers; the filter layers are designed to prevent internal erosion.
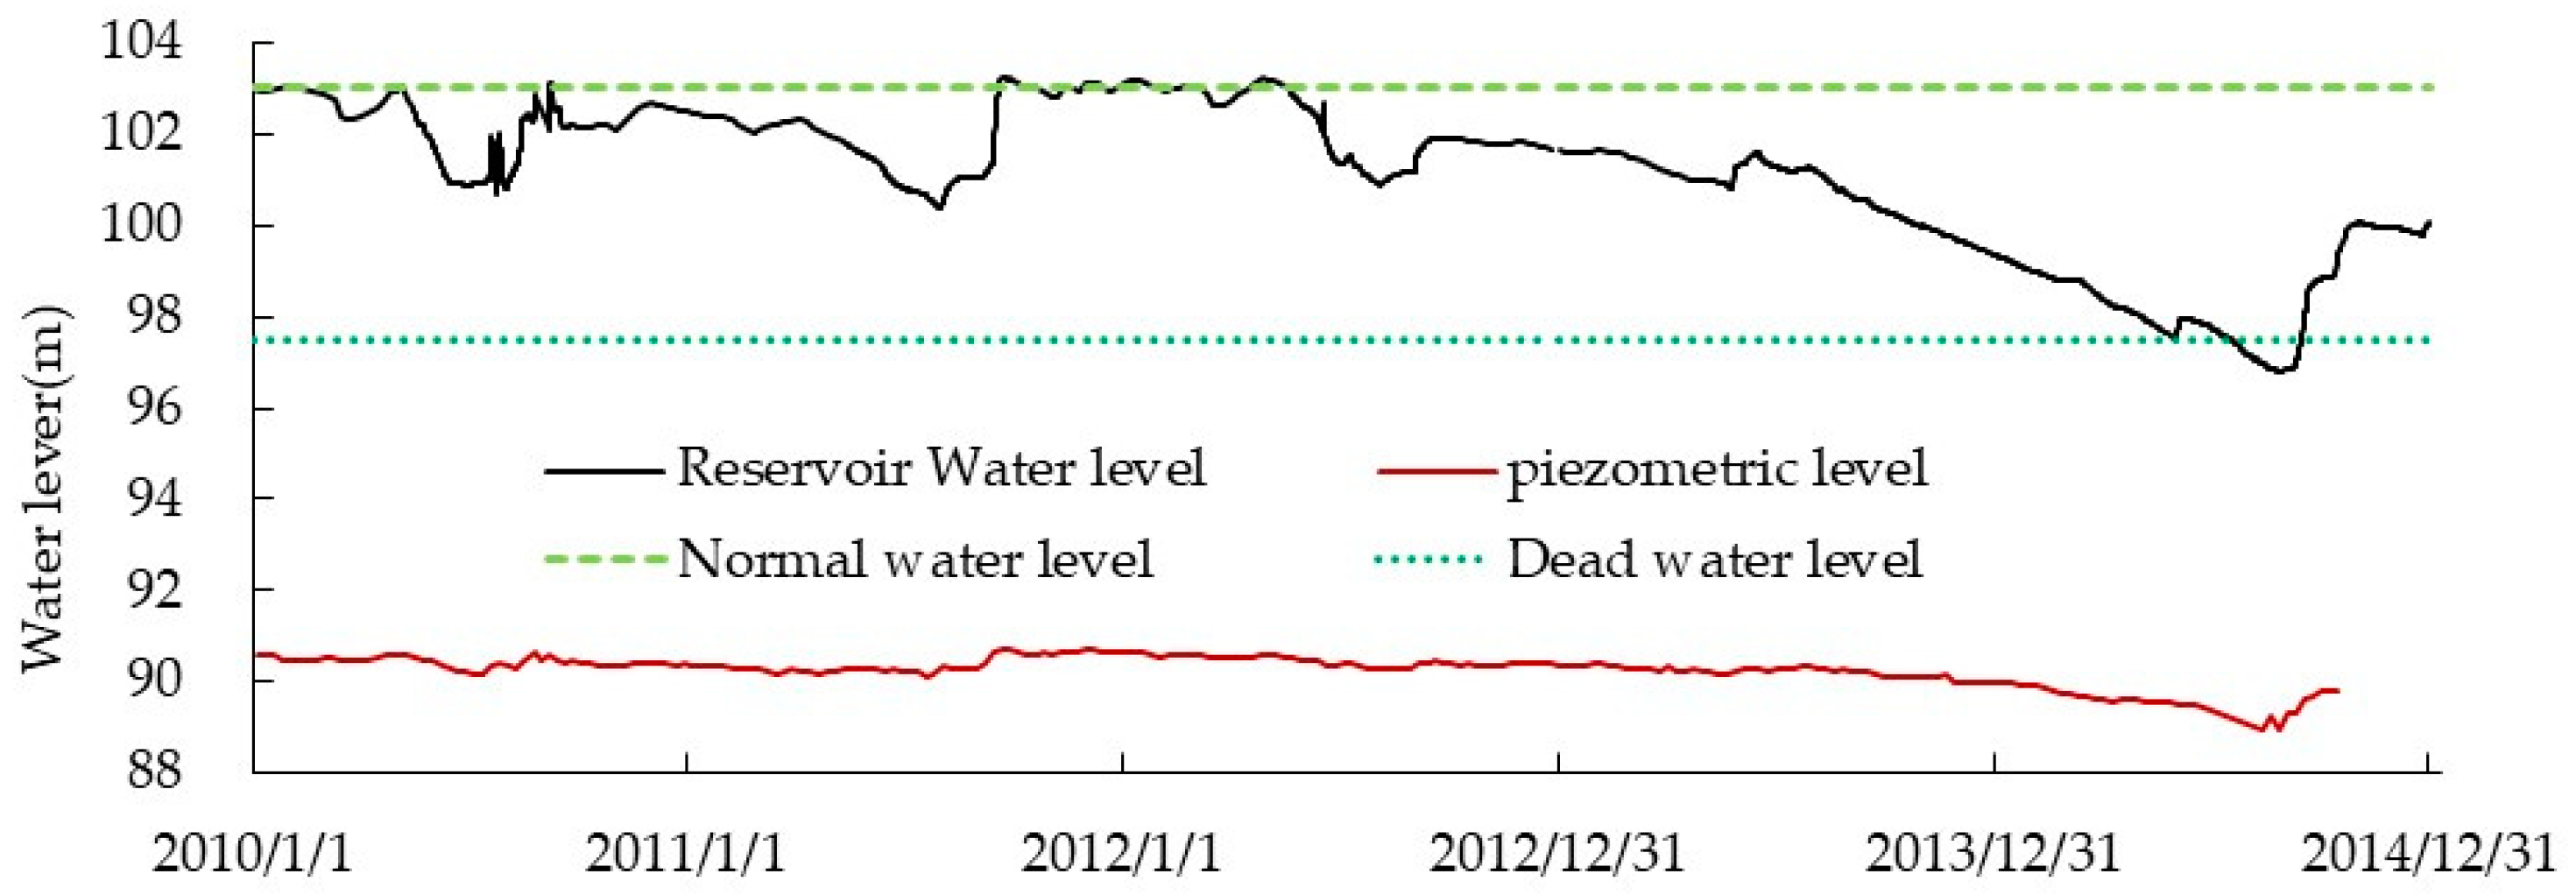
In 2014, the reservoir suffered its worst drought since 1953 (beginning of hydrological observation) [18] and continued to operate at extremely low water level (Figure 3). Especially during the months of July to September, the reservoir water level continued to run below the dead water level (97.50 m), and the lowest operating water level was 96.80 m.
Though several piezometer tubes were installed in the dam, only one piezometer tube (shown in Figure 2) which protrudes through the rock toe drain in the dam foundation had been maintained well enough to provide a relatively continuous observation sequence of pore water pressure. The time series of measured piezometer and reservoir water levels is shown in Figure 3. The piezometer water level is generally low and stable, and positively correlated with the reservoir water level. The fluctuation of the piezometer water level is very small, with an annual maximum fluctuation of 0.57 m before 2014. With the reservoir drawdown in 2014, the piezometer level also decreased significantly, bringing the range fluctuation to 0.99 m.
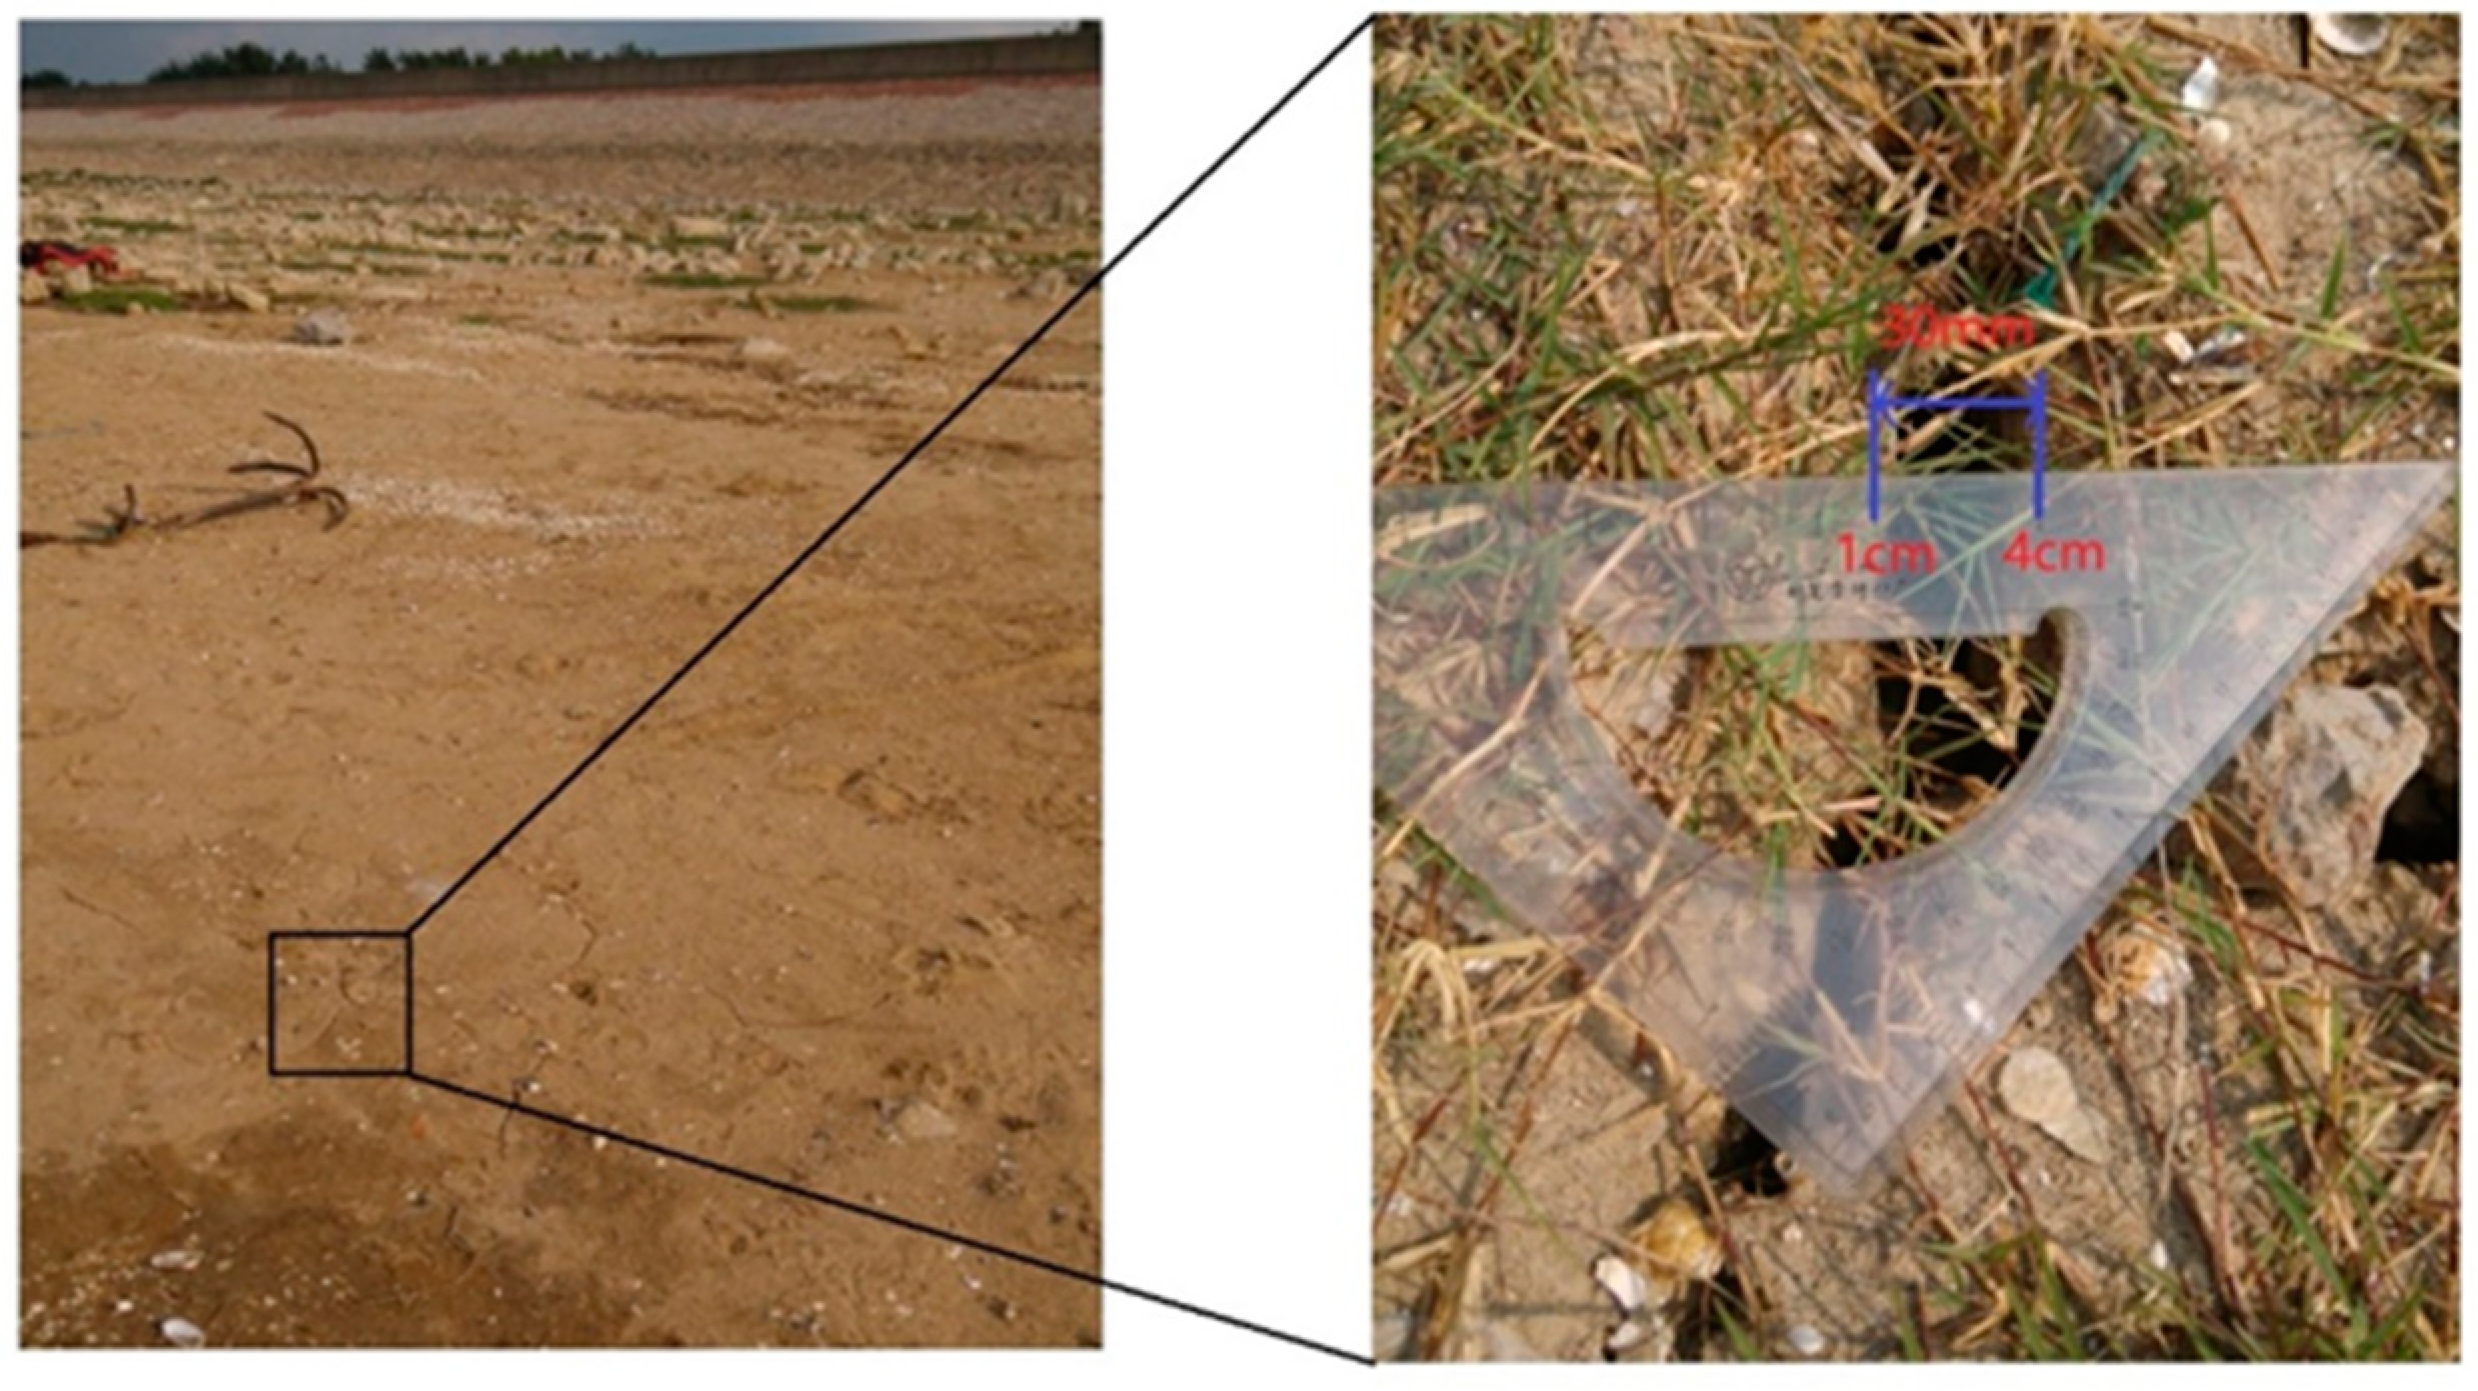
During the drought, the upstream dam slope was exposed to air and a large number of cracks appeared. According to the field investigation, cracks developed between elevations of 97.28 and 100.00 m on the upstream slope. The exposed area increased as the water level continued to decline, and the number and width of cracks on the dam slope increased with time. The maximum width of the cracks was up to 30 mm (as shown in Figure 4), the maximum length was 3.0 m, and maximum depth was 1.0 m.
The foundation of the dam is a highly permeable fine sand layer and sandy gravel layer (as shown in Figure 2). The upstream dam slope fill and clay blanket are important impervious bodies. The long-term low water level lead to the development of exposed cracks on the dam slope, which may cause failure of the seepage prevention function of the clay cover. This may lead to seepage through the dam foundation and internal erosion in the weak zone of the dam upstream toe. Moreover, this drought occurred during what is normally the flood season. If a sudden heavy rain occurs, the abrupt change of water level could cause internal erosion, affecting dam safety.
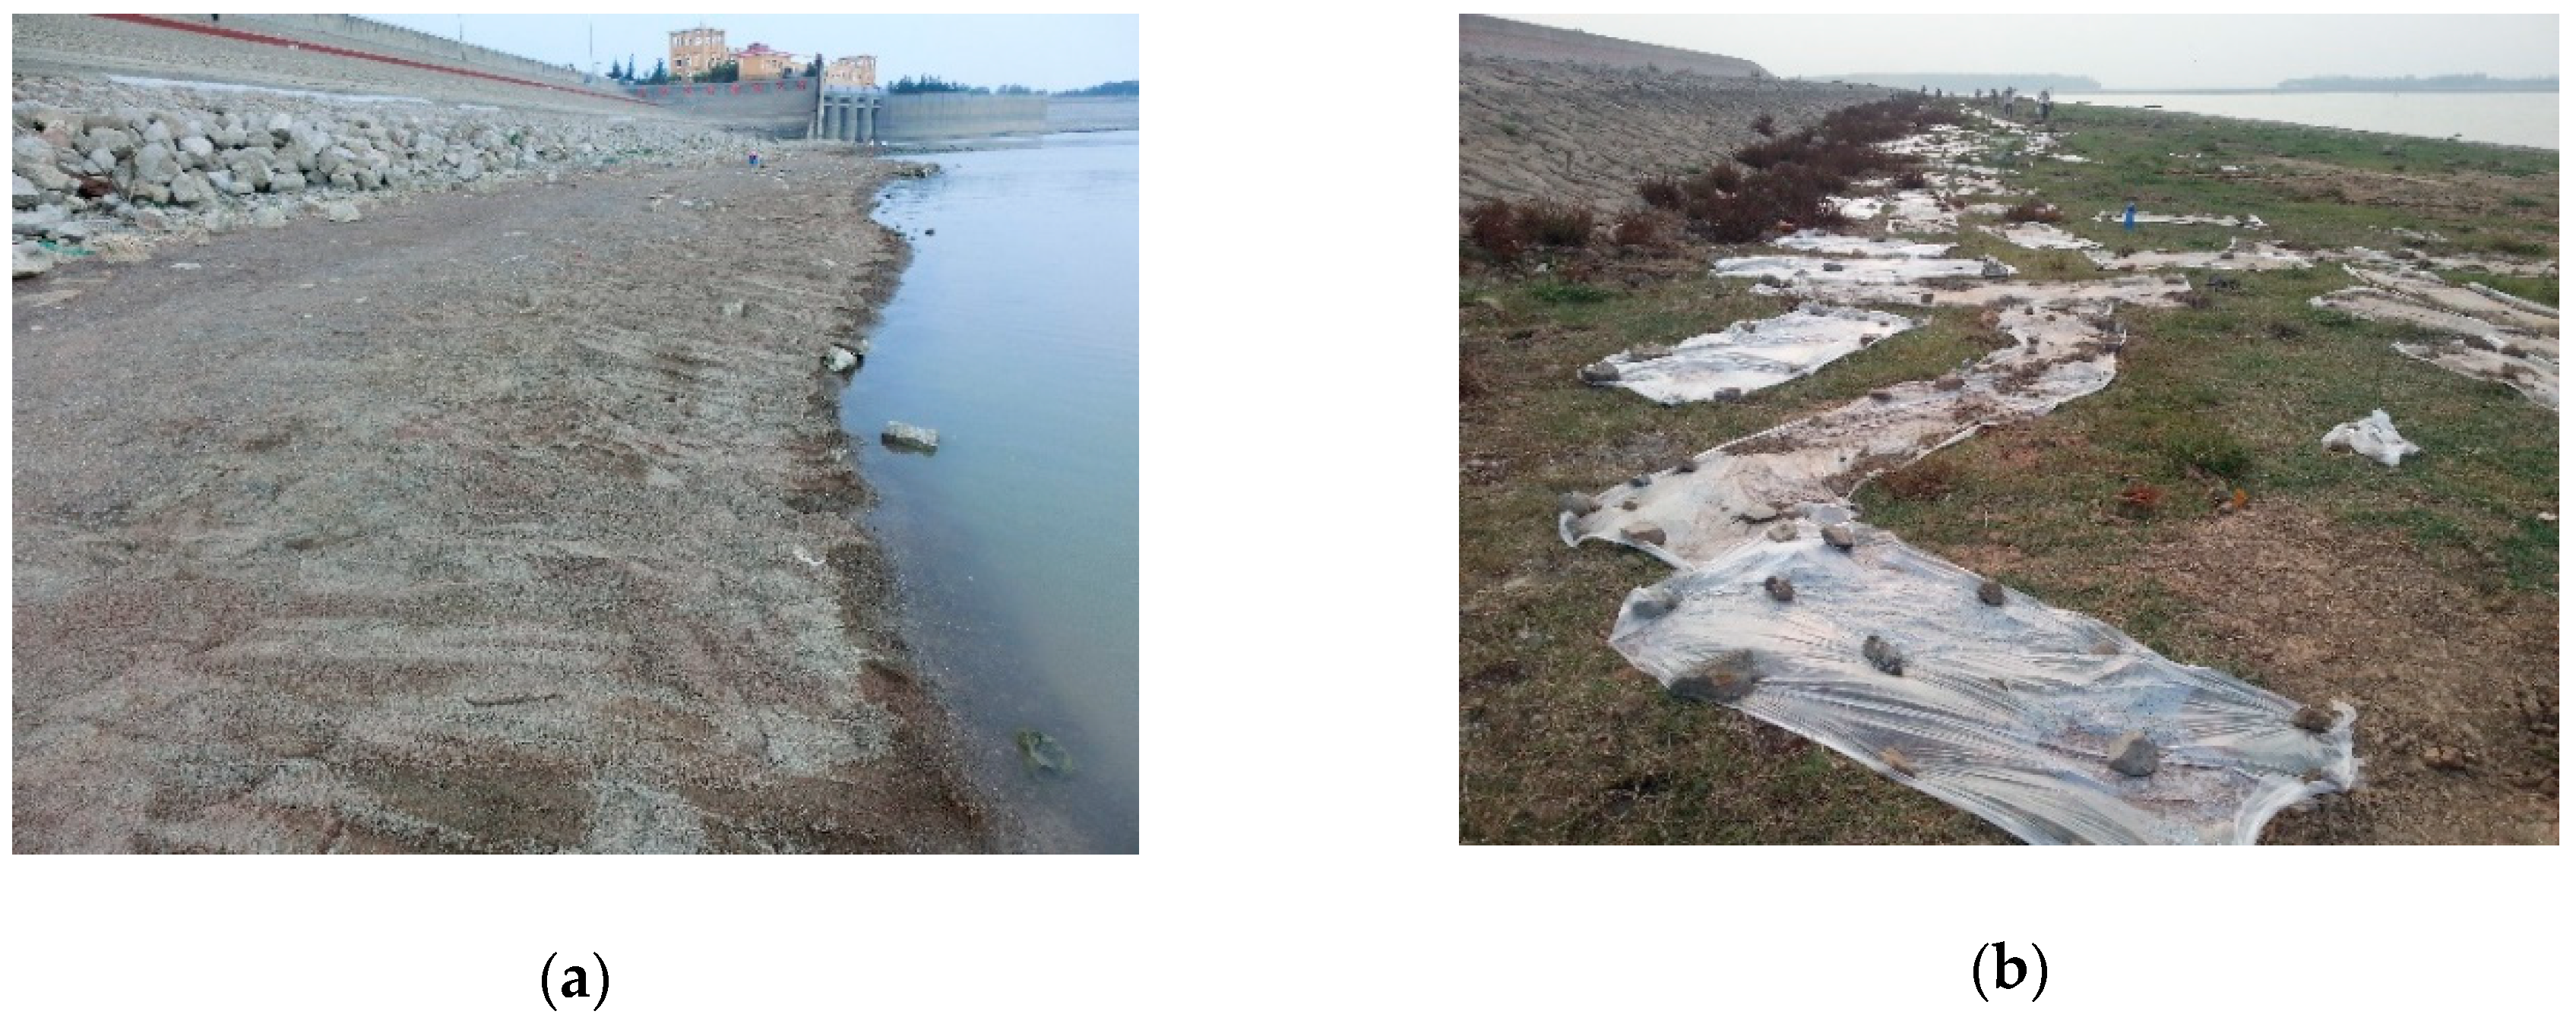
Since crack development is closely related to the rate of change of water content, the key to preventing development of cracks is to protect the dam slope from drying and wetting cycles [18]. To prevent cracks from forming on the dam, countermeasures include closure of joints and keeping soil moist. Large cracks are filled with clay backfill and covered with stone flour of 200 mm thickness (Figure 5a). Plastic films (Figure 5b) are used to prevent evaporation from the surface of the soil and to reduce the speed of development of the cracks, further minimizing potential drought-induced leakage through the dam.
3. Experimental Test of Clay Sample during Dry-Wet Cycles
The purpose of the laboratory experimental sample test is to track the development of cracks in the clay during drought-flood cycles, including the location and degree of development of the cracks. Another objective is to measure the variation of the suction pressure (negative pore water pressure) at different depths in the clay sample during dry-wet cycles. This can provide the soil characteristics for further finite element simulation of rapid water level fluctuations and is helpful for the prevention and treatment of cracks at low water levels.
3.1. Test Condition
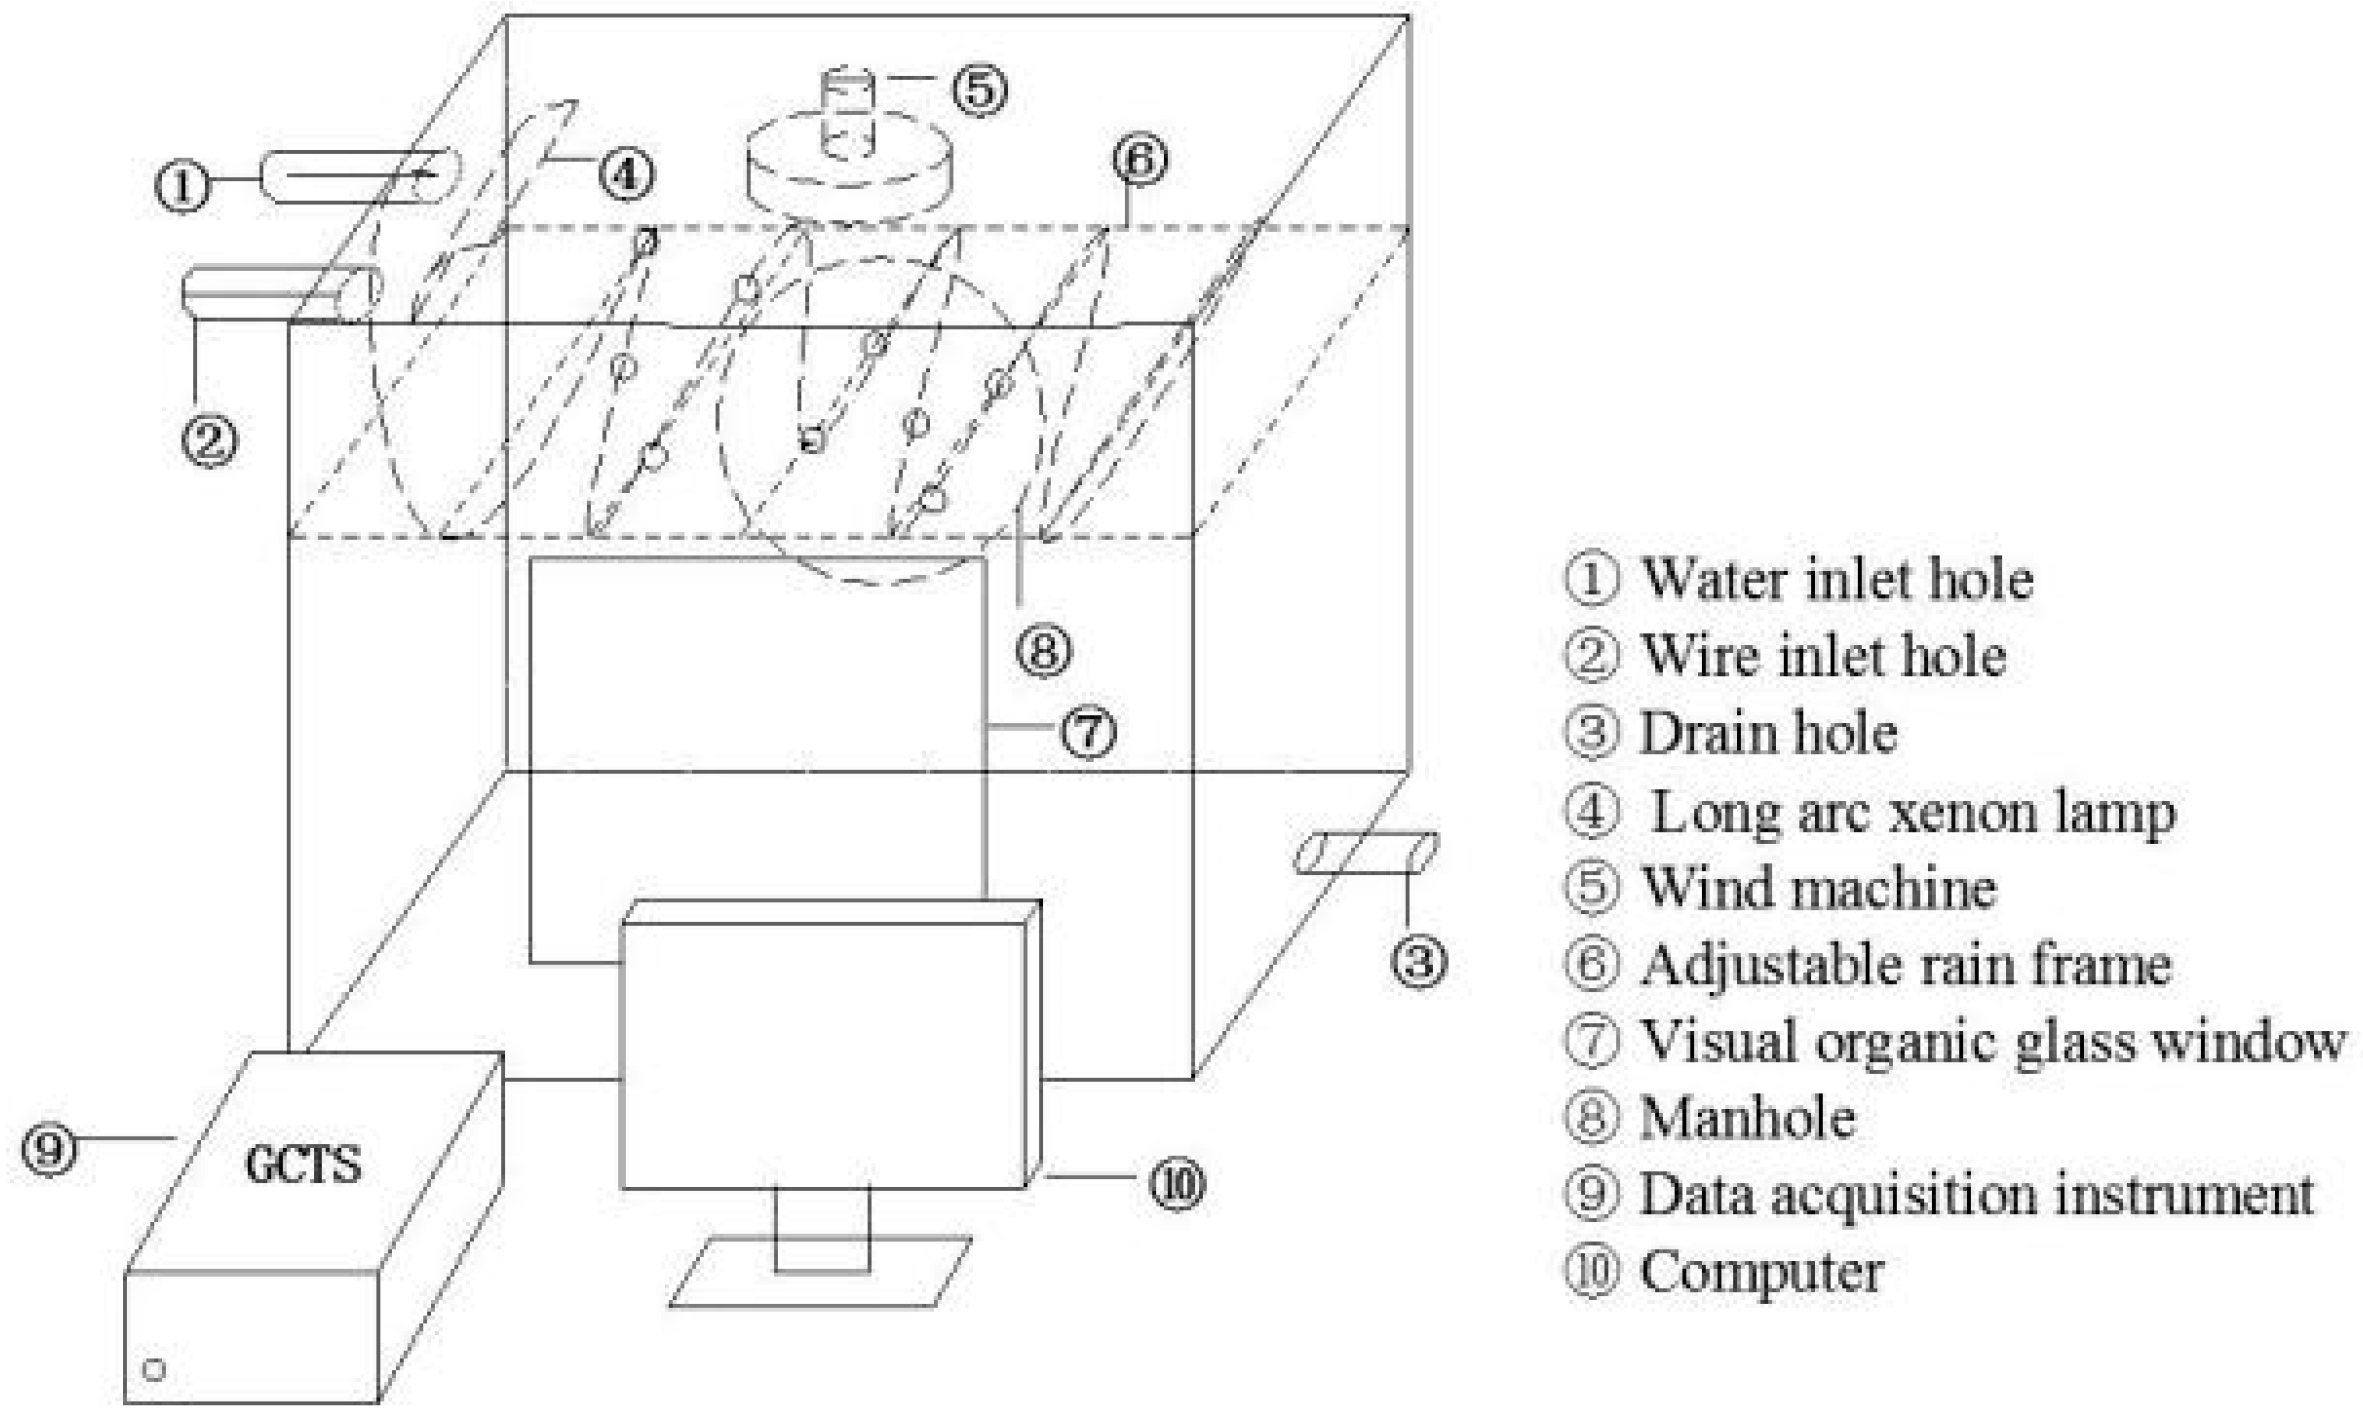
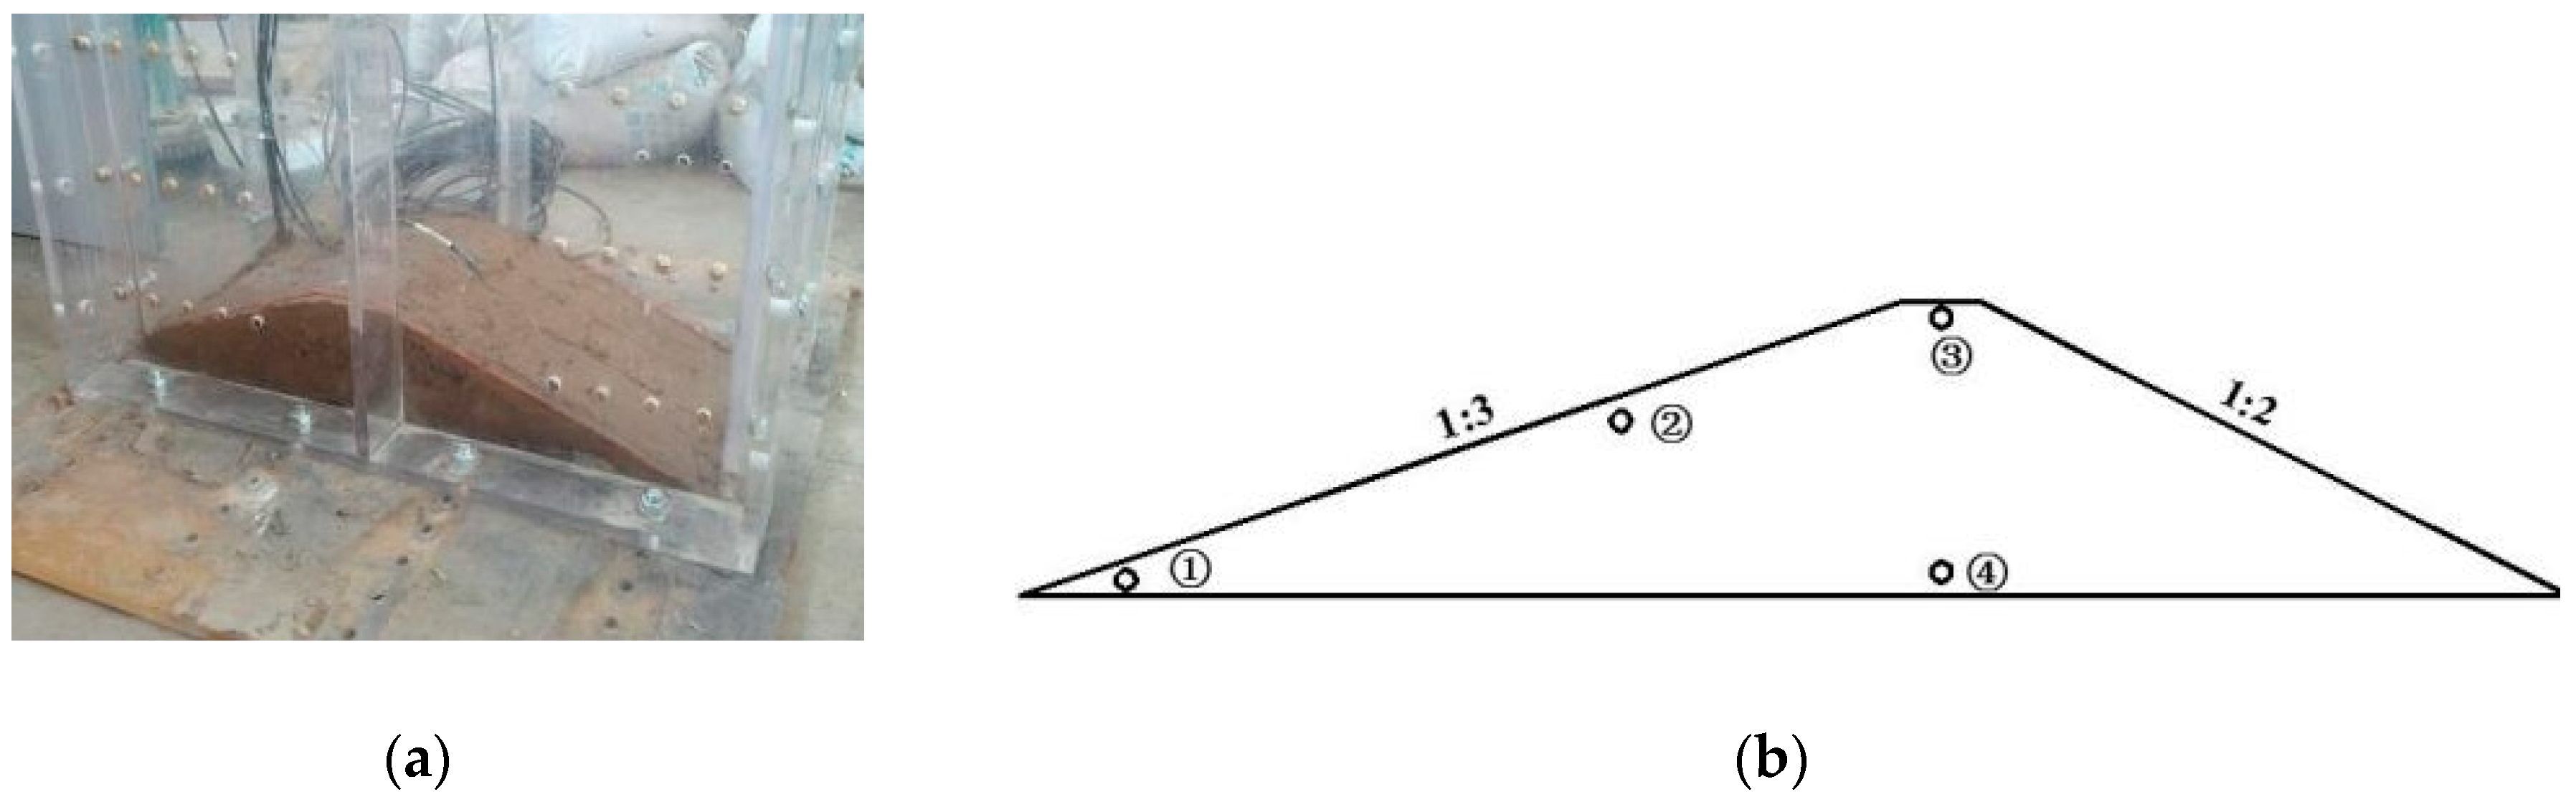
The experimental “environment box” is shown in Figure 6. Long arc lamps and speed regulating fans are installed on the top of the environment box to simulate sunshine and dry air, and a number of atomized nozzles are uniformly distributed to simulate rainfall. The test clay sample (as shown in Figure 7) is 100 cm in length, 40 cm in width, and 20 cm in height. The upstream and downstream slopes have gradients of 1:3 and 1:2 respectively. The sample was constituted in five layers, each 5 cm thick; each layer was compacted manually with a hammer. The clay was excavated from the original dam slope. The final density of the sample is 1.64 g/cm3 and the initial water content is 23% (unsaturated).
FTC-100 Fredlund thermal conductivity sensors (GCTS Testing Systems: South Maple Avenue, Tempe, AZ, USA) are used to measure suction pressure. The sensors measure the temperature of the soil directly and then calculate the suction pressure based on the thermal conductivity of the sensor materials (ceramic block). The range of this sensor is 1 to 1500 kPa and the precision is better than 5%. Four sensors are embedded in the sample (Figure 7b): in the sample toe, midway up the upstream slope, at the sample crest, and at the bottom of the sample. In addition, water content is measured at these same locations by a MPM-160B soil moisture measurement instrument (ICT International, 211 Mann St, Armidale, Austria), with a precision of ±2%. Data are automatically collected during the test and supplemented with manual monitoring.
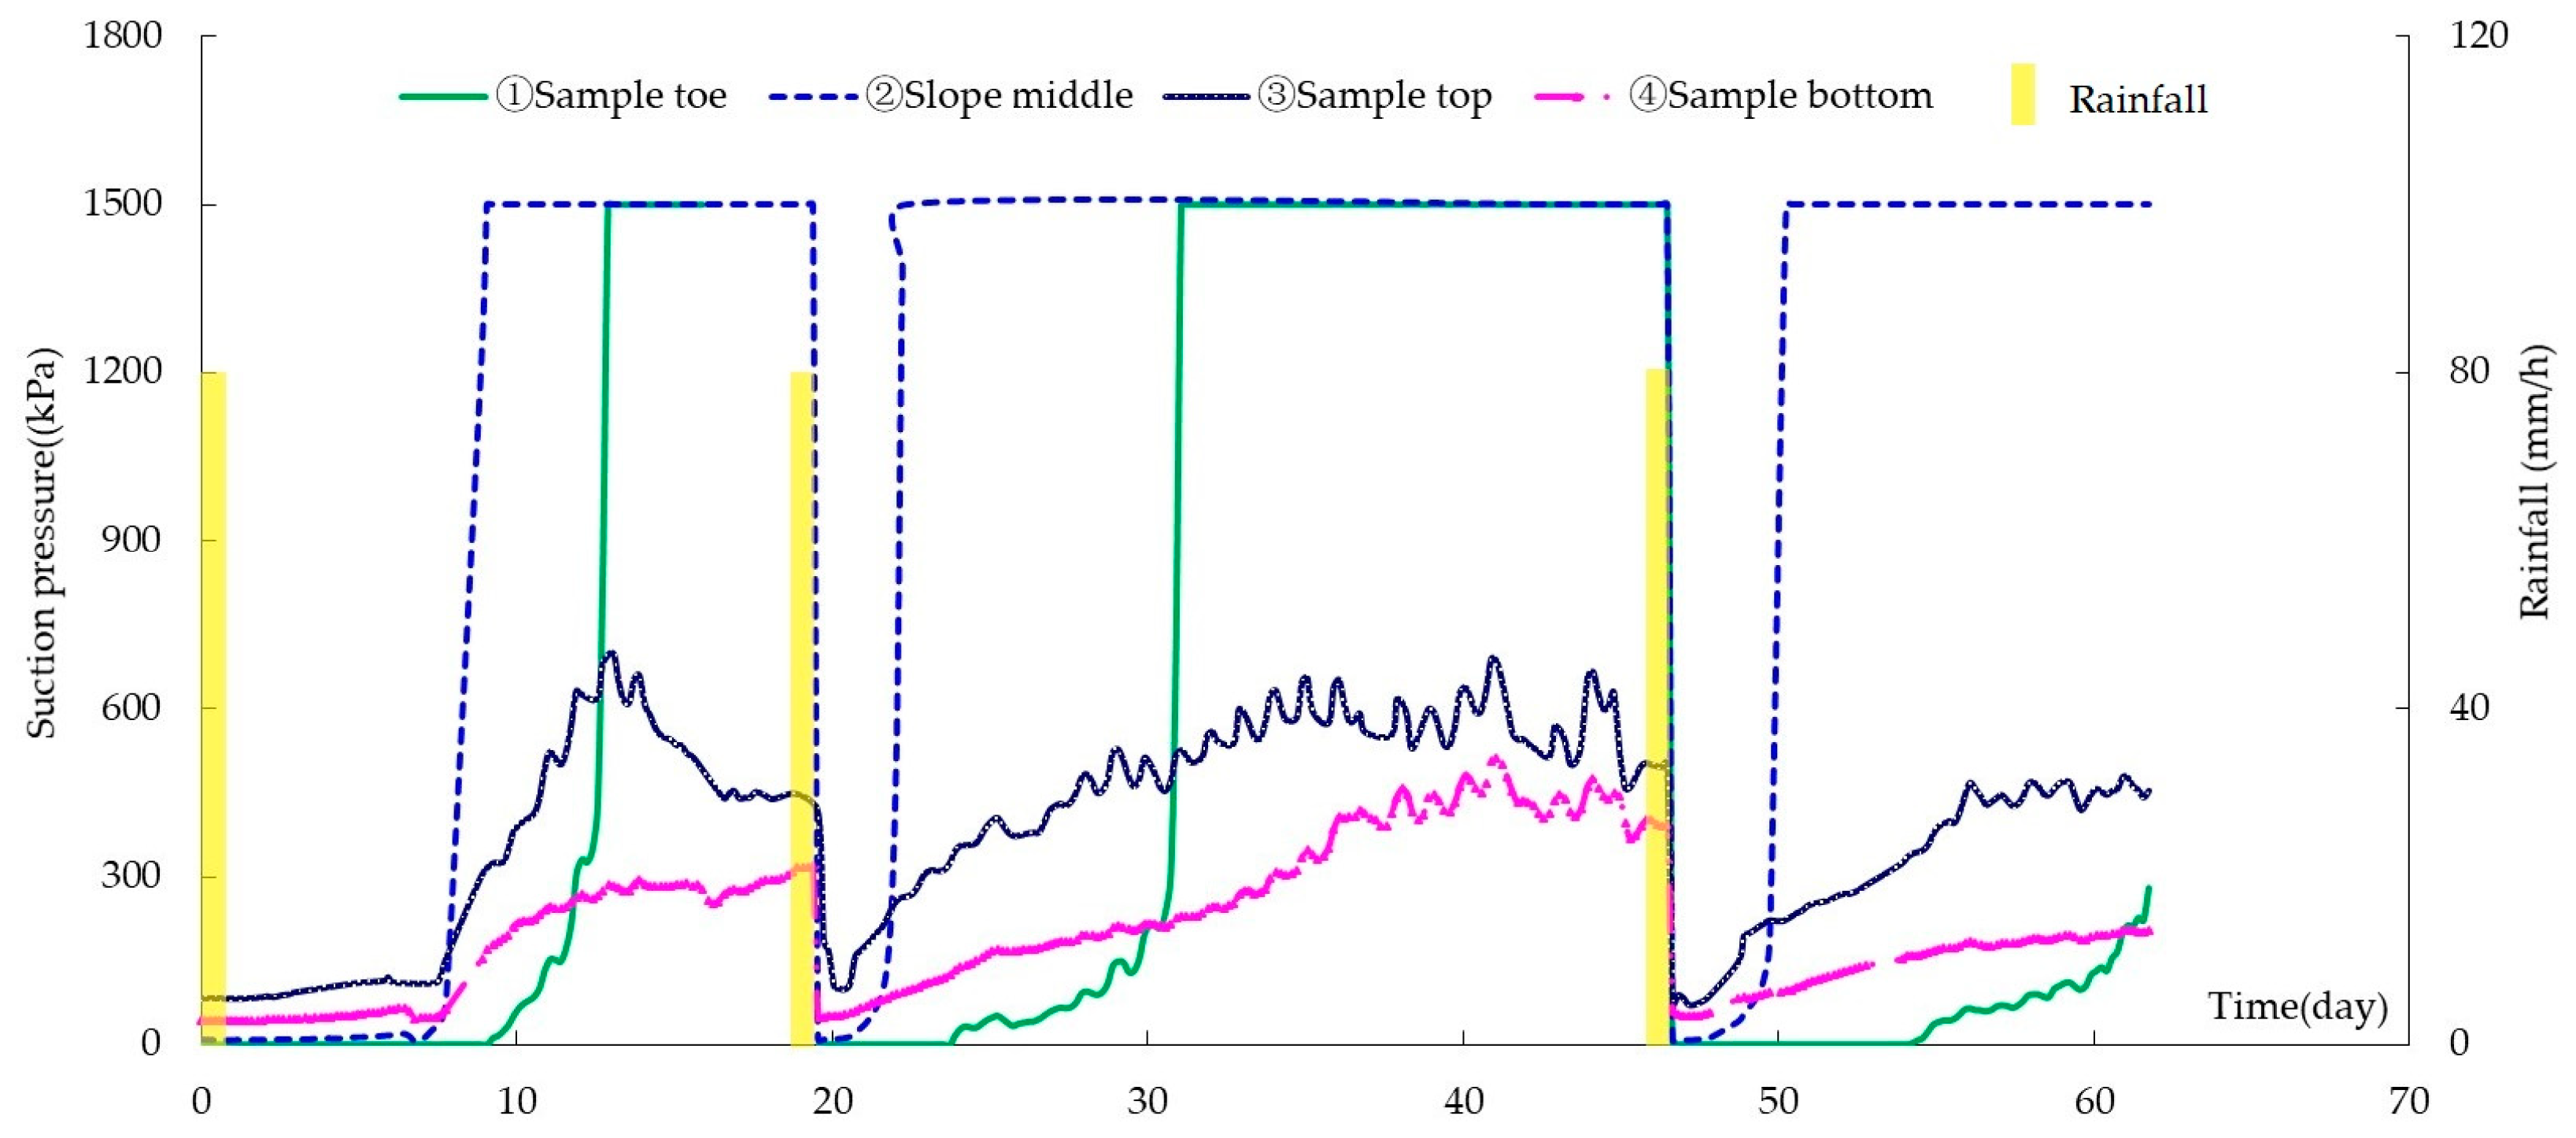
During the test, three cycles of drying and wetting are simulated (as shown in Figure 8). At the beginning, the homogeneous clay sample has no visible surface cracks. After the sample is put into the environment box, artificial rainfall is applied on the first day, and lasts for one hour with a rainfall intensity of 80 mm/h. Afterwards, the sample is dehydrated by light and wind for 19 consecutive days, with the internal temperature kept at about 30 °C. The second (on the 19th day) and third (on the 46th day) rainfall events are similar to the first one. The total test lasts 62 days.
3.2. Test Analysis
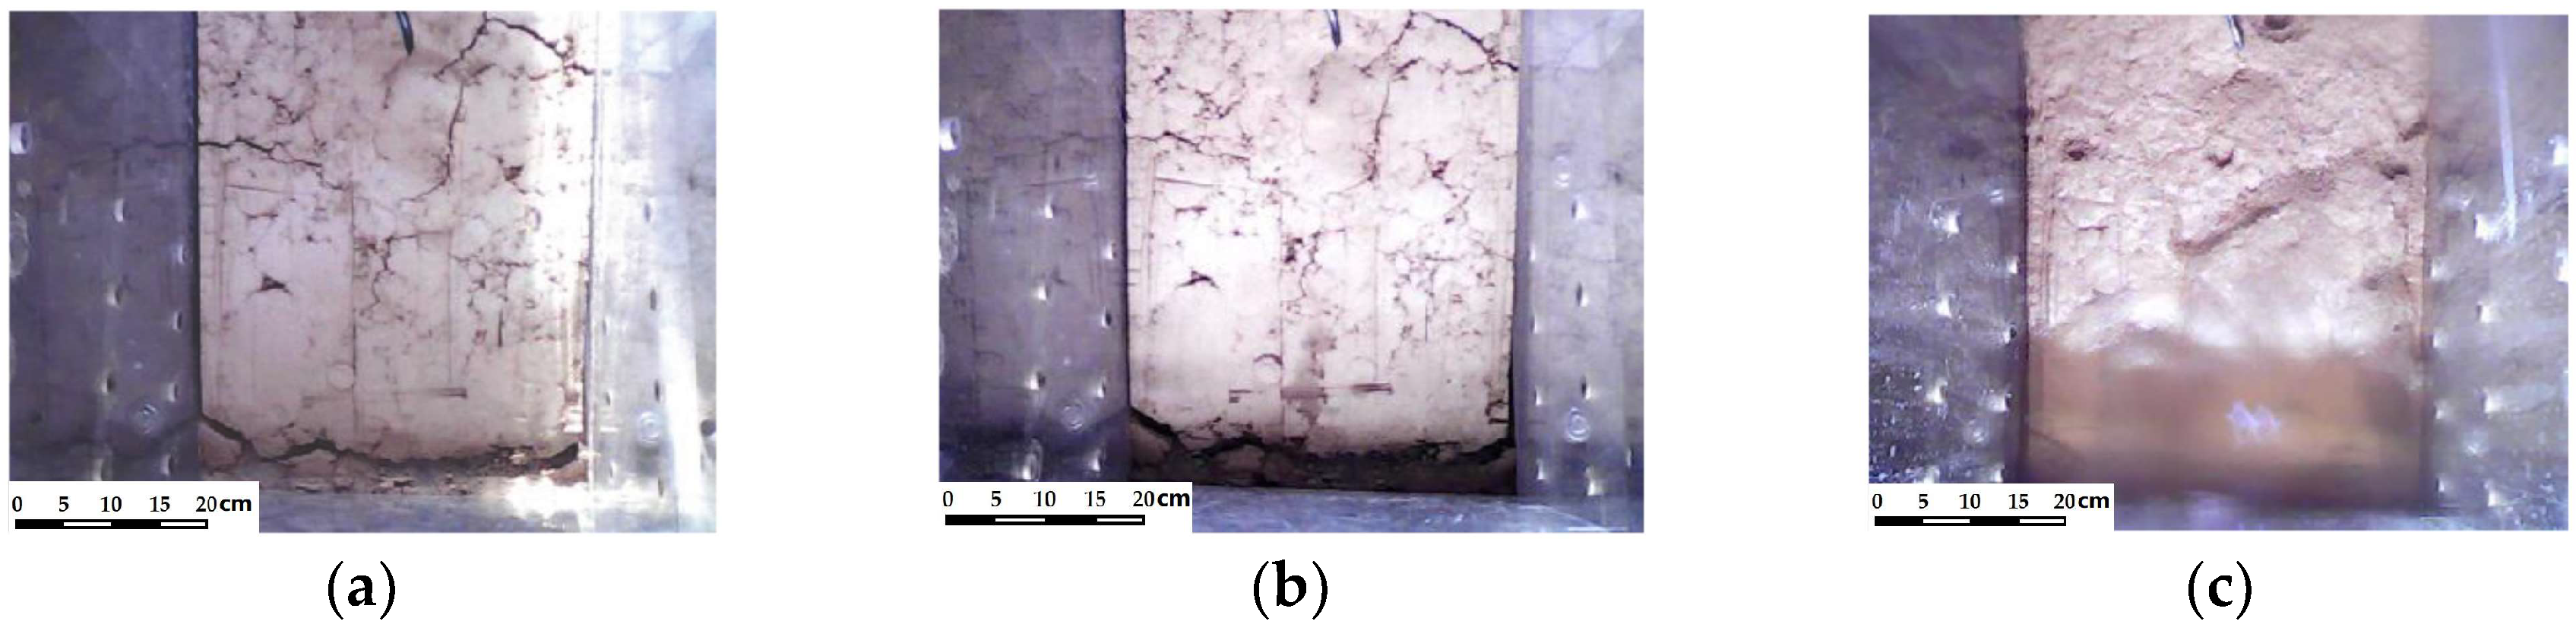
Figure 8 shows suction pressure as a function of time. During the initial several days of the drying process, no surface cracks appear, and the suction pressure increases little. On the seventh day of drying, cracks in the middle of the upstream slope begin to appear (as shown in Figure 9a), which causes the suction pressure at this location (②) to increase to the maximum value of the sensor range (1500 kPa) in a short time. Because water seeped from the top of the sample to the bottom, the water content at the sample toe decreased slowly. Therefore, the growth of suction pressure at the sample toe (①) lagged behind that at the middle of the upstream slope. Toe suction pressure didn’t begin to increase rapidly until the ninth day of drying (data from the sample toe on days 16 to 19 are not shown due to instrument problems). The suction pressure at the sample crest (③) began to increase from the seventh day, but on the 13th day, the suction decreased gradually and stabilized, which is related to the influence of the experimental environment. Because of the slow loss of water at the bottom of the sample (④), the suction growth here lagged behind other locations.
After 19 days of drying, the suction pressure at all four sensors was generally stable, and the width and number of cracks remained unchanged (as shown in Figure 9b). After the second artificial rainfall, the surface cracks on the sample heal (as shown in Figure 9c). The suction pressures recorded by all four sensors dropped steeply, and the suction at the sample heel and the middle of the sample slope are close to 0. Subsequently, as the drying continues, the suction pressure begins to increase gradually. However, the suction pressure increases at a much faster rate than in the first cycle. This may be because the cracks increase the infiltration and water content of the clay sample during the second cycle. The increase of suction pressure at the middle slope sensor is still the fastest, reaching its maximum after two days of drying. The suction pressure at the sample toe reaches its maximum value after about 10 days of drying. The suction pressure increases at the sample crest and the sample base are relatively slow and stabilize after 18 days of drying. Although the clay cracks heal after rainfall, the suction pressure growth is still fast during drying. It can be concluded that even though cracks heal after rain, the clay particles in the area of prior cracking could not bind together with cohesive force. New cracks appear quickly when the soil suffers from drought again, and the water content in the vicinity of the cracks decreases rapidly. During the third wet-dry cycle, the behavior of suction pressure in all parts of the sample are similar to that of the second wet-dry cycle.
The test results show the main damage mode to the clay slope due to severe drought is cracking. Evaporation from the clay causes suction pressure to increase gradually; due to different water loss rates, each part of the sample experiences different rates of pore pressure increase. From Figure 8, it is seen that cracks in the middle of the upstream slope are the first to appear after the beginning of the dry period, as suction pressure increases most rapidly here. After rainfall, the suction pressure decreases rapidly, indicating that the clay has a self-healing ability under the action of saturation [19]. However, cracks from the earlier drying stage could not completely heal, which increases the hydraulic conductivity once the soil has suffered from drought again [20]. In terms of engineering safety, short-term drought leads to cracking of the dam surface but doesn’t affect the deep stability of the dam slope. However, long-term drought causes deeper cracks and induces a sharp increase of suction pressure; these cracks may become channels for rain infiltration into the dam, causing rapid decrease of slope soil strength and slope stability. After repeated dry-wet cycles, dry shrinkage cracks in the clay may partially close during subsequent rainfall, but the cohesive force cannot be restored, leading to a latent defect in dam slope stability. Therefore, cracks in the dam should be treated well during the drought period, especially long-term drought (Figure 5), and in situ measurement of suction pressure is recommended to track changes in soil characteristics [6].
4. Model Calculation of Seepage through Dam during Dry-Wet Cycles
4.1. Finite Element Model (FEM) and Material Parameters
Based on a typical profile of the dam, a simplified finite element model (Autobank 7.7 developed by Hohai University) of 1378 elements and 1469 nodes, is set up as shown in Figure 10 for further seepage calculation under rapid changes of reservoir water level. In order to facilitate modeling, two clay layers, sand and gravel layers are treated as one separately, and some border (drainage sand belt) are simplified. The average size of the elements is approximately 1.5 m, which is sufficient for project requirements [21]. The main physical and mechanical parameters of the dam material, which come from previous test results [22], are shown in Table 1. The strength index of clay material is determined via the Mohr-Coulomb strength criterion. Based on the actual situation (Figure 4), a simulated zone of cracking is located between elevations of 97.28 m and 100.00 m on the upstream slope; the depth of the cracking zone is 1.0m. It is shown by Li et al. [23] that for sandy loam and clay, the contribution of cracks to the permeability of the cracked zone is not less than 99%; therefore, we set the permeability coefficient of the cracking zone 100 times higher than clay without cracks (Table 1) to simulate the influence of cracks on dam seepage.
The permeability coefficient of unsaturated soil depends on the water content. For unsaturated soil, the seepage path of water becomes more tortuous because of air filling the pores, which also leads to a decrease of the permeability coefficient. The volumetric water content is a function of the suction pressure. Therefore, it is necessary to determine how the permeability coefficient varies with the suction pressure for unsaturated seepage [17]. The permeability coefficient is predicted by the soil-water characteristic curve because the permeability coefficient of unsaturated soil is more difficult to obtain by experiment.
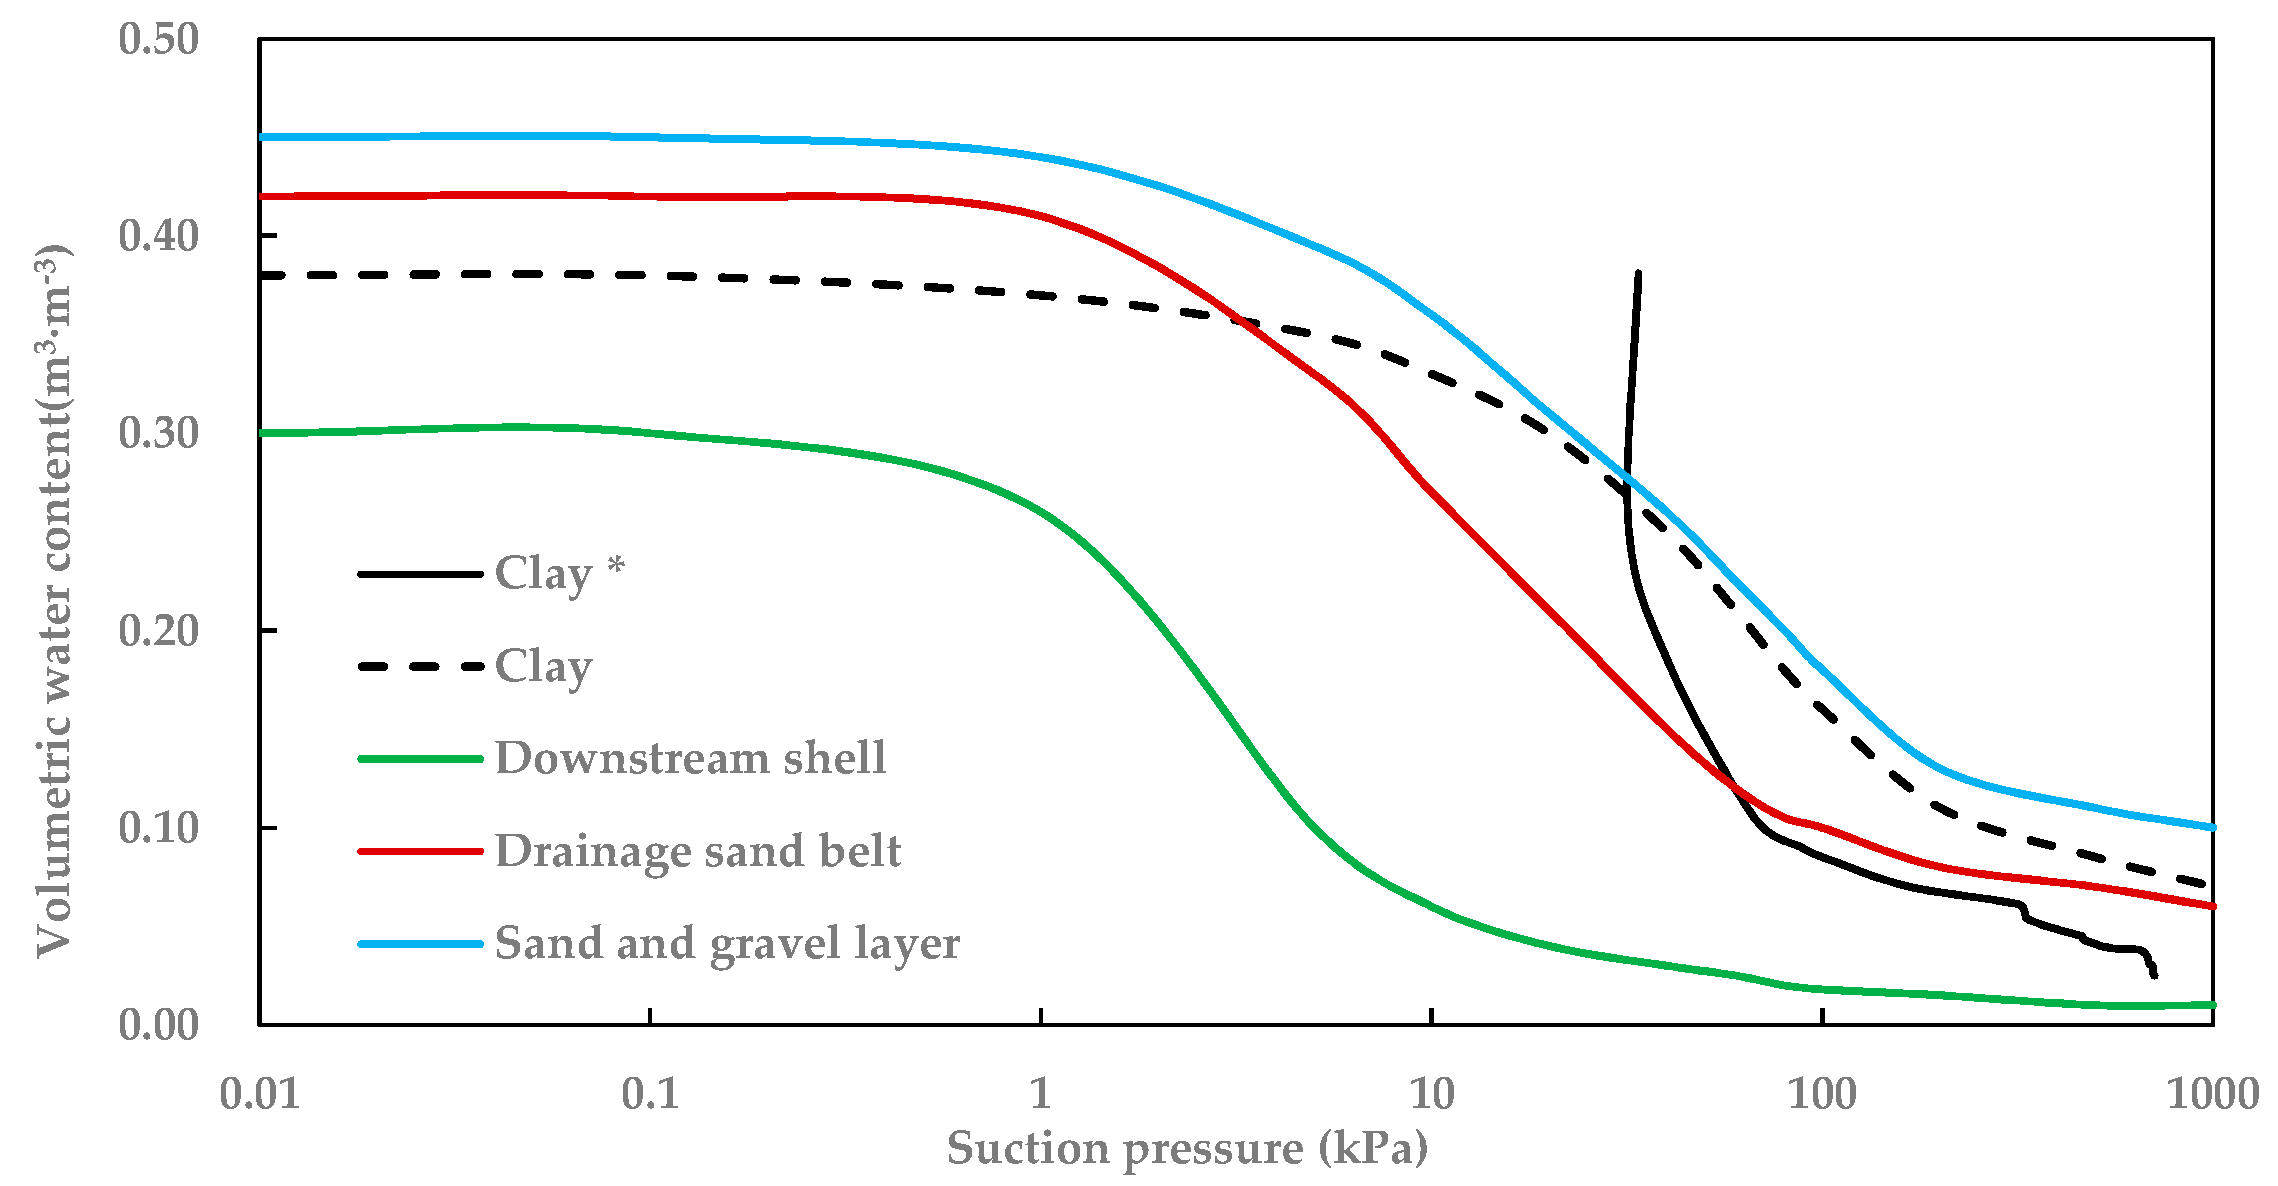
The soil-water characteristic curves of the dam materials are shown in Figure 11. For this dam-fill clay, considering the effect of many dry-wet cycles during the actual operation of the dam, the soil-water characteristic curve of clay (clay* in Figure 11), which is also used in further calculations, is drawn from measured data on the middle of the upstream slope of the sample during the third drying stage. The soil-water characteristic curves of other materials are from sample functions [24]. Because the curves for clay (clay* and clay in Figure 11) are obtained from different samples with different equipment, they are not identical.
The Van Genuchten model [25] is used to estimate the permeability coefficient curve of different materials according to the soil-water characteristic curve. First, the model fits the soil water characteristic curve with Equation (1)
in which, is the dimensionless water content variable, also called the effective saturation; is the volumetric water content; are the saturated water content and the residual water content (%); are the fitting parameters, for clay the values are 0.107, 0.49, 1.98 respectively; and is the suction pressure. Second, the model estimates the permeability coefficient curve, Equation (2), based on the volumetric water content function and saturated permeability coefficient ks.
4.2. Calculation Condition
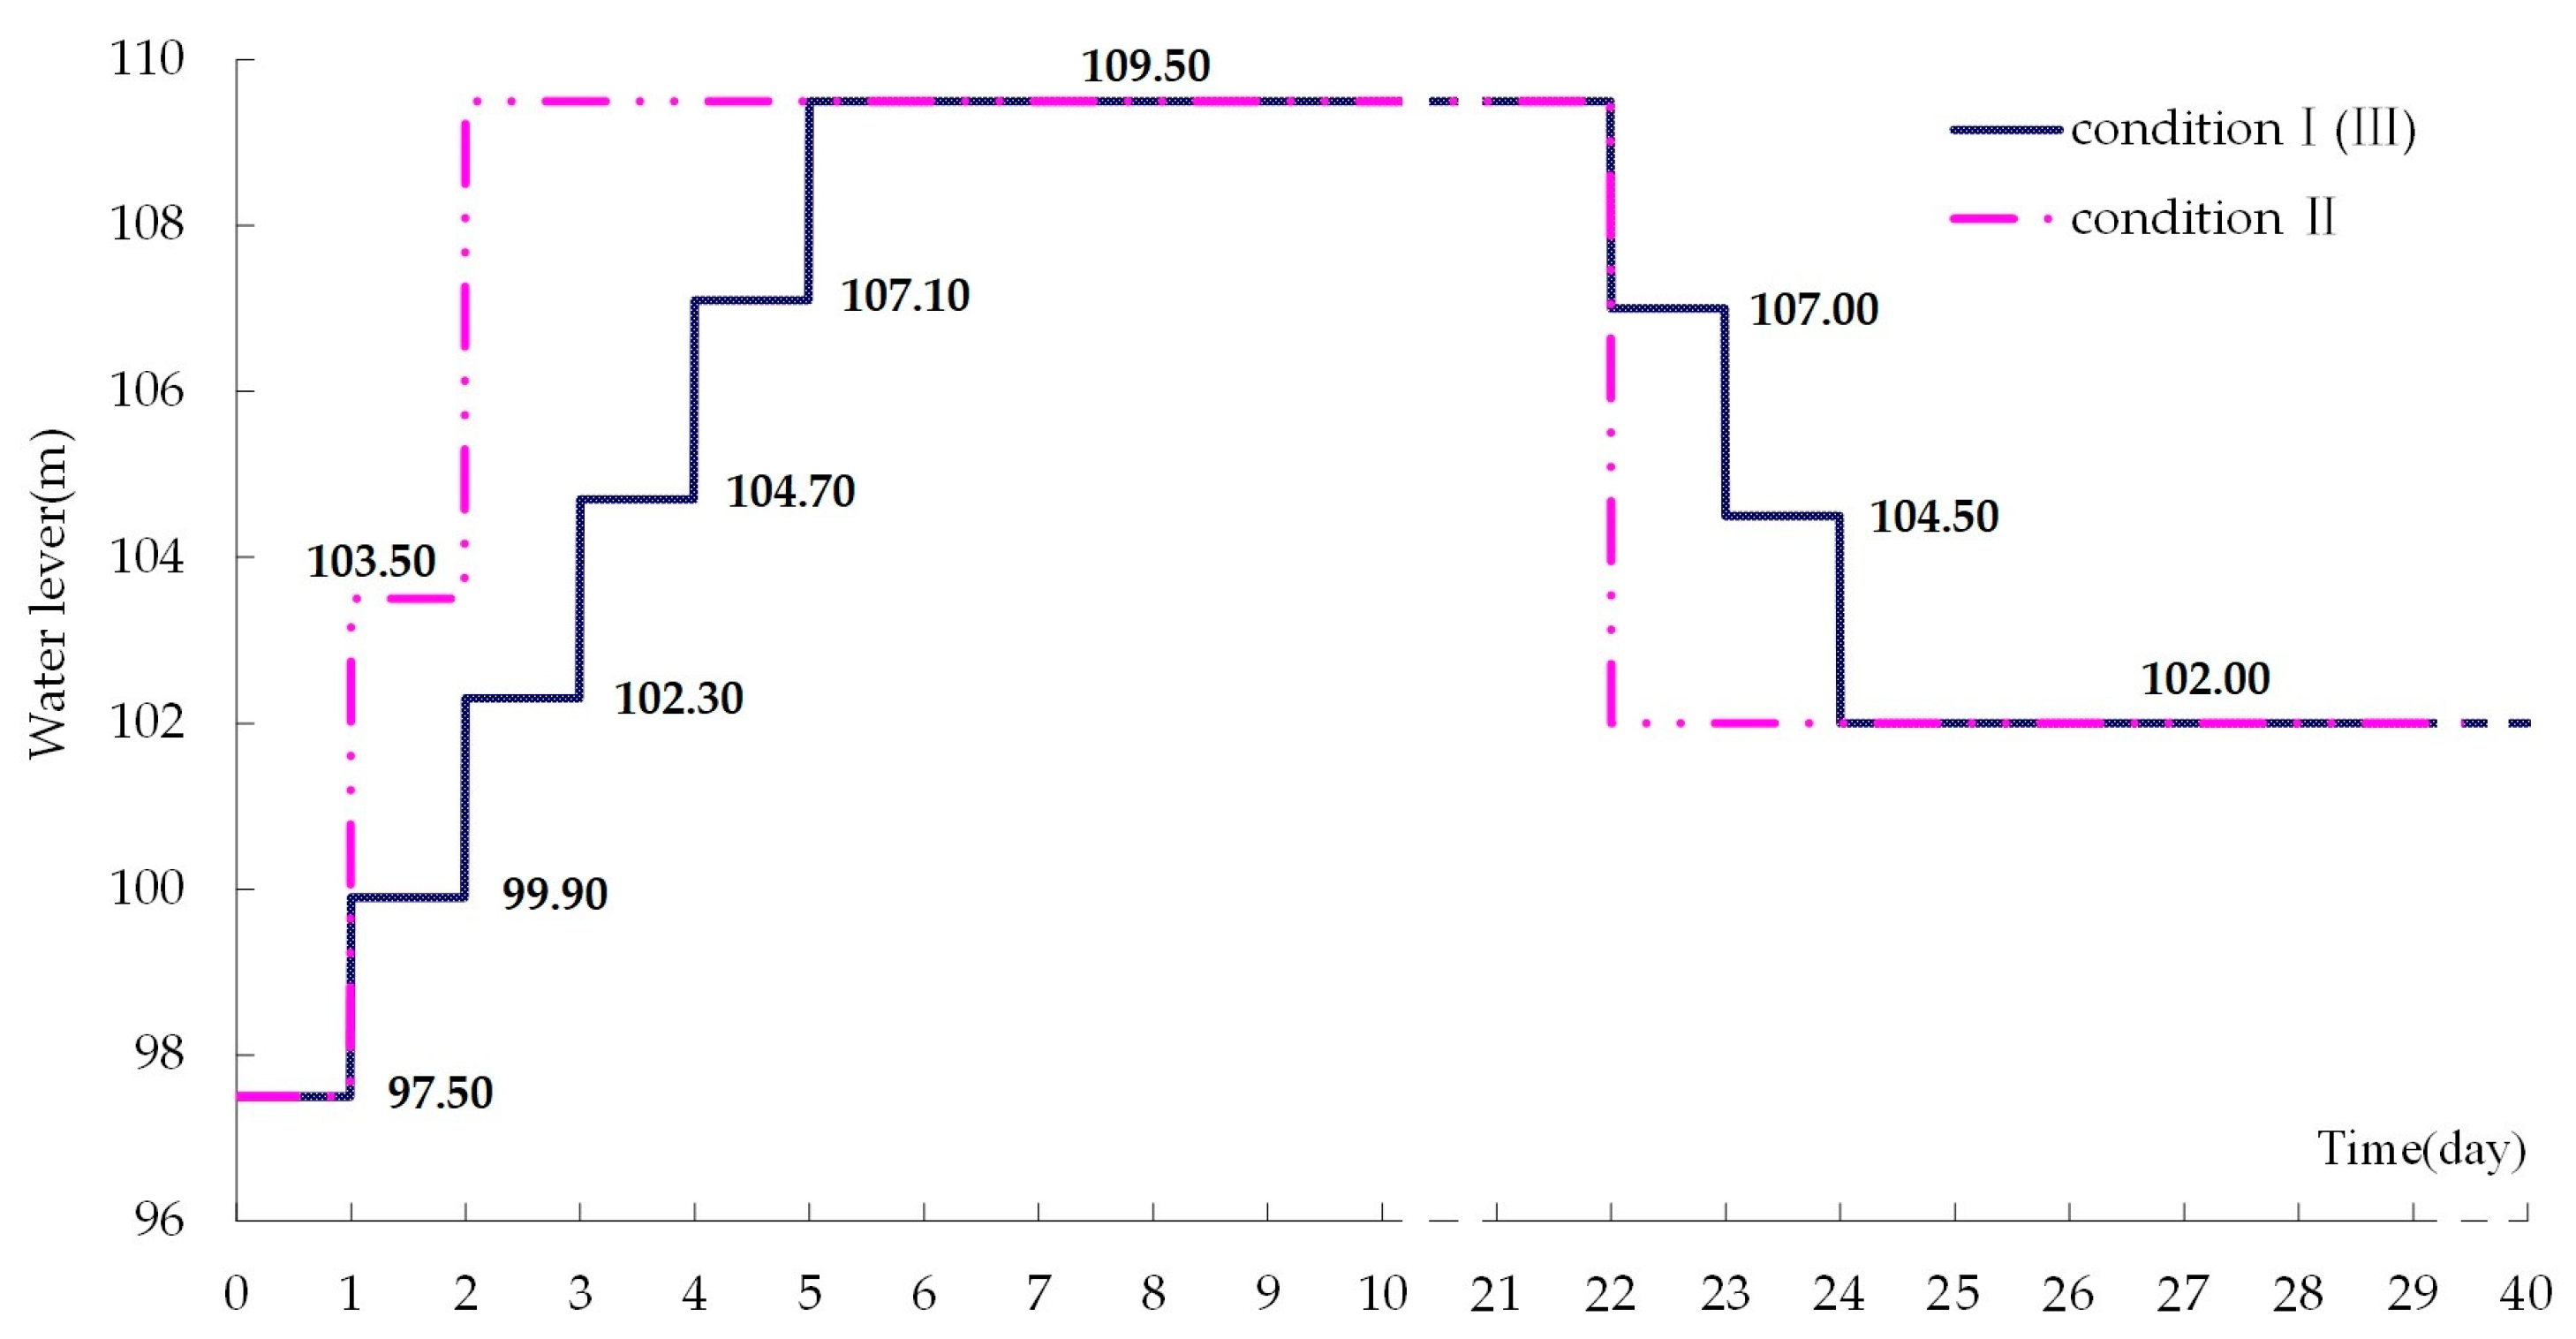
Based on the hydrological characteristics of the reservoir, the calculation considers extreme changes of water level from drought to flood, so both saturation and water head vary with seepage through the dam [26]. The reservoir water levels analyzed are shown in Figure 12. These assumed conditions are not common in normal dam operation but could become more relevant as result of more intense droughts and floods as a result of climate change.
Condition I (shown in dark blue): Taking steady seepage with an initial reservoir water level of 97.50 m (dead water level) as the initial state, then raising the water level to 109.50 m (flood water level) within five days (+2.4 m/d). After reaching steady seepage at water level 109.50 m (day 21), then lowering the water level rapidly to 102.00 m (limited water level in the flood season) within three days (−2.5 m/d), and ending with steady seepage at water level 102.00 m (day 40). The downstream water level is 92.80 m, which is also the elevation of the downstream slope toe.
Condition II (shown in pink): Taking the same steady seepage at a water level of 97.50 m as the initial state, then raising the water level to 109.50 m within two days (+6.0 m/d), after reaching steady state seepage at water level 109.50 m, then lowering the water level rapidly to 102.00 m within one day (−7.5 m/d), and ending with steady seepage.
Condition I and Condition II do not consider cracking of the clay. Condition III uses the same reservoir water levels as Condition I but uses the permeability coefficient of clay with cracks (Table 1) in the zone of cracking.
4.3. Phreatic Line Analysis
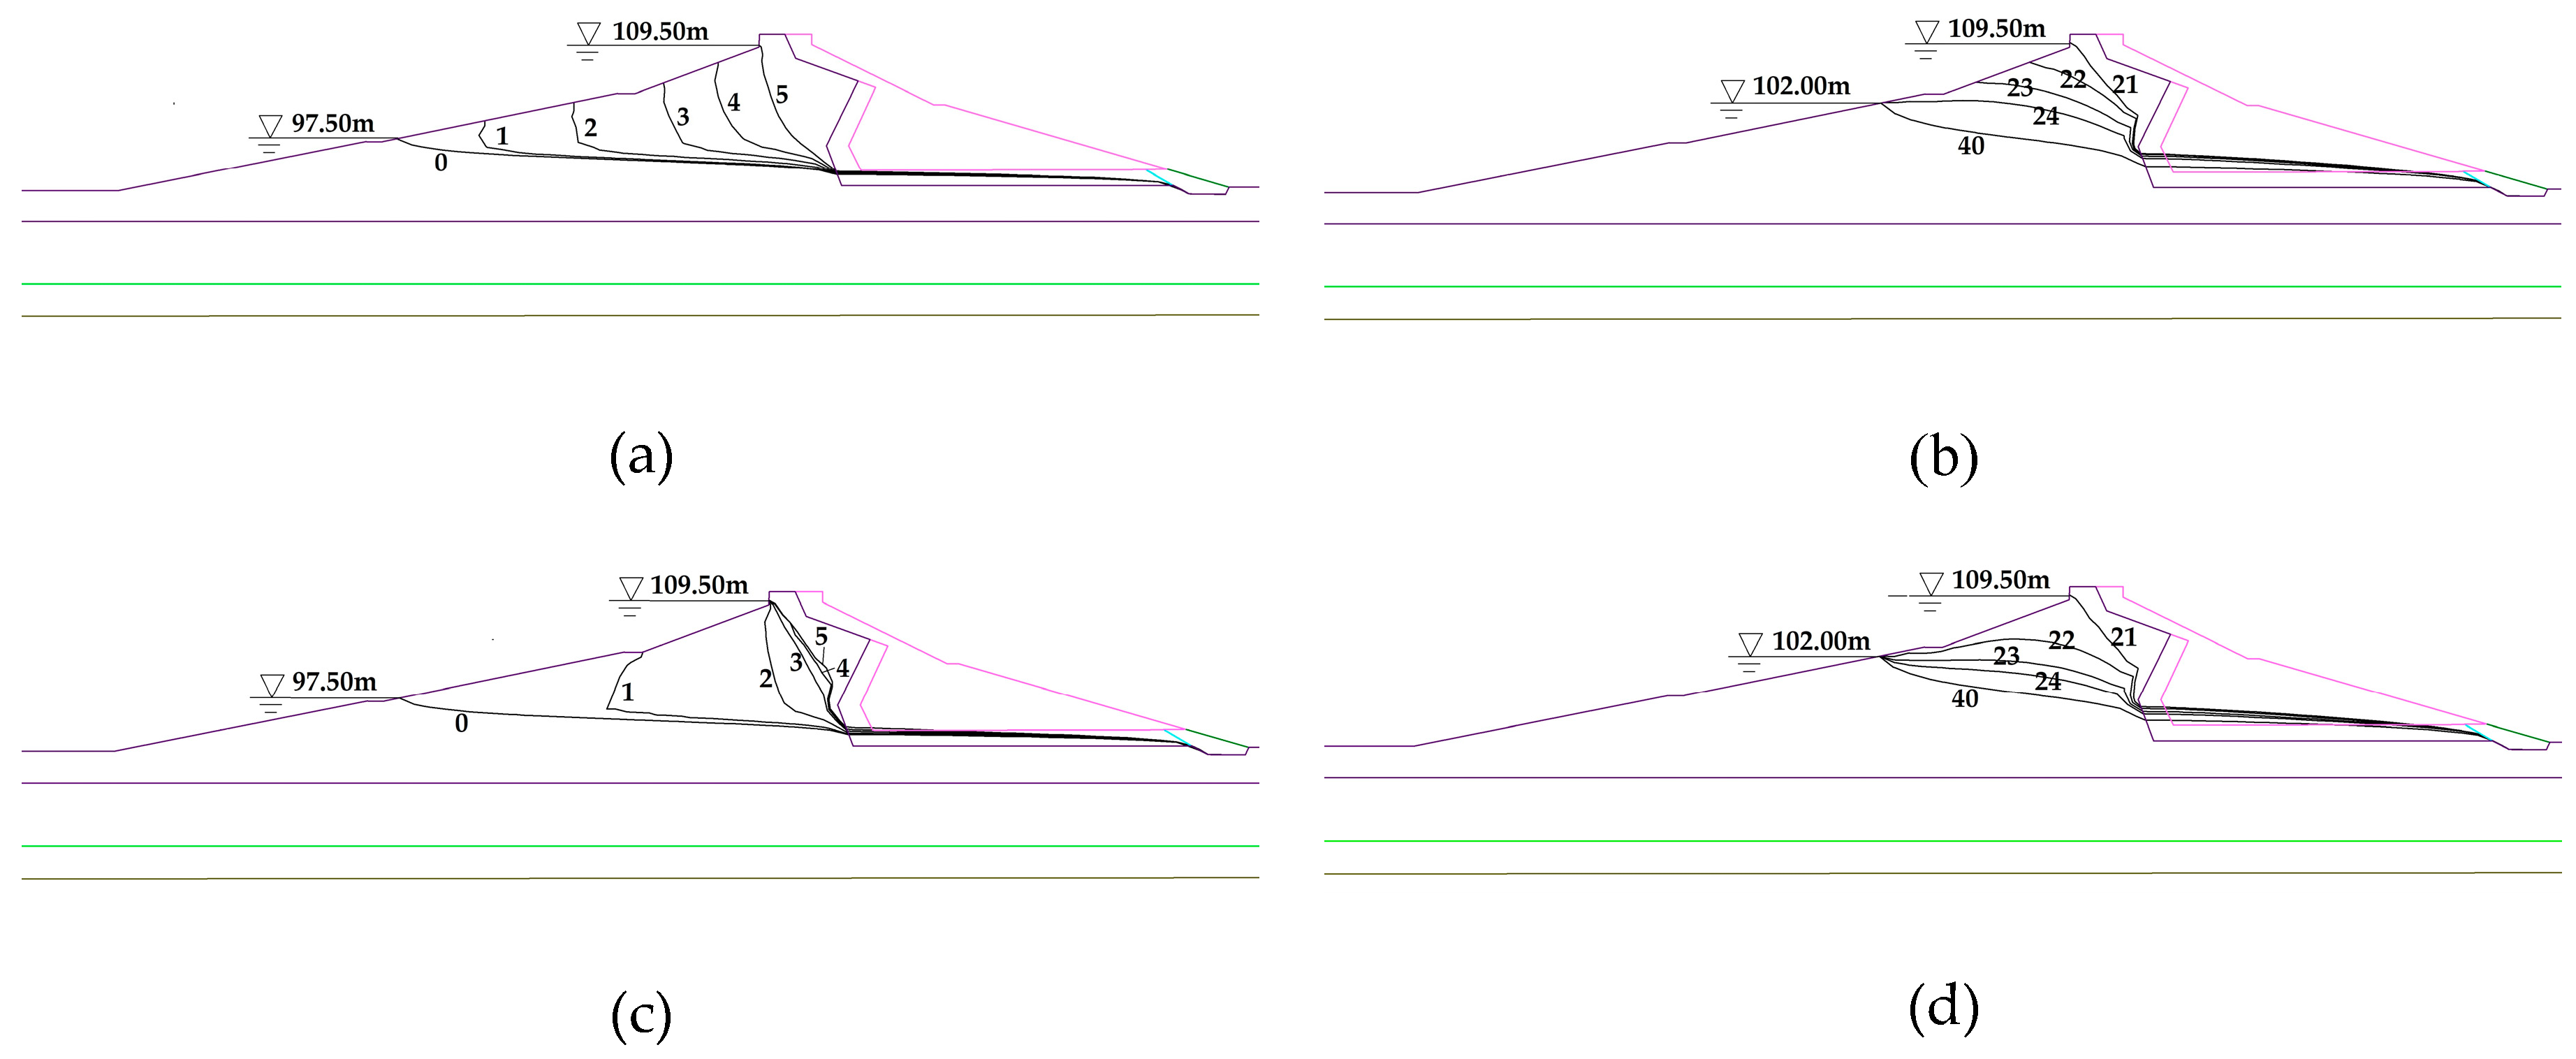
As the reservoir water level rises, the phreatic line of the dam is shown in Figure 13a,c. The height of the phreatic line in the dam gradually rises with the increase of reservoir water level. Due to the rapid rise of the water level and the low permeability of the clay, the zone below the steady phreatic line can’t be saturated rapidly, so the phreatic line is bent upstream. The phreatic line during unsteady seepage above the initial steady state in the dam is curved, and the faster the rise of the water level, the greater the curvature. The curvature of the phreatic line tends to decrease gradually as the rate of water level rise decreases. Variation of the phreatic line landward of the drain sand layer is very small because of the high permeability of the drain sand layer.
During the reservoir drawdown stage, the phreatic line of the dam is shown in Figure 13b,d. The height of the phreatic line gradually decreases with the decline of reservoir water level. As the water level drops rapidly, the water retention capacity of clay prevents the water inside the dam from discharging completely. Therefore, the phreatic line drops slower than the water level, and an unsaturated zone also exists, which makes the front half of the phreatic line convex up; the curvature is more obvious with the increase of the water level drawdown rate. During rapid drawdown, the pore water pressure in the upstream section of the dam is not fully dissipated when the reservoir water level drops, and the upstream slope experiences reverse seepage flow, which is detrimental to the stability of this slope. As the reservoir water level stabilizes, the excess pore water pressure dissipates rapidly, and the curvature of the phreatic line decreases. Variation of the phreatic line landward of the drain sand layer is minor.
4.4. Equipotential Line and Pore Pressure Gradient Analysis
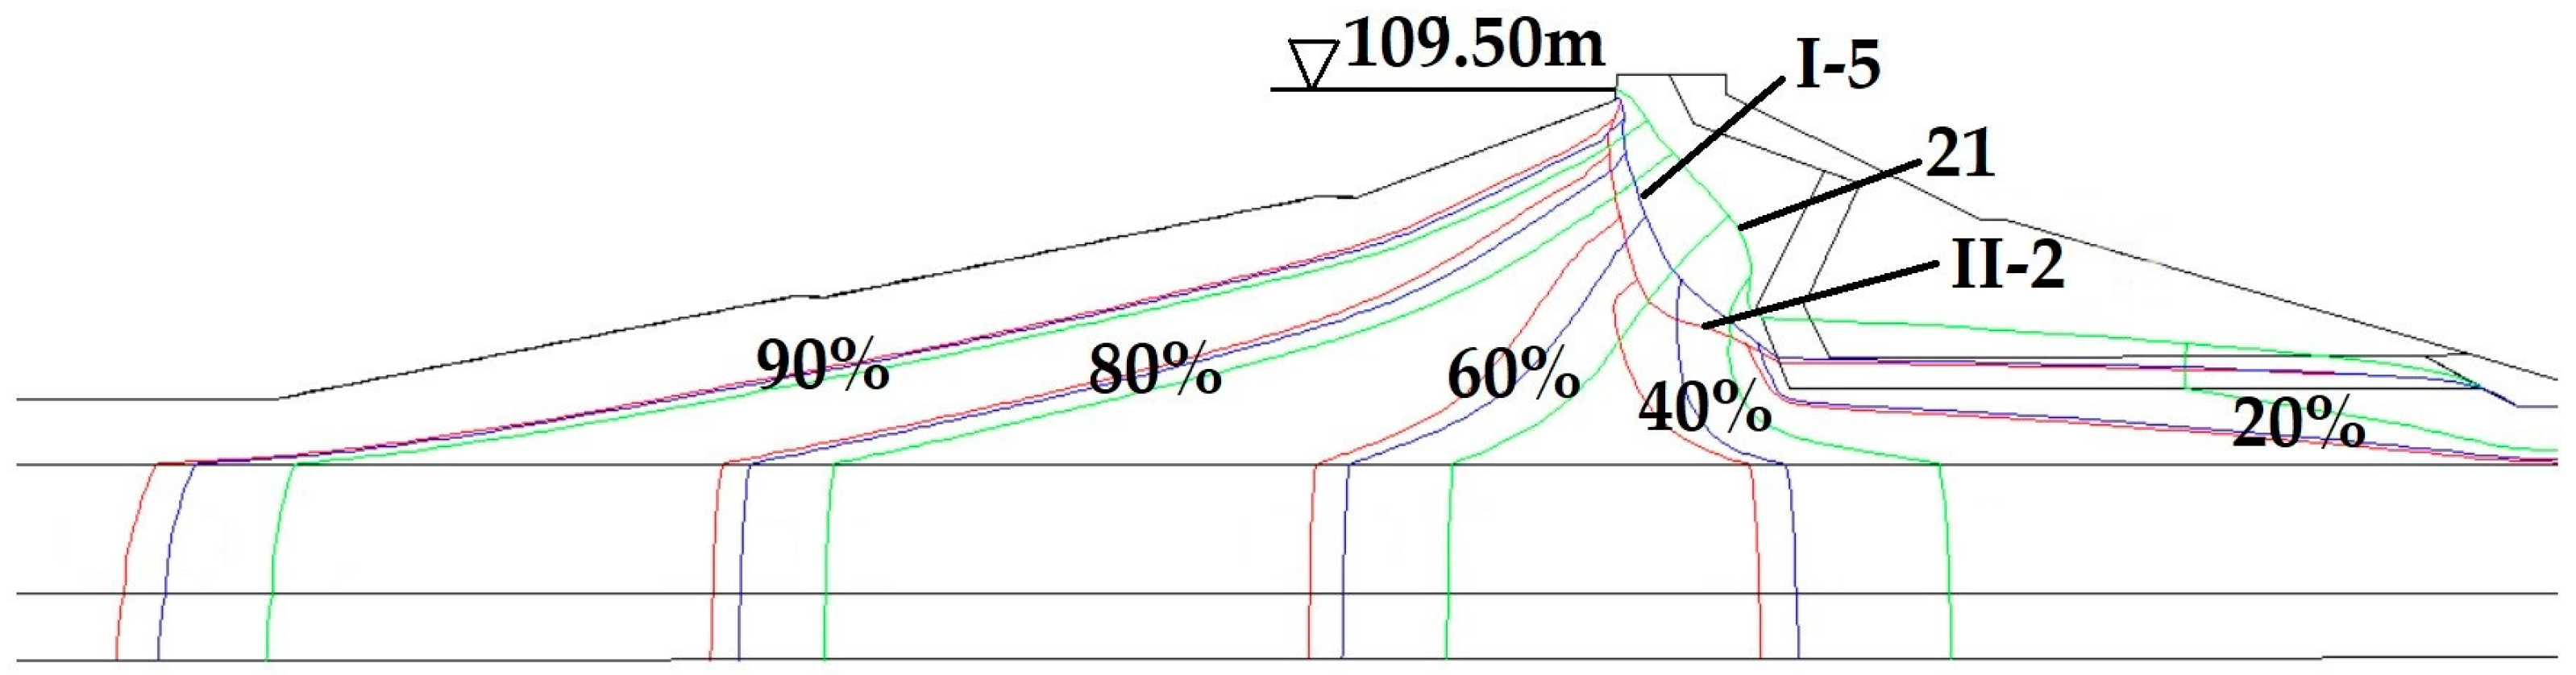
The seepage fields are steady at day 0, day 21, and day 40 in the simulation. From the steady phreatic line of day 21 (Figure 14 line 21(A)), it can be seen that the water height is reduced by more than 60% by the drainage belt. In the case of high-water level, the equipotential lines are most dense in the transition band of the clay and downstream shell (drainage sand belt), which is the site of the maximum pore pressure gradient. However, the upstream bed blanket is critical to internal erosion because of the thin clay layer and its sand foundation.
At the time of maximum water level of 109.50 m, the corresponding pore pressure gradient in the dam is largest, which is the most critical state for dam seepage. The unsteady seepage field and the distribution of equipotential lines in the dam with the same 109.50m reservoir water level under different conditions are shown in Figure 14 (for example, Condition I-5 means day 5 in condition I). The faster the water level rise, the larger the unstable percolation area is and the denser the distribution of the equipotential lines; this state may cause internal erosion of these critical areas.
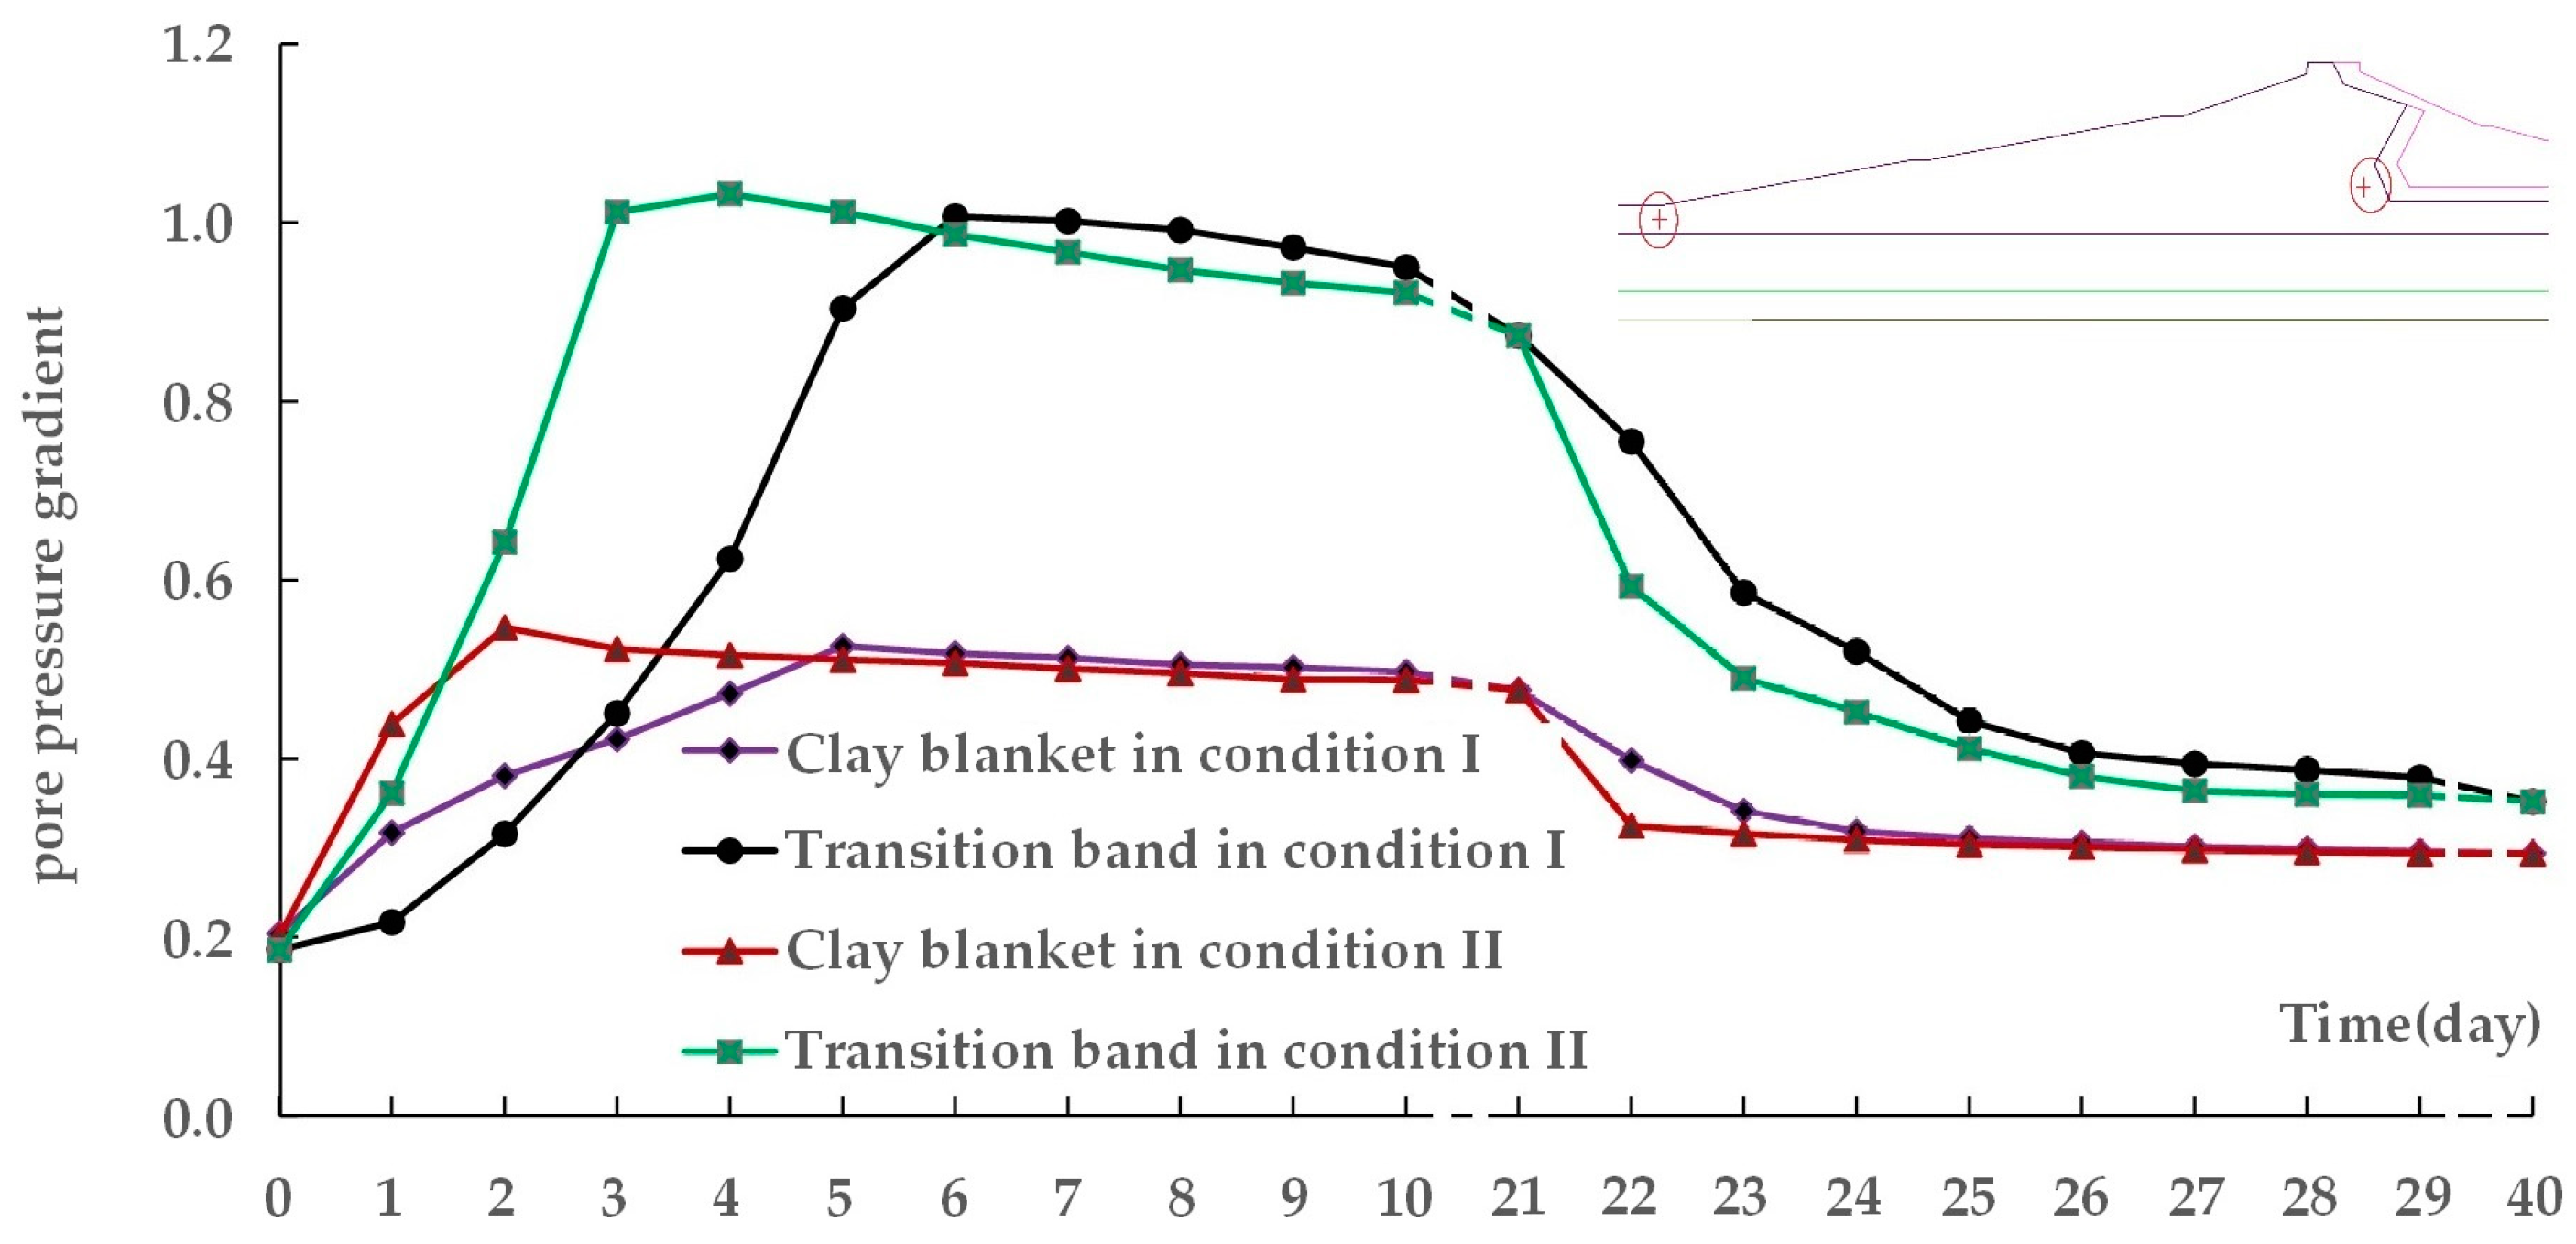
The pore pressure gradient at two key locations (the section of the clay body bordered by the transition band, and the upstream bed blanket) are shown in Figure 15 at different times. The pore pressure gradient increases with rising water level, and the gradient reaches a maximum when the water level is highest. The pore pressure gradient is larger than that of the stable seepage field at the same water level as water level rises, and the faster the water level rises the larger the gradient is. From Figure 14, it can also be seen that the equipotential lines for unsteady seepage are shifted upstream compared to the stable seepage field under the same water level, and the faster the reservoir water level rises the more the upstream offset of the equipotential lines. This is mainly because the movement of the phreatic line near the downstream shell is slow and minor, while the increased seepage pressure head is borne by the upstream clay during the stage of rapidly rising water level. Similarly, there is a lag in the reduction of seepage head during rapid drawdown.
In the upstream bed blanket, there is an increasing pore pressure gradient during the stage of rapidly rising water level. If the water level rises too fast and the gradation of the dam base sand is not optimal, internal erosion may occur in the bed blanket, causing failure of the seepage prevention layer, and resulting in the onset of piping through the dam foundation.
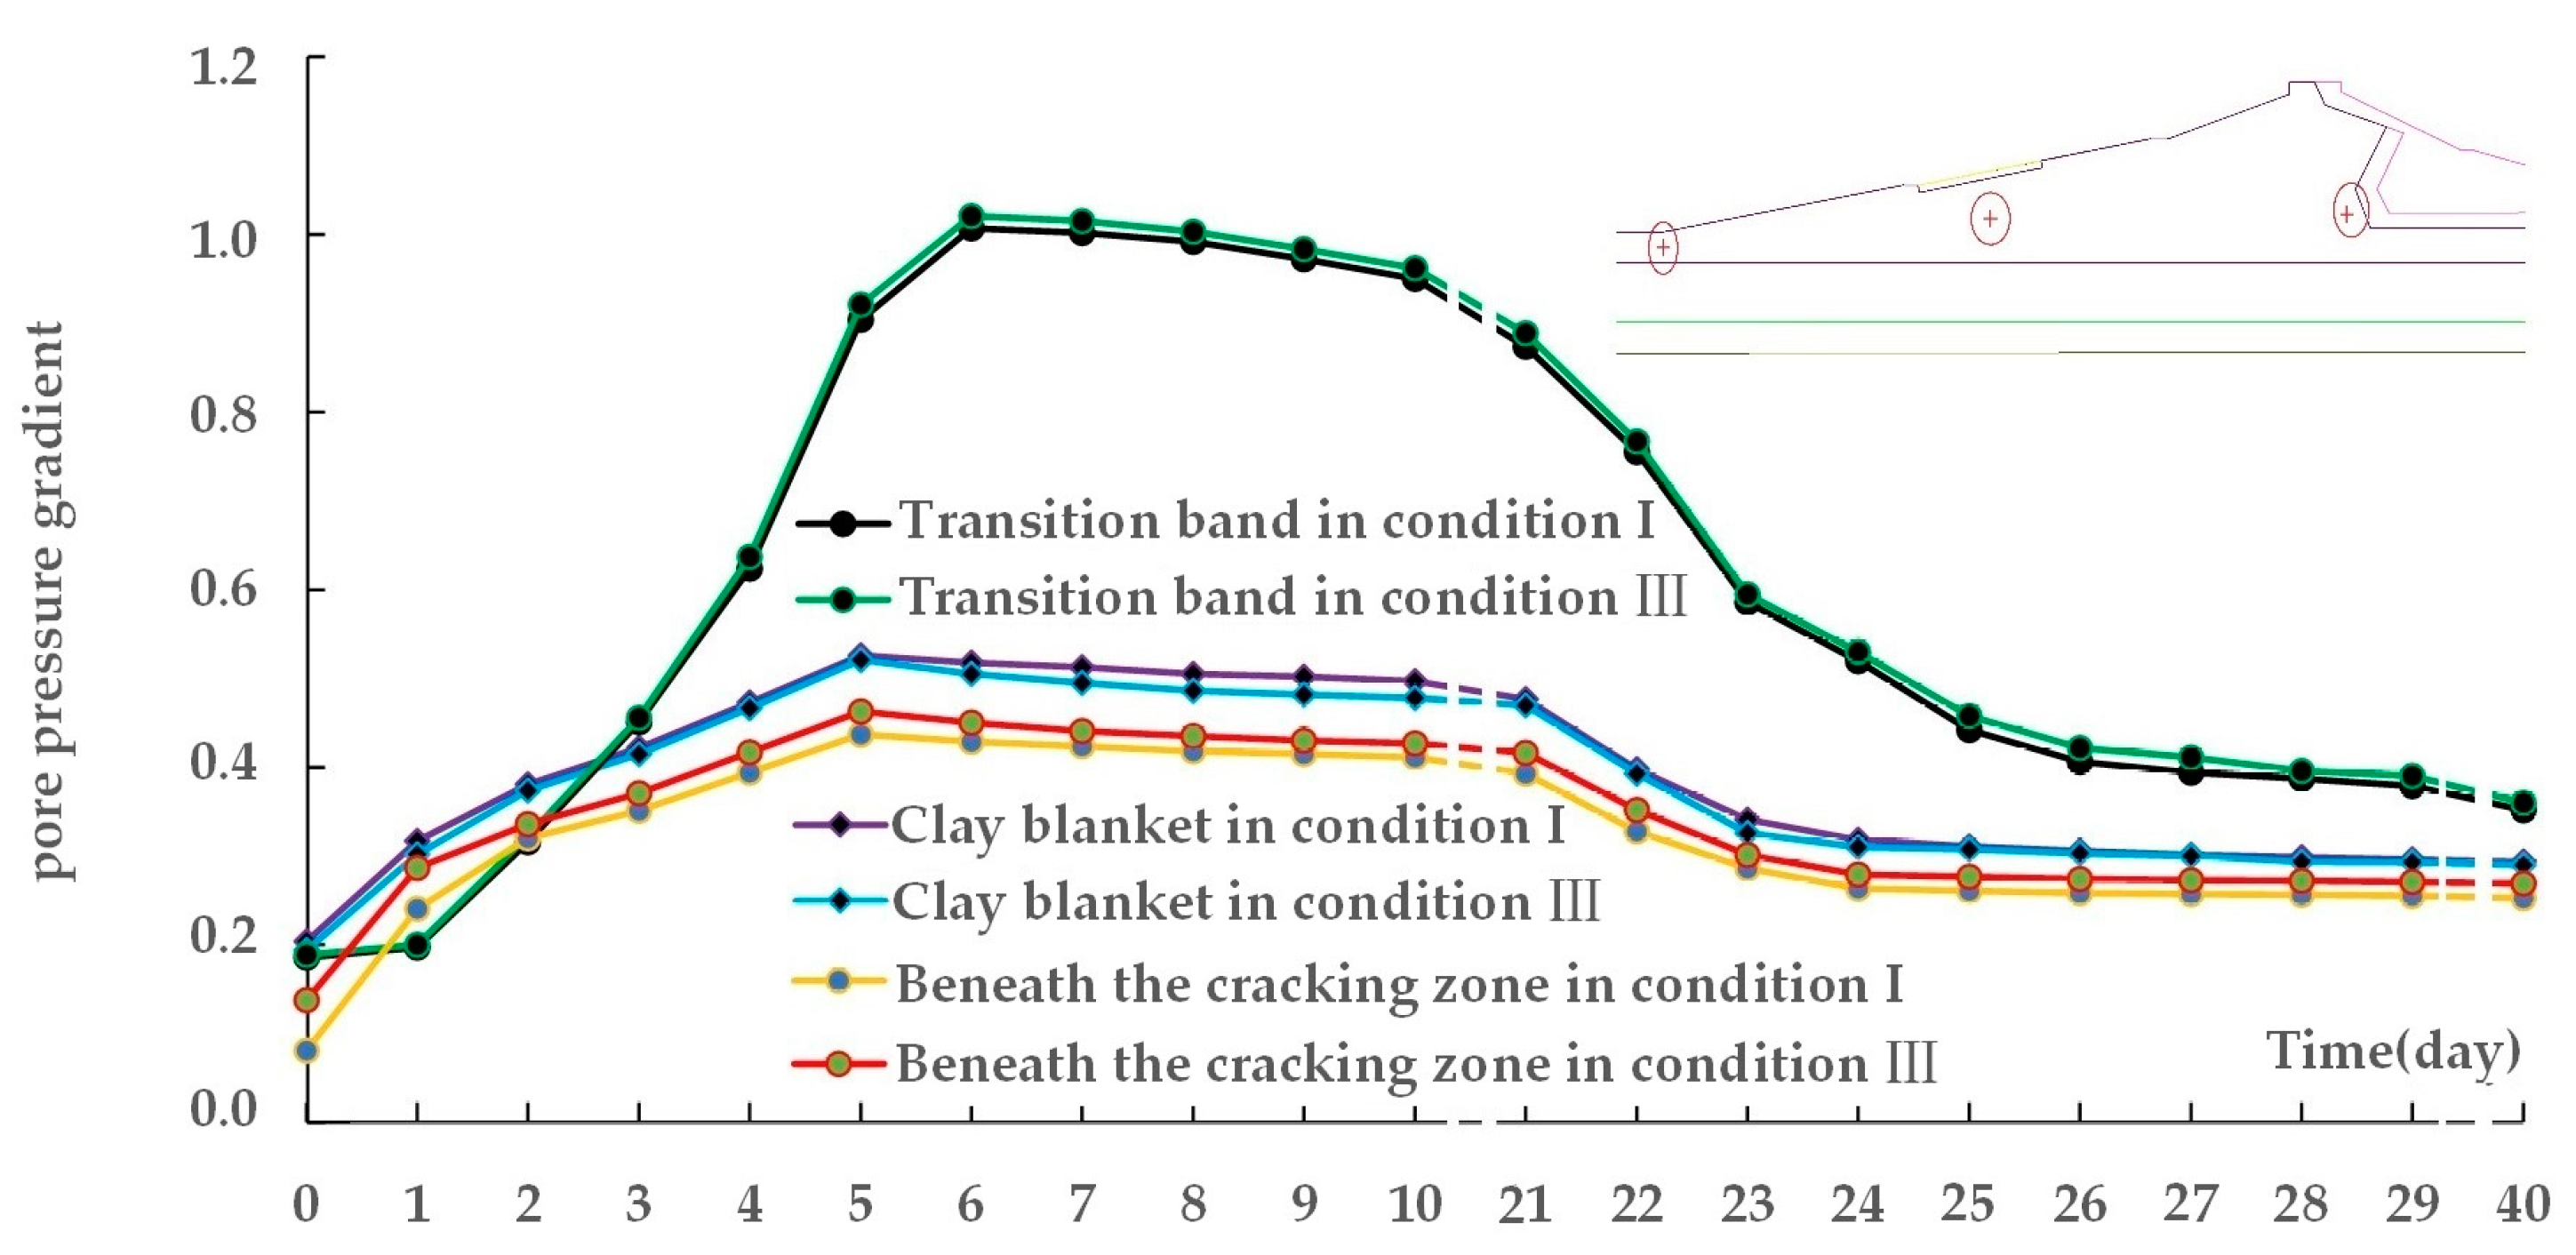
Figure 16 shows the influence of cracks on pore pressure gradient at three locations (the section of the clay body bordered by the transition band, the upstream bed blanket, and the zone beneath the cracks). Because the cracking zone is far away from the transition band and clay blanket, cracks have little effect on the pore pressure gradient at these two key locations during reservoir filling. However, the zone under the cracks experiences a slightly stronger pore pressure gradient. At the time of maximum water level of 109.50 m, the corresponding largest pore pressure gradient changes from 0.437 to 0.463 there; this is an increase of 5.9%. This indicates that crack formation in the upstream bed blanket could exacerbate internal erosion and may cause seepage failure.
4.5. Embankment Slope Stability Analysis
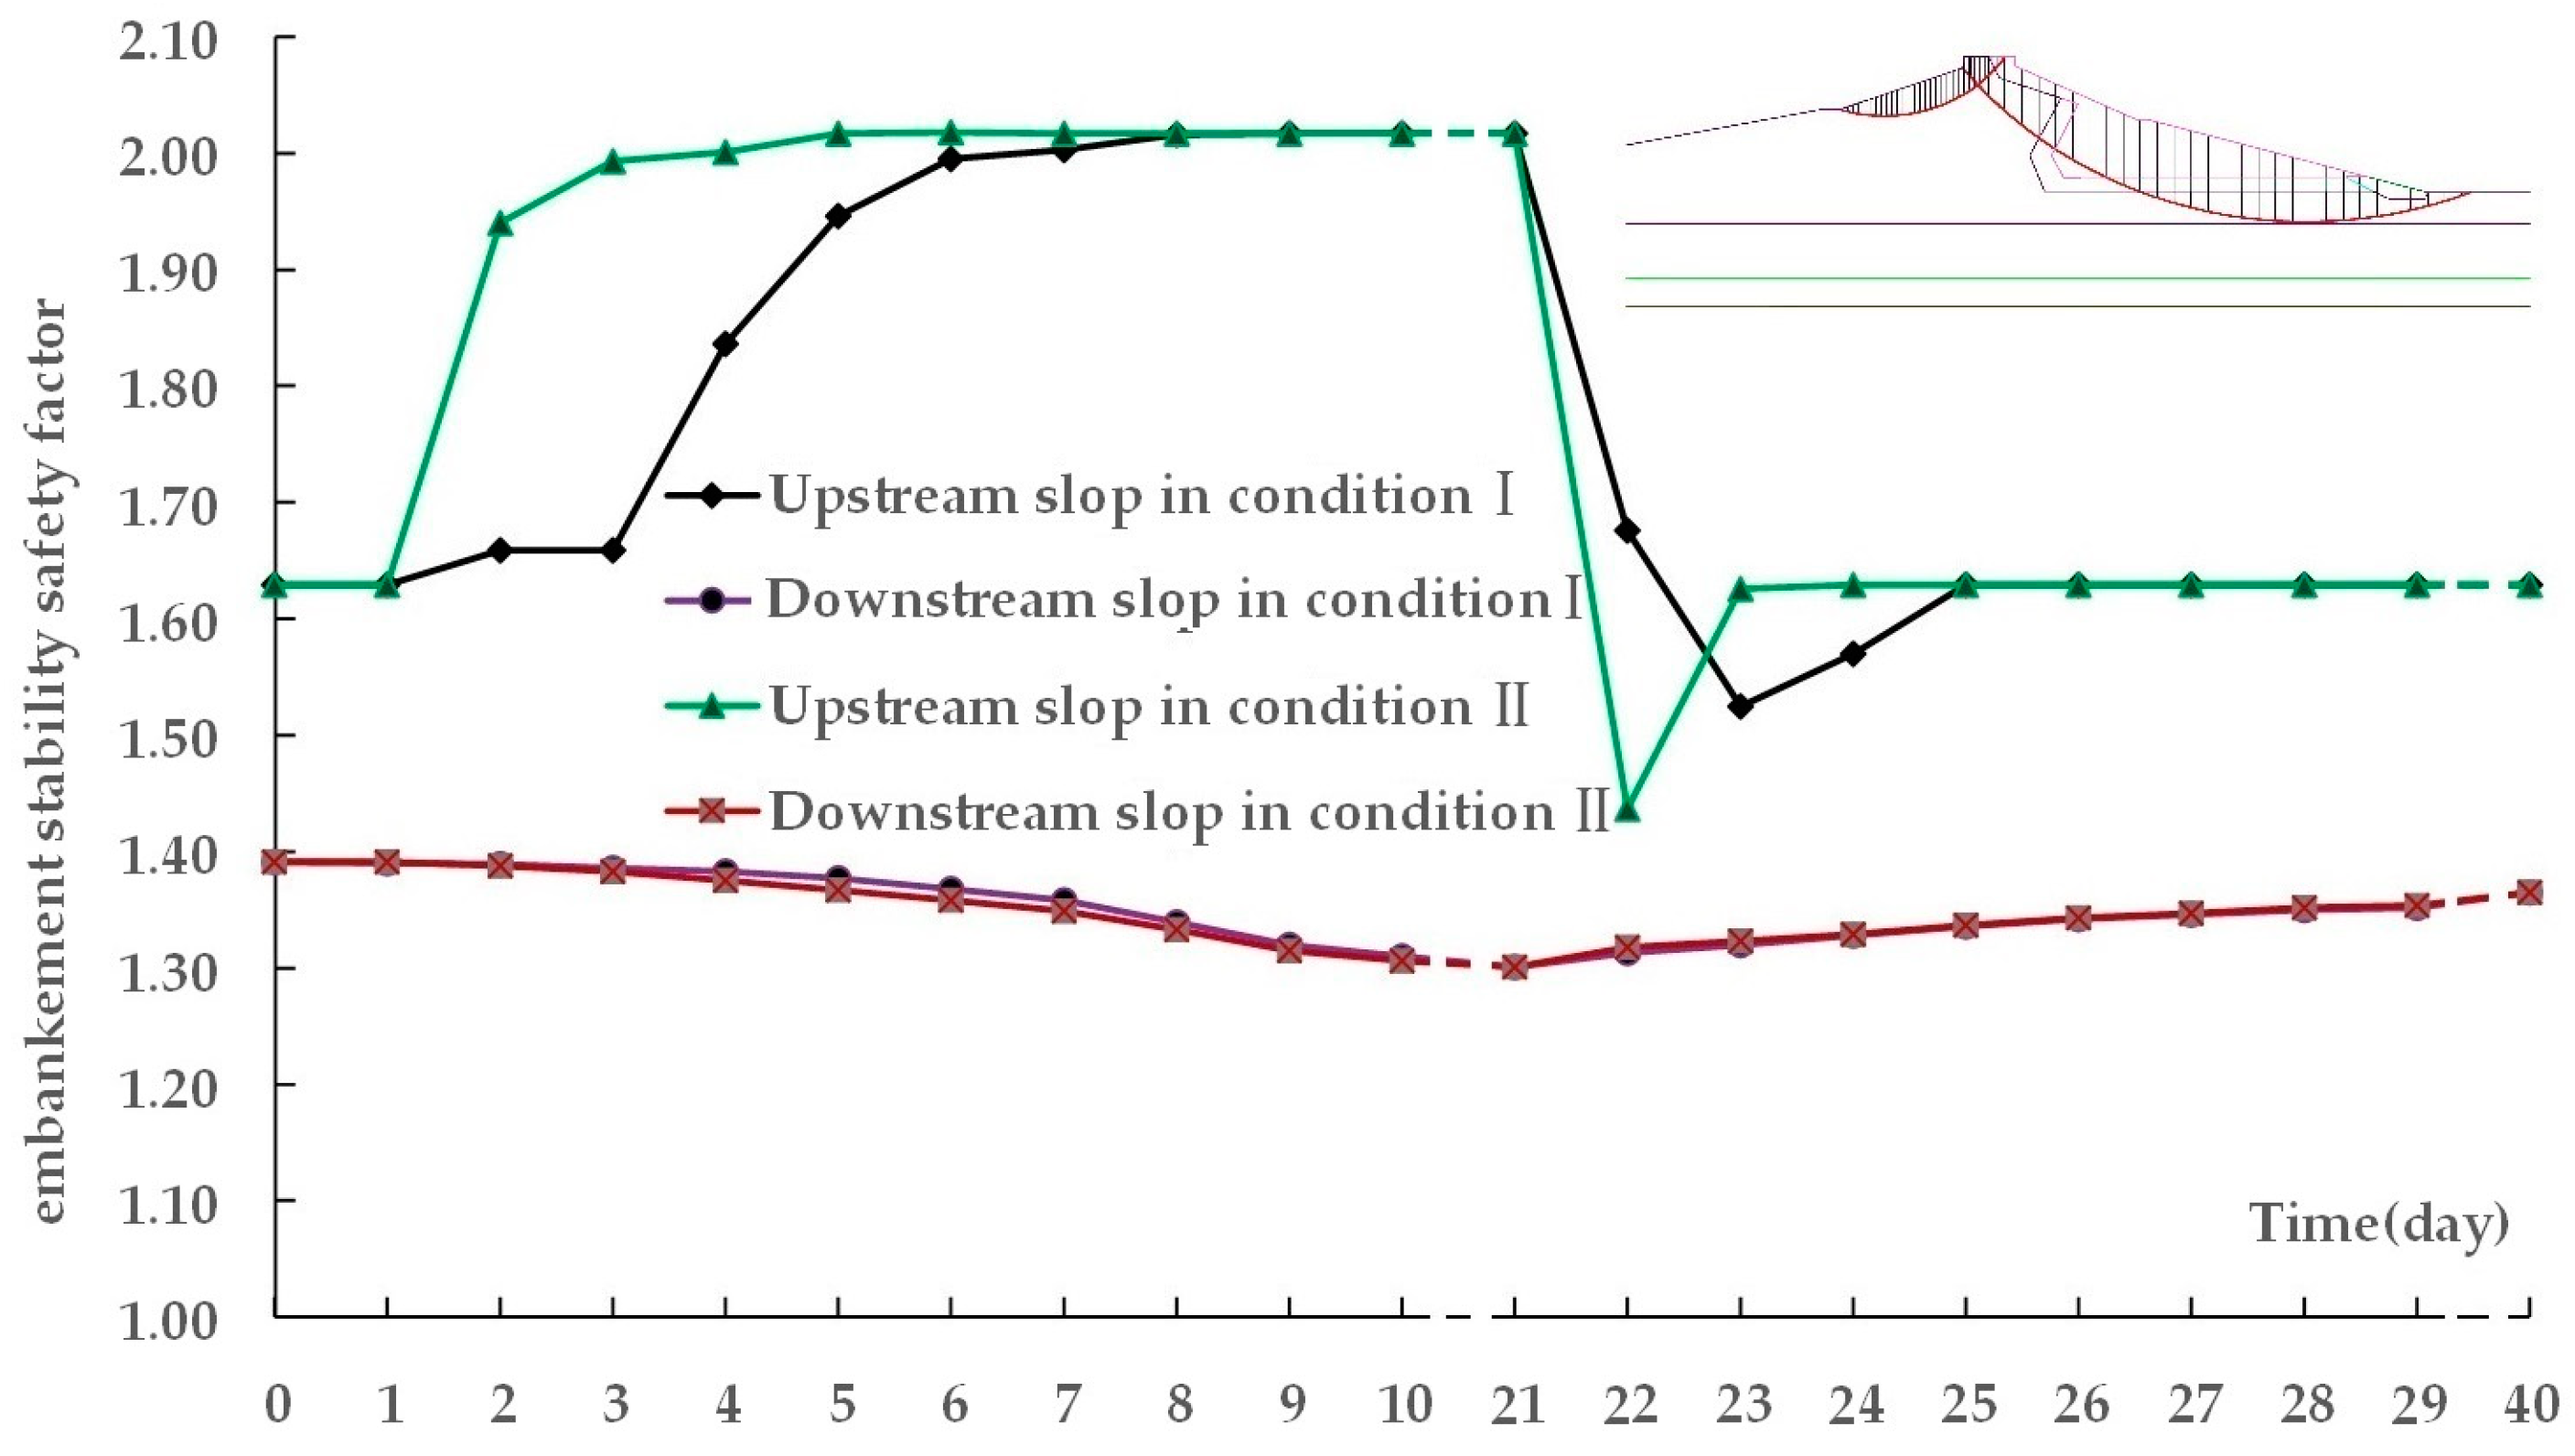
We analyze the transient embankment stabilities of the upstream and downstream slopes based on the distributions of pore water pressure during unsteady seepage. Using guidance from the Chinese design code for rolled earthfill dams (SL 274-2001), we calculate the stability safety factors for the slopes based on the Simplified Bishop Method, as shown in Figure 17.
For the upstream slope, the initial safety factor for embankment stability is 1.63. During reservoir filling, the slope safety factor gradually increases with the rising water level. The safety factor reaches a maximum of 2.02 when the water level is stable at 109.50 m. During the rapid drawdown stage, the pore water pressure in the upstream slope is not dissipated, and reverse seepage occurs, which leads to a decrease of the embankment stability. The stability safety factor decreases with the decline of the reservoir water level, and the faster the water level decreases, the stronger the decrease of the safety factor. As the unsteady seepage stabilizes, the excess pore water pressure in the dam gradually dissipates and the effective stresses increase, causing an increase in the safety factor.
For the downstream slope, the safety factor of embankment stability is initially 1.39, which is the maximum value because the phreatic line is here at its lowest. During the stage of rapidly rising water level, the stability safety factor gradually decreases due to the rise of the phreatic line and the increase of pore water pressure in the sliding body, but the change is not significant because the change of the phreatic line in the downstream slope is minor. The safety factor reaches a minimum of 1.30 when the water level is stable at 109.50 m. During the rapid drawdown stage, the safety factor increases as the phreatic line drops. Because of the drainage effect of the sand belt drainage layer, fluctuation of the phreatic line in the downstream slope is minor during rapid fluctuation of reservoir water level. The rate of change of reservoir stage has little effect on the stability of the downstream slope.
5. Conclusions
Extreme weather, such as severe drought and rapid changes of reservoir water level during abrupt drought-flood cycles, bring new challenges to the safety and stability of earthfill dams. A specific earthfill dam struck by severe drought is taken as an example in this paper. Through a sample test and finite element analysis, the clay characteristics and the behavior of unsteady seepage through the dam are analyzed during drought-flood cycles. The major limits to this work were the small scale of the unsaturated clay sample test, the lack of ability to develop an explicit relationship between crack development and suction pressure, and the simplicity of the simulation used to analyze the influence of cracks on unsteady seepage in an earthfill dam; these must be topics of future research. Nonetheless, both the laboratory experiment and the numerical simulation generated useful results.
Cracks in the clay slope easily formed during severe drought. The laboratory sample test showed that the clay has some self-healing ability after subsequent rainfall saturation, but the cracks could not heal completely, especially under repeated dry-wet cycles. After a dry-wet cycle, both the hydraulic conductivity of the clay and the rate of change of suction pressure increase. Therefore, short term drought causes the dam surface to lose water without affecting the deep stability of the dam slope, but cracks formed by persistent drought and multiple dry-wet cycles accompany a sharp increase of suction pressure. Cracks caused by long term drought may become channels for rainwater infiltration into the dam; this could reduce the soil strength of the dam slope.
An unsaturated seepage zone exists when reservoir water level changes suddenly. During a sudden rise in water level, the unsteady seepage equipotential lines shift upstream compared with the stable seepage field at the same water level; the faster the water level rises, the more the equipotential lines shift upstream. The pore pressure gradients of the unsteady seepage flow field in the dam are larger than those of the stable seepage field; the faster the water level rises, the larger the gradients are. This may exacerbate the risk of internal erosion. During rapid drawdown of the reservoir water level, embankment stability analysis shows that the stability factor of the upstream slope decreases because of reverse seepage, and the faster the water level falls, the smaller the safety factors is. The rate of change of reservoir water level has little effect on the stability of the downstream slope because of the effect of the drainage sand belt.
In addition to the finite element analysis of the intact dam, here cracking of the upstream dam slope is modelled. The position and extent of cracking corresponds to cracks measured in the field (Figure 4). Such modelling is not standard procedure in dam design, and the potential for cracking is normally omitted in design of the cover layer. Our results show that cracks have little influence on pore pressure gradient in locations far away from the cracks but cause an obvious increase in pore pressure gradient in the zone directly beneath the cracks. At the time of maximum reservoir water level of 109.50 m, the corresponding largest pore pressure gradient there is increased by 5.9%. Therefore, if cracks appear in a critical location of an earthfill dam, such as the upstream bed blanket, such cracking may worsen internal erosion.
It is necessary to pay more attention to the safety of dams under long-term extreme conditions such as drought-flood cycles. Preventative measures such as crack sealing and moisture retention of the slope surface should be implemented in time to ensure dam stability during severe drought periods, especially for those newly exposed areas which may not be well protected by design. The rate of change of the reservoir water level should be strictly controlled during drought-flood cycles. It is well known that the drawdown rate of the water level should be strictly controlled based on the embankment stability of the upstream slope. However, the rise rate of the water level also needs to be strictly controlled to avoid the internal erosion of critical seepage control regions such as the upstream blanket. In addition, as the appearance of cracks is accompanied by a sharp increase in suction pressure, in situ measurement of suction pressure is recommended to track the changes of soil characteristics and unsaturated seepage through the dam.
Author Contributions
Conceptualization, Formal Analysis, Investigation, Visualization and Writing-Original Draft Preparation, Z.L.; Data Curation, Formal Analysis, Investigation and Visualization, W.Y.; Formal Analysis and Writing—Review & Editing, M.M.; Data Curation, Formal Analysis and Writing—Review & Editing, J.D.B.
Funding
This research is supported by the National key R & D Program of China (2018YFC0407104, 2016YFC0401602), the Fundamental Research Funds of Nanjing Hydraulic Research Institute (Y718002), the National Natural Science Foundation of China (51779155, 51761135024), the Netherlands Organization for Scientific Research NWO (ALWSD.2016.007) and Engineering and Physical Sciences Council (EP/R034214/1).
Acknowledgments
We are grateful to Qian Ke for assistance in preparation of this manuscript.
Conflicts of Interest
The authors declare no conflict of interest.
References
- Zhang, J.Y.; Wang, G.Q.; Liu, J.F. Review on worldwide studies for impact of climate change on water. Yangtze River 2009, 20, 39–41. (In Chinese) [Google Scholar]
- Yan, D.; Werners, S.E.; Ludwig, F.; Huang, H.Q. Hydrological response to climate change: The Pearl River, China under different RCP scenarios. J. Hydrol. Reg. Stud. 2015, 4, 228–245. [Google Scholar] [CrossRef]
- Omofunmi, O.E.; Kolo, J.G.; Oladipo, A.S.; Diabana, P.D.; Ojo, A.S. A Review on Effects and Control of Seepage through Earth-fill Dam. Curr. J. Appl. Sci. Technol. 2017, 22, 1–11. [Google Scholar] [CrossRef]
- Zhang, J.-Y.; Wang, G.-Q. Climate change and dam safety. China Water Resour. 2008, 20, 17–20. (In Chinese) [Google Scholar]
- Flores-Berrones, R.; Ramirez Reynaga, M.; Macari, E.J. Internal erosion and rehabilitation of an earth dam. J. Geotech. Geoenviron. Eng. ASCE 2011, 137, 150–160. [Google Scholar] [CrossRef]
- Stark, T.D.; Jafari, N.H.; Zhindon, J.S.L.; Baghdady, A. Unsaturated and Transient Seepage Analysis of San Luis Dam. J. Geotech. Geoenviron. Eng. 2017, 143, 04016093. [Google Scholar] [CrossRef]
- Berilgen, M.M. Investigation of stability of slopes under drawdown conditions. Comput. Geotech. 2007, 34, 81–91. [Google Scholar] [CrossRef]
- Paronuzzi, P.; Rigo, E.; Bolla, A. Influence of filling–drawdown cycles of the Vajont reservoir on Mt. Toc slope stability. Geomorphology 2013, 191, 75–93. [Google Scholar] [CrossRef]
- Li, Z.; Guo, L.; Yan, Z. Seepage characteristic analysis and safety control of earth-rockfill dam under condition of abrupt alternation of drought-flood. Water Resour. Power 2015, 33, 49–51. (In Chinese) [Google Scholar]
- Zhang, J.J.; Gong, B.W.; Hu, B.; Zhou, X.W.; Wang, J. Study of evolution law of fissures of expansive clay under wetting and drying cycles. Rock Soil Mech. 2011, 32, 2729–2734. (In Chinese) [Google Scholar]
- Zhang, J.R.; Qiang, X.U.; De-an, S.U.N. Simulation of soil-water characteristic curves during drying and wetting cycles. Rock Soil Mech. 2014, 35, 689–695. (In Chinese) [Google Scholar]
- Ng, C.W.W.; Shi, Q. A Numerical investigation of the Stability of Unsaturated Soil Slopes Subjected to Transient Seepage. Comput. Geotechn. 1998, 22, 1–28. [Google Scholar] [CrossRef]
- Fattah, M.Y.; Omran, H.A.; Hassan, M.A. Flow and stability of Al-Wand earth dam during rapid drawdown of water in reservoir. Acta Montan. Slovaca 2017, 22, 43–57. [Google Scholar]
- Jones, F.O.; Embody, D.R.; Peterson, W.L. Landslides along the Columbia River Valley Northeastern Washington; United States Government Printing Office: Washington, DC, USA, 1961.
- Nakamura, K. On reservoir landslide. Bull. Soil Water Conserv. 1990, 10, 53–64. (In Chinese) [Google Scholar]
- Zhong, Q.; Huo, J.; Liu, R. Influence of rapid drawdown of reservoir level on stability of unsaturated dam slope. Adv. Sci. Technol. Water Resour. 2012, 32, 84–86. (In Chinese) [Google Scholar]
- Liao, H.; Sheng, Q.; Gao, S. Influence of drawdown of reservoir water level on landslide stability. Chin. J. Rock Mech. Eng. 2005, 24, 3454–3458. (In Chinese) [Google Scholar]
- Baiguishan Reservoir Administration Bureau; Nanjing Hydraulic Researcher Institute. Research Report on Disaster-Causing Effect of Extreme Low Water Level on Earthfill Dam and Countermeasures; Nanjing Hydraulic Research Institute: Nanjing, China, 2016. (In Chinese)
- Parashar, S.P.; Wong, K.S.; Choa, V. Swell-Shrink Behavior of Compacted Clay. J. Geotech. Eng. 1995, 121, 385–387. [Google Scholar] [CrossRef]
- Lin, L.C.; Benson, C.H. Effect of wet-Dry cycling on swelling and hydraulic conductivity of GCLs. J. Geotech. Geoenviron. Eng. 2000, 126, 40–49. [Google Scholar] [CrossRef]
- Chapuis, R.P. Influence of element size in numerical studies of seepage: Unsaturated zones, steady-state. Geotech. News 2012, 30, 30–33. [Google Scholar]
- Henan Water & Power Engineering Consulting Co., Ltd. Preliminary Design Report of Baiguishan Reservoir Reinforcement Project; Nanjing Hydraulic Research Institute: Nanjing, China, 1998. (In Chinese) [Google Scholar]
- Li, J.H.; Zhang, L.M.; Wang, Y.; Fredlund, D.G. Permeability tensor and representative elementary volume of saturated cracked soil. Can. Geotech. J. 2009, 46, 928–942. [Google Scholar] [CrossRef]
- Krahn, J. Seepage Modeling with Seep; GEO-SLOPE International Ltd.: Calgary, AB, Canada, 2004. [Google Scholar]
- Van Genuchten, M.T. A Closed-form Equation for Predicting the Hydraulic Conductivity of Unsaturated Soils. Soil Sci. Soc. Am. J. 1980, 44, 892–898. [Google Scholar] [CrossRef]
- Fu, J.; Jin, S. A study on unsteady transient seepage flow through Dam. J. Hydrodyn. 2009, 21, 499–504. [Google Scholar] [CrossRef]
Figure 1.
Geographical location of the Baiguishan reservoir dam.

Figure 2.
Cross section with structural characteristics of the reservoir dam.

Figure 3.
Time series of measured reservoir water level and piezometer water level.

Figure 4.
Cracks with maximum width of 30 mm on the upstream slope.

Figure 5.
Treatment and prevention measures for cracks on the upstream slope of the dam. (a) Cover with stone flour; (b) Moisture retention with plastic sheets.
Figure 5.
Treatment and prevention measures for cracks on the upstream slope of the dam. (a) Cover with stone flour; (b) Moisture retention with plastic sheets.

Figure 6.
Schematic diagram of the environment box.

Figure 7.
Test sample geometry. (a) Picture of sample; (b) Locations of suction pressure monitoring sensors.
Figure 7.
Test sample geometry. (a) Picture of sample; (b) Locations of suction pressure monitoring sensors.

Figure 8.
Suction pressure in various parts of the sample during three wet and dry cycles.

Figure 9.
Photos of cracks on the 1:3 slope during the dry period of the test. (a) Cracks on day 7 of the dry period; (b) Cracks with little development on day 19 of the dry period; (c) Cracks healing during the second rainfall.
Figure 9.
Photos of cracks on the 1:3 slope during the dry period of the test. (a) Cracks on day 7 of the dry period; (b) Cracks with little development on day 19 of the dry period; (c) Cracks healing during the second rainfall.

Figure 10.
FEM for seepage and stability calculation.

Figure 11.
Soil-water characteristic curve of the dam materials (the curve of Clay* is from our experimental data, while the curves of Clay and other materials are from sample functions [24]).
Figure 11.
Soil-water characteristic curve of the dam materials (the curve of Clay* is from our experimental data, while the curves of Clay and other materials are from sample functions [24]).

Figure 12.
Reservoir water level time series analyzed with FEM.

Figure 13.
Phreatic line of the dam at representative moments (i.e., 5 indicates the fifth day of the simulation.) (a) Rising water level in condition I; (b) Falling water level in condition I; (c) Rising water level in condition II; (d) Falling water level in condition II.
Figure 13.
Phreatic line of the dam at representative moments (i.e., 5 indicates the fifth day of the simulation.) (a) Rising water level in condition I; (b) Falling water level in condition I; (c) Rising water level in condition II; (d) Falling water level in condition II.

Figure 14.
Equipotential lines of unsteady seepage at representative moments. (i.e., Condition I-5 indicates the fifth day in condition I).
Figure 14.
Equipotential lines of unsteady seepage at representative moments. (i.e., Condition I-5 indicates the fifth day in condition I).

Figure 15.
Curves of maximum pore pressure gradients at two locations (upstream blanket and transition band as shown by the inset at top right) under Condition I and Condition II.
Figure 15.
Curves of maximum pore pressure gradients at two locations (upstream blanket and transition band as shown by the inset at top right) under Condition I and Condition II.

Figure 16.
Curves of maximum pore pressure gradient at three locations (upstream blanket, transition band, and zone beneath cracks as shown at top right) under Condition I and Condition III.
Figure 16.
Curves of maximum pore pressure gradient at three locations (upstream blanket, transition band, and zone beneath cracks as shown at top right) under Condition I and Condition III.

Figure 17.
Embankment stability safety factors under two conditions.


Table 1.
Physical and mechanical parameters of the dam materials. In this table, γ’ is buoyant unit weight, γs is wet unit weight, c is cohesive force, φ is internal friction angle, ks is saturated permeability coefficient, e is void ratio, and θs is saturated water content.
Table 1.
Physical and mechanical parameters of the dam materials. In this table, γ’ is buoyant unit weight, γs is wet unit weight, c is cohesive force, φ is internal friction angle, ks is saturated permeability coefficient, e is void ratio, and θs is saturated water content.
| Material | γ’ (kN/m3) | γs (kN/m3) | c (kPa) | φ (°) | ks (cm/s) | e | θs |
|---|---|---|---|---|---|---|---|
| Clay | 9.7 | 19.0 | 12.0 | 19.7 | 4.0 × 10⁻⁵ | 0.75 | 38.1 |
| Clay with cracks | 9.7 | 19.0 | 12.0 | 19.7 | 4.0 × 10⁻³ | 0.75 | 38.1 |
| Downstream shell | 10.5 | 19.9 | 14.0 | 22.0 | 1.0 × 10⁻⁴ | 0.61 | 29.8 |
| Drainage sand belt | 9.0 | 16.2 | 0 | 27.5 | 5.0 × 10⁻³ | 0.80 | 42.1 |
| Sand and gravel layer | 9.0 | 16.2 | 0 | 27.5 | 1.0 × 10⁻³ | 0.86 | 45.3 |
| Clay layer | 9.7 | 19.0 | 8.0 | 19.7 | 1.0 × 10⁻⁴ | 0.75 | 38.1 |
© 2018 by the authors. Licensee MDPI, Basel, Switzerland. This article is an open access article distributed under the terms and conditions of the Creative Commons Attribution (CC BY) license (http://creativecommons.org/licenses/by/4.0/).
Share and Cite
MDPI and ACS Style
Li, Z.; Ye, W.; Marence, M.; Bricker, J.D. Unsteady Seepage Behavior of an Earthfill Dam During Drought-Flood Cycles. Geosciences 2019, 9, 17. https://doi.org/10.3390/geosciences9010017
AMA Style
Li Z, Ye W, Marence M, Bricker JD. Unsteady Seepage Behavior of an Earthfill Dam During Drought-Flood Cycles. Geosciences. 2019; 9(1):17. https://doi.org/10.3390/geosciences9010017
Chicago/Turabian StyleLi, Ziyang, Wei Ye, Miroslav Marence, and Jeremy D. Bricker. 2019. "Unsteady Seepage Behavior of an Earthfill Dam During Drought-Flood Cycles" Geosciences 9, no. 1: 17. https://doi.org/10.3390/geosciences9010017
Note that from the first issue of 2016, this journal uses article numbers instead of page numbers. See further details here.