
Developments in Seismic Vulnerability Assessment of Tunnels and Underground Structures


1
Department of Civil Engineering, University of Thessaly, GR-38334 Volos, Greece
2
Department of Civil Engineering, Aristotle University of Thessaloniki, GR-54124 Thessaloniki, Greece
*
Author to whom correspondence should be addressed.
Geotechnics 2022, 2(1), 209-249; https://doi.org/10.3390/geotechnics2010010
Submission received: 1 February 2022
/
Revised: 15 February 2022
/
Accepted: 24 February 2022
/
Published: 26 February 2022
Abstract
:Underground structures are being constructed at an increasing rate in seismic prone areas, to facilitate the expanding needs of societies. Considering the vital role of this infrastructure in densely populated urban areas and interurban transportation networks, as well as the significant losses associated with potential seismically induced damage, its assessment against seismic hazard is of great importance for stakeholders, operators, and governmental bodies. This paper presents a state-of-the-art review of current developments in the assessment of seismic vulnerability of tunnels and underground structures. Methods for the development of fragility functions for the assessment of bored tunnels in rock or alluvial, and cut and cover tunnels and subways in alluvial, against ground seismic shaking and earthquake-induced ground failures are presented. Emphasis is placed on the estimation of the capacity of the examined structures, the selection of appropriate intensity measures to express seismic intensity, the development of rational probabilistic seismic demand models and the estimation of epistemic and aleatoric uncertainties, related to the seismic fragility of underground structures. Through the discussion, acknowledged gaps in the relevant literature are highlighted.
1. Introduction
Underground structures and tunnels have demonstrated a better behavior during past earthquakes compared to buildings and bridges [1,2]. However, cases of seismically induced damage on underground infrastructure have been reported from the mid-1970s [3]. The seismic response and, therefore, seismic vulnerability of underground structures is affected by a series of parameters, including the characteristics and condition of the surrounding ground (alluvial, rock), the shape of the structure (e.g., circular, rectangular), the burial depth of the structure, and the effects of seismic hazard on the structure (e.g., ground shaking or earthquake-induced ground failures, such as liquefaction, slope instabilities at portals, fault movement, etc.) [1]. Early studies revealed that the damage potential, due to seismic hazard, increases for shallow-embedded underground structures, as well as for cases of structures embedded in soft soils [3,4,5,6,7]. Spectacular collapses of underground structures, such as the collapse of Daikai subway station during the 1995 Hyogoken-Nambu earthquake in Kobe, Japan [8,9,10,11,12,13,14,15], as well as reports of severe damage of mountain tunnels during the 1999 Chi-Chi earthquake in Taiwan [16,17] and 2008 Wenchuan earthquake in China [18,19,20,21,22,23,24,25,26], highlighted the need for appropriate design and assessment methods for new and existing structures.
These observations, in conjunction with the importance of underground structures and tunnels in urban areas, as well as in interurban transportation networks, motivated the research on the seismic response of embedded structures and tunnels, with numerous analytical, numerical, and experimental studies being found in recent literature [1,2,27].
In addition to the studies on the seismic response of tunnels and underground structures, several studies have recently focused on the vulnerability assessment of these types of structures against seismic hazard [28,29,30]. In this context, methodologies for the derivation of fragility functions for underground structures have been developed, with most of the relevant studies in the field being published in the last decade. In the following sections, a summary of available studies on seismic vulnerability assessment of tunnels and underground structures against seismic hazard is provided. The presented studies/articles were retrieved from the Scopus Database or Google Scholar Database, using relevant keywords (see keywords on the first page), while the investigation was conducted in 2021. Interestingly, most of the studies in the field are rather new (i.e., most studies were published from 2018 onwards); hence, this review study is timely. The evaluation of the response of tunnels and underground structures shaking is usually performed separately in the transversal and longitudinal direction of the structure [1,2]. A similar approach is followed regarding the seismic vulnerability of embedded infrastructure, with most of the available studies focusing on the assessment of structures against ground seismic shaking in the transversal direction.
2. Concepts on Loss and Vulnerability Assessment of Structures against Seismic Hazard
Losses associated with the effects of seismic hazard on a structure or infrastructure may be evaluated by integrating the expected response and damage over given levels of hazard and assigning appropriate weights on these parameters, based on their relative likelihood of occurrence. Commonly, the total probability theorem is used to define losses [31,32]:
where DV is a decision variable(s), for instance, physical losses or direct or indirect monetary losses, associated to downtimes of a tunnel, etc., DM is a measure associated with expected damage, EDP is the Engineering Demand Parameter, expressing the response of the examined structure under the seismic hazard, G(.) is the Complementary Cumulative Distribution Function (CCDF) or probability of exceedance. CCDFs in Equation (1) are evaluated based on loss, damage, and response models. IM stands for the Intensity Measure, i.e., a metric used to express the seismic hazard severity and dλ[ΙΜ] is commonly estimated based on seismic hazard curves, derived through probabilistic seismic hazard analyses.
A critical aspect in the assessment of losses is the development of appropriate models to determine the vulnerability of structures against seismic hazard. Fragility functions constitute vital components of such models. Fragility functions (i.e., fragility curves, fragility surfaces) constitute functional forms that link the probability of exceeding a predefined level of damage, caused by a hazard on a structure, with a selected measure used to describe the severity of this hazard. The level of damage is commonly expressed by a set of discrete Damage States (DS), which are bounded Limit States (LS) or damage levels, corresponding to given thresholds, i.e., values of predefined, representative for the examined structure, EDPs. The severity of the examined natural hazard is expressed by an IM, for instance, the Peak Ground Acceleration (PGA) [33,34]. Fragility functions (e.g., Figure 1) for tunnels and underground structures are commonly expressed in the form of curves, following a lognormal probability distribution [35], such as:
where Pf(.) is the probability of exceeding a given limit state for a given intensity level (the latter expressed via an IM), Φ is the standard cumulative probability function, IMmi is the median threshold value of the intensity measure required to cause the ith limit state and βtot is the total lognormal standard deviation, describing the uncertainties (both aleatory or epistemic) related with the definition of the fragility curve, which may be decomposed, as follows ([35,36,37]):
is the lognormal standard deviation associated with the definition of capacity of the examined element, e.g., variability of mechanical and/or geometric properties, modeling uncertainties,
is the lognormal standard deviation associated with the demand, e.g., variability of seismic ground motion, etc., and
is the lognormal standard deviation associated with the definition of EDP thresholds in defining damage levels.
Fragility functions are constructed based on data obtained from post-earthquake observations, expert judgement (i.e., empirical fragility functions), or numerical results obtained from analytical methods (i.e., analytical fragility functions, and functions based on hybrid approaches combining analytical and empirical data) [38].
Two approaches are commonly employed in developing fragility functions. The first one includes regression analyses of the data obtained from one of the above methods. More specifically, least-squares regression analyses are conducted on datasets of EDP-IM, commonly in the log–log space, as per the following equation [39,40]:
From these analyses, the standard deviation of the residuals of response may be computed. Upon defining the thresholds for individual damage states, i.e., EDPmi, the required parameters for developing fragility curves, i.e., median μ and standard deviation β, may be obtained as follows:
where βd refers to the standard deviation of residuals. Normally, βtot is used for the definition of fragility curves, accounting for the uncertainties related to the estimation of structural demand and definition of damage states, as described in Equation (2). The approach is rather stable, even for a low number of data points [41].
The second method is the maximum likelihood method [42]. The method is based on assigning binary values (i.e., 1 when the examined element is damaged, 0 when the element remains intact) to a vector of damage states for each fragility curve, referring to a predefined damage state. The fragility parameters (α, β) are then derived by maximizing the likelihood function:
where Pi(α, β) is the probability of reaching a damage state, n is the number of data points and xi is a binary variability with values: 1 if the damage state is reached and 0 otherwise. A clear definition of damage or no damage state should be possible, regardless of the actual value of EDP, to apply the method [34].
3. Methods for Vulnerability Assessment of Underground Structures/Tunnels Subjected to Ground Shaking
Accounting for the importance, as well as the high costs, of construction and maintenance of tunnels and underground structures, the risks associated with the response of these infrastructures against hazards and relevant mitigation measures are commonly considered in early design stages, with any inevitable remaining level of risk, i.e., ‘residual risk’, being identified [43,44]. This approach is applicable in the designing process of new tunnels/structures, when the type and level of severity of hazards are well defined. However, the approach is not applicable for the risk assessment of existing infrastructures, particularly when considering the effects of multiple natural hazards on the response of the examined infrastructures, as well as ageing phenomena, which lead to a degrading condition of infrastructures with time. In this context, various methods have been recently presented in the literature for the risk assessment of existing civil infrastructure, including embedded structures and tunnels. Most of the studies focused on the response and vulnerability of tunnels and underground structures against seismic hazard (i.e., ground shaking and earthquake-induced ground failures), as the most relevant natural hazard affecting embedded structures.
3.1. Methods for the Derivation of Fragility Curves for Tunnels and Underground Structures Subjected to Ground Seismic Shaking in the Transversal Direction
Studies on the vulnerability assessment of tunnels and underground structures, subjected to ground seismic shaking, are discussed in this section, focusing on the effects in the transversal direction. The studies, presented in chronological order, are classified based on the main typologies of embedded structures [45], i.e., mountain tunnels or tunnels in rock, bored/segmental tunnels in alluvial, cut and cover tunnels in alluvial, and rectangular embedded structures (e.g., subways) in alluvial.
3.1.1. Mountain Tunnels and Tunnels in Rock
In 1985, ATC issued the document ATC-13 [46], providing a first reference on the seismic fragility of tunnels in rock or alluvial. The used data were derived from expert judgement, while their statistical analysis did not reflect the variability of ground motion. Hence, only median values were provided for two damage states (i.e., minor and moderate damage).
ALA [47,48] used the data of damaged tunnels in alluvial soil or rock (217 cases in total) to develop empirical PGA-based fragility curves. The analysis accounted for the quality of construction of tunnels, as well as for the method of construction. The proposed curves were defined for the states of minor, moderate, and heavy damage, with the IM (i.e., PGA) referring to the ground surface (at outcropping conditions).
HAZUS technical manual for earthquakes [37] provided PGA-based fragility curves for the assessment of bored/drilled tunnels, based on engineering judgement and empirical data. The curves were defined, accounting for damage potential on the liner and portals of tunnels, for four damage states, i.e., minor, moderate, extensive, and complete damage.
Using data from 121 cases of damage on deep tunnels reported during earthquakes in the USA, Taiwan, and Japan, Corigliano et al. [49] developed empirical fragility curves. Peak Ground Velocity (PGV) was used as IM in this study, as the researchers highlighted a better correlation of this IM with seismic response of examined tunnels.
Kim et al. [50] developed PGA-based fragility curves for NATM tunnels, analysing numerically (by means of dynamic time-history analyses) the fragility of 91 newly built tunnels in Korea. Fragility curves were derived for distinct damage states, using the exceedance of capacity of the liners for the definition of the damage state thresholds. Differences were reported when comparing the proposed fragility curves with the ones proposed by HAZUS [37].
Osmi et al. [51] presented an analytical fragility curve for a circular tunnel in rock with rock bolts. A 3D numerical model in Finite Element (FE) code MIDAS was employed to perform dynamic analyses of the examined rock–tunnel configuration, with the rock response being simulated with a Mohr–Coulomb nonlinear model. The definition of EDP and the damage states was made following Argyroudis and Pitilakis [52] (see Section 3.1.2), while PGA at ground surface was used as IM.
Huang et al. [53] proposed an analytical method for the development of fragility curves for the assessment of rock mountain tunnels against ground shaking. The selection of the examined rock tunnel configurations was made using the Uniform Design Method (UDM), a method used to design experimental setups, accounting for uncertainties associated with ground motion characteristics, lining and rock mass properties, and tunnel depth. Dynamic analyses were performed for the selected configurations using FLAC 3D, adopting elastic models for the simulation of the tunnel liners and the rock mass, and by assuming two limit cases, with regard to the rock–tunnel interface conditions, i.e., no-slip and full-slip interface conditions. EDP and damage state thresholds were defined following Argyroudis and Pitilakis [52], while Arias Intensity (Ia) was used as IM. The Support Vector Machine (SVM) method was employed to develop a prediction model of the relationship between the selected EDP and the seismic IM (i.e., the Probabilistic Seismic Demand Model, PSDM). The output from dynamic analyses was used to train the prediction model, which was then used to forecast the structural seismic demand for a given IM, calculate the structural capacity, and conclude with an estimation of the probability function at different seismic IM levels. The analyses were carried out for two circular tunnels, with diameters d = 9 m and 12 m, and burial depths ranging between 44 m and 200 m. The efficiency of the proposed method to establish PSDM was examined by comparing its predictions against the ones of the ‘traditional’ approach (i.e., using regression analyses of EDP-IM datasets derived from dynamic analyses). To the researchers, the comparisons revealed comparable predictions in fragilities, with the proposed method leading to a 10% reduction in calculation times compared to traditional approaches. Moreover, by employing the null hypothesis test, it was found that the uncertainties related to tunnel depth had a higher effect on computed fragilities, with properties of rock mass and properties of the lining following. The rock–tunnel interface conditions were also found to affect, to some extent, the fragility of examined tunnels (Figure 2). The researchers compared their analytical fragility curves with empirical fragility curves, reporting differences.
Qiu et al. [54] presented a series of analytical fragility curves for the assessment of circular mountain tunnels in rock. The proposed framework involved dynamic time-history analyses of selected rock–tunnel configurations, using 2D numerical models in FLAC 3D. The analyses were carried out assuming α no-slip rock–tunnel interface condition and elastic response of the linings and the surrounding rock, with EDP defined as per Argyroudis and Pitilakis [52]. The Uniform Design Method (UDM) was used to account for the uncertainties of ground motion characteristics, lining and rock mass properties and tunnel depth, as in Huang et al. [53]. The analyses were carried out for three circular tunnels, with the diameters d = 6 m, 12 m, and 18 m, and for a burial depth ranging between 44 m and 200 m. Instead of using a lognormal distribution to develop the analytical fragility curves, the researchers proposed the use of beta distribution, since the latter was found to better predict the lining response compared to the numerical results. Interestingly, the spectral pseudo-acceleration at fundamental period Sa(T1) was used as IM. Fragility functions were derived for states of minor, moderate, and extensive damage. The researchers compared their analytical fragility curves with empirical fragility curves, reporting differences.
Andreotti and Lai [44] proposed a numerical framework for the vulnerability assessment of mountain tunnels, involving 2D nonlinear dynamic analyses of the examined tunnel–ground configurations in Finite Difference (FD) code FLAC 2D. More specifically, three cases of rock tunnels in fractured rock masses were examined (Geological Strength Index of rock masses GSI = 15, 25, 35), with the burial depth of tunnels varying between 80 m and 400 m. The liners of examined tunnels (i.e., shape of horseshoe with inverted arch) were composed of a primary lining made of shotcrete and steel ribs and a final reinforced concrete lining. Various thicknesses (i.e., 0.7 m and 1.0 m) were examined for the final lining. The response of the surrounding rock was simulated by a model characterized by the Mohr–Coulomb yield criterion. The nonlinear response of the examined tunnels was simulated through inelastic elements/hinges, introduced at critical positions of the liners, which are prone to seismic damage. According to the researchers, the used elements allowed for the simulation of stiffness and strength decrease in the reinforced concrete lining, caused by cracking and yielding, while accounting for the effect of variation of axial loading on the lining during ground shaking. A full contact no-slip condition was adopted for the interface around the liners. The excavation process of the tunnels was also simulated prior to dynamic analyses, by employing the stress relaxation method. The damage index (DI) proposed in this study uses the damage accumulated by all inelastic zones and is defined as:
where n is the total number of inelastic zones crossing the yielding point, and are the maximum and the first yielding relative rotations of the ith inelastic zone, respectively, and is the ultimate plastic rotation (capacity). This metric constitutes a direct measure of the damage of the tunnel support; however, it is not an easily measurable metric in the field. Hence, EDP was defined as the ratio of the relative displacement between the crown of the arch and the inverted arch over the equivalent diameter of the tunnel lining cross-section (δ/Deq) (see Figure 3). A correlation relationship between the DI and EDP was provided by the researchers by fitting the computed datasets of DI-EDP of the examined cases. Fragility curves were derived for three damage states: no damage condition (DS0), characterized by axial and shear loads lower than lining capacity, extensive damage (DS2), defined when the yielding point was exceeded in at least four inelastic zones of the model (flexural response) or when brittle failures occurred (i.e., axial or shear failure), and an intermediate damage state, i.e., slight/moderate damage (DS1), characterized by axial and shear load lower than the lining capacity and a number of yielded inelastic zones less than three. A better correlation between computed tunnel response and PGV was reported compared to PGA; however, both PGV- and PGA-based fragility curves were provided. Comparisons of the proposed analytical fragility curves with empirical ones [47,48] revealed differences. Two examples of the potential use of proposed fragility curves (in the framework of risk analysis) were also presented.
Sarkar and Pareek [55] examined the effect of rock stratification on the seismic vulnerability of mountain tunnels. A circular tunnel, with diameter d = 10 m and a lining thickness t = 0.2 m, was examined. Two ground conditions were examined, i.e., a 200 m deep, single-layered, very blocky, and seamy, slickensided rock mass (V grade rock mass) and a two-layered rock mass, comprising an upper stratum (50 m) of V grade rock mass and a 150 m deep lower stratum of IV grade rock mass (i.e., moderate blocky and seamy rock mass). In the latter case, the tunnel was embedded in the upper layer. The examined configurations were modeled by employing the discrete element method; in particular, code UDEC. Rock masses were simulated with a Mohr–Coulomb model. The damage index was defined as the ratio of maximum axial stress induced on the tunnel lining over the maximum permissible stress of the lining, with the latter defined accounting for the grade of concrete and liner thickness. Fragility analysis was conducted for six damage states, i.e., no damage, slight damage, moderate damage, substantial to heavy damage, very heavy damage, and complete damage. Seven ground motions were selected for the analysis, scaled for PGA, ranging between 0.1 g and 1.0 g. In addition, analyses were carried out for harmonic excitations considering various frequencies. PGA-based fragility curves were developed based on the analysis results for five concrete grades for the liners, i.e., M20, M25, M30, M35. Much lower fragility was computed for the tunnel embedded in the single-layered rock mass, compared to the one computed for the stratified rock site. In addition, a higher fragility was computed when real earthquake excitations were employed in the analyses, compared to the cases where harmonic excitations were used. Comparing the fragility curves computed for different lining shotcrete grades, it was found that the probability of failure decreases with the increasing grade of shotcrete liner, due to an increase in the capacity of the liner.
Zi et al. [56] examined the effect of voids that may be found behind the linings of mountain tunnels in rock on the seismic vulnerability of the tunnels. A deeply buried two-lane expressway tunnel in western China was selected as case study. The tunnel had a horseshoe section with an equivalent diameter d = 11 m; the examined section was set at a depth of 100 m. The rock mass was idealized as a homogeneous medium and was simulated by means of plane strain elements in FE code ABAQUS. Infinite elements were used to simulate the boundaries of the rock numerical domain. The dynamic behavior of rock was characterized by a Mohr–Coulomb yield criterion. The primary support was modeled by means of elastic plane strain elements, whereas the final lining was simulated via elastic beam elements. Three rock classes were considered in the analysis. The tunnel construction process was simulated in steps (accounting for releasing forces) prior to dynamic analysis. The analyses were conducted for seven real ground motions, scaled at various intensities, in an Incremental Dynamic Analysis (IDA) framework. The seismic loading was imposed in either a horizontal or vertical direction, while the analyses were conducted assuming the void between the primary and secondary support or between the primary support and the surrounding rock. Various sizes of voids were considered (i.e., 0°, 15°, 30°, 45°, 60°). The EDP was defined following Argyroudis and Pitilakis [52], computed for the most unfavourable combination of acting bending moment and axial force on the lining. PGA-based fragility curves were provided based on the results of the analyses. An increase in seismic vulnerability with an increase in the size of voids was reported. The position of voids was also found to affect the vulnerability of an examined tunnel. When the tunnel was embedded in good quality rock mass, the effect of voids on the vulnerability was small. The vulnerability increased when the characteristics of the surrounding rock worsened. Finally, for a given level of seismic intensity, the vulnerability of examined tunnels under horizontal seismic excitation was greater than the one estimated under vertical excitation.
Table 1 summarizes the studies discussed above, along with some useful information regarding each study for comparison purposes.
3.1.2. Segmental Tunnels/Bored Tunnels in Soft Soils
ATC-13 [46], ALA [47,48] and HAZUS [37] provided fragility curves for the assessment of bored/drilled tunnels in alluvial, based on empirical data or engineering judgement.
Salmon et al. [57] presented a series of analytical fragility curves for the assessment of underground elements of the San Francisco Bay Area Rapid Transit (BART) system. In the frame of the study, fragility curves were provided for the assessment of bored steel tunnels against ground shaking. Various IMs were used, depending on the examined element, i.e., PGA and Peak Rock Acceleration (PRA).
Argyroudis and Pitilakis [52] provided the first detailed numerical framework for the development of fragility curves for the assessment of tunnels in soft soils. An uncoupled analysis approach was employed to compute the response of examined soil–tunnel configurations against ground seismic shaking. The nonlinear response of soil was accounted for via 1D equivalent linear soil response analyses, carried out using appropriate G-γ-D curves for selected soil deposits (gravel, sand, clay deposits). These analyses provided strain compatible stiffness values for the soil under various ground motions and shaking levels, which were then used as input values in 2D plane strain models of the soil–tunnel systems, used to compute the response of the liners of tunnels. A pseudo-static approach was used to simulate the effect of ground shaking on the response of tunnels, with ground displacements being introduced on the boundaries of the numerical models, as per the detailed equivalent static analysis method presented in ISO 23469 [58]. The analyses were performed using FE code PLAXIS 2D. From these analyses, the maximum bending moment of the lining was identified. Proper interface elements were used in the soil–tunnel interface (reducing factor R = 0.7). The level of damage (i.e., damage states) was expressed based on the ratio of the maximum bending moment acting on the liner over the capacity bending moment of the liner (M/MRd), the latter defined based on a separate section analysis, considering, indirectly, the axial seismic forces acting on the liner. The analyses were conducted for a circular tunnel, with diameter d = 10 m and lining thickness t = 0.50 m, embedded in various soil deposits, corresponding to soil classes B, C and D (acc. to EN1998-1 [59]) at a depth h = 10 m. Nine real ground motions, scaled from 0.1 g to 0.7 g, were used to calculate the induced stress on tunnel liners for an increasing level of ground shaking. Analytical fragility curves were defined for four damage states, i.e., minor damage, moderate damage, extensive damage, and collapse, using PGA at the ground surface in free field conditions as seismic IM. The analyses revealed the critical effect of soil deposit characteristics on the computed fragility of the examined tunnel (Figure 4).
Using a 3D numerical model of a circular tunnel–ground configuration, as in Osmi et al. [51], Osmi et al. [60] developed a series of analytical PGA-based fragility curves for a circular tunnel, embedded in various soft alluvial deposits, comprised of sand or clay. The definition of damage states was made following Argyroudis and Pitilakis [52].
A numerical study on the seismic vulnerability of circular shield tunnels in soft soil was presented by Fabozzi and Bilotta [61]. The researchers examined the case of a circular tunnel with 10 segments, with the in-between segment joints being modeled using a simplified bi-linear moment–angular rotation relationship [62]. In particular, 2D numerical models of the examined circular tunnel–soil configurations were developed in FE code PLAXIS 2D, with the soil properties ranging to simulate soil classes B, C and D, according to EN 1998-1 [59]. A linear elastic model was used to simulate the lining segments, whereas for the soil, an elastic–plastic strain-hardening model with a small strain overlay, available in PLAXIS 2D, was employed. The rotational stiffness of longitudinal joints was set in correspondence to the 80% of the maximum limit moment that the adjacent segments can transfer. Interface elements were used in the soil–tunnel interface (reducing factor R = 0.7). Prior to dynamic analyses, a static step was defined to simulate the excavation procedure, by reducing the initial lithostatic stress σ0 by a stress relaxation coefficient λ = 0.30. PGA- and PGD- (Permanent Ground Deformation) based fragility curves were developed for four damage states (i.e., no, slight, moderate, and extensive damage) using M/MRd ratio as EDP for segments and the ratio of permanent joint rotation, φr, over first critical rotation, defined as φ1 = Nl2/6EI as EDP for joints. A higher vulnerability was reported when the examined tunnel was embedded in softer soil deposits. Additionally, high differences between predicted fragilities were reported when different damage indexes were employed. A much higher variability of computed response was reported when EDP was defined based on joint rotational response.
Avanaki et al. [63] examined the effect of using steel fibers as reinforcements for tunnel segments on the seismic vulnerability of circular segmental tunnels. An analytical framework was proposed for this purpose, with six different composites of steel fiber reinforced concrete being examined and with the estimated fragilities of these cases being compared against the fragilities of unreinforced or conventionally reinforced concrete segments. In particular, six concrete mixes, containing micro or macro sized steel fibers, at a volume content of 0.3% or 0.5%, or combinations of these volumes were investigated. An experimental campaign was carried out to obtain the mechanical properties of the examined concrete composites, with the tests also being simulated numerically in FE code ABAQUS. The mechanical properties obtained from the aforementioned procedures were then employed in a numerical framework aimed at deriving analytical fragility curves for a segmental-lined circular tunnel of an urban subway tunnel, made of either the examined steel fiber reinforced concrete composites, conventional reinforced concrete, or plain concrete. The numerical framework resembled the one proposed by Argyroudis and Pitilakis [52]. In particular, an uncoupled approach was employed, with the segmental tunnel response underground shaking being estimated via pseudo-static analyses of the soil–tunnel configuration, the latter run by employing a 2D numerical model in ABAQUS. A Mohr–Coulomb model was used to simulate soil response, whereas for the liners’ response, a damaged plasticity model, available in ABAQUS was implemented. The concrete model was calibrated based on the experimental and numerical study results carried out on examined composites. The segmental joint behavior was evaluated using a separate numerical model, based on a standard test setup for such joints and was then implemented in the soil–structure analysis model. The seismic loading was simulated in a pseudo-static fashion, with the strain-equivalent deformation being estimated via 1D equivalent linear soil response analyses and induced on the boundaries of the soil–tunnel model. PGA-based fragility curves were developed for five damage states (i.e., no damage, minor damage, moderate damage, extensive damage, and collapse), with the damage index accounting for potential damage of the segments or the joints, thus, composed of two ‘parts’, i.e., lining part and joint part:
where is the diametric strain-demand on the lining, defined as the ratio of maximum diametric deformation due to a given seismic intensity over the lining diameter and is the diametric strain capacity of the lining, calculated based on the closed form solutions of Wang [64]. Md and My stand for the demand bending moment and yielding bending moment of the joints, defined on the basis of appropriate tests of the joints. The analytical fragility curves revealed a lower seismic vulnerability of the examined tunnel when a steel fiber composite segmental lining was used, compared to the cases where plain concrete or conventionally reinforced concrete were adopted for the lining. Comparisons of the analytical fragility curves against existing empirical ones (e.g., HAZUS, ALA etc.) revealed differences. Finally, general polynomial equations were proposed to fit the analytical curves in an effort to allow for general applications.
Huang et al. [65] proposed a set of analytical fragility curves for the assessment of circular tunnels in deep soft soil deposits, expanding the analytical framework developed by Argyroudis and Pitilakis [52] and Argyroudis et al. [66]. The proposed fragility curves refer to tunnels that are representable to typologies found in Shanghai, China. The response of tunnels was examined via time-history analyses, carried out using 2D numerical models in FE code ABAQUS. In addition to fragility curves, vulnerability curves were developed by using the proposed fragility functions and setting the vulnerability index in terms of the ratio of repair cost to the cost of replacement of the liners. The framework was applied on a circular tunnel, with diameter d = 6.2 m and lining thickness t = 0.35 m, embedded at various depths (i.e., h = 9, 20 and 30 m). Three distinct soil profiles (of increasing stiffness with depth) were considered, corresponding to soil class D, according to EN 1998-1 [59]. Based on the results of the numerical analyses, PGA- and PGV-based fragility curves were derived. Similar standard deviations were reported from regression analyses of the datasets of examined IMs with EDP in the case of shallow tunnels, whereas for the moderately deep and the deep tunnel, the scatter of the PGA-based fragility curves was significantly higher compared to the PGV-based fragility curves, indicating that the fragility curves are more sensitive to the selected soil profile when PGA is used as IM. The above observations were analyzed further in a subsequent study by the researchers (Huang et al. [67]), where an effort to identify optimal IMs for the assessment of bored tunnels was made. Differences were reported between the proposed fragility curves and existing empirical [36,37,38] and analytical ones [41]. The vulnerability curves were derived by computing the vulnerability index DIj, as follows:
where DIj takes values ranging from 0 (no damage) to 1 (complete damage), corresponding to intensity measure level j, Pkj is the discrete damage probability for damage state k and intensity measure level j, and dk is the specific central damage or vulnerability index for each damage state k, the latter defined in terms of repair ratio (metric described above) and assigned a value of 0, 0.10, 0.25 and 0.75 for none damage, minor damage, moderate damage and extensive damage, respectively, following Werner et al. [68] and Selva et al. [69]. The vulnerability curves were subsequently defined by plotting the estimated values of the vulnerability index against the employed IMs (PGA and PGV). Using the developed vulnerability curves and for an average known replacement cost of the tunnel lining, the cost of repairs for each tunnel segment can be estimated for different seismic scenarios, by multiplying the corresponding damage index with the average replacement cost.
Hu et al. [70] examined the effect of burial depth of circular twin tunnels in soft soils on their seismic vulnerability, by means of a numerical parametric study. The main assumptions of the study followed Argyroudis and Pitilakis [52]. A twin tunnel, comprised of two circular tunnels at a distance of 13 m, with diameters d = 6.2 m and lining thickness t = 0.35 m, embedded at various depths in 280 m deep sand–clay soil deposits, was examined. Soil nonlinear response was simulated by employing 1D soil response analyses, conducted separately. The tunnel response was estimated via 2D dynamic analyses, carried out in FE code ABAQUS, using 15 real ground motions, scaled at various PGA, ranging between 0.075 g and 1.2 g. The damage index and thresholds were defined as per Argyroudis and Pitilakis [41]. Comparisons between proposed analytical fragility curves and ones [27,36,37] revealed differences.
Huang and Zhang [71] proposed scalar- and vector-valued fragility functions for circular tunnels in soft soils, using the numerical framework presented in Huang et al. [54]. The analysis was conducted for a circular tunnel, with diameter d = 6.2 m and lining thickness t = 0.35 m. An overburden depth ratio h/d = 1.45 was considered, with the tunnel being embedded in soft soil deposits, corresponding to soil class D, according to EN 1998-1 [59]. A suite of 12 ground motions, scaled to various PGA levels, ranging between 0.1 g and 1.0 g were used in the analyses. Based on the analysis, PGA-based (scalar) fragility curves were defined for four damage states (i.e., no damage, minor damage, moderate damage, and extensive damage). For the vulnerability assessment of examined soil–tunnel configurations, with vector-valued fragility functions, an analysis was performed by testing pairs of IMs, i.e., IM1 and IM2, with the final selection of used IMs being made based on the strong correlation between each of selected measures and the damage index (EDP). PGA and the Acceleration Spectrum Intensity (ASI) were proposed by the researchers based on the aforementioned analysis. To the researchers, the use of vector-valued IMs (PGA, ASI) led to better correlation relationships to EDP, compared to the correlations made between EDP and the independent IMs. Fragility surfaces (vector-valued fragility functions) were developed for three damage states, i.e., minor damage, moderate damage, and extensive damage, based on the following equation:
where a, b and c are defined via regression analyses of EDP against selected IMs, as follows:
The researchers compared the PGA-based scalar-valued fragility curves with slices of the vector-valued fragility surfaces for minor damage, moderate damage, and extensive damage, the latter defined for constant values of ASI, revealing the effect of the second IM on the computed vulnerability of the examined tunnel.
Furthermore, de Silva et al. [72] proposed a series of analytical fragility curves for the assessment of circular tunnels in sand, using the results of cloud analysis, involving 2D nonlinear dynamic analyses of selected soil–tunnel configurations, carried out in FD code FLAC 2D. In particular, a 10 m diameter circular tunnel, with lining thickness t = 0.50 m, was examined. The tunnel was assumed to be embedded in two idealized sand deposits of depth equal to 60 m and relative density Dr = 40% and 75% (loose and dense sand deposits, respectively), with two burial depths being tested, i.e., 15 m (h/d = 1) and 30 m (h/d = 2). Soil nonlinear response was modeled via an elastic-perfectly plastic Mohr–Coulomb material model with hysteretic behaviour, with the latter being calibrated based on adequate G-γ-D curves. The lining of the examined elements was modeled via an elastic model. The analyses were performed using 10 real ground motions, retrieved from the PEER database. Fragility curves were developed for one limit state, i.e., minor damage, associated with the onset of cracks on lining or reaching of concrete tensile strength. The resistance bending moment Mres(t) was calculated via sectional stresses analysis, accounting for the equilibrium with lining axial force N(t). The novelty of the present study is the consideration of the effect of axial load time dependency on the lining resistance bending moment. EDP was defined as resistance to capacity ratio, as follows:
where Mload(t) is the time-dependent lining bending moment, estimated based on the dynamic analyses. Based on the analysis, PGA- and PGV-based fragility curves were defined, using the values of IMs, corresponding to either the input motions, or those computed at ground surface at free-field conditions. Analytical fragility curves were also provided, assuming zero lining axial force, a condition corresponding to the lowest lining bending resistance, to highlight the beneficial effect of axial forces on the lining, on the seismic fragility of tunnels. The researchers reported a rather satisfactory comparison of the empirical fragility curves of ALA for minor damage [47,48] with their analytical fragility curves.
Huang et al. [73] presented an analytical framework for the development of fragility curves for the assessment of circular tunnels in soft soils, involving an Artificial Neural Network (ANN) to develop the PSDM (i.e., the relation between a damage measure (XDM) and an intensity measure (XIM), Figure 5). A circular tunnel embedded in a deep soft soil deposit, examined in a previous study by the researchers (Huang et al., [54]), was employed as a case study. The data required to train ANN were derived via a numerical framework that included 2D dynamic analyses of the examined system for 12 ground motions, scaled at various levels of ground motion, as discussed in Huang et al. [65]. The proposed ANN included an input layer that receives the information (i.e., the intensity measure XIM), a hidden layer that transforms the input and lead to the output (i.e., the damage measure XDM) that is displayed in an output layer. Weights were assigned and adjusted to connect the neurons between the different layers, whereas bias parameters were set to prevent the model from outputting null values by zero inputs. Finally, activation functions were used to establish the nonlinear correlations between input and output neurons. After training, using the connecting weights and biases, as well as the activation functions, the following PSDM model was derived:
where b and bi are the bias at the output layer and the ith neuron of the hidden layer, respectively; hi is the connection weight between the ith neuron of the hidden layer and the output neuron; wi is the connection weight between the input layer and ith neuron of the hidden layer. The connection weights and bias values were calculated during the training process. The researchers applied the approach for various IMs, i.e., PGA, PGV, PGD, Fr1 = PGV/PGA, Arias Intensity (Ia) and provided the connection weights and bias values of the trained ANN for the development of PSDM (for instance, Table 2 provides these values for PGV). The derived ANN-based PSDMs were compared to the one produced by linear regression of the XIM-XDM dataset in the log–log space. The comparisons indicated a better performance of ANN in capturing the trends of XIM-XDM datasets, compared to the classic linear regression analysis. ANN-based fragility curves were compared with fragility curves, derived based on PSDMs developed via linear regression analyses of XIM-XDM dataset. ANN-based fragility curves were generally close to the ones derived from linear regression-based curves, with the former displaying slightly less uncertainty, βtot.
Table 3 summarizes available studies for the assessment of segmental tunnels or bored tunnels in alluvial, subjected to ground seismic shaking in the transversal direction.
3.1.3. Cut and Cover Tunnels/Subway Stations/Rectangular Underground Structures
The first fragility curves presented in the literature for the assessment of cut and cover (CC) tunnels were provided by ALA [47,48] and HAZUS [37], based on empirical data and/or engineering judgment.
Salmon et al. [57] presented analytical fragility curves for cut and cover tunnels subjected to ground shaking and fault movement (the latter for the Berkeley Hills tunnels, subjected to the potential effect of the nearby Hayward fault).
Argyroudis and Pitilakis [52] provided the first detailed numerical framework to develop fragility curves for the assessment of rectangular CC tunnels in soft soils. Analytical fragility curves were defined for a 16 × 10 (m) rectangular tunnel, embedded in various soil deposits, corresponding to soil classes B, C and D (acc. to EN1998-1 [59]), at a depth h = 3.5 m. The fragility functions were developed following the same numerical framework presented for bored circular tunnels, for four damage states, i.e., minor damage, moderate damage, extensive damage, and collapse, using PGA at the ground surface in free-field conditions as seismic IM.
Le et al. [74] presented a set of analytical fragility curves for the assessment of one-story, two-barrel, rectangular tunnels in soft soil. A numerical approach was proposed, which included 1D equivalent linear soil response analyses, with SHAKE program, to identify the acceleration (profile with depth) of the soil mass surrounding the tunnel, at the time of maximization of tunnel response (i.e., time step when the relative horizontal deformation between the top and bottom slabs of the tunnel is maximized) for each selected ground motion. The analyses were conducted using 200 artificial ground motions, matched to a selected response spectrum. The acceleration profiles were converted into body force regimes to perform static analyses of the soil–tunnel configuration, through a relevant 2D numerical model of the configuration (developed in FE code MIDAS), aiming at computing the lining bending moment distribution. By employing the maximum likelihood method, defining EDP as per Argyroudis and Pitilakis [52], and using PGA of ground motion as IM, the researchers developed fragility curves for three damage states, i.e., minor, moderate, and extensive damage.
In addition to rock tunnels, Kim et al. [50] developed PGA-based fragility curves for cut and cover tunnels, numerically analysing the fragility of newly built tunnels in Korea.
Ryong et al. [75] examined the effect of soil characteristics on the seismic vulnerability of shallow rectangular utility tunnels in Korea, providing relevant analytical fragility curves. One damage state was defined based on ratios of bending moment and shear force over the relevant moment and shear force resistances. An interesting aspect was the investigation of the effect of the definition of soil properties on the computed tunnel fragilities. Soil properties were defined in two ways; in the first series of analyses, equivalent properties were defined based on the average shear wave velocity of the upper 30 m of soil, i.e., Vs30, following relevant design codes, whereas in a second series of analyses, the Vs profiles of the examined deposits were defined probabilistically, using a Monte Carlo simulation approach. Interestingly, the comparisons of computed fragility curves indicated a lower fragility when a probabilistic approach was employed to simulate soil characteristics.
Extending the previous study of Le et al. [74], Huh et al. [76] presented a series of analytical fragility curves for a rectangular tunnel in soft soil. The novel aspect of this study, compared to the previous one, was the definition of damage states, which was made based on nonlinear pushover analyses of the examined tunnel section, carried out with FE code SAP 2000. The plasticity of the lining of the tunnel was simulated via a concentrated hinge model, assuming that yielding could occur at the ends of the structural members (Figure 6a). An elastoplastic law, proposed by FEMA 356 [77] (Figure 6b), was adopted to define the response of hinges. An additional issue was the definition of static configuration (supports and loading patterns) that should be employed in the pushover analysis. Assuming a homogeneous soil deposit around the tunnel, the researchers used the static configurations proposed by Wang [64] (see Figure 7). The variability of material strength of the liner was accounted for by employing the Latin Hypercube Sampling (LHS) method. The EDP thresholds, associated with each damage state, were defined based on the pushover analyses, in terms of maximum interstory drift (i.e., the ratio of the horizontal relative displacement of the roof to invert slab of the tunnel over the height of the tunnel section, δ/h). Using the maximum likelihood method and PGA of ground motion as IM, the researchers developed fragility curves for four damage states, i.e., none, minor damage (associated with Immediate Occupancy limit state), moderate damage (associated with Life Safe limit state) and extensive damage (associated with Collapse Prevention limit state). Fragility analysis was conducted using 20 or 50 artificial ground motions per examined level of seismic intensity. The effect of the number of ground motions on the computed analytical fragility curves was found to be rather minor (almost negligible).
Using the methodology presented earlier, Huh et al. [78] developed analytical fragility curves for the assessment of a two-story four spans underground box structure, embedded in soft soil. Twenty-three different PGA levels were considered in the analysis (PGA = 0.02 g to 1.30 g), with 50 artificial time histories being generated for each PGA level. The generated time histories were matched to a representative for the Korean terrain response spectrum. The damage index values for the adopted damage states were defined based on pushover analyses of the examined structure, examining both static configurations, as per Wang [64] (see Figure 5). The use of different loading patterns (see Figure 7) resulted in slightly different values of EDP thresholds for the adopted damage states (i.e., none, minor damage, moderate damage, and extensive damage). The number of employed ground motions on the computed fragilities was also examined by extracting fragilities curves for 10, 20, 30, 40 and 50 ground motions and comparing them with each other for the various damage states. The researchers reported steeper curves when fewer ground motions were employed, whereas for the cases where more than 20 motions were used, similar curves (almost identical) were produced; hence, they concluded that the use of approximately 20 ground motions in each PGA level is a reasonable value for performing the structural analysis to derive the fragility curves of tunnels.
Nguyen et al. [79] developed a series of analytical fragility curves for cut and cover tunnels in soft soils. A decoupled analytical framework was proposed for this purpose, including pseudo-static analyses of single, double, and triple boxes, embedded in a variety of ground sites (sixteen ground sites with depth H = 30, 50, 100 and 150 m and increasing stiffness with depth, corresponding to soil classes B, C and D, according to EN 1998-1 [59]). More specifically, frame beam models were developed for the examined tunnel sections in FE code SAP2000, with soil compliance being modeled by means of springs. The seismic ground shaking was simulated as horizontal deformation, imposed on the structural frame model of the tunnel, and was computed separately via 1D equivalent linear site response analyses of the examined ground sites, carried out using code DEEPSOIL. The stiffnesses of the springs, attached to the nodes of the frame elements in the normal and shear directions, was defined following the seismic design code for the metropolitan subway of Korea [80,81]:
where KH, is the horizontal and vertical normal spring stiffnesses, respectively, h and b are the height and the width of the tunnel, respectively, kh0 = (1/30) × ED, ED is the elastic modulus of the ground, estimated via the 1D soil response analyses to account for soil nonlinear response during shaking (i.e., strain-equivalent stiffness of soil). The shear springs KSS and KSB, referring to the vertical and horizontal planes, respectively (i.e., sidewalls and slabs, respectively), were defined as:
It is worth noticing that the simplified soil spring model used in this study does not simulate the complex dynamic soil–structure interaction phenomena, including slippage or gapping effects at the soil–tunnel interface. Nonlinear material models were applied to simulate the response of concrete and reinforcement bars and estimate the capacity of the linings. Prior to the pseudo-static earthquake step, the geostatic stresses were applied on the normal springs of the frame models. In the earthquake step, and in addition to the seismically induced soil displacements, imposed on the normal springs, a shear stress distribution was applied directly to the tunnel frame elements. The latter was estimated as the product of the free-field shear strain (γ) and the corresponding shear modulus of soil (G), evaluated via the 1D soil response analyses, at the depth of examined tunnels. The analyses were carried out for 20 real ground motions regarded at rock outcrop conditions, with each ground motion being scaled for PGA, from 0.1 g to 1.5 g, and for PGV, from 0.1 m/s to 1.0 m/s. Five damage states (i.e., no damage, minor/slight damage, moderate damage, and extensive damage) were used, following Argyroudis and Pitilakis [52]. PGA-, PGV- and PGV/Vs30-based fragility curves were developed for all examined cases, based on regression analyses of the EDP-IMs datasets. It is noted that the selection of PGV/Vs30 was made considering that this metric constitutes an approximation of the ground shear strain applied on the tunnel. Single box tunnels were reported to be less vulnerable to damage compared to multi-box tunnels. Comparisons of the proposed analytical fragility curves with existing empirical and analytical curves revealed some differences.
He and Chen [82] examined the effect of vertical seismic components on the seismic vulnerability of large space rectangular underground structures by means of a numerical study. A 2D numerical model of a soil–structure system was proposed to perform pushover analyses and estimate the capacity curve of the central columns of the structure (Figure 8a). The system was subjected to monotonically increasing horizontal and vertical distributions of body forces, simulating the effects of horizontal and vertical components of the seismic loading, respectively. The horizontal forces followed an inverted triangular distribution that decreased linearly with depth, whereas for the vertical forces, a uniform distribution was adopted throughout the deposit depth. The vertical forces were computed based on a peak vertical acceleration equal to two-thirds of the horizontal peak acceleration. Through the pushover analyses, capacity curves of the central columns were computed in the form of lateral load—drift curves (Figure 8b). These curves were used to define thresholds for four damage/performance levels, i.e., fully operational (FO), operational (OP), life safety (LS) and near collapse (NC), following Qing and Feng [83]. Seismic demand was defined based on IDA conducted under a combination of horizontal and vertical seismic excitation for increasing levels of seismic intensity. The estimated IDA curves were employed in the derivation of the parameters required to develop fragility curves. It is worth noticing that in addition to the other sources of uncertainty presented in Section 2, the uncertainty related to modeling was also considered herein, which resulted in us adopting a relevant standard deviation value equal to 0.2 [37].
The proposed framework was applied on an underground commercial street structure in China, assuming a variety of ground sites with different depths (H varying between 22 m and 70 m) and different distributions of soil stiffness (increasing soil stiffness with depth). The examined systems were analyzed in FE code ABAQUS, with soil response being simulated via an isotropic hardening law, characterized by the Mohr–Coulomb yield criterion, and the response of the concrete of the underground structure being simulated using a plastic-damage model. An idealized elastoplastic model was selected for the steel reinforcement of the structure. A hard–contact interface condition was adopted at the soil–structure interface, with frictional response being simulated via a Coulomb friction law (friction coefficient μ = 0.4). Prior to the pushover and the dynamic analyses, the geostatic stress field was established. IDA was conducted for a suite of 15 ground motion records. Comparing the capacity curves, estimated by considering or neglecting the vertical component of seismic shaking, the researchers reported no effect at the early ‘elastic parts’ of the curves, i.e., the yield drift ratio and the drift ratio of peak loading did not change for the two examined conditions; on the contrary, the consideration of the vertical seismic component led to a significant decrease in the ultimate drift ratio (as high as 50%). Evidently, this affected the definition of thresholds at FO and OP performance levels (Figure 8b), i.e., neglecting the vertical component of ground shaking leads to an underestimation of the capacity of the structure. The IDA results were used to develop fragility curves, using both PGA and PGV as IMs. Comparisons of fragility curves were provided for FO and OP levels when considering or neglecting the effect of vertical ground shaking.
Jiang et al. [84] proposed a similar conceptual approach to the one presented by He and Chen [82], for performing pushover analysis of underground structures to obtain the PSDM, accounting for both horizontal and vertical earthquake excitation effects. The researchers analyzed the seismic vulnerability of various types of subway stations (i.e., two-story, two span and two-story, three span, subway stations; Daikai subway station, in Kobe Japan, which collapsed during the 1996 Great Hanshin earthquake).
A nonlinear IDA was conducted by Zhong et al. [85], aiming at assessing the vulnerability of subway stations. The Daikai subway station in Kobe, Japan (rectangular section 17 × 7.17 m, with central columns 0.4 × 1.0 m, spaced at 3.5 m), was used as case study. A 2D numerical model of the station–ground configuration was developed in FE code ABAQUS to perform IDA analyses. The central column was simulated by a nonlinear beam–column element, whereas an elasto-plastic Drucker–Prager constitutive model was used to simulate the nonlinear soil response. Soil–station interface was simulated via a contact model (Coulomb friction coefficient μ = 0.4). Fragility curves were developed for five damage states, i.e., no damage, minor damage, moderate damage, extensive damage, and complete failure (collapse). The interstory drift ratio (θ = δ/h) was used as EDP, with the thresholds of damage states being defined based on a capacity curve (shear force of central column—drift θ curve) derived from nonlinear static pushover analyses of the structure, conducted as per Figure 9. Structural demand was defined based on an IDA, conducted for 12 pairs of records scaled up to specific intensity levels. An interesting observation was that some of the computed IDA curves revealed a non-monotonic increasing trend of EDP with increasing IM. A back-and-forth twisting behavior was observed, attributed to the complex effects of SSI response (e.g., effects of the nonlinear response of soil and structure on the computed response of the system). The results of IDA were used to develop PGA-based fragility curves, which were compared to empirical curves proposed by ALA [47,48], as well as with analytical ones, developed by Argyroudis and Pitilakis [52]. The latter comparisons revealed some reasonable differences.
Zhuang et al. [86] presented a numerical framework for the development of fragility curves for the assessment of underground structures in soft soil, using the Daikai subway station as a case study. The proposed framework included IDA of the examined configuration, using a 2D numerical model in FE code ABAQUS. The soil response was simulated by means of a nonlinear dynamic constitutive model with multi-nested yield surfaces [87], whereas the seismic response of the structure was modeled using a nonlinear dynamic constitutive model, based on the concrete fracture energy principle [88]. The concrete model was accompanied by an elastic material model, simulating the steel reinforcement bars. The analysis was conducted for a suite of 20 real ground motion records, selected by introducing, as a criterion, the PGA/PGV ratio, as an indicator of the frequency containment of the records (i.e., PGA/PGV < 0.8: low-frequency motion, 0.8 < PGA/PGV < 1.2: mid-frequency motion, PGA/PGV > 1.2: high-frequency motion). In addition, a normality test was carried out to examine if the PGA values of the selected ground motions followed a normal distribution population. The definition of damage states (five in total, i.e., no damage, minor damage, moderate damage, extensive damage, and collapse) was made by examining the damage modes of the structure, computed by the dynamic analyses, (e.g., cracking damage on slabs or sidewalls, exceedance of bearing capacity of central column etc.). Based on the definitions of damage states, the computed structural response from each of the calculation cases was associated with a damage state and correlated with the relevant computed interstory drift ratio θ. Statistical analysis was conducted on the above data, leading to the estimation of the thresholds of the damage states. For each seismic performance level, θ thresholds were defined based on μ ± β values (i.e., median ± 1 standard deviation), corresponding to the upper and lower limits of θ. A back-and-forth twisting behavior was reported for some IDA curves, attributed to the complex effects of SSI response, as well as to the characteristics of the ground motions. PGA-based and PRLD- (peak relative lateral displacement) based fragility curves were provided. Limited differences (less than 5%) were reported comparing the fragilities, estimated by using the fragility curves defined for the two examined IMs. The comparisons of the proposed fragility curves, with existing empirical and analytical fragility curves, revealed significant differences.
Zhong et al. [89] developed a series of analytical fragility curves for the evaluation of a two-story, three span subway station in soft soil, using the framework presented in Zhong et al. [85]. A 21.2 × 12.5 (m) rectangular embedded structure, with an overburden depth of 10 m, supported by a series of circular columns with a diameter d = 0.8 m, was used as a case study. Emphasis was placed on the effect of different soil properties on the computed fragilities. In this context, three distinct soil deposits of increasing Vs with depth were examined, with Vs ranging between 120 and 600 m/s. A numerical model was established in FE code ABAQUS, with the soil and structure being modeled using nonlinear models, following Zhong et al. [85]. The analysis was conducted for a suite of 21 far-field seismic records. The ground motions at bedrock were back-calculated by employing 1D response deconvolution analyses for all selected unscaled records. The latter ground motions were selected as input motions to the models and scaled up to cover PGAs ranging between 0.05 g and 0.8 g. The thresholds of damage states were defined based on nonlinear static pushover analysis, carried out following Wang’s method (Figure 7a). PGA- and PGV-based fragility curves were developed for all examined soil–structure configurations. A decrease in seismic vulnerability of the station with increasing stiffness of surrounding ground was generally reported (Figure 10). The proposed fragility curves were compared with existing empirical [47,48] and analytical [79] fragility curves, with the comparisons revealing differences.
Jiang et al. [90] investigated the effect of ground motion characteristics on the seismic fragility of subway stations in soft soils. The Caofang subway station in Beijing, China, was selected as a case study. The station is a two-story, two span structure, with external dimensions 21 × 13.8 (m). The structure is supported by a series of rectangular central columns (0.7 × 1.1 m) and is embedded at a burial depth of 3.5 m in a soft soil deposit (Vs ranging between 147 and 382 m/s). IDA was conducted on the selected soil–station configuration, using a 2D numerical model developed in FE code ABAQUS. Soil response was modeled with a viscoelastic constitutive model, developed by Zhuang et al. [91]. The concrete damage plasticity model was used to simulate the reinforced concrete, which simulates two failure mechanisms: tensile cracking and compressive crushing of the concrete material. A classic metal plasticity model was used to describe the behavior of the reinforcing rebars. The soil–structure interface was simulated via a contact model, considering a friction coefficient μ = 0.4. The analyses were performed for a set of 24 far-field records, 12 near-field records and 12 near-field records containing a pulse, to examine the potential effects of ground motion characteristics on the vulnerability of the station. A deconvolution procedure was employed to estimate the ground motion at bedrock level (which was used in the analyses). Four damage states were defined, using the interstory drift ratio θ as EDP. The thresholds of damage states were defined following Du et al. [92], who performed a series of pushover analyses on 18 actual subway stations found in several cities in China. Stations of various shapes (i.e., two story, two spans; two story, three spans; three-story, three spans) were examined, with local site conditions accounted for in the pushover analyses. In particular, the pushover analyses were conducted by using 3D numerical models of the examined configurations in FE code ABAQUS and introducing loads simulating the effects of both the horizontal and vertical earthquake excitation (the latter set as two-thirds of horizontal loading). Using the IDA results and PGA as IM, Jiang et al. [90] presented a series of PGA-based fragility curves. The use of near-field ground motions led to a higher seismic fragility of the station, compared to the cases where far-field ground motions were examined. The differences were generally attributed to the effects of ground motion characteristics on the response of the surrounding ground.
Zhang et al. [93] also investigated the effect of ground motion characteristics on the seismic vulnerability of subway stations, by examining the case of a subway station subjected to near-fault ground motions with velocity pulses. A 20.6 × 13.8 (m) two-story, three-span subway station was used as a case study. The station was assumed to be supported by a series of 1 × 0.7 (m) columns, introduced at an interval of 5.5 m. The station was assumed to be embedded at a depth of 4 m in soil classes I to IV, according to a Chinese code for seismic design of urban rail transit structures (Vs constant with depth, ranging from 635 to 125 m/s). The selected station–soil configurations were analyzed by means of 2D nonlinear time history analyses, carried out with FE code ABAQUS. The soil was simulated with a Mohr–Coulomb model. A bilinear model was used to simulate the steel rebars’ response, whereas for the concrete, a concrete damaged constitutive plasticity model, available in ABAQUS, was employed. The analyses were conducted for 121 near-fault ground motions. The maximum interstory drift ratio θ was used as EDP. Five damage states were defined, namely normal operational (NO), immediate operational (IO), reparable operational (RO), irreparable (IR) and complete collapse (CC), with the relevant thresholds being defined as per Du et al. [92] and Zhang et al. [93]. Based on the analyses results, analytical fragility curves were proposed using Sustained Maximum Acceleration (SMA) as IM for the assessment of the subway station in soil classes I and II, and the Velocity Spectrum Intensity (VSI) as IM for the assessment of the subway station in soil classes III and IV. PGA-based fragility curves were also provided for all examined systems.
He et al. [94] presented a methodology for the development of seismic demand models, capacity models, and fragility curves for the seismic vulnerability assessment of underground structures, accounting for the spatially varying soil properties around the structure. A method based on non-stationary random fields was proposed to model the random properties of soil, with the approach being calibrated based on data obtained by field tests (e.g., boreholes) at the area of interest. Full dynamic time-history analyses of the soil–structure configuration, using 2D numerical models in FE code ABAQUS, were proposed to evaluate the dynamic response of the examined structure. A nonlinear model, with a Mohr–Coulomb yield criterion and a plastic-damage constitutive model, was proposed for the simulation of the soil and structure, respectively. For the development of the PSDM and the analytical fragility curves, the maximum inter-story drift δd and PGV were proposed as EDP and IM, respectively. The study proposed the use of a bilinear model for the simulation of the seismic demand model (Figure 11), as follows:
where and are unknown fitting model parameters that need to be estimated, and are additive model errors, in which and are the standard deviations assumed to be constant and and are standard normal random variables. A Bayesian approach was proposed to calibrate the model. Four different damage states were proposed, with the relevant thresholds being estimated based on characteristic points of a pushover curve of the examined structure (i.e., Yield, Peak-yield, Peak, and Ultimate points), defined following Zhong et al. [73] (see Figure 7b). A formulation of fragility curves was finally proposed, based on the analysis of the data obtained, as described above:
where is a limit state function employed to define the failure event, and C and D represent the drift capacity and demand of the underground structure, which are developed following the discussion made above. The proposed method was applied on an embedded rectangular structure, referring to an actual structure in Guangzhou, China. A six-cell 37.4 × 5.45 m rectangular structure, embedded at a depth of 4 m was considered. The ground deposit was assumed to have a depth of 36 m. The random ground properties were obtained, accounting for the findings of a series of boreholes at the area of interest. The fragility analysis was conducted using 200 real ground motions, recorded at bedrock conditions. The selected ground motions were categorized into five categories, accounting for the magnitude and epicentral distance of relevant earthquake events. Upon definition of the parameters of the PSDM and of the damage state thresholds, fragility functions were derived. The researchers posed some limitations of their work, i.e., random field formulation works only for continuous/numerical predicted variables (e.g., unit weight, shear wave velocity, cohesion, and friction angle) and does not consider variables such as pore water pressure. In addition, calibrating a random field requires inversing a spatial covariance matrix, which can be computationally expensive when the spatial data size is large.
Table 4 summarizes the studies discussed above, along with some useful information regarding each study for comparison purposes.
3.2. Methods for Derivation of Fragility Curves for Tunnels and Underground Structures Subjected to Ground Seismic Shaking in the Longitudinal Direction
The fragility curves provided by ALA [47,48] and HAZUS [37] do not differentiate between the seismic response and vulnerability of tunnels or underground structures subjected to ground shaking in the transversal or longitudinal direction; hence, the curves can be used for the assessment of embedded structures against ground seismic shaking in both directions.
In addition to the empirical fragility curves, Dong et al. [95] developed a series of analytical fragility curves, focusing on the assessment of shield tunnels in soft soils, subjected to ground seismic shaking in the longitudinal direction. A numerical framework was proposed for this purpose, which included 3D dynamic time-history analyses of selected soil–tunnel configurations. In particular, circular shield tunnels, with diameters d = 6 m or 15 m, were examined. The tunnels were assumed to be embedded in soil classes II, III and IV, according to GB50909 [96], at burial depths ranging between 10, 20 and 36 m. The tunnels were assumed to be made of segments connected to each other through steel bolts. The number, diameter, and quality of circumferential bolts were ranged within a parametric study, to study the effect of these parameters on the seismic response and vulnerability of examined tunnels. The seismic response of the examined tunnels was computed using beam-on-soil-springs models in FE code ABAQUS. The tunnel segments were simulated as elastic beams in the 3D space, with soil compliance being modeled via springs. The bolts connecting the segments were simulated with nonlinear springs, allowing for relative movement of the segments and opening of the connecting joints. The soil springs were determined by employing 3D soil models, where axial and horizontal uniformly distributed loads were applied at the cavity position (where the tunnel is embedded) to compute soil reactions and, hence, derive the stiffnesses of relevant springs. The analyses were conducted with models of total length equal to 1080 m, with the seismic loading being applied on the models as a static load pattern through soil springs (i.e., loads due to relative displacement of the strata during an earthquake). The equivalent linear approximation was employed to account for the soil nonlinear response during shaking. Interestingly, no extensive reference was made on the employed springs of the numerical models, even though these parameters affect the computed response and, hence, the computed fragilities. The amount of the ring joint opening and dislocation between segments due to ground shaking were considered as EDPs. The former metric reflects the deformation caused by the axial tension, compression, and bending of the shield tunnel, whereas the latter constitutes a meter of deformation, caused by the horizontal and transverse shear of the shield tunnel. The liner was assumed to behave in a linear elastic fashion and no potential damage was considered on it. The analyses were conducted using 30 ground motions, which were divided into three examined sites evenly. PGV-based fragility curves were developed (Figure 12).
When the ring joint opening was adopted as EDP, fragility curves were developed for four performance states, i.e., opening of joints corresponding to elastic limit state of bolts, waterproof design value, waterproof limit value and tensile limit state of bolts. When dislocation was employed as EDP, fragility curves were developed for two performance states, i.e., transverse shear dislocation, corresponding to waterproof design value, and waterproof limit value. Comparing the fragility curves derived for various parameters examined in this study, the following conclusions were drawn:
- The effect of site conditions on the seismic vulnerability of the examined shield tunnels was higher than that of the burial depth of tunnels. Burial depth was found to have a more critical effect on the seismic vulnerability compared to that of dimensions of examined tunnels, while the effect of the spring stiffness of the rings connecting the segments was rather low.
- The computed fragility increased in cases where the tunnel was embedded in softer soil deposits, as well as for higher burial depths. The latter observation is rather interesting, since shallower tunnels are expected to be more vulnerable.
- The use of higher-grade bolts, as well as a higher stiffness of joint connections, were found to reduce the seismic vulnerability of examined tunnels, whereas the vulnerability of tunnels increased with the increase in their cross-section.
The effect of the axial tension–compression failure of the shield tunnel was reported to be more important than that of horizontal transverse shear failure. Table 5 summarizes the main aspects of the aforementioned studies.
4. Methods for Vulnerability Assessment of Underground Structures/Tunnels Subjected to Ground Shaking, Accounting for Corrosion Effects of the Lining
Ageing phenomena, e.g., corrosion of the lining, are expected to degrade the performance of embedded structures, leading to increased vulnerability against seismic loading. This topic has not been studied thoroughly yet. To the authors’ knowledge, the only available study is the one by Argyroudis et al. [66], who examined the effect of the ageing of lining (due to corrosion) on the vulnerability of bored circular tunnels, subjected to ground seismic shaking in the transversal direction. An uncoupled numerical framework was proposed for this purpose and applied to two tunnel sections, corresponding to an ‘old tunnel’, designed with a lower strength of concrete and lower reinforcement ratio, and an ‘new tunnel’, designed with higher specifications regarding the strength of concrete and reinforcement ratio. The seismic response of the examined tunnels (i.e., demand) was computed through 2D dynamic time-history analyses for increasing levels of seismic intensity, with the soil response being modeled using a visco-elasto-plastic model, with Mohr–Coulomb yield criterion and the soil–tunnel interface properties being considered via an advanced contact model. The EDP and damage state thresholds were defined following Argyroudis and Pitilakis [41]. The effect of corrosion on the capacity of tunnel liners and, hence, on their vulnerability, was considered in the section analysis of examined liners, using relevant studies for reinforced concrete structural elements of aboveground structures, i.e., FIB-Task Group 5.6 [97] guidelines. A corrosion initiation time (Tini) due to chloride ingress was initially estimated for examined liners. The selection of the parameters required to define the model for the examined tunnel sections were made accounting for associated environmental conditions, according to the relevant literature, as discussed in Argyroudis et al. [55]. The time-dependent loss of the reinforcement cross-sectional area due to the corrosion was expressed as (e.g., Ghosh and Padgett, [98]):
where n is the number of reinforcement bars, Di is the initial diameter of steel reinforcement, t is the elapsed time in years and D(t) is the reinforcement diameter at the end of (t-Tini) the years, which were defined as:
where is the rate of corrosion (mA/cm2) and κ is the corrosion penetration (μm/year), defined following the relevant literature [99]. Following the above framework, the loss of the reinforcement area was estimated for different corrosion scenarios (i.e., time t = 0, 50, 75, 100 years) and subsequently the reduction in the bending moment capacity was identified for the above scenarios. Based on the definition of damage states (i.e., damage states defined based on M/MRd), the effect of corrosion on damage state evaluation was inherently accounted for. Fragility curves were proposed for the examined tunnel sections for three damage states, i.e., minor damage, moderate damage, and extensive damage, and for distinct corrosion scenarios (i.e., 0, 50, 75, 100 years) using PGA at the ground surface (free-field conditions) as IMs (Figure 13). The vulnerability of tunnels was increased with the increasing number of years, due to the increasing effect of corrosion on the capacity of the liners, with the effect being more evident for the tunnel designed with lower specifications, regarding liner strength.
5. Methods for Vulnerability Assessment of Underground Structures/Tunnels Subjected to Seismically Induced Ground Failures
A series of studies on available methods for the assessment of tunnels and underground structures against seismically induced ground failures is presented herein.
Salmon et al. [57] proposed fragility curves for the assessment of the Berkeley Hills tunnel of the San Francisco Bay Area Rapid Transit (BART) system, against potential induced deformations due to movement of the nearby Hayward fault, using Permanent Ground Deformation (PGD) as IM. PGA-based fragility curves were also proposed for the assessment of the Transbay Tube against liquefaction.
HAZUS [37] presented fragility curves for the assessment of bored and cut and cover tunnels against seismic ground failures, based on empirical data and engineering judgement.
Employing centrifuge testing, Kiani et al. [100] examined the vulnerability of segmental circular tunnels in soft soil, subjected to seismically induced fault movements. The model tunnel was made of asbestos cement pipes, which were sliced properly and connected via joints to simulate segmental lining. The model was embedded in clean saturated sand (Firoozkuh #161 sand), while the soil–tunnel configuration was constructed in a split box, capable of simulating normal faults. Various ratios of thickness of overburden soil h over diameter d were tested (i.e., h/d = 0.75, 1.0, 1.2), and faulting angles ranged between 60° and 75°. The main reported damage patterns were longitudinal deformation, changing the slope of tunnel axis, cross-sectional deformations and sinkholes above the model tunnel. The observed behavior was used to define fragility curves for the assessment of tunnels subjected to faulting. Five distinct damage states were defined, based on the recorded response of the model tunnel during testing (i.e., deformation patterns were revealed from photos taken from inside of the tunnel and correlated with predefined damage states). The definition of damage states and the post-evaluation of the photographic material might have induced some uncertainty in the defined fragility curves. The researchers observed that segmental tunnels may undertake normal surface faulting, without sudden effects (e.g., collapse); in other words, these types of tunnels can withstand some level of deformation before damage and collapse, exhibiting a better performance compared to tunnels made of continuous lining. For lower damage states, the provided experimental fragility curves compared reasonably well with those proposed for ground failure effects by HAZUS [37]. A summary of available studies on the fragility assessment of tunnels and underground structures subjected to seismically induced ground failures is presented in Table 6.
6. Methods for Vulnerability Assessment of Tunnel Shafts
Tunnel shafts constitute a special category of embedded structures. The seismic vulnerability of this type of structure has received limited research interest. Mayoral et al. [101] developed analytical fragility curves for the assessment of floating tunnel shafts in soft soil subjected to ground seismic shaking, by employing 3D dynamic analyses of a representative shaft–soil configuration. A 30 m long shaft, with diameter d = 14 m and wall thickness t = 1 m, was examined. The shaft was assumed to be embedded in soil classes C and D, according to EN1998-1 [48], and was founded on a mat foundation, with thickness t = 2 m. The selected configuration was modeled in FD code FLAC 3D, with the shaft wall being simulated, with plate elements adopting a linear elastic model, and the soil being modeled with solid elements, employing a practice-oriented hysteretic model, available in FLAC 3D. The analyses were conducted for six ground motions, scaled at various intensity levels. The selected ground motions were applied at the base of the numerical model, assuming 100% of the scaled excitation being applied in one direction and 50% of the scaled excitation being applied in the orthogonal direction. The seismic damage was characterized based on the exceedance of the moment of resistance or normal force resistance of the shaft wall. Partial EDPs were proposed as the ratios of bending moment and normal force, over the bending moment capacity and normal tension force capacity, respectively, the latter obtained from the interaction diagram of the concrete wall, computed separately via section analyses (i.e., DIM = M/MRd, DIN = N/T). The global EDP was defined as the maximum of the partition damage indexes. Based on the latter definition, five damage states were defined, i.e., no damage, minor damage, moderate damage, extensive damage, and collapse, setting adequate thresholds. PGA-based fragility curves were developed based on the analysis results. A higher fragility was generally computed for the case where the tunnel shaft was embedded in the softer soil deposit, i.e., in soil class D.
7. Discussion
The ground seismic shaking acting in the transverse direction of embedded structures induces different deformation modes on the structures, compared to those induced by shaking acting in the longitudinal direction. Generally, the deformation modes associated with ground shaking in the transverse direction lead to a higher level of straining on the liners of structures [1,2]. This explains the higher interest of the scientific community in examining the vulnerability of embedded structures, focusing on the effects of ground seismic shaking acting in the transversal direction. Additionally, the limited interest in examining the vulnerability of embedded structures against seismically induced ground failure should be attributed partially to the complicated nature of these phenomena [44]. In the following sections, some critical aspects of the methods employed in the seismic vulnerability assessment of embedded structures are discussed.
7.1. Numerical Codes and Constitutive Models Used in Analytical Studies
Most analytical methodologies for the assessment of embedded structures against ground seismic shaking in the transversal direction employed 2D numerical models of ground structure configurations, to calculate the structural response (i.e., demand). The models were developed assuming plane strain conditions and were used to perform either full dynamic time-history analyses or static analyses. In the latter cases, the seismic loading was simulated in a pseudo-static fashion, by means of displacement patterns induced on the boundaries of the numerical models. Some studies used 2D numerical models of the examined ground structure configurations to perform pushover analyses, to estimate the structural capacity of, and set the thresholds for, the damage states to develop fragility functions. In most cases the general-purposed FE code ABAQUS was employed to perform the analyses (i.e., more than half of the studies) [56,63,64,65,66,82,84,85,89,90,91,92,93,94]. Other FE codes, such as PLAXIS 2D [61], MIDAS [51,60], and SAP2000 [79,80] were also used. Finite difference (FD) codes, oriented to geotechnical problems, such as FLAC 2D and FLAC 3D, were also employed in some studies [44,53,54], while the code UDEC (based on the discrete element method, DEM) was also employed in examined mountain tunnels in fractured rock [55].
A variety of constitutive models were employed to simulate the response of ground subjected to seismic shaking. In the simplest case, a linear elastic model [53,54], or approaches that employ the equivalent linear approximation in simulating the effect of the nonlinear response of ground under seismic shaking, were employed [63,64,65,66,67,68,69,70,76,77,78,79]. Nonlinear models that employ a Mohr–Coulomb yield criterion were also used widely [44,52,55,56,60,72,73,82]. In some studies, these models were calibrated by adjusting the stiffness and damping of the examined ground, based on results of separate 1D soil response analyses, aiming for a more realistic simulation of the ground response under lower earthquake-induced strains [52,65,71,73]. The validity of this approach has been tested in studies examining the seismic response of tunnels [102,103,104,105]. More advanced models were also employed in some studies, such as: the hardening soil model with small strain embedded in PLAXIS [61], a visco-elastic constitutive model proposed by Zhuang et al. [91], used in [90], and a nonlinear model with multi-nested yield surfaces, used in [86].
Most methodologies assumed total stresses and undrained conditions in the ground response analysis. The seismic vulnerability of embedded structures in undrained conditions and, specifically, the response associated with pore pressure build-up, due to ground shaking or liquefaction phenomena, has not received attention to date. Studies investigating the response and vulnerability of embedded structures in liquefiable soils are deemed necessary [27].
Regarding lining behavior, most studies referring to mountain tunnels in rock or bored tunnels in alluvial employed a linear elastic model [51,52,53,54,55,56,60,61,65,70,71,72,73,79]. The damage index and the damage state thresholds were defined using a separate section analysis for the examined liners, accounting for the effect of axial loading on the capacity of the liners in a simplified manner. Some studies employed concentrated plasticity approaches to account for the nonlinear response of tunnel liners, i.e., by using hinges to simulate inelastic zones of the liners [44,76,78]. More advanced nonlinear models were used to simulate the response of concrete linings of large rectangular embedded structures (e.g., subways); for example, the damage plasticity model proposed by Lubliner et al. [106], used in [93], the plastic-damage constitutive model of Lee and Fenves [107], used in [86], etc. In some studies, the concrete constitutive models were accompanied by nonlinear models to simulate the response of steel reinforcement, e.g., a bilinear relationship with alterative isotropic hardening, proposed by Guirguis and Mehanny [108], was applied in [93].
The only available analytical study on the seismic vulnerability of bored tunnels, subjected to ground shaking in the longitudinal direction [95], employed a simplified beam-on-springs model, to calculate the response of the examined tunnel for increasing levels of ground shaking, with tunnel segments being simulated with a linear elastic model, since the emphasis was placed on the seismic response of the connection elements of the segments (i.e., joints response). More advanced 3D numerical models, simulating the surrounding ground by means of continuum elements, would considerably increase the required computational cost of the analyses, particularly in the frame of a vulnerability assessment study. It is worth noting that critical parameters affecting the response and, therefore, the vulnerability of embedded structures subjected to ground shaking in the longitudinal direction have not been studied thoroughly (e.g., varying ground conditions along the axis of an embedded structure, asynchronous ground motion along the axis of an extended embedded structure, interface characteristics along the tunnel axis, etc.).
7.2. EDPs and Damage State Definitions for Vulnerability Assessment against Ground Seismic Shaking
Most studies referring to the vulnerability assessment of bored tunnels (in rock or soft soil), against ground seismic shaking in the transversal direction, employed M/MRd (i.e., ratio of acting bending moment over the capacity bending moment of the lining) as EDP, following Argyroudis and Pitilakis [52]. Some studies on rectangular cut and cover tunnels also followed a similar definition for the EDP [74]. The capacity bending moment was estimated based on section analyses of the examined liners, carried out separately for various axial loadings (to account indirectly for the effect of axial loading induced by seismic shaking on the capacity of the liners). The definitions of the thresholds of damage states were made based on expert judgment, again following Argyroudis and Pitilakis [52]. Despite the simple and straightforward definitions of EDP and damage state thresholds, the uncoupled approach proposed to compute the lining capacity and, hence, the EDP does not capture the variation of capacity accurately with time during ground shaking, associated with the variation of axial forces acting on the liner during ground shaking. Moreover, the linear elastic model employed by these studies does not replicate cracking and/or yielding phenomena on the liner, associated with the response at higher levels of ground shaking. As stated in Section 3.1.2, de Silva et al. [72] proposed an analytical method to account for the effect of axial load time dependency on the resistance bending moment of the lining and, hence, on the computation of the damage to capacity ratio. However, the definition was made for one damage state.
In addition to M/MRd, Fabozzi and Bilotta [61] proposed the use of φr/φ1 (i.e., the ratio of the permanent rotation of the joints connecting the segments, φr, over the first critical rotation of the joints, defined as φ1 = Nl2/6EI) as an additional EDP, focusing on the response of the joints of segmental tunnels. Avanaki et al. [63] suggested the use of a damage index that accounts for the potential damage of the segments or the joints, thus, composed of a lining ‘part’ and joint ‘part’ (see Equation (8)).
As discussed in Section 3.1.1, Andreotti and Lai [44] introduced hinges/inelastic zones on the linings to simulate the lining nonlinear response of mountain tunnels and defined the damage index based on the damage accumulated due to ground shaking in all zones. This index was then correlated with the ratio of the relative displacement between the crown of arch and the inverted arch, over the equivalent diameter of the tunnel lining cross-section (δ/Deq), which was used as EDP in the fragility analysis.
Several studies proposed the use of maximum drift ratio θ (i.e., maximum relative interstory displacement over the height of structure, θ = max(δ(t)/h)) as an adequate EDP for the assessment of rectangular tunnels and subway stations [76,78,82,84,85,86,89,93,94]. This displacement-based EDP, as well as the one proposed by Andreotti and Lai [44], are more compatible with the physics of the problem in hand. Indeed, ground shaking in the transverse direction results in an ovaling deformation of circular tunnels and a racking distortion of rectangular embedded structures, respectively. These deformation patterns may be associated directly with δ/Deq or interstory drift ratio θ.
Pushover analyses of embedded structures were employed by several studies to define the thresholds of damage states. In some studies, only the structure was modeled as a frame subjected to deformation patterns, replicating the ground shaking effect [85], while other studies proposed the use of 2D numerical models of the ground structure configurations [82,84], also accounting for the effect of the vertical component of ground shaking. Du et al. [92] performed a series of pushover analyses using 3D numerical models of actual subway stations, in real sites, to estimate the interstory drift thresholds for distinct performance (limit) states. The analysis approaches that also employ the ground are considered more efficient in replicating soil–structure interaction effects on the response and, hence, on the vulnerability of tunnels and embedded structures (e.g., distributions of earth pressures acting on the structure, effect of soil yielding on the structure). In this context, the definition of thresholds of damage states, based on such analyses, might be more rigorous; however, these approaches are associated with a much higher computational effort.
As far as the response/vulnerability of tunnels and underground structures against ground seismic shaking in the longitudinal direction is concerned, in the only available study [95], the joint opening between rings and the dislocation between segments were used as EDPs. The definitions of damage states and relevant thresholds were made based on performance criteria associated with the strength of the bolts connecting the segments, and water tightness design requirements.
7.3. Optimal Intensity Measures for Vulnerability Assessment against Ground Seismic Shaking
The characteristics of ground motion (i.e., amplitude, frequency content, duration, energy content, etc.) affect the seismic response and, therefore, the vulnerability of structures. However, describing all characteristics of ground motion by means of one parameter is not possible [109]. In this context, the selection of appropriate or optimal IMs for the assessment of structures is an important task. Several studies aimed at identifying optimal IMs for the seismic assessment of structures [110,111,112,113,114,115]. These studies employed various tests on the examined IMs, to identify the optimum (or optimal ones), with the most common tests being the efficiency test and sufficiency test [32,110]. An efficient IM results in the reduced variability of the structural performance (i.e., reduced variability of the computed EDP) for a given level of seismic intensity (i.e., for a given value of IM) [110]. Such a condition leads to a reduction in the number of ground motions and numerical analyses required to compute the exceedance probability of each value of the EDP for a given IM value [110]. The efficiency of a seismic IM may be quantified based on the computed dispersion of regression analyses of the EDP-IM dataset (i.e., the most efficient IM among the tested ones reveals the lowest dispersion). The use of a sufficient IM leads to a computed response that is conditionally independent of the characteristics of ground motions, e.g., earthquake magnitude (M), epicentral distance (R); hence, allowing for a free selection of ground motions in the analytical framework employed to compute the vulnerability of an examined structure [110]. The sufficiency of a seismic IM is evaluated based on the statistical significance of the residuals’ trend (i.e., the arithmetic differences between the computed values of EDP from the numerical analyses and the EDP values predicted from the regression fitting curve of the EDP-IM data) and the characteristics of the ground motions, i.e., magnitude or epicentral distance of the seismic event. The p-value test is often used as a quantitative measure for the statistical significance of regression estimates, with sufficient IMs leading to high p-values.
Additional tests have been proposed in the literature for identifying optimal IMs for structures, e.g., the proficiency test, the practicality test, the effectiveness test, the robustness test, and the hazard computability [111,112,113,114,115].
Some of the studies presented in Section 3 have tested various IMs to identify the optimal ones, for the seismic assessment of tunnels and subway stations. Andreotti and Lai [44] reported a better correlation of the computed response of examined mountain tunnels with PGV compared to PGA. To identify optimal IMs for bored tunnels in soft soil, Huang et al. [56] tested the correlation, efficiency, practicality, and proficiency of 18 IMs, based on regression analyses between the IMs (estimated at free-field conditions) and the dynamic response of the examined tunnels (expressed through an EDP), computed via a series of full dynamic analyses. A better performance of PGA (referring to ground surface) was reported for the examined case of a shallow tunnel, whereas in the cases of a moderately deep or deep tunnel, PGV (at the ground surface) was found to be the optimal IM among the tested ones. Huang and Zhang [71] tested 15 IMs to identify the optimal ones for shallow bored tunnels in alluvial. For the examined ground–tunnel configurations, PGA at ground surface was reported as the optimal IM, with PGV and acceleration spectrum intensity (ASI) following.
Comparing the outcome of regression analyses of EDP against all examined intensity measures, de Silva et al. [72] found that PGV at the ground surface better captured the seismic response of tunnels compared to PGA (i.e., higher R2 values were derived in the former case). A better performance in capturing the response of the examined tunnels was reported when the tested IMs referred to the ground motions, i.e., at bedrock conditions. This observation was attributed to the response of the sites’ underground shaking and the relevant effects on the values of tested IMs computed at ground surface.
Huang et al. [54] applied their ANN-based method for developing PSDM for bored tunnels, using various IMs, i.e., PGA, PGV, PGD, Fr1 = PGV/PGA, and Arias Intensity (Ia). A higher efficiency was reported for PGV, for the examined tunnel–ground configurations, by comparing the standard deviations of the correlations between each tested IM and computed EDP of the examined tunnel.
Higher research interest has been reported in the last few years, in identifying the optimal IMs for the assessment of rectangular embedded structures, particularly for subways. Nguyen et al. [79] used PGA, PGV and PGV/Vs30 as IMs to develop fragility curves. Lower dispersions were computed for regressions made in terms of PGV and PGV/Vs30 compared to PGA, revealing a better performance of these metrics for rectangular tunnels. He and Chen [82] reported better performance of PGA compared to PGV as IM for the assessment of a rectangular tunnel in stiff ground sit. A relatively large scatter was reported for PGA, in the case where the structure was assumed to be embedded in softer soil deposit. In a study assessing the vulnerability of the Daikai subway station in Kobe, Japan, that collapsed during the 1996 Great Hanshin earthquake, Zhong et al. [85] examined the efficiency of a series of IMs, i.e., PGA, PGV and Arias Intensity (Ia), estimated at various positions, including the bedrock, ground surface and at the depth of the station. Their analysis yielded a superior performance of PGA at ground surface and at the depth of structure, compared to the other examined measures. Zhuang et al. [86] tested a series of IMs to identify the optimal ones for the assessment of rectangular underground structures. PGA, PGV, Ia, and PBA, as well as the peak relative lateral displacement (PRLD) of the site, were tested by employing the efficiency test, practicality test, proficiency test, and comparing the correlation factors (R2) of relevant regression analyses of the EDP-IM datasets. Their analysis revealed a better performance from PGA and PRLD. A series of IMs, i.e., PGA, PGV, PGD, spectral acceleration at fundamental frequency Sa(T1) and PRLD, computed at the ground surface, bedrock and at the burial depth of the structure, were examined by Zhong et al. [89], to identify the optimal ones for the assessment of subway stations. The IMs were tested for their efficiency, practicality, proficiency, with PGA and PGV at the ground surface being reported as optimal. A similar study was presented by Zhang et al. [93], who tested 21 IMs, using the criteria of efficiency, practicality, proficiency, and sufficiency. To reduce the number of required analyses, the Spearman Rank Correlation Coefficient (SRCC) was used to evaluate the grade of interdependency among the examined IMs in the logarithmic space. Different IMs (i.e., the Sustained Maximum Acceleration, SMA, and the Velocity Spectrum Intensity, VSI) were proposed as optimal for distinct soil conditions, examined within the study.
PGA, PGV, PGD, spectral acceleration Sa, Arias Intensity Ia, and the root-mean square acceleration (RMSA) were tested by Dong et al. [95], using the criteria of correlation, efficiency, practicality, and proficiency to identify the optimal measures for the assessment of a circular segmental tunnel, subjected to ground seismic shaking in the longitudinal direction. The researchers reported PGV as the optimum measure for the examined ground–tunnel configurations and proposed relevant PGV-based curves for this purpose.
Summarizing, the use of optimal IMs is essential in the vulnerability assessment of any infrastructure asset; however, hazard computability, i.e., the ability to obtain information about the IM after an event, is of great importance, particularly in cases of extended structures, such as tunnels. This explains the common use of PGA and PGV as IMs in most of the studies presented in Section 3. The selection of these IMs is made (at least to some extent) on the basis that these metrics are commonly readily available for various scenarios (i.e., various return periods), for the assessment of extended embedded structures, pre- or post-event, and more importantly, for the post-event management of seismic hazard. Finally, it is worth noting that various assumptions were made regarding the position, where the above IMs should refer (i.e., outcrop conditions, bedrock, or ground surface at free-field conditions), with no conclusive answer given yet, regarding the optimal position.
7.4. Uncertainties in Vulnerability Assessment against Ground Seismic Shaking
In most analytical studies, the uncertainties associated with the vulnerability assessment of examined tunnels and underground structures were treated as discussed in Section 2. The uncertainties related to the definition of capacity of the examined element, (e.g., variability of mechanical and geometric properties or modeling uncertainties), were calculated through the lognormal standard deviation, estimated via least-square regression analyses of the EDP-IM data in the log–log space. For the definition of the uncertainties related to the demand (), and the of the definition of the damage states and EDP thresholds in defining damage levels (), most studies followed the relevant proposals of HAZUS [27], as proposed by Argyroudis and Pitilakis [52]. Given that the latter definitions are based on limited empirical data, research in this field seems necessary.
7.5. On the Development of PSDM for Vulnerability Assessment against Ground Seismic Shaking
Most analytical studies introduced least-squares regression analyses on datasets of EDP-IM, in the log–log space [39,40] to establish the PSDM. Such an analytical approach may be associated with a large number of dynamic analyses to establish the required data sets of EDP-IM, which are associated with considerable computational times. To reduce the computational effort, Artificial Neural Network (ANN) approaches have been recently proposed for the development of PSDM [53,54,73]. The main disadvantage of ANN-based approaches currently is the effort required to properly train the ANN model, given that available data from field records are generally not available; therefore, the use of output results from numerical analyses is mandatory.
7.6. On Vulnerability Assessment against Seismically Induced Ground Failures
Available studies on the vulnerability assessment of tunnels and underground structures against seismically induced ground failures are very limited compared to those referring to ground seismic shaking. This is partially attributed to the ‘nature’ of the specific seismic effects. For instance, fault deformation acting on a mountain tunnel constitutes a complex 3D problem, characterized by large uncertainties, which requires a site-specific investigation. At the same time, it affects a very limited part of the examined structure, which the in case of newly-built tunnels, is commonly identified (at least for known faults) during the design phase, to take the right measures and mitigate the high risk in advance [44]. In this context, limited research efforts have been made towards identifying and computing the vulnerability of embedded structures and tunnels against fault displacements.
7.7. Selection of Fragility Functions in Vulnerability Assessment Studies
Available fragility functions are applicable in cases of tunnels/underground structures with similar typologies, geometries and materials, and ground conditions with those adopted to develop these functions. The selection of adequate fragility functions should always be made carefully, employing calibration procedures with data collected from maintenance management systems of tunnels or underground structures [116]. Cartes et al. [117] and Selva et al. [69] highlighted the necessity of these calibration procedures. In cases where calibration procedures are not possible, the use of most suitable fragility curves might be an alternative. Rossetto et al. [118] proposed a systematic procedure for selecting suitable fragility curves (Figure 14), which differentiates between analytical and empirical curves and then classifies them based on their relevance and quality. The relevance criterion depends on the ability of each curve to represent the damage states of an examined element for a given range of hazard intensities. The quality criterion accounts for the rationality of the modeling approach and the quality of input data used to develop the fragility functions, as well as for the quality of technical documentation used to calibrate the fragility curves. Following this approach, Cartes et al. [117] presented a framework for the selection of fragility curves for the assessment of tunnels in Chile against seismic hazard, which included: (i) the selection of available fragility curves, using as a criterion the employed seismic IM, (ii) the selection of fragility curves referring to tunnel- or embedded structure–ground configurations, with similar characteristics to the ones of the examined cases and (iii) the evaluation of the selected fragility curves, based on the criteria set out by Rossetto et al. [118] (Figure 14). Each criterion was evaluated based on three scores, i.e., “low” (score 1), “medium” (score 2), and “high” (score 3), with final scores resulting from the sum of the qualifications for each criterion, the fragility curve with the highest final score being selected. In cases in which more than one fragility curve with similar scores are identified, it was proposed to combine these curves, as follows:
where n is the number of fragility curves, Pj (.) represents each fragility curve, E[P(.)] is the combination of fragility curves and wj is a weighted factor expressing the probability that j fragility curve is the most accurate one among the n curves combined, estimated for instance based on expert judgment [118].
Databases of existing empirical and analytical fragility functions, summarizing information, regarding the soil conditions, the characteristics of the tunnel/embedded structure to which the provided fragility curves refer to, the IM and EDP used to develop the fragility curves, the damage state definitions, and the definitions of relevant thresholds, in a common structure, facilitate the selection and evaluation procedure presented above. A novel database, containing all information required to select, evaluate, and apply available fragility functions, was recently developed within the research project INFRARES (www.infrares.gr, accessed on 25 February 2022) [119]. Each page of the database refers to a study and contains information about the typology of the ground–structure configuration examined, information regarding the used IM and EDP, as well as the definition of damage states, information about the parameters required to plot the fragility functions, as well as the methodology (analytical, empirical, or experimental) employed to develop the fragility functions. A graphical presentation of fragility functions is provided, allowing for a quick check of the ‘shape’ of functions. Finally, the full reference of the relevant publication is provided.
8. Conclusions
The paper presented a thorough state-of-the-art review on available methodologies for the vulnerability assessment of tunnels and underground structures against seismic hazards, highlighting recent breakthroughs in the field.
Despite the recent advances in the field, more research is deemed necessary in topics related to the seismic response and vulnerability of embedded structures, under drained soil conditions, the vulnerability of embedded structures against ground shaking in the longitudinal direction, as well as seismically induced ground failures. Furthermore, the development of time-dependent fragility functions accounts for potential cumulative effects, due to the sequence of earthquakes and/or aftershocks, as well as ageing effects of the lining on the seismic vulnerability. The research project INFRARES contributes in some of the topics mentioned above, towards more accurate and comprehensive resilience assessments of underground structures.
Author Contributions
Conceptualization, G.T.; investigation, G.T., A.K., S.S. and O.M.; writing—original draft preparation, G.T., A.K., S.S. and O.M.; writing—review and editing, G.T., A.K., S.S. and O.M.; visualization, G.T.; supervision, G.T.; project administration, G.T.; funding acquisition, G.T., A.K. and S.S. All authors have read and agreed to the published version of the manuscript.
Funding
The work reported in this paper was carried out in the framework of the research project INFRARES “Towards resilient transportation infrastructure in a multi-hazard environment” (https://www.infrares.gr/, accessed on 25 February 2022), funded by the Hellenic Foundation for Research and Innovation (H.F.R.I.) under the “2nd Call for H.F.R.I. Research Projects to support Post-Doctoral Researchers” (Project Number: 927).

Institutional Review Board Statement
Not applicable.
Data Availability Statement
Not applicable.
Acknowledgments
The funding received by the Hellenic Foundation for Research and Innovation (H.F.R.I.) is gratefully acknowledged.
Conflicts of Interest
The authors declare no conflict of interest. The funders had no role in the design of the study; in the collection, analyses, or interpretation of data; in the writing of the manuscript, or in the decision to publish the results.
References
- Hashash, Y.M.A.; Hook, J.J.; Schmidt, B.; Yao, J.I.C. Seismic design and analysis of underground structures. Tunn. Undergr. Space Technol. 2001, 16, 247–293. [Google Scholar] [CrossRef]
- Pitilakis, K.; Tsinidis, G. Performance and seismic design of underground structures. In Earthquake Geotechnical Engineering Design, Geotechnical Geological and Earthquake Engineering; Maugeri, M., Soccodato, C., Eds.; Springer: Dordrecht, The Netherlands, 2014; Volume 28, pp. 279–340. [Google Scholar]
- Kawashima, K. Seismic analysis of underground structures. J. Disaster Res. 2006, 1, 378–389. [Google Scholar] [CrossRef]
- Dowding, C.H.; Rozen, A. Damage to rock tunnels from earthquake shaking. J. Geotech. Eng. Div. 1978, 104, 175–191. [Google Scholar] [CrossRef]
- Owen, G.N.; Scholl, R.E. Earthquake Engineering Analysis of a Large Underground Structures; FHWA/RD-80/195; Federal Highway Administration and National Science Foundation: Alexandria, VA, USA, 1981.
- Sharma, S.; Judd, W.R. Underground opening damage from earthquakes. Eng. Geol. 1991, 30, 263–276. [Google Scholar] [CrossRef]
- Power, M.; Rosidi, D.; Kaneshiro, J.; Gilstrap, S.; Chiou, S.J. Summary and Evaluation of Procedures for the Seismic Design of Tunnels. Final Report for Task 112-d-5.3(c); National Center for Earthquake Engineering Research: Buffalo, NY, USA, 1998. [Google Scholar]
- Iida, H.; Hiroto, T.; Yoshida, N.; Iwafuji, M. Damage to Daikai subway station. Soils Found. 1996, 36, 283–300. [Google Scholar] [CrossRef]
- An, X.; Shawky, A.; Maekawa, K. The collapse mechanism of a subway station during the Great Hanshin earthquake. Cem. Concr. Compos. 1997, 19, 241–257. [Google Scholar] [CrossRef]
- Samata, S.; Ohuchi, H.; Matsuda, T. A study of the damage of subway structures during the 1995 Hanshin-Awaji earthquake. Cem. Concr. Compos. 1997, 19, 223–239. [Google Scholar] [CrossRef]
- Uenishi, K.; Sakurai, S. Characteristic of the vertical seismic waves associated with the 1995 Hyogo-ken Nanbu (Kobe), Japan earthquake estimated from the failure of the Daikai Underground Station. Earthq. Eng. Struct. Dyn. 2000, 29, 813–821. [Google Scholar] [CrossRef]
- Huo, H.; Bobet, A.; Fernández, G.; Ramírez, J. Load transfer mechanisms between underground structure and surrounding ground: Evaluation of the failure of the Daikai station. J. Geotech. Geoenviron. Eng. 2005, 131, 1522–1533. [Google Scholar] [CrossRef]
- Montesinos, G.J.P.; Bobet, A.; Ramírez, J.A. Evaluation of soil-structure interaction and structural collapse in Daikai station. ACI Struct. J. 2006, 103, 113–122. [Google Scholar]
- Kheradi, H.; Ye, B.; Nishi, H.; Oka, R.; Zhang, F. Optimum pattern of ground improvement for enhancing seismic resistance of existing box culvert buried in soft ground. Tunn. Undergr. Space Technol. 2017, 69, 187–202. [Google Scholar] [CrossRef]
- Ma, C.; Lu, D.; Du, D. Seismic performance upgrading for underground structures by introducing sliding isolation bearings. Tunn. Undergr. Space Technol. 2019, 69, 187–202. [Google Scholar] [CrossRef]
- Wang, W.L.; Wang, T.T.; Su, J.J.; Lin, C.H.; Seng, C.R.; Huang, T.H. Assessment of damage in mountain tunnels due to the Taiwan Chi-Chi earthquake. Tunn. Undergr. Space Technol. 2001, 16, 133–150. [Google Scholar] [CrossRef]
- Lu, C.C.; Hwang, J.H. Damage analysis of the new Sanyi railway tunnel in the 1999 Chi-Chi earthquake: Necessity of second lining reinforcement. Tunn. Undergr. Space Technol. 2019, 73, 48–59. [Google Scholar] [CrossRef]
- Wang, Z.Z.; Gao, B.; Jiang, Y.J.; Yuan, S. Investigation and assessment on mountain tunnels and geotechnical damage after the Wenchuan earthquake. Sci. China Ser. E-Technol. Sci. 2009, 52, 546–558. [Google Scholar] [CrossRef]
- Tao, S.; Gao, B.; Wen, Y.; Zhou, X. Investigation and analysis on seismic damages of mountain tunnels subjected to Wenchuan earthquake. Appl. Mech. Mat. 2011, 99–100, 273–281. [Google Scholar] [CrossRef]
- Li, T.B. Damage to mountain tunnels related to the Wenchuan earthquake and some suggestions for aseismic tunnel construction. Bull. Eng. Geol. Environ. 2012, 71, 297–308. [Google Scholar] [CrossRef]
- Chen, Z.; Shi, C.; Li, T.; Yuan, Y. Damage characteristics and influence factors of mountain tunnels under strong earthquakes. Nat. Hazards 2012, 61, 387–401. [Google Scholar] [CrossRef]
- Wang, Z.Z.; Zhang, Z. Seismic damage classification and risk assessment of mountain tunnels with a validation for the 2008 Wenchuan earthquake. Soil Dyn. Earthq. Eng. 2013, 45, 45–55. [Google Scholar] [CrossRef]
- Shen, Y.S.; Gao, B.; Yang, X.M.; Tao, S.J. Seismic damage mechanism and dynamic deformation characteristic analysis of mountain tunnel after Wenchuan earthquake. Eng. Geol. 2014, 180, 85–98. [Google Scholar] [CrossRef]
- Yu, H.T.; Yuan, Y.; Liu, X.; Li, Y.W.; Ji, S.W. Damages of the Shaohuoping road tunnel near the epicenter. Struct. Infrastruct. Eng. 2013, 9, 935–951. [Google Scholar] [CrossRef]
- Yu, H.T.; Chen, J.T.; Yuan, Y.; Zhao, X. Seismic damage of mountain tunnels during the 5.12 Wenchuan earthquake. J. Mt. Sci. 2016, 13, 1958–1972. [Google Scholar] [CrossRef]
- Yu, H.; Chen, J.; Bobet, A.; Yuan, Y. Damage observation and assessment of the Longxi tunnel during the Wenchuan earthquake. Tunn. Undergr. Space Technol. 2016, 54, 102–116. [Google Scholar] [CrossRef]
- Tsinidis, G.; De Silva, F.; Anastasopoulos, I.; Bilotta, E.; Bobet, A.; Hashash, Y.M.A.; He, C.; Kampas, G.; Knappett, J.; Madabhushi, G.; et al. Seismic behavior of tunnels: From experiments to analysis. Tunn. Undergr. Space Technol. 2020, 99, 103334. [Google Scholar] [CrossRef]
- Norwegian Geotechnical Institute. Syner-G Deliverable 3.7: Fragility functions for roadway system elements. In Systemic Seismic Vulnerability and Risk Analysis for Buildings, Lifeline Networks and Infrastructures Safety Gain; Norwegian Geotechnical Institute: Oslo, Norway, 2011. [Google Scholar]
- Argyroudis, S.; Kaynia, A.M. Fragility functions of highway and railway infrastructure. In SYNER-G: Typology Definition and Fragility Functions for Physical Elements at Seismic Risk; Pitilakis, K., Crowley, H., Kaynia, A.M., Eds.; Springer: Dordrecht, The Netherlands, 2014; pp. 299–326. [Google Scholar]
- El-Maissi, A.M.; Argyroudis, S.A.; Nazri, F.M. Seismic vulnerability assessment methodologies for roadway assets and networks: A state-of-the-art review. Sustainability 2020, 13, 61. [Google Scholar] [CrossRef]
- Cornell, C.A.; Krawinkler, H. Progress and challenges in seismic performance assessment. PEER Center News 2000, 32, 1–4. [Google Scholar]
- Luco, N.; Cornell, C.A. Structure-specific scalar intensity measures for near-source and ordinary earthquake ground motions. Earthq. Spec. 2007, 232, 357–392. [Google Scholar] [CrossRef] [Green Version]
- Negulescu, C.; Gehl, P. Mechanical methods: Fragility curves and pushover analysis. In Seismic Vulnerability of Structures; Gueguen, P., Ed.; John Wiley & Sons: Hoboken, NJ, USA, 2013; pp. 63–110. [Google Scholar]
- Gehl, P.; Seyedi, D.M.; Douglas, J. Vector-valued fragility functions for seismic risk evaluation. Bull. Earthq. Eng. 2013, 11, 365–384. [Google Scholar] [CrossRef] [Green Version]
- Argyroudis, S.A.; Mitoulis, S.A.; Winter, M.G.; Kaynia, A.M. Fragility of transport assets exposed to multiple hazards: State-of-the-art review toward infrastructural resilience. Reliab. Eng. Syst. Saf. 2019, 191, 106567. [Google Scholar] [CrossRef]
- D’Ayala, D.; Gehl, P.; Martinovic, K.; Gavin, K.; Clarke, J.; Tucker, M.; Corbally, R.; Avdeeva, Y.V.; van Gelder, P.; Salceda Page, M.T.; et al. Deliverable D3.2: Fragility Functions Matrix. In Novel Indicators for Identifying Critical INFRAstructure at RISK from Natural Hazards; European Commission: Brussels, Belgium, 2015. [Google Scholar]
- HAZUS. Hazus Earthquake Model Technical Manual; Hazus 4.2 SP3; FEMA: Washington, DC, USA, 2004.
- Rossetto, T.; Elnashai, A. Derivation of vulnerability functions for European-type RC structures based on observational data. Eng. Struct. 2003, 25, 1241–1263. [Google Scholar] [CrossRef]
- Baker, J.W. Probabilistic structural response assessment using vector-valued intensity measures. Earthq. Eng. Struct. Dyn. 2007, 36, 1861–1883. [Google Scholar] [CrossRef]
- Cornell, C.A.; Jalayer, F.; Hamburger, R.O.; Foutch, D.A. Probabilistic basis for 2000 SAC Federal Emergency Management Agency steel moment frame guidelines. J. Struct. Eng. 2002, 128, 526–533. [Google Scholar] [CrossRef] [Green Version]
- Gehl, P.; Douglas, J.; Seyedi, D.M. Influence of the number of dynamic analyses on the accuracy of structural response estimates. Earthq. Spectra 2015, 31, 97–113. [Google Scholar] [CrossRef] [Green Version]
- Shinozuka, M.; Feng, M.Q.; Kim, H.K.; Uzawa, T.; Ueda, T. Statistical Analysis of Fragility Curves; Technical Report MCEER-03-0002; State University of New York: Buffalo, NY, USA, 2003. [Google Scholar]
- Eskesen, S.; Tengborg, P.; Kampmann, J.; Veicherts, T. Guidelines for tunnelling risk management. Tunn. Undergr. Space Technol. 2004, 19, 217–237. [Google Scholar] [CrossRef]
- Andreotti, G.; Lai, C.G. Use of fragility curves to assess the seismic vulnerability in the risk analysis of mountain tunnels. Tunn. Undergr. Space Technol. 2019, 91, 103008. [Google Scholar] [CrossRef]
- NCHRP (National Cooperative Highway Research Program). Making Transportation Tunnels Safe and Secure; NCHRP Report 525; National Cooperative Highway Research Program: Washington, DC, USA, 2006; Volume 12. [Google Scholar]
- ATC. ATC-13 Earthquake Damage Evaluation Data for California; Applied Technology Council: Redwood City, CA, USA, 1985. [Google Scholar]
- ALA (American Lifelines Alliance). Seismic Fragility Formulations for Water Systems. Part 1—Guideline; ASCE-FEMA: Reston, VA, USA, 2001. Available online: http://cidbimena.desastres.hn/docum/crid/CD_Agua/pdf/eng/doc14609/doc14609.htm (accessed on 30 December 2021).
- ALA (American Lifelines Alliance). Seismic Fragility Formulations for Water Systems. Part 2—Appendices; ASCE-FEMA: Reston, VA, USA, 2001. Available online: http://cidbimena.desastres.hn/pdf/eng/doc14610/doc14610.htm (accessed on 30 December 2021).
- Corigliano, M.; Lai, C.G.; Barla, G. Seismic Vulnerability of Rock Tunnels Using Fragility Curves. In Proceedings of the 11th Congress of the International Society for Rock Mechanics, Lisbon, Portugal, 9–13 July 2007; Sousa, R., Grossmann, O., Eds.; Taylor & Francis Group: London, UK, 2007. [Google Scholar]
- Kim, H.; Shin, C.; Lee, T.; Lee, J.; Park, D. A study on the development of the seismic fragility functions of the high speed railway tunnels in use. J. Korean Geoenviron. Soc. 2014, 15, 67–75. [Google Scholar] [CrossRef] [Green Version]
- Osmi, S.K.C.; Ahmad, S.M.; Adnan, A. Seismic fragility analysis of underground tunnel buried in rock. In Proceedings of the 50th International Conference on Earthquake Engineering and Seismology, Kiel, Germany, 12–16 May 2015. [Google Scholar]
- Argyroudis, S.A.; Pitilakis, K.D. Seismic fragility curves of shallow tunnels in alluvial deposits. Soil Dyn. Earthq. Eng. 2012, 35, 1–12. [Google Scholar] [CrossRef]
- Huang, G.; Qiu, W.; Zhang, J. Modelling seismic fragility of a rock mountain tunnel based on support vector machine. Soil Dyn. Earthq. Eng. 2017, 102, 160–171. [Google Scholar] [CrossRef]
- Qiu, W.; Huang, G.; Zhou, J.; Xu, W. Seismic vulnerability analysis of rock mountain tunnel. Int. J. Geomech. 2018, 18, 04018002. [Google Scholar] [CrossRef]
- Sarkar, R.; Pareek, K. Influence of stratification and assessment of fragility curves for mountain tunnels. Geotech. Eng. 2021, 174, 279–290. [Google Scholar] [CrossRef]
- Zi, H.; Ding, Z.; Ji, X.; Liu, Z.; Shi, C. Effect of voids on the seismic vulnerability of mountain tunnels. Soil Dyn. Earthq. Eng. 2021, 148, 106833. [Google Scholar] [CrossRef]
- Salmon, M.; Wang, J.; Jones, D.; Wu, C. Fragility formulations for the BART system. In Proceedings of the 6th U.S. Conference on Lifeline Earthquake Engineering, TCLEE, Long Beach, CA, USA, 10–13 August 2003. [Google Scholar]
- ISO 23469; Bases for Design of Structures—Seismic Actions for Designing Geotechnical Works; ISO TC 98/SC3/WG10. ISO International Standard: Geneva, Switzerland, 2005.
- CEN EN 1998-1; Eurocode 8 Design of Structures for Earthquake Resistance. European Committee for Standardization: Brussels, Belgium, 2004.
- Osmi, S.K.C.; Ahmad, S.M. Seismic fragility curves for shallow circular tunnels under different soil conditions. Inter. J. Civ. Environ. Eng. 2016, 10, 1351–1357. [Google Scholar]
- Fabozzi, S.; Bilotta, E. A Numerical Study on Seismic Vulnerability of Tunnel Linings. In Proceedings of the III Conference on Performance Based Design in Earthquake Geotechnical Engineering, Vancouver, BC, Canada, 16–19 July 2017. [Google Scholar]
- Janssen, P. Tragverhalten von Tunnelausbauten mit Gelenktübbings; Report No. 83-41; Department of Civil Engineering, Institute for Structural Analysis University of Braunschweig: Braunschweig, Germany, 1983. [Google Scholar]
- Avanaki, M.J.; Hoseini, A.; Vahdani, S.; de Santos, C. Seismic fragility curves for vulnerability assessment of steel fiber reinforced concrete segmental tunnel linings. Tunn. Undergr. Space Technol. 2018, 78, 259–274. [Google Scholar] [CrossRef]
- Wang, J.N. Seismic Design of Tunnels: A Simple State of the Art Design Approach; Parsons Brinckerhoff Inc.: New York, NY, USA, 1993. [Google Scholar]
- Huang, Z.-K.; Pitilakis, K.; Tsinidis, G.; Argyroudis, S.; Zhang, D.-M. Seismic vulnerability of circular tunnels in soft soil deposits: The case of Shanghai metropolitan system. Tunn. Undergr. Space Technol. 2020, 98, 103341. [Google Scholar] [CrossRef]
- Argyroudis, S.; Tsinidis, G.; Gatti, F.; Pitilakis, K. Effects of SSI and lining corrosion on the seismic vulnerability of shallow circular tunnels. Soil Dyn. Earthq. Eng. 2017, 98, 244–256. [Google Scholar] [CrossRef]
- Huang, Z.-K.; Pitilakis, K.; Argyroudis, S.; Tsinidis, G.; Zhang, D.-M. Selection of optimal intensity measures for fragility assessment of circular tunnels in soft soil deposits. Soil Dyn. Earthq. Eng. 2021, 145, 106724. [Google Scholar] [CrossRef]
- Werner, S.D.; Taylor, C.E.; Cho, S.; Lavoie, J.-P.; Huyck, C.K.; Eitzel, C.; Chung, H.; Eguchi, R.T. Redars 2. Methodology and Software for Seismic Risk Analysis of Highway Systems; Special Report MCEER-060SP08; University of Buffalo, The State University of New York: Buffalo, NY, USA, 2006. [Google Scholar]
- Selva, J.; Argyroudis, S.; Pitilakis, K. Impact on loss/risk assessments of intermodal variability in vulnerability analysis. Nat. Hazards 2013, 67, 723–746. [Google Scholar] [CrossRef] [Green Version]
- Hu, X.; Zhou, Z.; Chen, H.; Ren, Y. Seismic fragility analysis of tunnels with different buried depth in a soft soil. Sustainability 2020, 12, 892. [Google Scholar] [CrossRef] [Green Version]
- Huang, Z.-K.; Zhang, D.-M. Scalar- and vector-valued vulnerability analysis of shallow circular tunnel in soft soil. Transp. Geotech. 2021, 27, 100505. [Google Scholar] [CrossRef]
- De Silva, F.; Fabozzi, S.; Nikitas, N.; Bilotta, E.; Fuentes, R. Seismic vulnerability of circular tunnels in sand. Géotechnique 2021, 71, 1056–1070. [Google Scholar] [CrossRef] [Green Version]
- Huang, Z.-K.; Argyroudis, S.; Pitilakis, K.; Zhang, D.; Tsinidis, G. Fragility assessment of tunnels in soft soils using artificial neural networks. Undergr. Space, 2021; in press. [Google Scholar] [CrossRef]
- Le, T.S.; Huh, J.; Park, J.-H. Earthquake fragility assessment of the underground tunnel using an efficient SSI analysis approach. J. Appl. Math. Phys. 2014, 2, 1073–1078. [Google Scholar] [CrossRef] [Green Version]
- Ryong, H.S.; Dam, L.H.; Soo, L.C. Seismic fragility of underground utility tunnels considering probabilistic site response analysis. J. Korean Soc. Hazard Mitig. 2016, 16, 31–37. [Google Scholar]
- Huh, J.; Le, T.S.; Kang, C.; Kwak, K.; Park, I.-J. A probabilistic fragility evaluation method of a RC box tunnel subjected to earthquake loadings. J. Korean Tunn. Undergr. Space Assoc. 2017, 19, 143–159. [Google Scholar] [CrossRef] [Green Version]
- FEMA (Federal Emergency Management Agency) 356. Pre-Standard and Commentary for the Seismic Rehabilitation of Buildings; FEMA: Washington, DC, USA, 2000.
- Huh, J.; Tran, Q.H.; Haldar, A.; Park, I.; Ahn, J.-H. Seismic vulnerability assessment of a shallow two-story underground RC box structure. Appl. Sci. 2017, 7, 735. [Google Scholar] [CrossRef] [Green Version]
- Nguyen, D.-D.; Park, D.; Shamsher, S.; Nguyen, V.-Q.; Lee, T.-H. Seismic vulnerability assessment of rectangular cut-and-cover subway tunnels. Tunn. Undergr. Space Technol. 2019, 86, 247–261. [Google Scholar] [CrossRef]
- Nguyen, D.-D.; Lee, T.-H.; Nguyen, V.-Q.; Park, D. Seismic damage analysis of box metro tunnels accounting for aspect ratio and shear failure. Appl. Sci. 2019, 9, 3207. [Google Scholar] [CrossRef] [Green Version]
- MLTM (Ministry of Land, Transport and Maritime Affairs). Earthquake Resistance Design Regulations for Subway Structures; Ministry of Land, Transport and Maritime Affairs of Korea: Seoul, Korea, 2009. [Google Scholar]
- He, Z.; Chen, Q. Vertical seismic effect on the seismic fragility seismic vulnerability of large-space underground structures. Adv. Civ. Eng. 2019, 2019, 9650294. [Google Scholar]
- Qing, J.R.; Feng, B.R. Experimental study on seismic behavior of different seismic grade RC columns. J. Build. Struct. 2014, 35, 105–114. [Google Scholar]
- Jiang, J.; Xu, C.; El Naggar, H.M.; Du, X.; Xu, Z.; Assaf, J. Improved pushover method for seismic analysis of shallow buried underground rectangular frame structure. Soil Dyn. Earthq. Eng. 2021, 140, 106363. [Google Scholar] [CrossRef]
- Zhong, Z.; Shen, Y.; Zhao, M.; Li, L.; Du, X.; Hao, H. Seismic fragility assessment of the Daikai subway station in layered soil. Soil Dyn. Earthq. Eng. 2020, 132, 106044. [Google Scholar] [CrossRef]
- Zhuang, H.; Yang, J.; Chen, S.; Dong, Z.; Chen, G. Statistical numerical method for determining seismic performance and fragility of shallow-buried underground structure. Tunn. Undergr. Space Technol. 2021, 116, 104090. [Google Scholar] [CrossRef]
- Zhuang, H.Y.; Chen, G.X. A viscous-plastic model for soft soil under cyclic loadings. In Soil and Rock Behavior and Modelling, Proceedings of the Geo-Shanghai Conference, Shanghai, China, 6–8 June 2006; Geotechnical Special Publication of ASCE, Soil and Rock Behavior and Modelling; American Society of Civil Engineers: Reston, VA, USA, 2006; pp. 343–350. [Google Scholar]
- Dassault Systèmes Simulia Corp. ABAQUS 6.11 Theory Manual; Dassault Systèmes Simulia Corp.: Providence, RI, USA, 2012. [Google Scholar]
- Zhong, Z.; Shen, Y.; Zhao, M.; Li, L.; Du, X. Seismic performance evaluation of two-story and three-span subway station in different engineering sites. J. Earthq. Eng. 2021, 1–31. [Google Scholar] [CrossRef]
- Jiang, J.; El Nggar, H.; Xu, C.; Zhong, Z.; Du, X. Effect of ground motion characteristics on seismic fragility of subway station. Soil Dyn. Earthq. Eng. 2021, 143, 106618. [Google Scholar] [CrossRef]
- Zhuang, H.; Chen, G.; Liang, Y.; Xu, M. A developed dynamic viscoelastic constitutive relation of soil and implemented by ABAQUS software. Rock Soil Mech. 2007, 28, 436–442. [Google Scholar]
- Du, X.; Jiang, J.; El Naggar, H.M.; Xu, C.; Xu, Z. Interstory drift ratio associated with performance objectives for shallow-buried multistory and span subway stations in inhomogeneous soil profiles. Earthq. Eng. Struct. Dyn. 2021, 50, 655–672. [Google Scholar] [CrossRef]
- Zhang, C.; Zhao, M.; Zhong, Z.; Du, X. Seismic intensity measures and fragility analysis for subway stations subjected to near-fault ground motions with velocity pulses. J. Earthq. Eng. 2021, 1–27. [Google Scholar] [CrossRef]
- He, Z.; Xu, H.; Gardoni, P.; Zhou, Y.; Wang, Y.; Zhao, Z. Seismic demand and capacity models, and fragility estimates for underground structures considering spatially varying soil properties. Tunn. Undergr. Space Technol. 2022, 119, 104231. [Google Scholar] [CrossRef]
- Dong, Z.; Kuo, C.; Yin, J.; Wen, S.; Ganzhi, L.; Gou, Y. Examination of longitudinal seismic vulnerability of shield tunnels utilizing incremental dynamic analysis. Front. Earth Sci. 2021, 9, 779879. [Google Scholar] [CrossRef]
- GB50909; Code for Seismic Design of Urban Rail Transit Structures. China Planning Press: Beijing, China, 2014.
- CEB-FIB Task Group 5.6. Model for Service Life Design; Fédération Internationale du Béton (FIB): Lausanne, Switzerland, 2006. [Google Scholar]
- Ghosh, J.; Padgett, J.E. Aging considerations in the development of time-dependent seismic fragility curves. J. Struct. Eng. 2000, 136, 1497–1511. [Google Scholar] [CrossRef]
- Stewart, M. Spatial variability of pitting corrosion and its influence on structural fragility and reliability of RC beams in flexure. Struct. Saf. 2000, 26, 453–470. [Google Scholar] [CrossRef]
- Kiani, M.; Ghalandarzadeh, A.; Akhlaghi, T.; Ahmadi, M. Experimental evaluation of vulnerability for urban segmental tunnels subjected to normal surface faulting. Soil Dyn. Earthq. Eng. 2016, 89, 28–37. [Google Scholar] [CrossRef]
- Mayoral, J.M.; Argyroudis, S.; Castañon, E. Vulnerability of floating tunnel shafts for increasing earthquake loading. Soil Dyn. Earthq. Eng. 2015, 80, 1–10. [Google Scholar] [CrossRef]
- Tsinidis, G.; Pitilakis, K.; Madabhushi, G. On the dynamic response of square tunnels in sand. Eng. Struct. 2016, 125, 419–437. [Google Scholar] [CrossRef] [Green Version]
- Tsinidis, G.; Rovithis, E.; Pitilakis, K.; Chazelas, J.-L. Seismic response of box-type tunnels in soft soil: Experimental and numerical investigation. Tunn. Undergr. Space Technol. 2016, 59, 199–214. [Google Scholar] [CrossRef]
- Tsinidis, G.; Pitilakis, K.; Anagnostopoulos, C. Circular tunnels in sand: Dynamic response and efficiency of seismic analysis methods at extreme lining flexibilities. Bull. Earthq. Eng. 2016, 14, 2903–2929. [Google Scholar] [CrossRef]
- Tsinidis, G.; Pitilakis, K.; Madabhushi, G.; Heron, C. Dynamic response of flexible square tunnels: Centrifuge testing and validation of existing design methodologies. Géotechnique 2015, 65, 401–417. [Google Scholar] [CrossRef] [Green Version]
- Lubliner, J.; Oliver, J.; Oller, S.; Onate, E. A plastic-damage model for concrete. Inter. J. Sol. Struct. 1989, 25, 299–326. [Google Scholar] [CrossRef]
- Lee, J.H.; Fenves, G.L. Plastic-damage model for cyclic loading of concrete structures. J. Eng. Mech. 1998, 124, 892–900. [Google Scholar] [CrossRef]
- Guirguis, J.; Mehanny, S. Evaluating code criteria for regular seismic behavior of continuous concrete box girder bridges with unequal height piers. J. Bridge Eng. 2012, 18, 486–498. [Google Scholar] [CrossRef]
- Baker, J.W.; Cornell, C.A. A vector-valued ground motion intensity measure consisting of spectral acceleration and epsilon. Earthq. Eng. Struct. Dyn. 2005, 34, 1193–1217. [Google Scholar] [CrossRef]
- Shome, N.; Cornell, C.A.; Bazzurro, P.; Carballo, J.E. Earthquakes, records, and nonlinear responses. Earthq. Spectra 1998, 14, 469–500. [Google Scholar] [CrossRef]
- Vamvatsikos, D.; Cornell, C.A. Developing efficient scalar and vector intensity measures for IDA capacity estimation by incorporating elastic spectral shape information. Earthq. Eng. Struct. Dyn. 2005, 34, 1573–1600. [Google Scholar] [CrossRef]
- Padgett, J.E.; DesRoches, R. Methodology for the development of analytical fragility curves for retrofitted bridges. Earthq. Eng. Struct. Dyn. 2008, 37, 1157–1174. [Google Scholar] [CrossRef]
- Padgett, J.E.; Nielson, B.G.; DesRoches, R. Selection of optimal intensity measures in probabilistic seismic demand models of highway bridge portfolios. Earthq. Eng. Struct. Dyn. 2008, 37, 711–725. [Google Scholar] [CrossRef]
- Shakib, H.; Jahangiri, V. Intensity measures for the assessment of the seismic response of buried steel pipelines. Bull. Earthq. Eng. 2018, 14, 1265–1284. [Google Scholar] [CrossRef]
- Tsinidis, G.; Di Sarno, L.; Sextos, A.; Furtner, P. Optimal intensity measures for the structural assessment of buried steel natural gas pipelines due to seismically induced axial compression at geotechnical discontinuities. Soil Dyn. Earthq. Eng. 2020, 131, 106030. [Google Scholar] [CrossRef]
- Silva, V.; Akkar, S.; Baker, J.; Bazzurro, P.; Castro, J.M.; Crowley, H.; Dolsek, M.; Galasso, C.; Lagormasino, S.; Monteiro, R.; et al. Current challenges and future trends in analytical fragility and vulnerability modeling. Earthq. Spec. 2019, 35, 1927–1952. [Google Scholar] [CrossRef]
- Cartes, P.; Chamorro, A.; Echaveguren, T. Seismic risk evaluation of highway tunnel groups. Nat. Hazards 2021, 108, 2101–2121. [Google Scholar] [CrossRef]
- Rossetto, T.; D’Ayala, D.; Ioannou, I.; Meslem, A. Evaluation of existing fragility curves. In SYNER-G: Typology Definition and Fragility Functions for Physical Elements at Seismic Risk, Geotechnical, Geological and Earthquake Engineering; Pitilakis, K., Ed.; Springer: Dordrecht, The Netherlands, 2014; Volume 27, pp. 47–93. [Google Scholar]
- Tsinidis, G.; Karatzetzou, A.; Stefanidou, S.; Markogiannaki, O. Deliverable D3.1: State of the art report regarding methodologies for multi-hazard vulnerability assessment of tunnels. In INFRARES. Towards Resilient Transportation Infrastructure in a Multi-Hazard Environment; Aristotle University of Thessaloniki: Thessaloniki, Greece, 2022. [Google Scholar]
Figure 1.
Example of fragility curve representing the probability of exceeding damage state DS1 (modified after [36]).
Figure 1.
Example of fragility curve representing the probability of exceeding damage state DS1 (modified after [36]).

Figure 2.
Analytical fragility curves proposed by Huang et al. [53] developed for a circular tunnel in rock for various damage states, assuming no-slip (NS) and full-slip (FS) interface conditions.
Figure 2.
Analytical fragility curves proposed by Huang et al. [53] developed for a circular tunnel in rock for various damage states, assuming no-slip (NS) and full-slip (FS) interface conditions.

Figure 3.
Definition of Damage Index (DI) and EDP for mountain tunnels and correlation between these metrics, following Andreotti and Lai [34].
Figure 3.
Definition of Damage Index (DI) and EDP for mountain tunnels and correlation between these metrics, following Andreotti and Lai [34].

Figure 4.
Analytical fragility curves developed by Argyroudis and Pitilakis [52] for a circular tunnel in alluvial for various damage states, assuming various soil classes for surrounding ground.
Figure 4.
Analytical fragility curves developed by Argyroudis and Pitilakis [52] for a circular tunnel in alluvial for various damage states, assuming various soil classes for surrounding ground.

Figure 5.
Framework to derive an ANN-based PSDM proposed by Huang et al. [73].
Figure 5.
Framework to derive an ANN-based PSDM proposed by Huang et al. [73].

Figure 6.
(a) Location of hinges for the analysis of rectangular tunnels; (b) definition of hinges response and damage states (IO: Immediate Occupancy limit state, LS: Life Safe limit state, CP: Collapse Prevention limit state, redrawn after Huh et al. [76]).
Figure 6.
(a) Location of hinges for the analysis of rectangular tunnels; (b) definition of hinges response and damage states (IO: Immediate Occupancy limit state, LS: Life Safe limit state, CP: Collapse Prevention limit state, redrawn after Huh et al. [76]).

Figure 7.
Simplified frame analysis models proposed by Wang [64], (a) concentrated force, (b) triangular distribution (redrawn after Huo et al. [76]).

Figure 8.
(a) Conceptual model for pushover analysis of an embedded structure and definition of control section for recording capacity, (b) thresholds of damage/performance states on shear force–drift capacity curve derived via pushover analysis (θy: drift ratio corresponding to yield point B, θp: drift ratio corresponding to peak strength point C, θu: drift ratio corresponding to ultimate strength point D defined at the moment when shear force drops to 85% of the peak force, θOP: drift ratio threshold for performance state: OP, θLS: drift ratio threshold for performance state: LS) (modified after He and Chen, [82]).

Figure 9.
(a) Conceptual model for pushover analysis of an embedded structure/station and definition of control element for recording capacity, (b) definition of thresholds of damage/performance states on shear force–drift capacity curve developed via the pushover analysis (θA: drift ratio corresponding to yield point A, θC: drift ratio corresponding to peak strength point C, θB: drift ratio corresponding to point B, defined by the intersection point between the extension line of the initial stiffness and the horizontal line corresponding to the peak shear force, θD: drift ratio corresponding to ultimate strength point D, defined at the moment when shear force drops to 85% of the peak shear force) (modified after Zhong et al. [85]).

Figure 10.
Analytical fragility curves proposed by Zhong et al. [89] developed for a two-story, three span subway station in alluvial for various damage states, assuming various conditions for surrounding ground.
Figure 10.
Analytical fragility curves proposed by Zhong et al. [89] developed for a two-story, three span subway station in alluvial for various damage states, assuming various conditions for surrounding ground.

Figure 11.
Bilinear seismic demand model proposed by He et al. [94].
Figure 11.
Bilinear seismic demand model proposed by He et al. [94].

Figure 12.
Analytical fragility curves developed by Dong et al. [95] for segmental circular tunnels, subjected to ground seismic shaking in the longitudinal direction, for various damage states (JO: Joint Opening; EL: Elastic Limit of bolts (PL1); WDV: Waterproofness Design Value (PL2); WLS: Waterproofness Limit State (PL3); BTL: Tensile Limit of bolts (PL4)), assuming various burial depths, h.

Figure 13.
Analytical fragility curves developed by Argyroudis et al. [66] for segmental circular tunnels in soft soil (soil class D), for various damage states and various scenarios regarding corrosion (i.e., t0 = 0 years, t50 = 50 years, t75 = 75 years, t100 = 100 years after initiation of corrosion).

Figure 14.
Criteria for selecting fragility functions, after Rossetto et al. [118]; Cartes et al. [117].


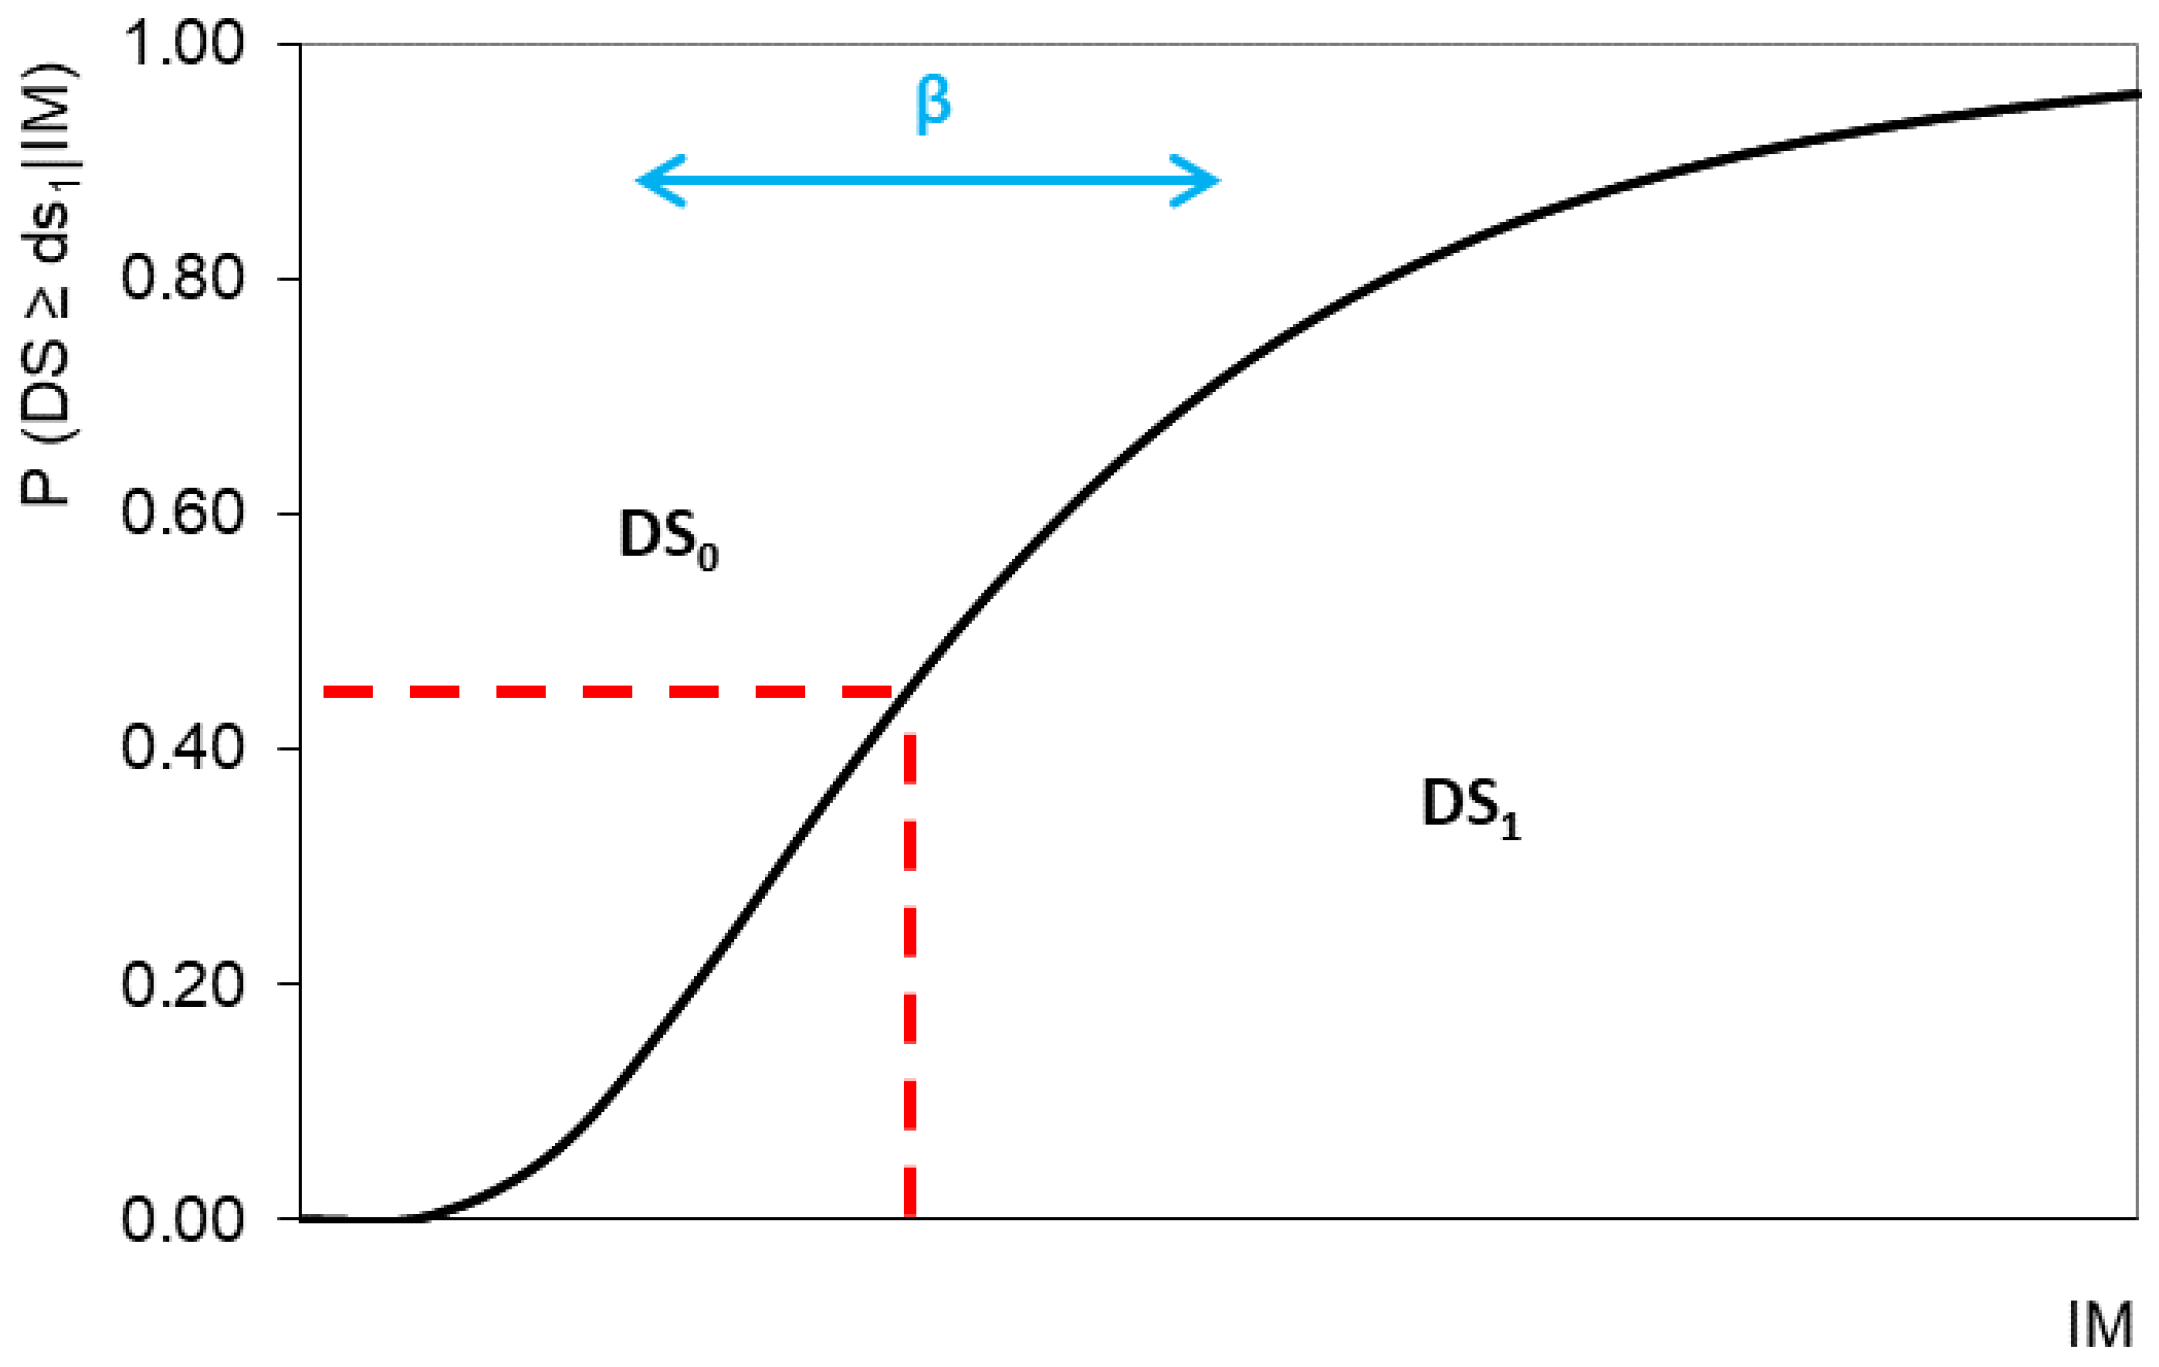
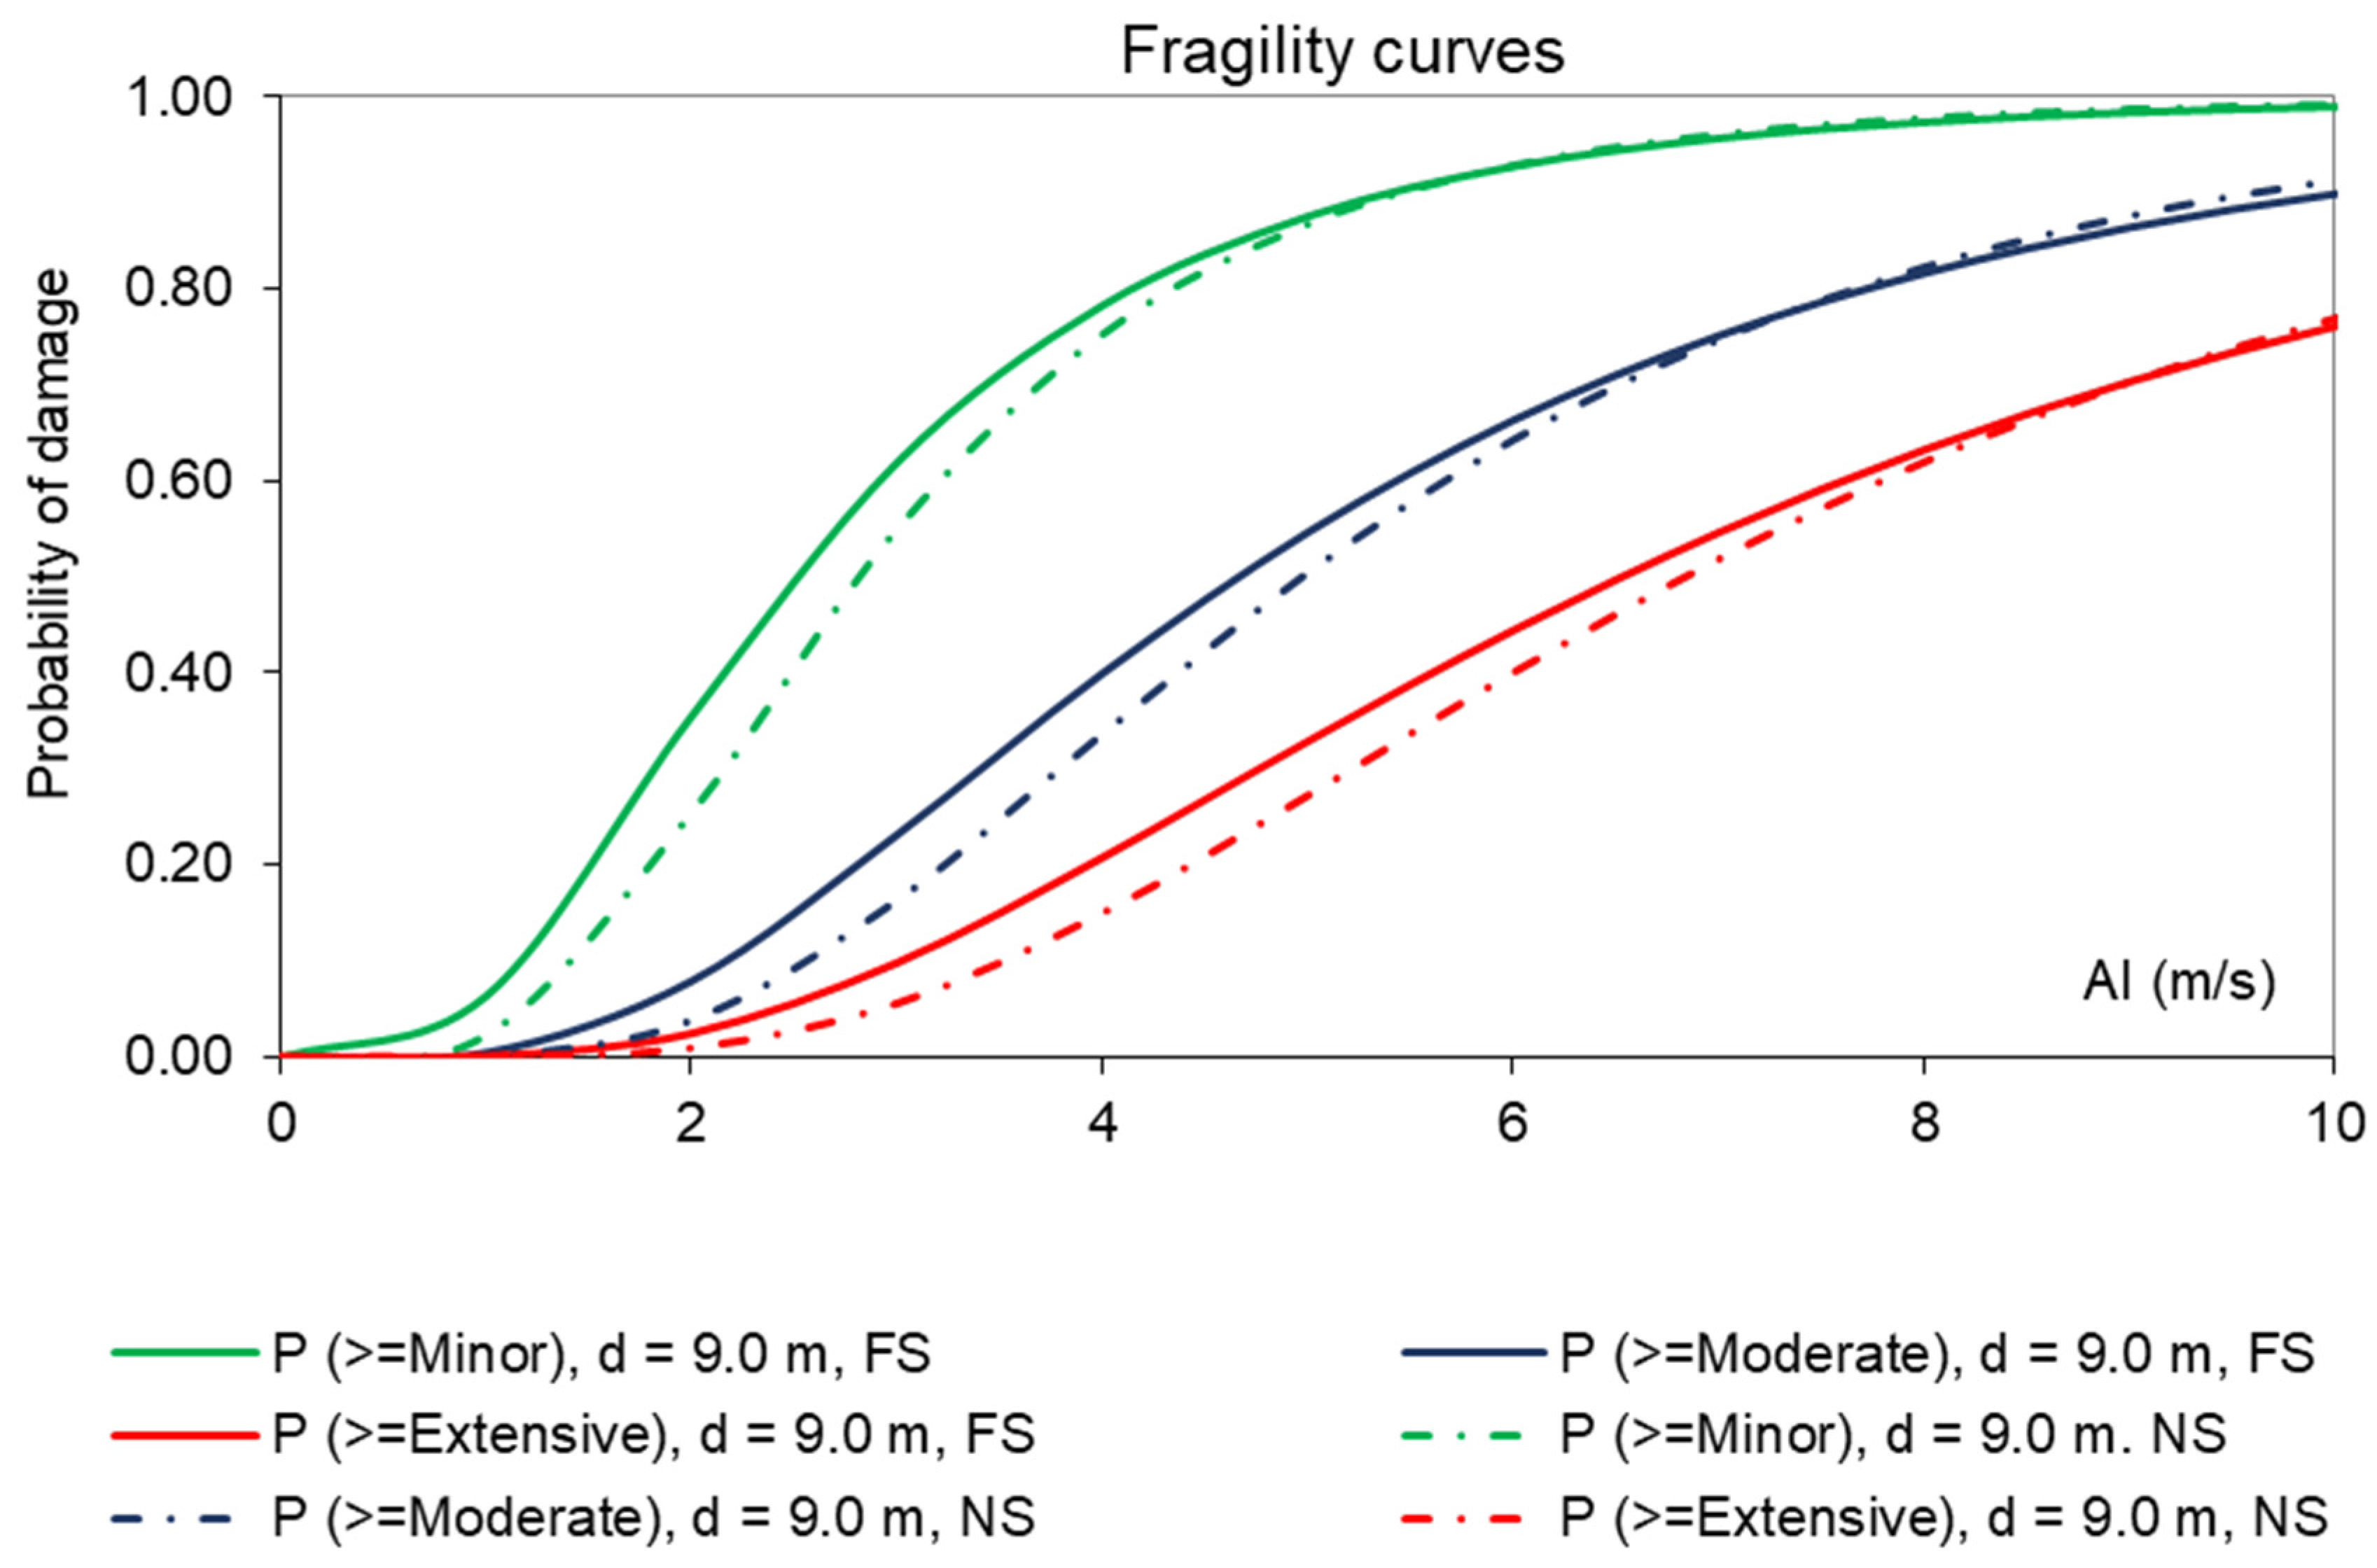
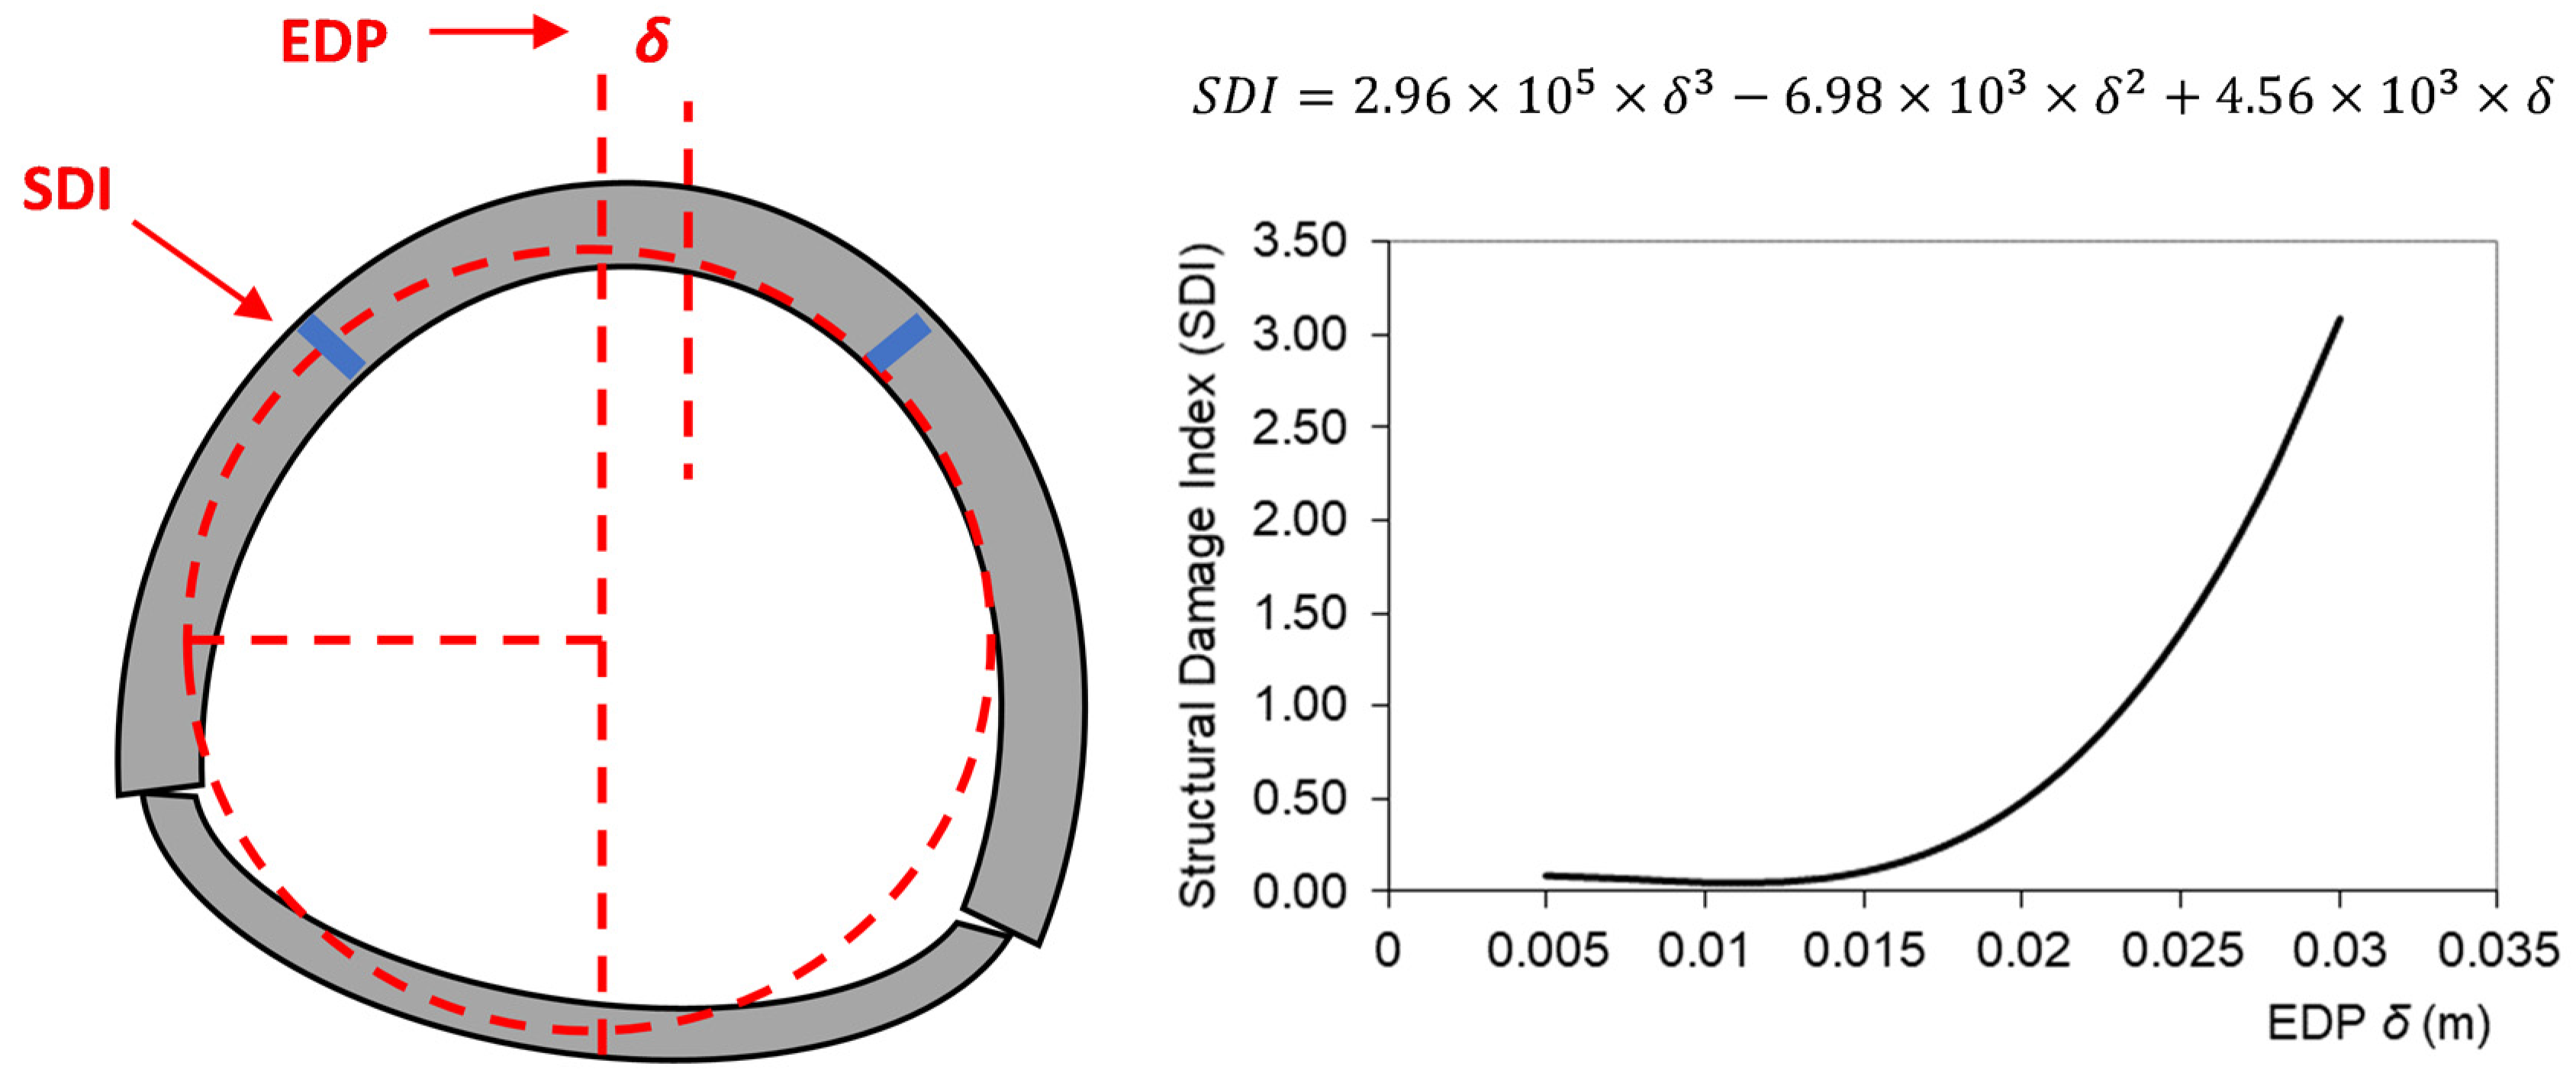
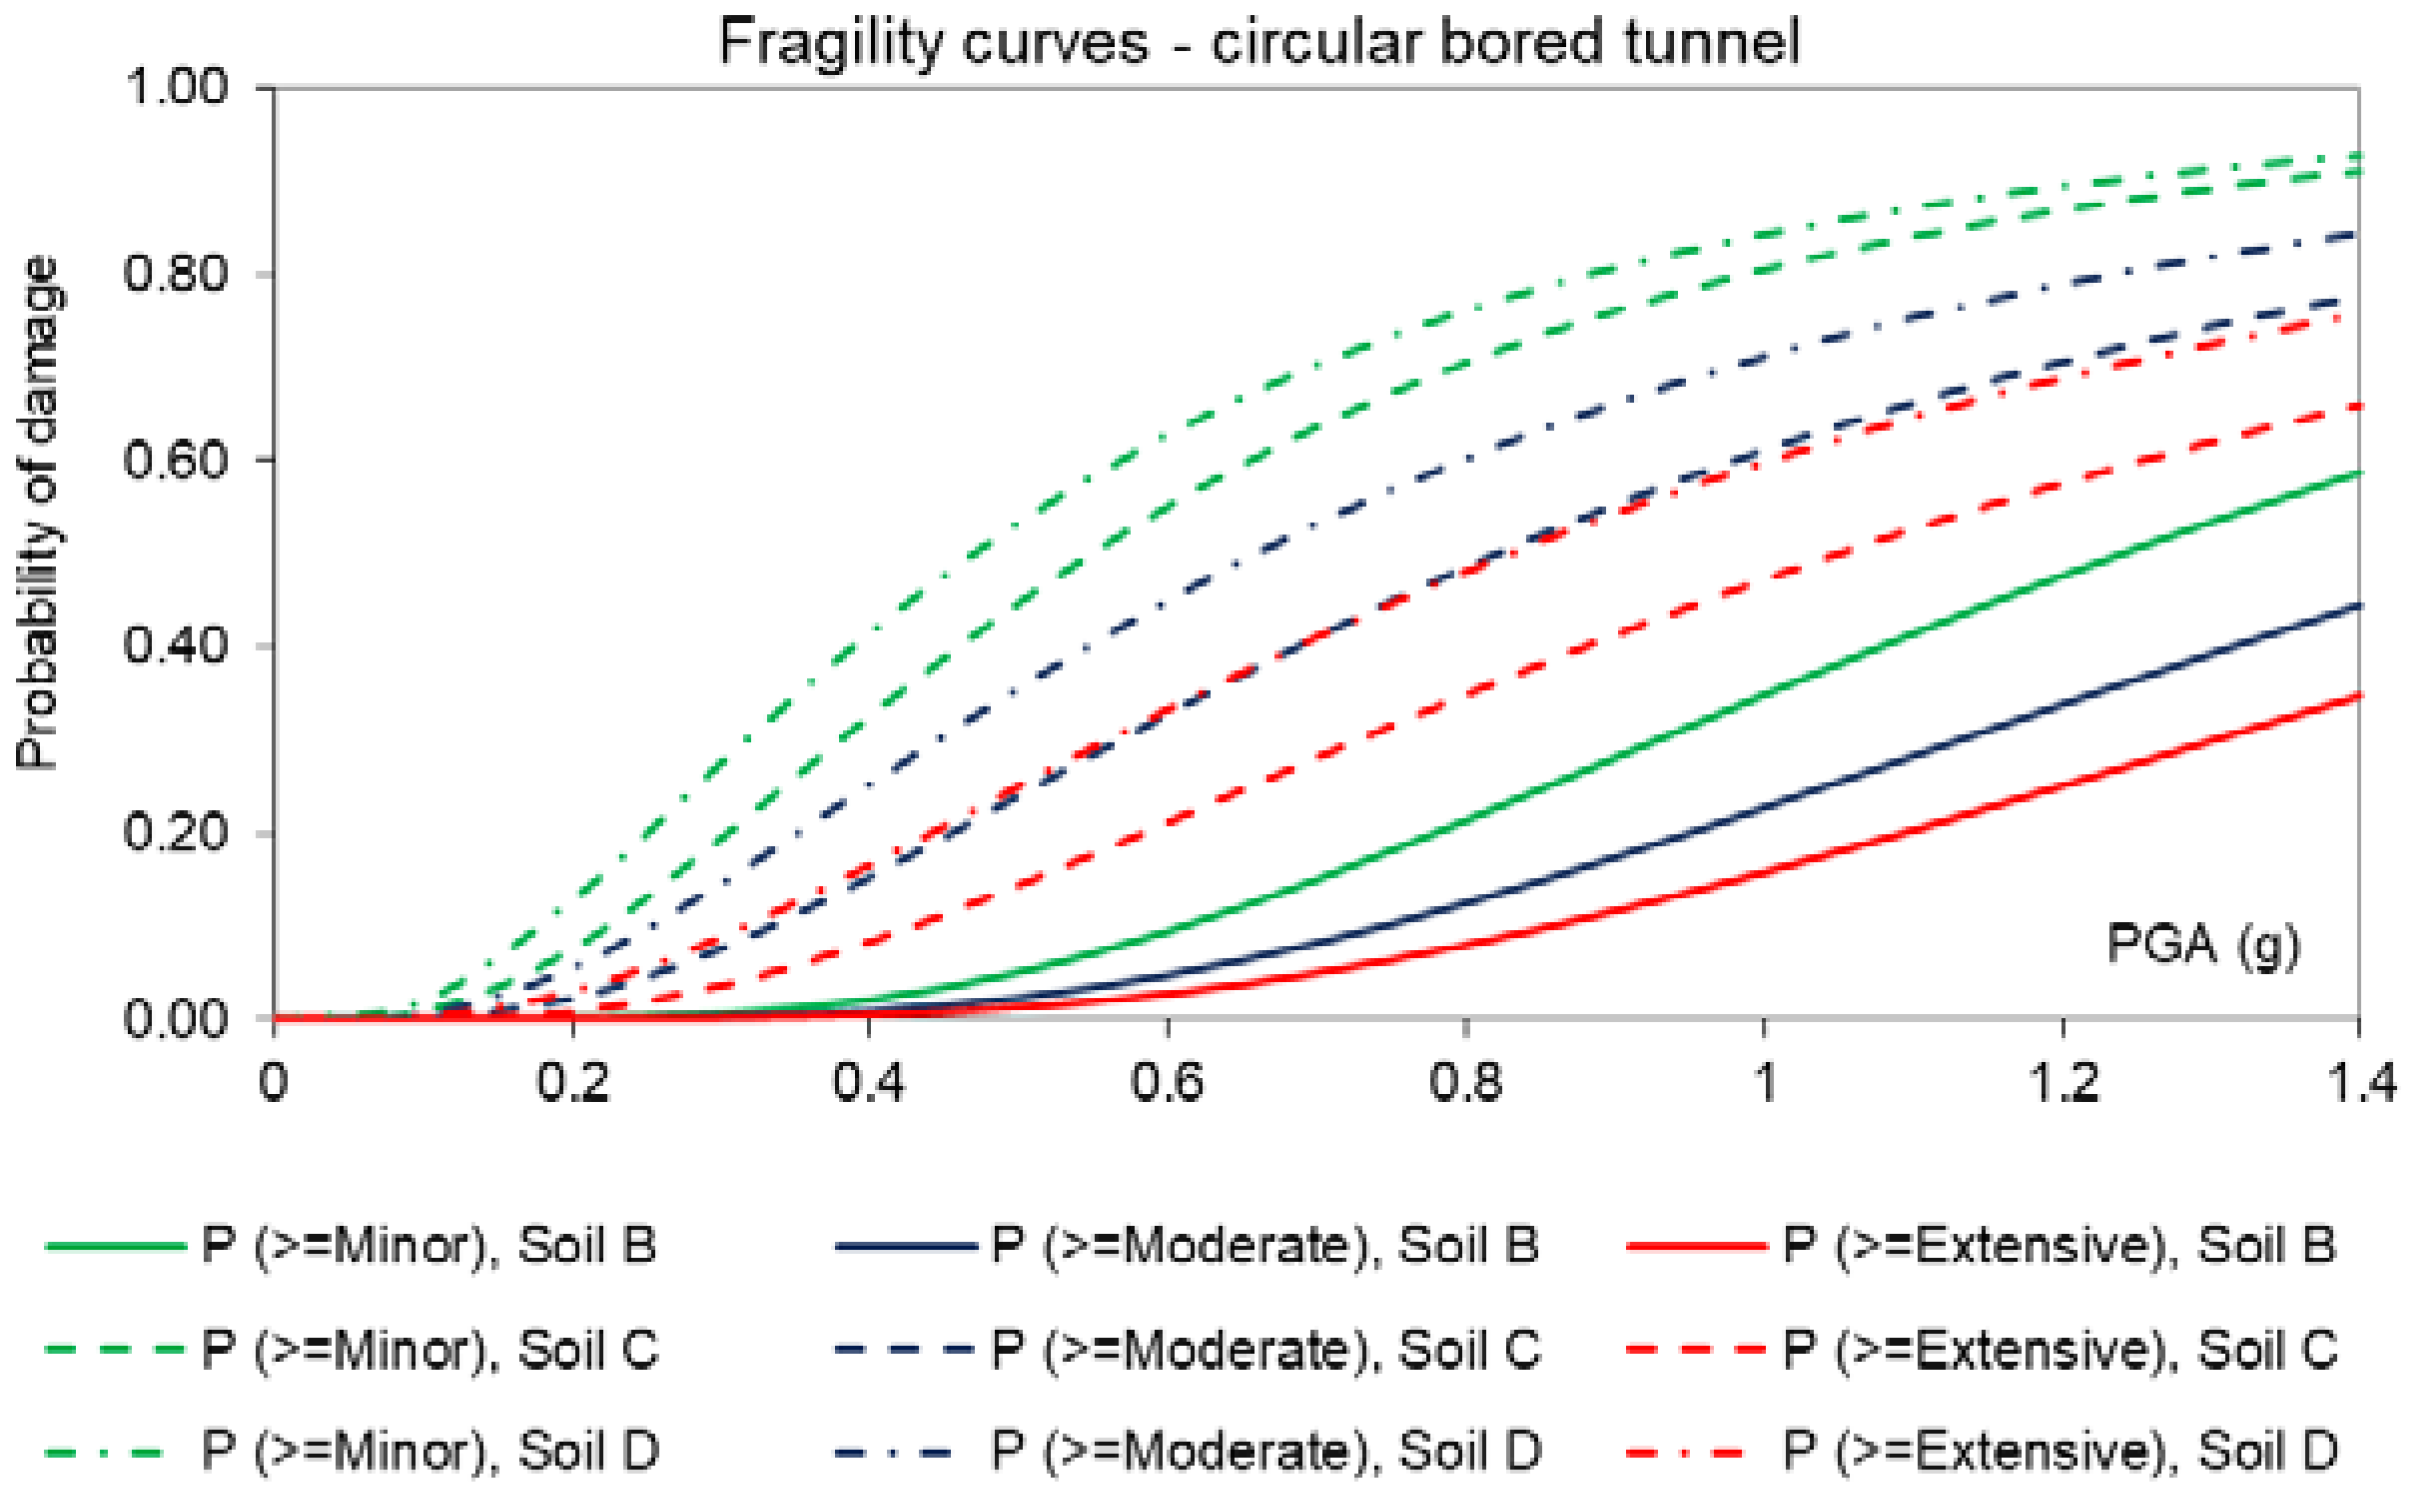
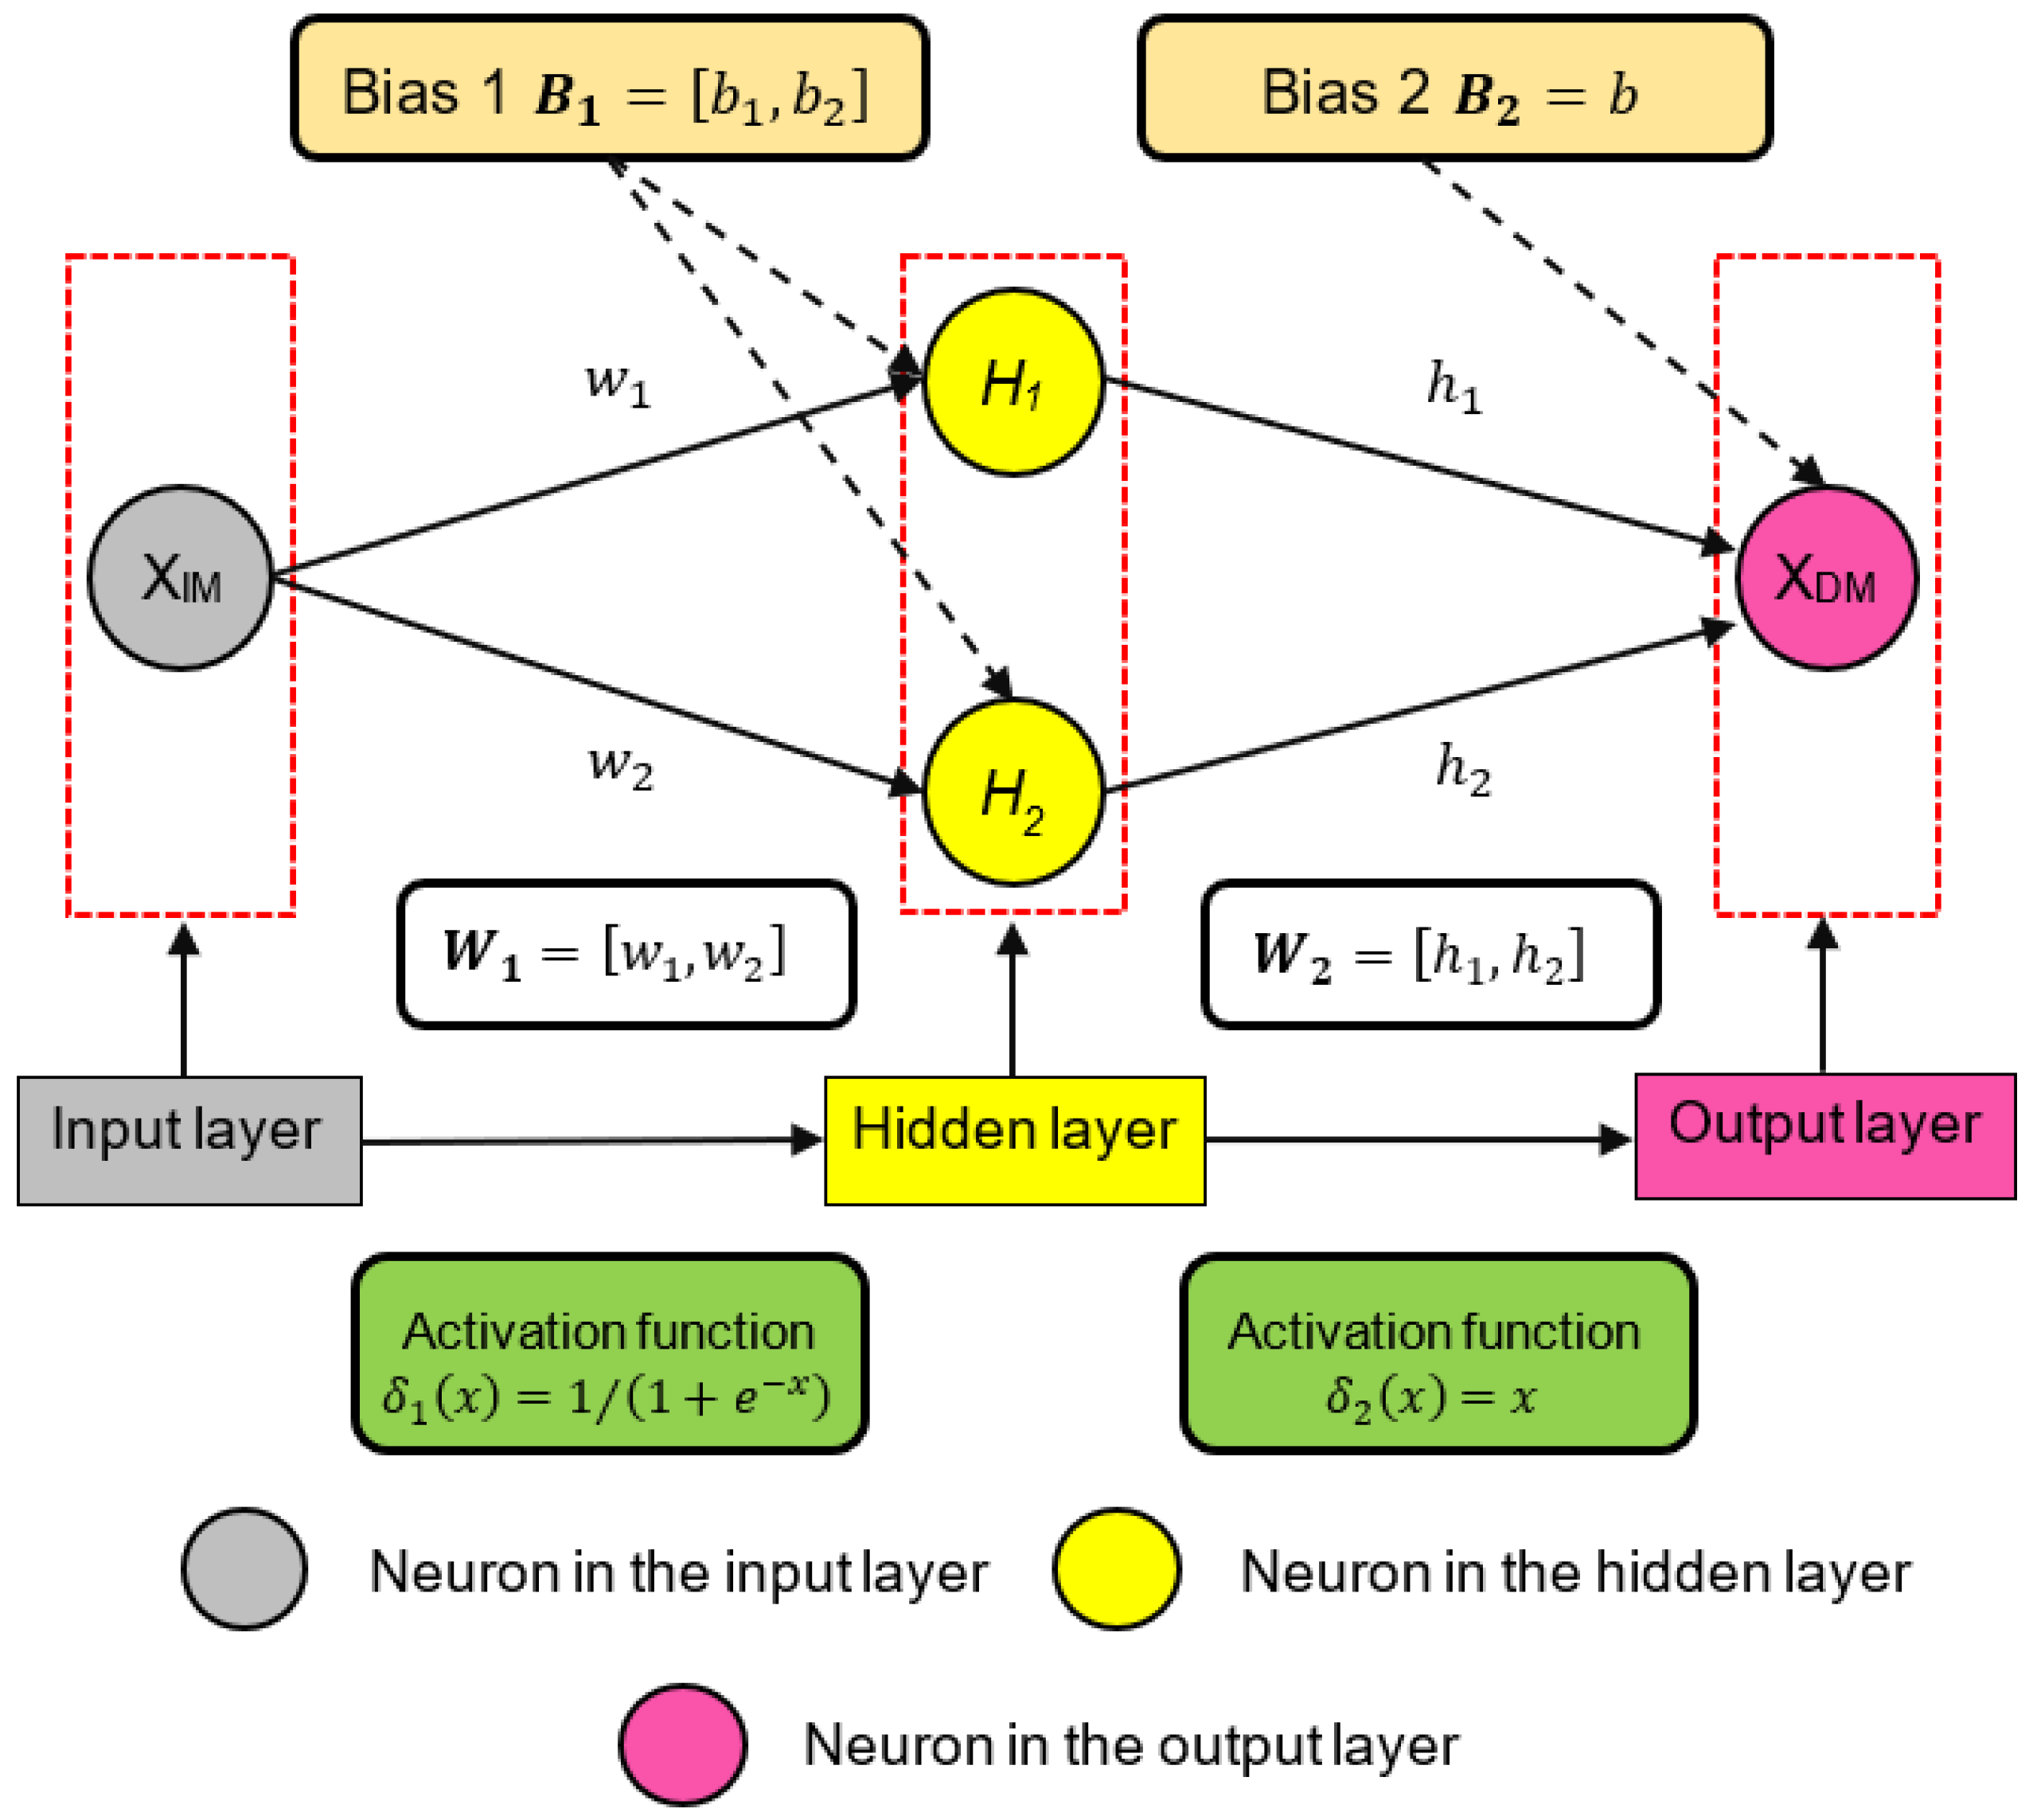
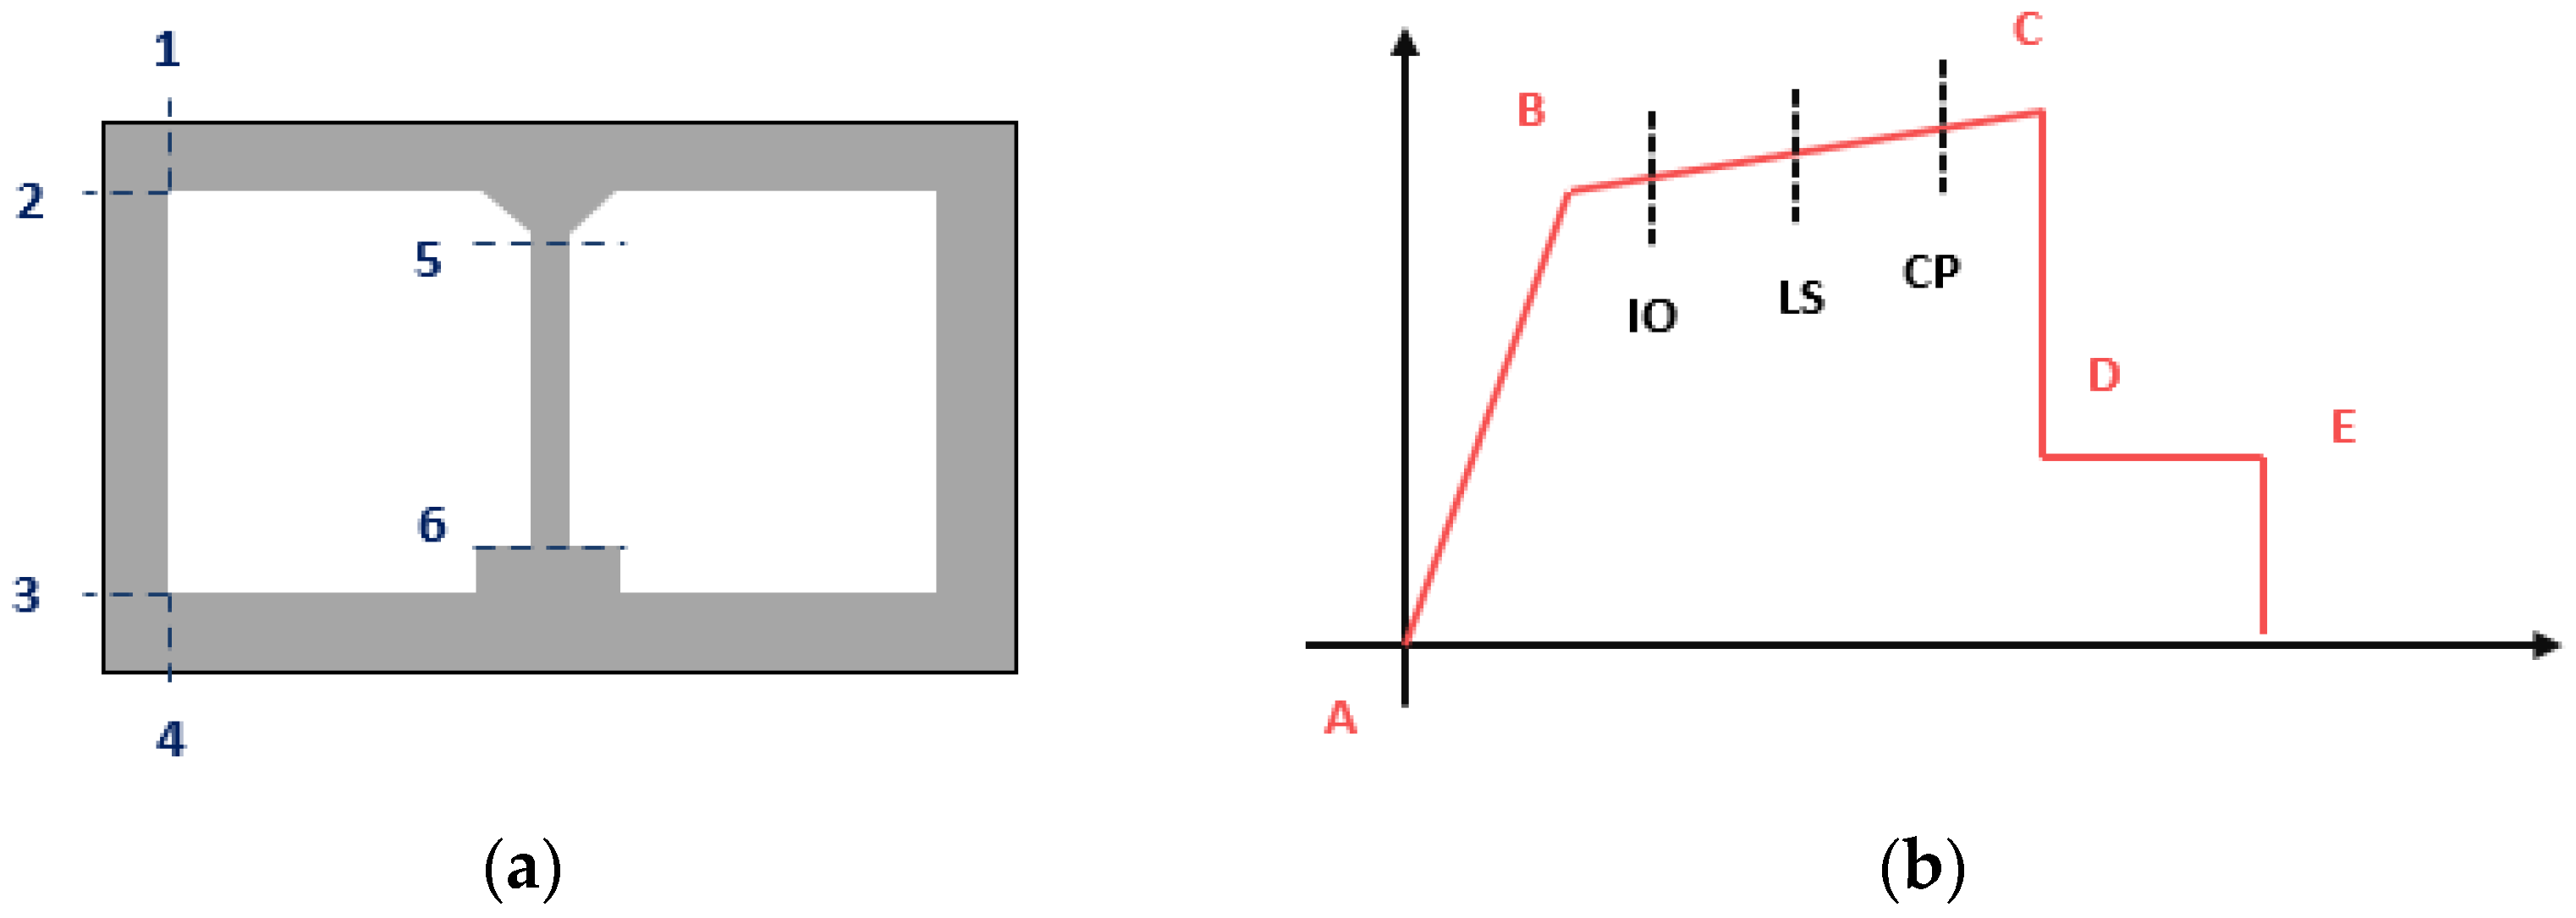
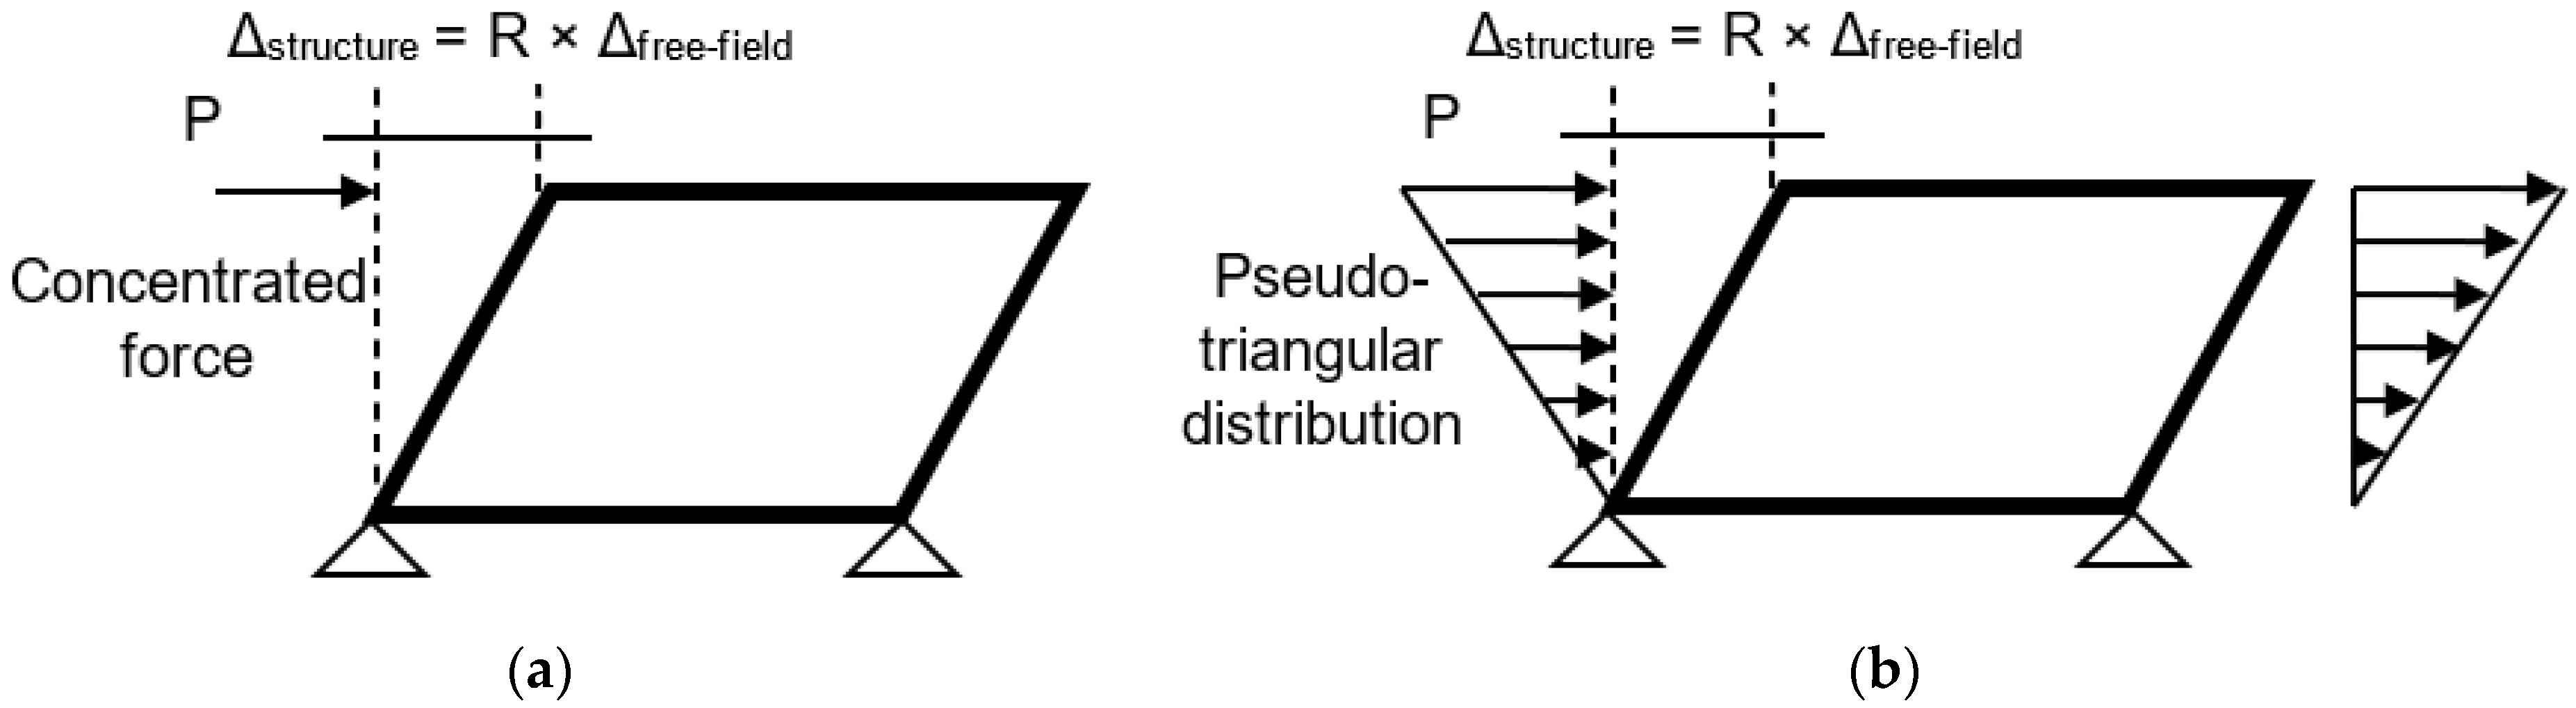
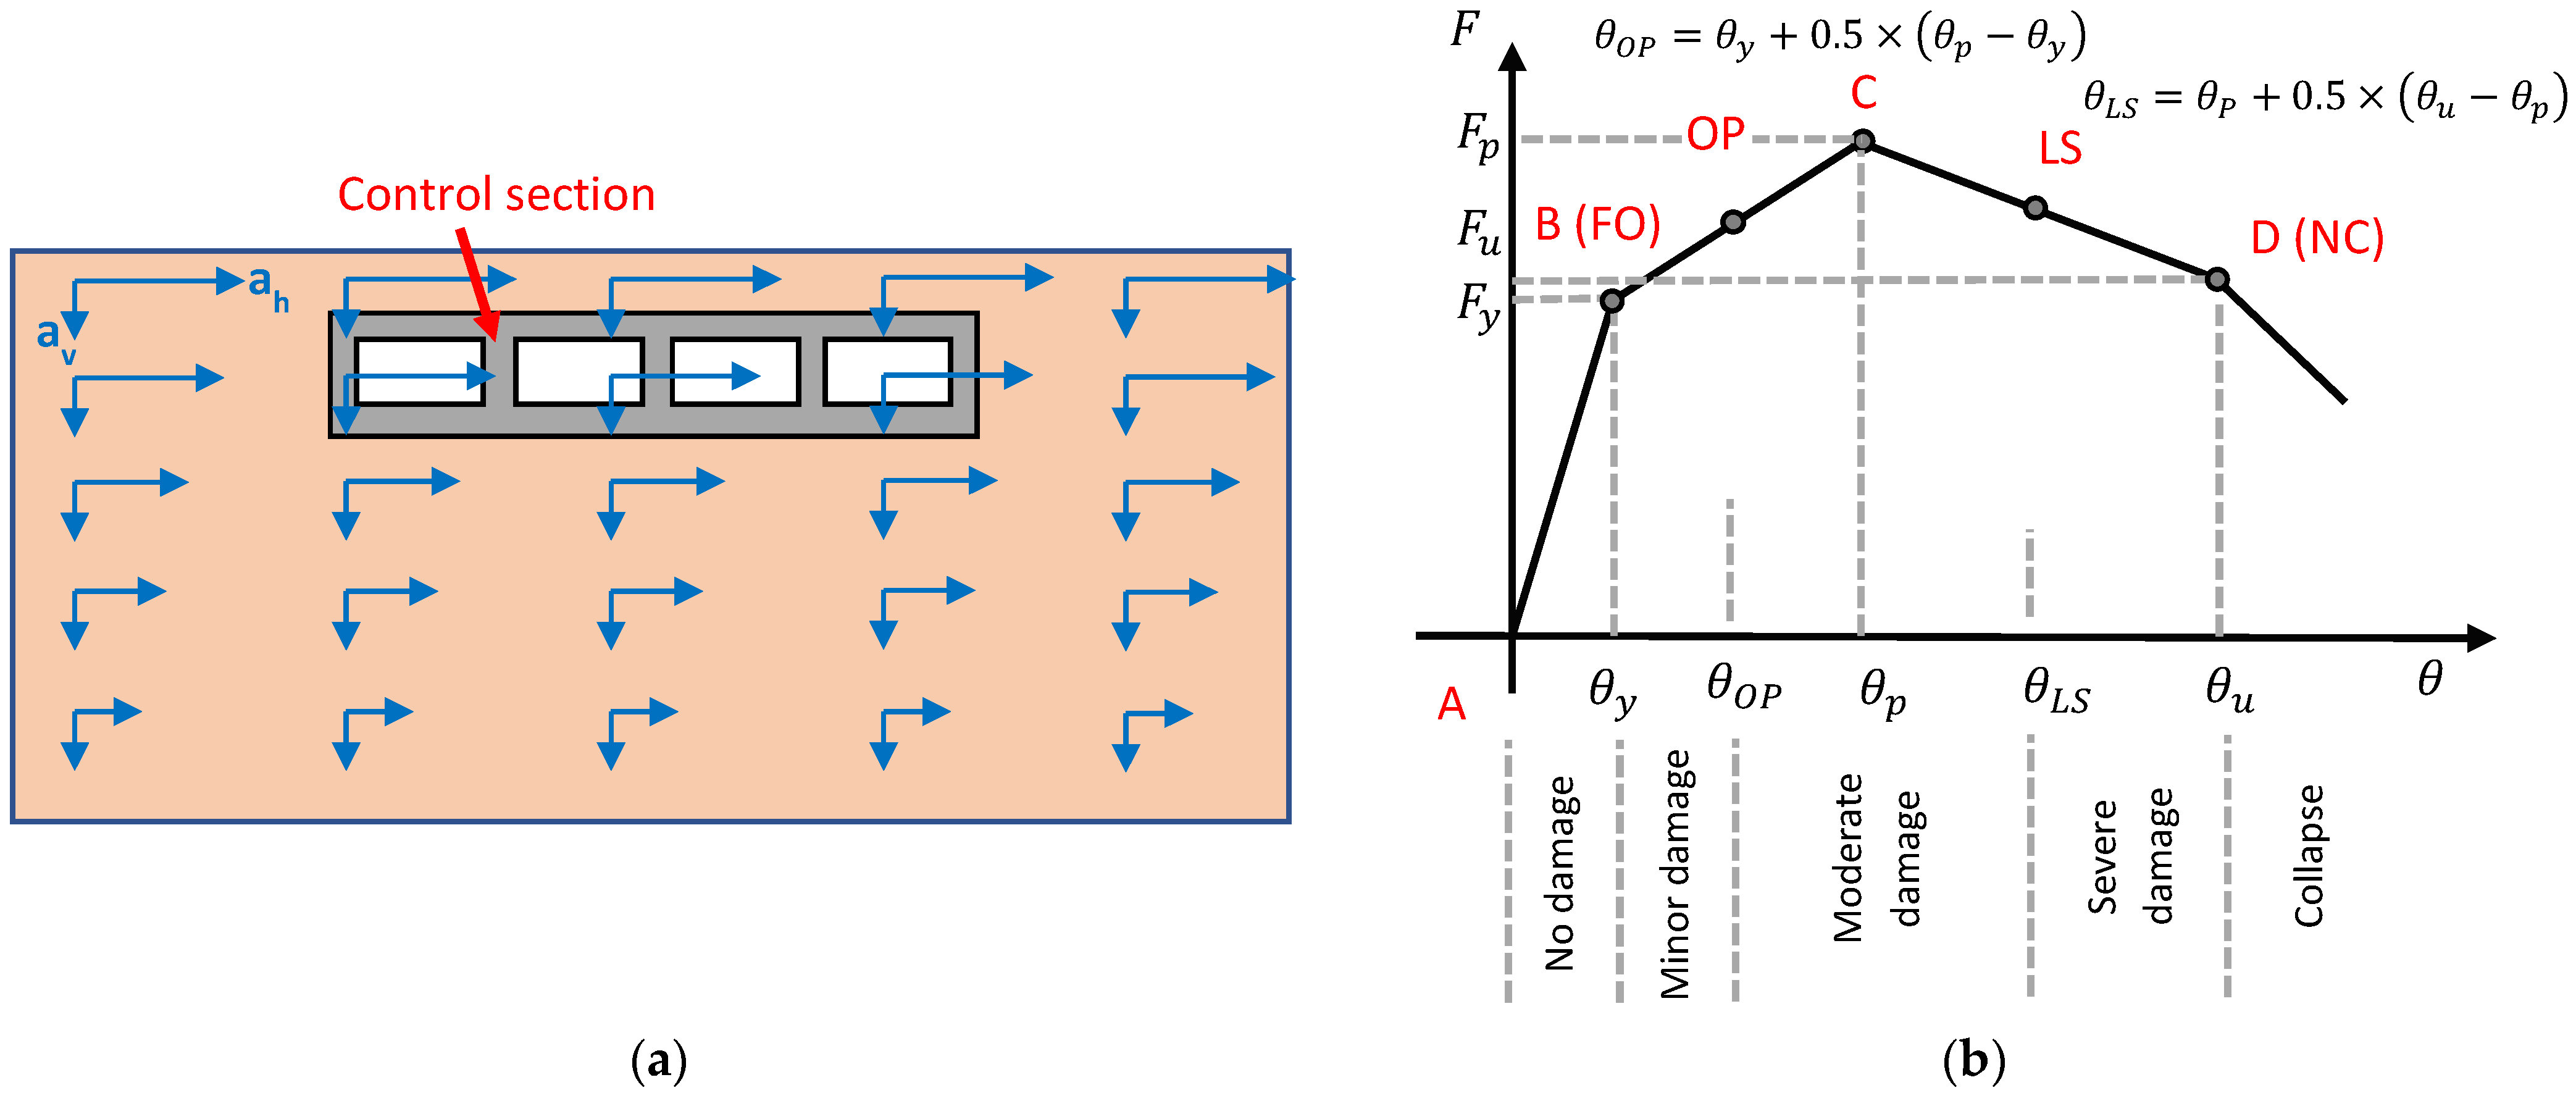
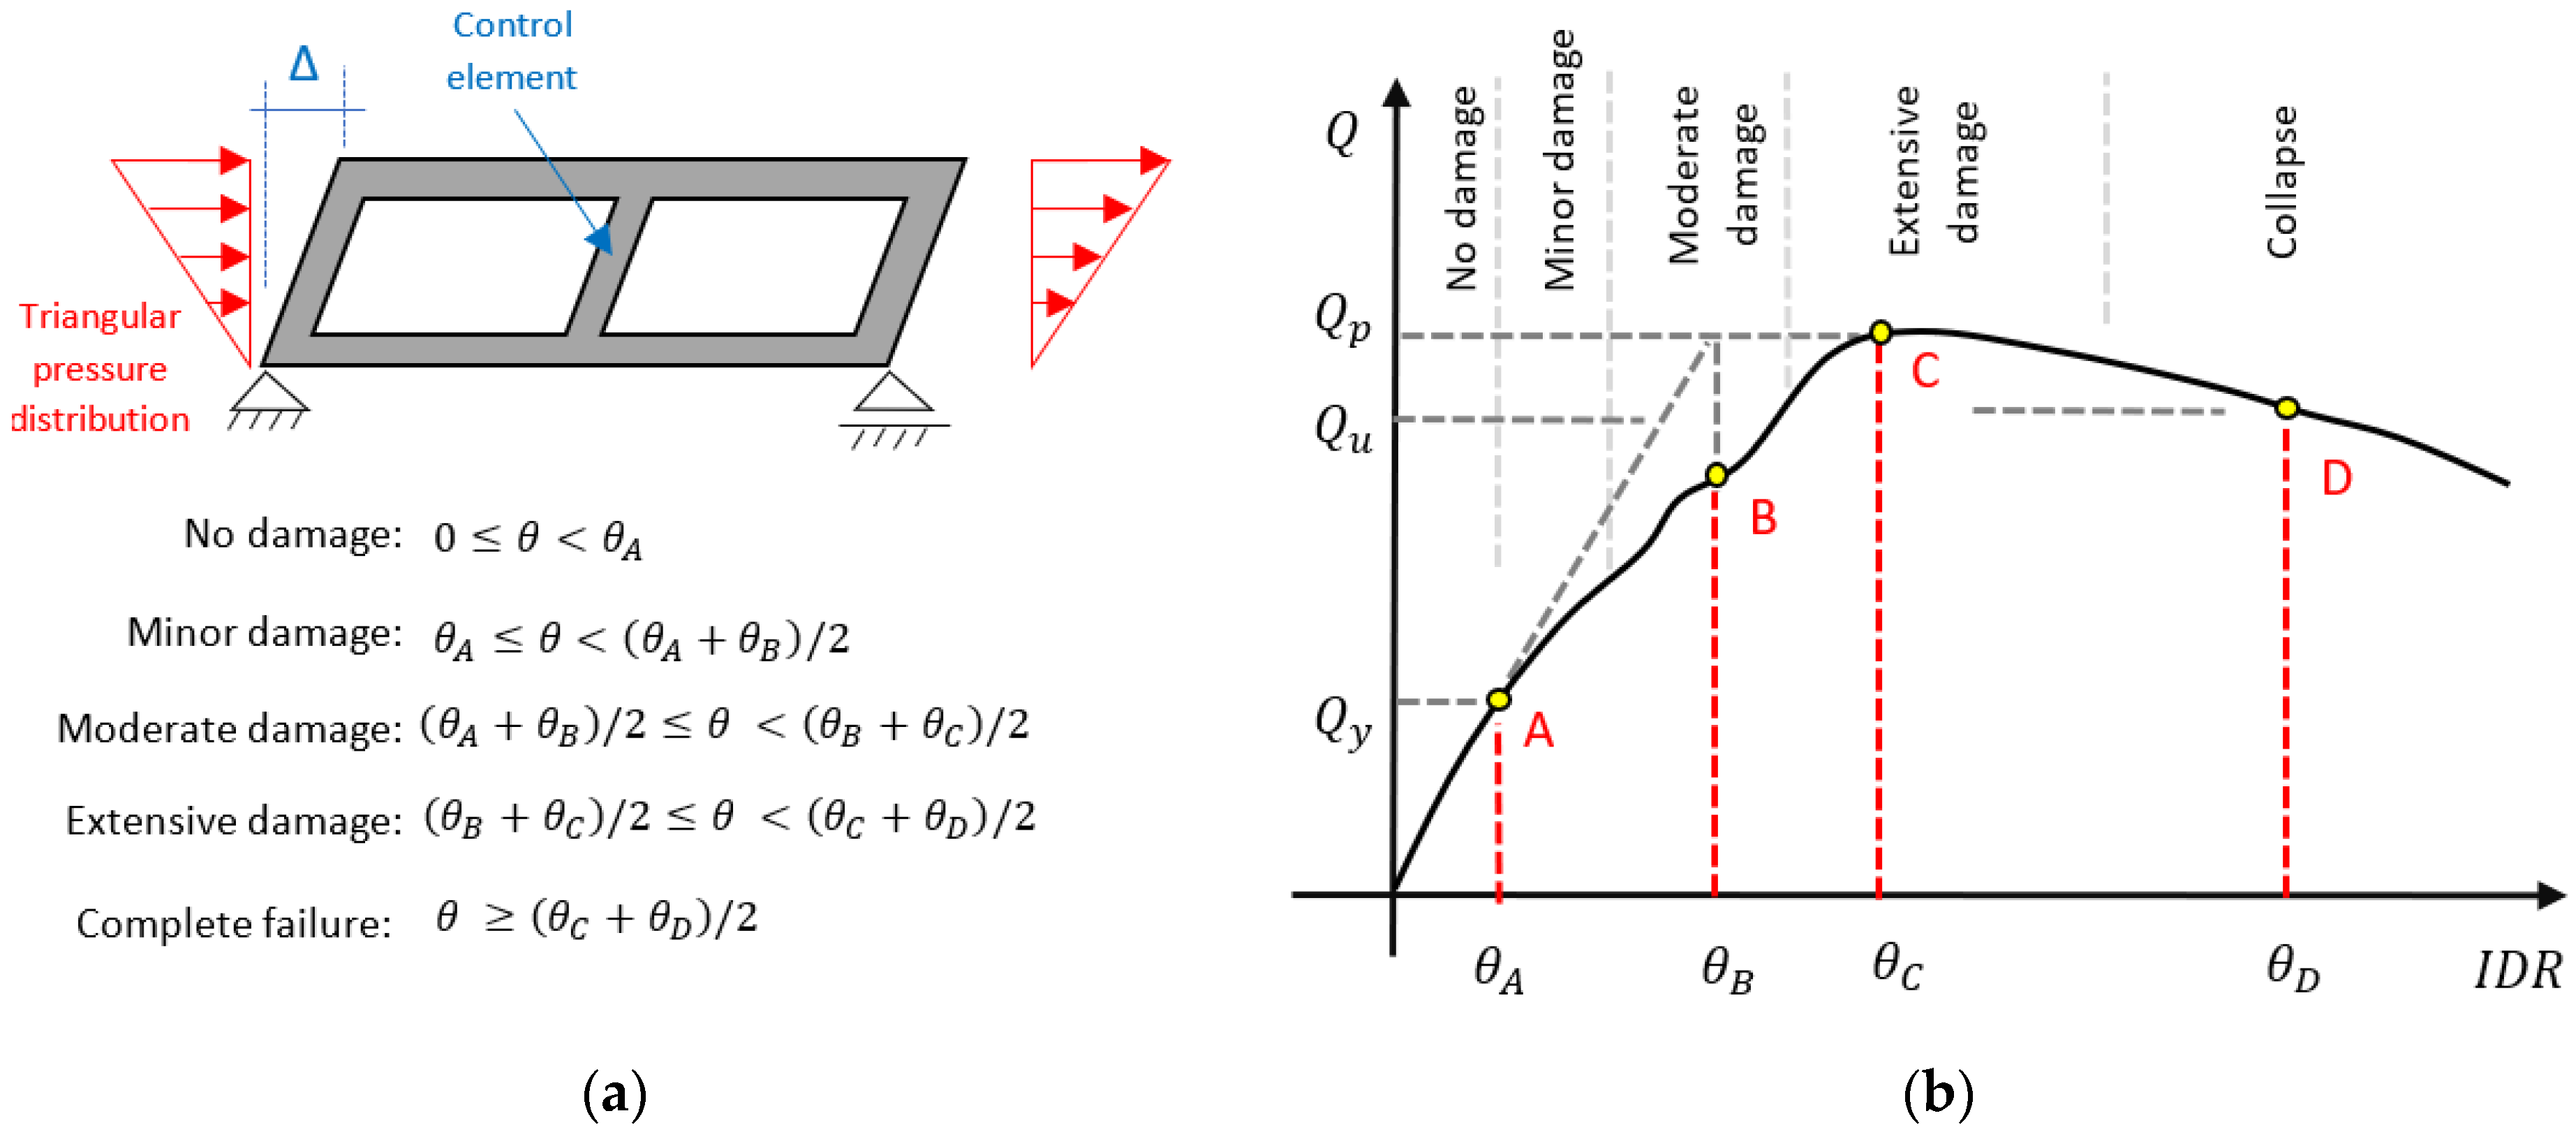
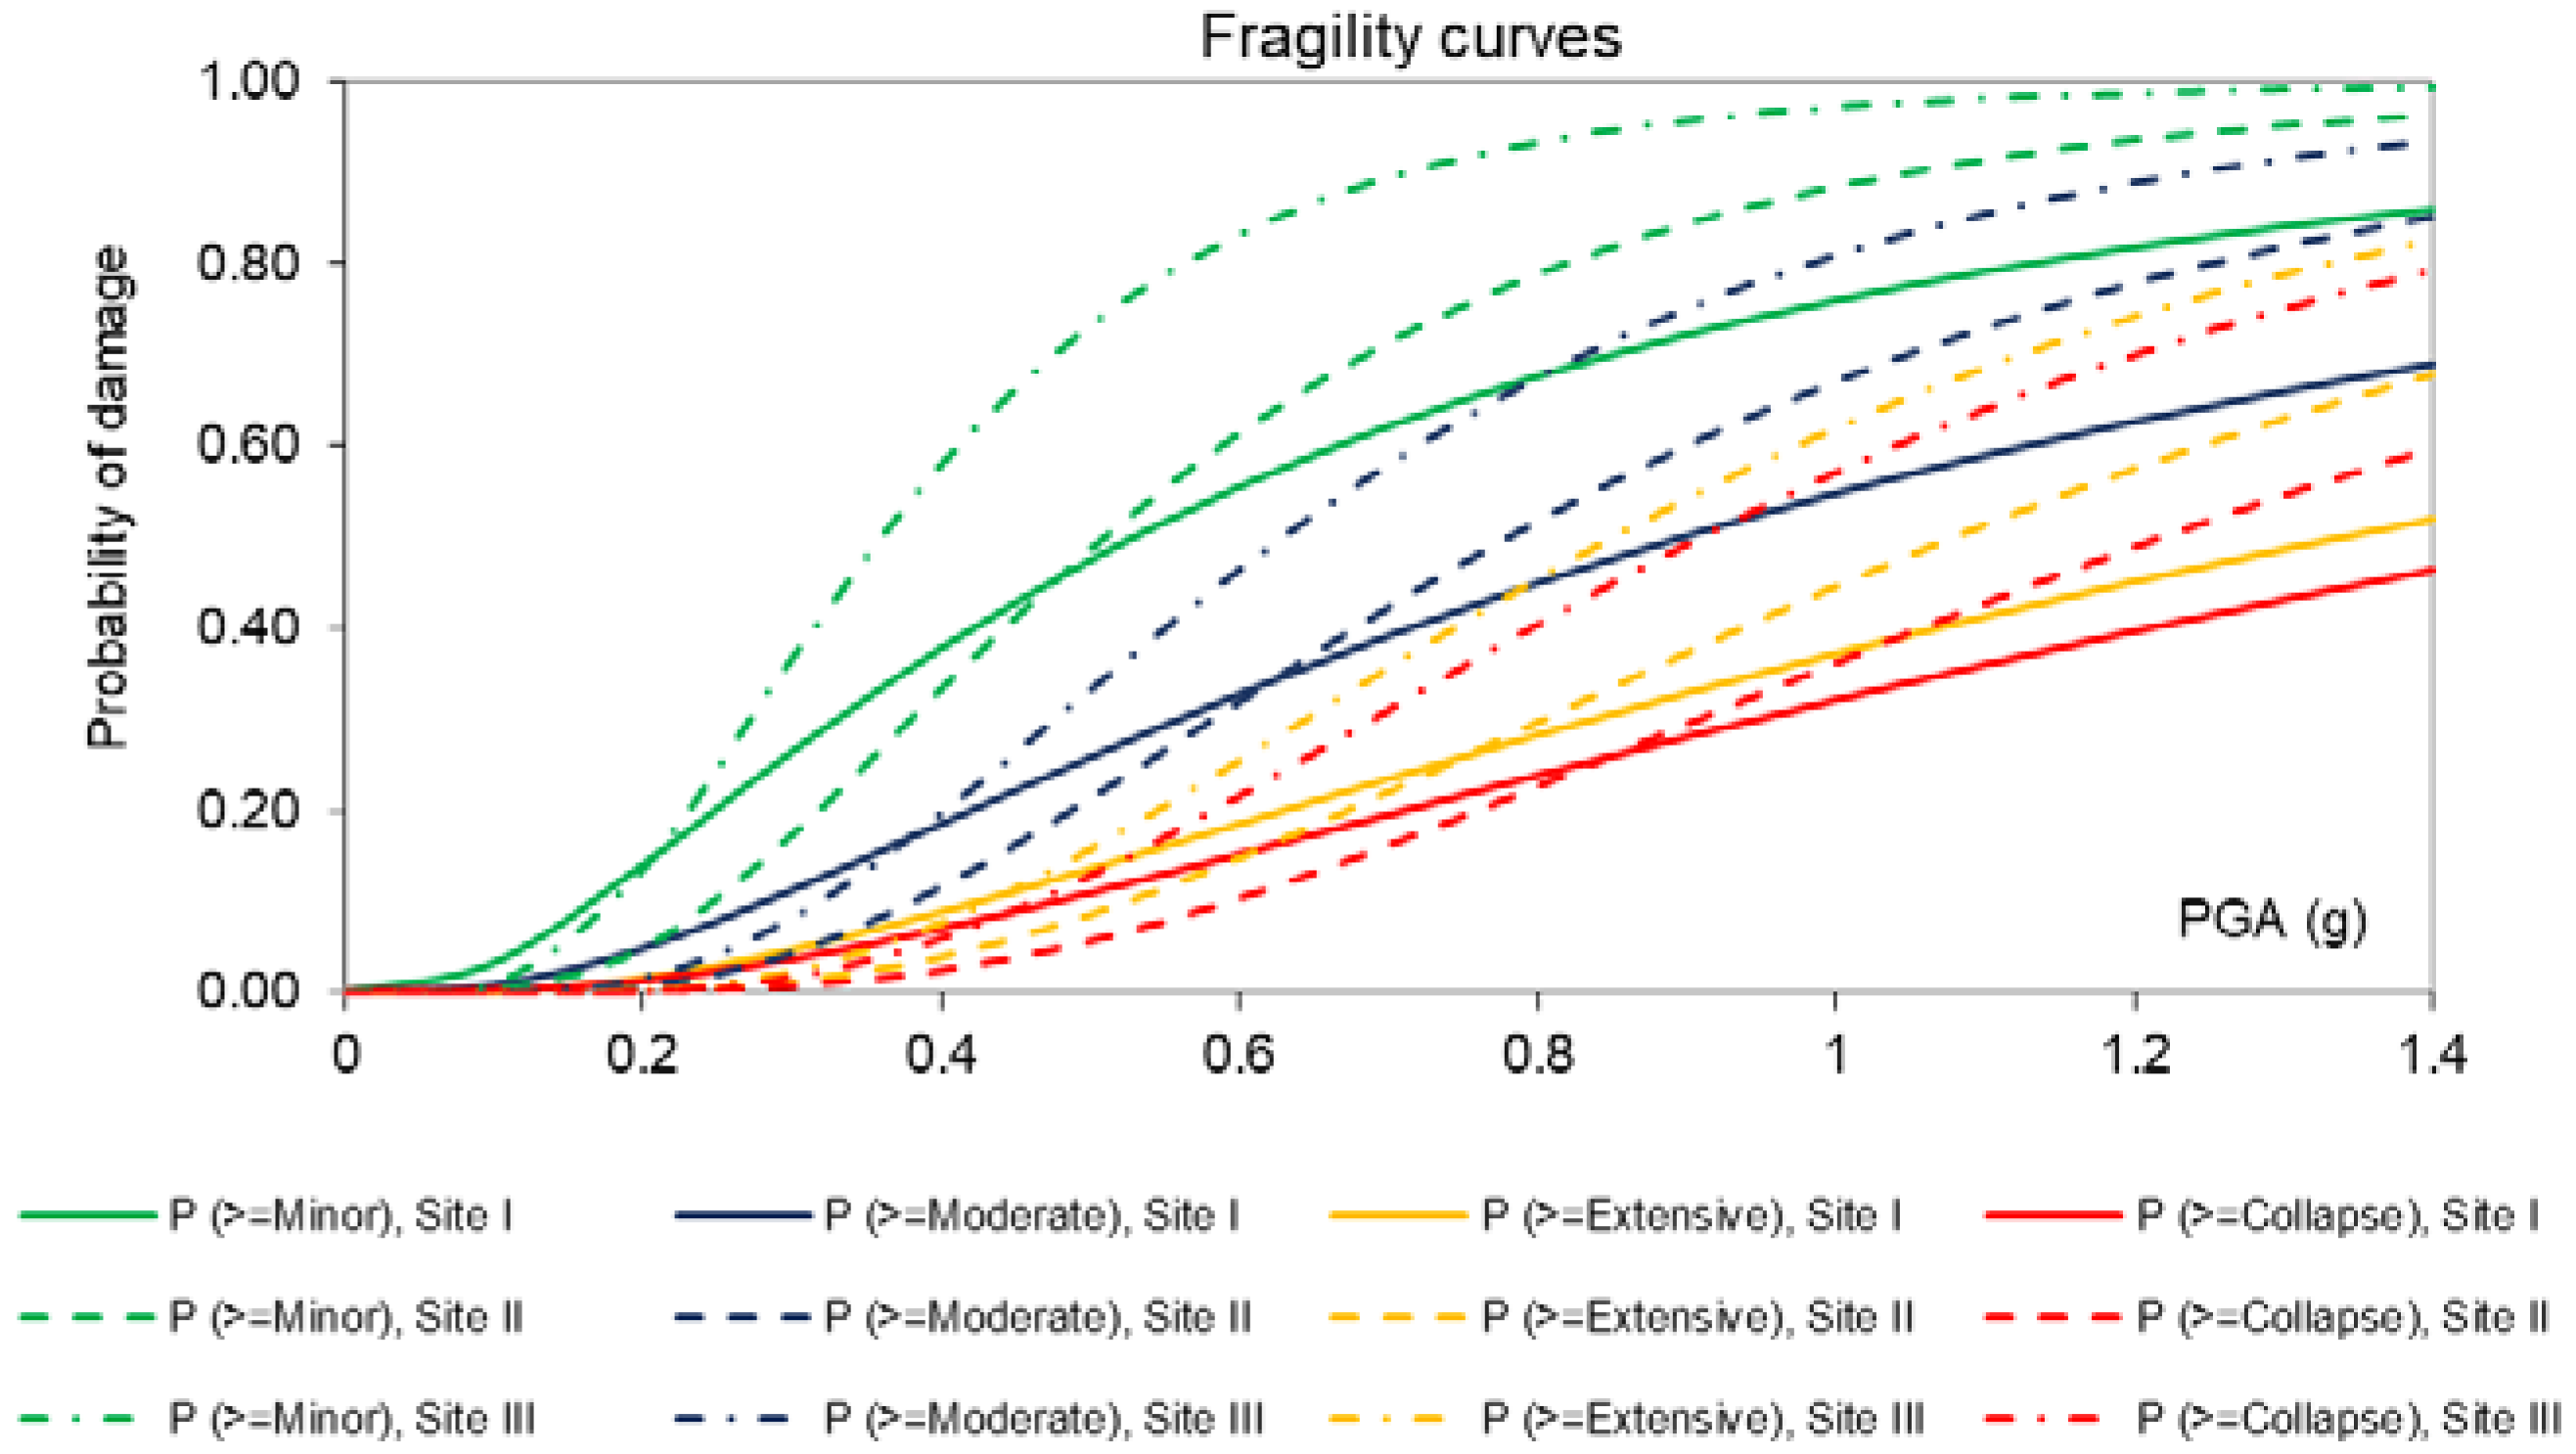
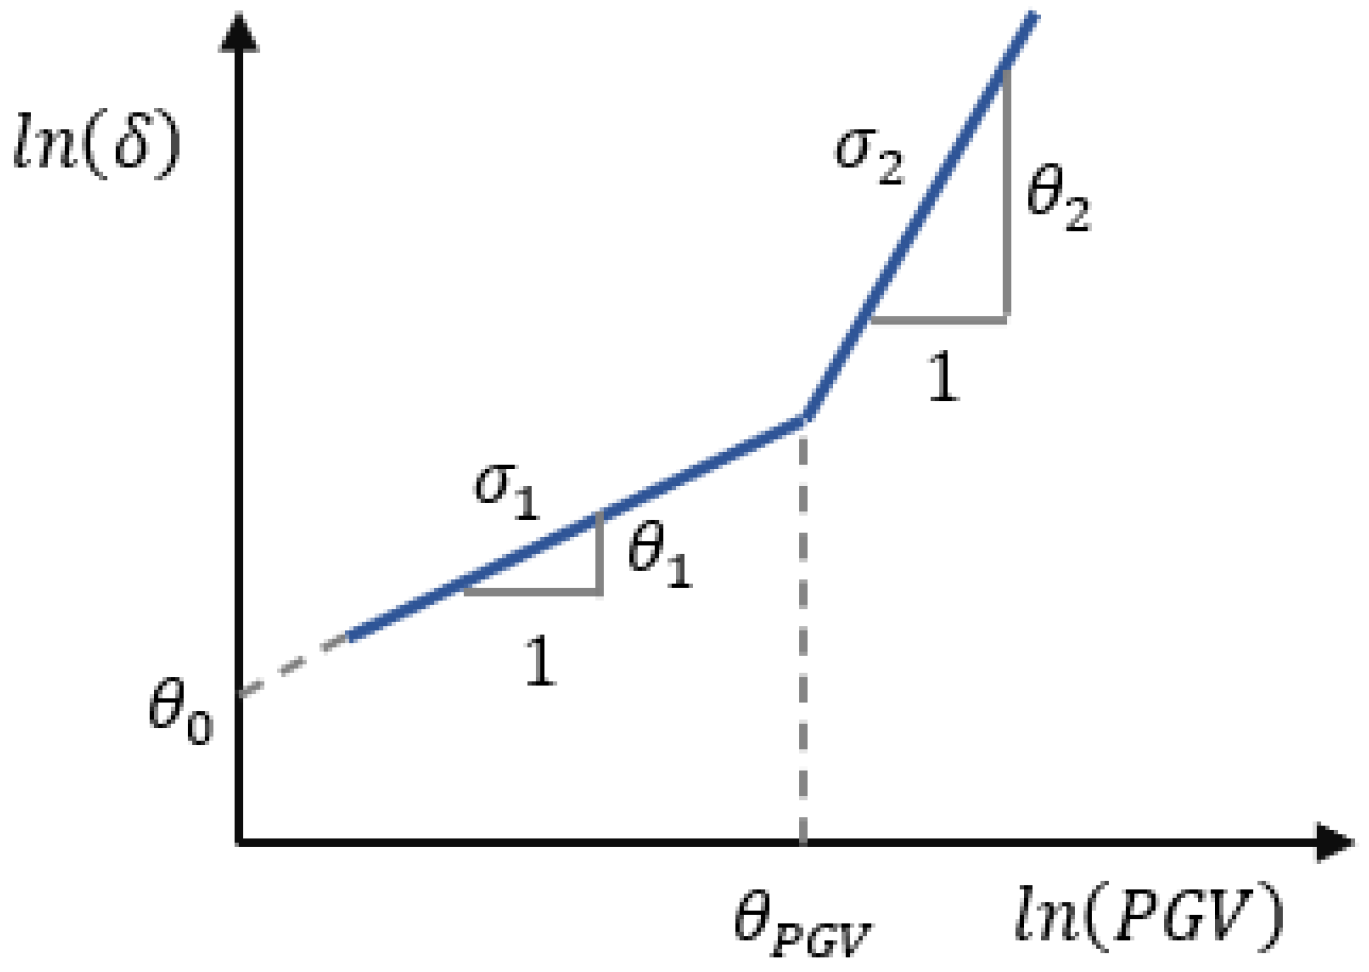
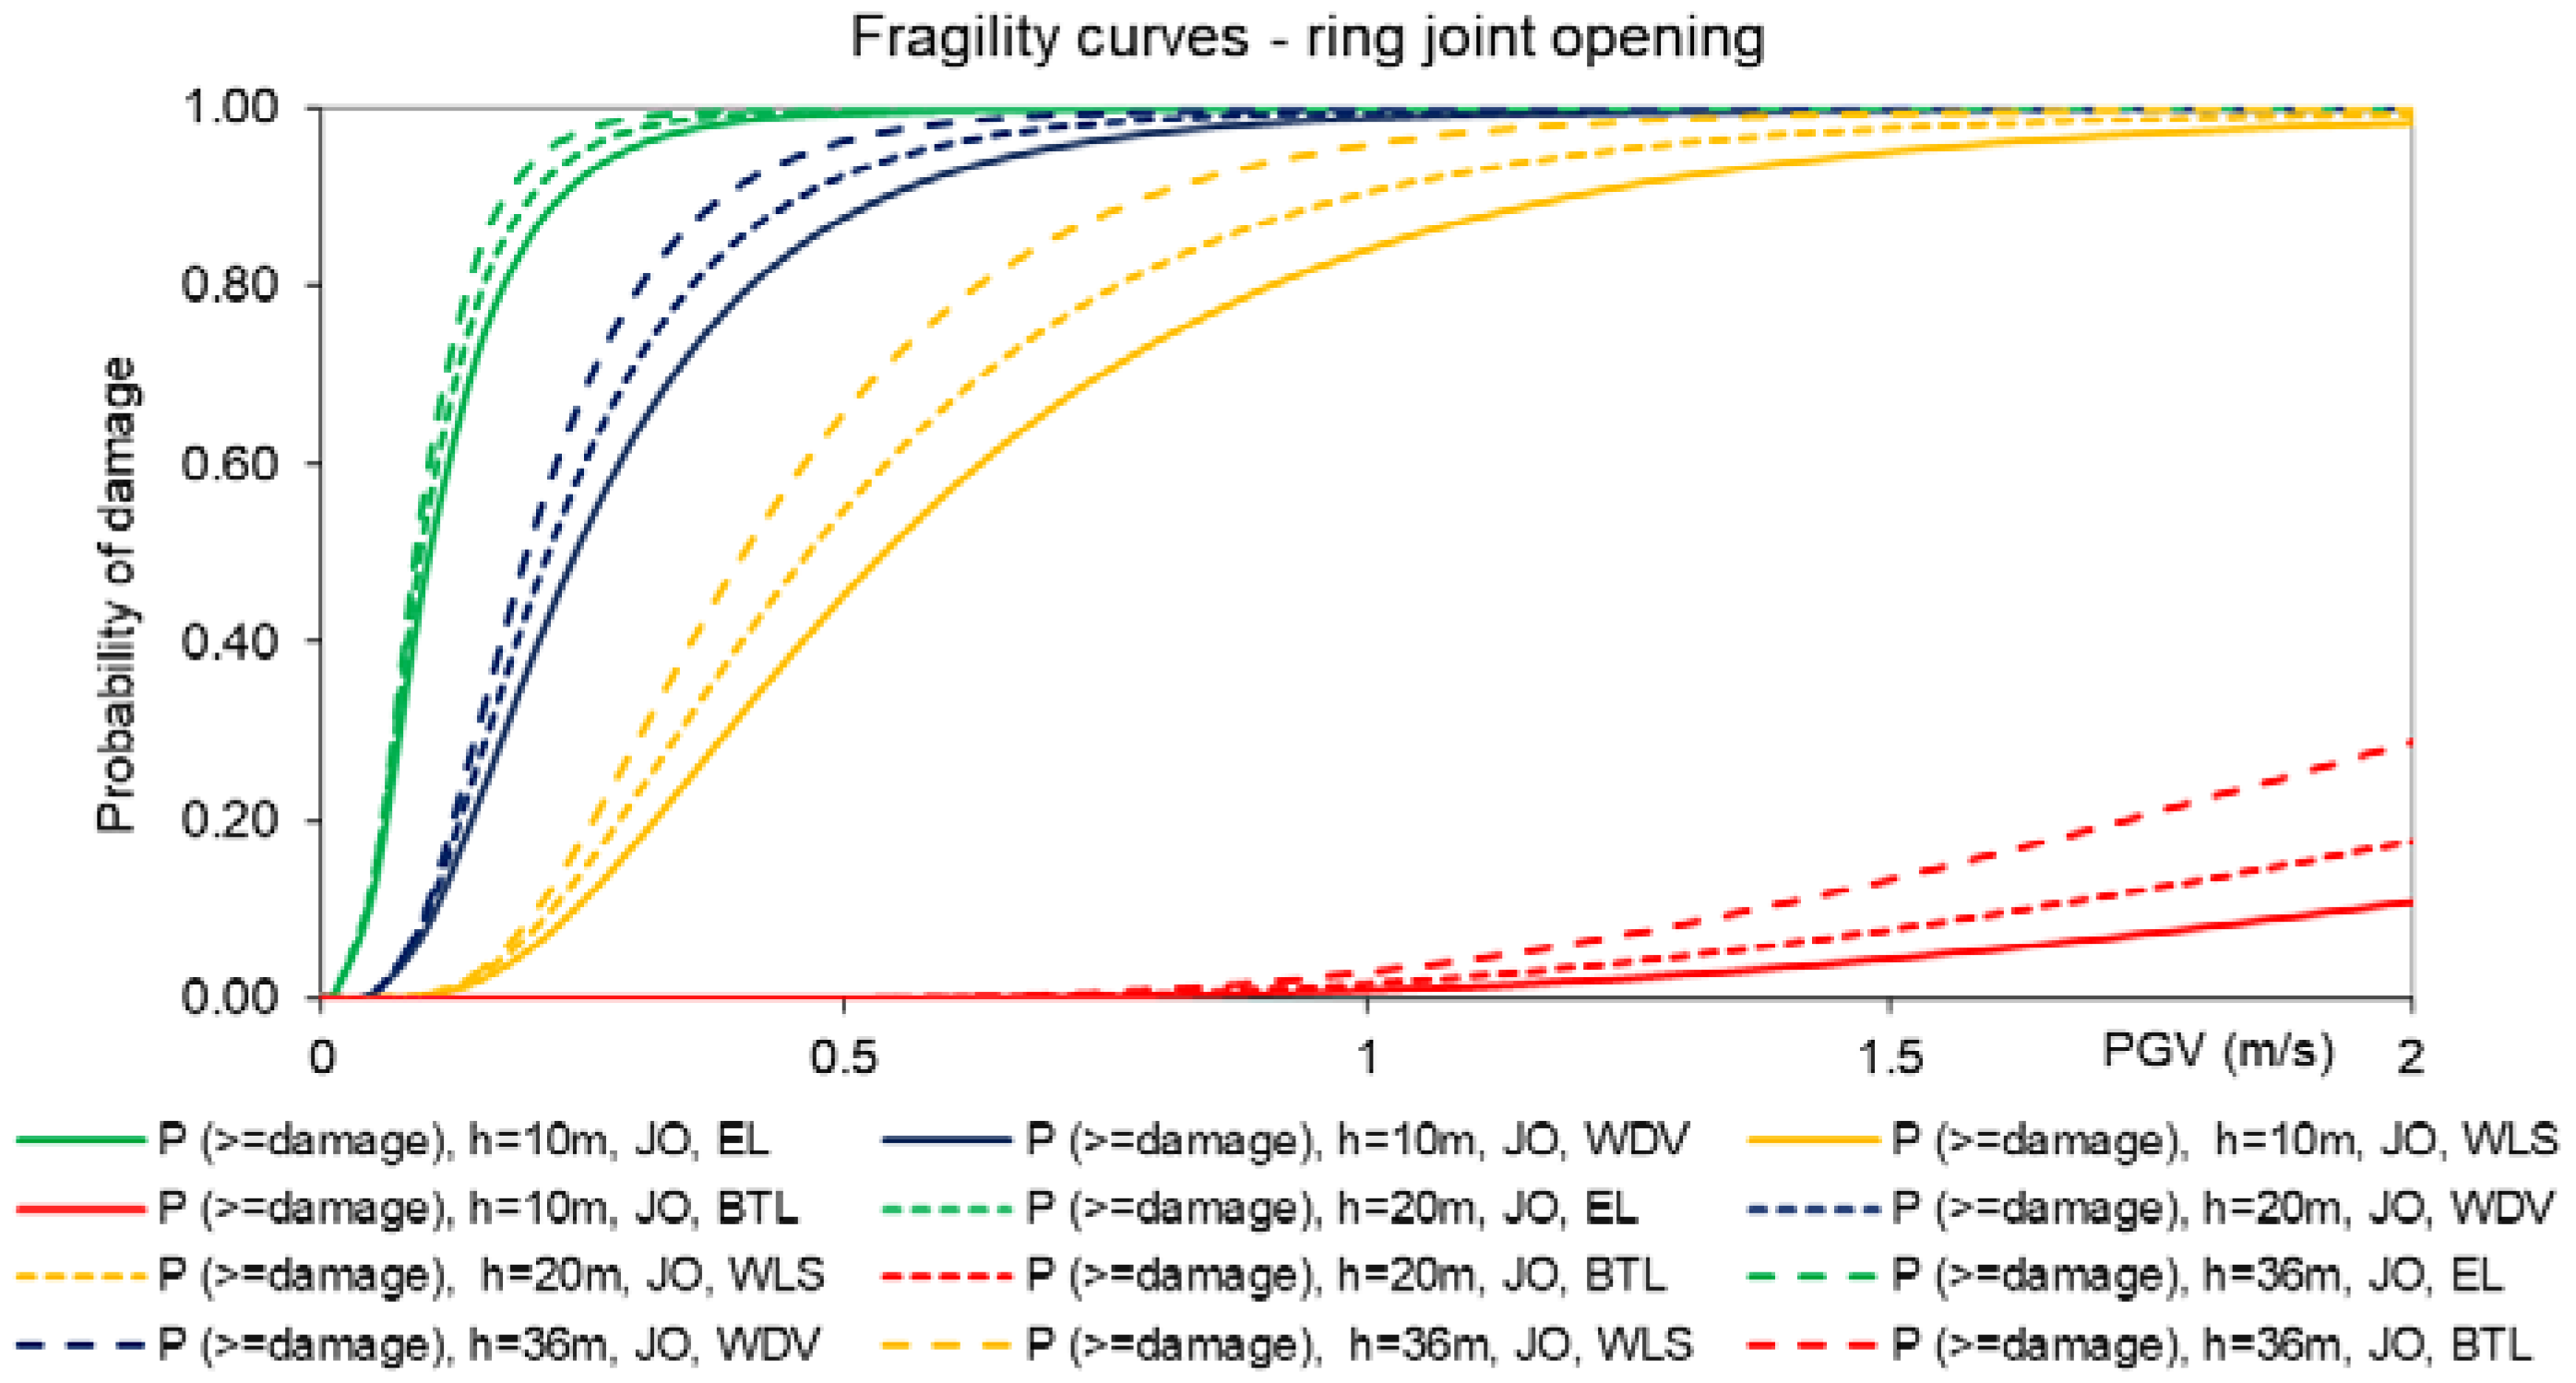
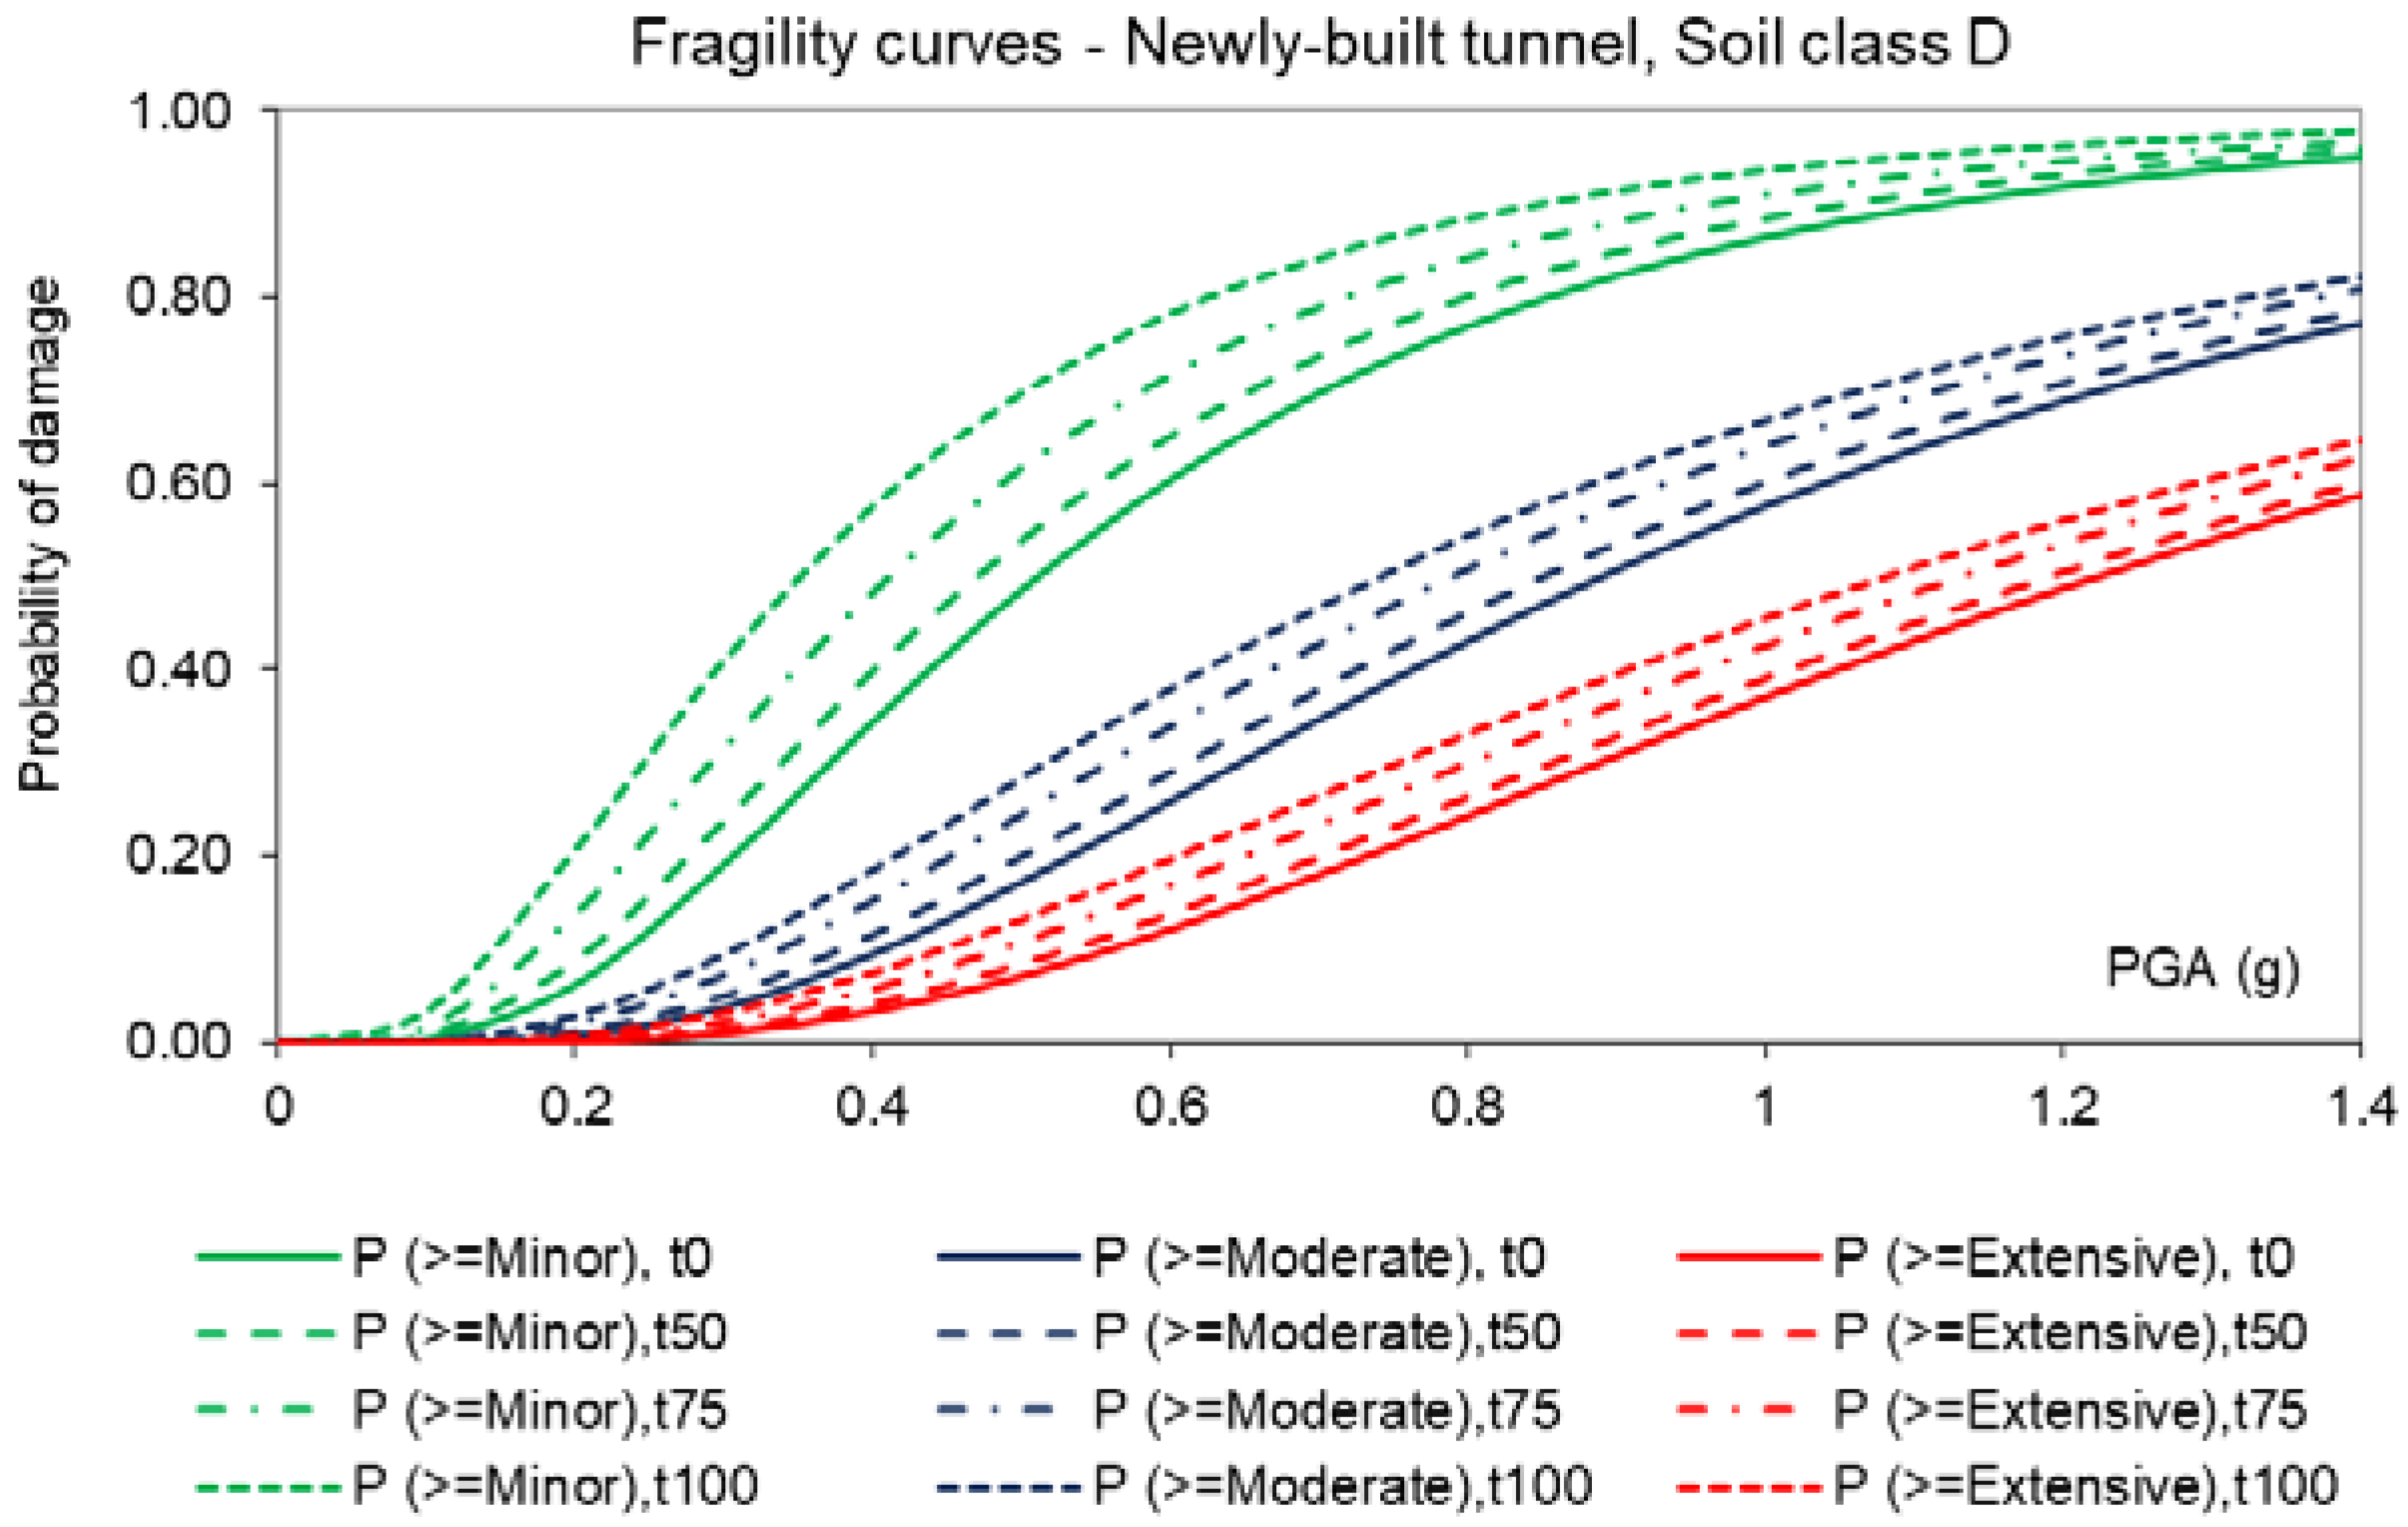
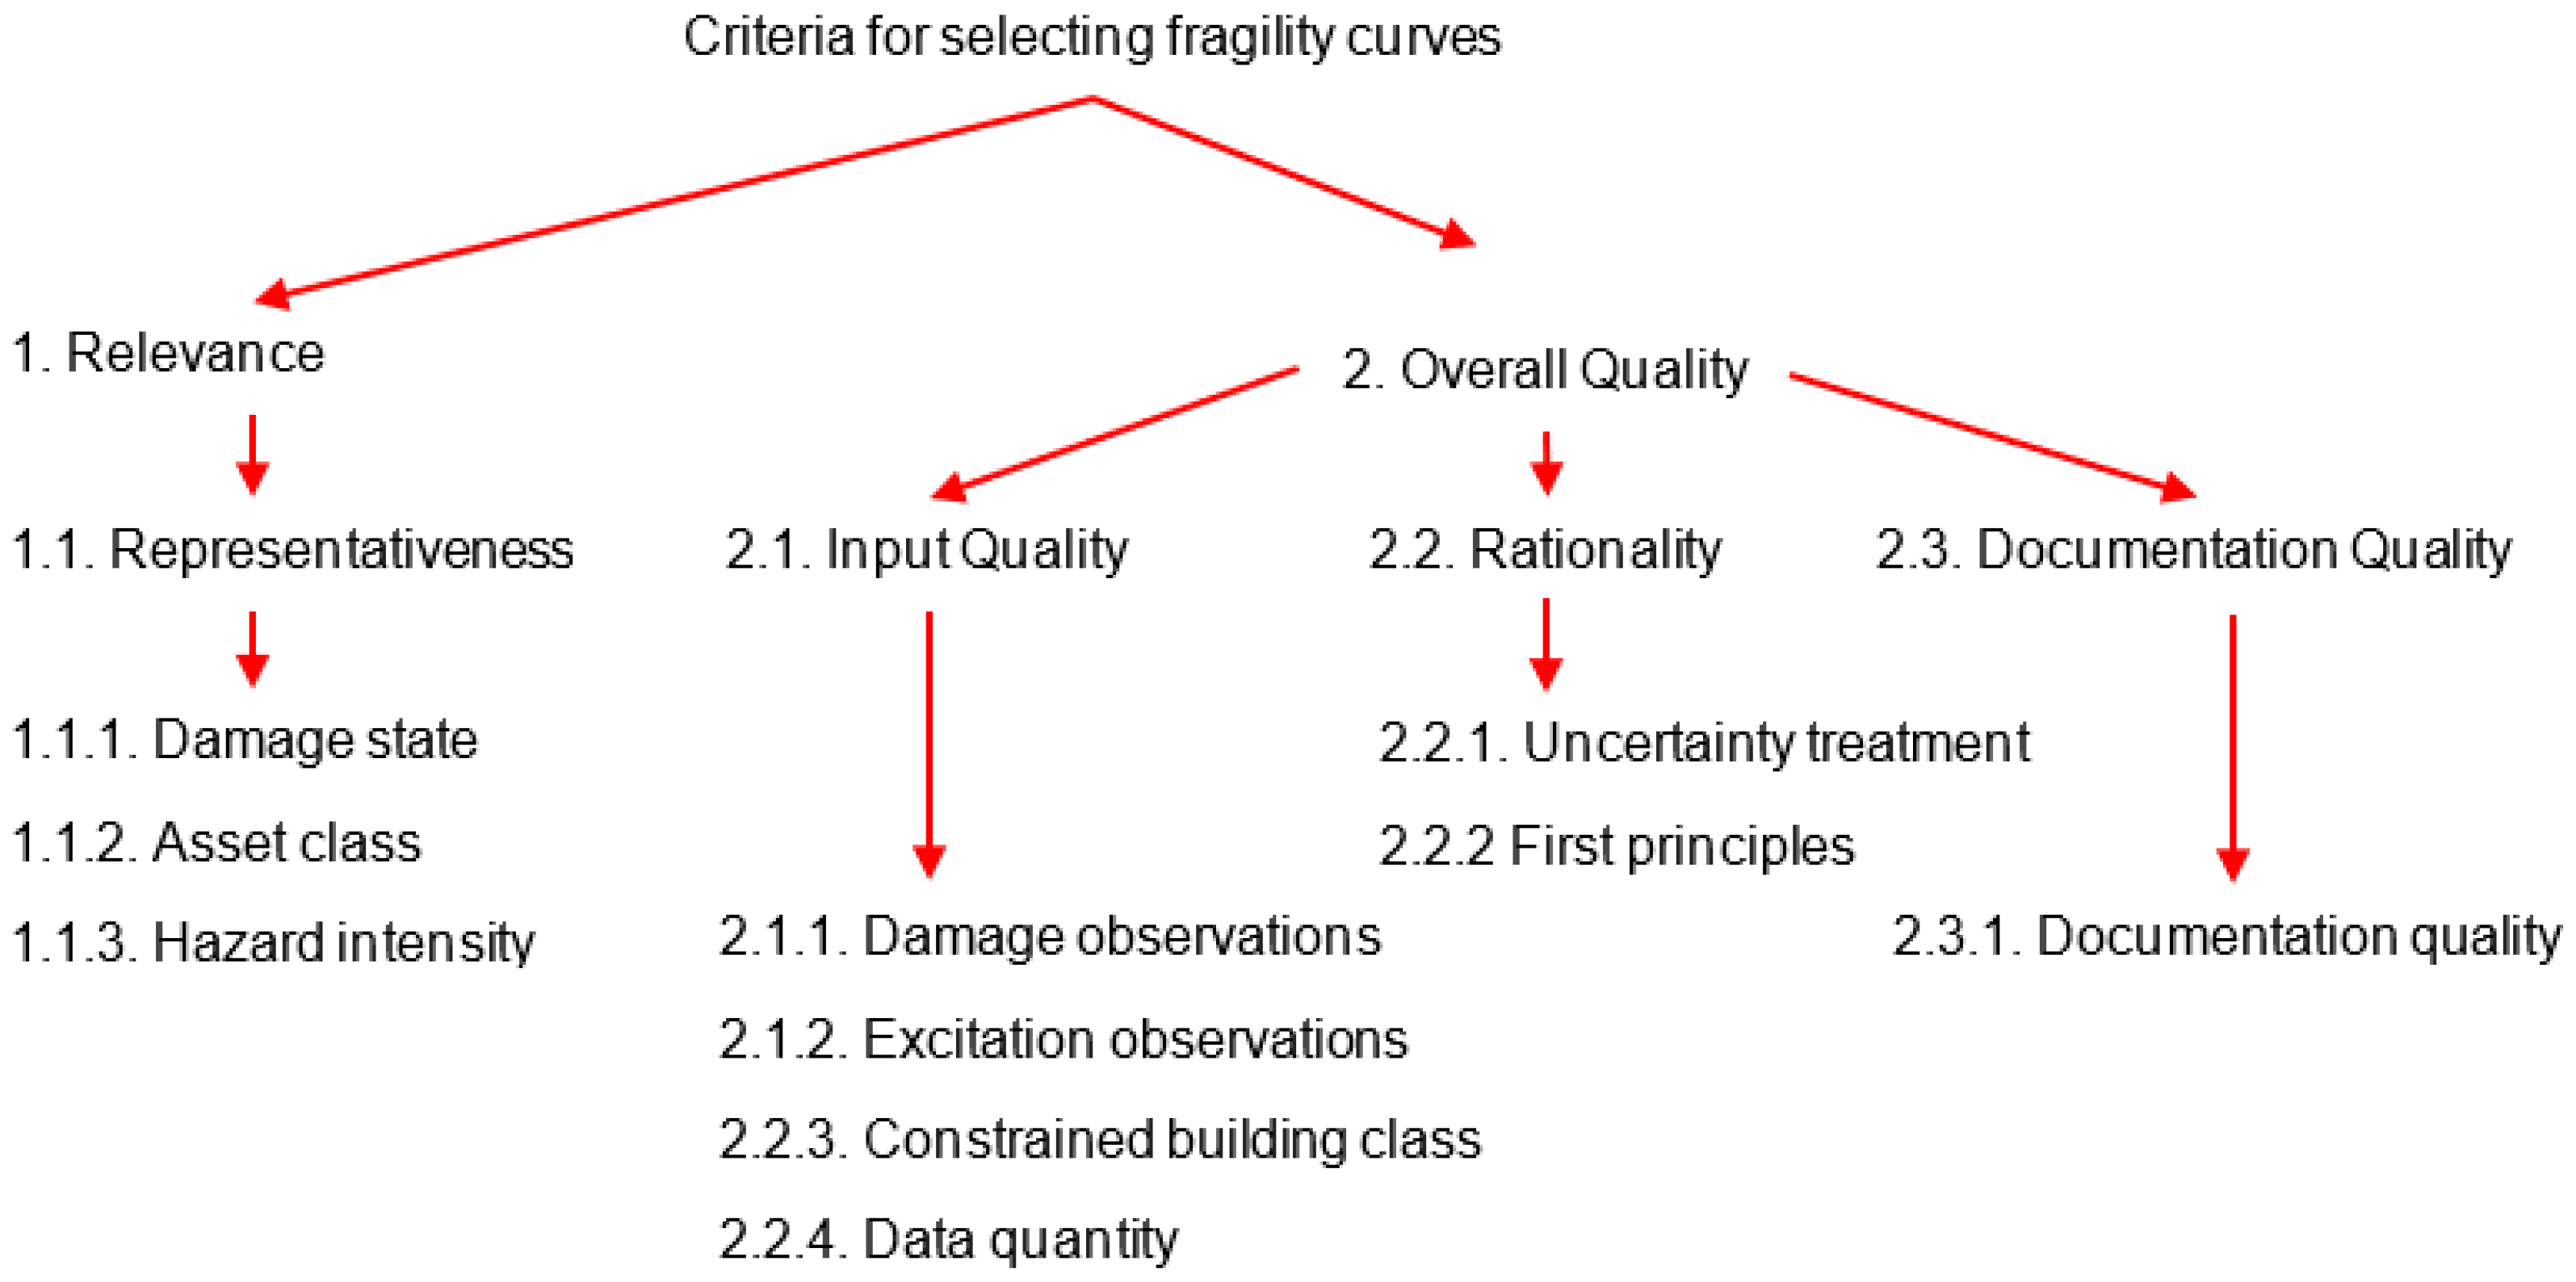
Table 1.
Studies on seismic fragility assessment of mountain type tunnels or tunnels in rock subjected to ground seismic shaking in the transversal direction.
Table 1.
Studies on seismic fragility assessment of mountain type tunnels or tunnels in rock subjected to ground seismic shaking in the transversal direction.
| Reference | Typology | Method | Intensity Measure | Definition of Demand and Capacity | Notes |
|---|---|---|---|---|---|
| ATC [46] | Tunnels in rock | Expert judgement | MMI (Converted to PGA) | - | Only median values are provided for damage states |
| ALA [47,48] | Bored tunnels in rock | Empirical data | PGA (gs *) | Observed damage on tunnels | - |
| NIBS—HAZUS [37] | Bored tunnels in rock | Expert judgement/ Empirical data | PGA (gs) | Observed damage on tunnels | Same fragility curves are provided in more recent versions of HAZUS |
| Corigliano et al. [49] | Deep tunnels | Empirical data | PGV (gs) | Demand/Capacity ratio (lining response) | Type of surrounding ground and quality of support are not accounted for |
| Kim et al. [50] | Various NATM tunnels in different ground conditions | Analytical | PGA | Not clear reference | 2D numerical analysis of examined systems |
| Osmi et al. [51] | Circular tunnel with rock bolts in rock | Analytical/ uncoupled analysis | PGA (gs) | Ratio M/MRd ** | 3D numerical analysis of examined system in FE code MIDAS |
| Huang et al. [53] | Rock mountain tunnels | Analytical/ coupled analysis | Arias Intensity, AI (im) | Ratio M/MRd | 2D numerical analysis of examined systems in FD code FLAC |
| Qui et al. [54] | Circular tunnel in rock | Analytical/ uncoupled analysis | PSA (gs) | Ratio M/MRd | 2D numerical analysis of examined systems in FD code FLAC; beta model for PSDM |
| Andreotti & Lai [44] | Horse-shoe mountain tunnels in fractured rock | Analytical/ coupled analysis | PGA, PGV (im) | Ratio δ/Deq | 2D numerical analysis of examined systems in FD code FLAC |
| Sarkar & Pareek [55] | Circular tunnels in rock | Analytical/ coupled analysis | PGA (im) | Ratio of maximum axial stress induced on the tunnel lining over the maximum permissible stress of the lining | 2D numerical analysis of examined systems in discrete element code UDEC |
| Zi et al. [56] | Rock mountain tunnels | Analytical/ coupled analysis | PGA (gs) | Ratio M/MRd | 2D numerical analysis of examined systems in FE code ABAQUS, investigation of effect of voids on seismic vulnerability |
* im: IM estimated based on input motion, gs: IM estimated based on computed/estimated values at ground surface. ** M: acting bending moment of lining, MRd: capacity bending moment of lining.
Table 2.
Example of definition of an ANN-based PSDΜ: coefficients of the relating damage measures XDM with PGV (Huang et al. [73]).
Table 2.
Example of definition of an ANN-based PSDΜ: coefficients of the relating damage measures XDM with PGV (Huang et al. [73]).
| XIM | w1 | w2 | b1 | b2 | h1 | h2 | b | βDM/IM |
|---|---|---|---|---|---|---|---|---|
| PGV | −78.11 | 75.91 | −0.840 | −0.930 | −1.928 | −1.950 | 1.417 | 0.13 |
Table 3.
Studies on seismic fragility assessment of segmental tunnels/bored circular tunnels in soft soils subjected to ground seismic shaking in the transversal direction.
Table 3.
Studies on seismic fragility assessment of segmental tunnels/bored circular tunnels in soft soils subjected to ground seismic shaking in the transversal direction.
| Reference | Typology | Method | Intensity Measure | Definition of Demand and Capacity | Notes |
|---|---|---|---|---|---|
| ATC [46] | Tunnels in alluvial | Expert judgement | MMI (Converted to PGA) | - | Only median values are provided for damage states |
| ALA [47,48] | Bored tunnels in alluvial | Empirical data | PGA (gs *) | Observed damage on tunnels | - |
| NIBS—HAZUS [37] | Bored tunnels in alluvial | Expert judgement/ Empirical data | PGA (gs) | Observed damage on tunnels | Same fragility curves are provided in more recent versions of HAZUS |
| Salmon et al. [57] | Bored tunnels with steel liner | Analytical | PGA (gs) | Not clear reference | Tunnels referring to BART system, CA, USA |
| Argyroudis and Pitilakis [52] | Circular tunnels in soft soils | Analytical/uncoupled analysis | PGA (gs) | Ratio M/MRd ** | 2D numerical analysis of examined systems in FE code PLAXIS |
| Osmi et al. [60] | Circular tunnel in alluvial deposits | Analytical/uncoupled analysis | PGA (gs) | Ratio M/MRd | 3D numerical analysis of examined systems in FE code MIDAS |
| Fabozzi & Bilotta [61] | Circular segmental tunnel | Analytical/coupled analysis | PGA (im), PGD | Damage Indexes: Segments: Ratio M/MRd, Joints: Ratio φr/φ1 | 2D numerical analysis of examined systems in FE code PLAXIS |
| Avanaki et al. [63] | Circular segmental tunnel | Analytical/uncoupled analysis | PGA (im) | Defined as per Equation (8) | 2D numerical analysis of examined systems in FE code ABAQUS |
| Huang et al. [65] | Circular tunnels in soft deep soil deposits | Analytical/uncoupled analysis | PGA, PGV (im) | Ratio M/MRd | 2D numerical analysis of examined systems in FE code ABAQUS |
| Hu et al. [70] | Circular twin tunnel in soft soil | Analytical/uncoupled analysis | PGA (gs) | Ratio M/MRd | 2D numerical analysis of examined systems in FE code ABAQUS |
| Huang & Zhang [71] | Circular tunnels in soft deep soil deposits | Analytical/uncoupled analysis | PGA, PGV (im) | Ratio M/MRd | 2D numerical analysis of examined systems in FE code ABAQUS |
| de Silva et al. [72] | Circular tunnels in sand | Analytical/coupled analysis | PGA, PGV (im, gs) | Defined as per Equation (12) | 2D numerical analysis of examined systems in FD code FLAC, cloud analysis |
| Huang et al. [73] | Circular tunnels in soft deep soil deposits | Analytical/uncoupled analysis | PGV (gs), FR1 = PGV/PGA (gs), PGV (im) | Ratio M/MRd | 2D numerical analysis of examined systems in FE code ABAQUS |
* im: IM estimated based on input motion, gs: IM estimated based on computed/estimated values at ground surface. ** M: acting bending moment of lining, MRd: capacity bending moment of lining.
Table 4.
Studies on seismic fragility assessment of cut and cover tunnels/subway stations/rectangular underground structures subjected to ground seismic shaking in the transversal direction.
Table 4.
Studies on seismic fragility assessment of cut and cover tunnels/subway stations/rectangular underground structures subjected to ground seismic shaking in the transversal direction.
| Reference | Typology | Method | Intensity Measure | Definition of Demand and Capacity | Notes |
|---|---|---|---|---|---|
| ALA [47,48] | Cut & cover tunnels in alluvial | Empirical data | PGA (gs *) | Observed damage on tunnels | - |
| NIBS—HAZUS [37] | Cut & cover tunnels in alluvial | Expert judgement/ Empirical data | PGA (gs) | Observed damage on tunnels | Same fragility curves are provided in more recent versions of HAZUS |
| Salmon et al. [57] | Cut & cover tunnels; Transbay tube | Analytical | PGA (gs) | Not clear reference | Tunnels referring to BART system, CA, USA |
| Argyroudis and Pitilakis [52] | Rectangular tunnels in soft soils | Analytical/uncoupled analysis | PGA (gs) | Ratio M/MRd ** | 2D numerical analysis of examined systems in FE code PLAXIS |
| Le et al. [74] | One story—two-barrel rectangular tunnel | Analytical/uncoupled analysis | PGA (im) | Ratio M/MRd | Maximum likelihood analysis is performed |
| Kim et al. [50] | Cut & cover tunnels in alluvial | Analytical | PGA | Observed damage state | 2D numerical analysis of examined systems |
| Ryong et al. [75] | Utility tunnels in soil (rectangular) | Analytical | PGA | Md ≤ Mu *** Vd ≤ Vu | Probabilistic definition of soil properties |
| Huh et al. [76] | One story—two-barrel rectangular tunnel | Analytical/uncoupled analysis | PGA (im) | max(δ/h) **** | Maximum likelihood analysis is performed—pushover analyses in FE code SAP2000 to define damage states and relevant thresholds |
| Huh et al. [78] | Two story—four-barrel underground box structure | Analytical/uncoupled analysis | PGA (im) | max(δ/h) | Maximum likelihood analysis is performed—pushover analyses in FE code SAP2000 to define damage states and relevant thresholds |
| Nguyen et al. [79] | One story—single, double, and triple rectangular tunnels | Analytical/uncoupled analysis | PGA, PGV, PGV/Vs30 (im) | Ratio M/MRd | 2D numerical frame-spring models of examined tunnels in FE code SAP2000 |
| He & Chen [82] | Multi-span underground box structure (commercial underground structure in China) | Analytical/uncoupled analysis | PGA, PGV (im) | max(δ/h) | 2D numerical analysis of examined systems in FE code ABAQUS |
| Zhong et al. [85] | Daikai subway station | Analytical/coupled analysis | PGA (gs) | max(δ/h) | 2D numerical analysis of examined systems in FE code ABAQUS, pushover analyses to define damage states and relevant thresholds |
| Zhuang et al. [86] | Daikai subway station | Analytical/coupled analysis | PGA (gs), PRLD | max(δ/h) | 2D numerical analysis of examined systems in FE code ABAQUS, pushover analyses to define damage states and relevant thresholds |
| Zhong et al. [89] | Two story—three span subway station | Analytical/coupled analysis | PGA (gs) | max(δ/h) | 2D numerical analysis of examined systems in FE code ABAQUS, pushover analyses to define damage states and relevant thresholds |
| Jiang et al. [90] | Caofang subway station in Beijing, China | Analytical/coupled analysis | PGA (gs) | max(δ/h) | 2D numerical analysis of examined systems in FE code ABAQUS |
| Zhang et al. [93] | Two story—three span subway station | Analytical/coupled analysis | PGA, SMA, VSI (gs) | max(δ/h) | 2D numerical analysis of examined systems in FE code ABAQUS |
| He et al. [94] | Multi-span underground box structure | Analytical/coupled analysis | PGV (im) | max(δ/h) | 2D numerical analysis of examined systems in FE code ABAQUS, study accounts for spatially varying soil properties |
* im: intensity measure based on input motion, gs: intensity measure based on computed/estimated values at ground surface. ** M, MRd: acting and capacity bending moment of lining, respectively. *** Md, Mu: acting and ultimate bending moment of lining, respectively, Vd, Vu: acting and ultimate shear force of lining, respectively. **** max(δ/h): maximum of ratio of the horizontal relative displacement of the roof to invert slab of the structure over the height of the examined structure.
Table 5.
Studies on seismic fragility assessment of tunnels and underground structures subjected to ground seismic shaking in the longitudinal direction.
Table 5.
Studies on seismic fragility assessment of tunnels and underground structures subjected to ground seismic shaking in the longitudinal direction.
| Reference | Typology | Method | Intensity Measure | Definition of Demand and Capacity | Notes |
|---|---|---|---|---|---|
| ALA [47,48] | Bored tunnels in alluvial | Empirical data | PGA (gs *) | Observed damage on tunnels | - |
| NIBS—HAZUS [37] | Bored tunnels in alluvial | Expert judgement/ Empirical data | PGA (gs) | Observed damage on tunnels | Same fragility curves are provided in more recent versions of HAZUS |
| Dong et al. [95] | Circular shield tunnels in soft soils | Analytical/ coupled analysis | PGV (gs) | Ring joint opening Segments Dislocation | 3D numerical analysis of examined systems in FE code ABAQUS (Beam on springs models) |
* gs: IM estimated based on computed/estimated values at ground surface.
Table 6.
Studies on fragility assessment of tunnels and underground structures subjected to seismically induced ground failures.
Table 6.
Studies on fragility assessment of tunnels and underground structures subjected to seismically induced ground failures.
| Reference | Typology | Method | Intensity Measure | Definition of Demand and Capacity | Notes |
|---|---|---|---|---|---|
| NIBS—HAZUS [37] | Bored tunnels in rock, bored tunnels in alluvial cut & cover tunnels in alluvial | Expert judgement/ Empirical data | PGD | Observed damage on tunnels | Same fragility curves are provided in more recent versions of HAZUS |
| Salmon et al. [57] | Bored tunnels with steel liner; cut & cover tunnels; Transbay tube | Analytical | PGA | Not clear reference | Tunnels referring to BART system, California, USA. Damage due to faulting or liquefaction. |
| Kiani et al. [100] | Circular segmental tunnel | Experimental/centrifuge | PGD | Damage states defined based on observation of response during testing (photo material) | Experimental investigation of the fragility of tunnels under faulting |
Publisher’s Note: MDPI stays neutral with regard to jurisdictional claims in published maps and institutional affiliations. |
© 2022 by the authors. Licensee MDPI, Basel, Switzerland. This article is an open access article distributed under the terms and conditions of the Creative Commons Attribution (CC BY) license (https://creativecommons.org/licenses/by/4.0/).
Share and Cite
MDPI and ACS Style
Tsinidis, G.; Karatzetzou, A.; Stefanidou, S.; Markogiannaki, O. Developments in Seismic Vulnerability Assessment of Tunnels and Underground Structures. Geotechnics 2022, 2, 209-249. https://doi.org/10.3390/geotechnics2010010
AMA Style
Tsinidis G, Karatzetzou A, Stefanidou S, Markogiannaki O. Developments in Seismic Vulnerability Assessment of Tunnels and Underground Structures. Geotechnics. 2022; 2(1):209-249. https://doi.org/10.3390/geotechnics2010010
Chicago/Turabian StyleTsinidis, Grigorios, Anna Karatzetzou, Sotiria Stefanidou, and Olga Markogiannaki. 2022. "Developments in Seismic Vulnerability Assessment of Tunnels and Underground Structures" Geotechnics 2, no. 1: 209-249. https://doi.org/10.3390/geotechnics2010010