
A Systematic Review and Meta-Analysis of Dengue Risk with Temperature Change

Abstract
:1. Introduction
2. Methods
2.1. Search Strategy and Selection Criteria
2.2. Data Extraction
2.3. Quality Assessment
2.4. Statistical Analysis
3. Results
3.1. Study Inclusions
3.2. The Association Analysis between Temperatures and OR of Dengue


| Study | OR | 95% CI | |
|---|---|---|---|
| Tmin | |||
| Promprou et al. [27] | 1.08 | 1.08 | 1.08 |
| Hurtado-Daiz et al. [29] | 1.04 | 1.00 | 1.08 |
| Hurtado-Daiz et al. [29] | 1.06 | 1.02 | 1.10 |
| Chowell et al. [28] | 1.62 | 1.53 | 1.71 |
| Hsieh et al. [33] | 1.19 | 0.96 | 1.48 |
| Lu et al. [14] | 1.42 | 1.26 | 1.57 |
| Lu et al. [14] | 1.37 | 1.23 | 1.51 |
| Chen et al. [34] | 1.15 | 1.12 | 1.18 |
| Chen et al. [34] | 1.71 | 1.67 | 1.75 |
| Sriprom et al. [35] | 2.69 | 2.44 | 2.97 |
| Colon- González et al. [36] | 1.08 | 1.03 | 1.13 |
| Gharbi et al. [37] | 1.11 | 0.98 | 1.27 |
| Pinto et al. [40] | 1.3 | 1.2 | 1.45 |
| Gomes et al. [42] | 1.45 | 1.34 | 1.58 |
| Gomes et al. [42] | 0.89 | 0.87 | 0.92 |
| Cheong et al. [47] | 1.14 | 1.04 | 1.46 |
| Huang et al. [49] | 1.64 | 1.01 | 2.67 |
| Li et al. [50] | 1.10 | 1.08 | 1.12 |
| Ibarra et al. [52] | 1.02 | 0.98 | 1.09 |
| Fan et al. [53] | 1.83 | 1.50 | 2.17 |
| Wang et al. [54] | 0.84 | 0.80 | 0.88 |
| Overall | 1.30 | 1.21 | 1.38 |
| Tmean | |||
| Promprou et al. [27] | 1.40 | 1.39 | 1.44 |
| Chowell et al. [28] | 2.84 | 2.66 | 2.96 |
| Arcari et al. [30] | 1.49 | 1.38 | 1.60 |
| Hsieh et al. [33] | 1.36 | 1.21 | 1.52 |
| Wu et al. [12] | 1.95 | 1.32 | 2.58 |
| Gharbi et al. [37] | 1.26 | 1.03 | 1.53 |
| Pham et al. [39] | 1.39 | 1.25 | 1.55 |
| Earnest et al. [41] | 1.20 | 1.14 | 1.25 |
| Hii et al. [44] | 1.31 | 1.22 | 1.40 |
| Hii et al. [44] | 1.07 | 1.00 | 1.15 |
| Hii et al. [44] | 1.46 | 1.36 | 1.56 |
| Hii et al. [44] | 1.39 | 1.30 | 1.47 |
| Goto et al. [48] | 1.18 | 1.04 | 1.8 |
| Goto et al. [48] | 1.00 | 0.99 | 1.01 |
| Goto et al. [48] | 1.64 | 1.36 | 1.92 |
| Lowe et al. [51] | 1.65 | 1.55 | 1.79 |
| Overall | 1.35 | 1.18 | 1.52 |
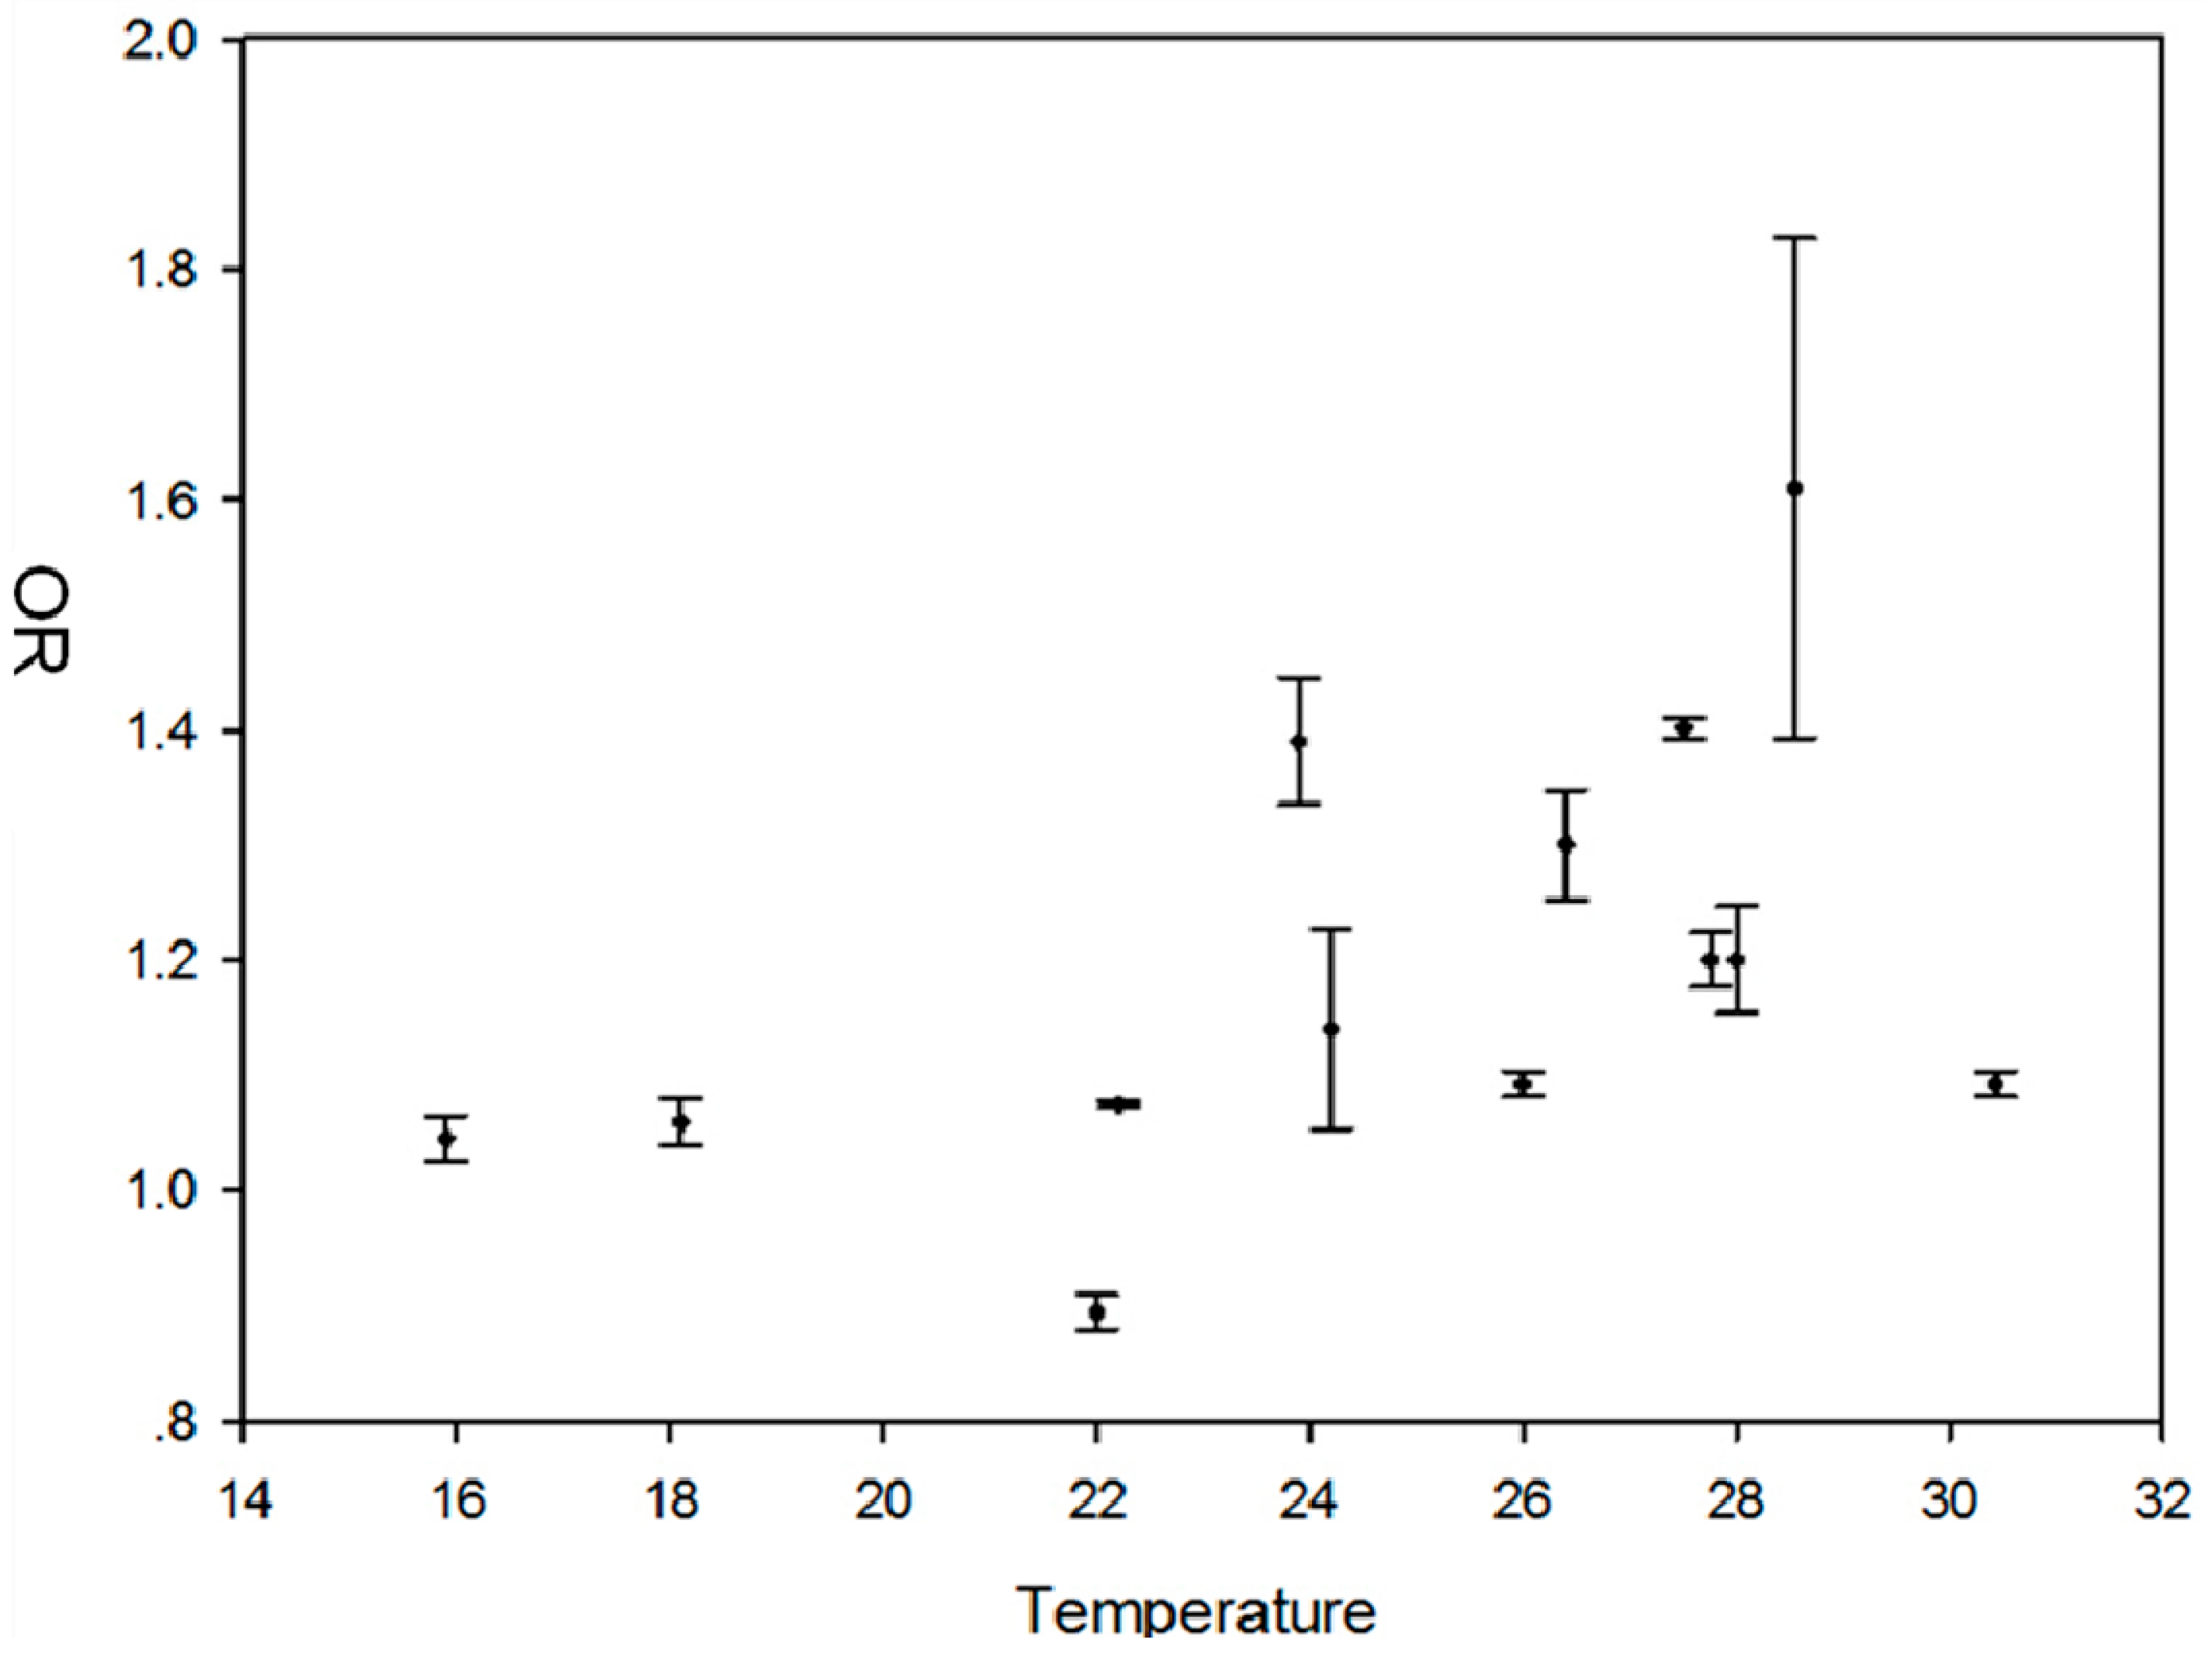
| Tmax | |||
| Chowell et al. [28] | 2.00 | 1.89 | 2.11 |
| Brunkard et al. [31] | 1.03 | 1.00 | 1.05 |
| Hsieh et al. [33] | 2.33 | 1.89 | 2.42 |
| Colon- González et al. [36] | 1.13 | 0.99 | 1.27 |
| Pinto et al. [40] | 1.20 | 1.11 | 1.33 |
| Gomes et al. [42] | 1.09 | 1.07 | 1.12 |
| Hu et al. [45] | 1.61 | 1.03 | 2.41 |
| Karim et al. [46] | 1.01 | 0.93 | 1.10 |
| Karim et al. [46] | 1.09 | 1.01 | 1.17 |
| Karim et al. [46] | 1.14 | 1.07 | 1.21 |
| Overall | 1.29 | 1.10 | 1.48 |
| Temperatures p | Lag | Altitude | Method | Climatic Zone | Largest Monte Carlo SE (p) | |
|---|---|---|---|---|---|---|
| Tmin | Unadjusted p | 0.889 | 0.500 | 0.667 | 0.889 | 0.1034 |
| Adjusted p | 1.000 | 1.000 | 1.000 | 1.000 | ||
| Tmax | Unadjusted p | 0.333 | 0.667 | 1.000 | 0.333 | 0.2191 |
| Adjusted p | 1.000 | 1.000 | 1.000 | 1.000 | ||
| Tmean | Unadjusted p | 0.822 | 0.592 | 0.557 | -- | 0.0050 |
| Adjusted p | 0.991 | 0.933 | 0.894 | -- | ||
3.3. Meta-Analysis of p-Values and Publication Bias Test
| Temperatures | Studies | χ2 | p_Value | Two-Tailed p |
|---|---|---|---|---|
| Tmin | 7 [16,17,26,27,31,38,43] | 33.591478 | 0.00021655 | 0.000433 |
| Tmax | 7 [16,17,26,27,38,43,47] | 53.472649 | 6.321 e−6 | 1.26 e−5 |
| Tmean | 6 [16,17,26,27,32,43,] | 29.511036 | 0.00025784 | 0.000516 |
| Temperatures | Statistic | Coef. | Std. Err. | t | p | 95% CI | |
|---|---|---|---|---|---|---|---|
| Tmin | Slope | 0.0695253 | 0.030069 | 2.31 | 0.034 | 0.00608 | 0.13296 |
| bias | 4.9533650 | 2.930330 | 1.69 | 0.109 | −1.22903 | 11.13576 | |
| Tmax | Slope | 0.0407122 | 0.123009 | 0.33 | 0.750 | −0.25015 | 0.33158 |
| bias | 3.8721170 | 4.255641 | 0.91 | 0.392 | −6.19087 | 13.93511 | |
| Tmean | Slope | 0.3523181 | 0.088274 | 3.99 | 0.001 | 0.16288 | 0.54164 |
| bias | −0.7215385 | 3.319929 | −0.22 | 0.831 | −7.84207 | 6.39934 | |
4. Discussion
5. Conclusions
Supplementary Files
Supplementary File 1Acknowledgments
Author Contributions
Conflicts of Interest
References
- Global Strategy for Dengue Prevention and Control 2012–2020; WHO Press: Geneva, Switzerland, 2012; pp. 1–5.
- Gubler, D.J. The economic burden of dengue. Amer. J. Trap. Med. Hyg. 2012, 86, 743–744. [Google Scholar]
- Simmons, C.P.; Farrar, J.J.; van Vinh Chau, N.; Wills, B. Dengue. N. Engl. J. Med. 2012, 366, 1423–1432. [Google Scholar] [CrossRef] [PubMed]
- Rigau-Pérez, J.G.; Clark, G.G.; Gubler, D.J.; Reiter, P.; Sanders, E.J.; Vance Vorndam, A. Dengue and dengue haemorrhagic fever. Lancet 1998, 352, 971–977. [Google Scholar] [CrossRef] [PubMed]
- Dengue: Guidelines for Diagnosis, Treatment, Prevention and Control; WHO Press: Geneva, Switzerland, 2009; pp. 25–58.
- Naish, S.; Dale, P.; Mackenzie, J.S.; McBride, J.; Mengersen, K.; Tong, S. Climate change and dengue: A critical and systematic review of quantitative modelling approaches. BMC Infect. Dis. 2014, 14, 167–180. [Google Scholar] [CrossRef] [PubMed]
- Dengue and Climate. Available online: http://www.cdc.gov/dengue/entomologyEcology/climate.html (accessed on 9 June 2010).
- Dhiman, R.C.; Pahwa, S.; Dhillon, G.; Dash, A.P. Climate change and threat of vector-borne diseases in India: Are we prepared? Parasitol. Res. 2010, 106, 763–773. [Google Scholar] [CrossRef] [PubMed]
- Chen, S.C.; Hsieh, M.H. Modeling the transmission dynamics of dengue fever: Implications of temperature effects. Sci. Total Environ. 2012, 431, 385–391. [Google Scholar] [CrossRef] [PubMed]
- Watts, D.M.; Burke, D.S.; Harrison, B.A.; Whitmire, R.E.; Nisalak, A. Effect of temperature on the vector efficiency of Aedes aegypti for dengue 2 virus. Amer. J. Trap. Med. Hyg. 1986, 36, 143–152. [Google Scholar]
- Vezzani, D.; Velázquez, S.M.; Schweigmann, N. Seasonal pattern of abundance of Aedes aegypti (Diptera: Culicidae) in Buenos Aires city, Argentina. Mem Inst. Oswaldo Cruz. 2004, 99, 351–356. [Google Scholar] [CrossRef] [PubMed]
- Wu, P.C.; Lay, J.G.; Guo, H.R.; Lin, C.Y.; Lung, S.C.; Su, H.J. Higher temperature and urbanization affect the spatial patterns of dengue fever transmission in subtropical Taiwan. Sci. Total Environ. 2009, 407, 2224–2233. [Google Scholar] [CrossRef] [PubMed]
- Wu, F.; Liu, Q.Y.; Lu, L.; Wang, J.F.; Song, X.P.; Ren, D.S. Distribution of Aedes albopictus (Diptera: Culidea) in northwestern China. Vector-Borne Zoonotic Dis. 2011, 11, 1181–1186. [Google Scholar] [CrossRef] [PubMed]
- Lu, L.; Lin, H.L.; Tian, L.W.; Yang, W.Z.; Sun, J.M.; Liu, Q.Y. Time series analysis of dengue fever and weather in Guangzhou, China. BMC Public Health 2009, 9, 395–399. [Google Scholar] [CrossRef] [PubMed]
- Chen Chen, W.J.; Li, C.X.; Lin, M.H.; Wu, K.C.; Wu, K.L.; Zhao, Z.G. Study on the suitable duration for dengue fever (DF) transmission in a whole year and potential impact on DF by global warming in Hainan Province. China Trop. Med. 2002, 2, 31–34 . (in Chinese). [Google Scholar]
- Yang, T.C.; Lu, L.; Fu, G.M.; Zhong, S.; Ding, G.Q.; Xu, R.; Zhu, G.F.; Shi, N.F.; Fan, F.L; Liu, Q.Y. Epidemiology and vector efficiency during a dengue fever outbreak in Cixi, Zhejiang Province, China. J. Vector Ecol. 2009, 34, 148–154. [Google Scholar]
- Rua-Uribe, G.L.; Suarez-Acosta, C.; Chauca, J.; Ventosilla, P.; Almanza, R. Modelling the effect of local climatic variability on dengue transmission in Medellin (Colombia) by means temporary series analysis. Biomedica 2013, 33, 142–152. [Google Scholar] [PubMed]
- Liu, X.D; Cheng, Z.B; Yan, L.B; Yin, Z.Y. Elevation dependency of recent and future minimum surface air temperature trends in the Tibetan Plateau and its surroundings. Glob. Planet. Change 2009, 68, 164–174. [Google Scholar]
- Chen, B.D. Enhanced climatic warming in the Tibetan Plateau due to doubling CO2: A model study. Clim. Dynam. 2003, 20, 401–413. [Google Scholar]
- Berthiera, E.; Toutin, T. SPOT5-HRS digital elevation models and the monitoring of glacier elevation changes in north-west Canada and south-east Alaska. Remote Sens. Environ. 2008, 112, 2443–2454. [Google Scholar] [CrossRef]
- Jetten, T.H.; Focks, D.A. Potential changes in the distribution of dengue transmission under climate warming. Amer. J. Trap. Med. Hyg. 1997, 57, 285–297. [Google Scholar]
- Rogers, D.J.; Randolph, S.E. Climate change and vector-borne diseases. Adv. Parasito. 2006, 62, 345–381. [Google Scholar]
- Pai, M.; McCulloch, M.; Enanoria, W.; Colford, J.M. Systematic reviews of diagnostic test evaluations: What’s behind the scenes? ACP J. Club. 2004, 9, 101–103. [Google Scholar]
- Wells, G.; Shea, B.; O’connell, D.; Peterson, J.; Welch, V.; Losos, M.; Tugwell, P. Newcastle-Ottawa Scale (Nos) for Assessing the Quality of Nonrandomised Studies in Meta-Analyses. In Proceedings of Cochrane Colloquium, Kape Town, South Africa, 25–29 October 2000.
- Shah, A.S.; Langrish, J.P.; Nair, H.; McAllister, D.A.; Hunter, A.L.; Donaldson, K.; Newby, D.E.; Mills, N.L. Global association of air pollution and heart failure: A systematic review and meta-analysis. Lancet 2013, 382, 1039–1048. [Google Scholar] [CrossRef] [PubMed]
- Depradine, C.A.; Lovell, E.H. Climatological variables and the incidence of dengue fever in Barbados. Int. J. Environ. Health Res. 2004, 14, 429–441. [Google Scholar] [CrossRef] [PubMed]
- Promprou, S.; Jaroensutasinee, M.; Jaroensutasinee, K. Climatic factors affecting dengue haemorrhagic fever incidence in southern Thailand. Dengue Bull. 2005, 29, 41–48. [Google Scholar]
- Chowell, G.; Sanchez, F. Climate-based descriptive models of dengue fever: The 2002 epidemic in Colima, Mexico. J. Environ. Health. 2006, 68, 40–44. [Google Scholar] [PubMed]
- Hurtado-Daiz, M.; Riojas-Rodrguez, H.; Rothenberg, S.; Gomez-Dantes, H.; Cifuentes, E. Impact of climate variability on the incidence of dengue in Mexico. Trop. Med. Int. Health 2007, 12, 1327–1337. [Google Scholar] [CrossRef] [PubMed]
- Arcari, P.; Tapper, N.; Pfueller, S. Regional variability in relationships between climate and dengue/DHF in Indonesia. Singap. J. Trop. Geogr. 2007, 28, 251–272. [Google Scholar] [CrossRef]
- Brunkard, J.M.; Cifuentes, E.; Rothenberg, S.J. Assessing the roles of temperature, precipitation, and ENSO in dengue re-emergence on the Texas-Mexico border region. Salud. Publ. Mex. 2008, 50, 227–234. [Google Scholar]
- Su, G.L. Correlation of climatic factors and dengue incidence in Metro Manila, Philippines. Ambio 2008, 37, 292–294. [Google Scholar] [CrossRef] [PubMed]
- Hsieh, Y.H.; Chen, C.W. Turning points, reproduction number, and impact of climatological events for multi-wave dengue outbreaks. Trop. Med. Int. Health 2009, 14, 628–638. [Google Scholar] [CrossRef] [PubMed]
- Chen, S.C.; Liao, C.M.; Chio, C.P.; Chou, H.H.; You, S.H.; Cheng, Y.H. Lagged temperature effect with mosquito transmission potential explains dengue variability in southern Taiwan: Insights from a statistical analysis. Sci. Total Environ. 2010, 408, 4069–4075. [Google Scholar] [CrossRef] [PubMed]
- Sriprom, M.; Chalvet-Monfray, K.; Chaimane, T.; Vongsawat, K.; Bicout, D.J. Monthly district level risk of dengue occurrences in Sakon Nakhon Province, Thailand. Sci. Total Environ. 2010, 408, 5521–5528. [Google Scholar] [CrossRef] [PubMed]
- Colon-Gonzalez, F.J.; Lake, I.R.; Bentham, G. Climate variability and dengue fever in warm and humid Mexico. Amer. J. Trap. Med. Hyg. 2011, 84, 757–763. [Google Scholar] [CrossRef]
- Gharbi, M.; Quenel, P.; Gustave, J.; Cassadou, S.; Ruche, G.L.; Girdary, L.; Marrama, L. Time series analysis of dengue incidence in Guadeloupe, French West Indies: Forecasting models using climate variables as predictors. BMC Infect. Dis. 2011, 11. [Google Scholar] [CrossRef] [PubMed]
- Lai, L.W. Influence of environmental conditions on asynchronous outbreaks of dengue disease and increasing vector population in Kaohsiung, Taiwan. Int. J. Environ. Health Res. 2011, 21, 133–146. [Google Scholar] [CrossRef] [PubMed]
- Pham, H.V.; Doan, H.T.; Phan, T.T.; Minh, N.N. Ecological factors associated with dengue fever in a Central Highlands province, Vietnam. BMC Infect. Dis. 2011, 11. [Google Scholar] [CrossRef] [PubMed]
- Pinto, E.; Coelho, M.; Oliver, L.; Massad, E. The influence of climate variables on dengue in Singapore. Int. J. Environ. Health Res. 2011, 21, 415–426. [Google Scholar] [CrossRef] [PubMed]
- Earnest, A.; Tan, S.B.; Wilder-Smith, A. Meteorological factors and El Niño southern oscillation are independently associated with dengue infections. Epidemiol. Infect. 2012, 140, 1244–1251. [Google Scholar] [CrossRef] [PubMed]
- Gomes, A.F.; Nobre, A.A.; Cruz, O.G. Temporal analysis of the relationship between dengue and meteorological variables in the city of Rio de Janeiro, Brazil, 2001–2009. Cad. Saude. Publ. 2012, 28, 2189–2197. [Google Scholar] [CrossRef]
- Hashizume, M.; Dewan, A.M.; Sunahara, T.; Rahman, M.Z.; Yamamoto, T. Hydroclimatological variability and dengue transmission in Dhaka, Bangladesh: A time-series study. BMC Infect. Dis. 2012, 12. [Google Scholar] [CrossRef] [PubMed]
- Hii, Y.L.; Rocklov, J.; Wall, S.; Ng, L.C.; Tang, C.S.; Ng, N. Optimal lead time for dengue forecast. PLoS Negl. Trop. Dis. 2012, 6. [Google Scholar] [CrossRef] [PubMed]
- Hu, W.B.; Clements, A.; Williams, G.; Tong, S.L.; Mengersen, K. Spatial patterns and socioecological drivers of dengue fever transmission in Queensland, Australia. Environ. Health Perspect. 2012, 120, 260–266. [Google Scholar] [CrossRef] [PubMed]
- Karim, M.N.; Munshi, S.U.; Anwar, N.; Alam, M.S. Climatic factors influencing dengue cases in Dhaka city: A model for dengue prediction. Indian J. Med. Res. 2012, 136, 32–39. [Google Scholar] [PubMed]
- Cheong, Y.L.; Burkart, K.; Leitão, P.J.; Lakes, T. Assessing weather effects on dengue disease in Malaysia. Int. J. Environ. Res. Public Health. 2013, 10, 6319–6334. [Google Scholar] [CrossRef] [PubMed]
- Goto, K.; Kumarendran, B.; Mettananda, S.; Gunasekara, D.; Fujii, Y.; Kaneko, S. Analysis of effects of meteorological factors on dengue incidence in Sri lanka using time series data. PLoS One 2013, 8. [Google Scholar] [CrossRef] [PubMed]
- Huang, X.; Williams, G.; Clements, A.C.; Hu, W. Imported dengue cases, weather variation and autochthonous dengue incidence in Cairns, Australia. PLoS One 2013, 8. [Google Scholar] [CrossRef] [PubMed]
- Li, T.G.; Yang, Z.C.; Luo, L.; Di, B.; Wang, M. Dengue fever epidemiological status and relationship with meteorological variables in Guangzhou, southern China, 2007–2012. Biomed. Environ. Sci. 2013, 26, 994–997. [Google Scholar] [PubMed]
- Lowe, R.; Bailey, T.C.; Stephenson, D.B.; Jupp, T.E.; Graham, R.J.; Barcellos, C.; Carvalho, M.S. The development of an early warning system for climate-sensitive disease risk with a focus on dengue epidemics in southeast Brazil. Stat. Med. 2013, 32, 864–883. [Google Scholar] [CrossRef] [PubMed]
- Stewart-Ibarra, A.M.; Lowe, R. Climate and non-climate drivers of dengue epidemics in southern coastal Ecuador. Amer. J. Trap. Med. Hyg. 2013, 88, 971–981. [Google Scholar] [CrossRef]
- Fan, J.C.; Lin, H.L.; Wang, C.G.; Bai, L.; Yang, S.R; Chu, C.; Yang, W.Z; Liu, Q.Y. Identifying the high-risk areas and associated meteorological factors of dengue transmission in Guangdong Province, China from 2005 to 2011. Epidemiol. Infect. 2014, 142, 634–643. [Google Scholar]
- Wang, C.G.; Jiang, B.F.; Fan, J.C.; Wang, F.R.; Liu, Q.Y. A study of the dengue epidemic and meteorological factors in Guangzhou, China, by using a zero-inflated poisson regression model. Asia Pac. J. Public Health 2014, 26, 48–57. [Google Scholar] [CrossRef] [PubMed]
- Tusting, L.S.; Willey, B.; Lucas, H.; Thompson, J.; Kafy, H.T.; Smith, R.; Lindsay, S.W. Socioeconomic development as an intervention against malaria: A systematic review and meta-analysis. The Lancet 2013, 382, 963–972. [Google Scholar] [CrossRef]
- Brady, O.J.; Gething, P.W.; Bhatt, S.; Messina, J.P.; Brownstein, J.S.; Hoen, A.G.; Moyes, C.L.; Farlow, A.W.; Scott, T.W.; Hay, S.I. Refining the global spatial limits of dengue virus transmission by evidence-based consensus. PLoS Negl. Trop Dis. 2012, 6. [Google Scholar] [CrossRef] [PubMed]
- Shope, R. Global climate change and infectious diseases. Environ. Health Perspect. 1991, 96, 171–174. [Google Scholar] [CrossRef] [PubMed]
- Yang, H.; Macoris, M.; Galvani, K.; Andrighetti, M.; Wanderley, D. Assessing the effects of temperature on dengue transmission. Epidemiol. Infect. 2009, 137, 1179–1187. [Google Scholar] [CrossRef] [PubMed]
- Tunlin, W.; Burkot, T.; Kay, B. Effects of temperature and larval diet on development rates and survival of the dengue vector Aedes aegypti in north Queensland, Australia. Med. Vet. Entomol. 2000, 14, 31–37. [Google Scholar] [CrossRef] [PubMed]
- Yu, H.L.; Yang, S.J.; Yen, H.J.; Christakos, G. A spatio-temporal climate-based model of early dengue fever warning in southern Taiwan. Stoch. Environ. Res. Risk Assess. 2011, 25, 485–494. [Google Scholar] [CrossRef]
- Wilson, R.M. On the Trend of the Annual Mean,Maximum, and Minimum Temperature and the Diurnal Temperature Range in the Armagh Observatory, Northern Ireland, Dataset; 1844–2012; Marshall Space Flight Center: Huntsville, AL, USA, 2013. [Google Scholar]
- Wu, P.C.; Guo, H.R.; Lung, S.C.; Lin, C.Y.; Su, H.J. Weather as an effective predictor for occurrence of dengue fever in Taiwan. Acta. Trop. 2007, 103, 50–57. [Google Scholar] [CrossRef] [PubMed]
- Carbajo, A.E.; Cardo, M.V.; Vezzani, D. Is temperature the main cause of dengue rise in non-endemic countries? The case of Argentina. Int. J. Health Geogr. 2012, 11. [Google Scholar] [CrossRef]
- Morita, K. Dengue vaccines. Nihon Rinsho. 2008, 66, 1999–2003. [Google Scholar] [PubMed]
© 2014 by the authors; licensee MDPI, Basel, Switzerland. This article is an open access article distributed under the terms and conditions of the Creative Commons Attribution license (http://creativecommons.org/licenses/by/4.0/).
Share and Cite
Fan, J.; Wei, W.; Bai, Z.; Fan, C.; Li, S.; Liu, Q.; Yang, K. A Systematic Review and Meta-Analysis of Dengue Risk with Temperature Change. Int. J. Environ. Res. Public Health 2015, 12, 1-15. https://doi.org/10.3390/ijerph120100001
Fan J, Wei W, Bai Z, Fan C, Li S, Liu Q, Yang K. A Systematic Review and Meta-Analysis of Dengue Risk with Temperature Change. International Journal of Environmental Research and Public Health. 2015; 12(1):1-15. https://doi.org/10.3390/ijerph120100001
Chicago/Turabian StyleFan, Jingchun, Wanxia Wei, Zhenggang Bai, Chunling Fan, Shulan Li, Qiyong Liu, and Kehu Yang. 2015. "A Systematic Review and Meta-Analysis of Dengue Risk with Temperature Change" International Journal of Environmental Research and Public Health 12, no. 1: 1-15. https://doi.org/10.3390/ijerph120100001