
China’s Land-Use Changes during the Past 300 Years: A Historical Perspective

Abstract
:1. Introduction
2. Materials and Methods
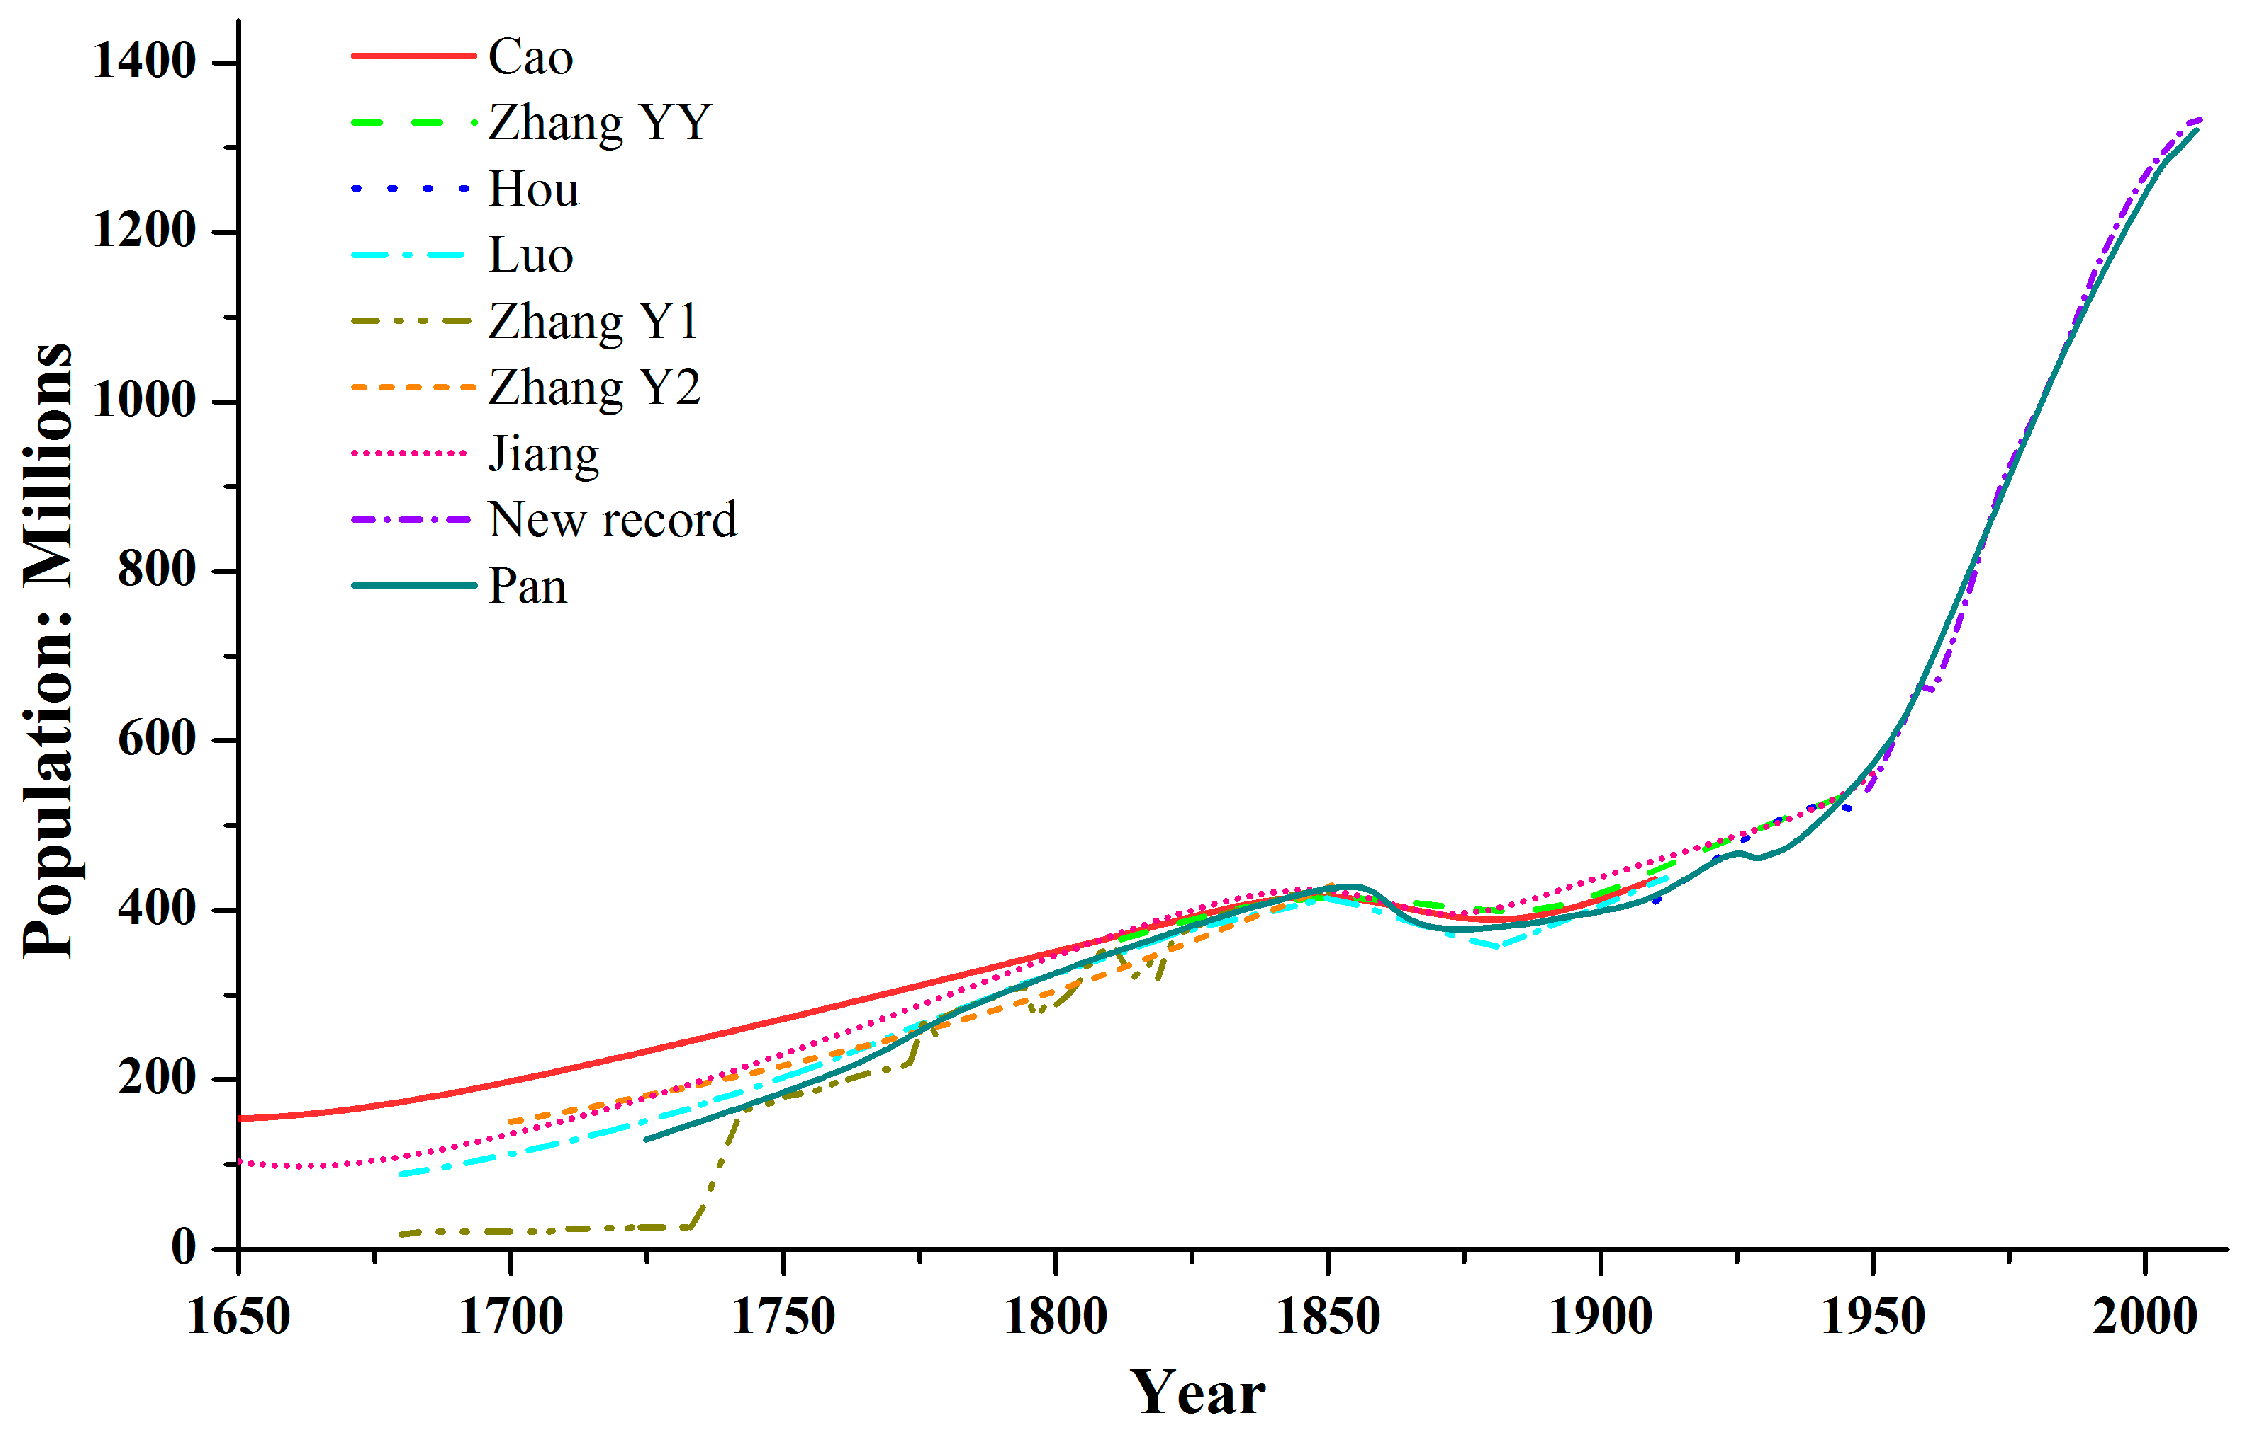
2.1. Population
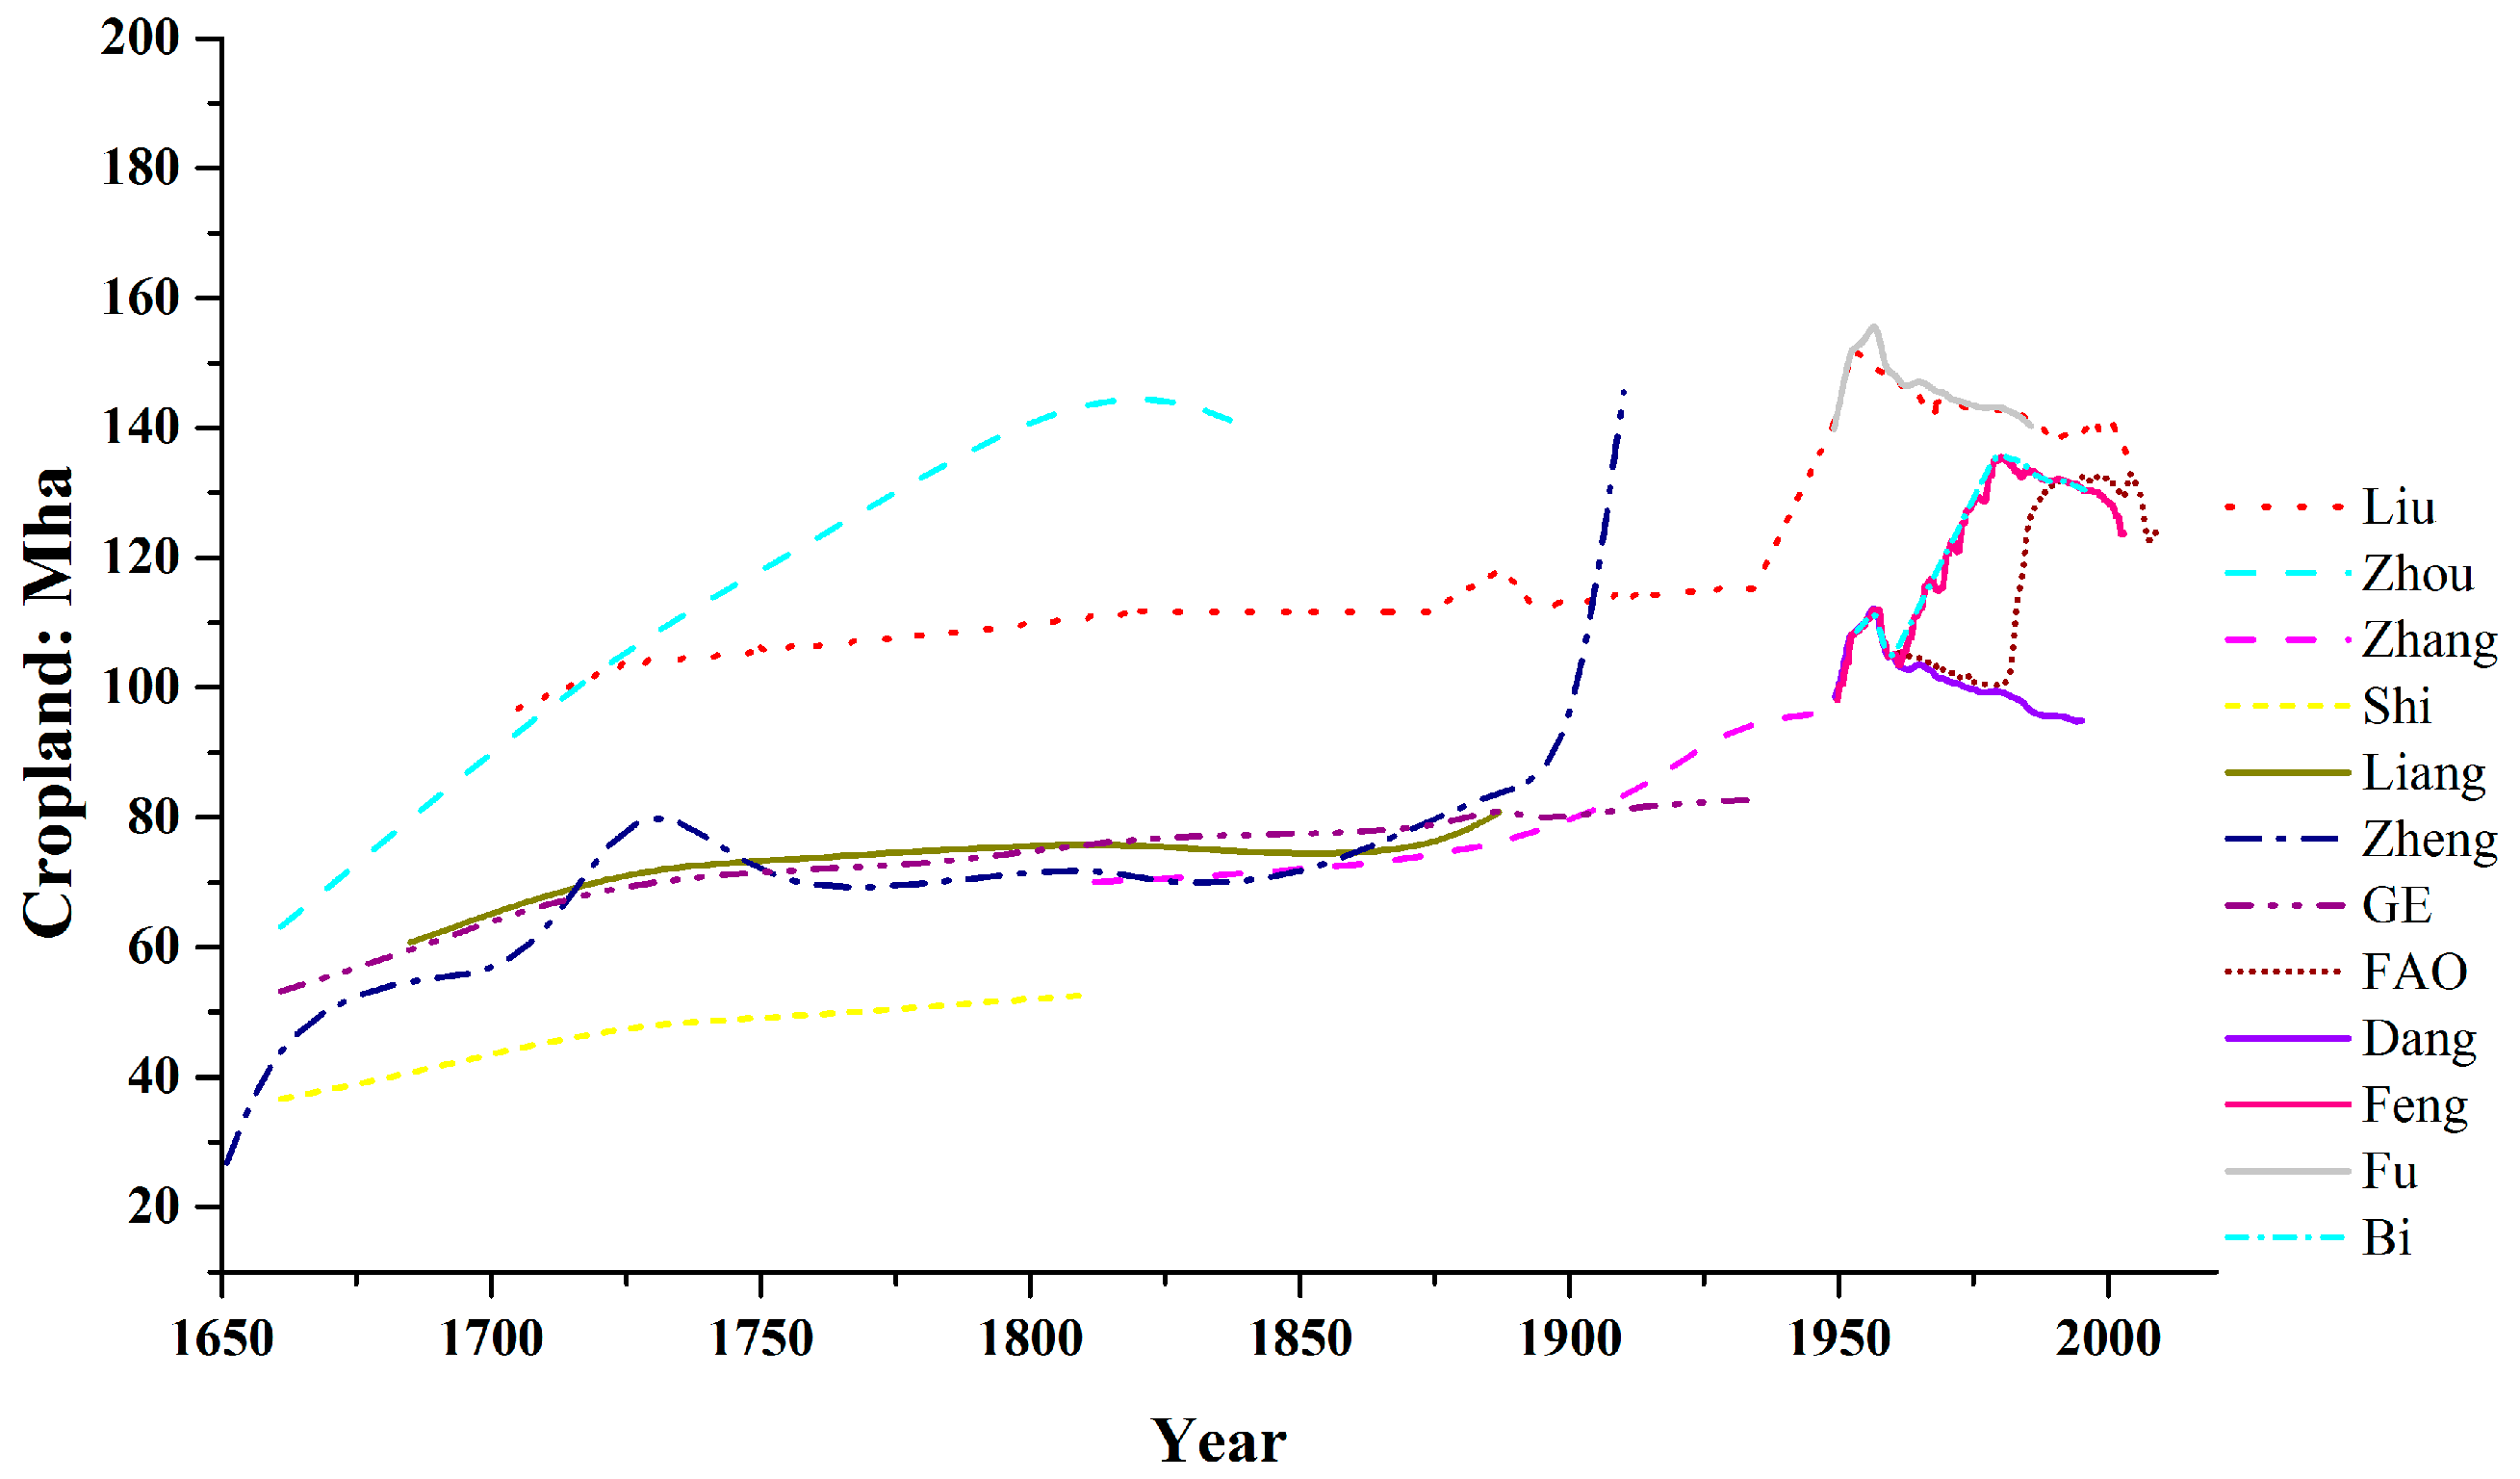
2.2. Cropland
2.3. Forest Coverage
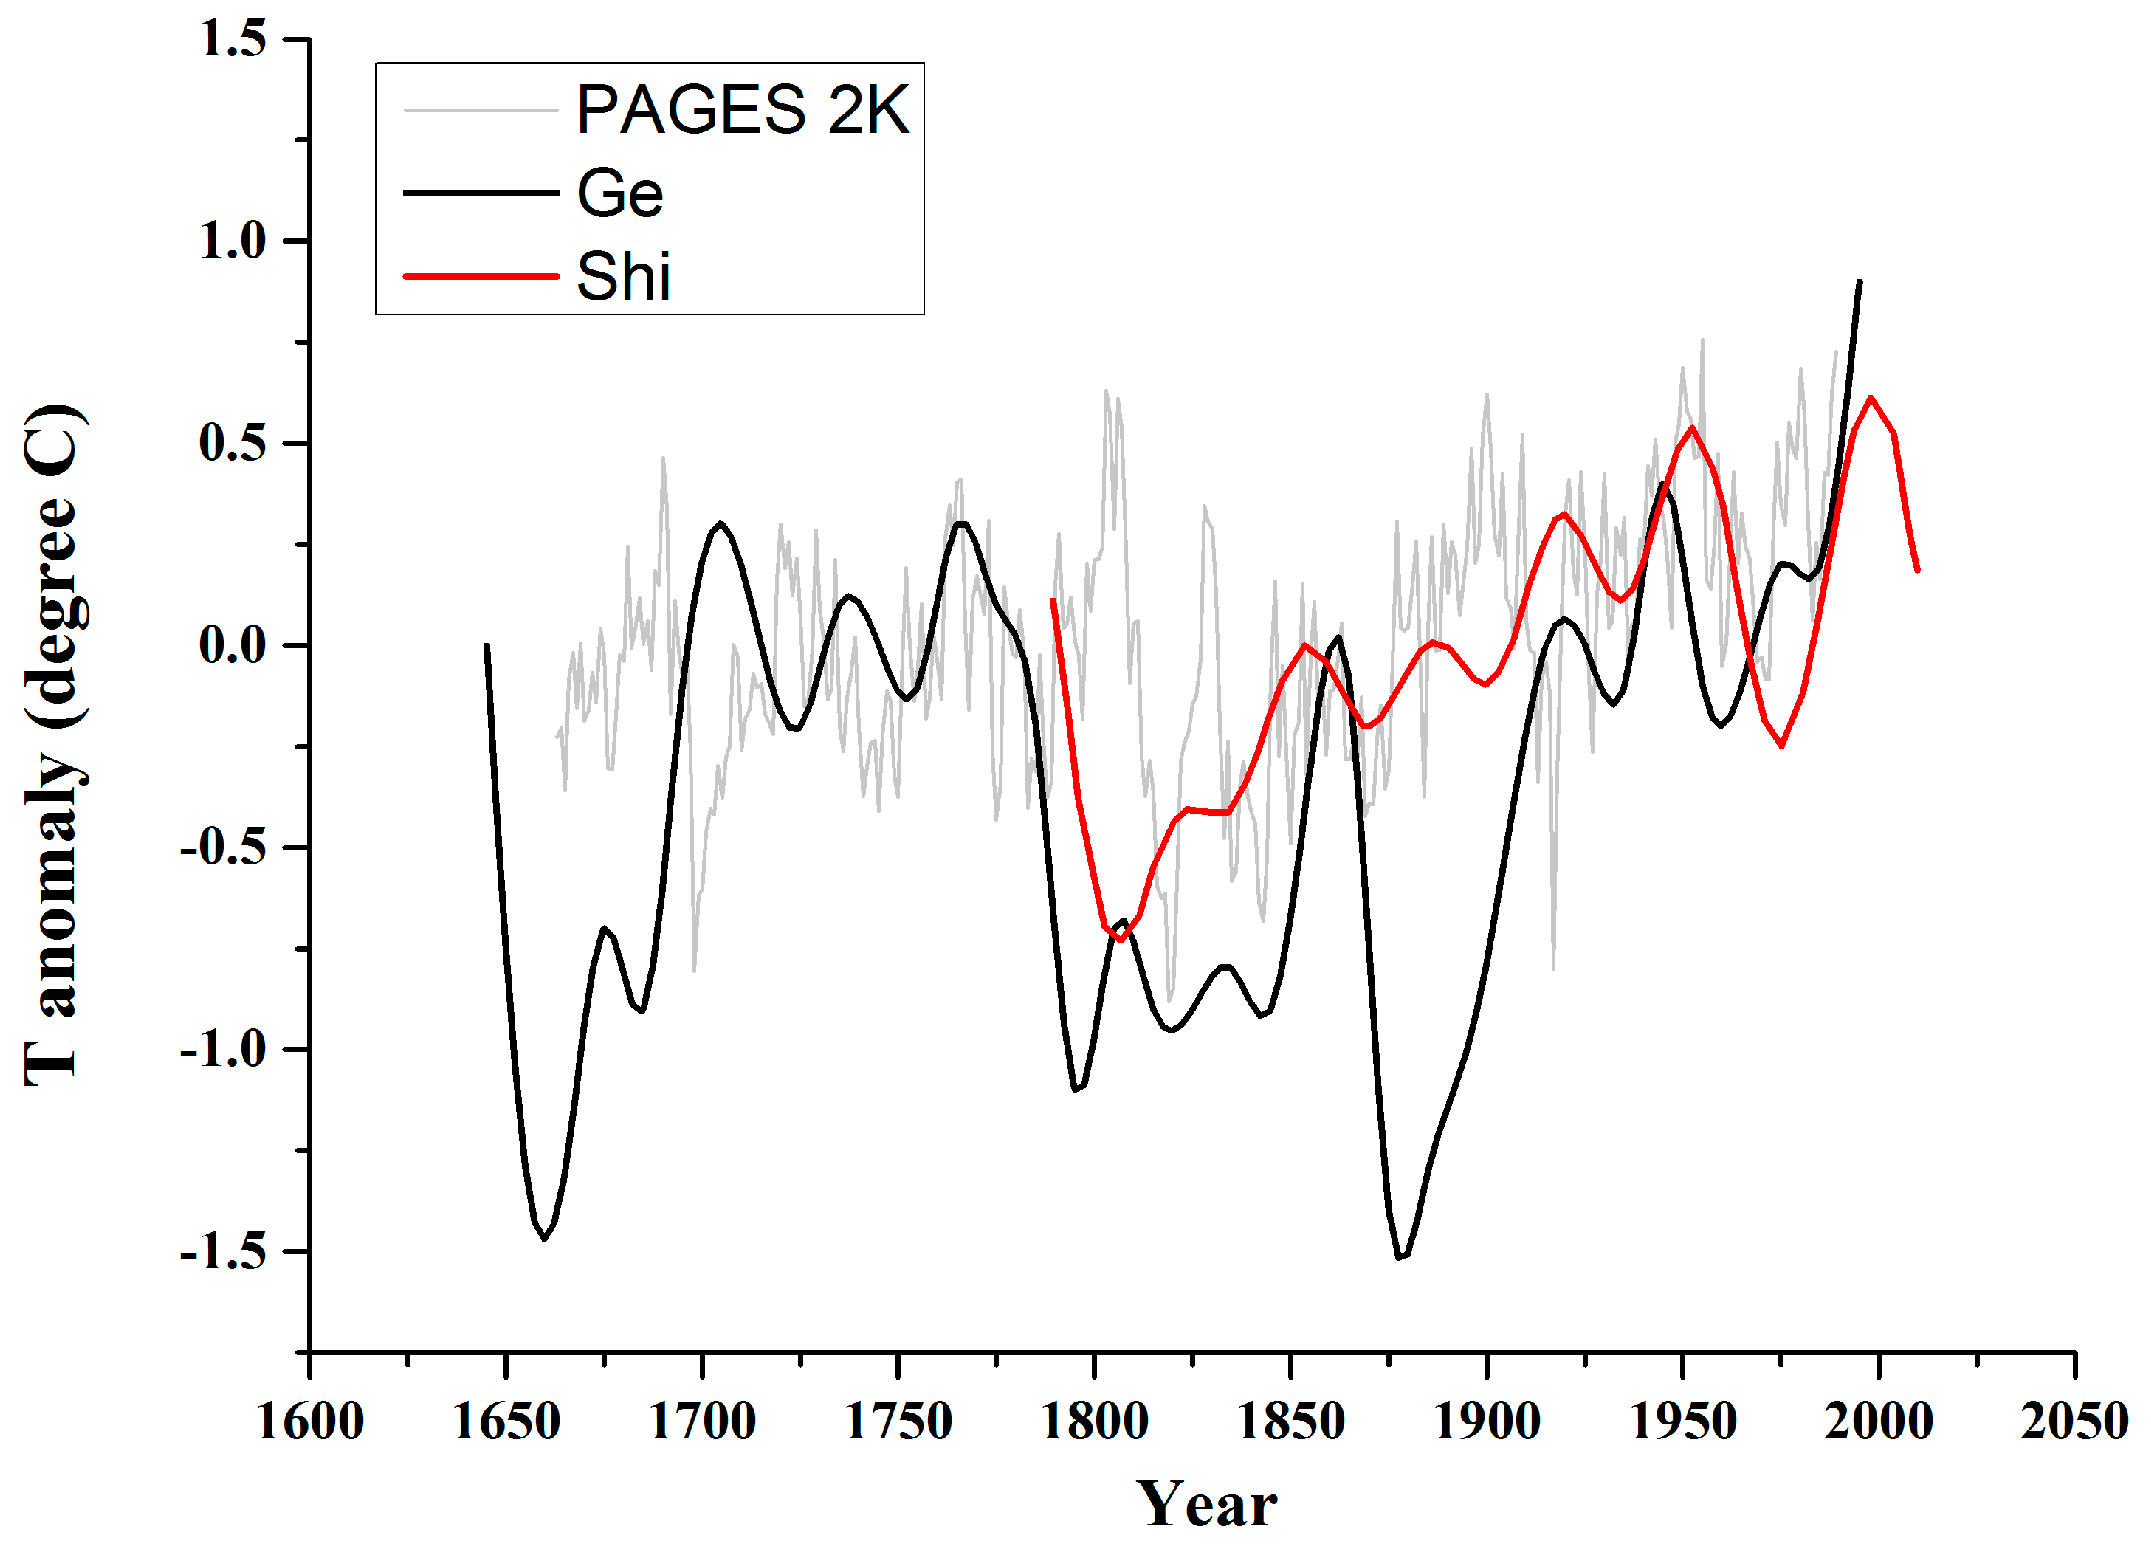
2.4. Climate Index
2.5. Agricultural Production Index
2.6. War Frequency
3. Results
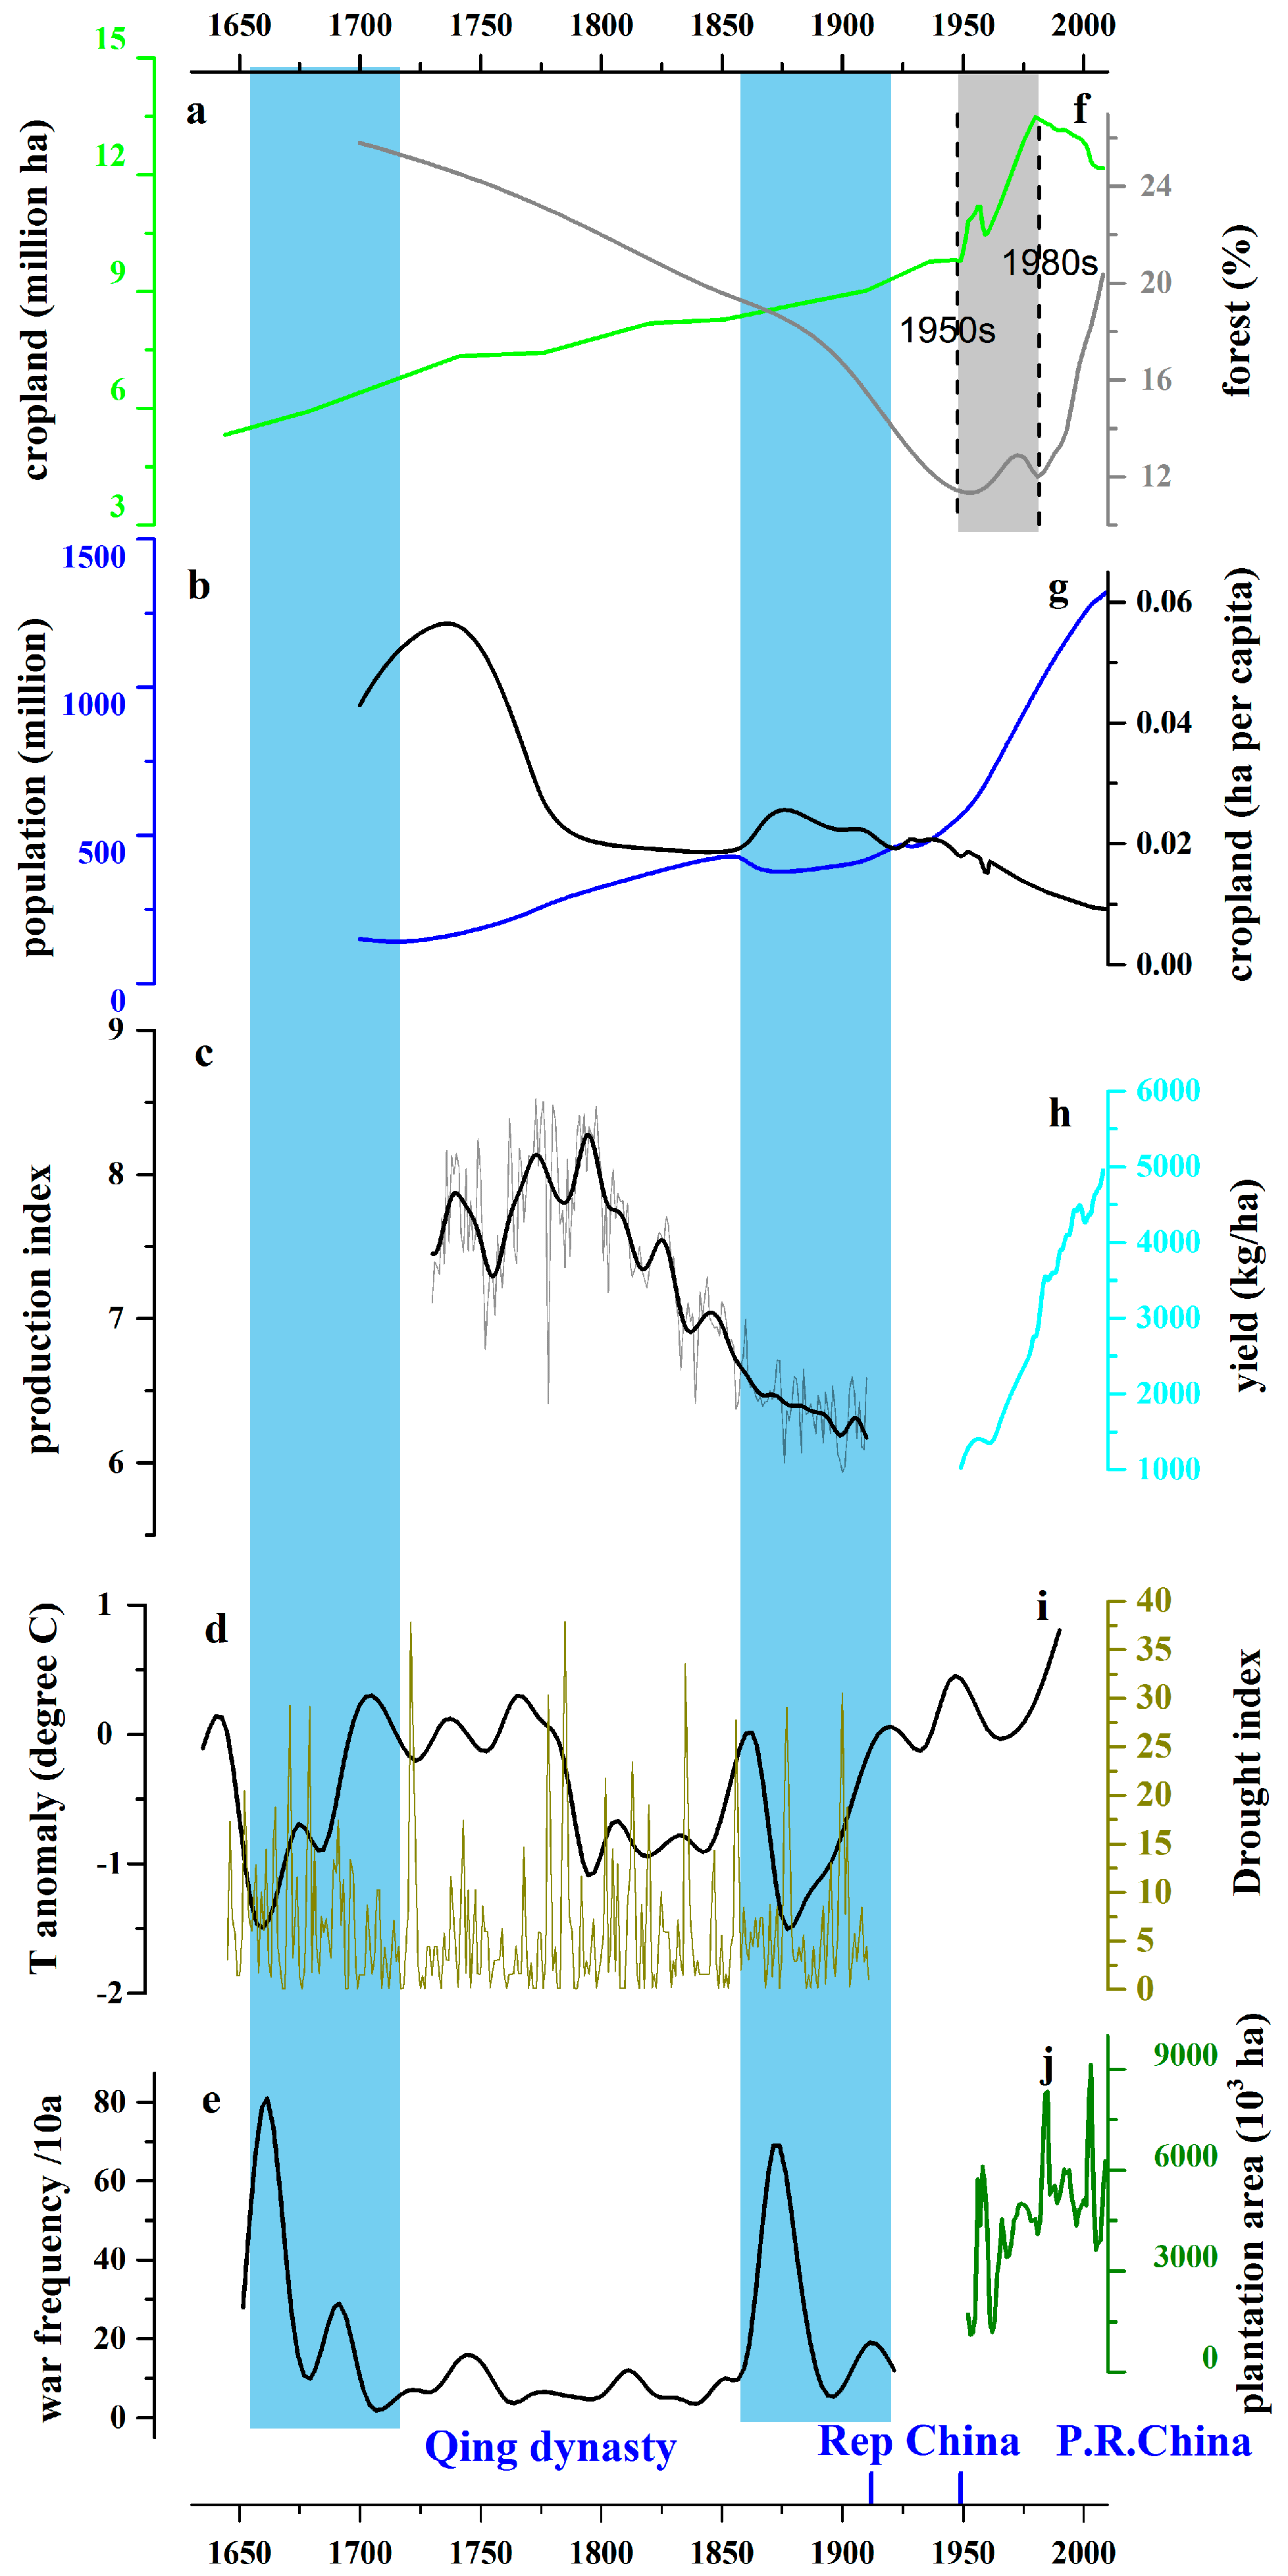
3.1. Historical LUC Patterns in China
3.2. Drivers of LUC
3.2.1. Population
3.2.2. Agricultural Technology and Intensification
3.2.3. Climate Change and Interactions among Driving Factors
3.2.4. National Policy
4. Discussion
4.1. Chinese Land-Use Transition
4.2. Dynamics of Land-Use Transition in China
4.3. Future Perspectives
5. Conclusions
Acknowledgments
Author Contributions
Conflicts of Interest
References
- Lambin, E.F.; Turner, B.L.; Geist, H.J.; Agbola, S.B.; Angelsen, A.; Bruce, J.W.; Coomes, O.T.; Dirzo, R.; Fischer, G.; Folke, C. The causes of land-use and land-cover change: Moving beyond the myths. Glob. Environ. Chang. 2001, 11, 261–269. [Google Scholar] [CrossRef]
- Turner, B.L.; Skole, D.; Sanderson, S.; Fischer, G.; Fresco, L.; Leemans, R. Land-Use and Land-Cover Change. Science/Research Plan; International Geosphere-Biosphere Programme: Stockholm, Sweden.
- Ellis, E.C.; Kaplan, J.O.; Fuller, D.Q.; Vavrus, S.; Goldewijk, K.K.; Verburg, P.H. Used planet: A global history. Proc. Natl. Acad. Sci. USA 2013, 110, 7978–7985. [Google Scholar] [CrossRef] [PubMed]
- Dearing, J.A.; Braimoh, A.K.; Reenberg, A.; Turner, B.L.; van der Leeuw, S. Complex land systems: The need for long time perspectives to assess their future. Ecol. Soc. 2010, 15, e167695. [Google Scholar]
- Miao, L.; Zhu, F.; He, B.; Ferrat, M.; Liu, Q.; Cao, X.; Cui, X. Synthesis of China’s land use in the past 300 years. Glob. Planet. Chang. 2013, 100, 224–233. [Google Scholar] [CrossRef]
- Klein Goldewijk, K.; Verburg, P.H. Uncertainties in global-scale reconstructions of historical land use: An illustration using the hyde data set. Landsc. Ecol. 2013, 28, 861–877. [Google Scholar] [CrossRef]
- Klein Goldewijk, K.; Beusen, A.; Van Drecht, G.; De Vos, M. The hyde 3.1 spatially explicit database of human-induced global land-use change over the past 12,000 years. Glob. Ecol. Biogeogr. 2011, 20, 73–86. [Google Scholar] [CrossRef]
- Ramankutty, N.; Foley, J.A. Estimating historical changes in global land cover: Croplands from 1700 to 1992. Glob. Biogeochem. Cycles 1999, 13, 997–1027. [Google Scholar] [CrossRef]
- Ciais, P.; Gervois, S.; Vuichard, N.; Piao, S.L.; Viovy, N. Effects of land use change and management on the european cropland carbon balance. Glob. Chang. Biol. 2011, 17, 320–338. [Google Scholar] [CrossRef]
- Zhu, F.; Cui, X.; Miao, L. China’s spatially-explicit historical land-use data and its reconstruction methodology. Prog. Geogr. 2012, 31, 1563–1573. [Google Scholar]
- Ge, Q.S.; Dai, J.H.; He, F.N.; Man, Z.M.; Zhao, Z. Cultivated land amount change and driving forces analysis of some provinces of China in past 300 years. Prog. Nat. Sci. 2003, 8, 825–832. [Google Scholar]
- Ge, Q.S.; Dai, J.H.; He, F.N. Land Use Changes and Terrestrial Carbon Budgets in China during the Last 300 Years; Science Press: Beijing, China, 2008. (In Chinese) [Google Scholar]
- Ye, Y.; Fang, X.; Ren, Y.; Zhang, X.; Chen, L. Cropland cover change in northeast China during the past 300 years. Sci. China Ser. D Earth Sci. 2009, 52, 1172–1182. [Google Scholar] [CrossRef]
- Qian, Y. The process of China’s market transition (1978–1998): The evolutionary, historical, and comparative perspectives. J. Inst. Theor. Econ. 2000, 156, 151–171. [Google Scholar]
- Pan, Q.; Jin, X.B.; Zhou, Y.K. Population change and spatiotemporal distribution of China in recent 300 years. Geogr. Res. 2013, 32, 1291–1302. [Google Scholar]
- Cao, S.J. History of Population in China, Qing Dynasty; Fudan Univerisity Press: Shanghai, China, 2001; Volume 5, pp. 1–971. (In Chinese) [Google Scholar]
- Zhang, Y.Y. Reestimation of modern chinese population and cultivated land. Res. Chin. Econ. Hist. 1991, 1, 20–30. (In Chinese) [Google Scholar]
- Hou, Y.F. History of Chinese Population (1910–1953); Fudan University Press: Shanghai, China, 2001. (In Chinese) [Google Scholar]
- Luo, Y. Reestimation of population in the qing dynasty. Econ. Sci. 1998, 6, 120–128. [Google Scholar]
- Zhang, Y. Re-recognition of the former population development in the qing dynasty. Jianghan Tribune 1999, 1, 65–69. (In Chinese) [Google Scholar]
- Jiang, T. Recent History of Chinese Population; Hangzhou University Press: Hangzhou, China, 1993. (In Chinese) [Google Scholar]
- Feng, Z.M.; Liu, B.Q.; Yang, Y.Z. A study of the changing trend of chinese cultivated land amount and data reconstructing: 1949–2003. J. Nat. Resour. 2005, 20, 35–43. (In Chinese) [Google Scholar]
- Liu, M.; Tian, H. China’s land cover and land use change from 1700 to 2005: Estimations from high-resolution satellite data and historical archives. Glob. Biogeochem. Cycles 2010, 24, 1–18. [Google Scholar] [CrossRef]
- Zhou, R. Comprehensive inspection and reestimate of the cultivated land in the early stage of the Qing dynasty. Jianghan Tribune 2001, 9, 57–61. (In Chinese) [Google Scholar]
- Shi, Z.H. Estimation of cultivated area and grain yield in the early stage of qing dynasty. Res. Chin. Econ. Hist. 1989, 2, 47–62. (In Chinese) [Google Scholar]
- Liang, F.Z. Statistical records of registered residence, land and land tax in chinese dynasties. Acad. Res. 1980, 2, 52–55. (In Chinese) [Google Scholar]
- Zheng, Z.; Ma, L.; Wang, X. Real cultivated area in qing dynasty. Jianghai Acad. J. 1998, 4, 129–135. (In Chinese) [Google Scholar]
- Dang, A.R.; Yan, S.Y. A study on the temporal variation of China’s farmland area and grain-crop sown area. Prog. Geogr. 1998, 17, 36–43. [Google Scholar]
- Fu, C.; Zheng, J. Investigation and revelation of quantity change of cultivated land resource in China since 1949. Sci. Technol. Manag. Land Resour. 2007, 6, 66–72. [Google Scholar]
- Bi, Y.Y.; Zheng, Z.Y. The actual changes of cultivated area since the fouding of new China. Resour. Sci. 2000, 22, 8–12. (In Chinese) [Google Scholar]
- He, F.; Ge, Q.; Dai, J.; Rao, Y. Forest change of China in recent 300 years. J. Geogr. Sci. 2008, 18, 59–72. [Google Scholar] [CrossRef]
- Fang, J.; Chen, A.; Peng, C.; Zhao, S.; Ci, L. Changes in forest biomass carbon storage in China between 1949 and 1998. Science 2001, 292, 2320–2322. [Google Scholar] [CrossRef] [PubMed]
- Lu, Y.H.; Fu, B.J.; Wei, W.; Yu, X.B.; Sun, R.H. Major ecosystems in China: Dynamics and challenges for sustainable management. Environ. Manag. 2011, 48, 13–27. [Google Scholar] [CrossRef] [PubMed]
- Piao, S.; Fang, J.; Ciais, P.; Peylin, P.; Huang, Y.; Sitch, S.; Wang, T. The carbon balance of terrestrial ecosystems in China. Nature 2009, 458, 1009–1013. [Google Scholar] [CrossRef] [PubMed]
- Cook, E.R.; Krusic, P.J.; Anchukaitis, K.J.; Buckley, B.M.; Nakatsuka, T.; Sano, M. Tree-ring reconstructed summer temperature anomalies for temperate east asia since 800 C.E. Clim. Dyn. 2012, 41, 2957–2972. [Google Scholar] [CrossRef]
- Ge, Q.; Zheng, J.; Fang, X.; Man, Z.; Zhang, X.; Zhang, P.; Wang, W. Winter half-year temperature reconstruction for the middle and lower reaches of the yellow river and yangtze river, China, during the past 2000 years. Holocene 2003, 13, 933–940. [Google Scholar]
- Shi, C.; Masson-Delmotte, V.; Daux, V.; Li, Z.; Carré, M.; Moore, J.C. Unprecedented recent warming rate and temperature variability over the east tibetan plateau inferred from alpine treeline dendrochronology. Clim. Dyn. 2015, 45, 1367–1380. [Google Scholar] [CrossRef]
- Gao, X.; Shi, Y.; Zhang, D.; Giorgi, F. Climate change in China in the 21st century as simulated by a high resolution regional climate model. Chin. Sci. Bull. 2012, 57, 1188–1195. [Google Scholar] [CrossRef]
- Ge, Q.S. Climate Change in China; Science Press: Beijing, China, 2011. (In Chinese) [Google Scholar]
- Cook, E.R.; Anchukaitis, K.J.; Buckley, B.M.; D’Arrigo, R.D.; Jacoby, G.C.; Wright, W.E. Asian monsoon failure and megadrought during the last millennium. Science 2010, 328, 486–489. [Google Scholar] [CrossRef] [PubMed]
- Ge, Q.S.; Wang, W.Q. Population pressure, climate change and taiping rebellion. Geogr. Res. 1995, 14, 32–41. [Google Scholar]
- Zhang, D.D.; Brecke, P.; Lee, H.F.; He, Y.-Q.; Zhang, J. Global climate change, war, and population decline in recent human history. Proc. Natl. Acad. Sci. USA 2007, 104, 19214–19219. [Google Scholar] [CrossRef] [PubMed]
- Zhang, D.D.; Zhang, J.; Lee, H.F.; He, Y.Q. Climate change and war frequency in eastern China over the last millennium. Hum. Ecol. 2007, 35, 403–414. [Google Scholar] [CrossRef]
- Zhang, Y. Deforestation and forest transition: Theory and evidence in China. In World Forests from Deforestation to Transition? Springer: Dordrecht, The Netherlands, 2000; pp. 41–65. [Google Scholar]
- Qian, Z.H.; Qu, F.T. Land expropriation system in China introspection and reform. China Land Sci. 2005, 18, 5–11. (In Chinese) [Google Scholar]
- Peng, X. Demographic consequences of the great leap forward in China’s provinces. Popul. Dev. Rev. 1987, 13, 639–670. [Google Scholar] [CrossRef]
- Andreas, J. Rise of the Red Engineers: The Cultural Revolution and the Origins of China’s New Class; Stanford University Press: Stanford, CA, USA, 2009. [Google Scholar]
- Jiang, A.L. Historical change of land management policy since the reform and opening up to the outside world. Acad. J. Zhongzhou 2003, 5, 48–53. (In Chinese) [Google Scholar]
- Cui, X.; Jin, X.; Zhou, Y.; He, B.; Miao, L.; Zhu, F.; Yang, X.; Lin, Y.; Han, J.; Wang, H. Land-use changes in China during the past 300 years. In Land-Use Changes in China: Historical Reconstruction over the Past 300 Years and Future Projection; World Scientific: Singapore, Singapore, 2015; pp. 1–10. [Google Scholar]
- Rindfuss, R.R.; Turner, B., II; Entwisle, B.; Walsh, S.J. Land cover/use and population. In Land Change Science; Springer: Amsterdam, The Netherlands, 2004; pp. 351–366. [Google Scholar]
- Boserup, E. The Conditions of Agricultural Growth: The Economics of Agriculture under Population Pressure; Faber: London, UK, 1965. [Google Scholar]
- Biggs, R.; Scholes, R.J. Land-cover changes in south africa 1911–1993: Research in action. S. Afr. J. Sci. 2002, 98, 420–424. [Google Scholar]
- Pongratz, J.; Reick, C.; Raddatz, T.; Claussen, M. A reconstruction of global agricultural areas and land cover for the last millennium. Glob. Biogeochem. Cycles 2008. [Google Scholar] [CrossRef]
- Tao, S.; Guoying, M. A Survey of Research on Grain Output Per Mu in the Early and Mid Qing Dynasty. Hist. Res. 2010, 2, 144–156. (In Chinese) [Google Scholar]
- He, B.L.; Ge, J.X. Population and Its Issues at the Begin of Qing Dynasty, 1368–1953; Sdx joint Publishing Company: Shanghai, China, 2000. (In Chinese) [Google Scholar]
- Zhu, G.H. Theory of man-land relationship. Popul. Econ. 1995, 1, 18–25. [Google Scholar]
- Yan, Z.D. Development of paddy in south China in qing dynasty. Agric. Hist. China 2003, 22, 10–14. (In Chinese) [Google Scholar]
- Huang, H.Y. Immigrants settlers and population studies of guangxi in the qing dynasty. Guangxi Soc. Sci. 2006, 3, 115–119. (In Chinese) [Google Scholar]
- Zhao, C.L. The Research on Land Cultivation in East Inner Mongolia form the End of the Qing Dynasty to the Period of the Republic of China; Inner Mongolia University: Huhhot, China, 2012. (In Chinese) [Google Scholar]
- Perkins, D.H. Agricultural Development in China, 1368–1968; AldineTransaction: Chicago, IL, USA, 2013. [Google Scholar]
- Godfray, H.C.J.; Beddington, J.R.; Crute, I.R.; Haddad, L.; Lawrence, D.; Muir, J.F.; Pretty, J.; Robinson, S.; Thomas, S.M.; Toulmin, C. Food security: The challenge of feeding 9 billion people. Science 2010, 327, 812–818. [Google Scholar] [CrossRef] [PubMed]
- Sun, H.L.; Liu, Y.X. Food safety concerns under the ninth increase of the food production. China Grain Econ. 2013, 3, 19–21. (In Chinese) [Google Scholar]
- Lee, H.F.; Zhang, D.D. A tale of two population crises in recent chinese history. Clim. Chang. 2013, 116, 285–308. [Google Scholar] [CrossRef]
- Zhang, D.D.; Lee, H.F.; Wang, C.; Li, B.; Pei, Q.; Zhang, J.; An, Y. The causality analysis of climate change and large-scale human crisis. Proc. Natl. Acad. Sci. USA 2011, 108, 17296–17301. [Google Scholar] [CrossRef] [PubMed]
- He, S. Chorography in qing dynasty. In Si Ku Quan Shu; Taiwan Commercial Press: Taibei, Taiwan, 1986. (In Chinese) [Google Scholar]
- Zhao, E.X. Draft History of Qing; Literature Research Society: Beijing, China, 1977. [Google Scholar]
- Shi, W.; Tao, F.; Liu, J.; Xu, X.; Kuang, W.; Dong, J.; Shi, X. Has climate change driven spatio-temporal changes of cropland in northern China since the 1970s? Clim. Chang. 2014, 124, 163–177. [Google Scholar] [CrossRef]
- Xu, C. The fundamental institutions of China’s reforms and development. J. Econ. Lit. 2011, 49, 1076–1151. [Google Scholar] [CrossRef] [Green Version]
- Tang, W. Urban land development under socialism: China between 1949 and 1977. Int. J. Urban Reg. Res. 1994, 18, 392–415. [Google Scholar] [CrossRef]
- Li, G.; Rozelle, S.; Brandt, L. Tenure, land rights, and farmer investment incentives in China. Agric. Econ. 1998, 19, 63–71. [Google Scholar] [CrossRef]
- Ding, C. Land policy reform in China: Assessment and prospects. Land Use Policy 2003, 20, 109–120. [Google Scholar] [CrossRef]
- Dean, R.; Damm-Luhr, T. A Current review of chinese land-use law and policy: A breakthrough in rural reform. Pac. Rim Law Policy J. 2010, 19, 121–159. [Google Scholar]
- Oi, J.C. Communism and clientelism: Rural politics in China. World Polit. 1985, 37, 238–266. [Google Scholar] [CrossRef]
- Edmonds, R.L. The environment in the people’s republic of China 50 years on. China Q. 1999, 159, 640–649. [Google Scholar] [CrossRef] [PubMed]
- Ho, P. Mao’s war against nature? The environmental impact of the grain-first campaign in China. China J. 2003. [Google Scholar] [CrossRef]
- Frayer, J.; Müller, D.; Sun, Z.; Munroe, D.K.; Xu, J. Processes underlying 50 years of local forest-cover change in Yunnan, China. Forests 2014, 5, 3257–3273. [Google Scholar] [CrossRef]
- Lin, J.Y. Rural reforms and agricultural growth in China. Am. Econ. Rev. 1992, 82, 34–51. [Google Scholar]
- Fan, S. Effects of technological change and institutional reform on production growth in Chinese agriculture. Am. J. Agric. Econ. 1991, 73, 266–275. [Google Scholar] [CrossRef]
- Yin, R.; Yin, G.; Li, L. Assessing China’s ecological restoration programs: What’s been done and what remains to be done? Environ. Manag. 2010, 45, 442–453. [Google Scholar] [CrossRef] [PubMed]
- Long, H. Land use policy in China: Introduction. Land Use Policy 2014, 40, 1–5. [Google Scholar] [CrossRef]
- Chen, J. Rapid urbanization in China: A real challenge to soil protection and food security. Catena 2007, 69, 1–15. [Google Scholar] [CrossRef]
- Liu, J.; Liu, M.; Tian, H.; Zhuang, D.; Zhang, Z.; Zhang, W.; Tang, X.; Deng, X. Spatial and temporal patterns of China’s cropland during 1990–2000: An analysis based on landsat TM data. Remote Sens. Environ. 2005, 98, 442–456. [Google Scholar] [CrossRef]
- Rudel, T.K.; Coomes, O.T.; Moran, E.; Achard, F.; Angelsen, A.; Xu, J.; Lambin, E. Forest transitions: Towards a global understanding of land use change. Glob. Environ. Chang. 2005, 15, 23–31. [Google Scholar] [CrossRef]
- Liu, J.; Li, S.; Ouyang, Z.; Tam, C.; Chen, X. Ecological and socioeconomic effects of China’s policies for ecosystem services. Proc. Natl. Acad. Sci. USA 2008, 105, 9477–9482. [Google Scholar] [CrossRef] [PubMed]
- Yin, R.; Yin, G. China’s primary programs of terrestrial ecosystem restoration: Initiation, implementation, and challenges. Environ. Manag. 2010, 45, 429–441. [Google Scholar] [CrossRef] [PubMed]
- Kates, R.W.; Parris, T.M. Long-term trends and a sustainability transition. Proc. Natl. Acad. Sci. USA 2003, 100, 8062–8067. [Google Scholar] [CrossRef] [PubMed]
- Zhang, Y.; Liang, S. Changes in forest biomass and linkage to climate and forest disturbances over northeastern China. Glob. Chang. Biol. 2014. [Google Scholar] [CrossRef] [PubMed]
- Tan, S. Analysis on causes of frequent land expropriation conflicts in China. China Land Sci. 2008, 22, 44–50. (In Chinese) [Google Scholar]
- Sun, Y. The social transition period rural land conflict reasons explore. Econ. Probl. 2007, 7, 92–95. [Google Scholar]
- Ning, Y. New process of urbanization-dynamics and features of urbanization in China since 1990. Acta Geogr. Sin. 1998, 53, 470–477. (In Chinese) [Google Scholar]
- Turner, B.; Fischer-Kowalski, M. Ester boserup: An interdisciplinary visionary relevant for sustainability. Proc. Natl. Acad. Sci. USA 2010, 107, 21963–21965. [Google Scholar] [CrossRef] [PubMed]
- Matson, P.A.; Parton, W.J.; Power, A.; Swift, M. Agricultural intensification and ecosystem properties. Science 1997, 277, 504–509. [Google Scholar] [CrossRef] [PubMed]
- Burney, J.A.; Davis, S.J.; Lobell, D.B. Greenhouse gas mitigation by agricultural intensification. Proc. Natl. Acad. Sci. USA 2010, 107, 12052–12057. [Google Scholar] [CrossRef] [PubMed]
- Stevenson, J.R.; Villoria, N.; Byerlee, D.; Kelley, T.; Maredia, M. Green revolution research saved an estimated 18 to 27 million hectares from being brought into agricultural production. Proc. Natl. Acad. Sci. USA 2013, 110, 8363–8368. [Google Scholar] [CrossRef] [PubMed]
- Tilman, D.; Balzer, C.; Hill, J.; Befort, B.L. Global food demand and the sustainable intensification of agriculture. Proc. Natl. Acad. Sci. USA 2011, 108, 20260–20264. [Google Scholar] [CrossRef] [PubMed]
- Alcott, B. Jevons’ paradox. Ecol. Econ. 2005, 54, 9–21. [Google Scholar] [CrossRef]
- Gibbs, H.; Ruesch, A.; Achard, F.; Clayton, M.; Holmgren, P.; Ramankutty, N.; Foley, J. Tropical forests were the primary sources of new agricultural land in the 1980s and 1990s. Proc. Natl. Acad. Sci. USA 2010, 107, 16732–16737. [Google Scholar] [CrossRef] [PubMed]
- Rudel, T.K.; Schneider, L.; Uriarte, M.; Turner, B.; DeFries, R.; Lawrence, D.; Geoghegan, J.; Hecht, S.; Ickowitz, A.; Lambin, E.F. Agricultural intensification and changes in cultivated areas, 1970–2005. Proc. Natl. Acad. Sci. USA 2009, 106, 20675–20680. [Google Scholar] [CrossRef] [PubMed]
- Chen, G.Q.; He, Y.H.; Qiang, S. Increasing seriousness of plant invasions in croplands of eastern China in relation to changing farming practices: A case study. PLoS ONE 2013, 8, e74136. [Google Scholar] [CrossRef] [PubMed]
- Jones, B.A.; Grace, D.; Kock, R.; Alonso, S.; Rushton, J.; Said, M.Y.; McKeever, D.; Mutua, F.; Young, J.; McDermott, J. Zoonosis emergence linked to agricultural intensification and environmental change. Proc. Natl. Acad. Sci. USA 2013, 110, 8399–8404. [Google Scholar] [CrossRef] [PubMed]
- Donald, P.; Green, R.; Heath, M. Agricultural intensification and the collapse of europe’s farmland bird populations. Proc. R. Soc. Lond. Ser. B Biol. Sci. 2001, 268, 25–29. [Google Scholar] [CrossRef] [PubMed]
- Birch-Thomsen, T.; Reenberg, A.; Mertz, O.; Fog, B. Continuity and change: Spatiotemporal land use dynamics on bellona island, solomon islands. Singap. J. Trop. Geogr. 2010, 31, 27–40. [Google Scholar] [CrossRef]
- Brown, L.R. Who Will Feed China; World Watch Institute: Washington, DC, USA, 1995. [Google Scholar]
- Ma, J.; Zhang, H.Q.; Li, H.X. Impacts of international grain trade on utilization of water and cultivated land. Resour. Sci. 2008, 30, 1723–1728. [Google Scholar]
- Wang, D.W.; Liu, Y.S.; Lu, Y.X. Agricultural structure adjustment and its effect on China’s food safety––Case study of the main food supply regions. China Popul. Resour. Environ. 2005, 15, 65–68. [Google Scholar]
- Cui, S.; Kattumuri, R. Cultivated land conversion in China and the potential for food security and sustainability. Asia Res. Centre Work. Pap. 2010, 35, 1–33. [Google Scholar]
- Kong, X. China Must Protect High-Quality Arable Land. Available online: http://www.nature.com/news/china-must-protect-high-quality-arable-land-1.14646 (accessed on 5 Februdry 2014).
- Mayer, A.L.; Kauppi, P.E.; Angelstam, P.K.; Zhang, Y.; Tikka, P.M. Importing timber, exporting ecological impact. Science 2005, 308, 359–360. [Google Scholar] [CrossRef] [PubMed]
- Gerland, P.; Raftery, A.E.; Ševčíková, H.; Li, N.; Gu, D.; Spoorenberg, T.; Alkema, L.; Fosdick, B.K.; Chunn, J.; Lalic, N.; et al. World population stabilization unlikely this century. Science 2014, 346, 234–237. [Google Scholar] [CrossRef] [PubMed]
- Cordell, D.; Drangert, J.-O.; White, S. The story of phosphorus: Global food security and food for thought. Glob. Environ. Chang. 2009, 19, 292–305. [Google Scholar] [CrossRef]


© 2016 by the authors; licensee MDPI, Basel, Switzerland. This article is an open access article distributed under the terms and conditions of the Creative Commons Attribution (CC-BY) license (http://creativecommons.org/licenses/by/4.0/).
Share and Cite
Miao, L.; Zhu, F.; Sun, Z.; Moore, J.C.; Cui, X. China’s Land-Use Changes during the Past 300 Years: A Historical Perspective. Int. J. Environ. Res. Public Health 2016, 13, 847. https://doi.org/10.3390/ijerph13090847
Miao L, Zhu F, Sun Z, Moore JC, Cui X. China’s Land-Use Changes during the Past 300 Years: A Historical Perspective. International Journal of Environmental Research and Public Health. 2016; 13(9):847. https://doi.org/10.3390/ijerph13090847
Chicago/Turabian StyleMiao, Lijuan, Feng Zhu, Zhanli Sun, John C. Moore, and Xuefeng Cui. 2016. "China’s Land-Use Changes during the Past 300 Years: A Historical Perspective" International Journal of Environmental Research and Public Health 13, no. 9: 847. https://doi.org/10.3390/ijerph13090847