Arsenic Removal from Groundwater by Solar Driven Inline-Electrolytic Induced Co-Precipitation and Filtration—A Long Term Field Test Conducted in West Bengal

 , ,
, ,
Abstract
:
1. Introduction
1.1. Origin of Arsenic in Drinking Water
1.2. Total Number of People Affected
1.3. Arsenic Removal Plant (ARP) and Operational Challenges
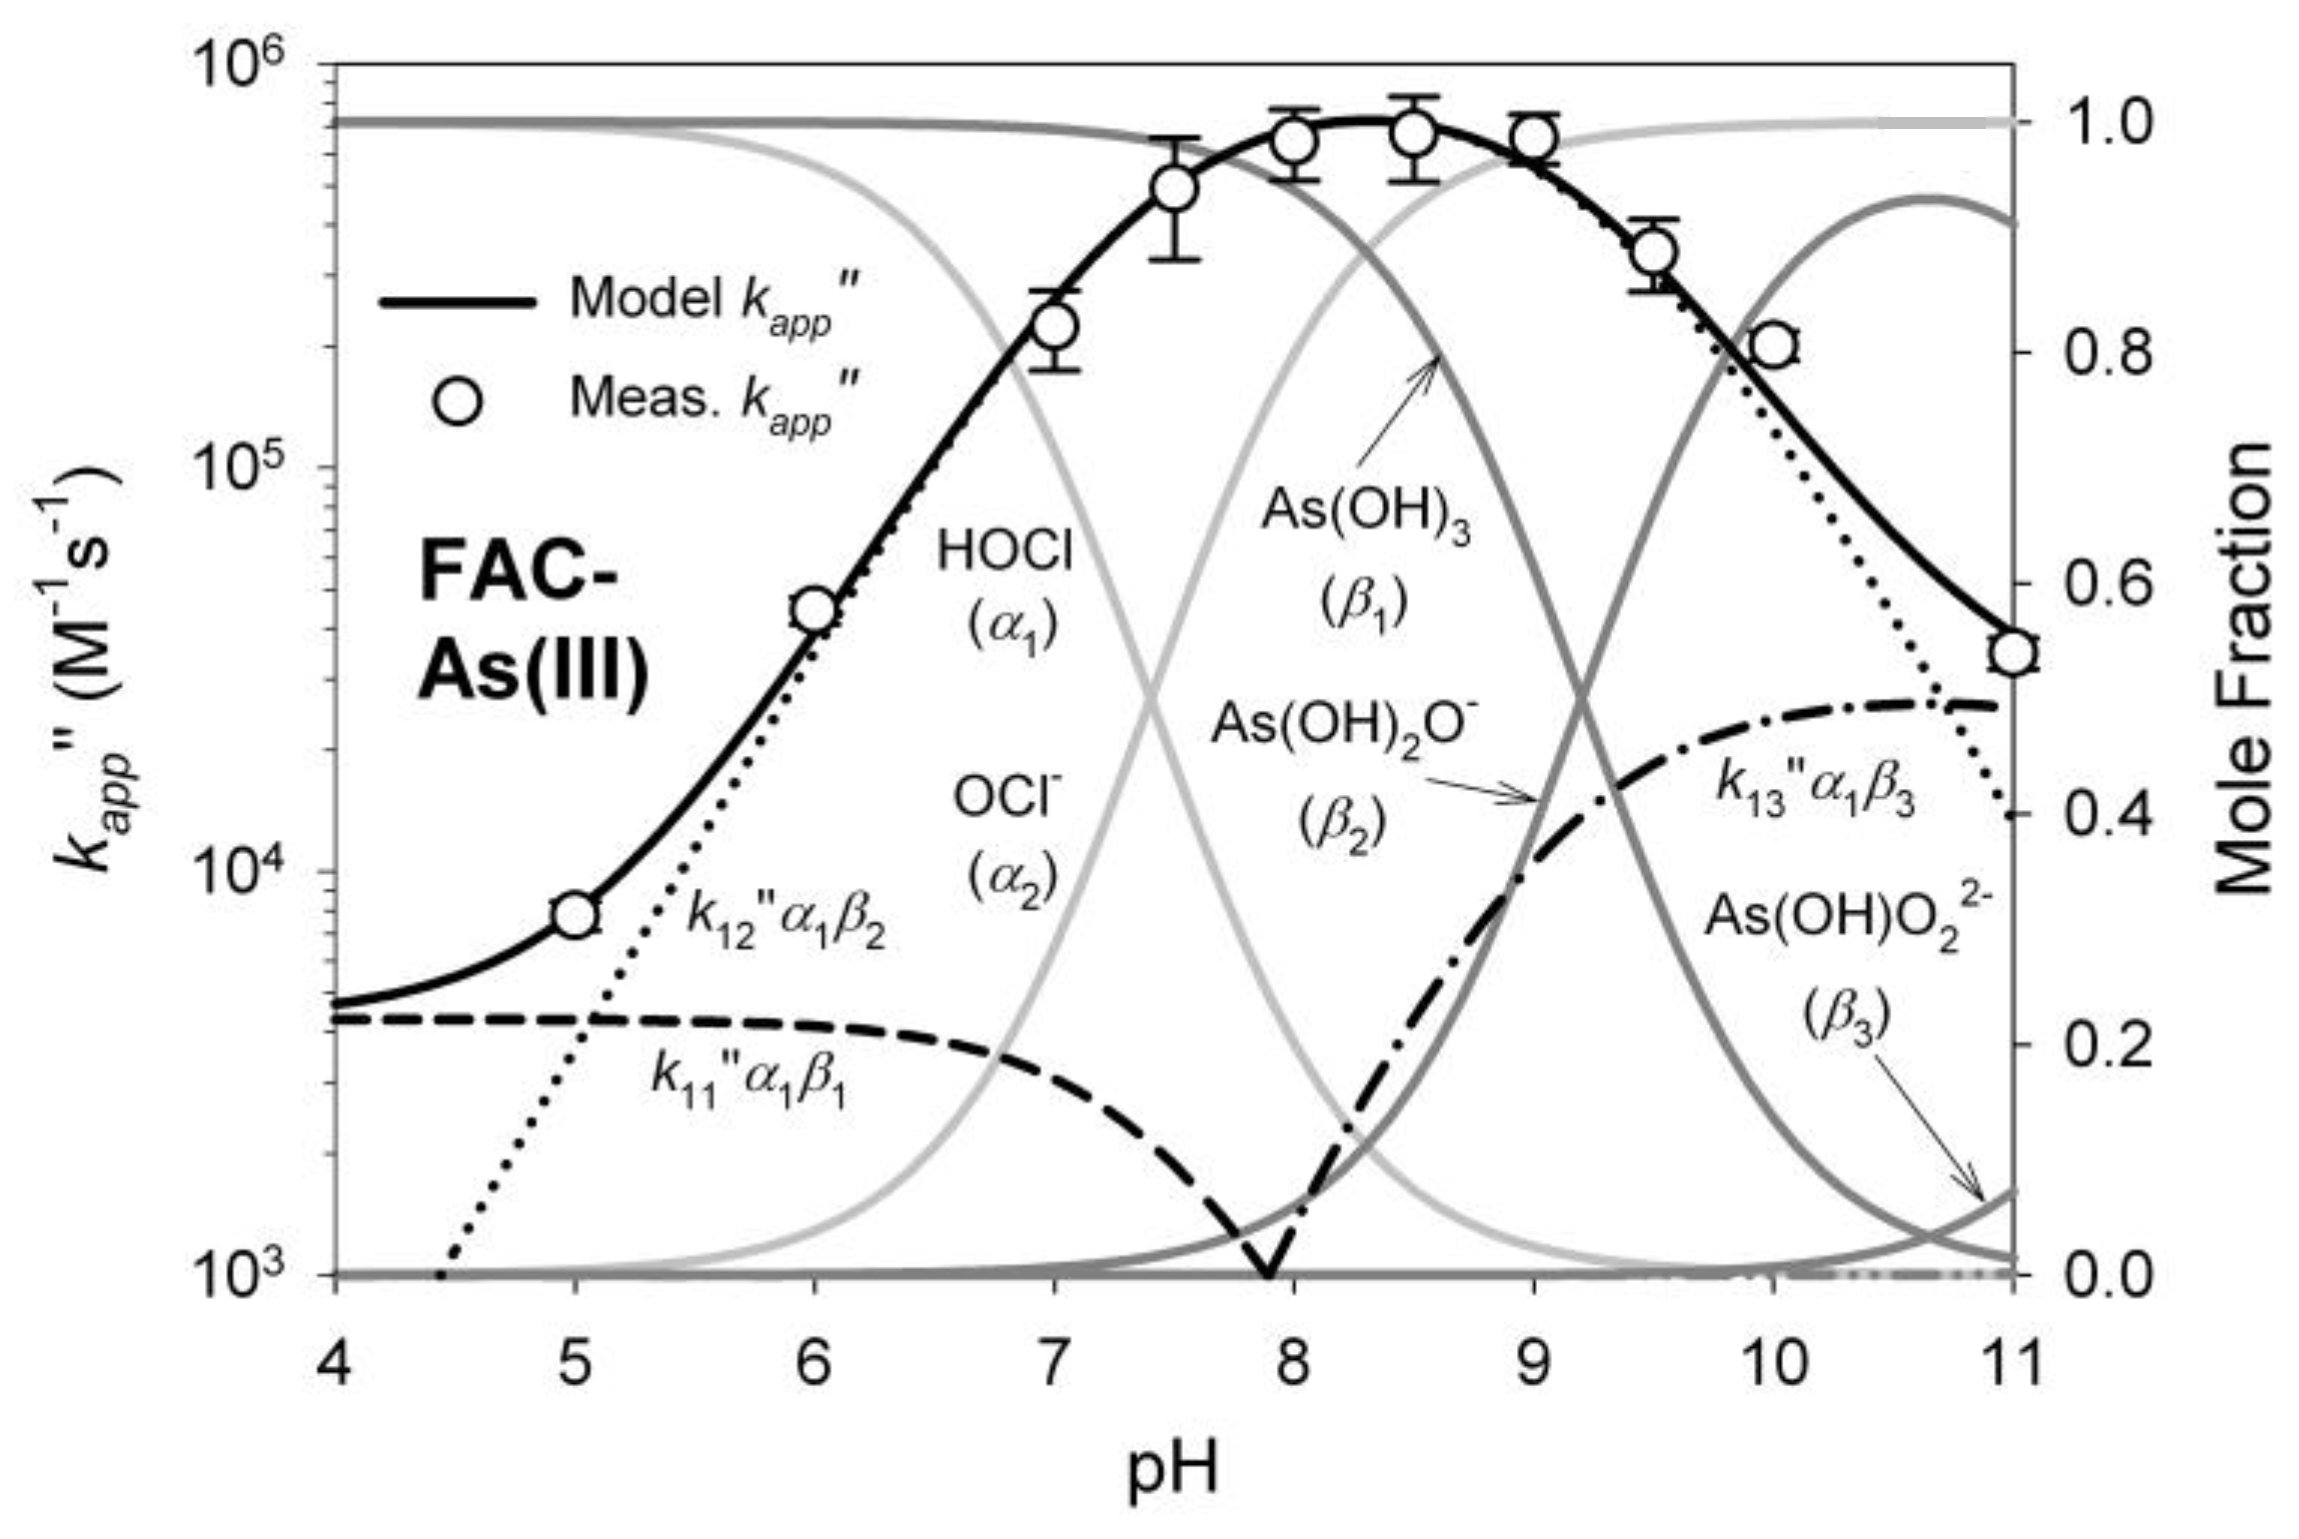
1.4. Oxidation of Arsenic
1.5. Co-Precipitation with Iron Hydroxide and Ions Competing with Adsoption Sites
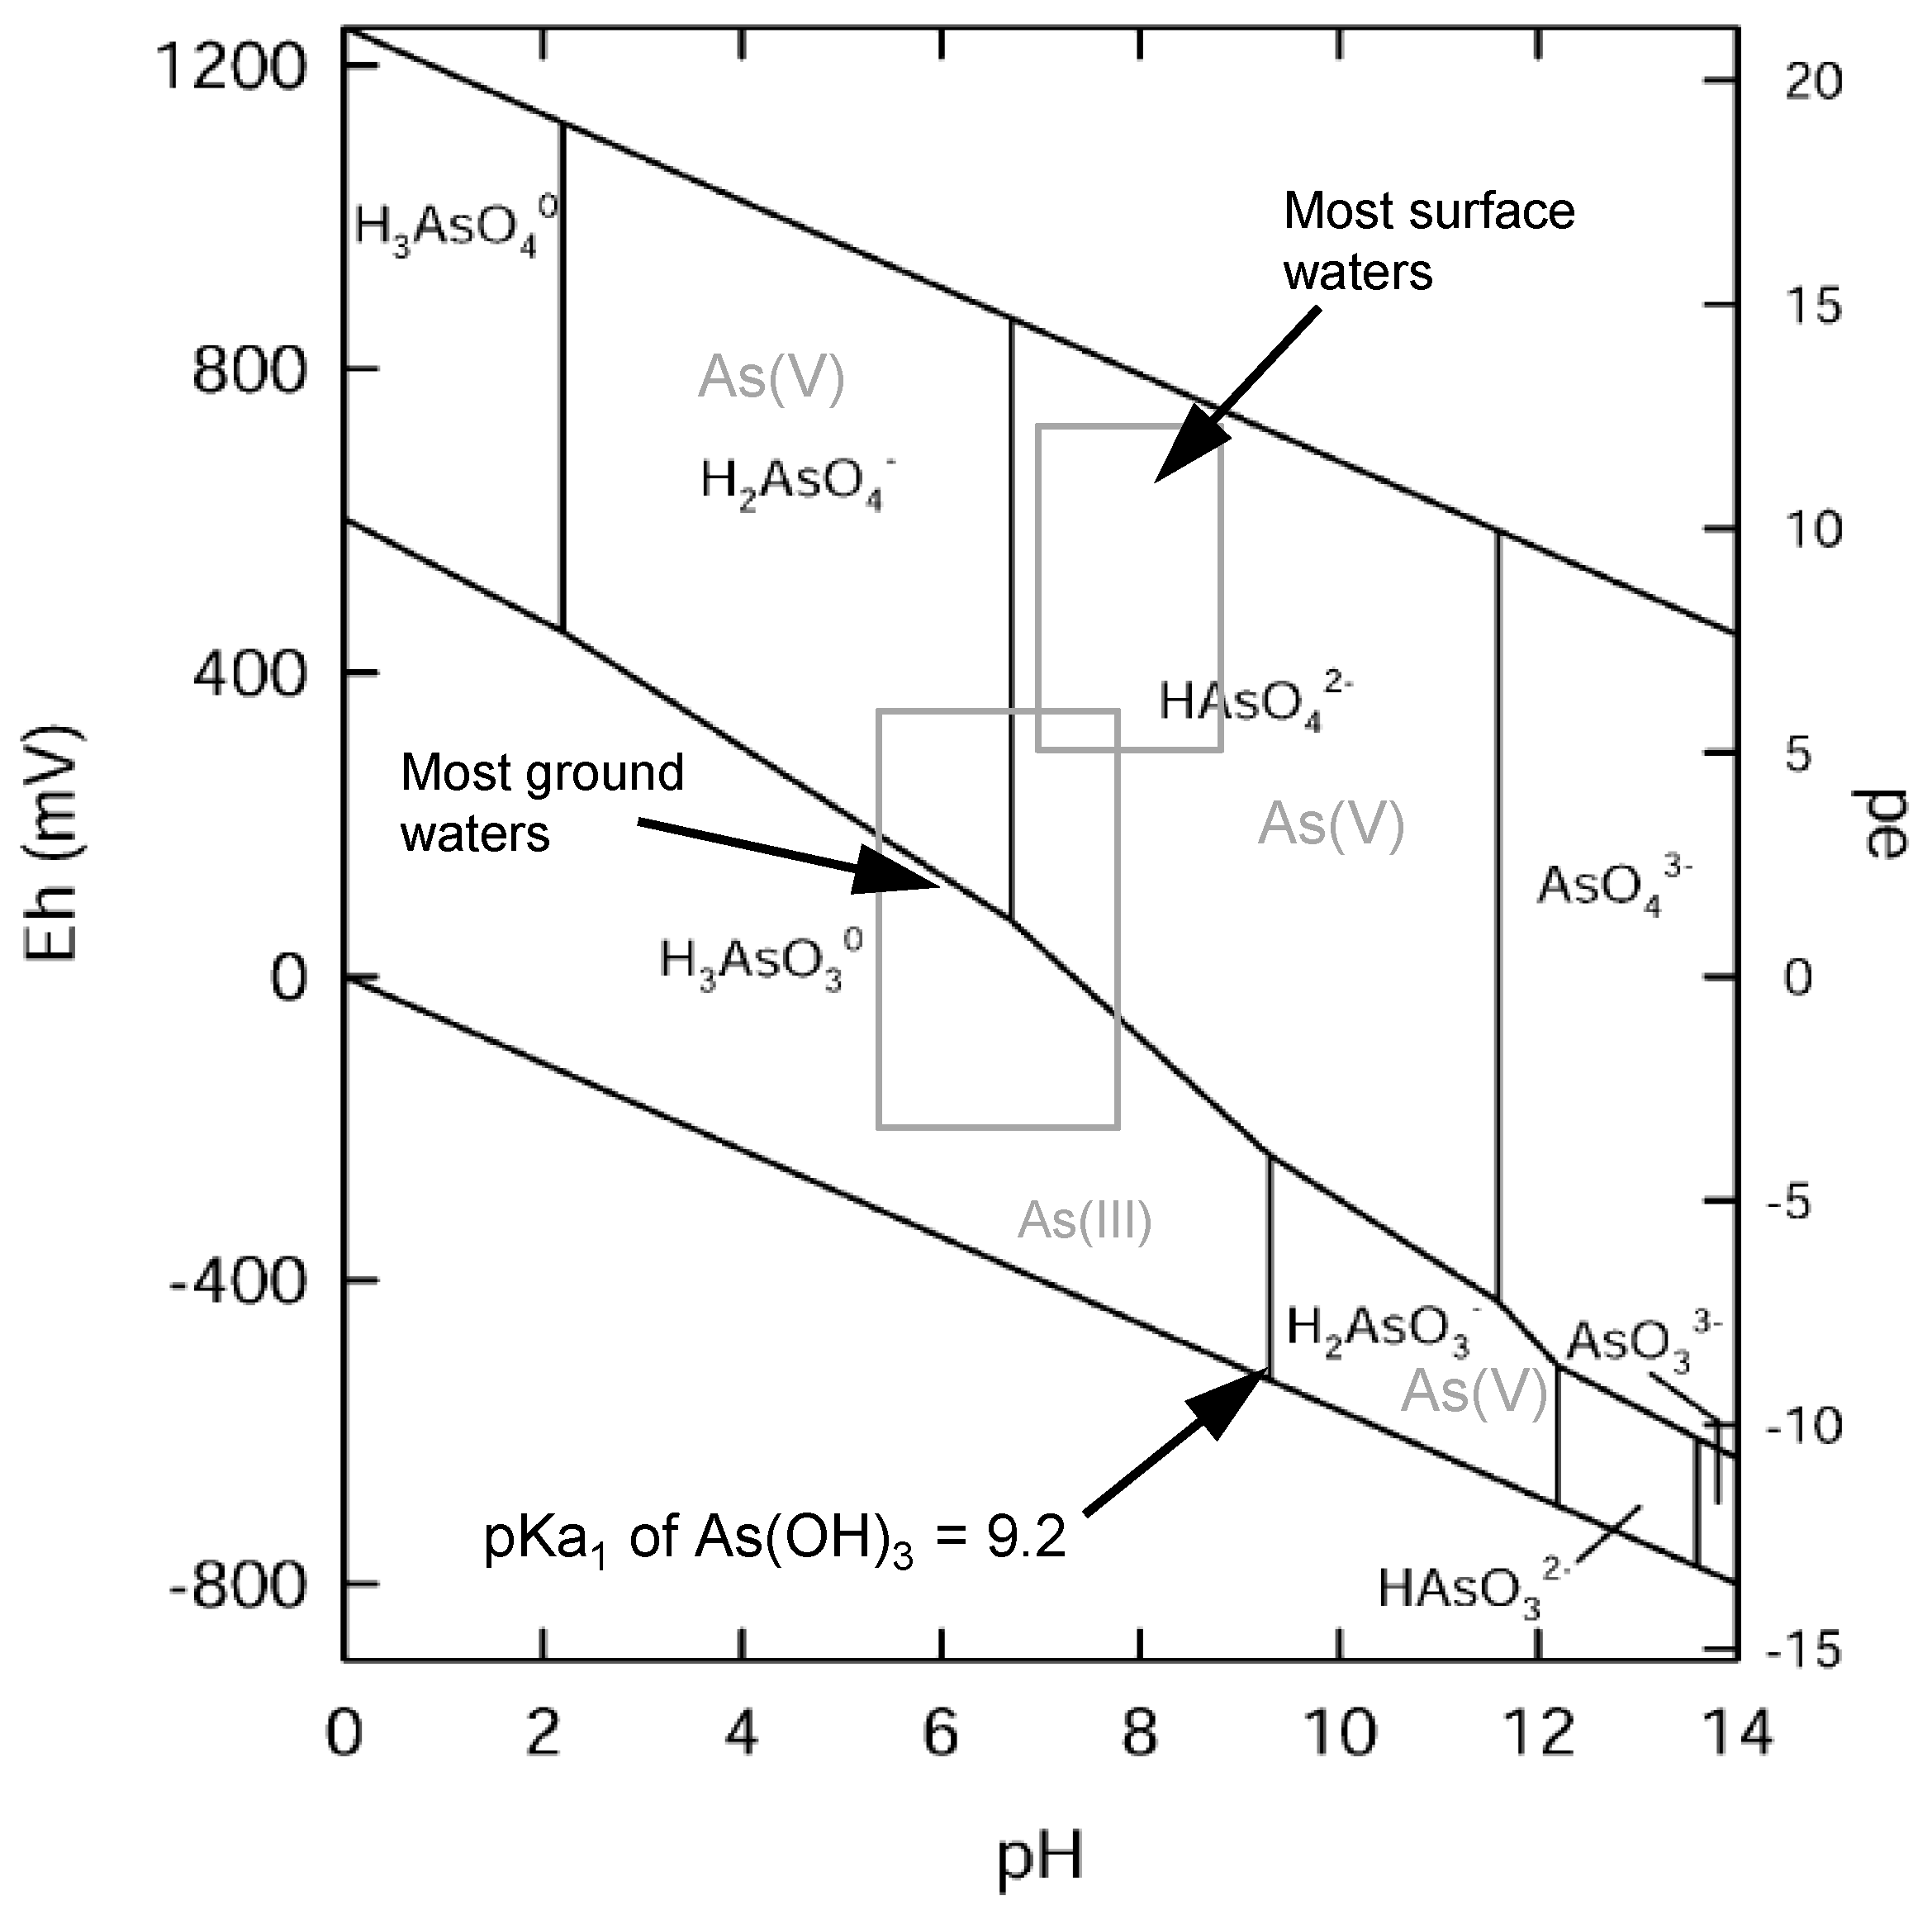
1.6. pH Dependency
1.7. Self-Sufficient Treatment Approach for Autonomous Arsenic Removal
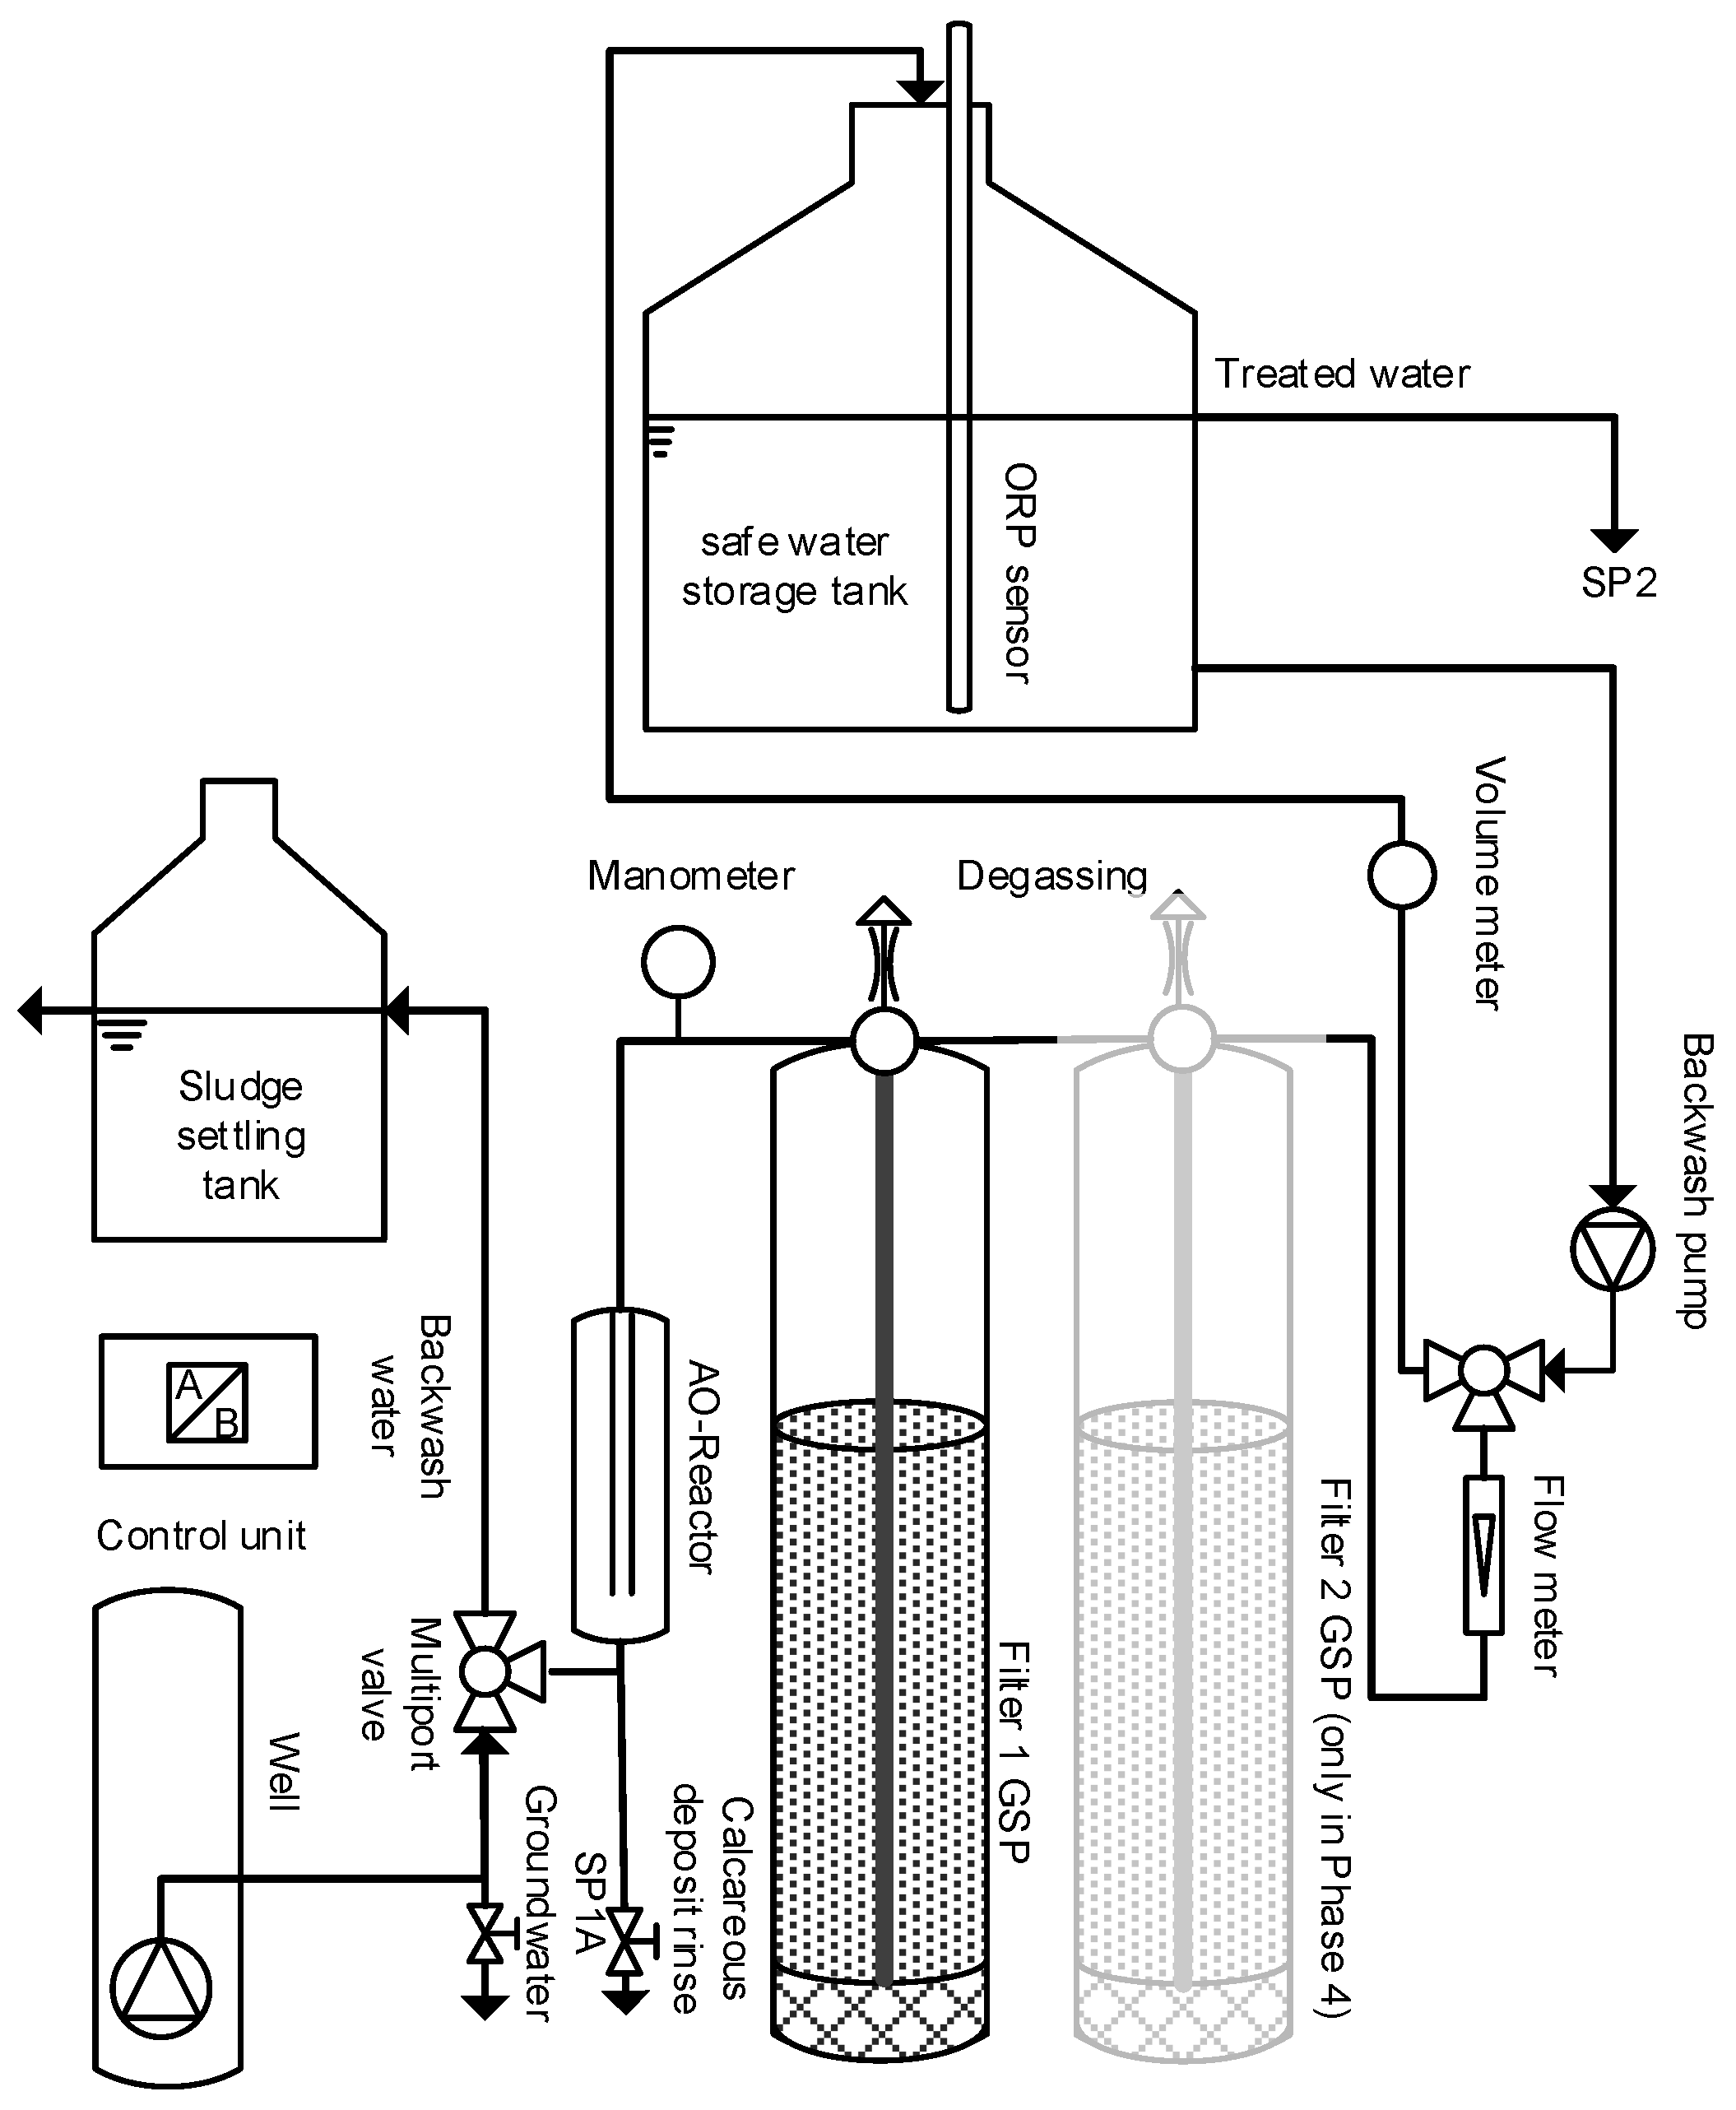
2. Materials and Methods
2.1. Inline Electrolysis
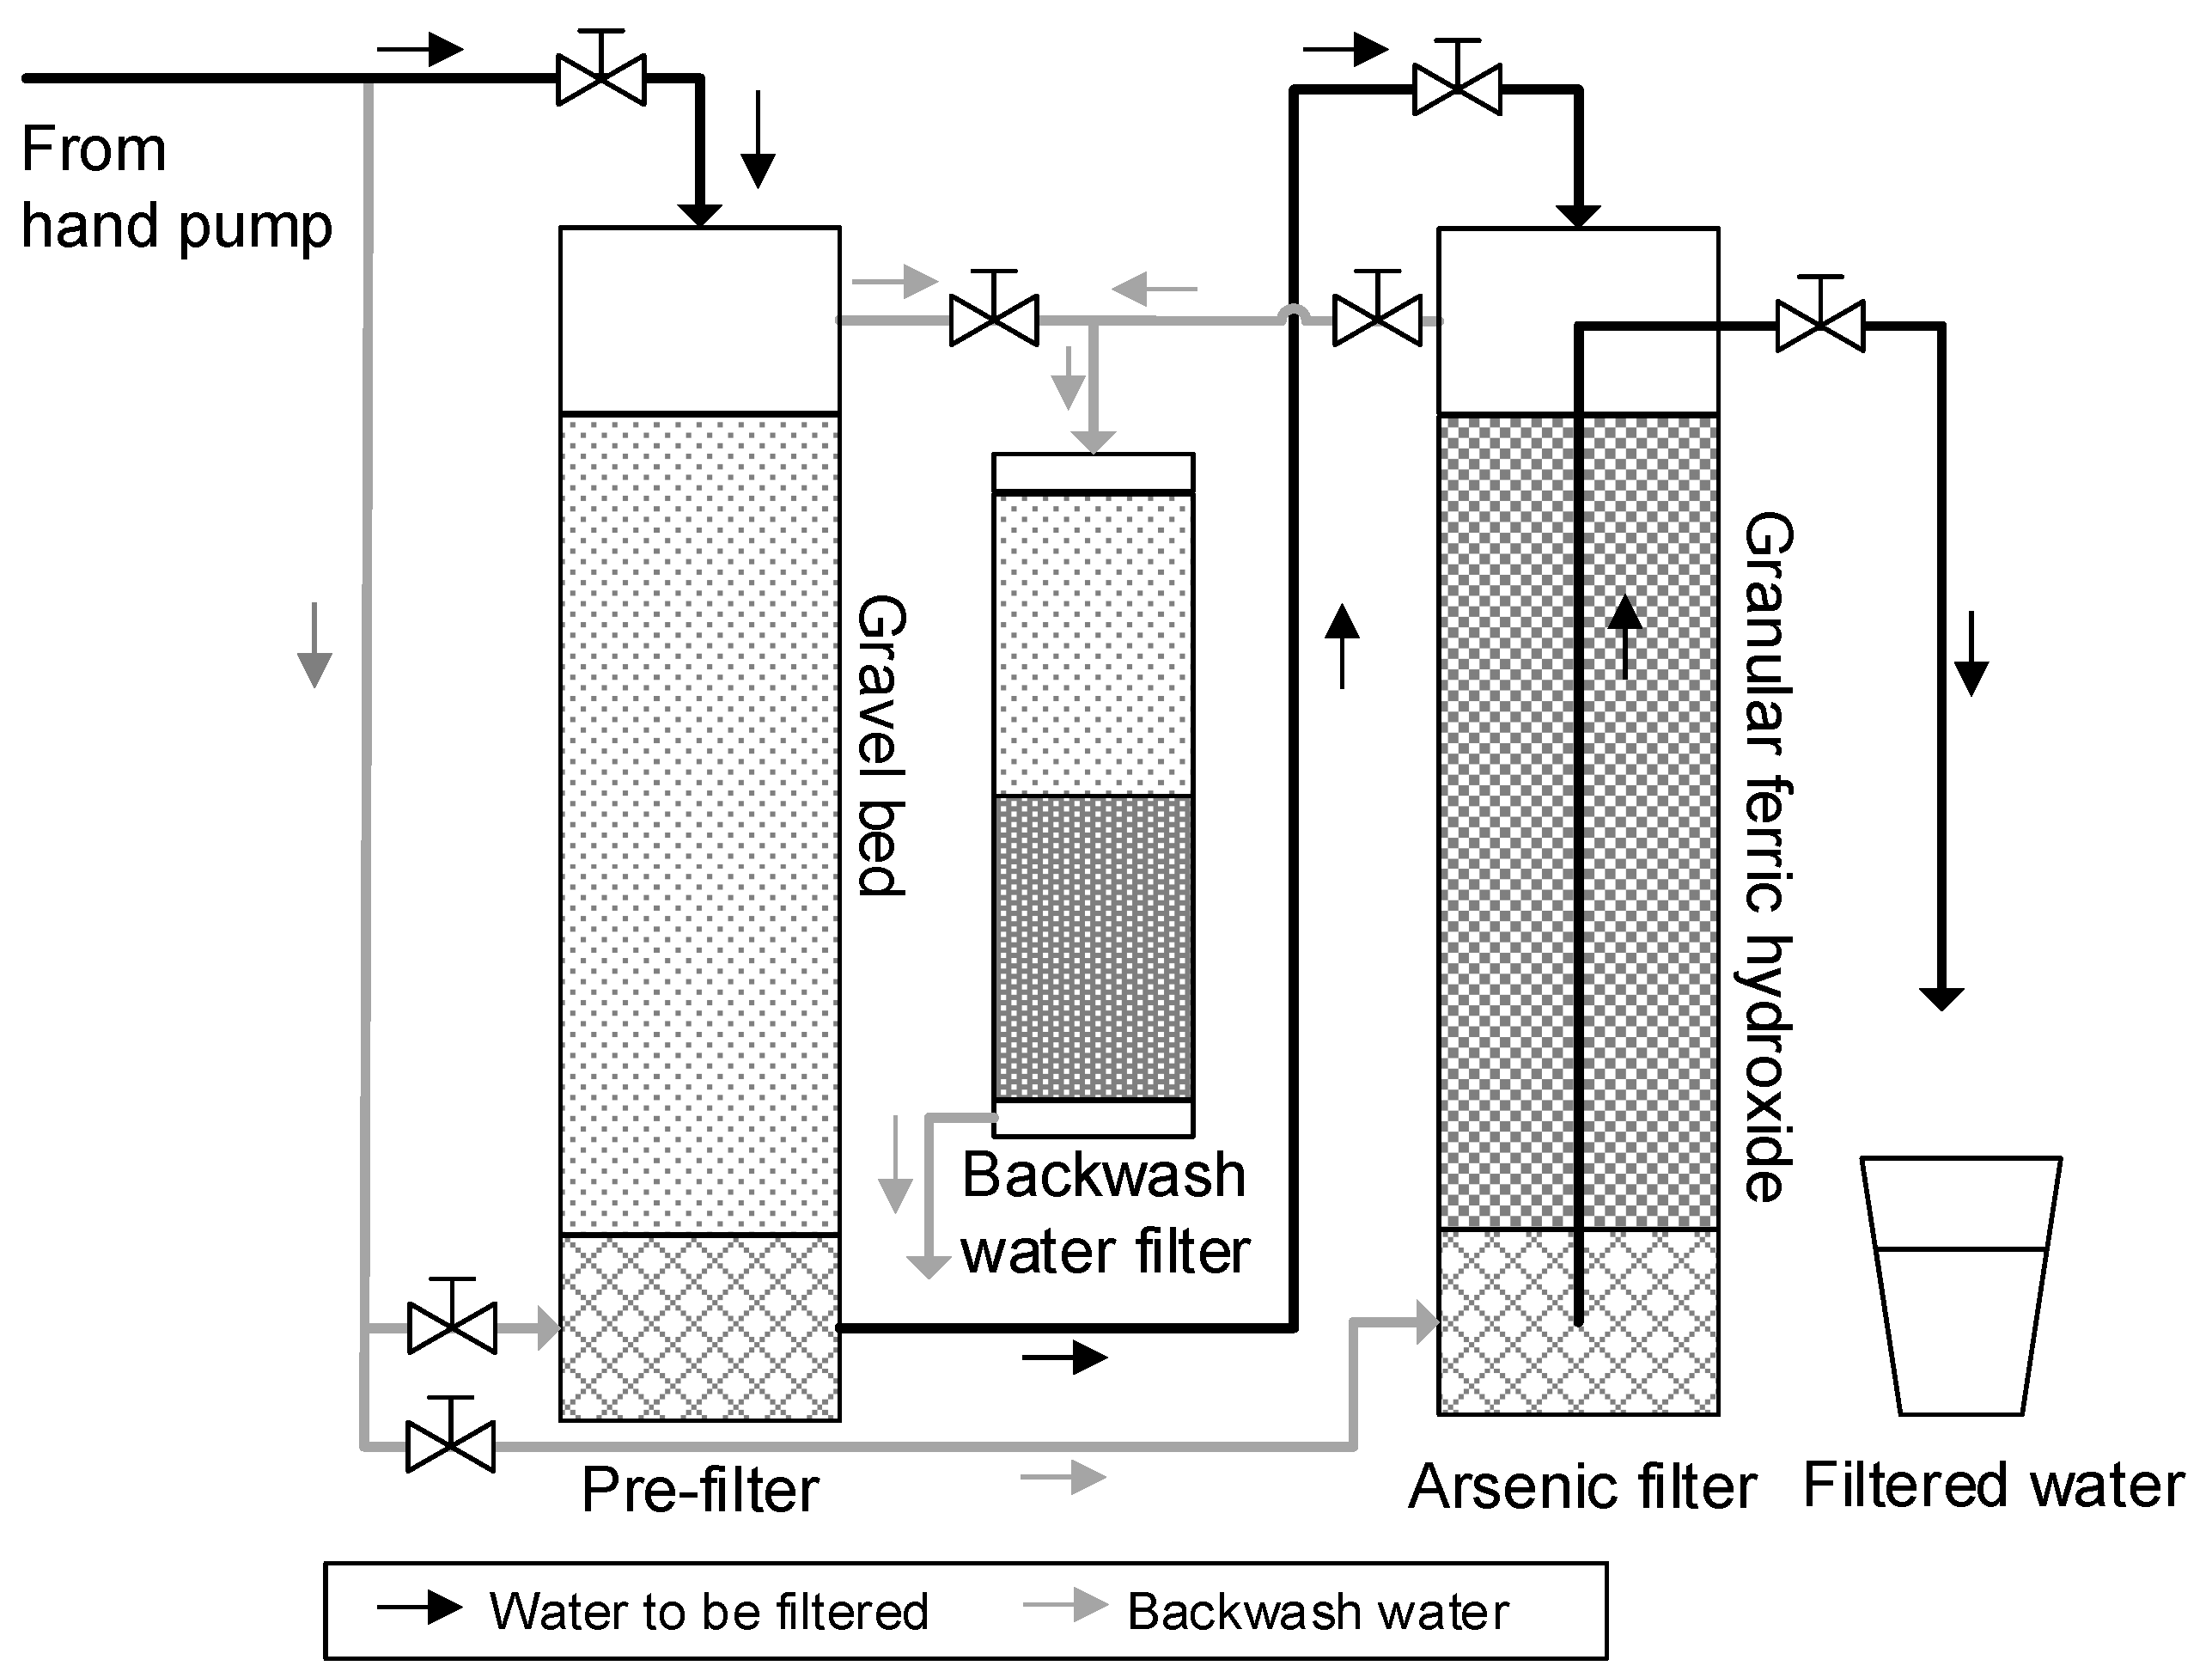
2.2. Filtration
2.3. Study Site
2.4. Sampling, Water Analysis and Monitoring
3. Results and Discussion
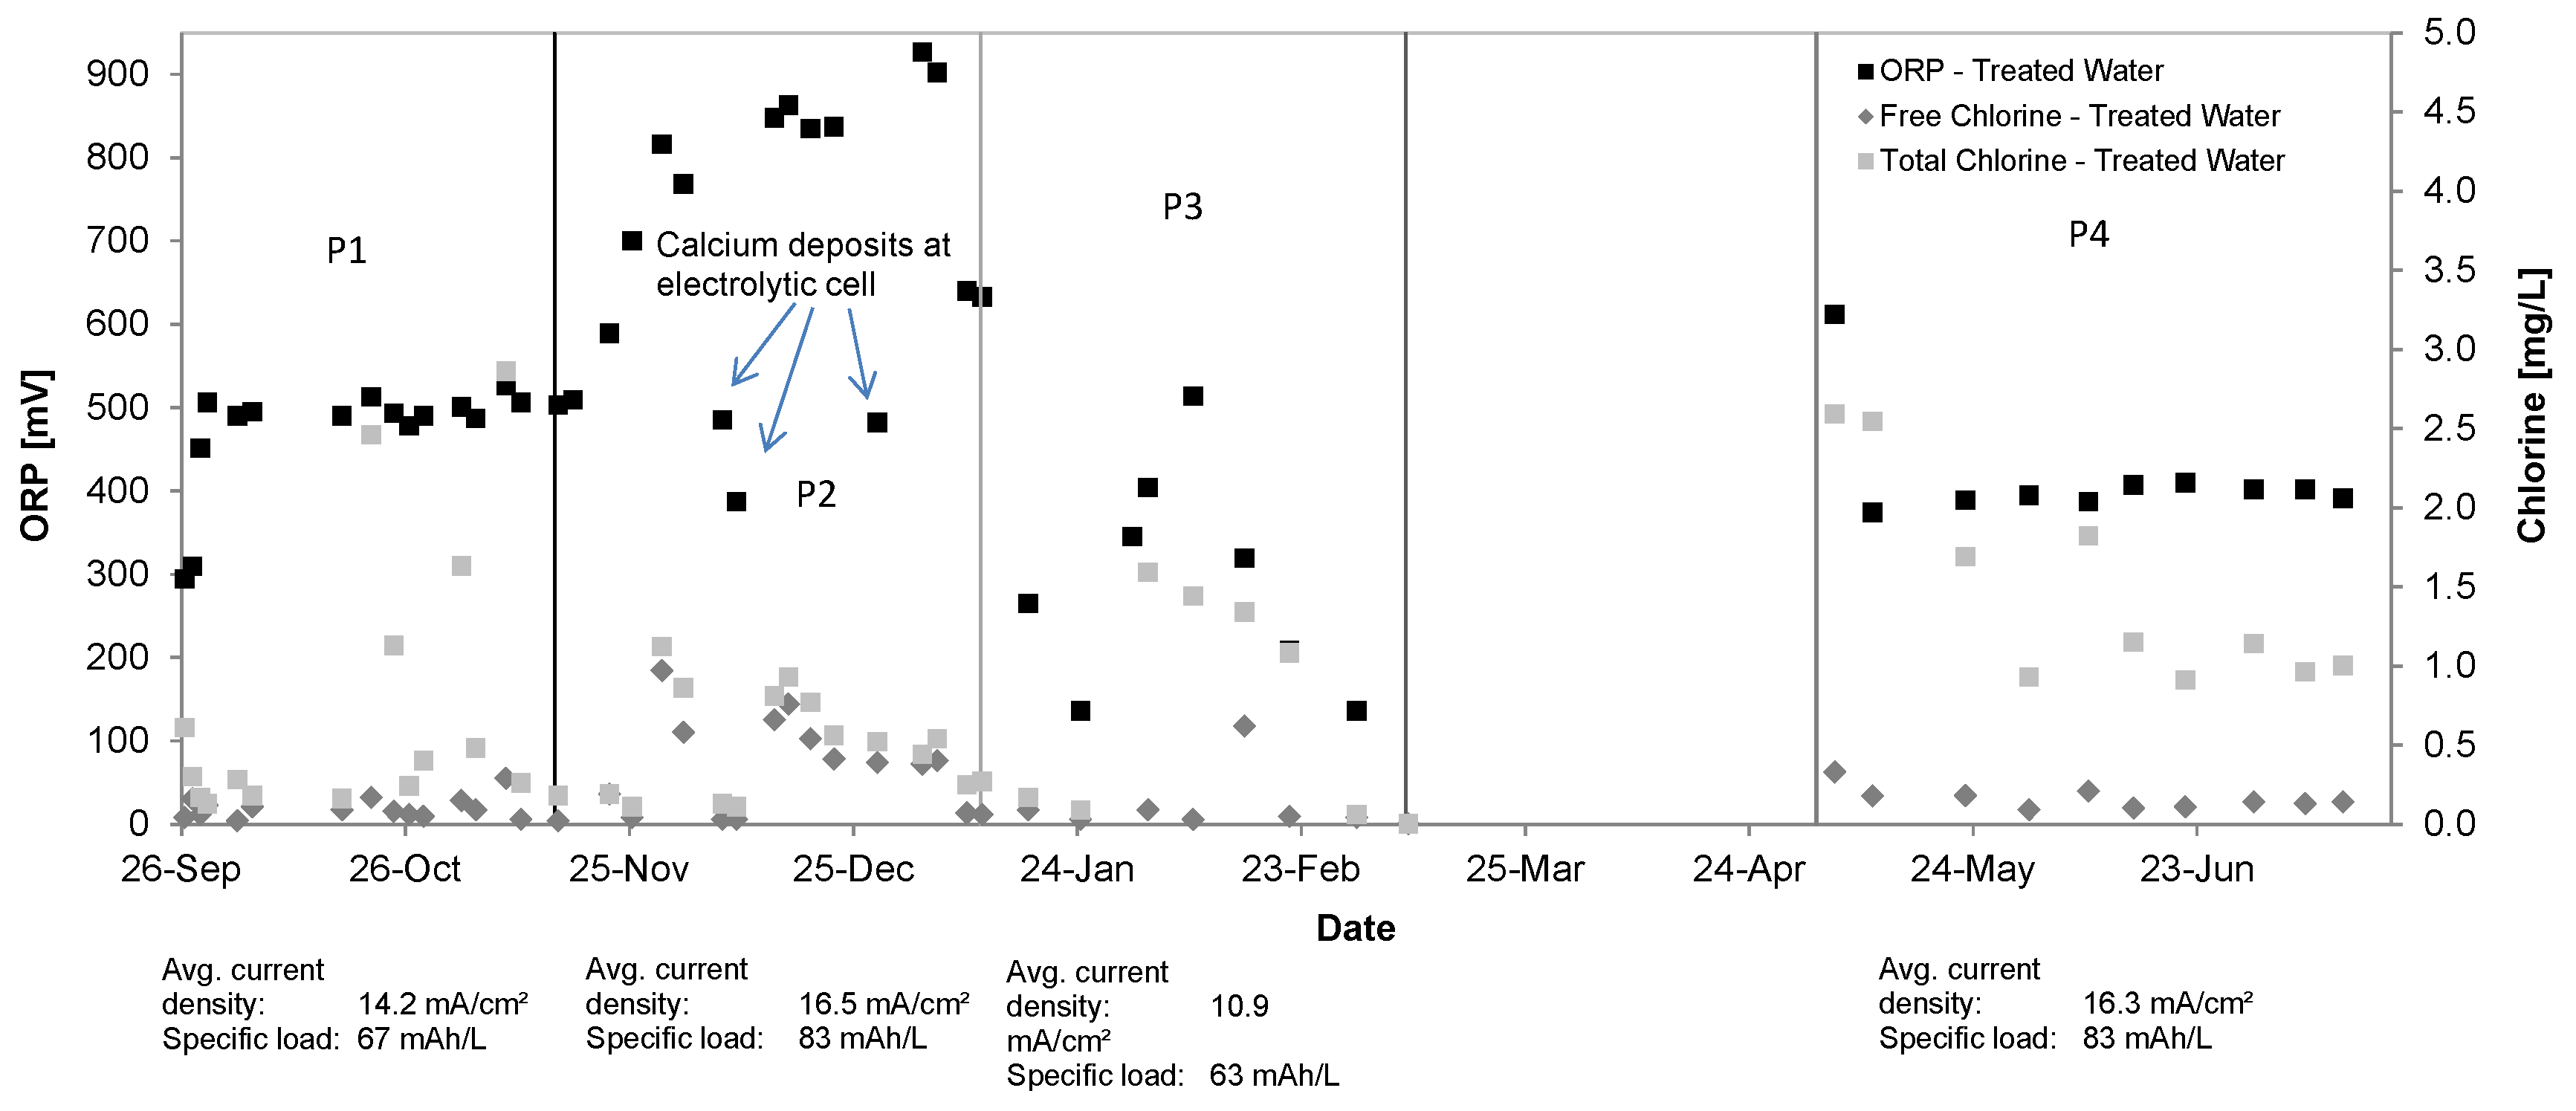
3.1. Oxidant Production and Breakpoint Chlorination
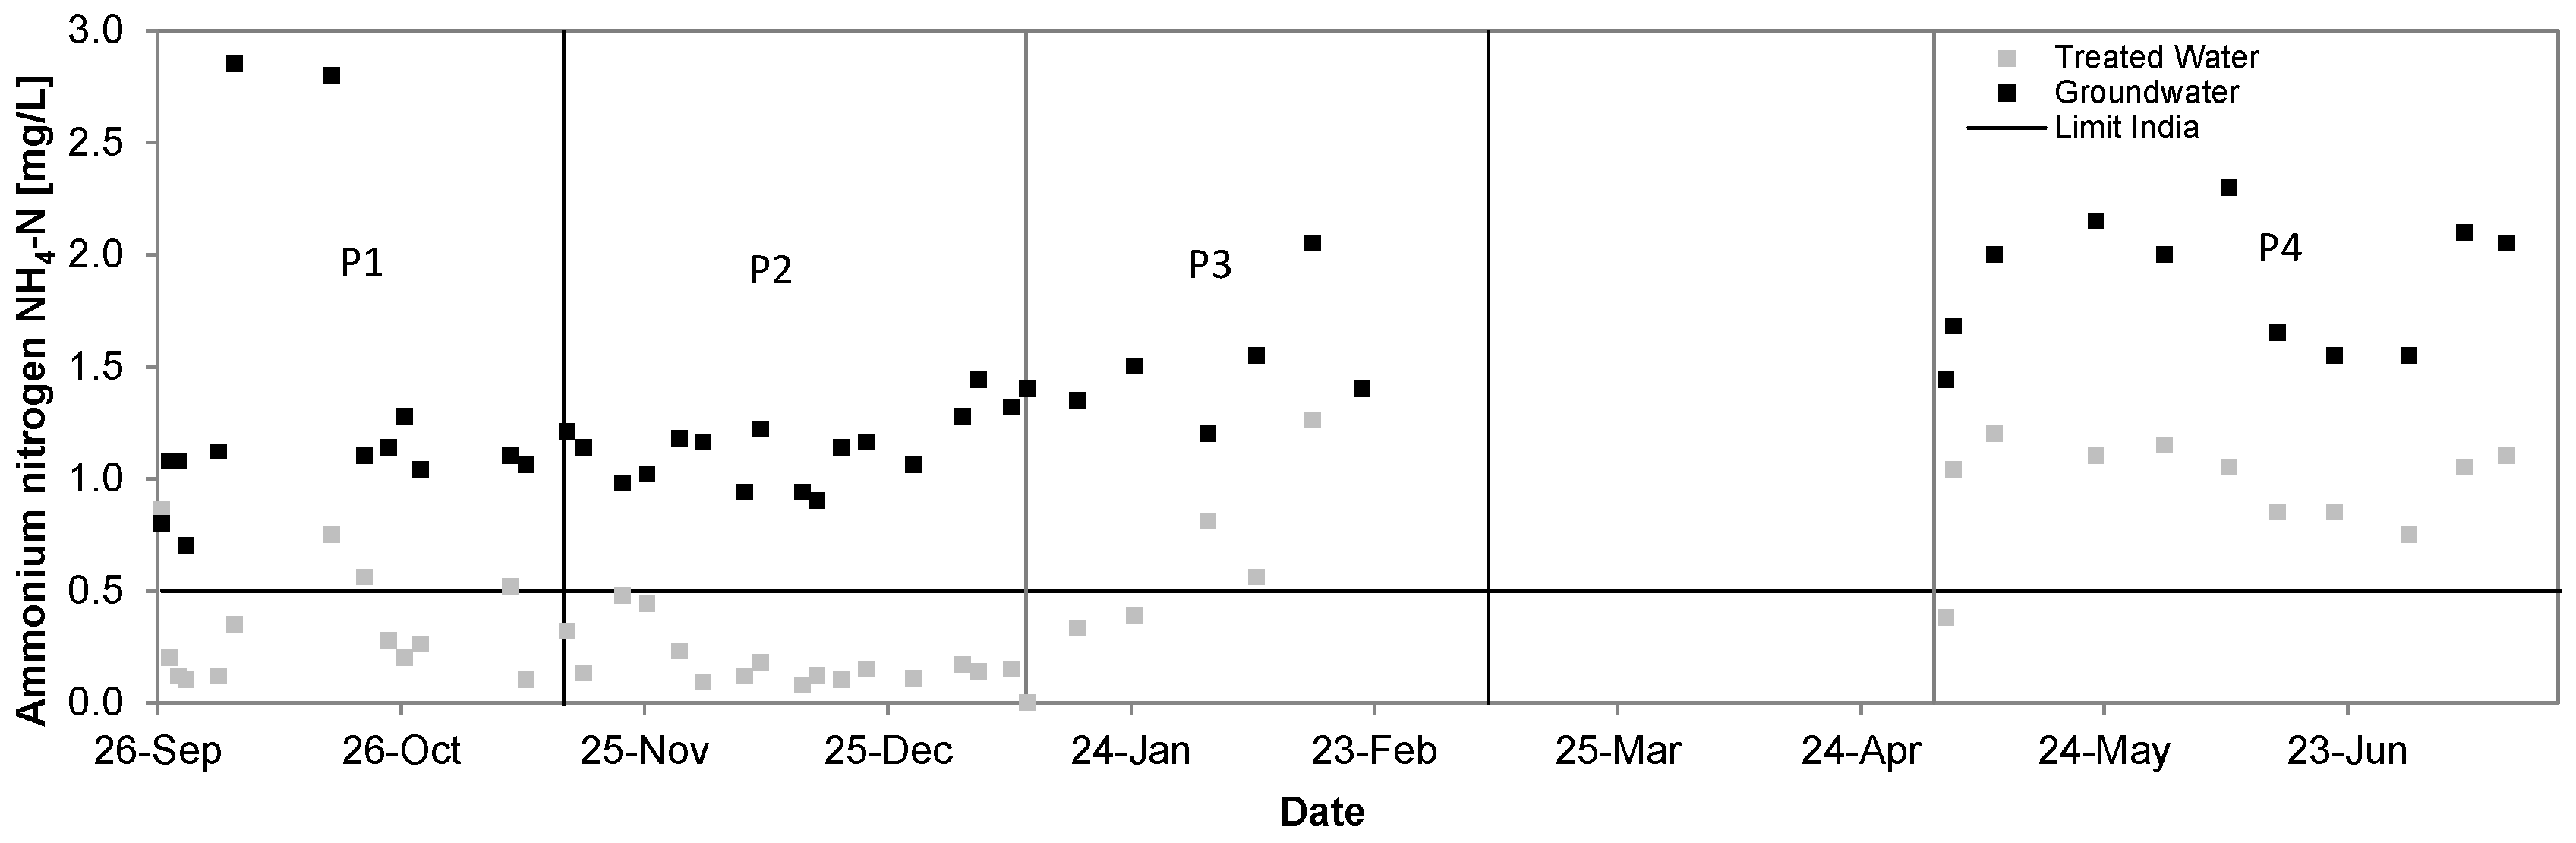
3.2. Ammonium
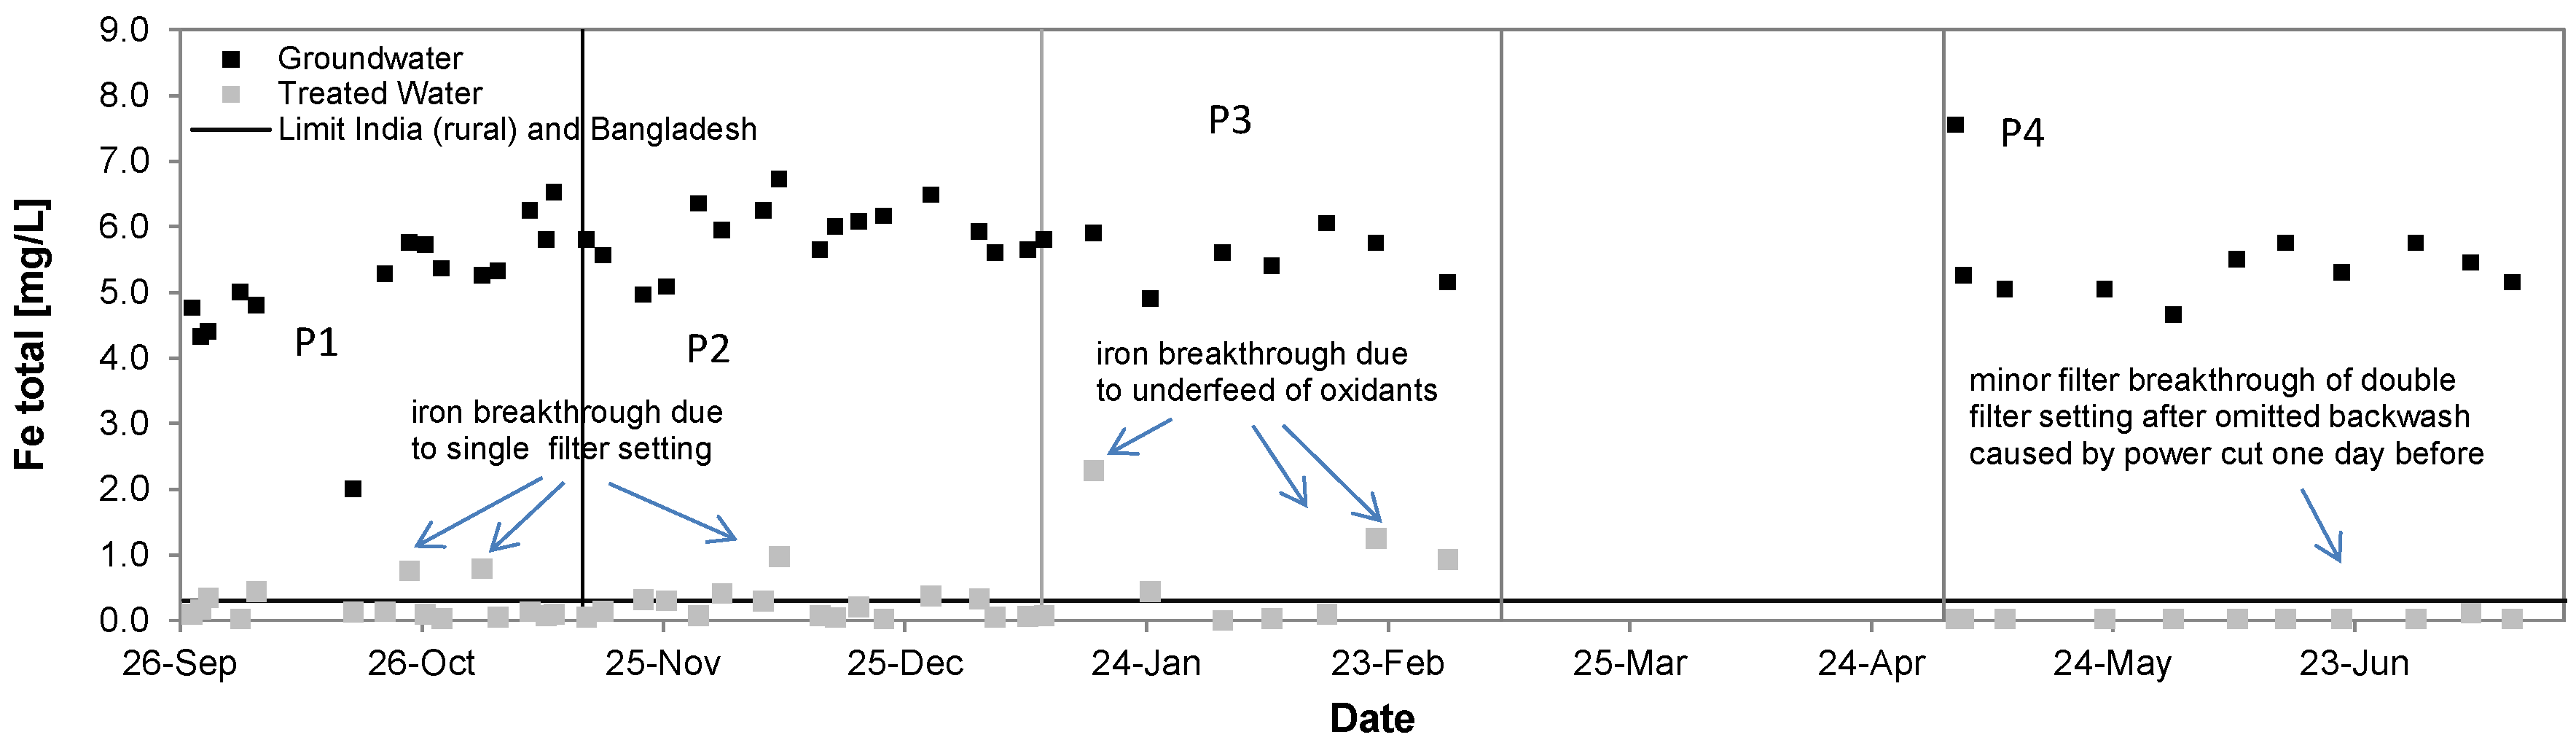
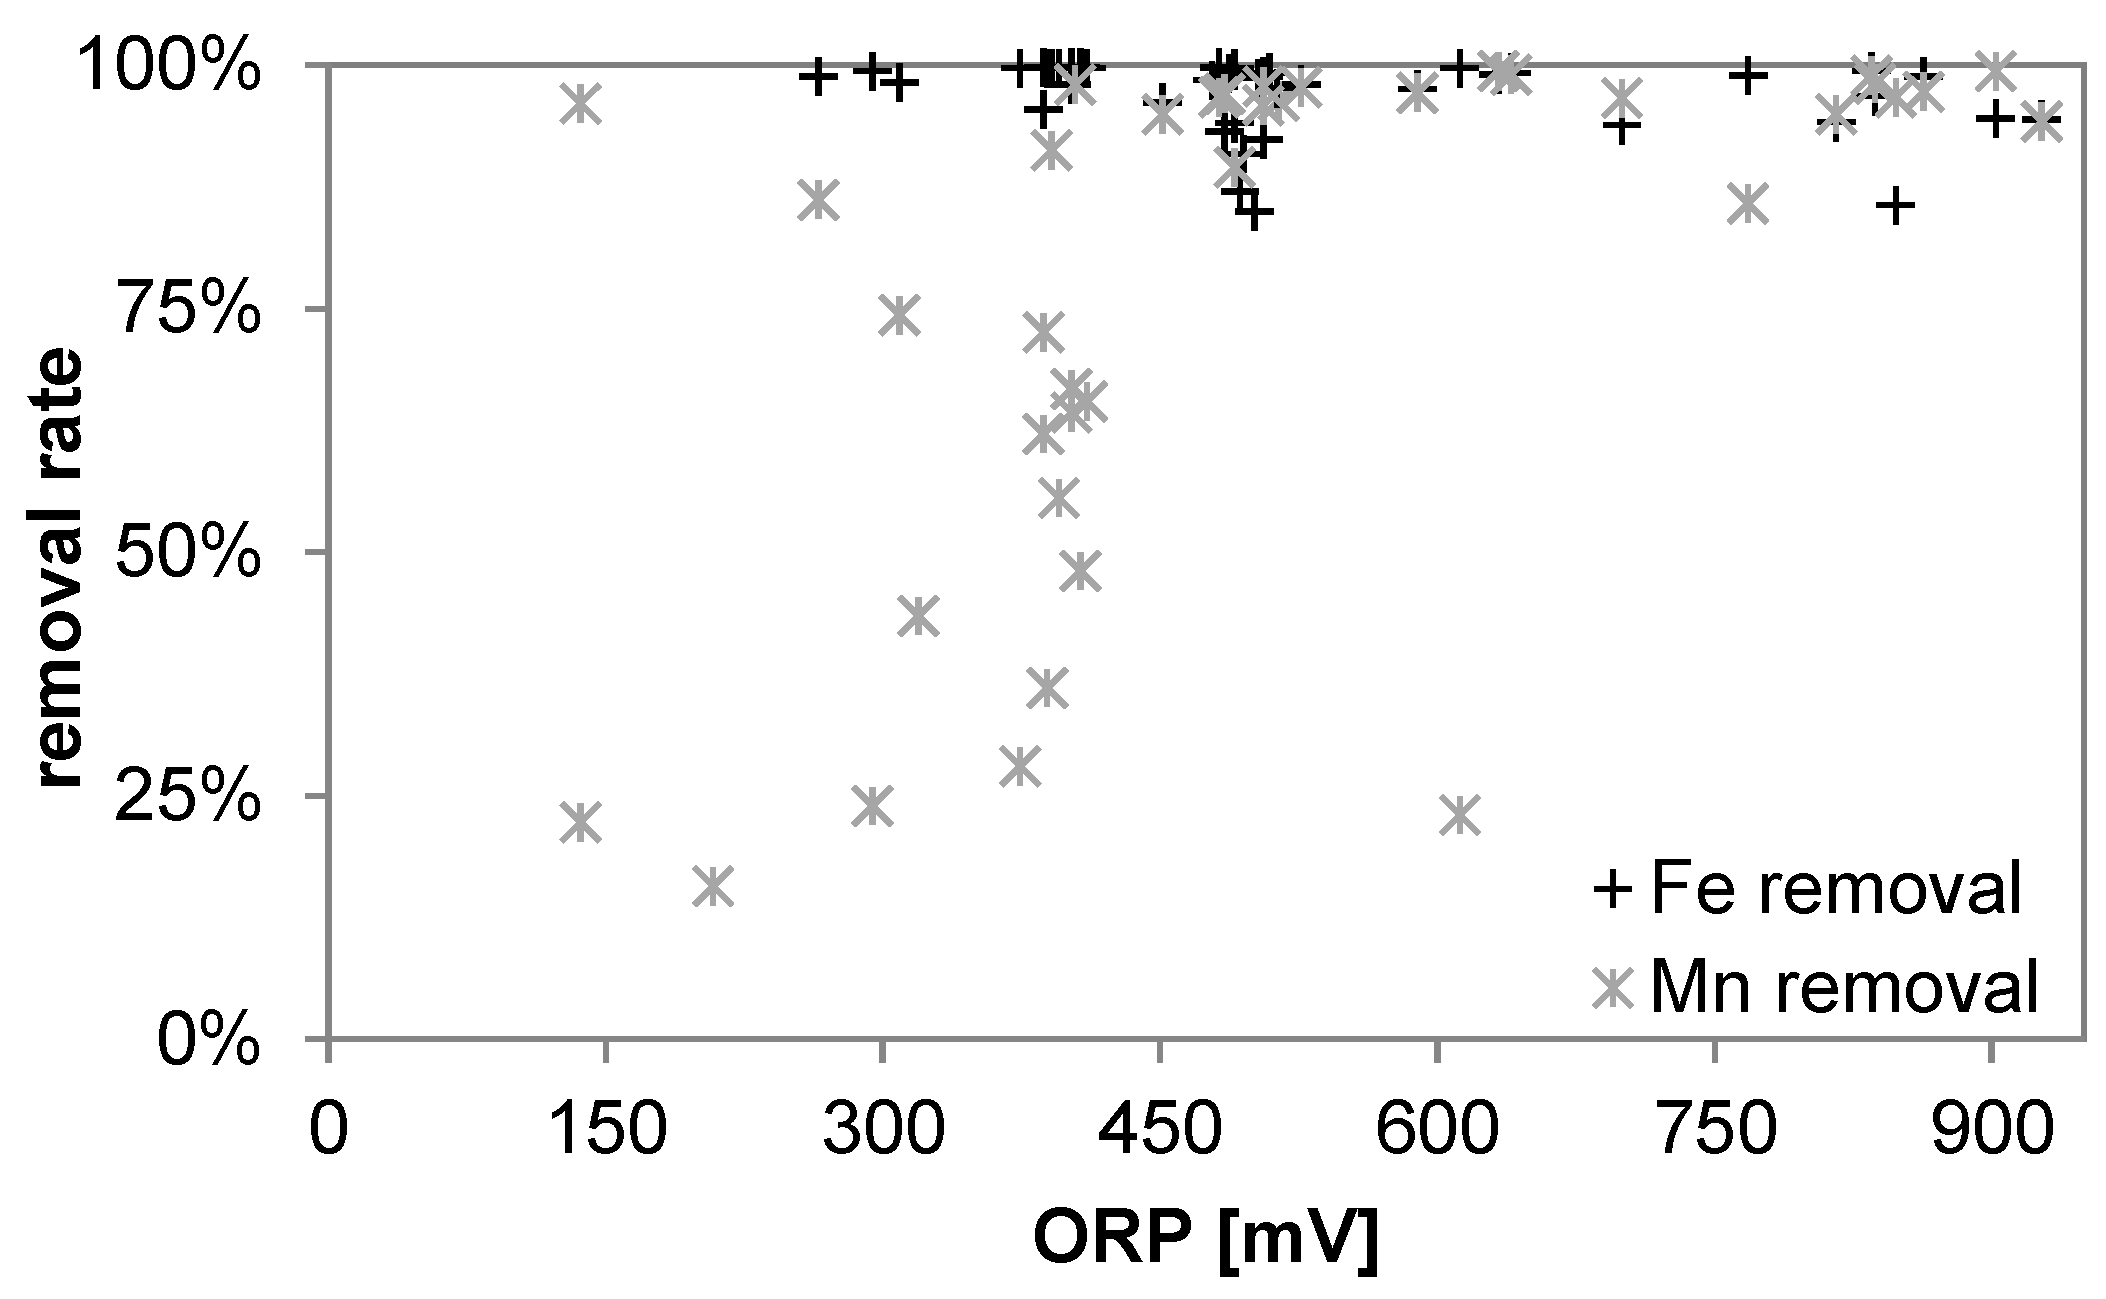
3.3. Iron
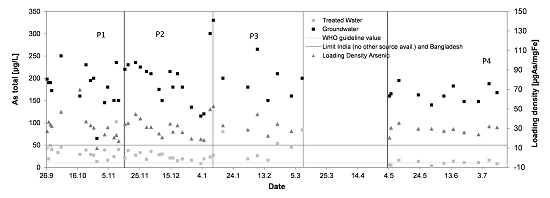
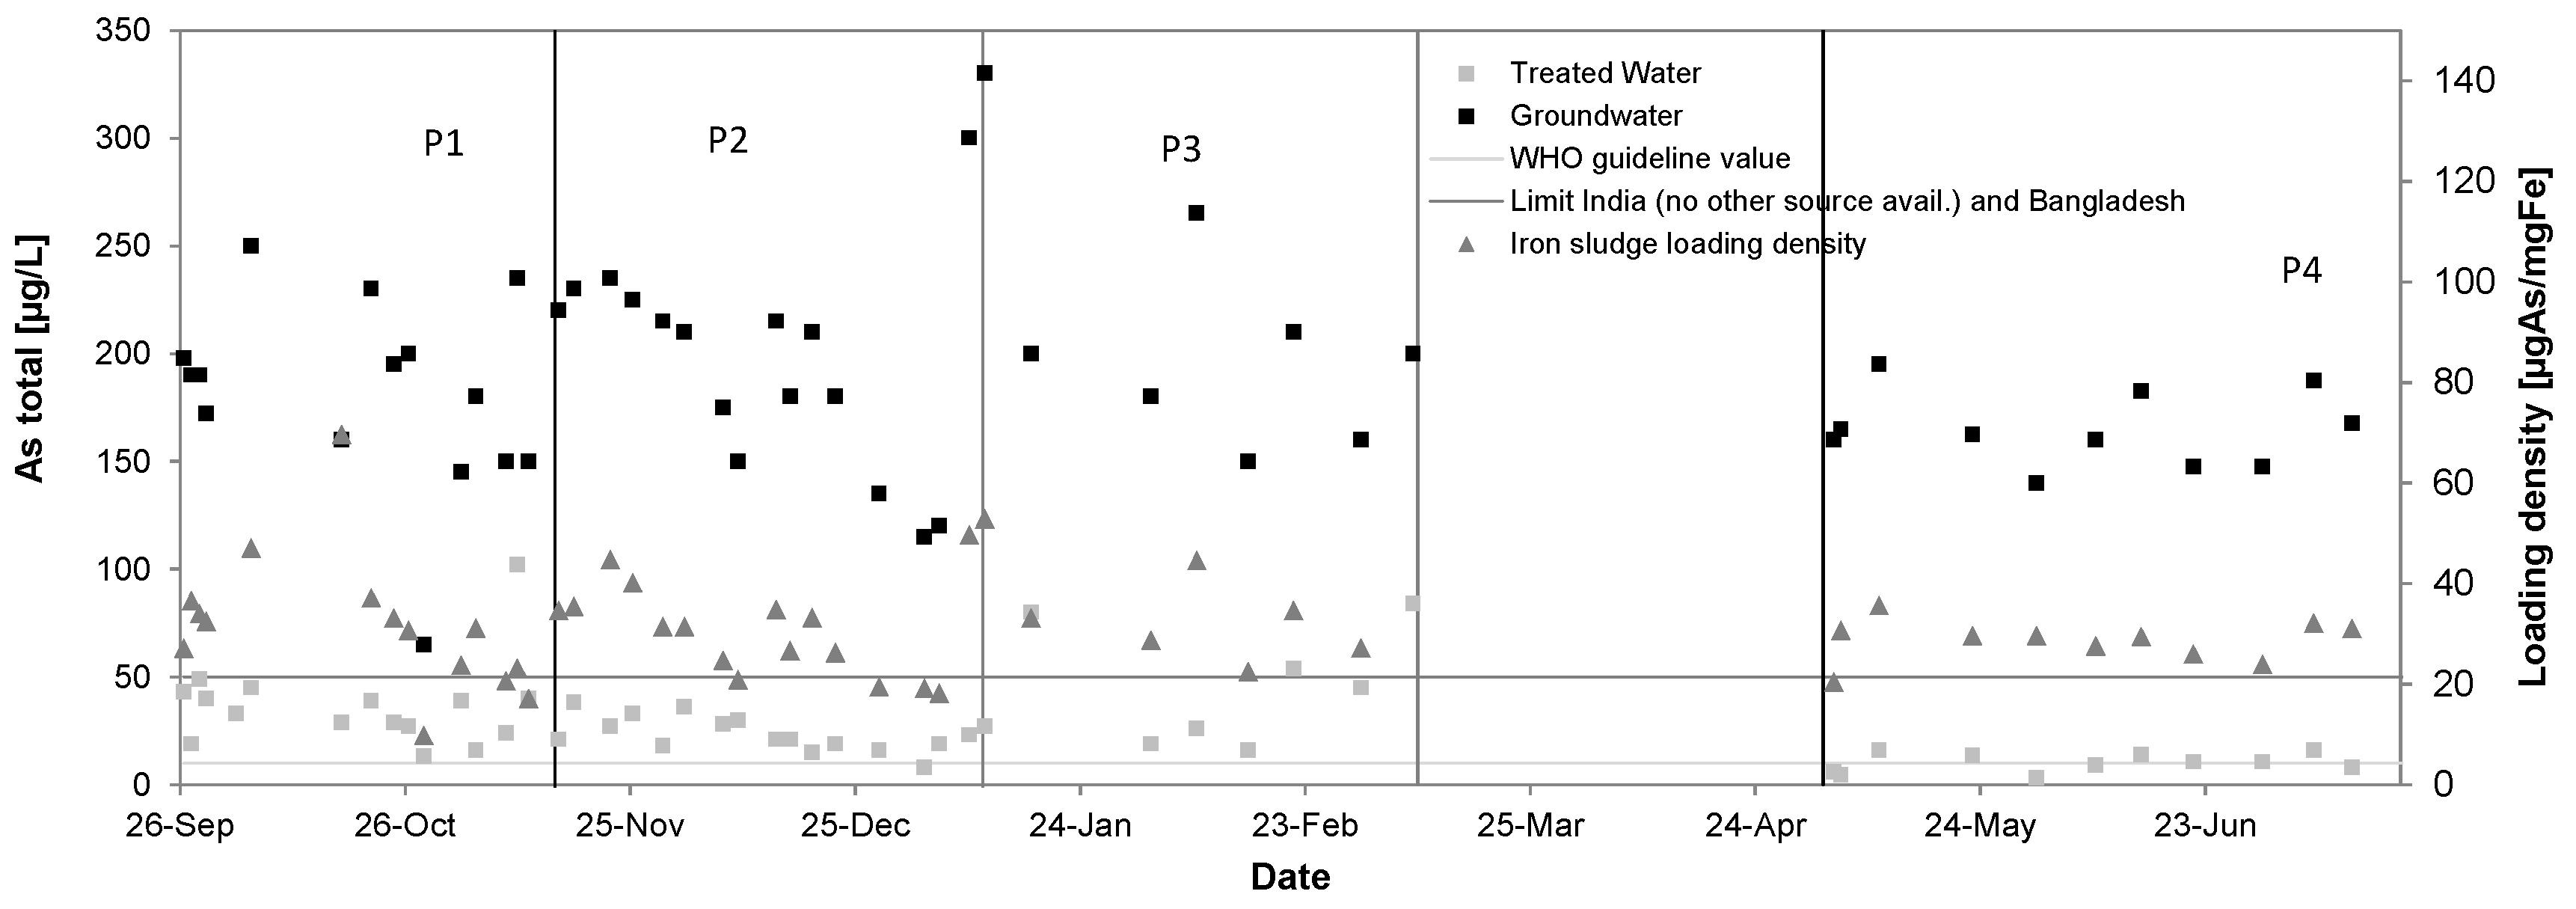
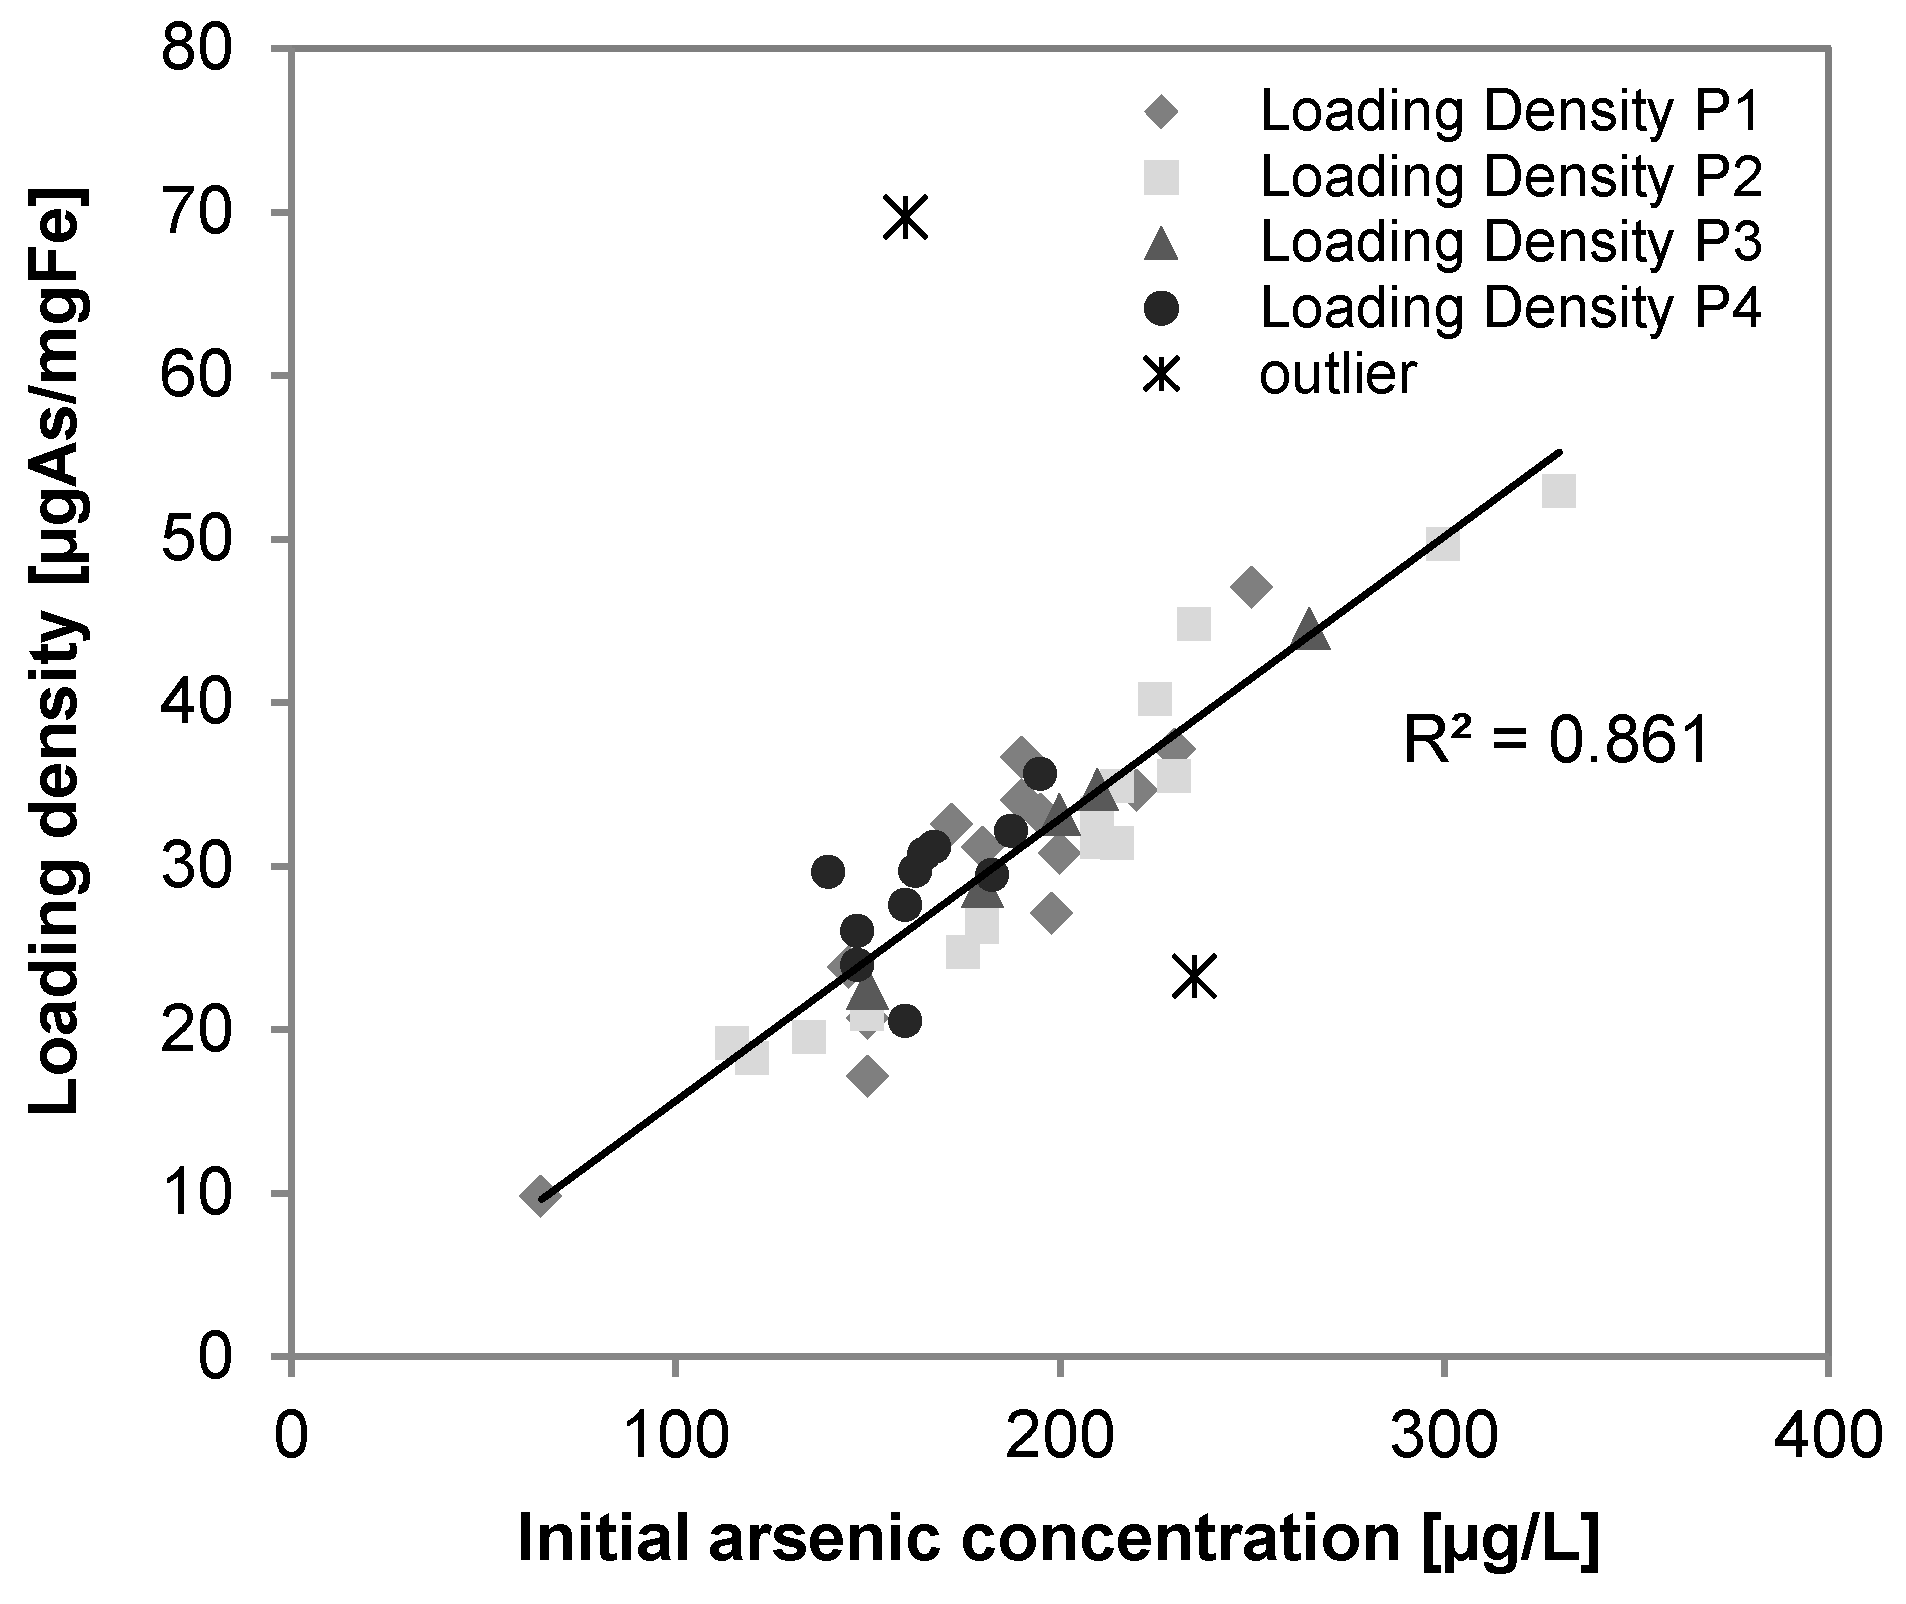
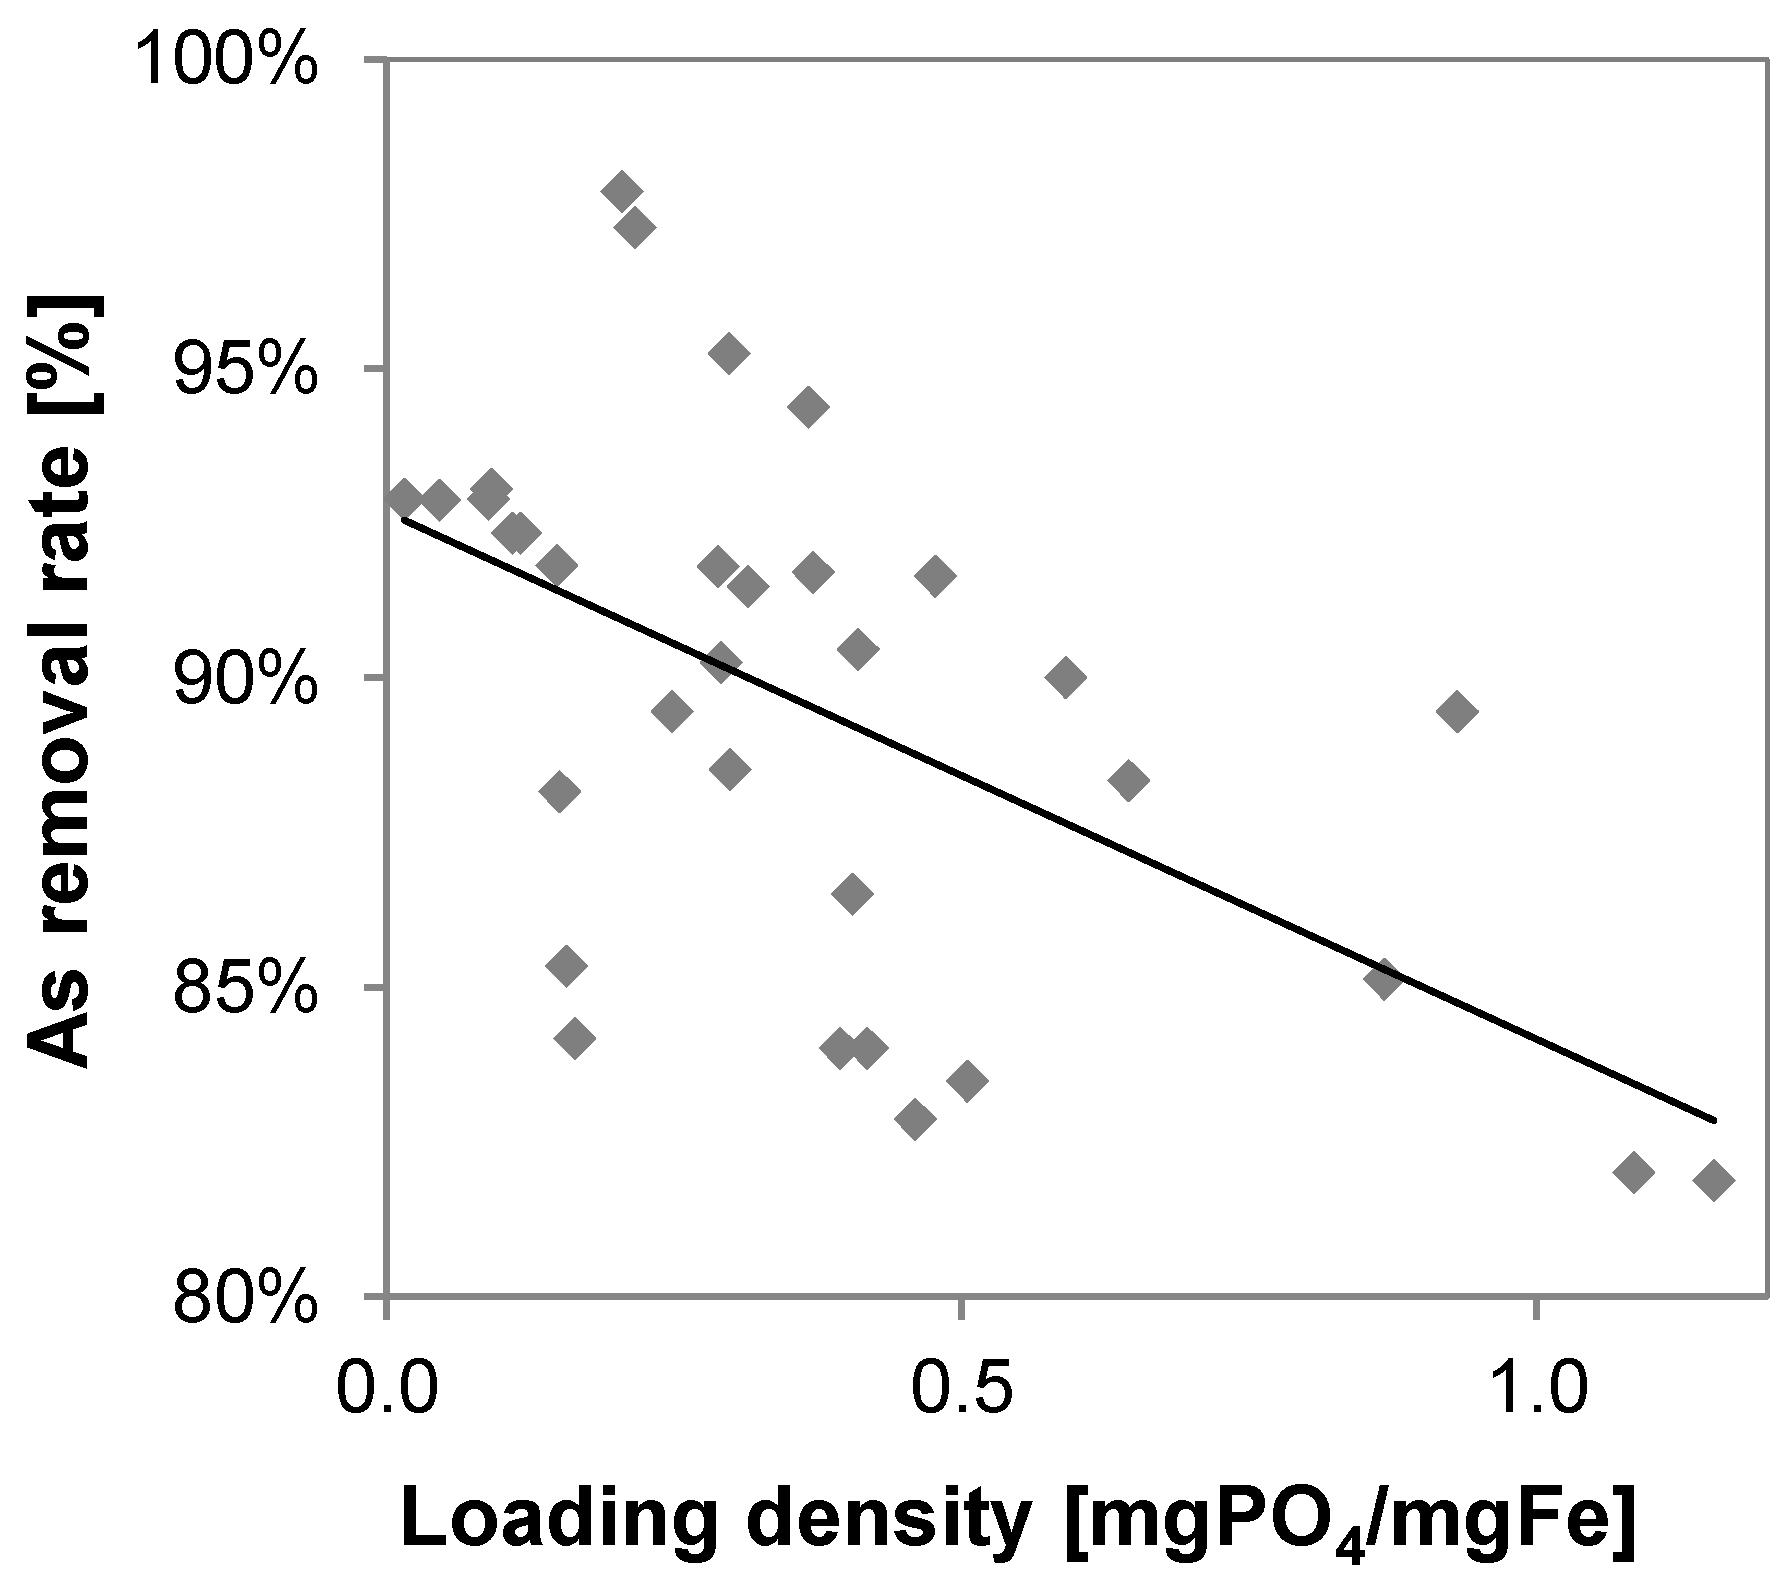
3.4. Arsenic
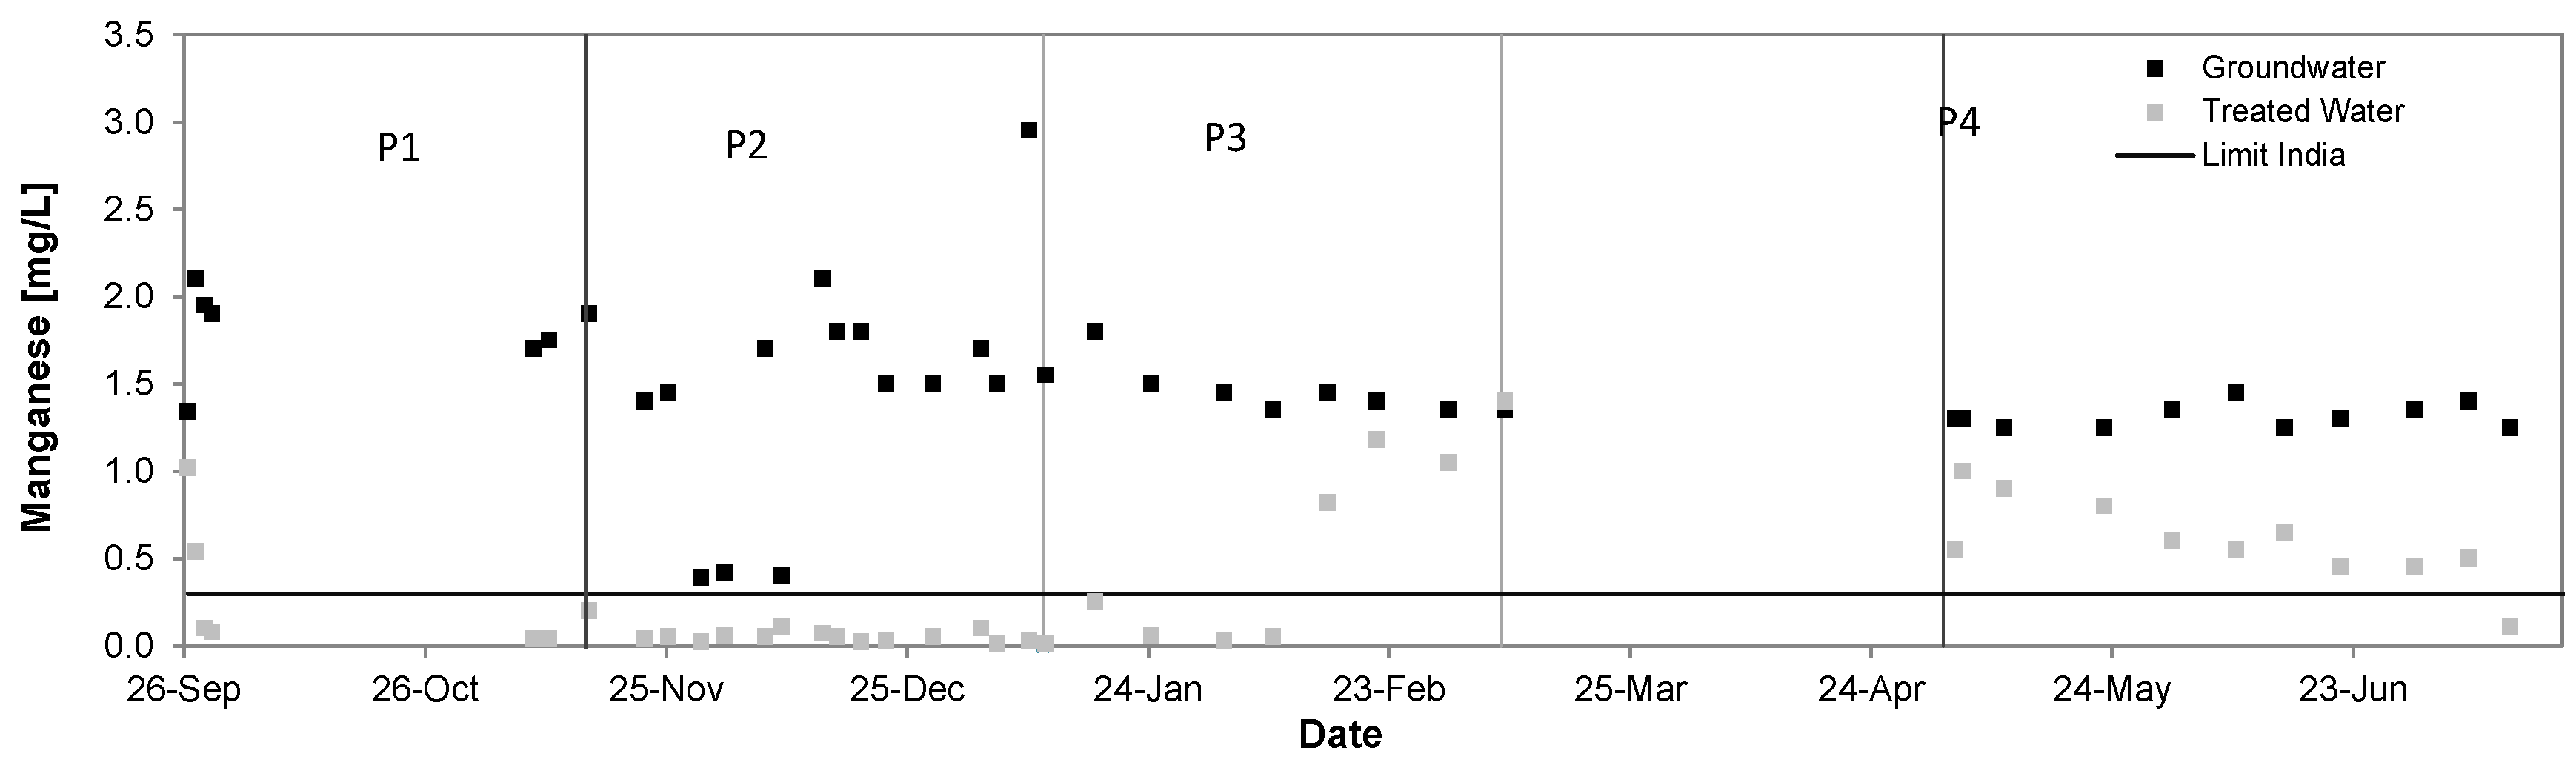
3.5. Manganese
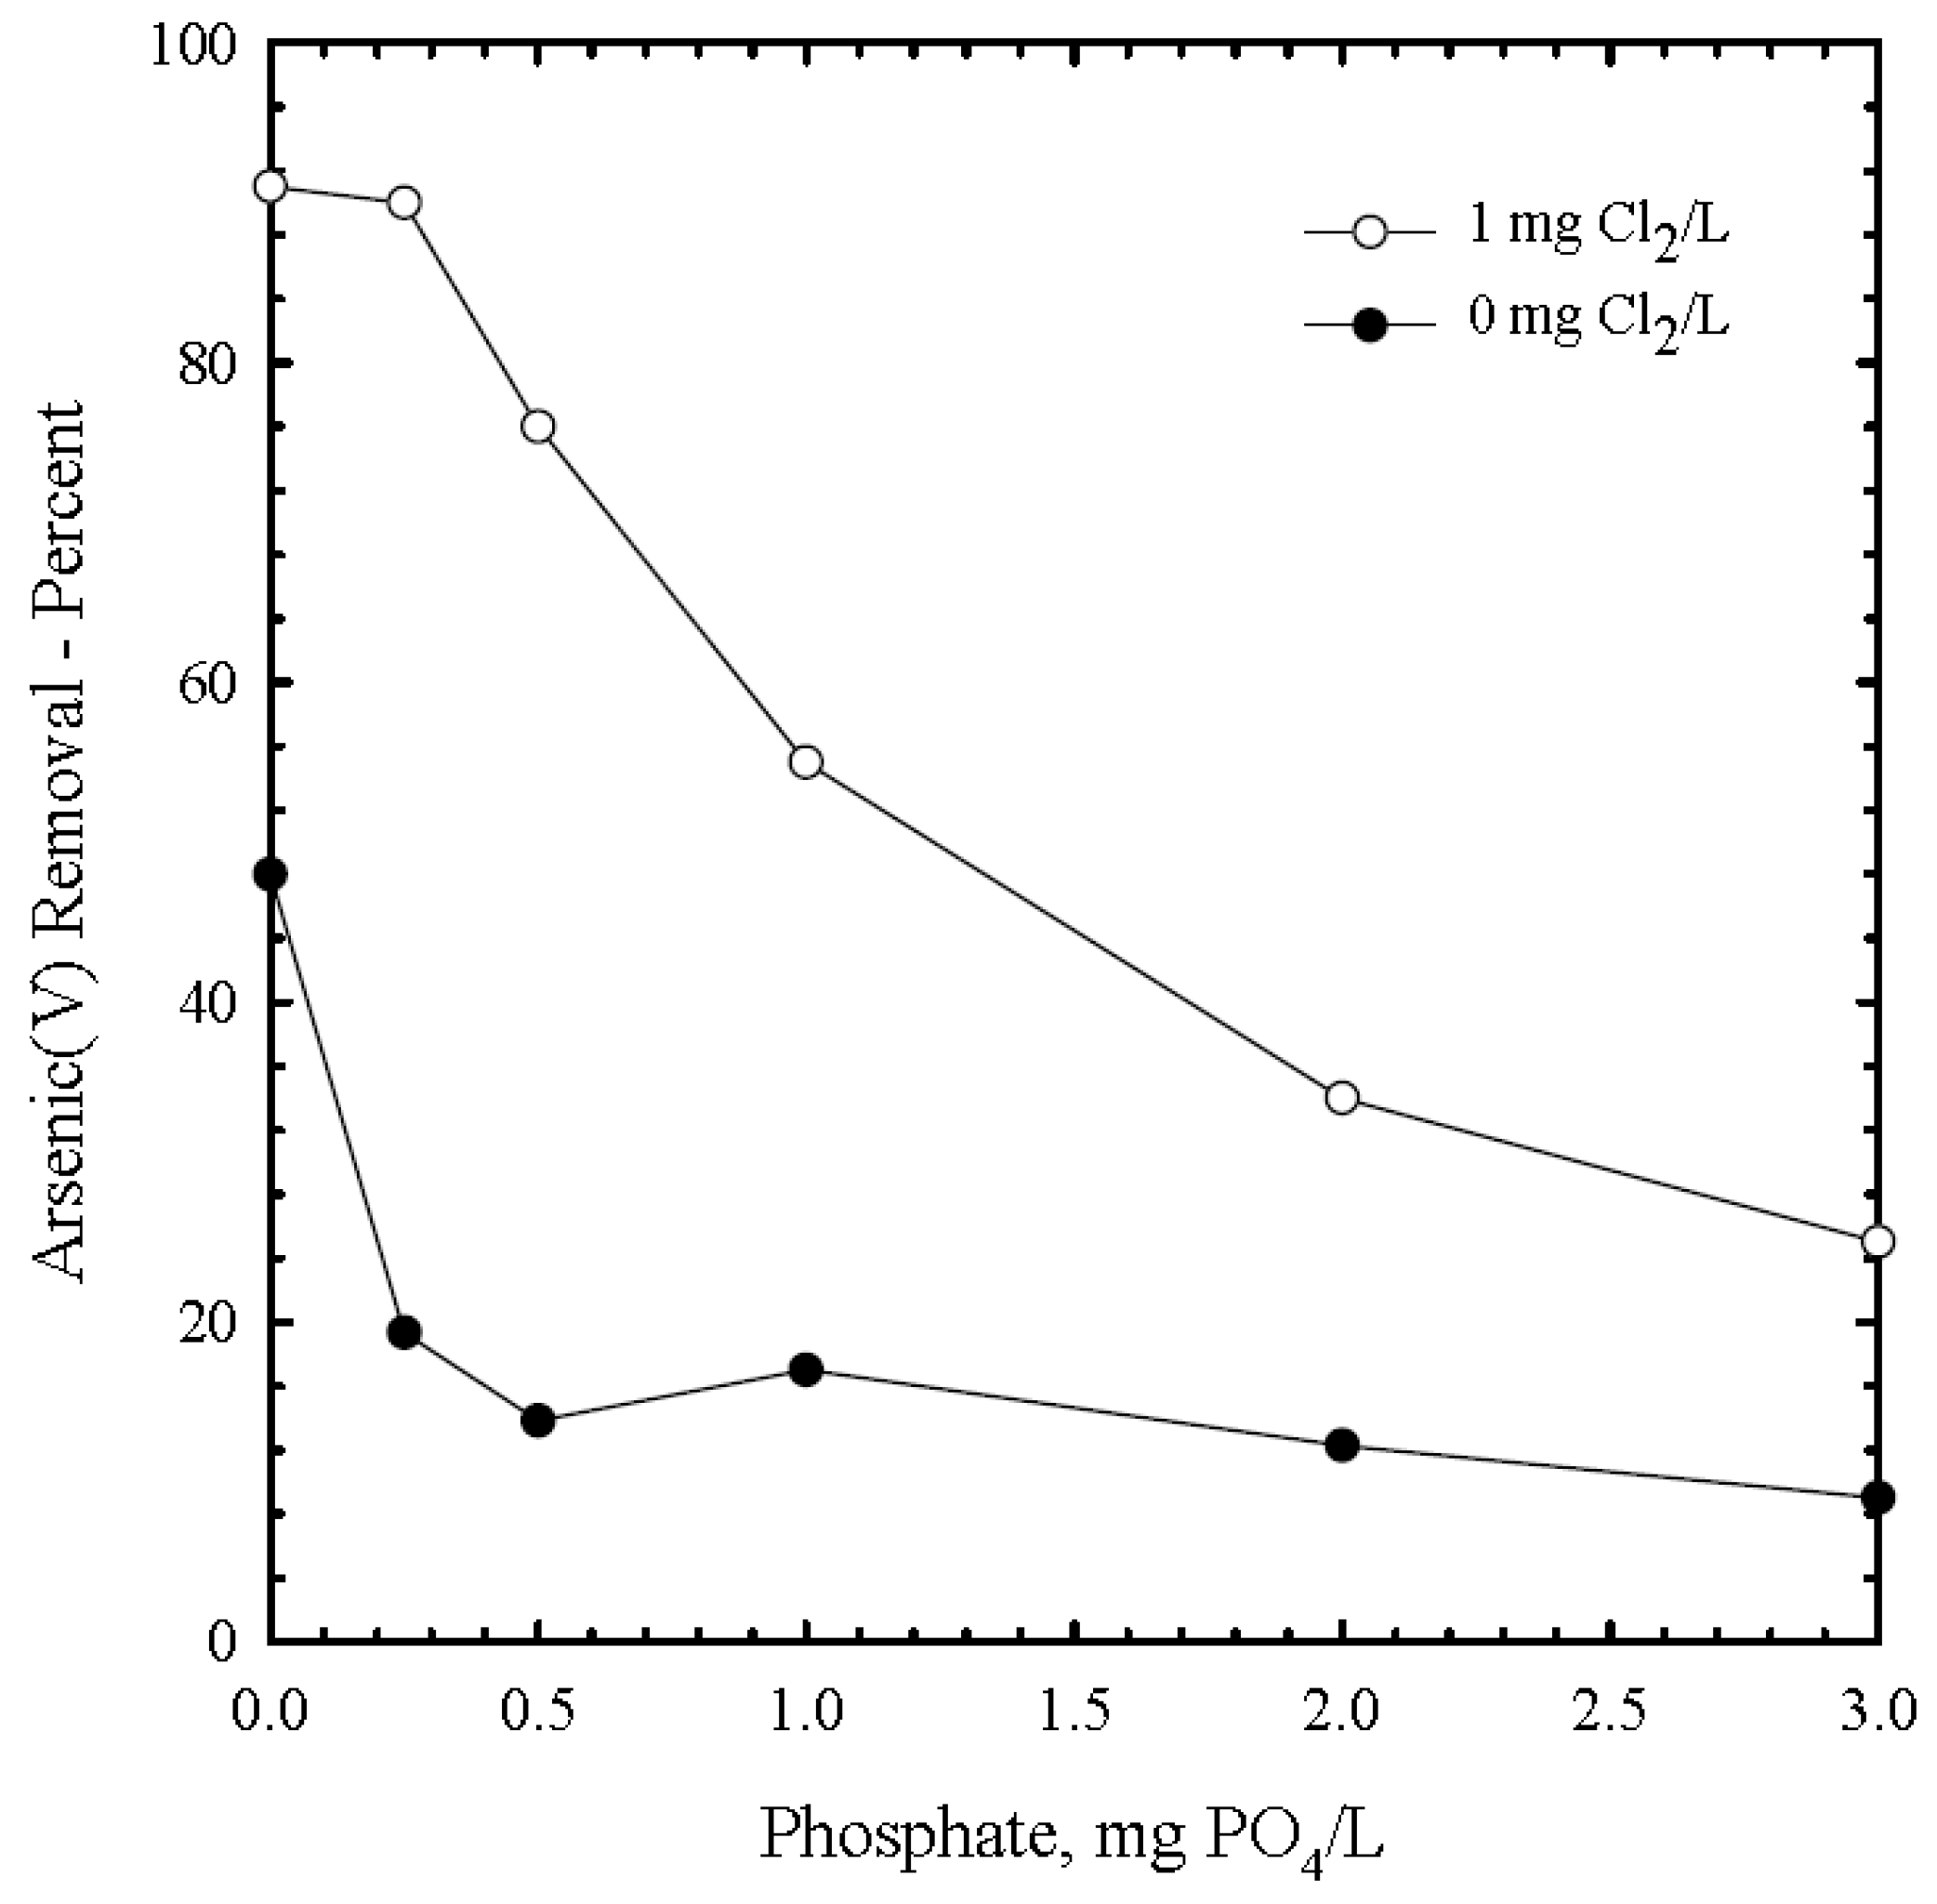
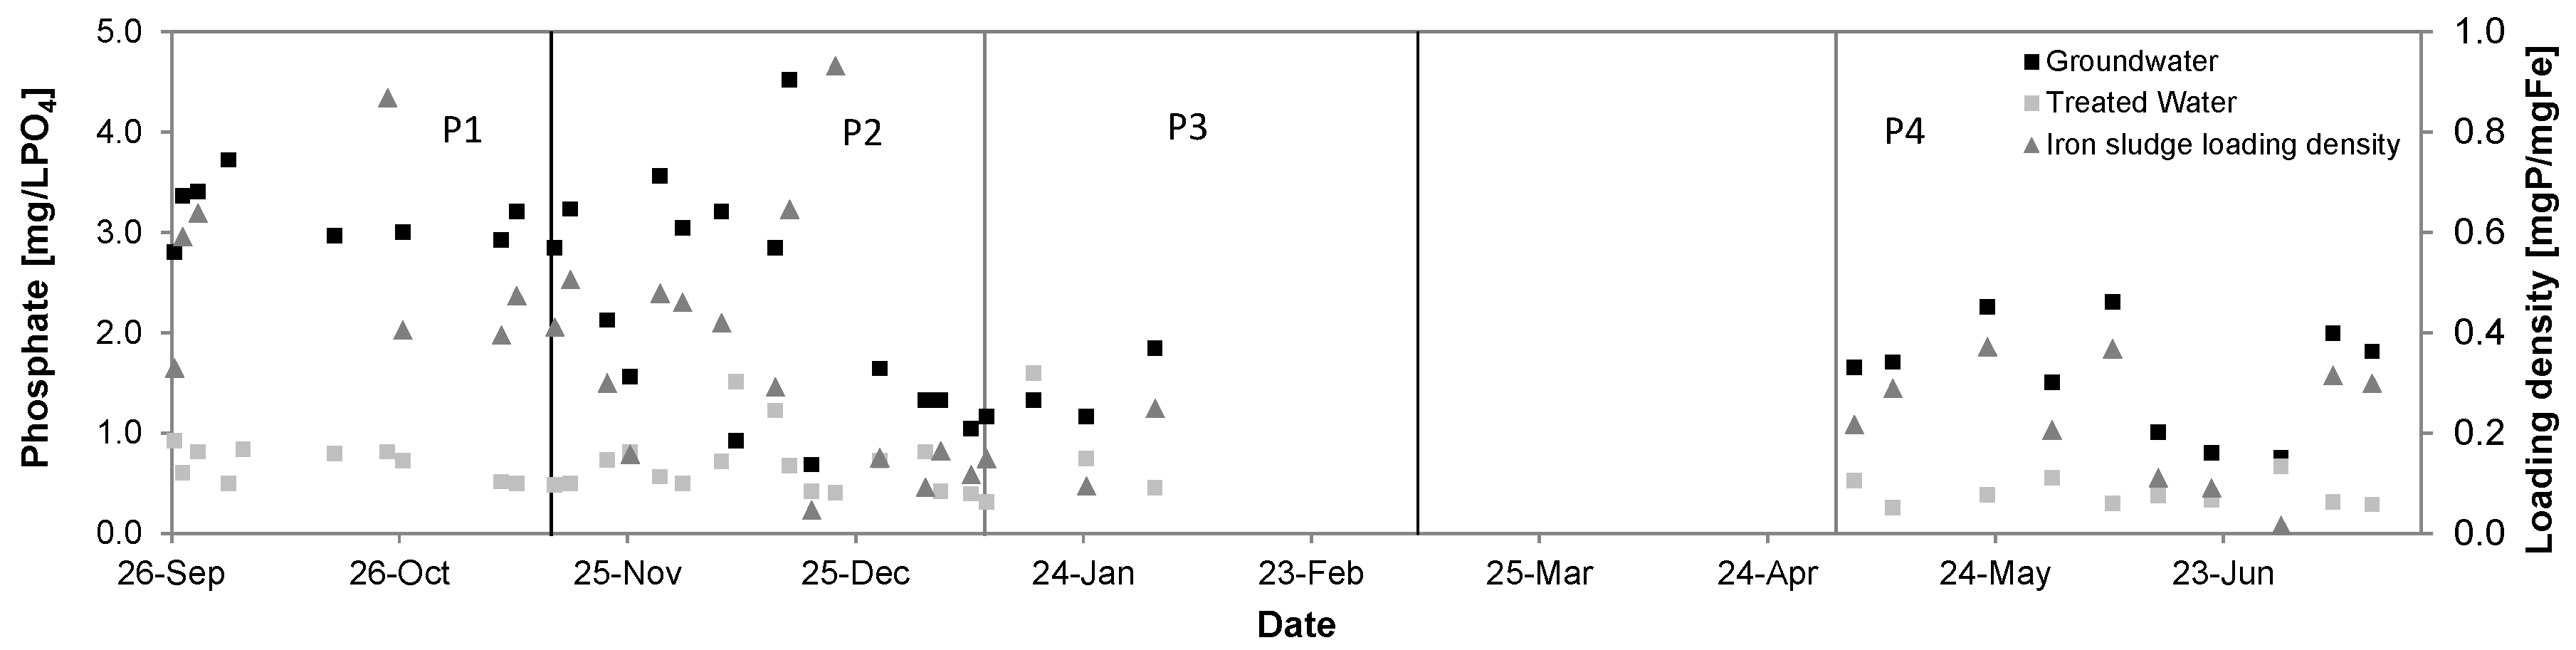
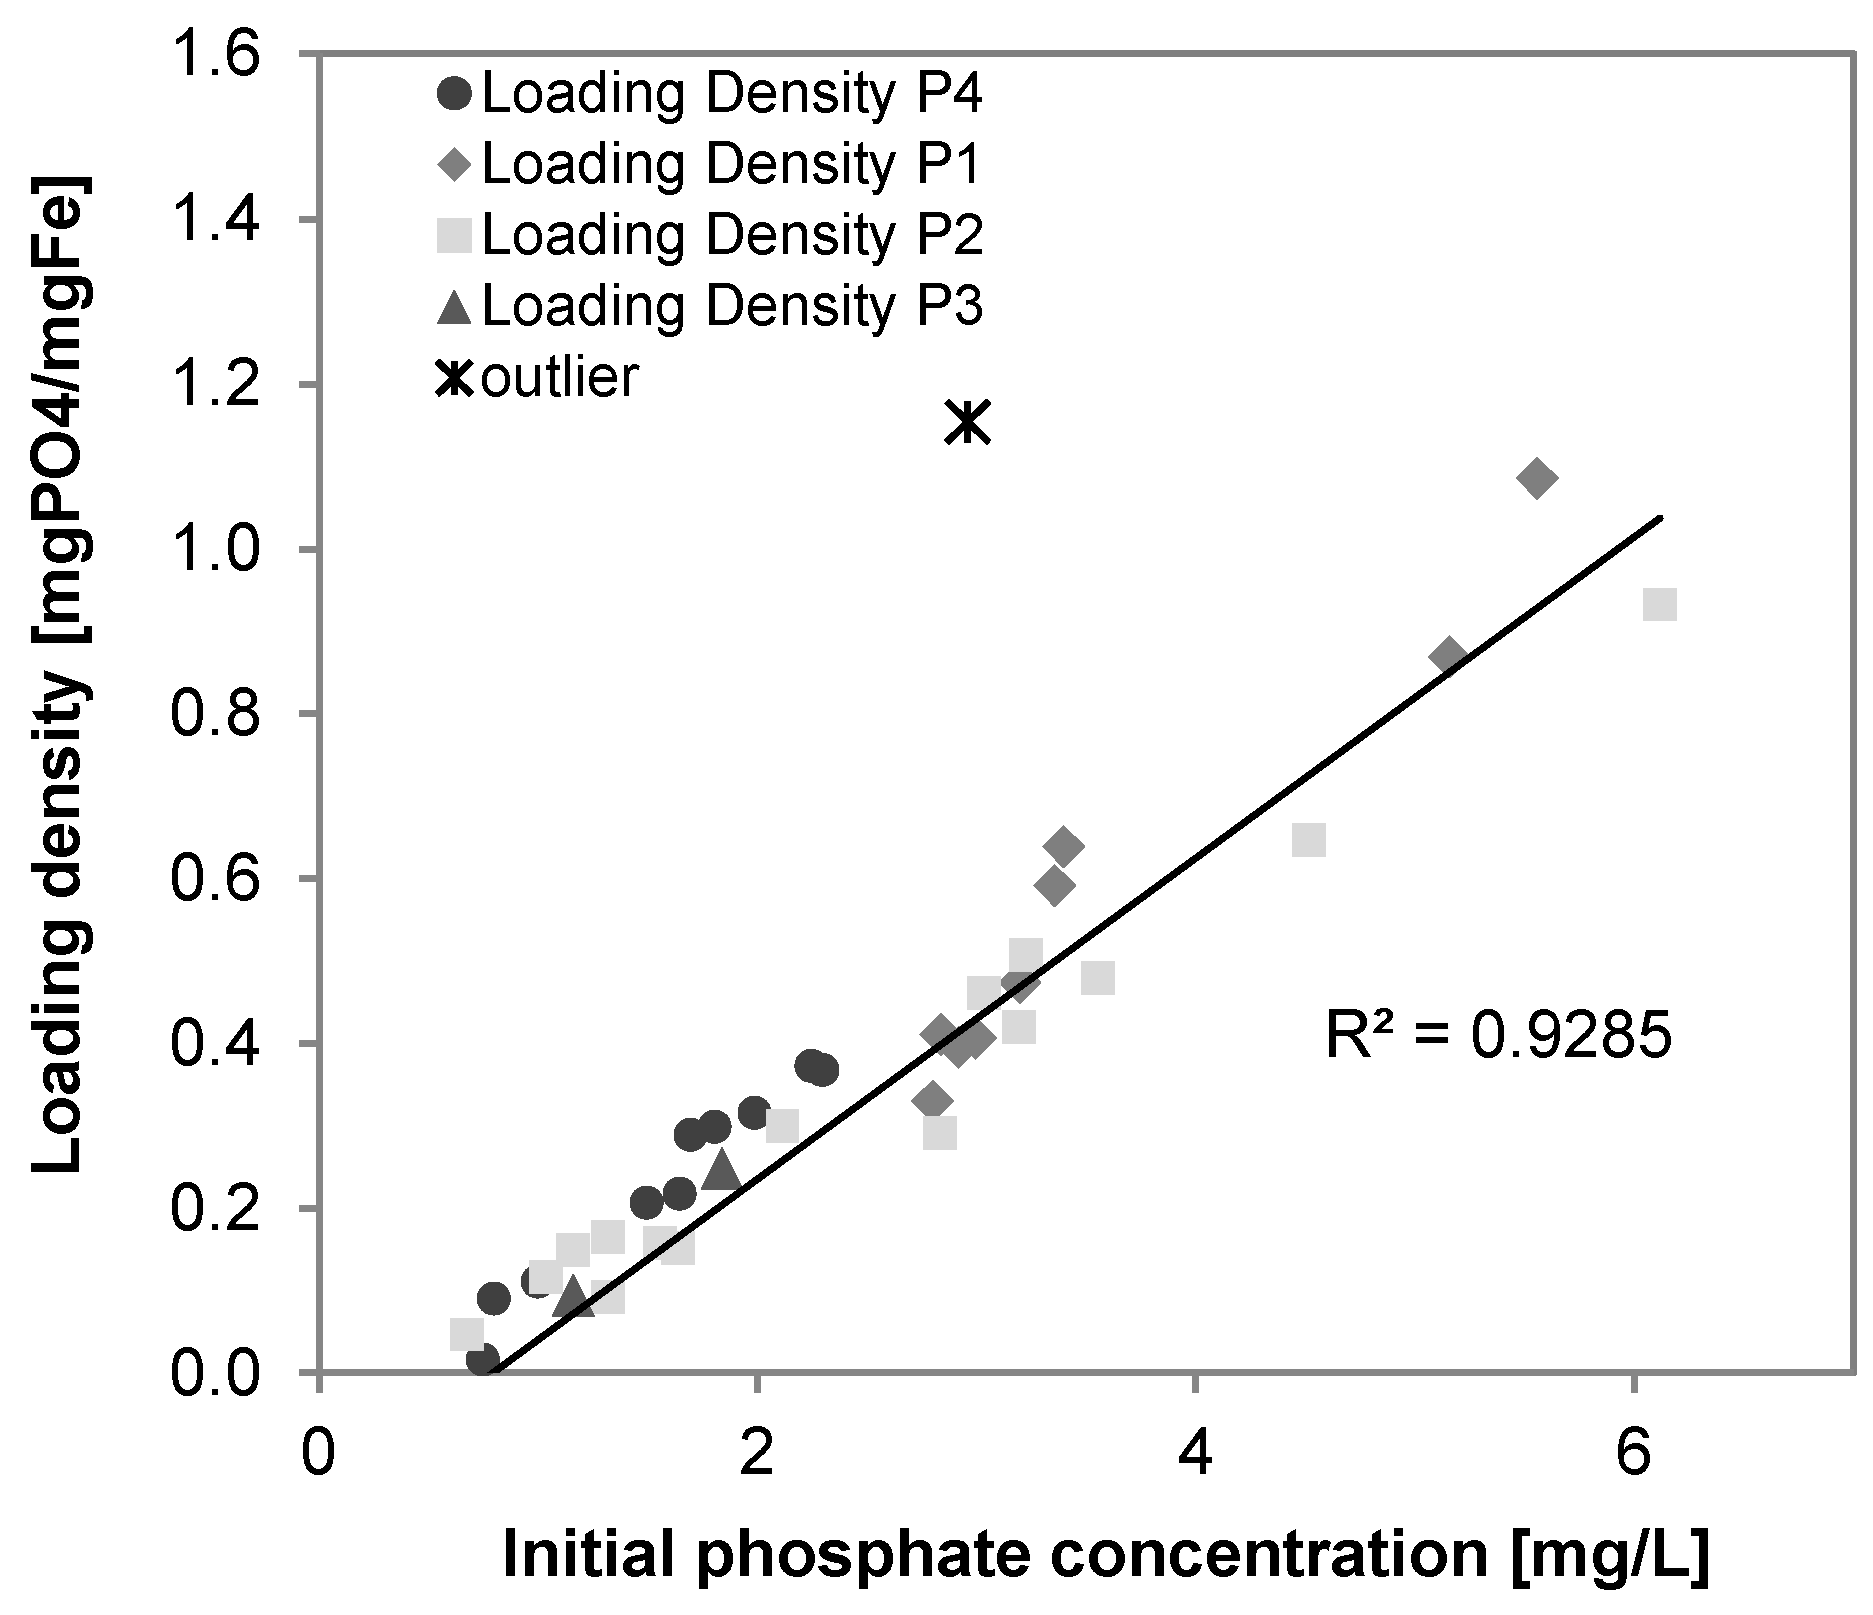
3.6. Phosphate
3.7. Energy Demand
3.8. Operation of the Treatment System
4. Conclusions
- Sufficiently high current density at the electrolytic cell allowing the availability of FAC even under harsh source water conditions to assure full iron, arsenic and manganese oxidation and ammonium removal, or ammonium concentrations ≤1 mg/L.
- A Fe/As ratio of >30:1 should be available before oxidant application, especially when competing phosphate is present.
- Well-adjusted filtration and backwash setting to prevent filter breakthrough as well as advanced crystallization of iron oxy-hydroxide, which may lead to discharge of arsenic.
- Prevention of pre-oxidation of source water prior to in situ oxidant production, to prevent crystallization and clogging.
Supplementary Materials
Supplementary File 1Acknowledgments
Author Contributions
Conflicts of Interest
Appendix A

| Parameter | Phase 1 | Phase 2 | Phase 3 | Phase 4 | ||||||||
|---|---|---|---|---|---|---|---|---|---|---|---|---|
| Ground Water | Treated Water | Removal | Ground Water | Treated Water | Removal | Ground Water | Treated Water | Removal | Ground Water | Treated Water | Removal | |
| Total Arsenic [µg/L] | 202 ± 57 | 36 ± 20 | 80% | 183 ± 43 | 24 ± 8 | 88% | 195 ± 35 | 46 ± 26 | 76% | 165 ± 17 | 10 ± 4 | 94% |
| Total Iron [mg/L] | 5.9 ± 0.5 | 0.2 ± 0.2 | 96% | 5.2 ± 1.0 | 0.2 ± 0.2 | 96% | 5.5 ± 0.4 | 0.7 ± 0.8 | 87% | 5.5 ± 0.7 | 0.03 ± 0.03 | >99% |
| Manganese [mg/L] | 1.50 ± 0.64 | 0.30 ± 0.37 | 83% | 1.79 ± 0.24 | 0.06 ± 0.05 | 96% | 1.46 ± 0.14 | 0.61 ± 0.53 | 58% | 1.31 ± 0.06 | 0.60 ± 0.23 | 55% |
| Ammonium [mg/L] | 1.31 ± 0.63 | 0.34 ± 0.24 | 74% | 1.14 ± 0.16 | 0.18 ± 0.12 | 84% | 1.51 ± 0.27 | 0.67 ± 0.34 | 56% | 1.86 ± 0.28 | 0.96 ± 0.23 | 49% |
| Phosphate [mg/L] | 2.4 ± 1.5 | 0.7 ± 0.3 | 81% | 3.5 ± 0.9 | 0.7 ± 0.2 | 72% | 1.4 ± 0.3 | 0.9 ± 0.5 | 36% | 1.6 ± 0.5 | 0.4 ± 0.1 | 75% |
| Silica [mg/L] | 20.4 ± 4.2 | 19.1 ± 2.4 | 12.3% | 19.5 ± 2.5 | 17.5 ± 0.5 | 4.7% | -- | -- | -- | -- | -- | -- |
| Chloride | -- | 154 ± 32 | -- | -- | 154 ± 49 | -- | -- | 154 ± 50 | -- | -- | 121 ± 31 | -- |
| FAC [mg/L] | -- | 0.10 ± 0.07 | -- | -- | 0.37 ± 0.29 | -- | -- | 0.14 ± 0.20 | -- | -- | 0.16 ± 0.07 | -- |
| Total Cl2 [mg/L] | -- | 0.72 ± 0.83 | -- | -- | 0.51 ± 0.32 | -- | -- | 0.82 ± 0.64 | -- | -- | 1.47 ± 0.62 | -- |
| EC [µS/cm] | 1188 ± 1147 | 1163 ± 53 | -- | 1147 ± 22 | 1102 ± 21 | -- | 1132 ± 14 | 1089 ± 7 | -- | 1180 ± 48 | 1146 ± 44 | -- |
| pH | 6.86 ± 0.06 | 7.00 ± 0.08 | -- | 6.94 ± 0.12 | 7.02 ± 0.21 | -- | 6.83 ± 0.07 | 7.15 ± 0.09 | -- | 6.48 ± 0.15 | 6.67 ± 0.12 | -- |
| ORP [mV] | −92 ± 68 | 473 ± 66 | -- | −91 ± 36 | 701 ± 167 | -- | −93 ± 19 | 313 ± 116 | -- | −97 ± 12 | 399 ± 176 | -- |
| Temperature [°C] | 24.8 ± 1.5 | 24.1 ± 1.4 | -- | 27.9 ± 1.0 | 27.2 ± 0.9 | -- | 25.4 ± 1.1 | 25.2 ± 1.2 | -- | 32.5 ± 3.3 | 32.9 ± 3.4 | -- |
References
- Ferguson, J.F.; Gavis, J. A review of the arsenic cycle in natural waters. Water Res. 1972, 6, 1259–1274. [Google Scholar] [CrossRef]
- Ratnaike, R.N. Acute and chronic arsenic toxicity. Postgrad. Med. J. 2003, 79, 391–396. [Google Scholar] [CrossRef] [PubMed]
- World Health Organization (WHO). Arsenic in Drinking-Water, Background Document for Development of WHO Guidelines for Drinking-Water Quality. Available online: http://www.who.int/water_sanitation_health/dwq/chemicals/arsenic.pdf (accessed on 21 July 2017).
- Herath, I.; Vithanage, M.; Bundschuh, J.; Maity, J.P.; Bhattacharya, P. Natural Arsenic in Global Groundwaters: Distribution and Geochemical Triggers for Mobilization. Curr. Pollut. Rep. 2016, 2, 68–89. [Google Scholar] [CrossRef]
- Nickson, R.T.; McArthur, J.M.; Ravenscroft, P.; Burgess, W.G.; Ahmed, K.M. Mechanism of arsenic release to groundwater, Bangladesh and West Bengal. Appl. Geochem. 2000, 15, 403–413. [Google Scholar] [CrossRef]
- Peryea, F.J. Phosphate-Induced Release of Arsenic from Soils Contaminated with Lead Arsenate. Soil Sci. Soc. Am. J. 1991, 55, 1301–1306. [Google Scholar] [CrossRef]
- Sullivan, C.; Tyrer, M.; Cheeseman, C.R.; Graham, N.J.D. Disposal of water treatment wastes containing arsenic—A review. Sci. Total Environ. 2010, 408, 1770–1778. [Google Scholar] [CrossRef] [PubMed]
- National Research Council. Arsenic in Drinking Water; National Academies Press: Washington, DC, USA, 1999. [Google Scholar]
- Smedley, P.L.; Kinniburgh, D.G. A review of the source, behaviour and distribution of arsenic in natural waters. Appl. Geochem. 2002, 17, 517–568. [Google Scholar] [CrossRef]
- Jiang, J.Q. Removing arsenic from groundwater for the developing world—A review. Water Sci. Technol. 2001, 44, 89–98. [Google Scholar] [PubMed]
- Mazumder, D.N.; Ghosh, A.; Majumdar, K.; Ghosh, N.; Saha, C.; Mazumder, R.N. Arsenic contamination of ground water and its health impact on population of district of Nadia, West Bengal, India. Indian J. Community Med. 2010, 35, 331–338. [Google Scholar] [CrossRef] [PubMed]
- Berg, M.; Tran, H.C.; Nguyen, T.C.; Pham, H.V.; Schertenleib, R.; Giger, W. Arsenic contamination of groundwater and drinking water in Vietnam: A human health threat. Environ. Sci. Technol. 2001, 35, 2621–2626. [Google Scholar] [CrossRef] [PubMed]
- Hug, S.J.; Leupin, O.X.; Berg, M. Bangladesh and Vietnam: Different Groundwater Compositions Require Different Approaches to Arsenic Mitigation. Environ. Sci. Technol. 2008, 42, 6318–6323. [Google Scholar] [CrossRef] [PubMed]
- Jiang, J.-Q.; Ashekuzzaman, S.M.; Jiang, A.; Sharifuzzaman, S.M.; Chowdhury, S.R. Arsenic contaminated groundwater and its treatment options in Bangladesh. Int. J. Environ. Res. Public Health 2012, 10, 18–46. [Google Scholar] [CrossRef] [PubMed]
- Astolfi, E.; Maccagno, A.; Garcia Fernandez, J.C.; Vaccaro, R.; Stimola, R. Relation between arsenic in drinking water and skin cancer. Biol. Trace Elem. Res. 1981, 3, 133–143. [Google Scholar] [CrossRef] [PubMed]
- Del Razo, L.M.; Arellano, M.A.; Cebrian, M.E. The oxidation states of arsenic in well-water from a chronic arsenicism area of northern Mexico. Environ. Pollut. (Barking, Essex: 1987) 1990, 64, 143–153. [Google Scholar] [CrossRef]
- Lepkoski, W.I.L. Arsenic crisis in Bangladesh. Chem. Eng. News 1998, 76, 27–29. [Google Scholar] [CrossRef]
- Department of Public Health Engineering (DPHE). Water Quality Parameters: Bangladesh Standards & WHO Guidelines, Dhaka, Bangladesh. Available online: http://dphe.gov.bd/index.php?option=com_content&view=article&id=125&Itemid=133 (accessed on 19 April 2016).
- Bureau of Indian Standards. Specification for Drinking Water IS 10500: 2012 New Delhi, India; Bureau of Indian Standards: New Delhi, India, 2012. [Google Scholar]
- WHO. Bulletin of WHO Vol. 90 No.11 2012; World Health Organization: Geneva, Switzerland, 2012. [Google Scholar]
- Ahmed, F.; Rahman, M. Water Supply and Sanitation: Rural and Low Urban Communities; ITN Bangladesh: Dhaka, Bangladesh, 2000. [Google Scholar]
- Ravenscroft, P.; Brammer, H.; Richards, K.S. Arsenic Pollution: A Global Synthesis; Wiley-Blackwell: Chichester, UK; Malden, MA, USA, 2009. [Google Scholar]
- Hossain, M.A.; Sengupta, M.K.; Ahamed, S.; Rahman, M.M.; Mondal, D.; Lodh, D.; Das, B.; Nayak, B.; Roy, B.K.; Mukherjee, A.; et al. Ineffectiveness and Poor Reliability of Arsenic Removal Plants in West Bengal, India. Environ. Sci. Technol. 2005, 39, 4300–4306. [Google Scholar] [CrossRef] [PubMed]
- Hossain, M.A.; Muharajee, A.; Sengupta, M.K.; Ahamed, S.; Das, B.; Nayak, B.; Pal, A.; Rahman, M.M. Million dollar arsenic removal plants in West Bengal, India: Useful or not? Water Qual. Res. J. Can. 2006, 41, 216–225. [Google Scholar]
- Bhakta, J.N.; Rana, S.; Jana, J.; Bag, S.K.; Lahiri, S.; Jana, B.B.; Panning, F.; Fechter, L. Current status of arsenic contamination in drinking water and treatment practice in some rural areas of West Bengal, India. J. Water Chem. Technol. 2016, 38, 366–373. [Google Scholar] [CrossRef]
- Meng, X.; Korfiatis, G.P.; Christodoulatos, C.; Bang, S. Treatment of arsenic in Bangladesh well water using a household co-precipitation and filtration system. Water Res. 2001, 35, 2805–2810. [Google Scholar] [CrossRef]
- Nitzsche, K.S.; Lan, V.M.; Trang, P.T.K.; Viet, P.H.; Berg, M.; Voegelin, A.; Planer-Friedrich, B.; Zahoransky, J.; Müller, S.-K.; Byrne, J.M.; et al. Arsenic removal from drinking water by a household sand filter in Vietnam—Effect of filter usage practices on arsenic removal efficiency and microbiological water quality. Sci. Total Environ. 2015, 502, 526–536. [Google Scholar] [CrossRef] [PubMed]
- Jain, C.K.; Singh, R.D. Technological options for the removal of arsenic with special reference to South East Asia. J. Environ. Manag. 2012, 107, 1–18. [Google Scholar] [CrossRef] [PubMed]
- Lytle, D.A.; Sorg, T.J.; Snoeyink, V.L. Optimizing arsenic removal during iron removal: Theoretical and practical considerations. J. Water Supply Res. Technol. Aqua 2005, 54, 545–560. [Google Scholar]
- Frank, P.; Dennis, C. Arsenic(III) Oxidation and Removal from Drinking Water; National Service Center for Environmental Publications: Houston, TX, USA, 1986.
- Ghurye, G.; Clifford, D.A. Laboratory Study on the Oxidation of Arsenic III to Arsenic V; National Risk Management Research Laboratory, Office of Research and Development, U.S. Environmental Protection Agency: Cincinnati, OH, USA, 2001.
- Dodd, M.C.; Vu, N.D.; Ammann, A.; van Le, C.; Kissner, R.; Pham, H.V.; Cao, T.H.; Berg, M.; von Gunten, U. Kinetics and Mechanistic Aspects of As(III) Oxidation by Aqueous Chlorine, Chloramines, and Ozone: Relevance to Drinking Water Treatment. Environ. Sci. Technol. 2006, 40, 3285–3292. [Google Scholar] [CrossRef] [PubMed]
- Bissen, M.; Frimmel, F.H. Arsenic—A Review. Part II: Oxidation of Arsenic and its Removal in Water Treatment. Acta Hydrochim. Hydrobiol. 2003, 31, 97–107. [Google Scholar] [CrossRef]
- Cheng, Z.; van Geen, A.; Jing, C.; Meng, X.; Seddique, A.; Ahmed, K.M. Performance of a Household-Level Arsenic Removal System during 4-Month Deployments in Bangladesh. Environ. Sci. Technol. 2004, 38, 3442–3448. [Google Scholar] [CrossRef] [PubMed]
- Hering, J.G.; Chen, P.-Y.; Wilkie, J.A.; Elimelech, M. Arsenic Removal from Drinking Water during Coagulation. J. Environ. Eng. 1997, 123, 800–807. [Google Scholar] [CrossRef]
- Edwards, M. Chemistry of Arsenic removal during coagulation and Fe-Mn oxidation. Am. Water Works Assoc. 1994, 86, 64–78. [Google Scholar]
- Cao, T.H.; Vu, N.D.; Vo, T.T.T.; Truong, T.M. Arsenic Removal from Water by Chemical Oxidation and Adsorption on in-situ Formed Ferric Hydroxide. In Southeast Asian Water Environment; Fukushi, K., Kurisu, F., Eds.; IWA publishing: London, UK, 2010; Volume 4, pp. 141–146. ISBN 184339362X. [Google Scholar]
- Fuller, C.C.; Davis, J.A.; Waychunas, G.A. Surface chemistry of ferrihydrite: Part 2. Kinetics of arsenate adsorption and coprecipitation. Geochim. Cosmochim. Acta 1993, 57, 2271–2282. [Google Scholar] [CrossRef]
- Sorg, T.J.; Logsdon, G.S. Treatment Technology to Meet the INTERIM Primary Drinking Water Regulations for Inorganics: Part 2; U.S. Environmental Protection Agency, Municipal Environmental Research Laboratory: Cincinnati, Ohio, USA, 1978.
- Feistel, U.; Otter, P.; Kunz, S.; Grischek, T.; Feller, J. Field tests of a small pilot plant for the removal of arsenic in groundwater using coagulation and filtering. J. Water Process Eng. 2016, 14, 77–85. [Google Scholar] [CrossRef]
- Otter, P.; Goldmaier, A. Weltweit sicheres Trinkwasser: Solar- und Wassertechnik ermöglichen neue Lösungsansätze für die Trinkwasserproblematik in Entwicklungsländern. Deutsche Lebensmittel-Rundschau 2014, 110, 54–59. [Google Scholar]
- Kraft, A. Electrochemical Water Disinfection: A Short Review. Platin. Met. Rev. 2008, 52, 177–185. [Google Scholar] [CrossRef]
- Kraft, A.; Stadelmann, M.; Blaschke, M.; Kreysig, D.; Sandt, B.; Schröder, F.; Rennau, J. Electrochemical water disinfection: Part I: Hypochlorite production from very dilute chloride solutions. J. Appl. Electrochem. 1999, 29, 859–866. [Google Scholar] [CrossRef]
- Pressley, T.A. Ammonia-Nitrogen Removal by Breakpoint Chlorination: Report-Nr. EPA-670-2-73-058; U.S. Government Print Office: Washington, DC, USA, 1973.
- Schmidt, S.-A.; Gukelberger, E.; Hermann, M.; Fiedler, F.; Großmann, B.; Hoinkis, J.; Ghosh, A.; Chatterjee, D.; Bundschuh, J. Pilot study on arsenic removal from groundwater using a small-scale reverse osmosis system—Towards sustainable drinking water production. J. Hazard. Mater. 2016, 318, 671–678. [Google Scholar] [CrossRef] [PubMed]


| Oxidant | Advantages | Disadvantages |
|---|---|---|
| Chlorine | Relatively low cost Primary disinfection capability Secondary disinfectant residual MnO2 media regenerant Oxidizes arsenic in less than 1 min | Formation of disinfection by-products possible Special handling and storage requirements |
| Permanganate | Unreactive with membranes No formation of disinfection by-products MnO2 media regenerant Oxidizes arsenic in less than 1 min | Relatively high cost No primary disinfection capability Formation of MnO2 particulates Pink water Difficult to handle An additional oxidant may be required for secondary disinfection |
| Ozone | No chemical storage or handling required Primary disinfection capability No chemical by-products left in water Oxidizes arsenic in less than 1 min in the absence of interfering reductants | Sulfide and TOC interfere with conversion and increase the required contact time and ozone dose for oxidation An additional oxidant may be required for secondary disinfection |
| Chlorine Species | As(III) | Fe(II) | Mn(II) | NH4+ |
|---|---|---|---|---|
| Chlorine (mg Cl2/mg) | 0.95 | 0.64 | 1.29 | 8–10 |
| Monochloramine (mg NH2Cl/mg) | 0.69 | 0.46 | 0.94 | - |
| Parameter | Data Sheet | Applied in Field Test |
|---|---|---|
| Uniformity coefficient | 1.6 | |
| Porosity | 0.45 | |
| Bulk density | 1.4 g/cm³ | |
| Media bed depth | 76 cm | 66 cm (in P4 2 filters) |
| Drainage gravel bed depth | 15 cm | 15 cm (in P4 2 filters) |
| Service flow rate | 5–30 m/h | 50–60 L/h |
| Back wash rate (at 13 °C) | ≥30 m/h | 730 L/h |
| Bed expansion | 40% | 32 cm |
| Automatic backwash intervals | Once per day | |
| Duration and volume of backwash | Until optically clear | 2 × 7 min 170 L |
| Parameter | Minimum/Maximum | Mean ± SD | n | Literature Values ** |
|---|---|---|---|---|
| Astotal in µg/L | 65/330 | 187 ± 45 | 50 | 62 ± 127 |
| Fetotal in mg/L | 2.0/7.6 | 5.5 ± 0.8 | 51 | 3.7 ± 5.4 |
| Mntotal in mg/L | 0.4/3.0 | 1.5 ± 0.4 | 41 | 0.6 ± 0.8 |
| PO4 in mg/L | 0.7/6.1 | 2.4 ± 1.3 | 40 | 2.1 ± 3.6 |
| NH4-N in mg/L | 0.7/2.9 | 1.4 ± 0.5 | 47 | 2.0 ± 1.0 |
| Hardness mg/LCaCO3 | 285/495 | 381 ± 54 | 32 | - |
| Silica as Si in mg/L | 16.8/27.3 | 20.0 ± 3.6 | 14 | 21 ± 6 |
| T in °C | 22.1/39.9 | 27.7 ± 3.7 | 48 | - |
| O2 * in mg/L | 1.8/4.5 | 2.7 ± 0.7 | 53 | - |
| EC in µS/cm | 1299/1087 | 1165 ± 45 | 53 | - |
| pH | 6.23/7.15 | 6.79 ± 0.21 | 53 | 7.0 ± 0.2 |
| ORP in mV | −135/129 | −92 ± 44 | 52 | - |
| Parameter | Wavelength | Method | Range |
|---|---|---|---|
| Fetotal in mg/L | 530 | 222: 1,10-Phenanthroline | 0.02–3 |
| Mntotal in mg/L | 560 | 242: PAN | 0.01–0.7 |
| PO4-P in mg/L | 660 | 323: Phosphomolybdenum blue Ascorbic acid | 0.06–2.5 |
| NH4-N in mg/L | 610 | 60: Indophenole | 0.02–1 |
| Cl− in mg/L | 530 | 90: Silver nitrate/turbidity | 0.5–25 |
| Total Hardness in mg/LCaCO3 | 560 | 200: Metalphthalein | 2–50 |
| Free Chlorine | 530 | 100: DPD1 | 0.01–6 |
| Total Chlorine | 530 | 100: DPD3 | 0.01–6 |
| Consumer | Power | Energy | ||
|---|---|---|---|---|
| Filtration pump | 9 | W | 213 | Wh/day |
| Inline Electrolysis (P2 and P4) | 55 | W | 1320 | Wh/day |
| Control unit and online monitoring | 4 | W | 96 | Wh/day |
| Backwash Pump (20 min/day) | 80 | W | 27 | Wh/day |
| Total demand | 1.64 | kWh/day | ||
© 2017 by the authors. Licensee MDPI, Basel, Switzerland. This article is an open access article distributed under the terms and conditions of the Creative Commons Attribution (CC BY) license (http://creativecommons.org/licenses/by/4.0/).
Share and Cite
Otter, P.; Malakar, P.; Jana, B.B.; Grischek, T.; Benz, F.; Goldmaier, A.; Feistel, U.; Jana, J.; Lahiri, S.; Alvarez, J.A. Arsenic Removal from Groundwater by Solar Driven Inline-Electrolytic Induced Co-Precipitation and Filtration—A Long Term Field Test Conducted in West Bengal. Int. J. Environ. Res. Public Health 2017, 14, 1167. https://doi.org/10.3390/ijerph14101167
Otter P, Malakar P, Jana BB, Grischek T, Benz F, Goldmaier A, Feistel U, Jana J, Lahiri S, Alvarez JA. Arsenic Removal from Groundwater by Solar Driven Inline-Electrolytic Induced Co-Precipitation and Filtration—A Long Term Field Test Conducted in West Bengal. International Journal of Environmental Research and Public Health. 2017; 14(10):1167. https://doi.org/10.3390/ijerph14101167
Chicago/Turabian StyleOtter, Philipp, Pradyut Malakar, Bana Bihari Jana, Thomas Grischek, Florian Benz, Alexander Goldmaier, Ulrike Feistel, Joydev Jana, Susmita Lahiri, and Juan Antonio Alvarez. 2017. "Arsenic Removal from Groundwater by Solar Driven Inline-Electrolytic Induced Co-Precipitation and Filtration—A Long Term Field Test Conducted in West Bengal" International Journal of Environmental Research and Public Health 14, no. 10: 1167. https://doi.org/10.3390/ijerph14101167