Risk Analysis of Earth-Rock Dam Failures Based on Fuzzy Event Tree Method

1
State Key Laboratory of Hydrology-Water Resources and Hydraulic Engineering, Hohai University, Nanjing 210098, China
2
National Engineering Research Center of Water Resources Efficient Utilization and Engineering Safety, Hohai University, Nanjing 210098, China
3
College of Water Conservancy and Hydropower Engineering, Hohai University, Nanjing 210098, China
*
Author to whom correspondence should be addressed.
Int. J. Environ. Res. Public Health 2018, 15(5), 886; https://doi.org/10.3390/ijerph15050886
Submission received: 12 March 2018
/
Revised: 8 April 2018
/
Accepted: 26 April 2018
/
Published: 29 April 2018
(This article belongs to the Special Issue Natural Hazards and Public Health: A Systems Approach)
Abstract
:Earth-rock dams make up a large proportion of the dams in China, and their failures can induce great risks. In this paper, the risks associated with earth-rock dam failure are analyzed from two aspects: the probability of a dam failure and the resulting life loss. An event tree analysis method based on fuzzy set theory is proposed to calculate the dam failure probability. The life loss associated with dam failure is summarized and refined to be suitable for Chinese dams from previous studies. The proposed method and model are applied to one reservoir dam in Jiangxi province. Both engineering and non-engineering measures are proposed to reduce the risk. The risk analysis of the dam failure has essential significance for reducing dam failure probability and improving dam risk management level.
1. Introduction
Earth-rock dams account for more than 90% of all of the 90,000 reservoirs in China, among which nearly 30,000 reservoirs are in operation with defects. The primary problem for decision-makers to solve is how to protect the safety of reservoirs and use the nation’s most limited funds to reinforce the most in-need reservoirs [1]. The use of risk analysis to manage these dams has become an urgent problem in the dam industry [2,3,4]. Dam failure is a low-probability social catastrophic factor, which is extremely harmful. There are great numbers of downstream residents of reservoirs in China. The life loss will be great and intolerable once a dam is damaged. According to statistics, the annual average dam failure rate in China is 8.761 × 10⁻⁴. In the 20th century, the average annual dam failure rate of the world was 2.0 × 10⁻⁴, regardless of war-related reasons, which means the probability of dam failure in China is relatively high [5].
A number of studies are dedicated to investigating dam failures. Hartford et al. [6] provided a contemporary description of evolving techniques for risk-based dam safety management. They presented some new approaches (e.g., ETA method and comprehensive sections on consequence analysis), which are necessary for the estimation of risk and the planning of emergency preparedness. Rong-Yong and Zong-Kun et al. [7,8] analyzed the overflow fuzzy risk on earth dams, which makes the calculation of dam failure probability more reasonable. Graham [9] conducted an extensive evaluation of dam failures and the factors that contributed to loss of life. Masskant [10] found that the consideration of the exact spatial distribution of population growth is essential for reliable estimation of future risk of flooding.
This paper mainly focuses on the risk analysis of earth-rock dams from the probability and life loss model of the dam failure [11,12,13]. In the aspect of dam failure probability, the traditional probability calculation only considers the randomness of the event occurrence and depends on the experience of the experts, but the factors that affect the dam failure are often complicated and fuzzy [14]. Therefore, an event tree analysis (ETA) method based on fuzzy set theory is proposed. Dam failure may cause heavy fatalities, property damage, and environmental deterioration. After calculating the dam failure probability, we also need to analyze the possible life loss caused by the dam failure and establish a life loss assessment model which is suitable for China, so as to serve the dam risk analysis and management.
The establishment of a dam failure probability and a dam failure life loss model is of great significance to reduce the failure risk, improve the ability to deal with sudden break time, reduce life loss, and improve the management level of dams.
2. Causes, Modes and Paths of Dam Failure
Obviously, analysis of dam failures is of critical importance for disasters prevention and mitigation. Hence, an insightful understanding of the characteristics of dam failures (e.g., failure causes, modes, and paths) is needed [15,16].
In different countries and regions, the characteristics and laws of dam failure patterns and dam failure possibilities are different. Therefore, dam failure history information in a certain region is of particular significance for the risk analysis of dams in this region. Through the statistical analysis of the history of dam breakage cases, summarizing the causes and modes of dam failure is highly necessary for reservoir dam risk assessment and emergency measures [17].
2.1. Statistical Analysis of Dam Failure Data
At present, many countries in the world have a large number of reservoir dams. Among them, many dams have caused heavy loss of life due to dam failure, as shown in Table 1 [18,19]. These dam failure events have shocked the world and should be studied in-depth.
Since the 1960s, there have been many serious dam failure events in China [20], as shown in Table 2. We should investigate the dam failure events that have caused heavy loss of life, clarify the situation of life loss, and summarize its rules. It can be used for significant reference to estimate the fatalities reasonably and to reduce life loss in the future.
According to the statistics in [21], the dam failure cases comprise earth dams, concrete dams, masonry dams, rockfill dams, and so on. Figure 1 compares the percentages of these types of dams in the world (excluding China) and in China. It clearly shows that the majority of cases are earth-rock dams, which account for 70.0% of dams in the world (excluding China) and 93.9% in China. Therefore, this paper chooses an earth-rock dam for failure analysis.
Earth-rock dam, one of the oldest dame types, generally refers to a dam that is constructed with local soil, stone, or mixture through throwing and rolling, etc. Such a dam has various risks in the operation, while dam failure is the most critical. Due to the complexity of the hydrogeographical environment, meteorology, hydrodynamic forces and structure of the dam, many factors can lead to dam failure. Therefore, it is very important to study the causes, modes, and paths in the earth-rock dam failure probability calculation.
2.2. Causes and Modes of Earth-Rock Dam Failure
The earth-rock dam is the dam type with the largest number of calamities and highest dam failure rate. According to the failure mechanism, these can be divided into several types: lack of flood control capacity, insufficient structural stability, seepage damage, and several other conditions. The main failure modes are dam foundation failure, overtopping, slope instability, spillway failure, and internal erosion, as shown in Figure 2 [22,23,24,25].
3. Establishment of Analysis Models
3.1. Event Tree Analysis (ETA)
Event tree analysis (ETA) is a logic method, either qualitative and quantitative, that is used to identify possible outcomes. ETA is widely used as a ‘pre-accident’ analysis technique that examines the systems in place, which would prevent accident precursors from developing into accidents. It can also be used as a ‘post-accident’ analysis technique that identifies consequences of an accident sequence. The application of the ETA method in dam safety, where accident initiation is postulated, is used to illustrate how various subsequent events and scenarios evolve [26].
The risk analysis of dams with the ETA method is based on a condition or load condition. By using the tracing method, the various elements of the dam and how the failure happened under the load condition are logically analyzed. Thus, the estimation of overall dam failure probability is available. The ETA method is constructed as shown in Figure 3, which attempts to generate all the resultant events caused by some excitation events such as earthquake, flood, and internal defect:
The ETA method provides a logical and graphical means to illustrate the sequence of events from an initiating event to the complete set of possible outcomes. The risk analysis of dam failure with the ETA method can help us to not only understand the overall process of the system change and identify possible accidents in advance, but also take measures to effectively avoid or reduce the incidence of accidents. According to the frequency of each risk factor occurrence, the probability of dam failure can be calculated.
However, the ETA method sometimes has less objective basis in estimating the probability of the event in every link of dam failure development. There is little historical data available for reference, most of which requires the experience of experts. The factors affecting dam failure are complicated and often fuzzy. In view of this, this paper also takes the fuzzy set theory into consideration to analyze the risk of earth-rock dam failure.
3.2. Fuzzy Set Theory
The concept of fuzzy set was proposed by Zadeh in 1965. The fuzzy set denotes the set of characteristic things with uncertain boundary [27]. For a fuzzy set A on the final field X, there is a corresponding to . is the membership degree of x to A and is the membership function of fuzzy set A.
3.2.1. Concept of Fuzzy Numbers
Fuzzy numbers are used to deal with some fuzzy and inaccurate information, such as the “very likely” and “unlikely” language used by experts in the risk analysis of earth-rock dams which need to be quantified with fuzzy numbers combined with membership functions. In this paper, fuzzy numbers are divided into triangular fuzzy numbers and trapezoidal fuzzy numbers [28,29].
A triangular fuzzy number is expressed as , whose membership function is
A trapezoidal fuzzy number is expressed as , whose membership function is
3.2.2. Operation of Fuzzy Numbers
For a given number , the -cut of fuzzy set A and B can be expressed as
Then the operation between fuzzy sets can be achieved by their -cut sets:
3.2.3. Non-Fuzzification of Fuzzy Language of Experts
For the ETA of dam failure, experts often use fuzzy language for qualitative evaluation. Usually, we need to transform the fuzzy language of experts into quantitative analysis and then evaluate the safety of reservoir dams comprehensively. For the probability of dam failure, the fuzzy language can be divided into seven types: ‘Extremely unlikely’, ‘Very unlikely’, ‘Less likely’, ‘Uncertain’, ‘Likely’, ‘Very Likely’, and ‘Extremely Likely’. The fuzzy numbers and corresponding -cut sets of them are expressed in Table 3 [30]:
The membership function is expressed in Figure 4:
Meanwhile, in the process of organizing experts’ empowerment analysis, it is also necessary to analyze the credibility of different experts. In this paper, the credibility of the expert, also known as the weight of experts, is expressed as . represents the expert being the most trusted and represents the expert being the least trusted. In this paper, the credibility of the expert is determined from four aspects: educational degree, professional title, professional direction, and length of service. The criteria for determining the credibility of an expert are shown in Table 4:
If (j =1,2,3,4) is used to represent the evaluation scores of experts in four aspects: educational degree, professional title, professional direction and length of service, the credibility of each expert can be expressed as follows:
3.2.4. Integral Value Method of Non-Fuzzification for Fuzzy Number
After obtaining the corresponding -cut sets of fuzzy numbers, the integral value method proposed by Liou is used to calculate the fuzzy numbers [31].
where is the index of optimism, . and are the inverse function of left and right integral values of A respectively.
where and is upper bound and lower bound of -cut sets of A. The upper and lower bounds of the fuzzy number A are respectively corresponding to and . The value of the fuzzy number is representative when .
3.3. Application of Dam Failure Risk Analysis
The application of the ETA method based on fuzzy set theory in dam failure risk analysis of an earth-rock dam can be summed up in the following steps [32]:
- (1)
- In view of the probable dam-breaking event, analyze the various accident paths and the accident links of the dam and establish the event tree structure chart.
- (2)
- Calculate the probability of dam failure for all dam-breaking paths under each load condition.
Invite experts to carry out a qualitative assessment of the accident. By using the ETA method of fuzzy set theory, the expert qualitative language is converted into quantitative value. The probability of each failure link in the accident path is obtained. Finally, the probability value of the dam in a burst mode is obtained by multiplying the probabilities of each failure link. The conditional probability of each link in a burst mode is . where i is the reservoir water level load, j is the failure mode and k represents for each aspect. Then, the probability of burst under the I type load and j type failure mode is
- (3)
- Under the same load, the failure mode of the dam can be independent, at which time the deMorgan law can be used to calculate the burst probability under the same load.
- (4)
- Repeat the above steps for different loads on the dam to obtain all possible dam-breaking paths and their probabilities under all possible load conditions. Assuming that the dam failures under different loads are independent of each other, the probability of the dam collapse under all different loading conditions is added, that is, the total dam probability of the dam is obtained.
3.4. Estimation Model of Dam Failure Life Loss
Evaluating the consequences of a dam failure is extremely important in the dam safety study. Dam failure can cause catastrophic losses such as life loss, property loss, environmental loss, and so on. The most important part is the loss of life. This paper focuses on estimating fatalities of a dam failure.
The estimation of dam failure life loss is affected by many factors [9]. Among these are cause and type of dam failure; number of people at risk; severity of dam break flood; timeliness of dam failure warnings; occurrence time of dam failure; ease of evacuation.
Graham summarized the seven basic steps to evaluate the dam failure life loss, which are still widely used at present. Ke-fa et al. [33,34] conducted an in-depth discussion and analysis on a large amount of data of eight dam failures that have occurred in the history of China. They summarized the basic law of the loss of life and proposed a life loss estimation method, which is suitable for Chinese conditions. In this paper, based on this method, combined with the actual situation of the studied reservoir, the potential loss of life caused by the dam failure will be evaluated.
3.4.1. Estimation Model Parameters of Dam Failure Life Loss
Dam-break loss of life is a result of complex factors, usually divided into population at risk (PAR), severity degree of dam break flood (SD), occurrence time of dam failure, warning time (WT), and understanding of PAR to SD.
- (1)
- Population at risk (PAR)
Population at risk refers to the number of people in the area covered by the dam-breaking flood. The larger the total population at risk is, and the closer it is to the dam site and main channel, the greater the resulting loss of life will be. PAR can be determined by survey statistics and population registration data:
where i means a residential area and PARi means population of the residential area.
When considering the PAR, other factors such as population composition, living environment, escape route, and emergency rescue capability should also be taken into consideration in order to obtain more appropriate results.
- (2)
- Severity degree of dam failure flood (SD)
SD refers to the damage degree of dam failure flood to the downstream residents and buildings, which is related to dam type, storage capacity, and discharging flow. SD is usually represented by the D × V value of the water depth and the velocity of a section:
- (3)
- Warning time (WT)
Warning time refers to the time from the moment of the dam failure warning to the time when the downstream masses retreated after receiving the instruction. It has an important influence on the amount of loss of life. WT can generally be divided into three categories:
- (4)
- Occurrence time (OT)
Occurrence time of dam failure has a significant impact on the PAR and WT. According to the weather, occurrence time can be divided into sunny and rainy days; according to the time of day, it can be divided into daytime and night; according to the season, it can be divided into winter and summer.
OT is very important in the evaluation of life loss. If the dam break occurs on sunny days the traffic will be better; during the daytime, it is more easily found by the staff; if the dam break occurs in summer, it is good for the evacuation of PAR.
- (5)
- Understanding of PAR to SD (UD)
Understanding of SD for PAR will affect the success rate of rescue methods, which is an important aspect in estimation of in dam failure life loss. UD can be divided into two types: (1) UD is fuzzy: the population at risk cannot understand the severity degree of the dam break flood when they get the warning and they do not know the necessity, measure, and path of escape. (2) UD is explicit: the population at risk can understand the severity degree of the dam break flood clearly and can take the necessary measures of escape clearly.
3.4.2. Calculation of Estimation Model of Dam Failure Life Loss
Based on the Graham method and combined with the situation of dams in China, this paper adopts the method of estimating the loss of life of dam failure in China proposed by Lei [33].
This calculation model mainly considers three parts: the number of population at risk (PAR), the risk mortality rate suitable for China f, and the corresponding correction coefficient . The formula is as follows:
where the value of f is determined according to Table 5.
Remarks: when it is sunny daytime, the upper limit is recommended and when it is rainy night, the lower limit is recommended.
4. Engineering Examples
4.1. Project Introduction
4.1.1. Project Overview
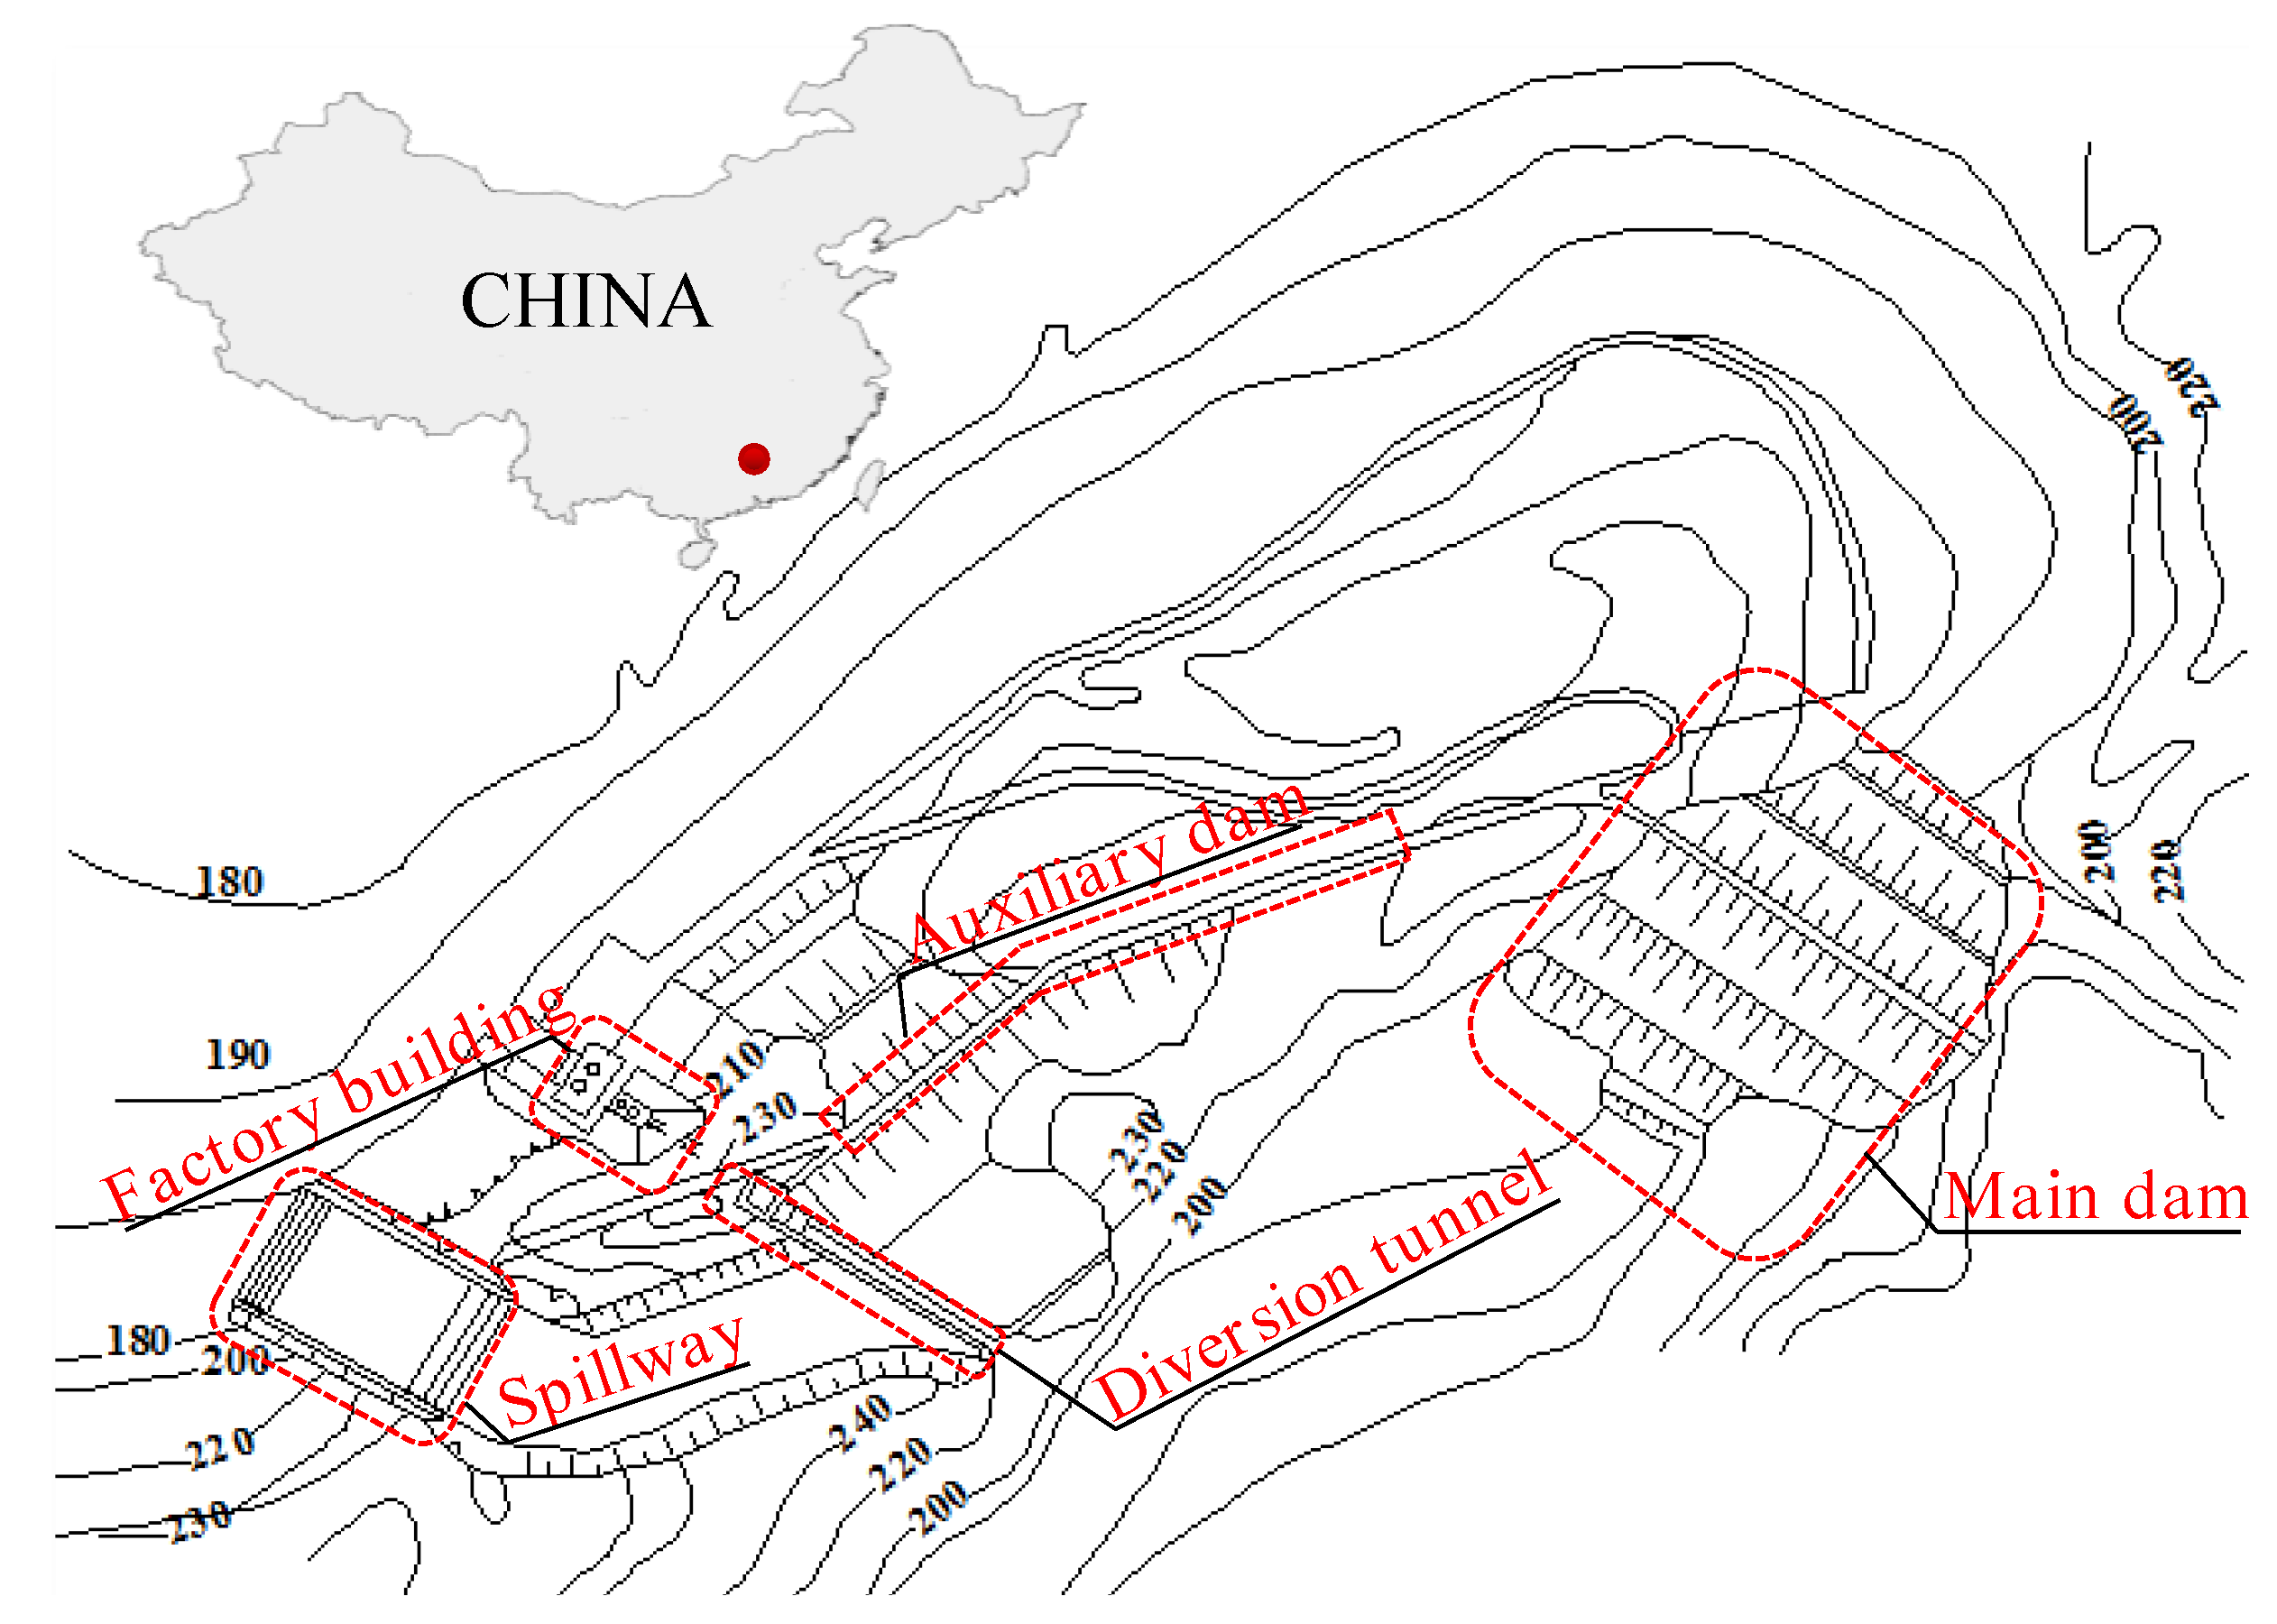
Located in the upper reaches of the Zhangjiang River, Ganzhou city, Jiangxi province, a hydropower project is large (2) type of water conservancy project dominated by flood control [35]. Reservoir total capacity is 1.19 × 10⁸ m3 at the normal pool level of 220.00 m. The checked flood level is 223.70 m and dead water level is 209.00 m.
In March 2004, the dam was identified as a third-type dam, which would be reinforced in 2008. This paper analyzed the probability of dam failure and the life loss model based on the data before the reinforcement work, aiming to analyze the risk of dam failure before reinforcement and to improve the safety management level. This analysis will provide a significant reference for other dam analyses.
The layout plan of the reservoir project is shown in Figure 5:
The dam is a roller thick clay core earth dam with a crest elevation of 226.0 m, a maximum dam height of 36.0 m, a crest width of 5.0 m, and a crest length of 177.0 m. The dam typical cross-section structure dimensions are shown in Figure 6.
4.1.2. Main Problems of the Dam
- (1)
- Main dam: Severe leakage in the dam body, prominent by-pass seepage, severely weathered slope protection rock with the danger of landslide.
- (2)
- Auxiliary dam: Existence of permeable layer because of the deficient foundation clearance, the probability of infiltration and damage of left bank, weak anti-seepage function of inclined wall.
- (3)
- Spillway: Serious erosion, cracks and tendons in the spillway pier and concrete shaft of the spillway, seriously deterioration of gates and electrical facilities.
4.2. Analysis of Dam Failure Probability
4.2.1. Dam Failure Modes and Paths
According to former data, the failure of earth-rock dams in China is mainly based on three conditions: (1) Failure of the dam structures caused by the water load in non-flood season, such as seepage failure; (2) Serious floods in flood season which cause dam collapse, such as overtopping, seepage damage, slope landslides, and so on; (3) The dam collapse caused by an earthquake, such as seepage damage, structural failure, and so on. As for the dam area reference, the basic earthquake intensity is less than 6 degrees in this area. This paper does not consider the dam failure caused by the earthquake load according to the relevant norms.
Aiming at the dam failure caused by the water load in flood season and non-flood season, this paper screens and analyzes all the dam failure modes and get the main failure modes and damage paths as follows [36,37,38]:
- (1)
- Non-flood season loadLeakage of main dam foundation–Piping–Manual intervention–Invalidation of intervention–dam failure;Leakage of auxiliary dam foundation–Piping–Manual intervention–Invalidation of intervention–dam failure;By-pass seepage of auxiliary dam shoulder–Piping–Manual intervention–Invalidation of intervention–dam failure;
- (2)
- Flood season loadFlood–Leakage of main dam foundation–Piping–Manual intervention–Invalidation of intervention–dam failure;Flood–Leakage of auxiliary dam foundation–Piping–Manual intervention–Invalidation of intervention–dam failure;Flood–By-pass seepage of auxiliary dam shoulder–Piping–Manual intervention–Invalidation of intervention–dam failure;Flood–By-pass seepage of auxiliary dam sloping core–Piping–Manual intervention–Invalidation of intervention–dam failure;Flood–Failure of spillway structure–Breach expanded–Manual intervention–Invalidation of intervention–dam failure;
4.2.2. Calculation of Dam Failure Probability
The reservoir is designed according to the 500-year flood (P = 0.2%) and checked according to the 5000-year flood (P = 0.02%). When we select the characteristic load value of the dam, we select the normal water level 220.00 m as the non-flood load value with the frequency of 1.0 and the check flood level 223.70 m as the flood load with the frequency of 0.02%.
The key to estimating the risk rate of dam failure by using the ETA method of fuzzy set theory is to calculate the probability of each link accident.
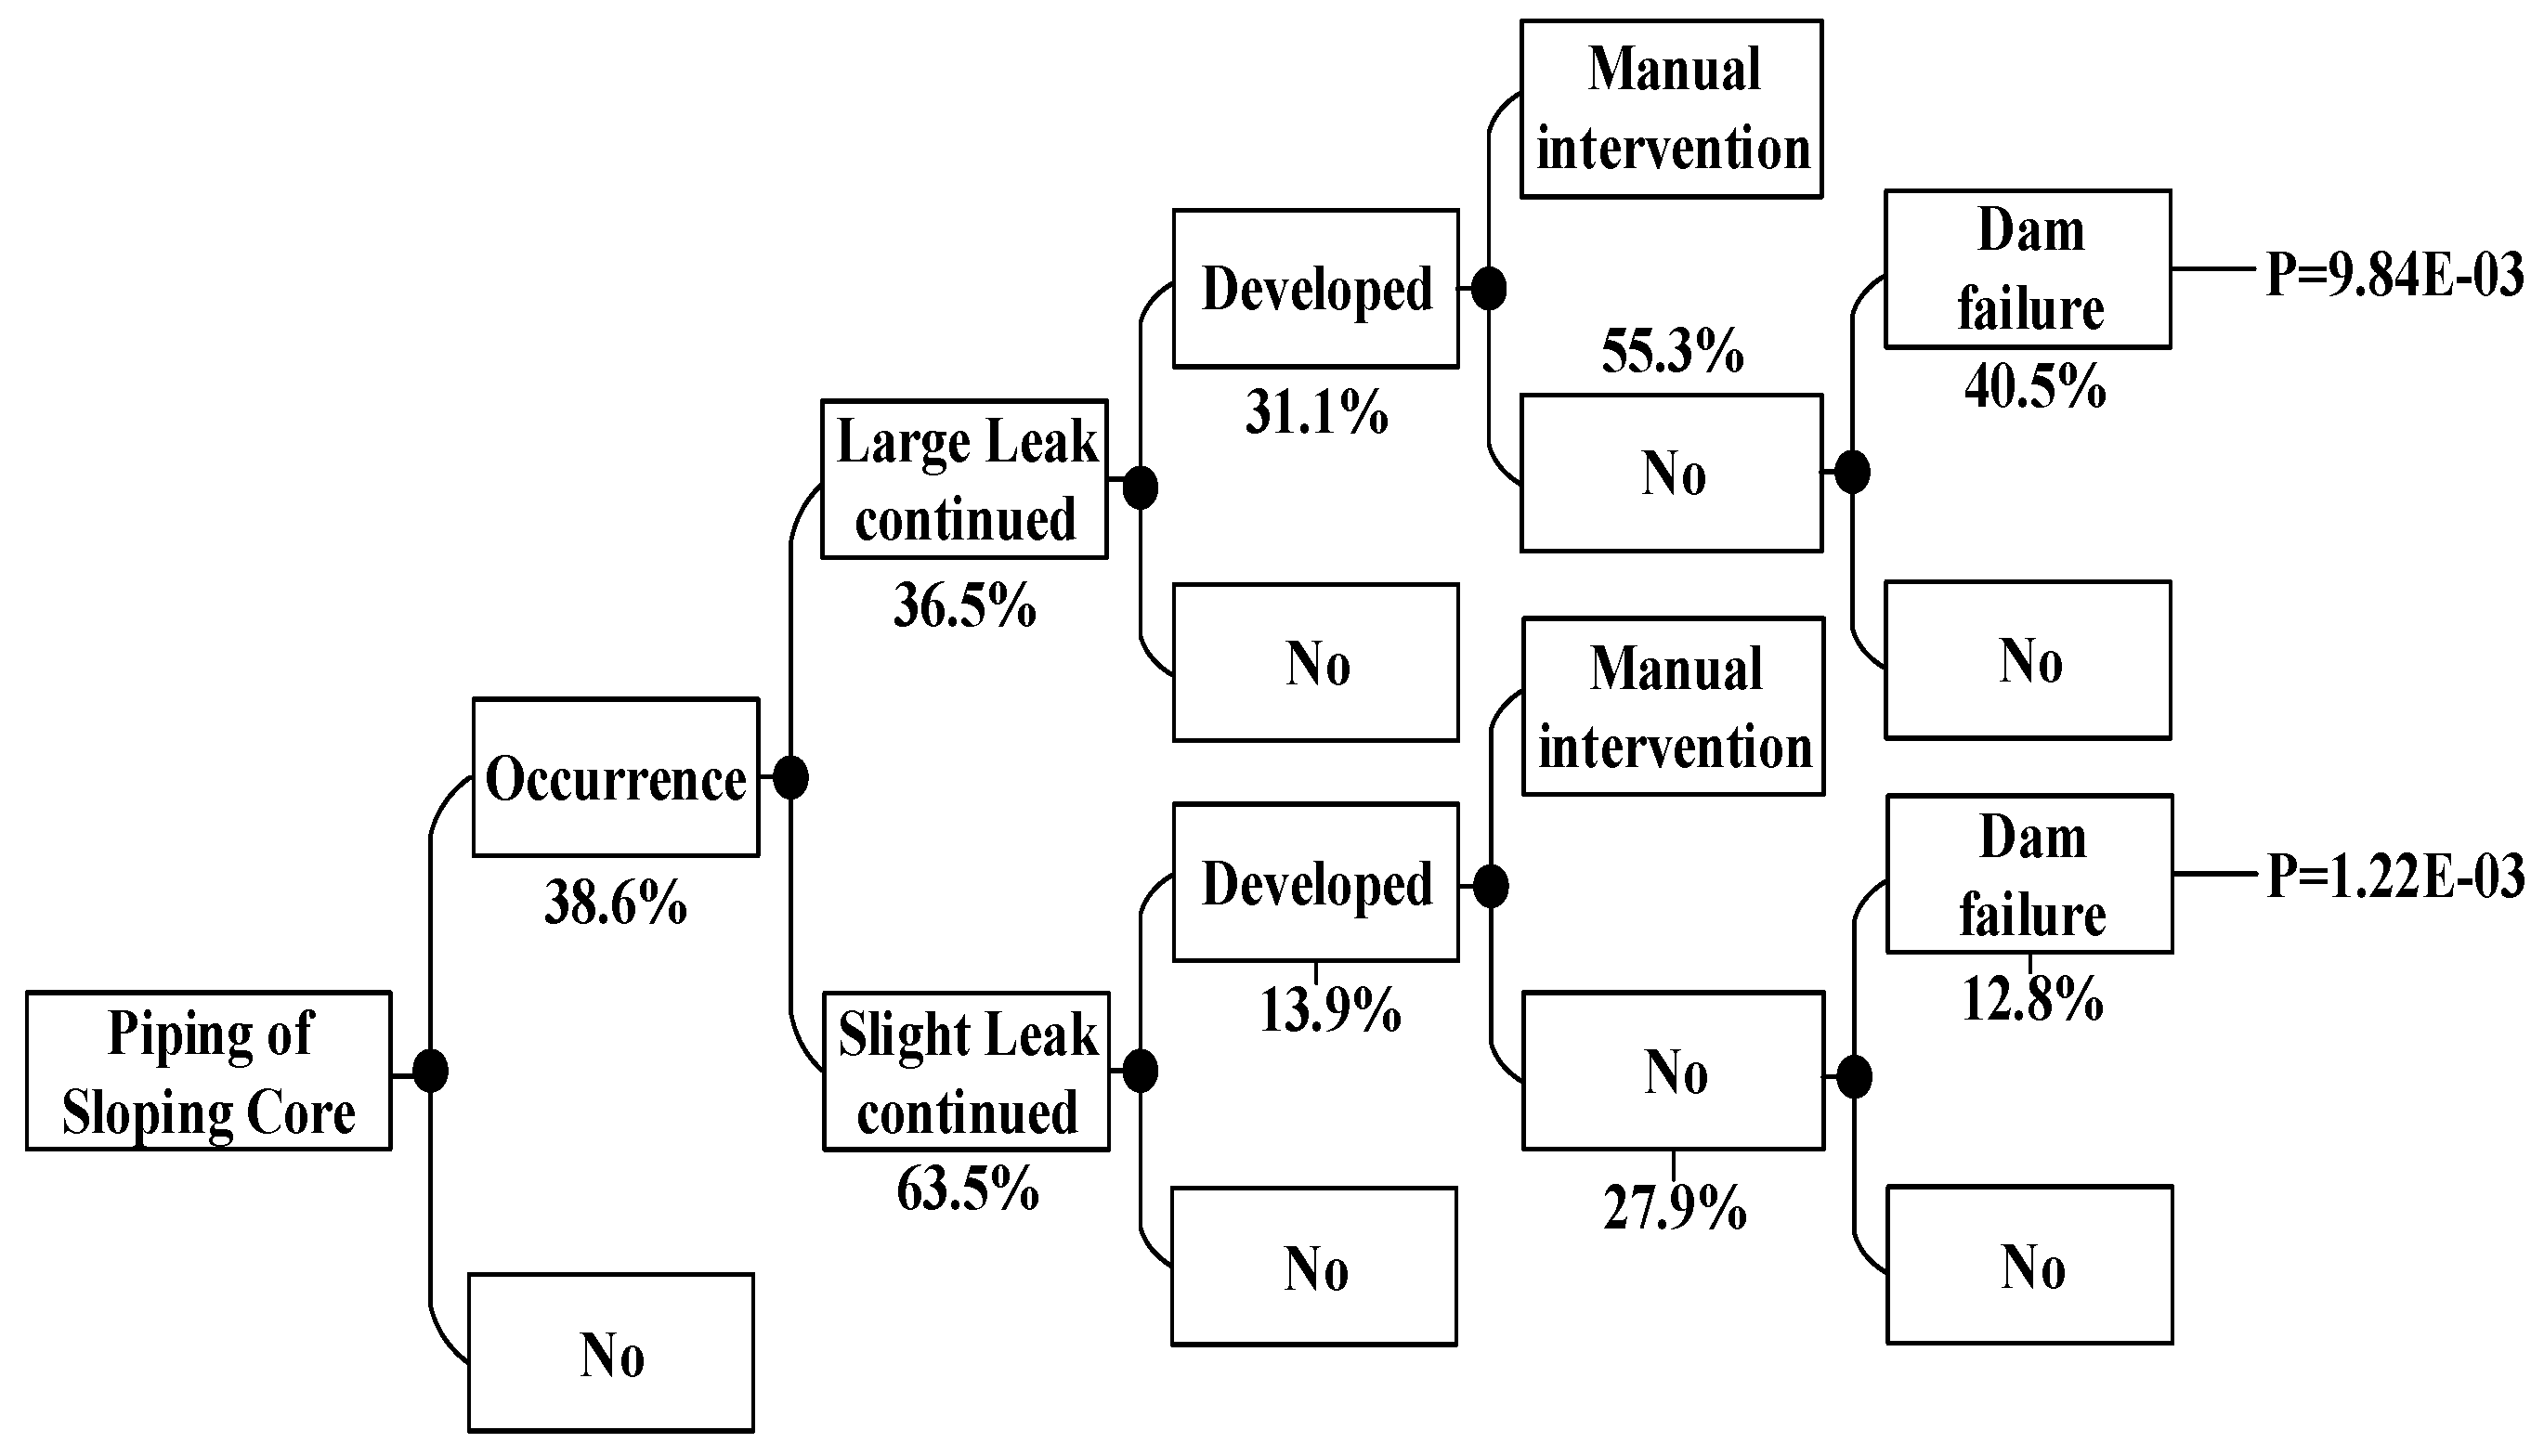
According to the dam failure mode and the dam break path, the event tree of the dam failure is constructed. This paper takes the case of the piping of the auxiliary dam shoulder under the condition of 223.70 m water level in flood season as an example.
Combined with the judgment of five experts (E1, E2, E3, E4, E5), the probabilities of each part of dam failure under this condition are calculated in Figure 7.
The five experts respectively evaluated D1, D2, D3, D4, D5, D6, D7, and D8 of each link of the piping event tree of the auxiliary dam shoulder [39]. The fuzzy probabilities are shown in Table 6.
Considering that different experts have different understandings of the actual operation status of the dam, there are differences among experts in terms of their level of knowledge, professional standards, personal experience ability, and other factors. In order to reduce the influence of expert subjectivity on the calculation results, this paper uses the weight coefficient of five experts to revise the evaluation and get the final evaluation results [40].
where Pi represents result of the expert’s comprehensive evaluation of event i, represents the weighting coefficient of the event i of the j-th expert’s evaluation, and Eij represents the evaluation result of the i-th event by the j-th expert.
The weight coefficient of experts can be calculated by 1~9 scale judgment matrix, and the judgment matrix must meet the consistency requirement, otherwise it should be rebuilt. The judgment matrix of experts are shown in Table 7.
The estimated values of the fuzzy numbers in each link of the auxiliary dam shoulder are respectively:
The calculation result is substituted by the Formulas (6) and (7) to calculate the fuzzy numbers. By adopting the integral value method proposed by Liou to calculate the fuzzy numbers, the fuzzy probability of each link of the auxiliary dam shoulder is obtained. Where and respectively correspond to the upper and lower bounds of the fuzzy numbers of the failure probability PL and PU. When , the calculated value obtained is the probability value P of the accident link. The following Table 8 is available:
The probability of the auxiliary dam shoulder failure is:
Considering the occurrence frequency of a flood season load of 223.70 m water level is 0.02%, the risk rate of the earth-rock dam with the water level of 223.70 m in the flood season and the dam failure occurring is:
4.2.3. Calculation of Dam Failure under Different Load Conditions
According to the method above, the dam failure probabilities occurring under other conditions can be obtained, which are shown in Figure 8, Figure 9, Figure 10, Figure 11, Figure 12, Figure 13, Figure 14 and Figure 15.
According to the above ETA method based on fuzzy set theory, we can summarize the dam failure probabilities under non-flood season and flood season load in Table 9:
The probability of the dam failure is 1.16 × 10⁻⁴, which is higher than the maximum probability of collapse estimated by the Bureau of Reclamation 10−4; thus, measures should be taken to reduce the failure probability. Table 9 shows that the main dam failure mode is the main dam foundation piping and the auxiliary dam foundation piping. The analysis results are consistent with the actual conditions of the dam. In view of the analysis results, we should focus on strengthening the reinforcement of main dam foundation and auxiliary dam foundation. During the flood season, strengthening the monitoring of flood data and paying attention to the reinforcement of the spillway are necessary.
4.3. Estimation Model of Dam Failure Life Loss
Dayu County, a total area of 1367.63 km2, administers 11 townships. In 2006, the county’s resident population was 291,969, with an average population density of 214 persons/km2. The population and the buildings are dense.
4.3.1. Determination of Influencing Factors
- (1)
- Population at risk (PAR)
First, identify the population at risk (PAR). According to the flooding range of dam break floods, the following Table 10 is obtained according to the government statistics on the population distribution of the submerged area. Among them, the number of PAR in the daytime and night are different; the impact factors are 0.5 and 0.8 respectively.
- (2)
- Severity degree of dam break flood (SD)
Calculate the average D × V value of the submerging range’s administrative area, as shown in the following Table 11:
- (3)
- Warning time (WT)
The calculated area is relatively small, with only Fujiang township and Nan’an Town. Modern communications are more developed. Therefore, it is assumed that the flood warning time (WT) is the same, divided into: 0~0.25 h, 0.25 ~1.0 h, and beyond 1.0 h.
- (4)
- Occurrence time (OT)
This simulated dam break occurs only in the daytime and night conditions, and other conditions such as weather and season are temporarily not taken into consideration.
- (5)
- Understanding of PAR to SD (UD)
4.3.2. Estimation of Dam Failure Life Loss
The formula of estimation of dam failure loss of life (LOL) is as follows:
where f is according to the Figure 5. For the dam considered in this paper, the corresponding correction coefficient is as follows according to the relevant information, which is shown in Table 13.
Then, we can make the estimation according the formula above. The results of the estimation of dam failure loss life are shown below.
In general,
Combined with the calculation results from 3.2, the dam has a 1.16 × 10⁻⁴ probability of dam failure. The possible loss of life in this case is estimated as shown in Table 18.
As can be seen from the Table 14, Table 15, Table 16,Table 17 and Table 18, the life loss (LOL)of dam failure is most affected by the warning time (WT), and the occurrence time (daytime or night) also has great influence. Therefore, the dam workers should strengthen safety monitoring (especially in flood season) and improve the warning time. It is highly necessary to ensure WT is longer than one hour, which can significantly reduce the loss of life of dam failure. According to the social risk standard F-N reference map of China reservoir dams, the calculated risk of life loss is higher than 1.1 × 10⁻³, which is an intolerable risk. So the dam reinforcement project should also be carried out, which is consistent with the 3.2 research conclusion.
In the event that dam engineering facilities cannot be changed and dam-breaking floods cannot be perfectly predicted, we need to strengthen the management of non-engineering measures in order to reduce the dam failure life loss. Some suggested actions below can be taken into consideration:
- (1)
- Evacuate residents in times of flood season and minimize the risk to the population;
- (2)
- Strengthen the monitoring work (especially in the flood season), improve the capability of early warning of dam breakage, and increase the warning time, which must be more than one hour;
- (3)
- Strengthen the liaison among downstream residents to ensure smooth communication;
- (4)
- Improve the level of contingency plans, ensure the availability of traffic in the submerged area and enhance the rescue capability after dam failure.
5. Conclusions
This paper conducted the risk analysis of an earth-rock dam failure, which involves several complicated factors. Based on the analyzed results, the following can be concluded.
- (1)
- After considering various factors affecting the dam safety, a new model with the ETA method based on fuzzy set theory is proposed for the dam failure analysis, and good results were achieved. By using the ETA method, the probability of each link of dam failure mode can be clearly evaluated. Combined with fuzzy set theory, experienced experts are invited to carry out the evaluation and analysis. The main failure modes of the dam in non-flood season are the main dam and auxiliary dam piping, and in flood season the spillway failure needs to be considered. The project reinforcement should be carried out in a targeted manner.
- (2)
- After considering other scholars’ estimation model of life loss, population at risk (PAR), severity degree of dam break flood (SD), warning time (WT), occurrence time (OT) and understanding of PAR to SD (UD) are taken into consideration as well as the corresponding correction coefficient . The new estimation model is applied to a specific project and the expected dam failure life loss exceeds the standard requirements. Some non-engineering measures are proposed with a view of reducing the dam failure life loss.
In summary, the dam risk is already at a high stage. It is highly necessary to reinforce the project in addition to strengthening the flood season monitoring and raising the warning time.
The dam failure risk analysis model proposed in this paper has been successfully applied to a specific water conservancy project and achieved good results. For other dams, the analysis model can also be applied to improve the operation of dam management.
Author Contributions
All authors named on the manuscript have made a significant contribution to this work. X.F. contributed to the conception of the study; C.-S.G. contributed significantly to analysis and manuscript preparation; X.F. performed the data analysis and wrote the manuscript; H.-Z.S. and X.-N.Q. helped perform the analysis with constructive discussions.
Acknowledgments
This work was supported by National Key R&D Program of China (2016YFC0401601, 2017YFC0804607), National Natural Science Foundation of China (Grant Nos. 51739003, 51479054, 51779086, 51579086, 51379068, 51579083, 51579085, 51609074), Project Funded by the Priority Academic Program Development of Jiangsu Higher Education Institutions ( YS11001), Jiangsu Natural Science Foundation (Grant No. BK20160872), Special Project Funded of National Key Laboratory(20145027612, 20165042112), Key R&D Program of Guangxi (AB17195074), Central University Basic Research Project (2017B11114), the Fundamental Research Funds for the Central Universities (Grant No. 2017B617X14), Postgraduate Research & Practice Innovation Program of Jiangsu Province (Grant Nos. KYCX17_0424, KYZZ16_0283).
Conflicts of Interest
The authors declare no conflict of interest.
References
- Yang, M.; Qian, X.; Zhang, Y.; Sheng, J.; Shen, D.; Ge, Y. Spatial Multicriteria Decision Analysis of Flood Risks in Aging-Dam Management in China: A Framework and Case Study. Int. J. Environ.l Res. Public Health 2011, 8, 1368–1387. [Google Scholar] [CrossRef] [PubMed]
- Hall, J.W.; Sayers, P.B.; Dawson, R.J. National-scale Assessment of Current and Future Flood Risk in England and Wales. Nat. Hazards 2005, 36, 147–164. [Google Scholar] [CrossRef]
- Balmforth, N.J.; Von Hardenberg, J.; Provenzale, A.; Zammett, R. Dam breaking by wave-induced erosional incision. J. Geophys. Res. Earth Surf. 2008, 113, 1–12. [Google Scholar] [CrossRef]
- Passey, M.; Bennett, T.; Zielinski, A.; Donnelly, C.R. Dam safety management plans: A conceptual framework for risk-informed decision making in ontario. In Proceedings of the Canadian Dam Association Association Canadienne Des Barrages Dam Safety, Banff, AB, Canada, 4–9 October 2014. [Google Scholar]
- Singh, V.P. Dam Breach Modeling Technology; Springer: Houten, The Netherlands, 1996. [Google Scholar]
- Hartford, D.N.; Baecher, G.B. Risk and Uncertainty in Dam Safety; Thomas Telford Ltd.: London, UK, 2004; pp. 185–215. [Google Scholar]
- Rong-Yong, M.A.; Huang, H.Y.; Liao, X.T. Analysis of overflow fuzzy risk on earth dam. J. Saf. Environ. 2004, 4, 15–18. [Google Scholar]
- Zong-Kun, L.I. Analysis of seepage failure fuzzy risk on earth dams. Dam Saf. 2007, 1, 17–20. [Google Scholar]
- Graham, W.J. A Procedure for Estimating Loss of Life Caused by Dam Failure. Dam Saf. Office US Bur. Reclam. 1999, 6, 262. [Google Scholar]
- Maaskant, B.; Jonkman, S.N.; Bouwer, L.M. Future risk of flooding: An analysis of changes in potential loss of life in South Holland (The Netherlands). Environ. Sci. Policy 2009, 12, 157–169. [Google Scholar] [CrossRef]
- Escuder-Bueno, I.; Mazzà, G.; Morales-Torres, A.; Castillo-Rodríguez, J.T. Computational Aspects of Dam Risk Analysis: Findings and Challenges. Engineering 2016, 2, 319–324. [Google Scholar] [CrossRef]
- Liu, Z.Q.; Nadim, F.; Eidsvig, U.K.; Lacasse, S. Reassessment of Dam Safety Using Bayesian Network. Geo-Risk 2017, 2016, 168–177. [Google Scholar]
- MccClelland, D.M; Bowles, D.S. Estimating Life Loss for Dam Safety Risk Assessment-a Review and New Approach; Institute for Water Resources US Army Corps of Engineers: Alexandria, VA, USA, 2002. [Google Scholar]
- Tsakiris, G.; Spiliotis, M. Embankment Dam Break: Uncertainty of Outflow Based on Fuzzy Representation of Breach Formation Parameters; IOS Press: Amsterdam, The Netherlands, 2014; pp. 2365–2378. [Google Scholar]
- Altarejosgarcía, L.; Escuderbueno, I.; Moralestorres, A. Advances on the Failure Analysis of the Dam—Foundation Interface of Concrete Dams. Materials 2015, 8, 8255–8278. [Google Scholar] [CrossRef] [PubMed]
- Chen, Z. Analysis of the existing situations and problems in failure risk evaluation of high arch dams. J. Hydroelectr. Eng. 2010, 29, 70–75. [Google Scholar]
- You, L.; Li, C.; Min, X.; Xiaolei, T. Review of Dam-break Research of Earth-rock Dam Combining with Dam Safety Management. Procedia Eng. 2012, 28, 382–388. [Google Scholar] [CrossRef]
- Wishart, J.S. Overtopping Breaching of Rock-Avalanche Dams. Master’s Thesis, University of Canterbury Civil Engineering, Canterbury, UK, 2007. [Google Scholar]
- Sharma, R.P.; Kumar, A. Case Histories of Earthen Dam Failures; International Conference on Case Histories in Geotechnical Engineering: Chicago, IL, USA, 2013. [Google Scholar]
- Xie, J.B.; Sun, D.Y. Statistics of dam failures in China and analysis on failure causations. Water Resour. Hydropower Eng. 2009, 40, 124–128. [Google Scholar]
- Zhang, L.M.; Xu, Y.; Jia, J.S. Analysis of earth dam failures: A database approach. Georisk Assess. Manag. Risk Eng. Syst. Geohazards 2009, 3, 184–189. [Google Scholar] [CrossRef]
- Imbrogno, D.F. Analysis of Dam Failures and Development of a Dam Safety Evaluation Program. Doctoral Dissertation, The Ohio State University, Columbus, OH, USA, 2014. [Google Scholar]
- Pyayt, A.L.; Kozionov, A.P.; Mokhov, I.I.; Lang, B.; Meijer, R.J.; Krzhizhanovskaya, V.V.; Sloot, P. Time-frequency methods for structural health monitoring. Sensors 2014, 14, 5147–5173. [Google Scholar] [CrossRef] [PubMed]
- Luo, Y.; Chen, L.; Xu, M.; Huang, J. Breaking mode of cohesive homogeneous earth-rock-fill dam by overtopping flow. Nat. Hazards 2014, 74, 527–540. [Google Scholar] [CrossRef]
- Foster, M.; Fell, R.; Spannagle, M. The statistics of embankment dam failures and accidents. Can. Geotech. J. 2000, 37, 1000–1024. [Google Scholar] [CrossRef]
- Baecher, G.B. Uncertainty in dam safety risk analysis. Georisk Assess. Manag. Risk Eng. Syst. Geohazards 2016, 10, 92–108. [Google Scholar] [CrossRef]
- Elmazoghi, H.G. Fuzzy algorithm for estimating average breach widths of embankment dams. Nat. Hazards 2013, 68, 229–248. [Google Scholar] [CrossRef]
- Huang, L.; Huang, J.; Wang, W. The Sustainable Development Assessment of Reservoir Resettlement Based on a BP Neural Network. Int. J. Environ. Res. Public Health 2018, 15, 146. [Google Scholar] [CrossRef] [PubMed]
- Arunraj, N.S.; Mandal, S.; Maiti, J. Modeling uncertainty in risk assessment: An integrated approach with fuzzy set theory and Monte Carlo simulation. Accid. Anal. Prev. 2013, 55, 242–255. [Google Scholar] [CrossRef] [PubMed]
- Wang, Y.; Zhang, J.; Guo, E.; Sun, Z. Fuzzy Comprehensive Evaluation-Based Disaster Risk Assessment of Desertification in Horqin Sand Land, China. Int. J. Environ. Res. Public Health 2015, 12, 1703–1725. [Google Scholar] [CrossRef] [PubMed]
- Liou, T.S.; Wang, M.J.J. Ranking fuzzy numbers with integral value. Fuzzy Sets Syst. 1992, 50, 247–255. [Google Scholar] [CrossRef]
- Abdollahzadeh, G.; Rastgoo, S. Risk Assessment in Bridge Construction Projects Using Fault Tree and Event Tree Analysis Methods Based on Fuzzy Logic. ASCE-ASME J. Risk Uncertain. Eng. Syst. Part B Mech. Eng. 2015, 1, 600–603. [Google Scholar] [CrossRef]
- Lei, L.I.; Zhou, K.F. Methods for evaluation of life loss induced by dam failure. Adv. Sci. Technol. Water Resour. 2006, 26, 76–80. [Google Scholar]
- Zhou, K.F.; Lei, L.I.; Sheng, J.B. Evaluation model of loss of life due to dam breach in China. J. Saf. Environ. 2007, 7, 145–149. [Google Scholar]
- Dong, J.; Wu, H.; Fu, Q. Dam-break flood calculation and risk assessment of Youluokou Reservoir. South-to-North Water Transf. Water Sci. Technol. 2014, 12, 189–191. [Google Scholar]
- Redaelli, M. Estimating the probability of piping-induced breaching of flood embankments. Geotech. Saf. Risk 2011, 567–575. [Google Scholar]
- Pham, H.T.; Oo, H.Z.; Jing, C. Stability of Slope and Seepage Analysis in Earth Dam Using Numerical Finite Element Model. Study Civ. Eng. Arch. 2013, 2, 104–108. [Google Scholar]
- Sachpazis, C. Detailed Slope Stability Analysis and Assessment of the Original Carsington Earth Embankment Dam Failure in the UK. Electron. J. Geotech. Eng. 2013, 18, 6021–6060. [Google Scholar]
- Dong, J.; Wu, H.; FU, Q. Possible failure mode analysis for a dam based on event tree analysis methodology. Yangtze River 2013, 44, 72–75. [Google Scholar]
- Hu, Q.; Xu, S.; Liu, Y. Application of improved fuzzy fault tree method in earth-rock dam failure risk assessment. J. Nanchang Inst. Technol. 2013, 32, 72–75. [Google Scholar]
Figure 1.
Statistics of dam types of the world (excluding China) and China.

Figure 2.
Several failure modes of earth-rock dams.

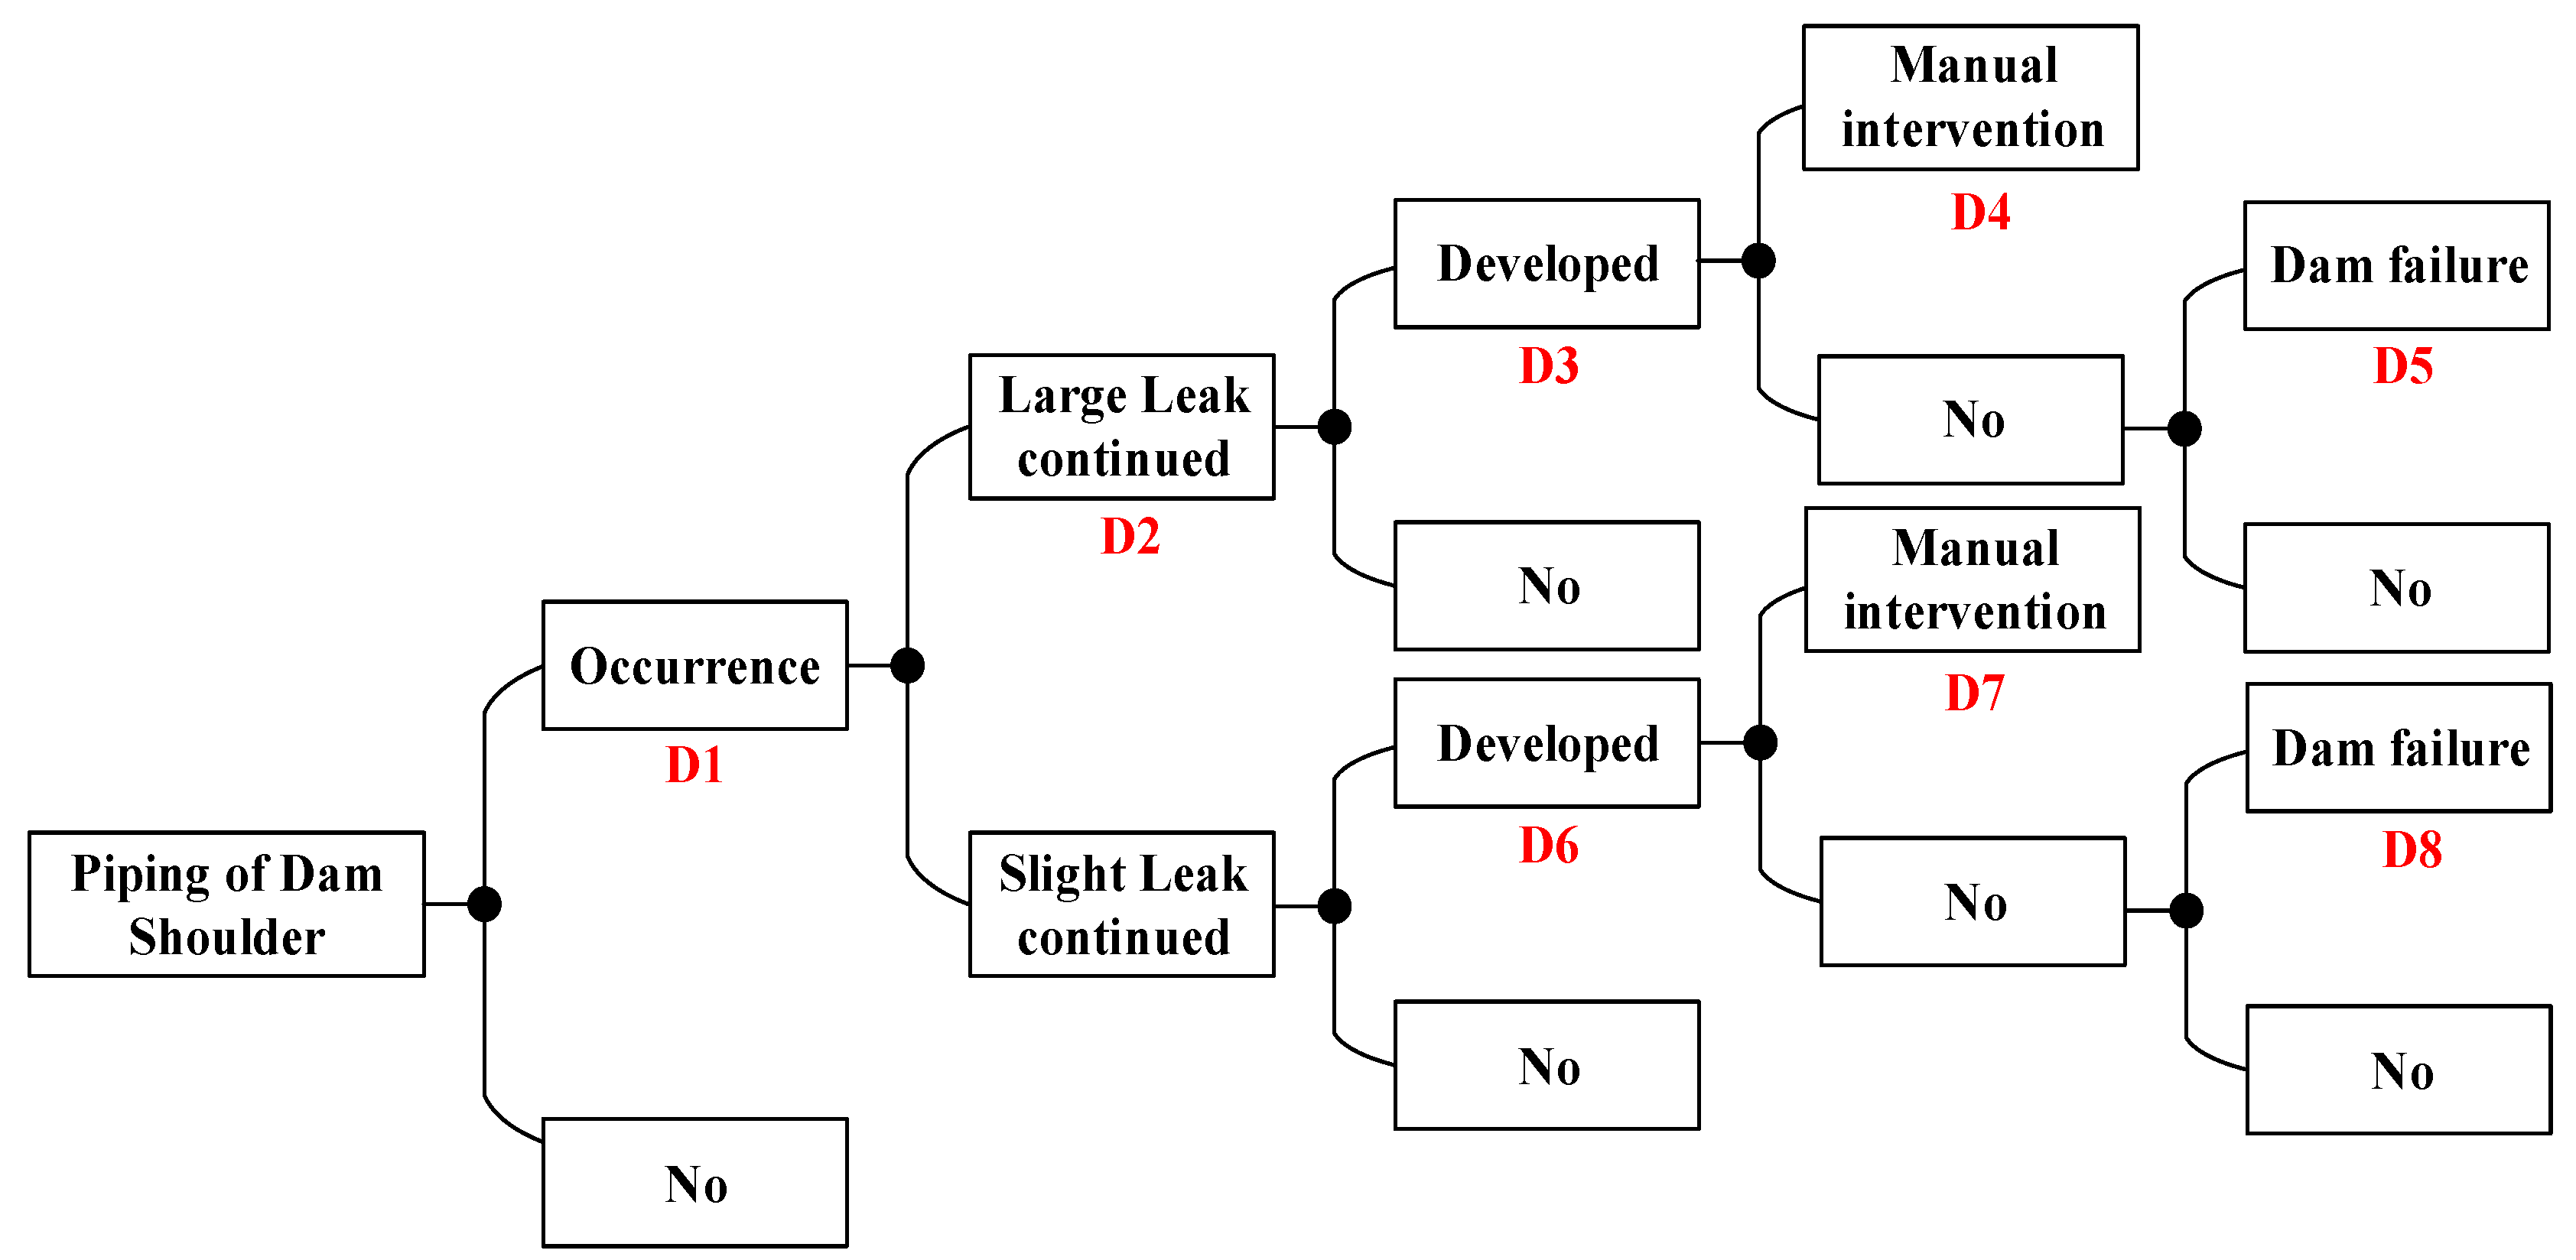
Figure 3.
Event tree analysis of dam failure.

Figure 4.
Membership function of fuzzy language.

Figure 5.
Layout plan of the reservoir project.

Figure 6.
Typical cross-section structure dimensions of the dam.

Figure 7.
Piping of auxiliary dam shoulder event tree in the flood season.

Figure 8.
Piping of main dam foundation event tree in the non-flood season.

Figure 9.
Piping of auxiliary dam foundation event tree in the non-flood season.

Figure 10.
Piping of auxiliary dam shoulder event tree in the non-flood season.

Figure 11.
Piping of main dam foundation event tree in the flood season.

Figure 12.
Piping of auxiliary dam foundation event tree in the flood season.

Figure 13.
Piping of auxiliary dam shoulder event tree in the flood season.

Figure 14.
Piping of sloping core event tree in the flood season.

Figure 15.
Failure of spillway structure core event tree in the flood season.


Table 1.
Several famous large dam failure events and deaths in the world.
| Dam Name | Country | Year of Accident | Dam Type | Reservoir Volume (×106 m3) | Deaths |
|---|---|---|---|---|---|
| Mohne Dam | German | 1943 | Gravity dam | 134.0 | 1200 |
| Malpasset Dam | France | 1959 | Arch dam | 15.0 | 421 |
| Vaiont Dam | Italy | 1963 | Arch dam | 169.0 | 2000 |
| Buffalo Creek Dam | USA | 1972 | Tailings dam | 49.8 | 125 |
| Machhu II Dam | India | 1979 | Earth dam | 101.0 | 3000 |
| Shakidor Dam | Pakistan | 2005 | Earth-rock dam | - | 135 |
| Situ Gintung Dam | Indonesia | 2009 | Earth-rock dam | 2.0 | 100 |
Table 2.
Several large dam failure events and deaths in China.
| Dam Name | Location | Date | Dam Type | Reservoir Volume (106 m3) | Deaths |
|---|---|---|---|---|---|
| Longtun Dam | Suizhong, Liaoning province | 1959.7.22 | Clay sloping core dam | 30.0 | 707 |
| Liujiatai Dam | Yixian, Hebei province | 1963.8.8 | Clay core wall dam | 40.5 | 943 |
| Hengjiang Dam | Jiexi, Guangdong province | 1970.9.15 | Homogeneous earth dam | 78.8 | 941 |
| Lijiaju Dam | Zhuanglang, Gansu province | 1973.4.29 | Homogeneous earth dam | 1.1 | 580 |
| Banqiao Dam | Luoyang, Henan province | 1975.8.8 | Clay core wall dam | 492.0 | 22,564 |
| Shimantan Dam | Wugang, Henan province | 1975.8.8 | Homogeneous earth dam | 91.8 | |
| Gouhou Dam | Gonghe, Qinghai province | 1993.8.27 | Concrete-faced rock-fill dam | 3.0 | 400 |
Table 3.
Fuzzy numbers and corresponding -cut sets of fuzzy language.
| Fuzzy Language | Fuzzy Number | -Cut Set |
|---|---|---|
| Extremely unlikely | ||
| Very unlikely | ||
| Less likely | ||
| Uncertain | ||
| Likely | ||
| Very likely | ||
| Extremely Likely |
Table 4.
Criteria for determining the credibility of an expert.
| Aspects | Educational Degree | Professional Title | ||||
| Doctor | Master | Bachelor | Senior | Medium-grade | Junior | |
| Scoring range | [8,10] | [7,9] | [6,8] | [8,10] | [7,10] | [5,7] |
| Aspects | Professional direction | Length of service | ||||
| Hydraulic structure engineering | Hydropower engineering | Civil Engineering | >20a | 10a~20a | <10a | |
| Scoring range | [7,10] | [5,10] | [5,8] | [8,10] | [5,7] | [4,6] |
Table 5.
Risk mortality rate suitable for China f.
| SD | WT(h) | UD | f | |
|---|---|---|---|---|
| Recommended Average | Recommended Range | |||
| High | <0.25 | Fuzzy | 0.7500 | 0.3000~1.0000 |
| Explicit | 0.2500 | 0.1000~0.5000 | ||
| 0.25~1.0 | Fuzzy | 0.2000 | 0.0500~0.4000 | |
| Explicit | 0.0100 | 0.0050~0.0200 | ||
| >1.0 | Fuzzy | 0.1800 | 0.0100~0.3000 | |
| Explicit | 0.0005 | 0.0000~0.0010 | ||
| Medium | <0.25 | Fuzzy | 0.5000 | 0.1000~0.8000 |
| Explicit | 0.0750 | 0.0200~0.1200 | ||
| 0.25~1.0 | Fuzzy | 0.1300 | 0.0150~0.2700 | |
| Explicit | 0.0008 | 0.0005~0.0020 | ||
| >1.0 | Fuzzy | 0.0500 | 0.0100~0.1000 | |
| Explicit | 0.0004 | 0.0002~0.0010 | ||
| Low | <0.25 | Fuzzy | 0.0300 | 0.0100~0.0500 |
| Explicit | 0.0100 | 0.0000~0.0200 | ||
| 0.25~1.0 | Fuzzy | 0.0070 | 0.0000~0.0150 | |
| Explicit | 0.0006 | 0.0000~0.0010 | ||
| >1.0 | Fuzzy | 0.0003 | 0.0000~0.0006 | |
| Explicit | 0.0002 | 0.0000~0.0004 | ||
Table 6.
Experts’ judgments of piping of auxiliary dam shoulder in the flood season.
| E1 | E2 | E3 | E4 | E5 | |
|---|---|---|---|---|---|
| D1 | Uncertain | Likely | Uncertain | Likely | Uncertain |
| D2 | Likely | Uncertain | Uncertain | Likely | Uncertain |
| D3 | Uncertain | Uncertain | Uncertain | Likely | Less likely |
| D4 | Likely | Uncertain | Likely | Uncertain | Uncertain |
| D5 | Likely | Likely | Very likely | Likely | Uncertain |
| D6 | Less likely | Uncertain | Uncertain | Less likely | Uncertain |
| D7 | Uncertain | Less likely | Less likely | Less likely | Less likely |
| D8 | Less likely | Very unlikely | Very unlikely | Very unlikely | Very unlikely |
Table 7.
Judgment matrix of experts.
| Experts | E1 | E2 | E3 | E4 | E5 | Weight Coefficient |
|---|---|---|---|---|---|---|
| E1 | 1 | 3 | 4 | 2 | 1/2 | 0.283 |
| E2 | 1/3 | 1 | 2 | 4 | 1/3 | 0.168 |
| E3 | 1/4 | 1/2 | 1 | 3 | 1/2 | 0.123 |
| E4 | 1/2 | 1/4 | 1/3 | 1 | 1/3 | 0.073 |
| E5 | 2 | 3 | 2 | 3 | 1 | 0.353 |
Table 8.
Probabilities of each accident of the auxiliary dam shoulder.
| Event | D1 | D2 | D3 | D4 | D5 | D6 | D7 | D8 |
|---|---|---|---|---|---|---|---|---|
| P | 0.536 | 0.553 | 0.458 | 0.561 | 0.616 | 0.447 | 0.392 | 0.295 |
| PL | 0.474 | 0.486 | 0.387 | 0.491 | 0.539 | 0.379 | 0.307 | 0.214 |
| PU | 0.598 | 0.621 | 0.529 | 0.631 | 0.692 | 0.514 | 0.478 | 0.377 |
Table 9.
Dam failure probabilities summary.
| Load | Failure Mode and Parts | Frequency f | Failure Probability P | f × P | Percentage |
|---|---|---|---|---|---|
| non-flood season (220.00 m) | Piping of main dam foundation | 100% | 4.00 × 10⁻⁵ | 4.00 × 10⁻⁵ | 34.54% |
| Piping of auxiliary dam foundation | 100% | 1.88 × 10⁻⁵ | 1.88 × 10⁻⁵ | 16.23% | |
| Piping of auxiliary dam shoulder | 100% | 1.32 × 10⁻⁵ | 1.32 × 10⁻⁵ | 11.40% | |
| flood season (233.70 m) | Piping of main dam foundation | 0.02% | 6.38 × 10⁻² | 1.28 × 10⁻⁵ | 11.05% |
| Piping of auxiliary dam foundation | 0.02% | 5.93 × 10⁻² | 1.18 × 10⁻⁵ | 10.28% | |
| Piping of auxiliary dam shoulder | 0.02% | 5.03 × 10⁻² | 1.01 × 10⁻⁵ | 8.72% | |
| Piping of sloping core | 0.02% | 1.11 × 10⁻² | 2.21 × 10⁻⁶ | 1.91% | |
| Failure of spillway structure | 0.02% | 3.40 × 10⁻² | 6.80 × 10⁻⁶ | 5.87% | |
| Total | 1.16 × 10⁻⁴ | ||||
Table 10.
PAR of the submerged area.
| Administrative Region | Households | Population | PAR (Daytime) | PAR (Night) |
|---|---|---|---|---|
| Fujiang township | 1261 | 4727 | 2363 | 3782 |
| Nan’an town | 18,727 | 65,735 | 32,868 | 52,588 |
| Total | 19,988 | 70,462 | 35,232 | 56,370 |
Table 11.
Average D × V value and corresponding SD.
| Administrative Region | D × V (m2/s) | SD |
|---|---|---|
| Fujiang township | 14.48 | High |
| Nan’an town | 11.26 | High |
Table 12.
Understanding of PAR to SD (UD).
| Warning Time | 0~0.25 h | 0.25~1.0 h | >1.0 h |
|---|---|---|---|
| Daytime | Fuzzy | Explicit | Explicit |
| Night | Fuzzy | Fuzzy | Explicit |
Table 13.
Corresponding correction coefficient .
| Warning Time | 0~0.25 h | 0.25~1.0 h | >1.0 h |
|---|---|---|---|
| Daytime | 0.80 | 0.60 | 0.40 |
| Night | 0.80 | 0.65 | 0.50 |
Table 14.
Estimated dam failure loss of life when WT = 0~0.25 h.
| Administrative Region | Fujiang Township | Nan’an Town | |
|---|---|---|---|
| DV (m2/s) | 14.48 | 11.26 | |
| SD | High | High | |
| WT | 0~0.25 h | 0~0.25 h | |
| Daytime | PAR | 2363 | 32,868 |
| UD | Fuzzy | Fuzzy | |
| F | 0.30 | 0.30 | |
| 0.80 | 0.80 | ||
| LOL | 567 | 7888 | |
| Night | PAR | 3782 | 52,588 |
| UD | Fuzzy | Fuzzy | |
| F | 0.70 | 0.70 | |
| 0.80 | 0.80 | ||
| LOL | 2118 | 29,449 | |
Table 15.
Estimated dam failure loss of life when WT = 0.25~1.0 h.
| Administrative Region | Fujiang Township | Nan’an Town | |
|---|---|---|---|
| DV(m2/s) | 14.48 | 11.26 | |
| SD | High | High | |
| WT | 0.25~1.0 h | 0.25~1.0 h | |
| Daytime | PAR | 2363 | 32,868 |
| UD | Explicit | Explicit | |
| f | 0.01 | 0.01 | |
| 0.6 | 0.6 | ||
| LOL | 14 | 197 | |
| Night | PAR | 3782 | 52,588 |
| UD | Fuzzy | Fuzzy | |
| f | 0.2 | 0.2 | |
| 0.65 | 0.65 | ||
| LOL | 492 | 6836 | |
Table 16.
Estimated dam failure loss of life when WT > 1.0 h.
| Administrative Region | Fujiang Township | Nan’an Town | |
|---|---|---|---|
| DV(m2/s) | 14.48 | 11.26 | |
| SD | High | High | |
| WT | >1.0 h | >1.0 h | |
| Daytime | PAR | 2363 | 32,868 |
| UD | Explicit | Explicit | |
| f | 0.001 | 0.001 | |
| 0.4 | 0.4 | ||
| LOL | 1 | 13 | |
| Night | PAR | 3782 | 52,588 |
| UD | Explicit | Explicit | |
| f | 0.001 | 0.001 | |
| 0.5 | 0.5 | ||
| LOL | 2 | 26 | |
Table 17.
Estimated dam failure loss of life.
| 0~0.25 h | 0.25~1.0 h | >1.0 h | ||
|---|---|---|---|---|
| LOL | Daytime | 8455 | 211 | 14 |
| Night | 31,567 | 7328 | 28 | |
Table 18.
Possible loss of life of the dam failure estimated.
| 0~0.25 h | 0.25~1.0 h | >1.0 h | ||
|---|---|---|---|---|
| LOL | Daytime | 9.79 × 10⁻¹ | 2.44 × 10⁻² | 1.62 × 10⁻³ |
| Night | 3.66 | 8.49 × 10⁻¹ | 3.24 × 10⁻³ | |
© 2018 by the authors. Licensee MDPI, Basel, Switzerland. This article is an open access article distributed under the terms and conditions of the Creative Commons Attribution (CC BY) license (http://creativecommons.org/licenses/by/4.0/).
Share and Cite
MDPI and ACS Style
Fu, X.; Gu, C.-S.; Su, H.-Z.; Qin, X.-N. Risk Analysis of Earth-Rock Dam Failures Based on Fuzzy Event Tree Method. Int. J. Environ. Res. Public Health 2018, 15, 886. https://doi.org/10.3390/ijerph15050886
AMA Style
Fu X, Gu C-S, Su H-Z, Qin X-N. Risk Analysis of Earth-Rock Dam Failures Based on Fuzzy Event Tree Method. International Journal of Environmental Research and Public Health. 2018; 15(5):886. https://doi.org/10.3390/ijerph15050886
Chicago/Turabian StyleFu, Xiao, Chong-Shi Gu, Huai-Zhi Su, and Xiang-Nan Qin. 2018. "Risk Analysis of Earth-Rock Dam Failures Based on Fuzzy Event Tree Method" International Journal of Environmental Research and Public Health 15, no. 5: 886. https://doi.org/10.3390/ijerph15050886
Note that from the first issue of 2016, this journal uses article numbers instead of page numbers. See further details here.