Article

Horizontal Flow Constructed Wetland for Greywater Treatment and Reuse: An Experimental Case

by
Maria Cristina Collivignarelli
1,2,
Marco Carnevale Miino
1,
Franco Hernan Gomez
3,
Vincenzo Torretta
4,
Elena Cristina Rada
4,* and
Sabrina Sorlini
3
1
Department of Civil Engineering and Architecture, University of Pavia, via Ferrata 1, 27100 Pavia, Italy
2
Interdepartmental Centre for Water Research, University of Pavia, Via Ferrata 3, 27100 Pavia, Italy
3
Department of Civil, Environmental, Architectural Engineering and Mathematics, University of Brescia, Via Branze 43, 25123 Brescia, Italy
4
Department of Theoretical and Applied Sciences, University of Insubria, Via G.B. Vico 46, 21100 Varese, Italy
*
Author to whom correspondence should be addressed.
Int. J. Environ. Res. Public Health 2020, 17(7), 2317; https://doi.org/10.3390/ijerph17072317
Submission received: 11 March 2020 / Revised: 19 March 2020 / Accepted: 23 March 2020 / Published: 30 March 2020
(This article belongs to the Special Issue Feature Papers in Environmental Science and Engineering)

Abstract

:
In the coming years, water stress is destined to worsen considering that the consumption of water is expected to increase significantly, and climate change is expected to become more evident. Greywater (GW) has been studied as an alternative water source in arid and semiarid zones. Although there is no single optimal solution in order to treat GW, constructed wetlands proved to be effective. In this paper, the results of the treatment of a real GW by a horizontal flow constructed wetland (HFCW) for more than four months are shown. In the preliminary laboratory-scale plant, Phragmites australis, Carex oshimensis and Cyperus papyrus were tested separately and showed very similar results. In the second phase, pilot-scale tests were conducted to confirm the performance at a larger scale and evaluate the influence of hydraulic retention time, obtaining very high removal yields on turbidity (>92%), total suspended solids (TSS) (>85%), chemical oxygen demand (COD) (>89%), and five-day biological oxygen demand (BOD5) (>88%). Based on the results of the pilot-scale HFCW, a comparison with international recommendations by World Health Organization and European Union is discussed.

1. Introduction

Water stress is now a reality in many parts of the world [1,2,3,4]. This phenomenon is destined to worsen considering that the consumption of water is expected to increase significantly in the coming years and with now more evident climate change accentuating this phenomenon [5]. In the European Union (EU), at least 17% of the territory and 11% of the population is affected by water scarcity [6,7,8,9,10,11]. In the Mediterranean area, over 20% of the population lives under constant water stress and in the summer this percentage reaches 50% as defined by the European Environmental Agency’s (EEA) water exploitation index (WEI) [12,13,14].
In addition to reducing water consumption, a possible solution can be the reuse of treated wastewater (WW) produced by human activities [15,16,17]. The WW presents a very large number of contaminants such as dyes, surfactants, heavy metals, drugs, personal care products and bacteria [18,19,20,21,22,23]. To date, there are numerous treatments to remove the contaminants present in the WW, but there is still little attention to the possible reuse of treated water. For example, in the EU 40,000 million m3 of treated WW are produced every year, of which only 964 million m3 are reused [7]. Failure to recover the treated WW also involves developing countries where in many cases a significant plant shortage must also be addressed.
The EU adopted an ambitious Waste Circular Economy Package [24,25,26] in order to promote the reuse, recycling and recovery of raw materials to minimize the consumption of new resources [27,28]. WW can be considered a valuable resource that can help to overcome the water scarcity problem, especially in arid and semiarid climatic zones [29,30,31].
For WWs in recent years, the interest of research towards the recovery of greywater (GW) is becoming increasingly important, especially to cope with the scarcity of water at the domestic level [32,33,34,35]. As defined in literature, GW represents domestic WW generated from sinks, laundry washing and showers (excluding toilet flushing), and accounts for 50%–80% of the total domestic water use [5,36].
The GW has strong advantages as an alternative water source in arid and semiarid zones due to its continual supply, contrary to other supply methods such as rainwater harvesting, which depends on hydrological conditions, easy access in the household and a low level of contamination. This last feature allows removing contaminants with a simple treatment system chain, unlike other WW, making the onsite treatment of water possible [5]. In recent years, several types of processes have been tested on GW, such as filtration [37,38], membrane bioreactors [39,40], rotating biological contactors [35], sequencing batch reactor [41,42], up-flow anaerobic sludge blanket [43,44] and constructed wetlands (CW) [45,46].
Although there is no single optimal solution, which must be assessed according to a “case by case” logic, in recent years many studies have focused on the study of CW as a low impact system for the treatment of GW, especially in developing countries [47,48,49,50]. CW are complex systems that operate as biological filter hosting many abiotic and biotic processes capable of degrading or transforming many pollutants [45]. The main advantage of this system is linked to its low cost and the very low environmental impact, while among the most important disadvantages there is the low organic load that can be fed to the system which translates into high surfaces necessary to treat significant flow rates [51]. The CW can be classified according to the hydraulic flow scheme adopted: (i) vertical flow constructed wetlands (VFCW) and (ii) horizontal flow constructed wetlands (HFCW) [45].
In recent years, several studies have shown the applicability of HFCW as a treatment for the reuse of GW [52,53,54]. Different types of macrophytes have been tested and show good performance, such as Cyperus papyrus, Cyperus iria, Typha latifolia, Phragmites australis and bamboo plants [50,54,55,56]. Although there are some examples of applications on real waters [46,48,55], most of the research results described in the literature relate to tests conducted on synthetic waters.
In order to better simulate real conditions, this paper presents the results of more than four months of treatment of real GW by a HFCW. A significant aspect of this research is that a two-step approach was used. Firstly, a laboratory-scale HFCW was used to identify the performance of three macrophytes, Carex oshimensis, Cyperus papyrus and Phragmites australis, by testing them separately on the same GW. This represents an important aspect because in the literature no results have been presented regarding the use of Carex oshimensis for the treatment of GW. Secondly, pilot-scale tests were conducted to confirm the performance on a larger scale and to evaluate the influence of hydraulic retention time (HRT). Based on the results of the pilot-scale HFCW, a comparison with international recommendations by World Health Organization (WHO) and EU is discussed.

2. Materials and Methods

2.1. Materials

2.1.1. Greywater Collections

During the more than four month period of the study, GW was collected from different points of a house located in Italy: shower and sink of the bathroom, sink in the kitchen and from the washing machine.

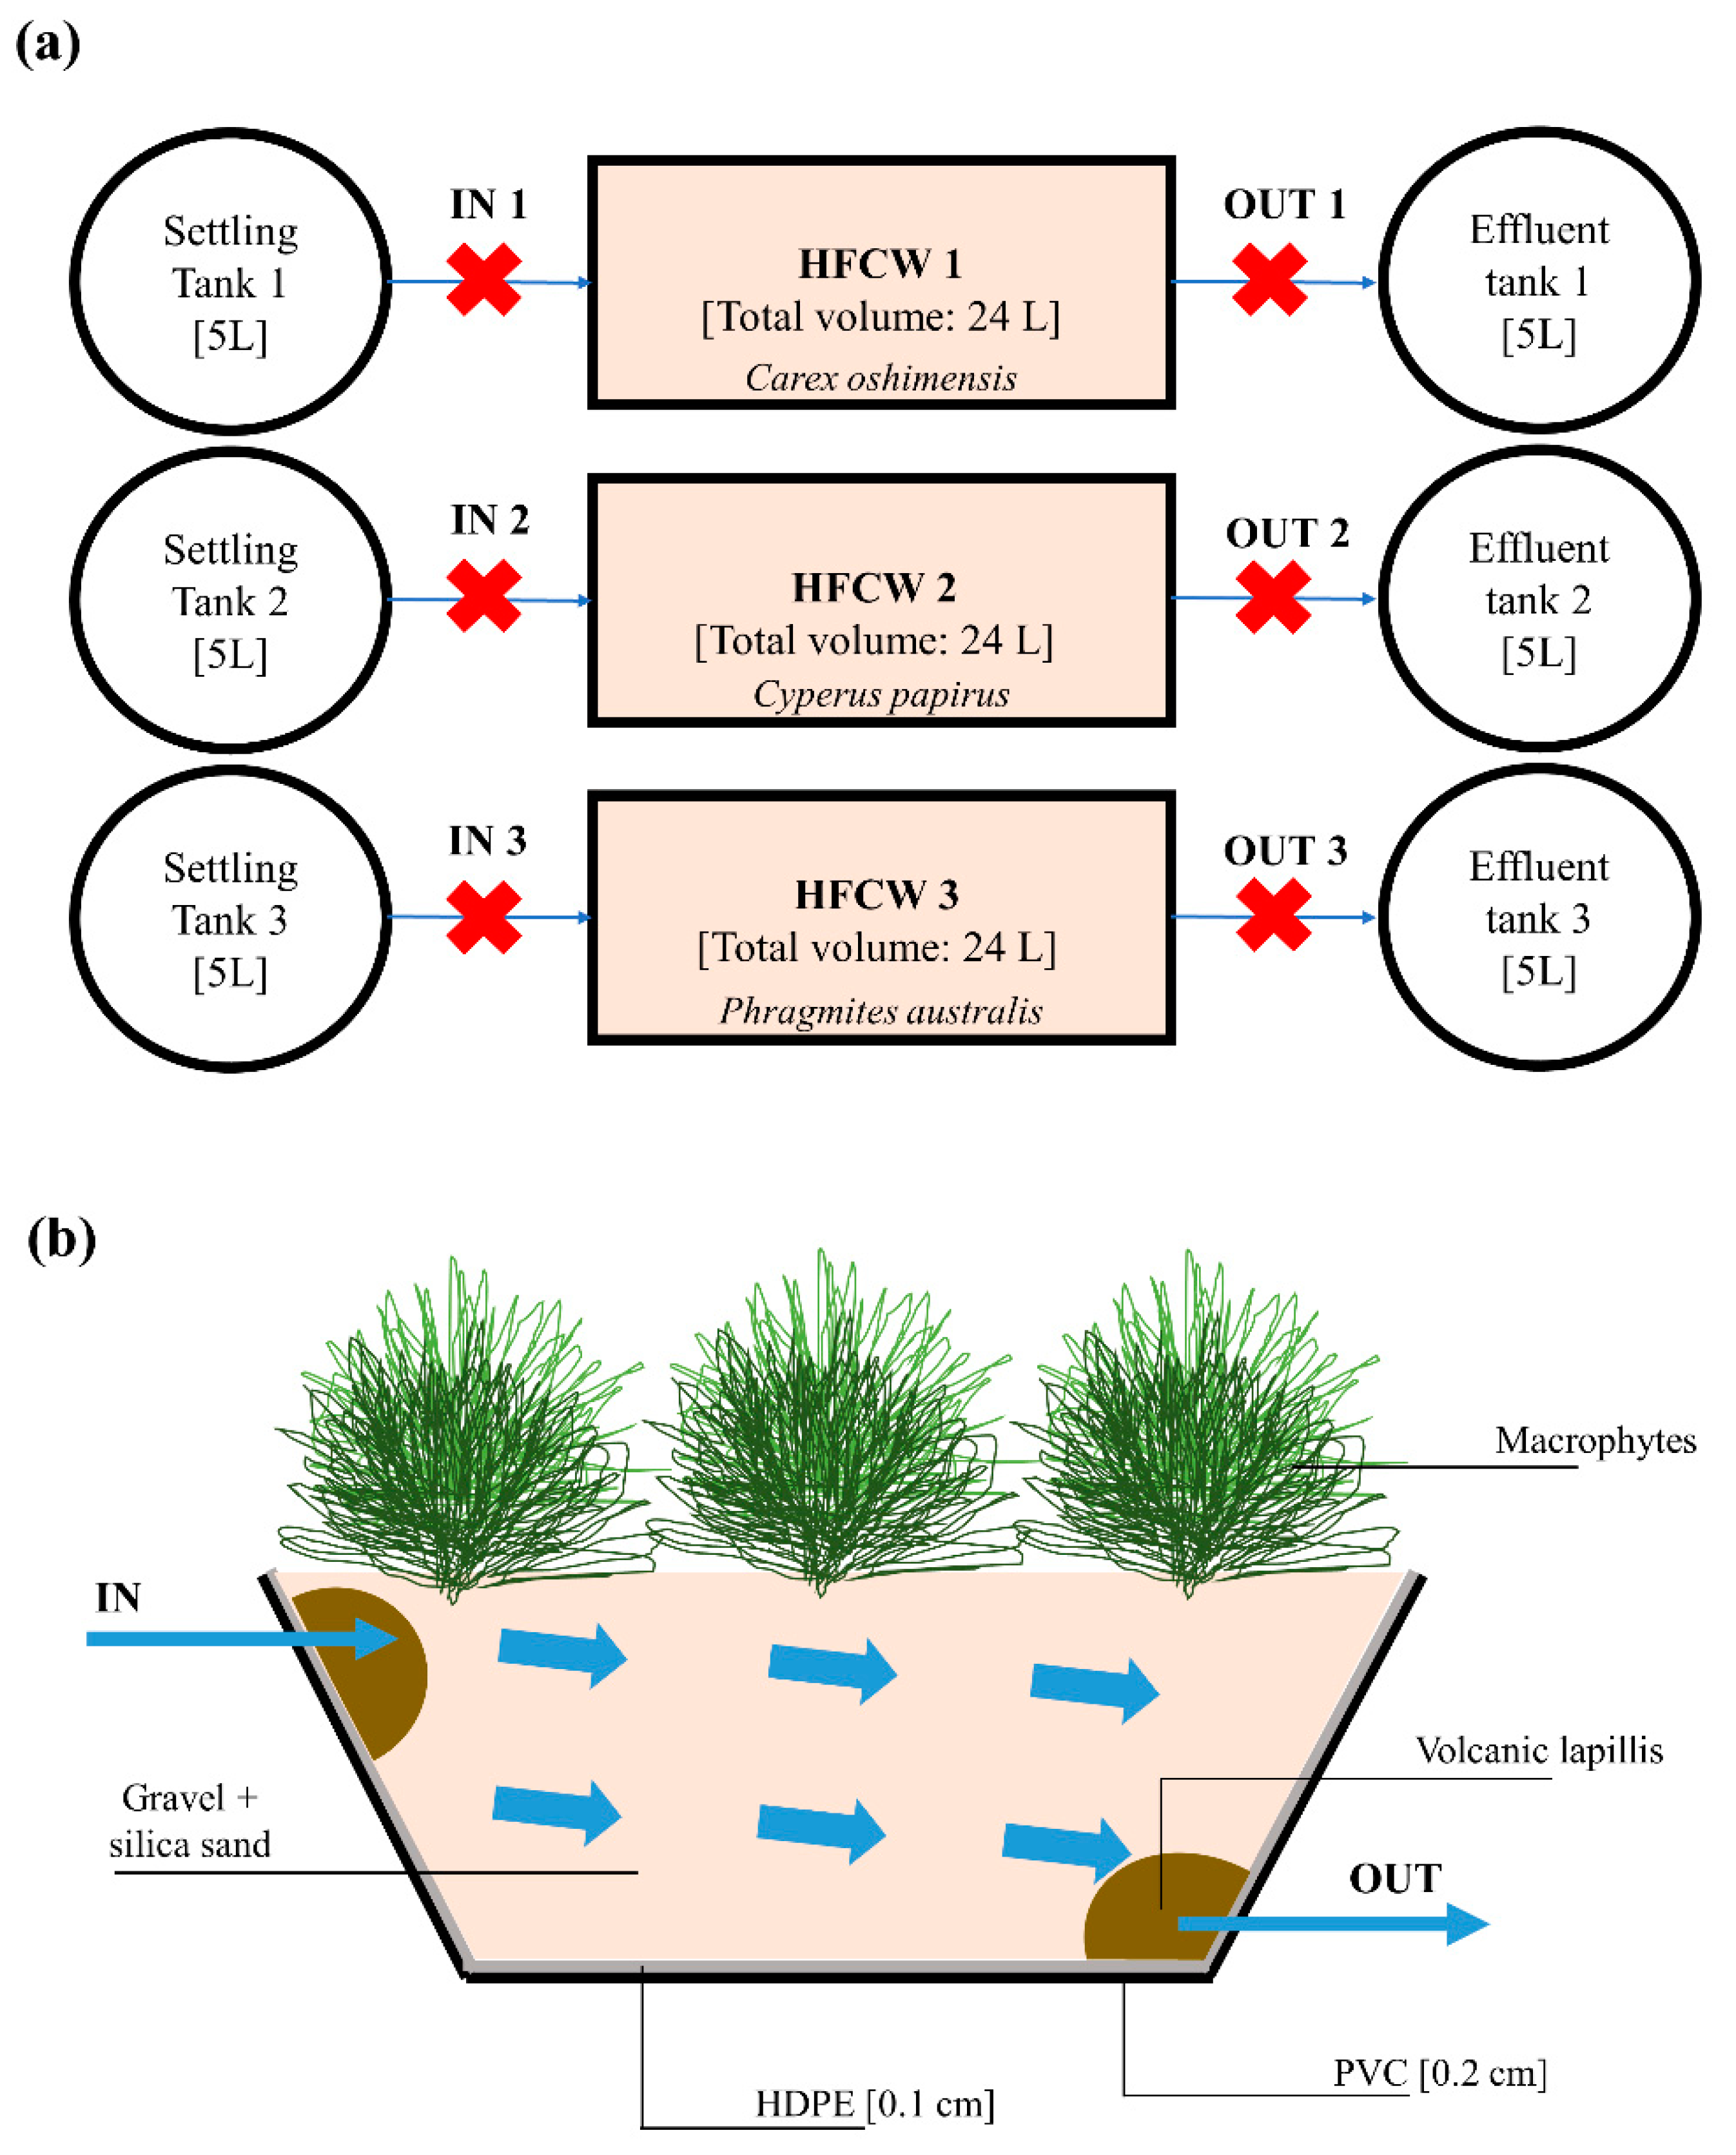
2.1.2. Laboratory-Scale Plant

A first preliminary laboratory-scale HFCW with submerged flow was realized in order to separately test the performance of three different types of macrophytes: Carex oshimensis, Cyperus papyrus and Phragmites australis. As shown in Figure 1a, the plant consisted of three parallel units, one for each type of macrophyte tested. To avoid obstructions of the connection pipes, sedimentation tanks (5 L) were located upstream from the respective HFCW in order to guarantee the sedimentation of the coarse material and the flotation of the oils. The HRT of the sedimentation tanks was 2 h.
Each HFCW unit (with dimensions 0.6 m× 0.2 m × 0.2 m) had a volume of 24 L and was planted with three macrophytes that after more than 1 month of the acclimatization phase covered the surface. The tanks of the units of HFCW were constructed of polyvinyl chloride (PVC) (Figure 1b). Each tank was further waterproofed with a layer of high-density polyethylene (HDPE) and subsequently filled with filter material (gravel and silica sand with a diameter of 2–10 mm) in order to obtain an effective porosity of the soil equal to 35%. The inlet and outlet pipes (1.1 cm internal diameter), made of polyethylene (PE), had 2 mm holes at regular distances. In order to ensure correct spreading of the inlet GW and correct collection of the treated GW at the outlet, a layer of draining material (volcanic lapilli with a diameter of 1–2 cm) was laid at the pipes. Both the inlet and outlet pipes were equipped with valves to control the incoming and outgoing flows. The average slope of the system was maintained at 0.5%–1.0%. The treated GW at the outlet was finally collected in three 5 L tanks.
The HFCW systems were illuminated by means of two lamps (15 W nominal power) for 12 h a day in order to promote chlorophyll photosynthesis.

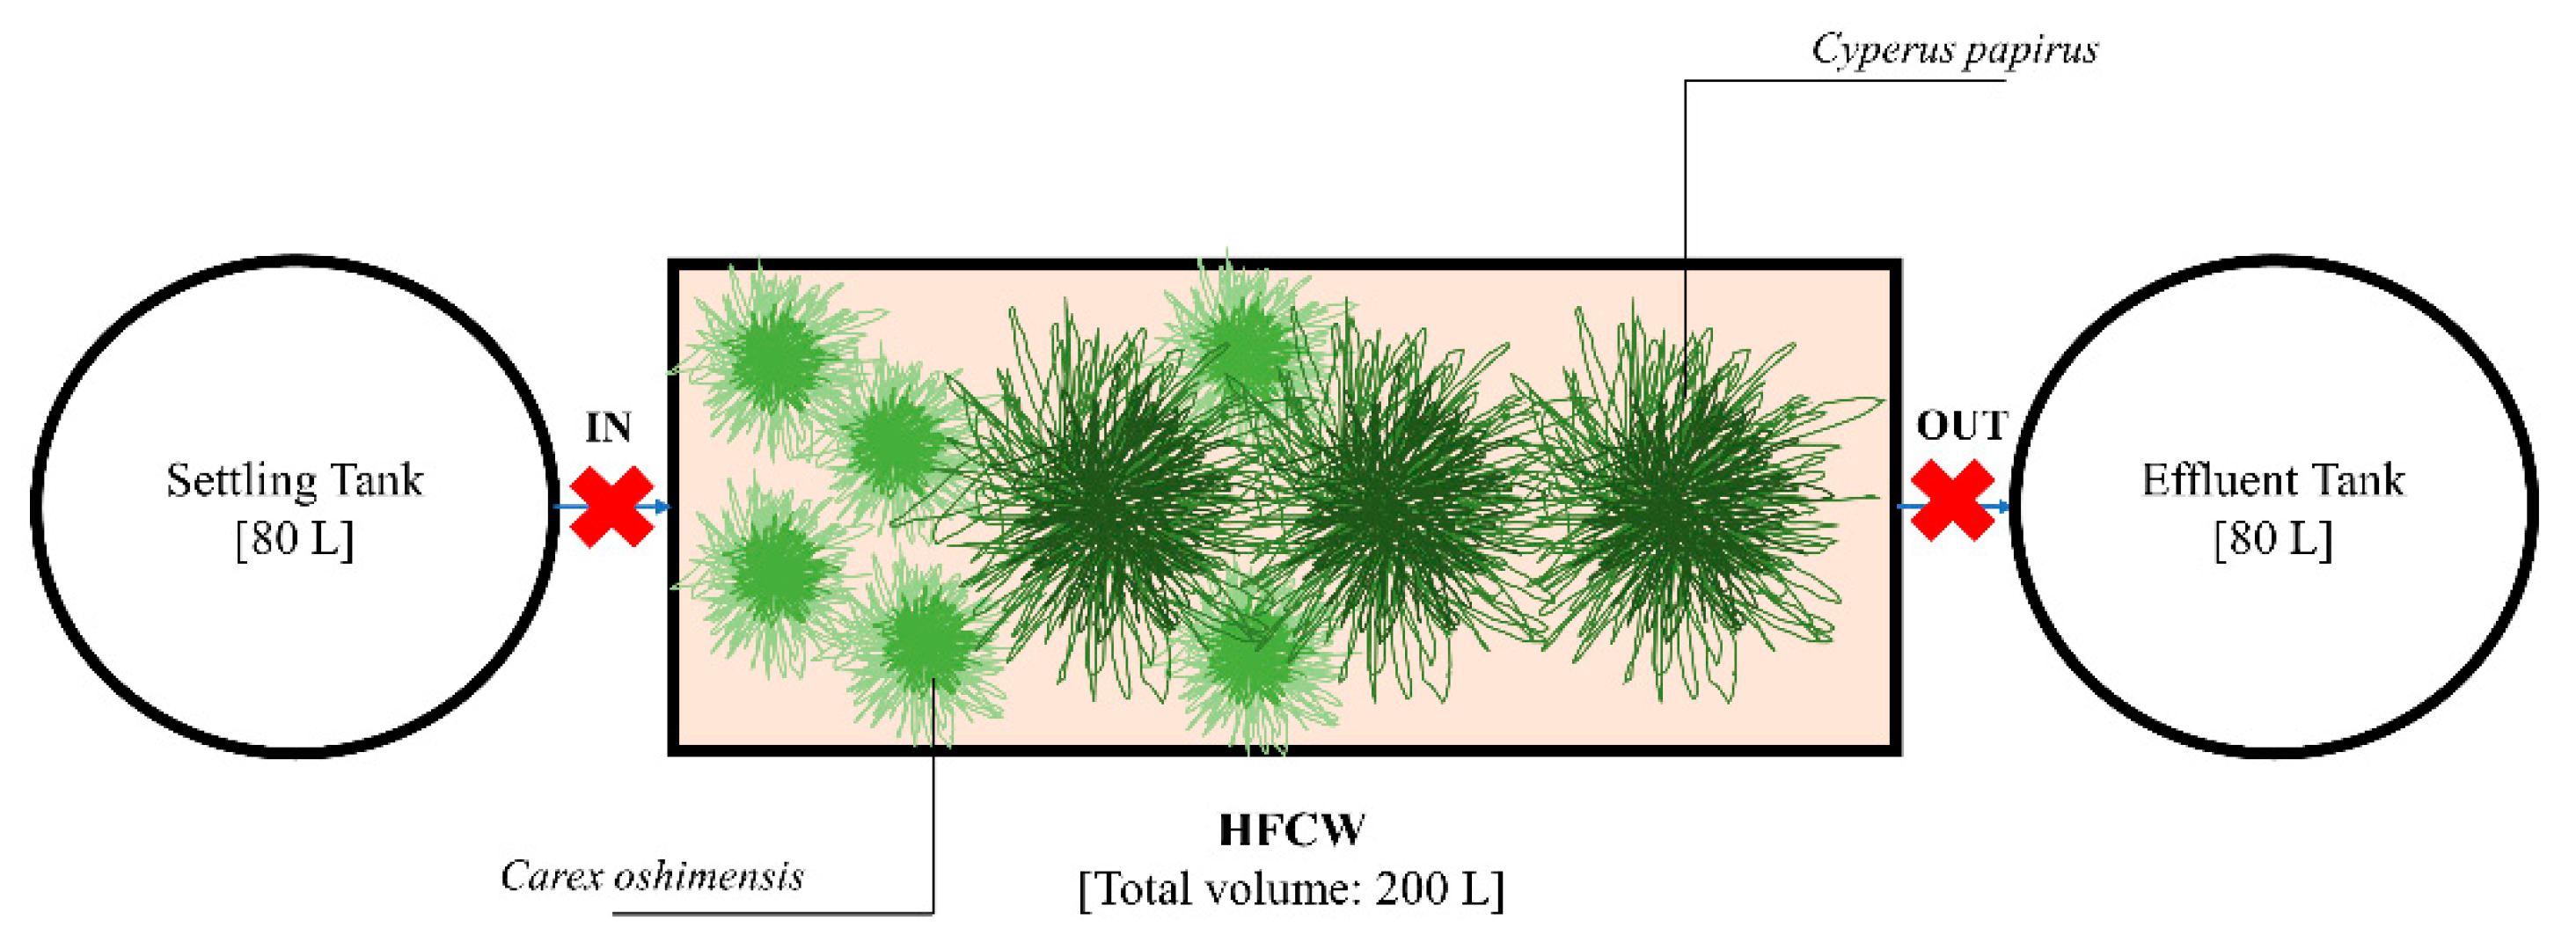
2.1.3. Pilot-Scale Plant

In order to test the CW on GW with the selected macrophytes (Carex oshimensis and Cyperus papyrus), a second larger pilot-scale plant HFCW with submerged flow was built (Figure 2). The structure of the treatment system and the illumination system were unchanged compared to the previous laboratory-scale plant (Figure 1b), but in this case the volumes were increased. The capacity of the tanks was 80 L and the HFCW, with dimension (0.8 × 0.6 × 0.4 m), had a volume of 200 L.
The position of the macrophytes was designed to ensure contact with GW (Figure 2). Considering that Cyperus papyrus are characterized by a root system capable of going deeper (up to 70 cm) [57,58], three specimens of this macrophyte were placed in the center towards the system outlet. As suggested by Masotti and Verlicchi [58], since the length of the roots of Carex oshimensis is limited (up to 10–30 cm) [59], six specimens of this macrophyte were positioned peripherally towards the tank entrance in order to ensure the contact with GW. After more than 1 month of acclimatization phase, the macrophytes covered the entire surface of the pilot-scale plant.

2.2. Methods

2.2.1. Greywater Analysis

Five-day biological oxygen demand (BOD5), chemical oxygen demand (COD), total nitrogen (TN), nitrogen forms, total phosphorus (TP) and total suspended solids (TSS) concentrations were measured according to the Standard Methods for the Examination of Water and Wastewater [60]. For COD, TN, N-NO2, N-NO3 and TP analysis, Hach kits were used. Before the analysis, the interference from chlorides was ruled out by verifying that the chloride concentration was lower than the maximum accepted by the method.
Turbidity was measured using a WTW Turb 430 iR® (Xylem, Germany) Dissolved oxygen (DO), pH and conductivity were measured using a portable multiparameter instrument (WTW 3410 SET4, Xylem, Germany). The DO was measured by using a WTW-IDS, model FDO® 925 probe (Xylem, Germany). Electrical conductivity was measured using a WTW-IDS, model TetraCon® 925 probe (Xylem, Germany). A WTW-IDS, Model SenTix® 940 probe (Xylem, Germany) was used to measure pH.
Water samples (300 mL) were collected before water entered and after it left the HFCW units (Figure 1a and Figure 2). Escherichia coli was determined by a membrane filtration technique (with a cellulose nitrate filter of 0.45 μm pore size, Millipore) and using a selective chromocult agar (NPS-COLC) culture medium [61,62].

2.2.2. Plants Management and Monitoring

The HRT of the preliminary laboratory-scale HFCW was imposed and equal to 2 days. In order to study the influence of this parameter on the performance of the system, two HRT were tested (1 and 3 days) in the pilot-scale HFCW. As suggested by the Environmental Protection Agency [63], the optimal flowrate (Q) was calculated using Equation (1):
Q [L d−1] = n·V·HRT−1.
where n represents the porosity of the system and V represents the bed volume. Considering the characteristics of the plants, a flowrate of 4 L d1 was used in the preliminary laboratory-scale reactor, and flowrates of 23 L d1 and 70 L d1 were used in the pilot-scale plant, depending on the HRT.
The study consisted of two phases: (i) a preliminary laboratory-scale phase in order to test the performance of Carex oshimensis, Cyperus papyrus and Phragmites australis to treat GW with HFCW and (ii) a subsequent pilot-scale phase, with the aim of evaluating the influence of HRT and the treatment efficiency during a longer period. The first preliminary phase was conducted in various 2 days intervals over a 7 week period, and samples were collected on every second day. The second phase was conducted in various 1 and 3 days intervals over a 7 week period, depending on the HRT imposed. In both phases, the temperature in the room in which the HFCW operated was maintained at around 25 °C.

3. Results and Discussions

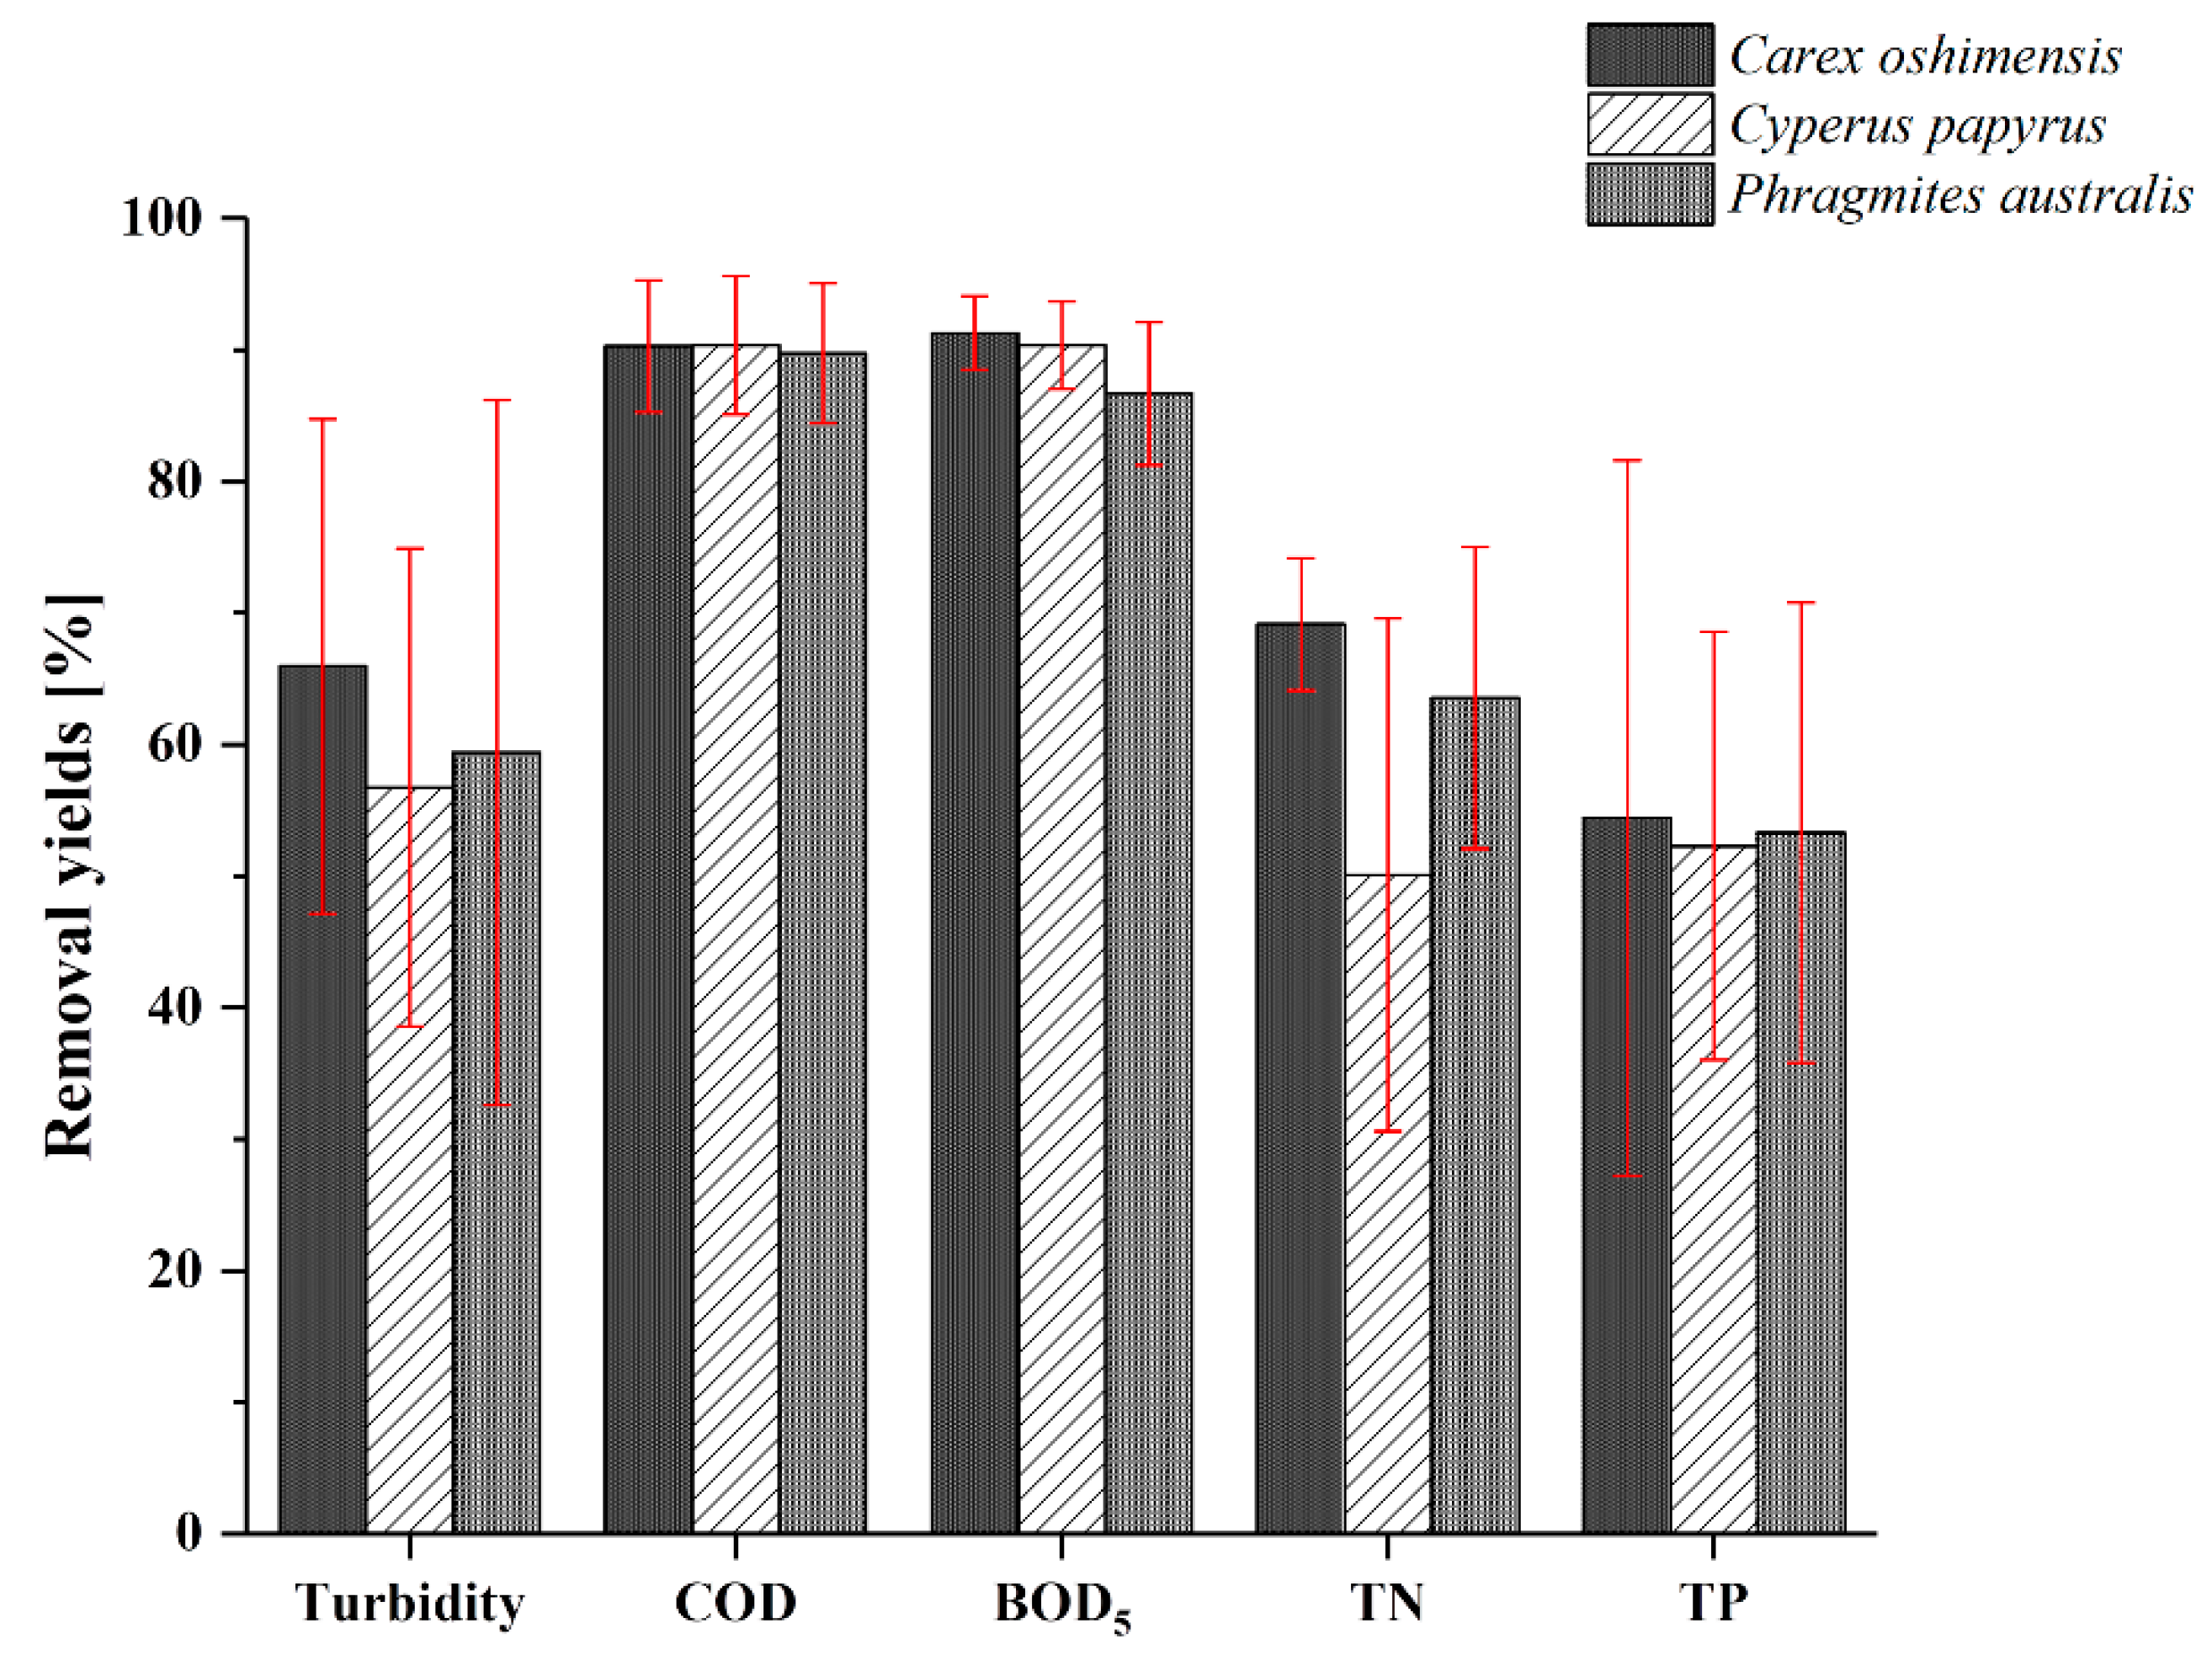
3.1. Laboratory-Scale Plant

In this first phase, a laboratory-scale HFCW was used to separately test the performance of three different types of macrophytes (Carex oshimensis, Cyperus papyrus and Phragmites australis). The influent and the effluent pH, conductivity, turbidity and concentration of COD, BOD5, TN and TP are shown in Table 1.
The pH was unchanged compared to that of the influent GW and this result was noted for all types of macrophytes studied. Moreover, the pH ranges remained within the recommended range for the existence of the majority of treatment bacteria (4.0 < pH < 9.5) [47], denitrifiers (7.5 < pH < 9.0) [64], and nitrifiers (7.5 < pH < 8.0) [65]. Compared to the influential GW, the conductivity significantly increased in all three units with the highest maximum values noted in the unit cultivated with Cyperus papyrus. This increase was probably due to the dissolution of some salt components present in the soil of the HFCW at the passage of the GW to be treated.
Furthermore, from the results obtained it is possible to highlight that all three types of plants showed significant removal yields on all the other chemical and chemical–physical parameters analysed (Figure 3). In terms of mean value, Carex oshimensis had the highest removal yields of turbidity (66%), BOD5 (91%), TN (69%) and TP (54%). COD was removed in equal percentage (90%) from the three plants studied. Cyperus papyrus also showed good results on BOD5 removal (90%). Phragmites australis showed results comparable to the other two types of plants, but slightly lower in terms of mean value than those obtained with the Carex oshimensis in turbidity (59%), BOD5 (87%) and TN (64%) removal.
Therefore, the performance of the three macrophytes on the removal of each single pollutant was very similar and there were no significant statistical differences (p-value was always higher than 0.05). The good results for Carex oshimensis were not obvious; in fact, literature on the application of this macrophyte for the treatment of real GW is absent. Carex oshimensis and Cyperus papyrus were chosen for combined use in the pilot-scale implant for several reasons:
(i)
Test alternative solutions to well-known Phragmites australis and obtain other data on Carex oshimensis application on real GW treatment.
(ii)
Nema et al. [50] highlighted that Phragmites australis showed good results on GW treatment in the short-term, but the same high performance cannot be maintained for a longer time without periods of rest. The pilot-scale implant overcomes this aspect.
(iii)
One of the limits of Carex oshimensis is certainly linked to the shallow depth that its roots reach (maximum 10–30 cm) [59]. Therefore, the combination of Carex oshimensis and Cyperus papyrus guarantee to overcome this limit positioning Carex oshimensis in the part closest to the entrance of the GW, and locating Cyperus papyrus (characterized by a deeper root system) in the central part of the pilot-scale plant (For further details, please see Section 2.1).

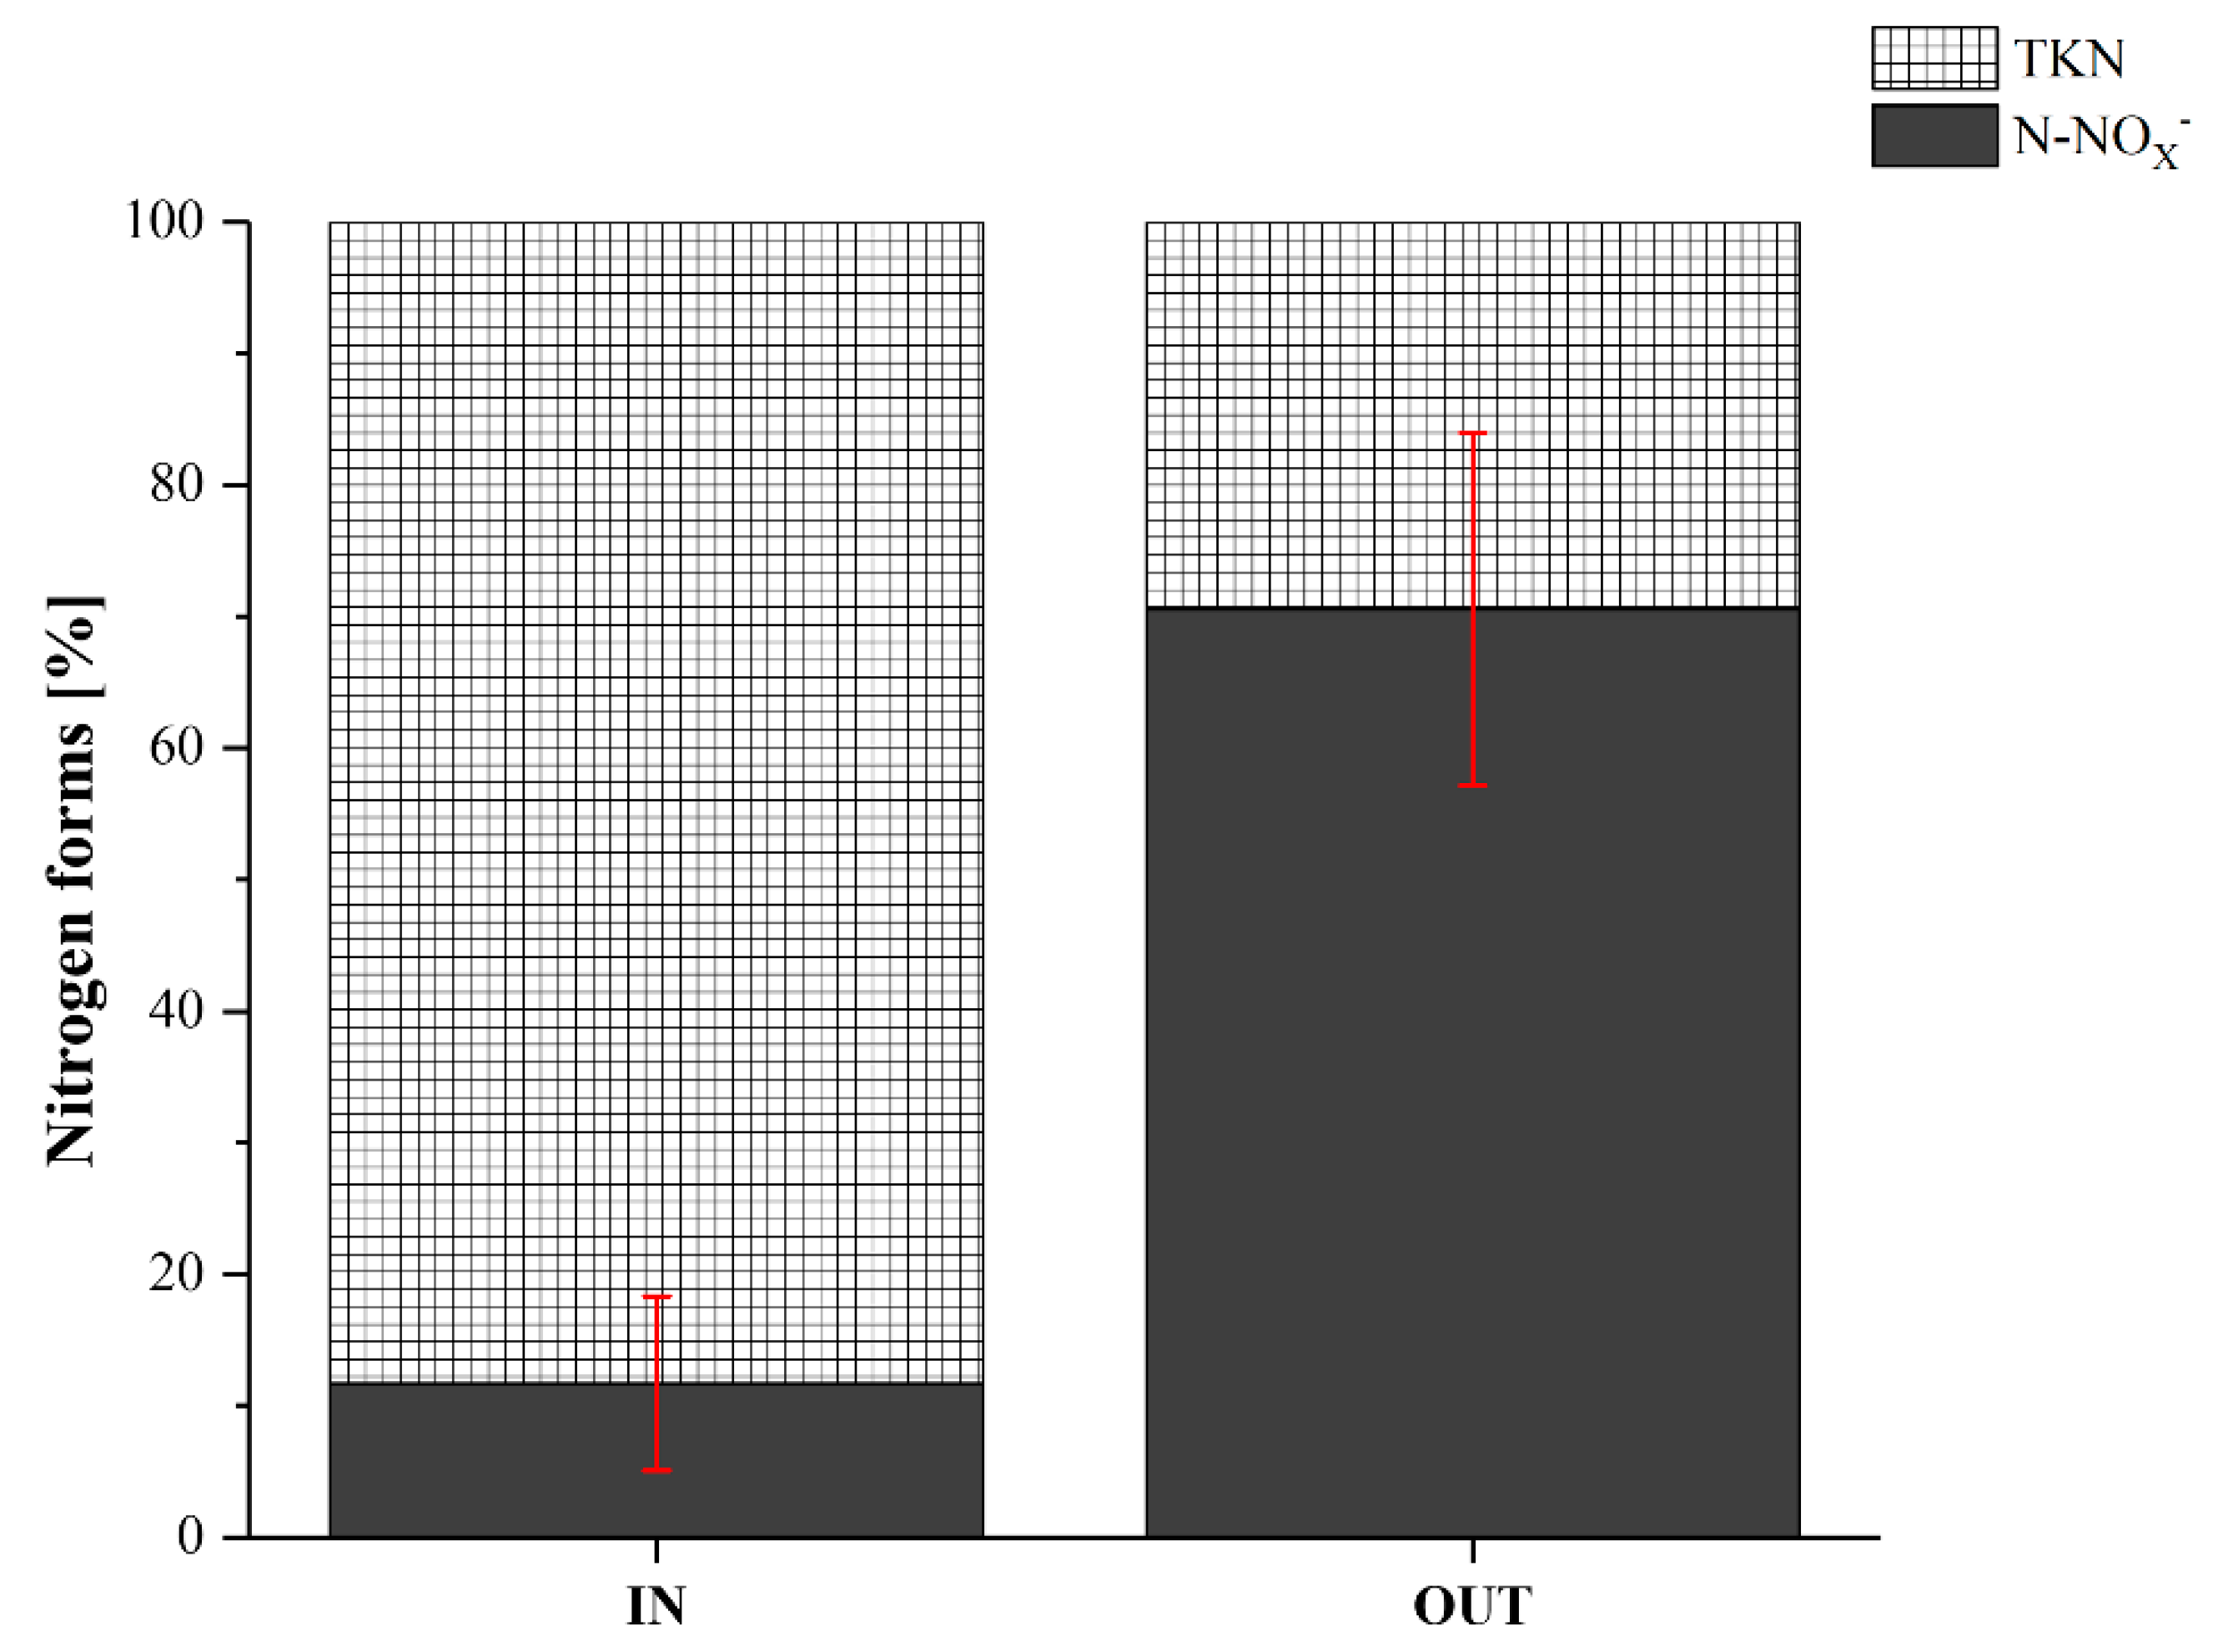
3.2. Pilot-Scale Plant

The aim was to study the performance of Carex oshimensis and Cyperus papyrus at a larger scale and evaluate the influence of HRT. Two different phases were conducted: (i) phase P1 with HRT equals to 1 day and (ii) phase P2 with HRT of 3 days. Given the purposes, in addition to the parameters already monitored in the previous phase, a series of additional parameters were also monitored, namely TSS, N-NO2, N-NO3, total Kjeldahl nitrogen (TKN) and Escherichia coli.
Concerning pH, in both cases the results confirmed what was already highlighted in the laboratory phase of the study: a substantially unchanged situation between influent and treated GW (Table 2). Conductivity increased considerably with the 3 days HRT. The increase was probably due to the dissolution of saline components present in the soil. In fact, by decreasing the contact time in the system (HRT = 1 day), the dissolution of the saline components was not detected.
Table 2 shows similar results for turbidity, COD and BOD5 in both cases. Compared to the laboratory phase, much more significant removal yields of the turbidity (>92%) were obtained in the pilot-scale HFCW compared to the laboratory-scale plant. Excluding the influence of HRT (removal yields changing HRT were very similar), this result could be related to the combination of the two different macrophytes. The removal data of COD, BOD5 and TP obtained in the laboratory-scale reactor were fully confirmed.
The excellent removal yield of TSS and Escherichia coli can be highlighted. These results were also confirmed by other literature studies that highlighted the significant effect of CW in reducing health risk [45,49].
By increasing the HRT from 1 to 3 days, there seemed to be no substantial improvement in the performance of the HFCW except for the increase from 50.7% to 54.6% of the TP removal.
Regarding the TN, a higher removal (77.6%) was observed with HRT equal to 1 day (phase P1) compared to 42.5% obtained with a HRT of 3 days (phase P2). This was in contrast with literature reporting an increase in HRT produced higher removals of TN [66].
This result could be related with to incomplete denitrification in phase P2. The larger part of TN in the influent GW was composed of N-NH4+ and Norg (Figure 4). The ability of Carex oshimensis and Cyperus papyrus to oxygenate the rhizosphere creating an area useful for the growth of nitrifying aerobic bacteria [67,68] allowed the transformation of ammonia in nitrates. Furthermore, the pH of the influent GW and of the effluent was always within the optimal range for the development and growth of nitrifying bacteria (Table 2). By monitoring the DO (Dissolved Oxygen) in the GW entering and leaving the filter, a slight decrease was found (5.16 to 4.06 mg L−1, on average). This decrease could be associated with the large demand of oxygen by the bacteria for degradation of organic substances and for nitrification, which therefore employ not only the oxygen introduced by the roots in the rhizosphere, but also the DO present in the GW. However, the nitrates remained in the system due to the absence of anoxic conditions or, more likely, to the low availability of organic matter available to denitrifiers. In fact, the average concentrations of COD and BOD5 in the influential GW of phase P2 were, respectively, 15% and 51% lower than in phase P1.
Another aspect that can be observed from the results was that the concentration of pollutants in the effluent had a much lower variability than the inlet concentrations (e.g., turbidity). This result was already detectable in the first phase of the experimentation and, given the larger dimensions of the HFCW, it was more evident both in phase P1 and in phase P2.

3.3. Comparison with Regulatory Parameters for Reuse

At an international level, the legislative framework on the reuse of GW after treatment is still very heterogeneous. Few countries have adopted legislation, including emerging ones where the treatment and recovery of these waters could represent a significant opportunity. Internationally, the WHO issued recommendations prescribing minimum requirements that the legislation should guarantee according to the final reuse of the purified GW [69]. However, these recommendations concern only a limited number of parameters (TSS, BOD5 and microbiological parameters) (Table 3). In order to standardize the regulatory framework, which is at times completely absent in some member countries, the EU also issued guidelines dividing the minimum requirements based on the type of reuse (agricultural, industrial, energy) [70].
By comparing the concentrations of the parameters analysed with those recommended by WHO, it can be stated that the GW treated with Carex oshimensis and Cyperus papyrus met the acceptance requirements for the irrigation of ornamental fruit trees and fodder crops. The BOD5 and microbiological parameter represented the critical values that prevented the reuse of the effluent of phase P1 and P2, respectively, for irrigation of vegetables likely to be eaten uncooked. The effluent from phase P2 (HRT = 3 days) can be classified as a water of Class C according to EU recommendations. Therefore, it can be used to irrigate (with drip irrigation only) food crops consumed raw where the edible portion is produced above ground and is not in direct contact with reclaimed water, processed food crops and non-food crops, including crops to feed milk- or meat-producing animals. Industrial reuse, energy reuse, and seeded crops irrigation are allowed, and in this case all irrigation methods are authorized.
Due to the critical value of BOD5, the treated effluent from phase P1 cannot be reused without further treatment.
Therefore, in order to have a treated GW quality capable of satisfying the most stringent requirements for potential urban reuse (e.g. toilet flushing) or for the irrigation of food crops where the edible portion is in direct contact with reclaimed water, it is necessary to intervene on the most critical parameters: BOD5 and the microbiological parameter. There could be two complementary solutions: (i) plan to couple the HFCW technology with a disinfection process for bacteria removal (preferably not using oxidizing agents such as Cl2 because it can form harmful disinfection by-products in presence of organic matter [71]), and (ii) ensure higher HRT (more than 3 days) in the system in order to improve the removal performance of BOD5.

4. Conclusions

In this study, a real GW was treated in order to test the performance of an HFCW. In the first phase Carex oshimensis, Cyperus papyrus, and Phragmites australis were separately tested in a laboratory-scale reactor in order to detect the performances of the three macrophytes. The results were very similar and Carex oshimensis and Cyperus papyrus were tested together on a pilot-scale reactor. The pilot-scale HFCW provided very high removal yields on turbidity (>92%), TSS (>85%), COD (>89%), and BOD5 (>88%). By increasing the HRT from 1 to 3 days, there appeared to be no substantial improvement in the performance of the HFCW except for the increase from 50.7% to 54.6% for the TP removal. A low removal of TN (42.5%) was observed in phase P2 when HRT equaled 3 days. It can be related to the low availability of organic matter in this phase, which led to incomplete denitrification. By comparing the results with the WHO and EU recommendations, it can be stated that in order to strengthen the quality of the treated GW, it is necessary to intervene on the most critical parameters: BOD5 and the microbiological parameter. There could be two complementary solutions: (i) plan to couple the HFCW technology with a disinfection process for bacteria removal, and (ii) ensure higher HRT (more than 3 days) in the system to improve the removal yield of BOD5.

Author Contributions

Conceptualization, M.C.M. and S.S.; Methodology, M.C.C., S.S. and V.T.; Validation, M.C.C., V.T., and E.C.R.; Investigation, F.H.G. and M.C.M.; Visualization and Supervision, M.C.C. and S.S. All authors have read and approved the final manuscript.

Funding

This research received no external funding.

Acknowledgments

The authors wish to thank Emanuele Ameglio and Fausta Prandini for their technical support.

Conflicts of Interest

The authors declare no conflict of interest.

Nomenclature

BODBiochemical oxygen demand
CODChemical oxygen demand
CWConstructed wetland
DODissolved oxygen
EEAEuropean Environmental Agency
EUEuropean Union
GWGreywater
HDPEHigh-density polyethylene
HFCWHorizontal flow constructed wetland
HRTHydraulic retention time
Phase P1Phase of pilot-scale reactor with HRT equals to 1 day
Phase P2Phase of pilot-scale reactor with HRT equals to 3 days
PVCPolyvinyl chloride
TKNTotal Kjeldahl nitrogen
TNTotal nitrogen
TPTotal phosphorus
TSSTotal suspended solids
VFCWVertical flow constructed wetlands
WEIWater exploitation index
WHOWorld Health Organization
WWWastewater

References

  1. Fitton, N.; Alexander, P.; Arnell, N.; Bajzelj, B.; Calvin, K.; Doelman, J.; Gerber, J.S.; Havlik, P.; Hasegawa, T.; Herrero, M.; et al. The vulnerabilities of agricultural land and food production to future water scarcity. Glob. Environ. Chang. 2019, 58, 101944. [Google Scholar] [CrossRef]
  2. Jiang, L.; Guli·Jiapaer; Bao, A.; Yuan, Y.; Zheng, G.; Guo, H.; Yu, T.; De Maeyer, P. The effects of water stress on croplands in the Aral Sea basin. J. Clean. Prod. 2020, 254, 120114. [Google Scholar] [CrossRef]
  3. UNESCO. The United Nations World Water Development Report—Leaving no One Behind; UN iLibrary: Paris, France, 2019. [Google Scholar]
  4. FAO. Coping with Water Scarcity—An Action Framework for Agriculture and Food Security; Food and Agriculture Organization of the United Nations: Rome, Italy, 2008. [Google Scholar]
  5. Santasmasas, C.; Rovira, M.; Clarens, F.; Valderrama, C. Grey water reclamation by decentralized MBR prototype. Resour. Conserv. Recycl. 2013, 72, 102–107. [Google Scholar] [CrossRef]
  6. EEA. Water Scarcity and Drought in the European Union; European Commission: Brussels, Belgium, 2010. [Google Scholar]
  7. EC. Water is Too Precious to Waste. Available online: https://ec.europa.eu/environment/water/pdf/water_reuse_factsheet_en.pdf (accessed on 1 February 2020).
  8. Cui, R.Y.; Calvin, K.; Clarke, L.; Hejazi, M.; Kim, S.; Kyle, P.; Patel, P.; Turner, S.; Wise, M. Regional responses to future, demand-driven water scarcity. Environ. Res. Lett. 2018, 13, 094006. [Google Scholar] [CrossRef]
  9. Garrote, L.; Iglesias, A.; Granados, A. Country-level assessment of future risk of water scarcity in Europe. In Proceedings of the International Association of Hydrological Sciences, Beijing, China, 13–15 June 2018; Volume 379, pp. 455–462. [Google Scholar]
  10. Suárez-Almiñana, S.; Pedro-Monzonís, M.; Paredes-Arquiola, J.; Andreu, J.; Solera, A. Linking Pan-European data to the local scale for decision making for global change and water scarcity within water resources planning and management. Sci. Total Environ. 2017, 603–604, 126–139. [Google Scholar]
  11. Gampe, D.; Nikulin, G.; Ludwig, R. Using an ensemble of regional climate models to assess climate change impacts on water scarcity in European river basins. Sci. Total Environ. 2016, 573, 1503–1518. [Google Scholar] [CrossRef]
  12. EEA. Is Europe’s Freshwater Use Sustainable? Available online: https://www.eea.europa.eu/highlights/world-water-day-is-europe (accessed on 1 February 2020).
  13. EEA. Water Scarcity. Available online: https://www.eea.europa.eu/archived/archived-content-water-topic/featured-articles/water-scarcity (accessed on 1 February 2020).
  14. Serra, P.; Pons, X. Two Mediterranean irrigation communities in front of water scarcity: A comparison using satellite image time series. J. Arid. Environ. 2013, 98, 41–51. [Google Scholar] [CrossRef]
  15. Trulli, E.; Torretta, V.; Rada, E.C. Water restoration of an urbanized karst stream by free-water-surface constructed wetlands as municipal wastewater posttreatment. UPB Sci. Bull. 2016, 78, 163–174. [Google Scholar]
  16. Elbana, T.A.; Bakr, N.; Elbana, M. Reuse of treated wastewater in Egypt: Challenges and opportunities. Handb. Environ. Chem. 2019, 75, 429–453. [Google Scholar]
  17. Baawain, M.; Almamun, M.; Omidvarborna, H.; Al-Sabti, A.; Choudri, B.S. Public perceptions of reusing treated wastewater for urban and industrial applications: Challenges and opportunities. Environ. Dev. Sustain. 2018, 22, 1–13. [Google Scholar] [CrossRef]
  18. Collivignarelli, M.C.; Carnevale Miino, M.; Baldi, M.; Manzi, S.; Abbà, A.; Bertanza, G. Removal of non-ionic and anionic surfactants from real laundry wastewater by means of a full-scale treatment system. Process Saf. Environ. Prot. 2019, 132, 105–115. [Google Scholar] [CrossRef]
  19. Collivignarelli, M.C.; Abbà, A.; Carnevale Miino, M.; Arab, H.; Bestetti, M.; Franz, S. Decolorization and biodegradability of a real pharmaceutical wastewater treated by H2O2-assisted photoelectrocatalysis on TiO2 meshes. J. Hazard. Mater. 2019, 387, 121668. [Google Scholar] [CrossRef] [PubMed]
  20. Collivignarelli, M.C.; Abbà, A.; Benigna, I. The reuse of biosolids on agricultural land: Critical issues and perspective. Water Environ. Res. 2019, 1196. [Google Scholar] [CrossRef] [PubMed]
  21. Fu, Q.; Malchi, T.; Carter, L.J.; Li, H.; Gan, J.; Chefetz, B. Pharmaceutical and personal care products: From wastewater treatment into agro-food systems. Environ. Sci. Technol. 2019, 53, 14083–14090. [Google Scholar] [CrossRef] [PubMed] [Green Version]
  22. Egea-Corbacho Lopera, A.; Gutiérrez Ruiz, S.; Quiroga Alonso, J.M. Removal of emerging contaminants from wastewater using reverse osmosis for its subsequent reuse: Pilot plant. J. Water Process Eng. 2019, 29, 100800. [Google Scholar] [CrossRef]
  23. Macías-García, A.; García-Sanz-Calcedo, J.; Carrasco-Amador, J.P.; Segura-Cruz, R. Adsorption of paracetamol in hospital wastewater through activated carbon filters. Sustainability 2019, 11, 2672. [Google Scholar] [CrossRef] [Green Version]
  24. Ricciardi, P.; Cillari, G.; Carnevale Miino, M.; Collivignarelli, M.C. Valorization of agro-industry residues in the building and environmental sector: A review. Waste Manag. Res. 2020, 1–27. [Google Scholar] [CrossRef]
  25. EC. Circular Economy: Implementation of the Circular Economy Action Plan. Available online: http://ec.europa.eu/environment/circular-economy/index_en.htm (accessed on 20 April 2019).
  26. Ragazzi, M.; Fedrizzi, S.; Rada, E.C.; Ionescu, G.; Ciudin, R.; Cioca, L.I. Experiencing urban mining in an Italian municipality towards a circular economy vision. Energy Procedia 2017, 119, 192–200. [Google Scholar] [CrossRef]
  27. Collivignarelli, M.C.; Canato, M.; Abbà, A.; Carnevale Miino, M. Biosolids: What are the different types of reuse? J. Clean. Prod. 2019, 117844. [Google Scholar] [CrossRef] [Green Version]
  28. Collivignarelli, M.C.; Abbà, A.; Frattarola, A.; Carnevale Miino, M.; Padovani, S.; Katsoyiannis, I.; Torretta, V. Legislation for the reuse of biosolids on agricultural land in Europe: Overview. Sustainability 2020, 11, 6015. [Google Scholar] [CrossRef] [Green Version]
  29. Villarín, M.C.; Merel, S. Paradigm shifts and current challenges in wastewater management. J. Hazard. Mater. 2020, 390, 122139. [Google Scholar] [CrossRef] [PubMed]
  30. Kiselev, A.V.; Magaril, E.R.; Rada, E.C. Energy and sustainability assessment of municipal wastewater treatment under circular economy paradigm. Wit. Trans. Ecol. Environ. 2019, 237, 109–120. [Google Scholar]
  31. Dominguez, S.; Laso, J.; Margallo, M.; Aldaco, R.; Rivero, M.J.; Irabien, Á.; Ortiz, I. LCA of greywater management within a water circular economy restorative thinking framework. Sci. Total Environ. 2018, 621, 1047–1056. [Google Scholar] [CrossRef] [PubMed]
  32. Boano, F.; Caruso, A.; Costamagna, E.; Ridolfi, L.; Fiore, S.; Demichelis, F.; Galvão, A.; Pisoeiro, J.; Rizzo, A.; Masi, F. A review of nature-based solutions for greywater treatment: Applications, hydraulic design, and environmental benefits. Sci. Total Environ. 2020, 711, 134731. [Google Scholar] [CrossRef] [PubMed]
  33. Hlavínek, P.; Negm, M.A.; Zelenakova, M. Management of water quality and quantity. In Water Reuse in Urban Areas; Springer International Publishing: Cham, Switzerland, 2020; Chapter 8; pp. 195–217. [Google Scholar]
  34. Noutsopoulos, C.; Andreadakis, A.; Kouris, N.; Charchousi, D.; Mendrinou, P.; Galani, A.; Mantziaras, I.; Koumaki, E. Greywater characterization and loadings—Physicochemical treatment to promote onsite reuse. J. Env. Manag. 2018, 216, 337–346. [Google Scholar] [CrossRef]
  35. Oteng-Peprah, M.; Acheampong, M.A.; DeVries, N.K. Greywater characteristics, treatment systems, reuse strategies and user perception—A review. Water Air Soil Pollut. 2018, 229, 255. [Google Scholar] [CrossRef] [Green Version]
  36. Oron, G.; Adel, M.; Agmon, V.; Friedler, E.; Halperin, R.; Leshem, E.; Weinberg, D. Greywater use in Israel and worldwide: Standards and prospects. Water Res. 2014, 58, 92–101. [Google Scholar] [CrossRef]
  37. Albalawneh, A.; Chang, T.-K.; Alshawabkeh, H. Greywater treatment by granular filtration system using volcanic tuff and gravel media. Water Sci. Technol. 2017, 75, 2331–2341. [Google Scholar] [CrossRef]
  38. Ungvári, C.; Izbéki-Szabolcsik, A.; Bodnár, I. Analysis of greywater samples treated by filtration. Műszaki Tudományos Közlemények 2018, 9, 247–250. [Google Scholar]
  39. Huelgas-Orbecido, A.; Funamizu, N. Membrane system for gray water. In Resource-Oriented Agro-Sanitation Systems; Springer Japan: Tokyo, Japan, 2019; pp. 185–193. [Google Scholar]
  40. Sushmitha, M.B.; Chanakya, H.N.; Khuntia, H.K. Efficient grey water treatment and reuse options for India—A Review. In Waste Water Recycling and Management; Springer Singapore: Singapore, 2019; pp. 143–149. [Google Scholar]
  41. Rojas-Z, U.; Fajardo-O, C.; Moreno-Andrade, I.; Monroy, O. Greywater treatment in an aerobic SBR: Sludge structure and kinetics. Water Sci. Technol. 2017, 76, 1535–1544. [Google Scholar] [CrossRef]
  42. Kumar Khuntia, H.; Hameed, S.; Janardhana, N.; Chanakya, H. Greywater treatment in aerobic bio-reactor with macropore mesh filters. J. Water Process Eng. 2019, 28, 269–276. [Google Scholar] [CrossRef]
  43. Abdel-Shafy, H.I.; Mansour, M.S.M.; Al-Sulaiman, A.M. Anaerobic/aerobic integration via UASB/enhanced aeration for greywater treatment and unrestricted reuse. Water Pract. Technol. 2019, 14, 837–850. [Google Scholar] [CrossRef]
  44. Butkovskyi, A.; Sevenou, L.; Meulepas, R.J.W.; Hernandez Leal, L.; Zeeman, G.; Rijnaarts, H.H.M. Micropollutant removal from black water and grey water sludge in a UASB-GAC reactor. Water Sci. Technol. 2018, 77, 1137–1148. [Google Scholar] [CrossRef] [PubMed]
  45. Arden, S.; Ma, X. Constructed wetlands for greywater recycle and reuse: A review. Sci. Total Environ. 2018, 630, 587–599. [Google Scholar] [CrossRef] [PubMed]
  46. Ramprasad, C.; Smith, C.S.; Memon, F.A.; Philip, L. Removal of chemical and microbial contaminants from greywater using a novel constructed wetland: GROW. Ecol. Eng. 2017, 106, 55–65. [Google Scholar] [CrossRef] [Green Version]
  47. Gupta, P.; Ann, T.; Lee, S.-M. Use of biochar to enhance constructed wetland performance in wastewater reclamation. Environ. Eng. Res. 2016, 21, 36–44. [Google Scholar] [CrossRef] [Green Version]
  48. Pérez-Salazar, R.; Mora-Aparicio, C.; Alfaro-Chinchilla, C.; Sasa-Marín, J.; Scholz, C.; Rodríguez-Corrales, J.Á. Biogardens as constructed wetlands in tropical climate: A case study in the Central Pacific Coast of Costa Rica. Sci. Total Environ. 2019, 658, 1023–1028. [Google Scholar] [CrossRef]
  49. Kivaisi, A.K. The potential for constructed wetlands for wastewater treatment and reuse in developing countries: A review. Ecol. Eng. 2001, 16, 545–560. [Google Scholar] [CrossRef]
  50. Nema, A.; Yadav, K.D.; Christian, R.A. Sustainability and performance analysis of constructed wetland for treatment of greywater in batch process. Int. J. Phytoremediat. 2019, 1–9. [Google Scholar] [CrossRef]
  51. EPA. Wastewater Technology Fact Sheet—Wetlands: Subsurface Flow; EPA: Washington, DC, USA, 2000.
  52. Laaffat, J.; Aziz, F.; Ouazzani, N.; Mandi, L. Biotechnological approach of greywater treatment and reuse for landscape irrigation in small communities. Saudi J. Biol. Sci. 2019, 26, 83–90. [Google Scholar] [CrossRef]
  53. Ramprasad, C.; Philip, L. Surfactants and personal care products removal in pilot scale horizontal and vertical flow constructed wetlands while treating greywater. Chem. Eng. J. 2016, 284, 458–468. [Google Scholar] [CrossRef]
  54. Ramprasad, C.; Philip, L. Greywater treatment using horizontal, vertical and hybrid flow constructed wetlands. Curr. Sci. 2018, 114, 155–165. [Google Scholar] [CrossRef]
  55. Qomariyah, S.; Ramelan, A.; Sobriyah; Setyono, P. Use of macrophyte plants, sand & gravel materials in constructed wetlands for greywater treatment. IOP Conf. Ser. Mater. Sci. Eng. 2017, 176, 012018. [Google Scholar]
  56. Memon, M.; Jatoi, H.B.; Narejo, A.M.; Mahar, R.B.; Ansari, A.K.; Bhanger, M.I. Use of aquatic plants for treatment of greywater. Pak. J. Bot. 2017, 49, 375–381. [Google Scholar]
  57. Mburu, N.; Rousseau, D.P.L.; van Bruggen, J.J.A.; Lens, P.N.L. Use of the macrophyte Cyperus papyrus in wastewater treatment. In The Role of Natural and Constructed Wetlands in Nutrient Cycling and Retention on the Landscape; Springer International Publishing: Cham, Switzerland, 2015; pp. 293–314. [Google Scholar]
  58. Masotti, L.; Verlicchi, P. Water purification of small communities. In Natural Techniques and Engineering Techniques; Hoepli Editor: Milan, Italy, 2005. (In Italian) [Google Scholar]
  59. EPA. Free Water Surface Wetlands for Wastewater Treatment: A Technology Assessment; EPA: Phoenix, Arizona, 1999.
  60. APHA. Standard Methods for the Examination of Water and Wastewater, 22nd ed.; APHA: Washington, DC, USA, 2012. [Google Scholar]
  61. Molleda, P.; Blanco, I.; Ansola, G.; de Luis, E. Removal of wastewater pathogen indicators in a constructed wetland in Leon, Spain. Ecol. Eng. 2008, 33, 252–257. [Google Scholar] [CrossRef]
  62. Sleytr, K.; Tietz, A.; Langergraber, G.; Haberl, R. Investigation of bacterial removal during the filtration process in constructed wetlands. Sci. Total Environ. 2007, 380, 173–180. [Google Scholar] [CrossRef]
  63. EPA. Subsurface Flow Constructed Wetlands for Wastewater Treatment A Technology Assessment; EPA: Phoenix, Arizona, 1993.
  64. Glass, C.; Silverstein, J. Denitrification kinetics of high nitrate concentration water: pH effect on inhibition and nitrite accumulation. Water Res. 1998, 32, 831–839. [Google Scholar] [CrossRef]
  65. Antoniou, P.; Hamilton, J.; Koopman, B.; Jain, R.; Holloway, B.; Lyberatos, G.; Svoronos, S.A. Effect of temperature and ph on the effective maximum specific growth rate of nitrifying bacteria. Water Res. 1990, 24, 97–101. [Google Scholar] [CrossRef]
  66. Akratos, C.S.; Tsihrintzis, V.A. Effect of temperature, HRT, vegetation and porous media on removal efficiency of pilot-scale horizontal subsurface flow constructed wetlands. Ecol. Eng. 2007, 29, 173–191. [Google Scholar] [CrossRef]
  67. Ottosen, L.; Risgaard-Petersen, N.; Nielsen, L. Direct and indirect measurements of nitrification and denitrification in the rhizosphere of aquatic macrophytes. Aquat. Microb. Ecol. 1999, 19, 81–91. [Google Scholar] [CrossRef] [Green Version]
  68. Zhao, J.; Xu, Y.; Peng, L.; Liu, G.; Wan, X.; Hua, Y.; Zhu, D.; Hamilton, D.P. Diversity of anammox bacteria and abundance of functional genes for nitrogen cycling in the rhizosphere of submerged macrophytes in a freshwater lake in summer. J. Soils Sediments 2019, 19, 3648–3656. [Google Scholar] [CrossRef]
  69. WHO. A Compendium of Standards for Wastewater Reuse in the Eastern Mediterranean Region; World Health Organization: Geneva, Switzerland, 2006. [Google Scholar]
  70. EC. Minimum Quality Requirements for Water Reuse in Agricultural Irrigation and Aquifer Recharge—Towards a Water Reuse Regulatory Instrument at EU Level; EC: Luxembourg, 2017. [Google Scholar]
  71. Sorlini, S.; Collivignarelli, M.C.; Canato, M. Effectiveness in chlorite removal by two activated carbons under different working conditions: A laboratory study. J. Water Supply Res. Technol. 2015, 64, 450–461. [Google Scholar] [CrossRef]
Figure 1. (a) Scheme of the preliminary laboratory-scale plant. The red crosses indicate the sampling points; (b) Side view of the horizontal flow constructed wetland (HFCW) laboratory-scale plant and pilot-scale plant. HDPE: high-density polyethylene, PVC: polyvinyl chloride.
Ijerph 17 02317 g001
Figure 2. Schematic drawing of the pilot-scale plant. The red crosses indicate the sampling points. HFCW: Horizontal flow constructed wetland.
Ijerph 17 02317 g002
Figure 3. Removal yields of main chemical and chemical–physical contaminants by Carex oshimensis, Cyperus papyrus and Phragmites australis. The red bars indicate the 95% confidence intervals.
Ijerph 17 02317 g003
Figure 4. The components of the TN as a percentage by comparing the concentration of the influent GW and of the HFCW effluent in the phase P2 (HRT = 3 days). The red bars indicate the 95% confidence intervals.
Ijerph 17 02317 g004
Table 1. Overall statistics of influent greywater (GW) and effluent concentrations in each unit.
Influent GW Concentration 1Effluent Concentration
Unit 1 Carex oshimensisUnit 2 Cyperus papyrusUnit 3 Phragmites australis
pH
[–]
Mean7.57.57.67.6
C.I.0.80.70.70.7
Maximum value8.58.48.58.5
Minimum value6.86.96.96.9
Electrical conductivity
[μS cm−1]
Mean481.3809.3823.0733.7
C.I.59.3146.6250.9165.4
Maximum value5169521079891
Minimum value421699690602
Turbidity [NTU]Mean12130.841.336.2
C.I.59.46.67.512.7
Maximum value22741.149.457.8
Minimum value64222921
COD
[mg L−1]
Mean1745.3177.1171.1181.4
C.I.430.6123.8113.1111.9
Maximum value2200359330335
Minimum value1281666064
BOD5
[mg L−1]
Mean7206570107.5
C.I.153.75.71770.3
Maximum value10007095215
Minimum value550605570
TN
[mg L−1]
Mean19.25.88.86.5
C.I.51.42.11
Maximum value24812.27.6
Minimum value11.646.45.3
TP
[mg L−1]
Mean2.40.911
C.I.1.30.60.40.3
Maximum value52.11.61.4
Minimum value1.10.50.50.5
1 The values refer to the samples taken after the settling phase and immediately before the HFCW (see in detail the sampling points in Figure 1a). C.I.: confidence interval; BOD: biological oxygen demand; COD: chemical oxygen demand; TN: total nitrogen; TP: total phosphorus.
Table 2. Overall statistics of influent GW and effluent concentrations in the pilot-scale plant (phase P1 and P2) and removal yields of pollutants.
ParameterPhase P1 [HRT = 1 day]Phase P2 [HRT = 3 days]
Influent GW ConcentrationEffluent ConcentrationRemoval Yields Phase P1 [% ± C.I.] 1Influent GW ConcentrationEffluent ConcentrationRemoval Yields Phase P2 [% ± C.I.] 1
Mean Value
[± C.I.]
Maximum ValueMinimum ValueMean Value
[± C.I.]
Maximum ValueMinimum ValueMean Value
[± C.I.]
Maximum ValueMinimum ValueMean Value
[± C.I.]
Maximum ValueMinimum Value
pH
[-]
8.3
[± 0.5]
8.87.58.0
[± 0.5]
8.77.2[-]8.3
[± 0.3]
8.97.78.0
[± 0.3]
8.57.3[-]
Electrical conductivity [μS/cm]1824.6
[± 683.9]
35805311293.8
[± 191]
1884783[-]401.9
[± 52.7]
5613561071.3
[± 140.8]
1377890[-]
Turbidity [NTU]468.6
[± 157.7]
7739911.9
[± 5.1]
32395.7
[± 2.8]
66.2
[± 26.3]
127315.2
[± 3.1]
122.192
[± 3.9]
TSS
[mg L−1]
27
[± 9.3]
4441.5
[± 1.5]
5096.3
[± 3.8]
49.7
[± 17.1]
80208
[± 3.7]
16084.6
[± 7.2]
COD
[mg L−1]
1327.7
[± 275.8]
1794469122.6
[± 32.8]
2216689.5
[± 3.9]
1119
[± 350.8]
1900494119
[± 26]
1726288.8
[± 1.4]
BOD5
[mg L−1]
522.2
[± 94.4]
68628055
[± 9.6]
742688.1
[± 3.7]
255.7
[± 33.9]
34021020.6
[± 5.5]
301092
[± 2]
TN
[mg L−1]
33.6
[± 8.2]
47.216.77.2
[± 2.6]
10.82.877.6
[± 8.7]
11
[± 2.9]
177.96.1
[± 1.1]
84.742.5
[± 11.1]
N-NO2
[mg L−1]
n.a.n.a.n.a.n.a.n.a.n.a.n.a.0.3
[± 0.3]
0.70.10.1
[± 0.1]
0.40.1increase
N-NO3
[mg L−1]
n.a.n.a.n.a.n.a.n.a.n.a.n.a.0.9
[± 0.5]
1.30.13.8
[± 1.7]
4.91.3increase
TKN[mg L−1]n.a.n.a.n.a.n.a.n.a.n.a.n.a.10.3
[± 4.9]
15.53.61.9
[± 1.4]
3.1066.2
[± 14.5]
TP
[mg L−1]
5.8
[± 2.7]
132.22.1
[± 0.4]
30.850.7
[± 19.5]
2.3
[± 0.6]
3.11.61
[± 0.2]
1.40.854.6
[± 7.8]
Escherichia coli [UFC 100−1 mL−1]3.3 × 10⁴ [± 1 × 10⁴]5.0 × 1041.8 × 10217.2
[± 13.5]
6012.8 log
[± 0.8 log]
2.4 × 10⁵
[± 1.7 × 10⁵]
4 × 1051.1 × 105937
[± 361]
1.3 × 1037 × 1022.4 log
[± 0.2 log]
1 The removal yields of Escherichia coli are expressed in log scale and not as a percentage. C.I.: confidence interval; TKN: total Kjeldahl nitrogen; n.a.: not available; HRT: hydraulic retention time; TSS: total suspended solids.
Table 3. Comparison between the characteristics of the effluent and the international recommendations for the reuse of treated GW. TKN: total Kjeldahl nitrogen; n.a.: not available; n.p.: not provided.
ParametersPilot-Scale HFCW Effluent [Phase PA]Pilot-Scale HFCW Effluent [Phase PB]WHO Recommendations [69]EU Recommendations [70]
Irrigation of Ornamental Fruit Trees and Fodder CropsIrrigation of Vegetables Likely to be Eaten UncookedToilet FlushingClass A 1Class B 2Class C 3Class D 4
pH
[-]
8.0 ± 0.58 ± 0.3n.p.n.p.n.p.n.p.n.p.n.p.n.p.
Conductivity [μS cm−1]1293.8 ± 1911071 ± 141n.p.n.p.n.p.n.p.n.p.n.p.n.p.
Turbidity [NTU]11.9 ± 5.15.2 ± 3.1n.p.n.p.n.p.5n.p.n.p.n.p.
TSS
[mg L−1]
1.5 ± 1.58 ± 3.7140201010353535
COD
[mg L−1]
122.6 ± 32.8119 ± 26n.p.n.p.n.p.n.p.n.p.n.p.n.p.
BOD5
[mg L−1]
55 ± 9.620.6 ± 5.5240201010252525
TN
[mg L−1]
7.2 ± 2.66.1 ± 1.1n.p.n.p.n.p.n.p.n.p.n.p.n.p.
N-NO2
[mg L−1]
n.a.0.1 ± 0.1n.p.n.p.n.p.n.p.n.p.n.p.n.p.
N-NO3
[mg L−1]
n.a.3.8 ± 1.7n.p.n.p.n.p.n.p.n.p.n.p.n.p.
TKN
[mg L−1]
n.a.1.9 ± 1.4n.p.n.p.n.p.n.p.n.p.n.p.n.p.
TP
[mg L−1]
2.1 ± 0.41 ± 0.3n.p.n.p.n.p.n.p.n.p.n.p.n.p.
Escherichia coli
[UFC 100−1 mL−1]
17.2 ± 13.5937 ± 2371000 5200 510 51010010001000
1 Minimum reclaimed water quality for all food crops, including root crops consumed raw and food crops where the edible portion is in direct contact with reclaimed water (all irrigation methods allowed); 2 Minimum reclaimed water quality for food crops consumed raw where the edible portion is produced above ground and is not in direct contact with reclaimed water, processed food crops and nonfood crops, including crops to feed milk- or meat-producing animals (all irrigation methods allowed); 3 Minimum reclaimed water quality for food crops consumed raw where the edible portion is produced above ground and is not in direct contact with reclaimed water, processed food crops and nonfood crops including crops to feed milk- or meat-producing animals (drip irrigation only); 4 Minimum reclaimed water quality for industrial reuse, energy reuse, and seeded crops (all irrigation methods allowed); 5 This value is referred to the total number of thermotolerant coliforms.

