Article

Manifestation of an Analytic Hierarchy Process (AHP) Model on Fire Potential Zonation Mapping in Kathmandu Metropolitan City, Nepal

by
Sachin Kumar Chhetri
1 and
Prabin Kayastha
2,3,*
1
Nepal Engineering College, Center for Postgraduate Studies (nec-CPS), Balkhu, Kathmandu 44618, Nepal
2
Acme Engineering College, Postgraduate Studies and Research Center, Sitapaila, Kathmandu 44614, Nepal
3
Attic Consulting Service, Thamel, Kathmandu 44600, Nepal
*
Author to whom correspondence should be addressed.
ISPRS Int. J. Geo-Inf. 2015, 4(1), 400-417; https://doi.org/10.3390/ijgi4010400
Submission received: 27 October 2014 / Revised: 3 March 2015 / Accepted: 10 March 2015 / Published: 19 March 2015
(This article belongs to the Special Issue Geoinformation for Disaster Risk Management)

Abstract

:
Even though fewer people die as a result of fire than other natural disasters, such as earthquake, flood, landslide, etc., the average loss of property due to fire is high. Kathmandu Metropolitan City is becoming more vulnerable to fire due to haphazard urbanization and increase in population. To control problems due to fire, systematic studies are necessary, including fire potential mapping and risk assessment. This study applies an Analytic Hierarchy Process (AHP) method in Kathmandu Metropolitan City, Nepal for generation of fire potential zonation map. The fire potential zonation map is prepared on the basis of available data of land use, fuel stations, and population density. This map shows that 58.04% of the study area falls under low fire potential zone, 32.92% falls under moderate fire potential zone and 9.04% falls under high fire potential zone. The map is also validated through major past fire incidents. The results show that the predicted fire potential zones are found to be in good agreement with past fire incidents, and, hence, the map can be used for future land-use planning.

1. Introduction

Kathmandu Metropolitan City (Figure 1), the capital city of Nepal, is vulnerable to different natural disasters such as earthquake, flood, landslide, etc. In addition, the possibility of fire across Kathmandu Metropolitan City is one of them [1]. Although the number of deaths due to fire is lower than other natural disasters such as earthquake, flood, landslide, the average loss of property is high. Due to haphazard urbanization and increase in population, Kathmandu Metropolitan City is becoming more vulnerable to fire. Poor settlement planning, lack of preventive measures, inadequate fire resistant construction, poor awareness of fire hazards, lack of fire protection policies and safety codes for the use of electricity, gas, fuel combined with narrow road lanes, clustered household, use of flammable building materials, and aging water supply and electrical systems have increased the risk of fire in Kathmandu Metropolitan City [1]. Furthermore, fire-fighting water techniques cannot effectively serve newly constructed high rise buildings in Kathmandu Metropolitan City. These factors significantly increase the fire vulnerability in the city. In order to mitigate or control the problems caused by fire, a systematic study related with fire such as mapping of area affected by fire, mapping of fire potential zone and fire risk assessment have to be undertaken. However, such studies are still limited in Nepal.
Figure 1. Location of study area.
Ijgi 04 00400 g001
Different researchers have attempted to prepare fire risk maps in forests [2,3,4,5,6,7,8,9,10,11,12,13,14]. However, few researchers have prepared fire susceptibility/hazard zonation maps in the city [15,16,17,18] and fire risk maps due to fuel [19,20].
Alam and Baroi [15] assessed the risk of fire hazards in Dhaka City, Bangladesh, with a Geographic Information System (GIS) framework, in order to develop a methodology to generate fire hazard categories and risk mapping. They also gave the methodology for site selection for fire stations in a given region for effective management of dynamic resources. Rohde et al. [16] applied a Bayesian methodology to produce disaggregate spatial forecasts of residential household fires across metropolitan South-East Queensland (SEQ), Australia. Srivanit [17] used six vulnerability factors such as building material types, building height, building density, population density, building hazard occupancy and distance to available fire source; and five capacity of mitigation factors such as accessibility by road, distance to fire stations, distance to hydrants, fire history, and distance to water supply in an Analytic Hierarchy Process (AHP) technique to generate fire risk map of Chiang Mai Municipality, Thailand. Santos et al. [18] catalogued the building typologies at the old city center of Seixal, Portugal which were then used for a seismic and fire vulnerability assessment of the old building stock.
Sur and Sokhi [19] assessed the vulnerability of the vicinity of petrol stations in Dehradun, a municipality in Uttaranchal State, India. They classified the study area into three categories: very hazardous, moderately hazardous and less hazardous, on the basis of building density, land use and population present within the 200 m buffer zone of petrol pumps. Das and Harinarayana [20] analyzed all aspects related to possible oil spills and gas leakages with special reference to Gujarat state, India. They considered communication networks (roads/rail), rivers, elevation, pipeline networks, fault zones, earthquake zones, meteorological data, etc., for analysis and the possible hazardous locations and the vulnerable zones were identified by considering the datasets with logical queries using GIS.
This paper documents the application of the AHP, developed by Saaty [21,22], in preparation for a fire potential map by taking Kathmandu Metropolitan City as an example. This paper also summarizes the outcomes of fire potential mapping study in Kathmandu Metropolitan City.

2. Study Area

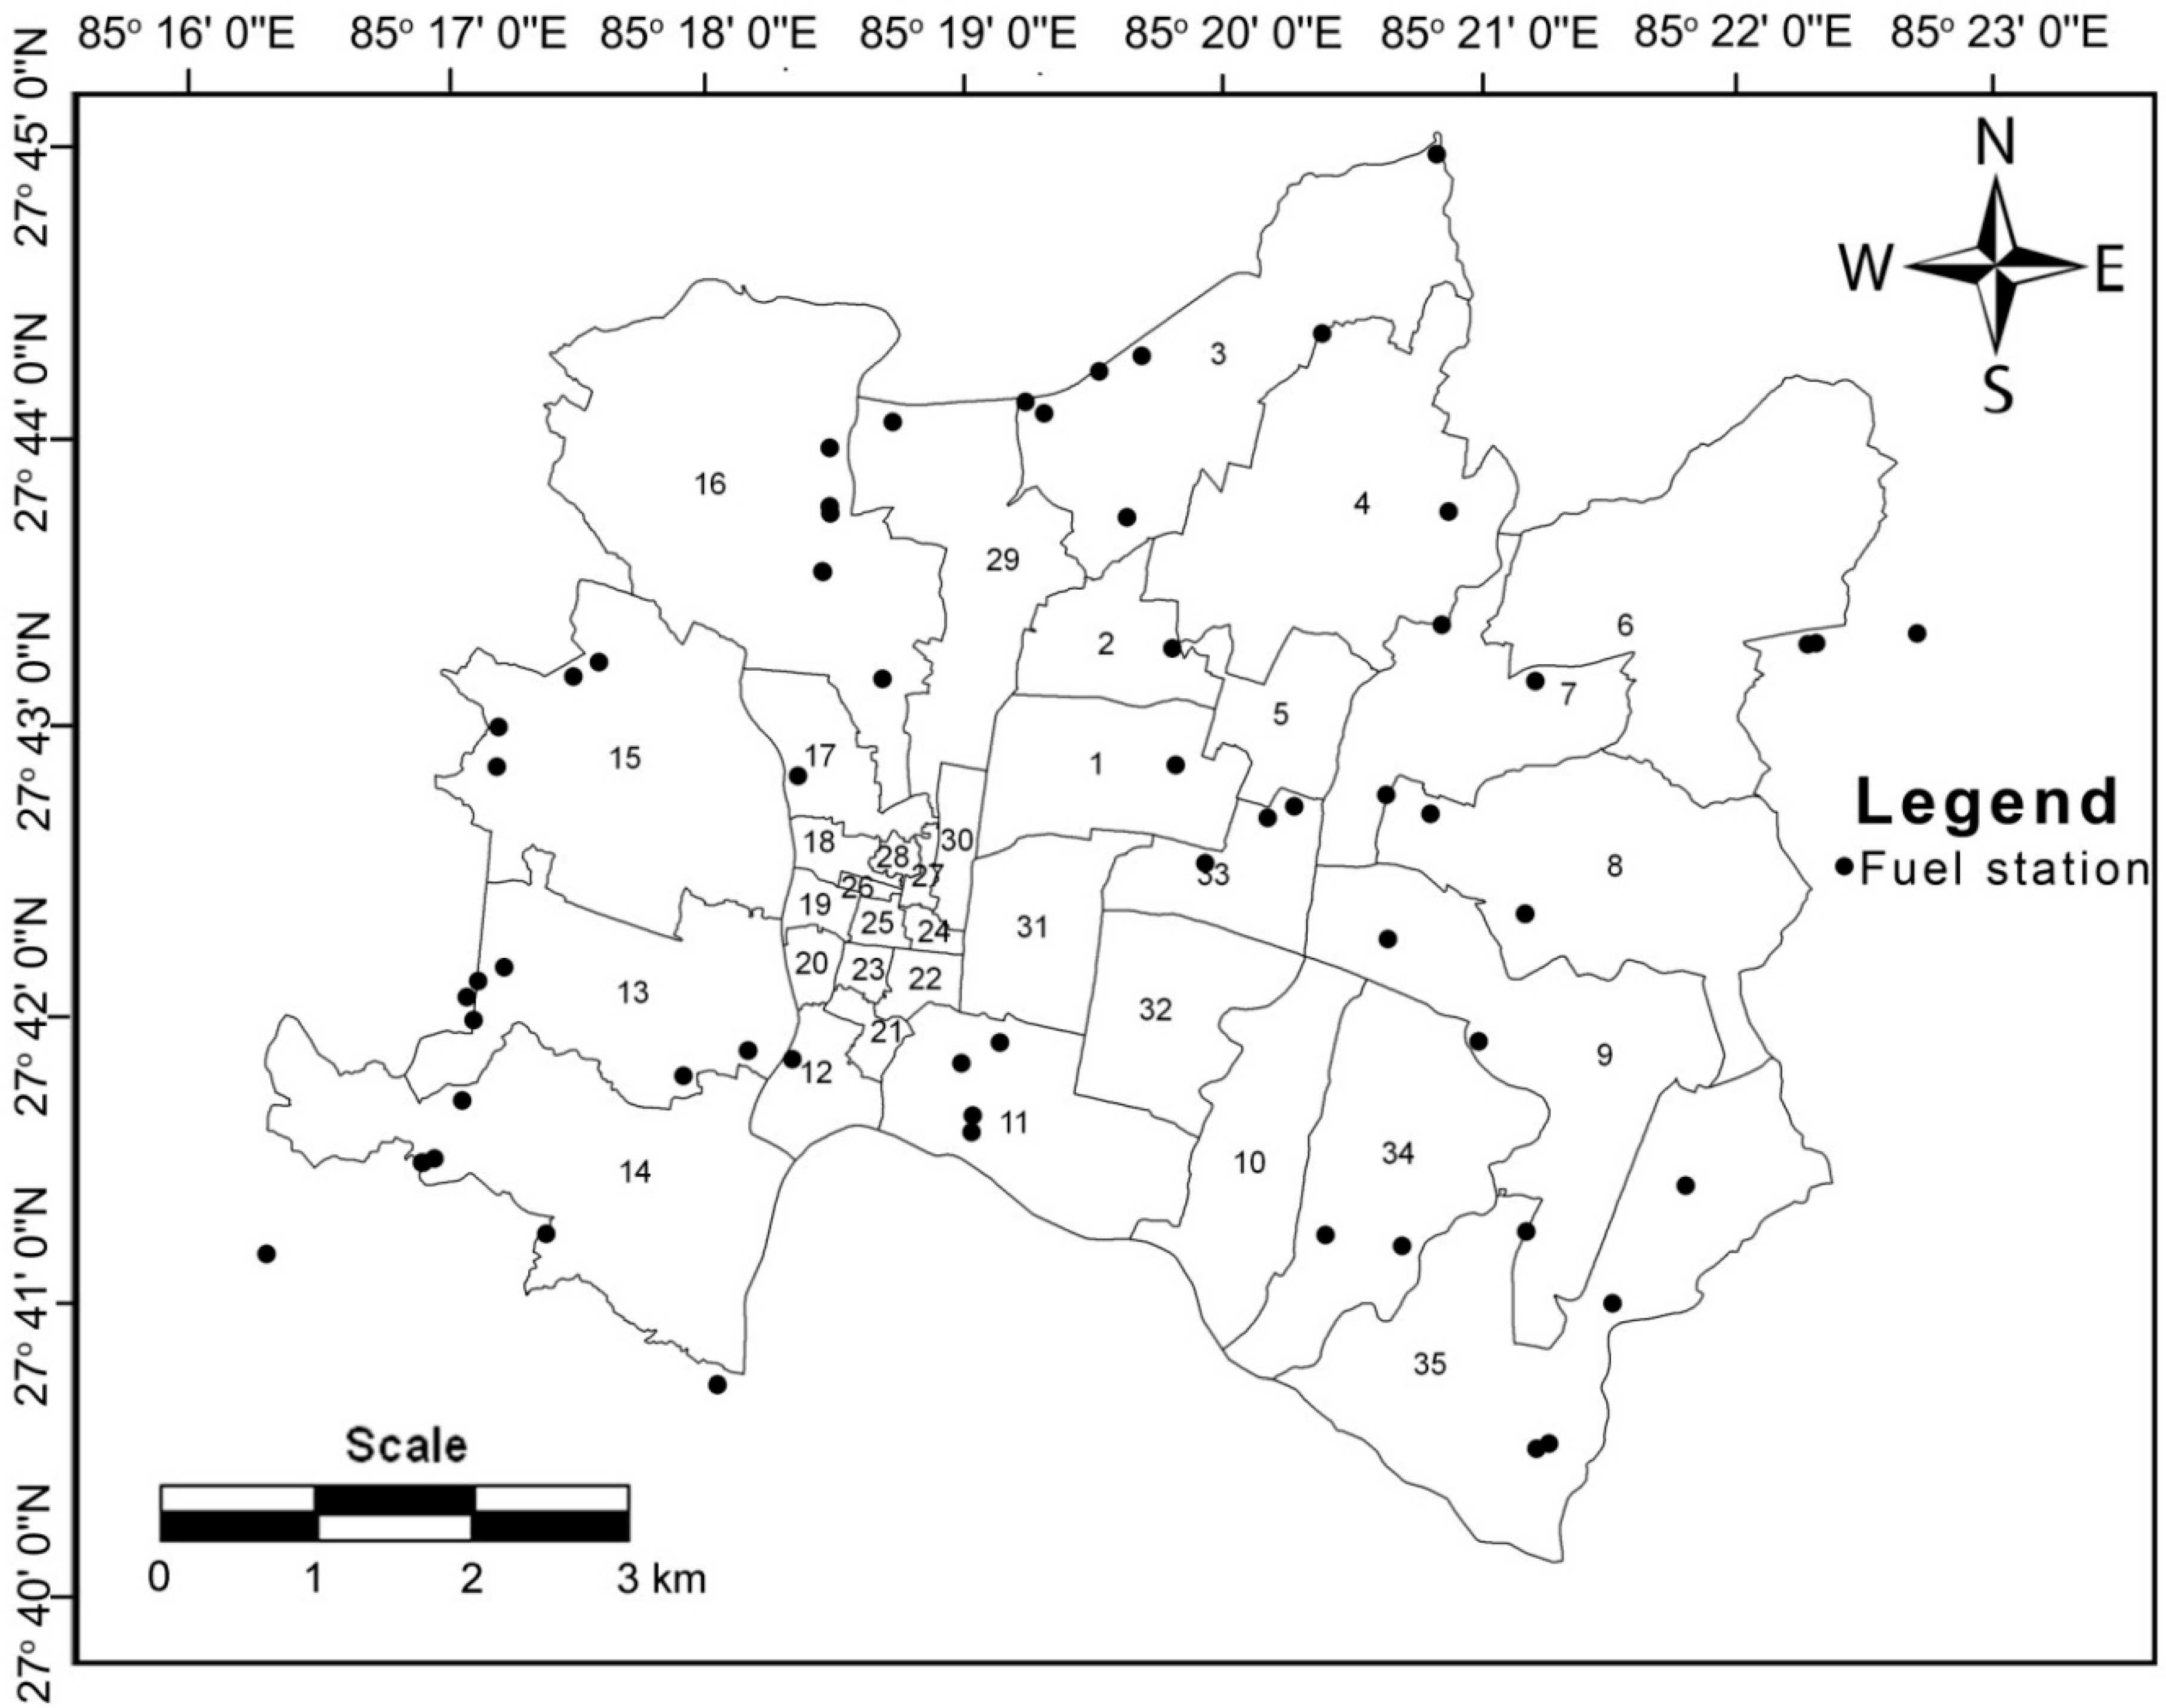
Kathmandu Metropolitan City, the capital city of Nepal, lies in Kathmandu district (Figure 1). It covers an area about 51.94 km2 with a size of 9.5 km in the east-west direction and 8.3 km in the north–south direction. It lies between latitudes 27°40′30′′ to 27°45′00′′N and longitudes 85°16′10′′ to 85°22′45′′E (Figure 2). There are 35 wards (administrative units) in this city.
The urban landscape of Kathmandu is rapidly changing. Kathmandu can now be considered as a mega city expanding further with new neighborhoods and districts. In recent decades, numerous high rise buildings are built around the city to accommodate a rapid growth in population. The rapid growth and development in Kathmandu creates an increase in the number of emergency incidents related to fires.
Figure 2. Map showing 35 wards of Kathmandu Metropolitan City with location of fuel stations.
Ijgi 04 00400 g002

3. Relevant Data

Thematic data needed for generation of fire potential map were collected from different sources:
  • Digital administrative map and land cover map of Kathmandu Metropolitan City on 1:25,000 scale from the Department of Survey, Government of Nepal;
  • Population data of the each ward of Kathmandu Metropolitan City for the year 2011 from the Central Bureau of Statistics (CBS), Government of Nepal; and
  • Location of fuel stations in Kathmandu Metropolitan City from Nepal Oil Corporation (NOC).
These data sources were used to generate thematic digital maps using GIS software. All maps are raster based with a cell size of 10 × 10 m2. The preparation procedures for each data layer are summarized below.

3.1. Distance from Fuel Stations

Nepal Oil Corporation (NOC) has specified all the possible safety norms in fuel pumps to reduce the risks associated with the damage of life and property of the people [23]. According to the NOC norms, a fuel station must possess at least two fire extinguishers, four dry sand filled buckets, water storage tanks, a spade, a fire-axe and safety gear, like fire proof clothing and masks. However, a large number of fuel stations are not found to adhere to the norms specified by NOC [24]. Most of the fuel stations have been established without any safety measures and are located so near that if the fire catches one fuel station it can spread to the nearest other fuel station resulting in huge damages [23]. A cluster of fuel stations can be seen in some areas of Kathmandu Metropolitan City (Figure 2). A blast or fire in one fuel station due to any sparks could destroy a large number of structures within a 500 m radius distance approximately [25].
The location and number of the fuel stations are very significant for the area intended to protect from fire. The location of such fuel stations is collected by using Geographical Position System (GPS) instrument in the field. A thematic map of a potential fire disaster prone area is derived by classifying the study area into five zones (Figure 3), i.e., (i) < 50 m; (ii) 50–100 m; (iii) 100–200 m; (iv) 200–500 m and (v) > 500 m from the fuel station.
Figure 3. Map showing distance from fuel stations in the study area.
Ijgi 04 00400 g003

3.2. Land Use

Land use is one of the most important factors for fire risk mapping. Based on the land use map prepared by the Department of Survey, Government of Nepal and different field studies, nine land use classes are considered (Figure 4), namely (i) built-up area; (ii) cultivation; (iii) plantation; (iv) open area; (v) water body; (vi) road; (vii) airport runway (viii) playground and (ix) sandy area. As most of land use types in Kathmandu Metropolitan City are covered by built-up area and cultivation, this city has high risk of fire.
Figure 4. Land use map of Kathmandu Metropolitan City.
Ijgi 04 00400 g004

3.3. Population Density

Population density is another causative factor for fire. The population of each ward of Kathmandu Metropolitan City for 2011 A.D. is obtained from the Central Bureau of Statistics (CBS), Government of Nepal. The population of each ward of Kathmandu Metropolitan City for 2013 A.D. is calculated by adopting geometrical incremental method. The population density for 2013 A.D. is then calculated by dividing population by area of each ward. The average population density of Kathmandu Metropolitan City for 2013 A.D. is found to be 20,520 inhab/km2 and therefore the city is classified into six classes (Figure 5) as (i) <20,000 inhab/km2; (ii) 20,000–40,000 inhab/km2; (iii) 40,000–60,000 inhab/km2; (iv) 60,000–80,000 inhab/km2; (v) 80,000–100,000 inhab/km2 and (vi) >100,000 inhab/km2.

4. Methodology

4.1. Analytic Hierarchy Process (AHP)

The AHP, introduced by Thomas Saaty [21,22] is a mathematical method which analyses complex decision problems under multiple criteria, and helps the decision makers to set priorities and make the best decision. In the AHP, the complex decisions are reduced to a series of pair-wise comparisons, and then produce the results. Moreover, the AHP incorporates a useful technique for checking the consistency of the decision maker’s evaluations, which in turn help in reducing the bias in the decision making process.
Figure 5. Map showing population density of Kathmandu Metropolitan City.
Ijgi 04 00400 g005
AHP has been applied in many and diverse areas of decision-support in environmental management such as wildfire risk map [8], forest fire risk map [9,12], urban fire risk map [17], landslide susceptibility mapping [26,27], landfill site selection [28], land use pattern selection [29].
Saaty [22,30] developed the following steps for applying the AHP:
1
Define the problem and determine its objective.
2
Structure the hierarchy from the top (the objectives from a decision maker's viewpoint) through the intermediate levels (criteria on which sub-sequent levels depend) to the lowest level which usually contains the list of alternatives.
3
Construct a set of pair-wise comparison matrices (size n × n) for each of the lower levels with one matrix for each element in the level immediately above by using the relative scale measurement shown in Table 1 [21]. The pair-wise comparisons are done in terms of which element dominates the other.
4
There are n(n − 1)= judgments required to develop the set of matrices in step 3. Reciprocals are automatically assigned in each pair-wise comparison.
5
Calculate the normalized principal eigen vectors, maximum eigen value, consistency index and consistency ratio for each criteria.
Table 1. Scale of preference between two parameters in Analytic Hierarchy Process (AHP) (adapted from [21]).
Preference FactorDegree of PreferenceExplanation
1EquallyTwo factors contribute equally to the objective
3ModeratelyExperience and judgment slightly to moderately favor one factor over another
5StronglyExperience and judgment strongly or essentially favor one factor over another
7Very stronglyA factor is strongly favored over another and its dominance is showed in practice
9ExtremelyThe evidence of favoring one factor over another is of the highest degree possible of an affirmation
2,4,6,8IntermediateUsed to represent compromises between the preferences in weights 1, 3, 5, 7 and 9
ReciprocalsOppositesUsed for inverse comparison
The consistency is determined by using the maximum eigen value (λmax) to calculate the consistency index (CI) as given in Equation (1).
CI = λ max n n 1
where n is the size of matrix.
Judgment consistency can be checked by taking the consistency ratio (CR) of CI with the appropriate value of random consistency index (RI) given in Table 2 [22,31]. If CR does not exceed 0.10, then the comparison matrix is consistent. If CR is greater than 0.1, the comparison matrix is inconsistent. If inconsistencies in the decision process exist, the process should be repeated till a consensus is reached.
Table 2. Random Consistency Index (RI) [22,31].
n123456789101112131415
RI000.580.901.121.241.321.411.451.491.511.531.561.571.59
6.
Perform steps 3–5 for all levels in the hierarchy.
7.
Integrate weight values (normalized principal eigen vectors) to reach an optimum decision.
AHP provides an easy applicable decision making methodology which helps the decision maker to precisely decide the judgments. The main advantages of AHP over other multi criteria methods are its flexibility, perceptive appeal to the decision makers and its ability to check inconsistencies [32]. However, the main demerit of AHP is that it has a subjective nature of the modeling process which may differ from one expert to another. Hence, methodology cannot guarantee the decisions as definitely true [27].

4.2. Application of AHP in Fire Potential Mapping

In this study, comparison of criteria are made using a scale from 1 to 9 if the factors have a direct relationship and a scale from 1/2 to 1/9 if the factors have an inverse relationship as shown in Table 1 [21]. Elements of the matrix in each level are compared in pairs with respect to their importance to the element in the next higher level. Starting at the top of the hierarchy and working down from there, the pair-wise comparison square matrixes are formed such that all the elements in the matrix are positive [33] as given in Equation (2).
A = [ a i j ] = [ a 11 a 12 a 21 a 22   a 1 n a 2 n a n 1 a n 2   a n n ]
such that aij > 0.
Table 3. Sample of comparison of each classes of parameter.
Q. 1With respect to fire potential zonation mapping,
Given that the distance from the fuel stations is < 50 m, which criteria is important?
ClassesWeight value
50–100 m
100–200 m
200–500m
>500 m
Q. 2With respect to fire potential zonation mapping,
Given that the distance from the fuel stations is 50–100 m, which criteria is important?
ClassesWeight value
<50 m
100–200 m
200–500m
>500 m
Q. 3With respect to fire potential zonation mapping,
Given that the distance from the fuel stations is 100–200 m, which criteria is important?
ClassesWeight value
<50 m
50–100 m
200–500m
>500 m
Q. 4With respect to fire potential zonation mapping,
Given that the distance from the fuel stations is 200–500 m, which criteria is important?
ClassesWeight value
<50 m
50–100 m
100–200m
>500 m
Q. 5With respect to fire potential zonation mapping,
Given that the distance from the fuel stations is > 500 m, which criteria is important?
ClassesWeight value
<50 m
50–100 m
100–200 m
200–500 m
Table 3 shows the sample of comparison of each classes of causative factor, i.e., distance from fuel stations. The questionnaire form which include the comparison of each classes of different causative factors was distributed to eight experts working in the field of geology, urban planning management, water resources engineering, disaster management, safety engineering and management, civil engineering. Then the relative weight values given by different experts were averaged for calculation purposes. The relative weight values for each classes of different causative factors are given in Table 4. Table 4 shows the calculation of normalized principal eigen vector for causative factors distance from fuel stations, land use and population density for assessing fire potential zone map. Table 5 shows the test result for consistency of the rating values for each criteria of fire potential zone. Since the CR of the each class of causative factors namely, distance from fuel station, land use and population density is less than 0.10, the rating values for these causative factors are consistent.
Table 4. Pair-wise comparison matrix and normalized principal eigenvector for the classes within each causative factor of fire potential, as required for applying the AHP method.
Causative Factors and Classes within each FactorPair-Wise Comparison MatrixNormalized Principal Eigen Vector
[1][2][3][4][5][6][7][8][9]
Distance from Fuel Stations
[1] <50 m12469 0.4720
[2] 50–100 m1/21236 0.2490
[3] 100–200 m1/41/2135 0.1641
[4] 200–500m1/61/31/312 0.0742
[5] >500 m1/91/61/51/21 0.0407
Land Use
[1] Built-up area1399999890.4084
[2] Cultivation1/3149999890.3007
[3] Plantation1/91/411111110.0440
[4] Open area1/91/911111110.0409
[5] Water body1/91/9111114/510.0399
[6] Road1/91/9111114/510.0399
[7] Airport runway1/91/9111114/510.0399
[8] Play ground1/81/8115/45/45/4110.0453
[9] Sandy area1/91/911111110.0409
Population Density
[1] < 20,000 inhab/km211/21/31/41/51/6 0.0468
[2] 20,000–40,000 inhab /km2211/21/21/31/3 0.0867
[3] 40,000–60,000 inhab /km232111/21/2 0.1506
[4] 60,000–80,000 inhab /km2421111/2 0.1792
[5] 80,000–100,000 inhab /km2532111 0.2499
[6] >100,000 inhab /km2632211 0.2868
In order to generate fire potential index map, the linear weighted combination is used for different causative factor maps as given in Equation (3).
FPI = Weight map of (distance from fuel stations + land use + population density)
Table 5. Number of order of matrix n, largest eigen value λmax of the preference matrix, consistency index (CI), random consistency index (RI), and consistency ratio (CR), for the fire potential causative factors.
Causative FactorsnλmaxCIRICR
Distance from fuel stations55.12700.03181.120.0283
Land use99.31570.03951.450.0272
Population density66.05060.01011.240.0082

5. Discussions

From Table 4, it can be seen that fire potential is directly proportional to the distance from fuel stations, as a closer distance to fuel stations has higher weight values and a farther distance from fuel stations has less weight values. The land use type such as built-up area and cultivation have a higher impact on fire potentiality, whereas other land use type such as water body, road, airport runway, sandy area, open area, plantation, playground have less impact on fire potentiality. Moreover, high population density has greater impact on fire potentiality than low population density.
Figure 6. Fire Potential Index (FPI) map of Kathmandu Metropolitan City.
Ijgi 04 00400 g006
With weighted linear combination technique in GIS, the resulting fire potential index (FPI) map is obtained as shown in Figure 6. In Figure 6, the value of the FPI varies from 0.05 to 1.03. A higher value of the FPI represents the high fire potential area and a lower value of FPI represents the low fire potential area. There are no general rules to categorize continuous data automatically [34]. Therefore, in this study, the FPI map of Kathmandu Metropolitan City is reclassified into low, moderate, and high potential zones using the natural break classifier system. The resulting fire potential zonation map is as shown in Figure 7 and their coverage area is shown in Table 6. Table 6 shows that 58.04% of the area falls under low fire potential zone, 32.92% falls under moderate fire potential zone and 9.04% falls under high fire potential zone.
Figure 7. Fire Potential Zonation map of Kathmandu Metropolitan City.
Ijgi 04 00400 g007
Table 6. Area distribution of fire potential zone in Kathmandu Metropolitan City.
S. No.Fire Potential ZoneArea
(km2)(%)
1Low30.1558.04
2Moderate17.1032.92
3High4.709.04
Total51.94100.00
Table 7 shows the area of different fire potential zones in 35 wards of Kathmandu Metropolitan City. As more than two-thirds of the area lies in the high fire potential zone, Ward Nos. 17, 18, 19, 20, 21, 23, 24, 26, 27 and 28 lie in high fire potential zone. Even though there are few or no fuel stations in these wards, these wards are highly susceptible to fire because of densely populated area and land use type of built-up area. Most of the areas of Ward Nos. 5, 7, 10, 12, 22, 25, 29, 30, 32, 33 and 34 lie in moderate fire potential zone. The reason behind this may be due to moderately dense population, fuel stations location and other land use types than built-up area in these wards. Almost half to 9/10th area of Ward Nos. 1, 2 ,3, 4, 6, 8, 9, 11, 13, 14, 15, 16, 31 and 35 lie in a low fire potential zone which may be due to less dense population, dominance of other land use types in these wards.
Table 7. Area distribution of different fire vulnerable zones in 35 wards of Kathmandu Metropolitan City.
Ward No.Low Fire Potential ZoneModerate Fire Potential ZoneHigh Fire Potential ZoneWard Area
(km2)(%)(km2)(%)(km2)(%)(km2)
10.813658.880.440531.880.12789.251.3818
20.415550.790.320339.150.082310.060.8181
31.870560.620.916329.700.29869.683.0854
42.486674.230.730021.790.13333.983.3498
50.249231.640.502063.750.03634.610.7875
63.239289.780.32549.020.04321.203.6078
70.486027.801.072961.380.189210.821.7481
82.434283.420.304410.430.17966.152.9181
91.997267.980.781926.610.15885.412.9378
100.376424.061.187975.940.00000.001.5643
111.074959.300.507728.010.230012.691.8126
120.132326.670.292458.940.071414.390.4961
131.260655.090.733632.060.294012.852.2882
142.514872.570.745321.510.20515.923.4651
152.361370.790.754622.620.22006.593.3358
163.341672.120.961620.750.33037.134.6335
170.142321.360.03455.180.489373.460.6661
180.034518.870.00271.480.145679.650.1828
190.024115.930.016811.100.110472.970.1513
200.024515.960.00261.690.126482.350.1535
210.01519.810.00000.000.138990.190.1540
220.029115.590.157684.410.00000.000.1867
230.00848.100.00000.000.095391.900.1037
240.011613.600.00000.000.073786.400.0853
250.011711.350.091488.650.00000.000.1031
260.00266.820.00000.000.035593.180.0381
270.00607.770.00000.000.071292.230.0772
280.00405.860.00000.000.064394.140.0683
290.720436.561.145658.140.10455.301.9705
300.031812.240.228087.760.00000.000.2598
310.925589.260.111210.720.00020.021.0369
320.197815.461.081284.540.00000.001.2790
330.123014.300.528161.410.208824.280.8598
340.471120.021.654670.310.22759.672.3532
352.310358.021.466436.820.20555.163.9822
Total30.147358.0417.097332.924.69679.0451.9413
It is always good to validate the fire potential zonation map. The best way is to validate physically in the field, which is rather a cumbersome job. However, the fire potential zonation map can also be verified with the field information on the basis of the past fire incidents. In this study, it is observed that large fire incidents in the city (Figure 7) such as fire incidents of Kalimati Fruits and Vegetable Market, Ward No. 13; Pilgrims Book House of Thamel, Ward No. 29; Jyoti Bhawan, Jamal, Ward No. 30 and 50 huts at Bhimsengola, Ward No. 9 lie on the high and moderate fire potential zone.
A massive fire started at Kalimati Fruits and Vegetable Market, Ward No. 13 on 4 March 2012, where six people were killed and one woman was seriously injured. About US$ 1 million in property was damaged by the fire. The flame spread throughout the building within five minutes after the short circuit occurred in the house [35]. The fire broke out in a crowded settlement of Thamel, Ward No. 29 on 16 May 2013 night, which destroyed property worth around US$ 2 million. The fire was started initially in the kitchen of Faces Lounge restaurant near the Kathmandu Guest House in Mandala Street then gutted other restaurants. This fire also completely destroyed the renowned Pilgrims Book House [36]. Another fire caught at Jyoti Bhawan located at Jamal Kathmandu, Ward No. 30 on 30 August 2013. The fire was blown into the store room of Nepal Bank Limited (NBL) situated on the first floor of Jyoti Bhawan. The fire damaged fifteen sets of computer, two sets of photocopy machines, six sets of printers and all the furniture inside NBL. Only two sections comprising of housing lockers and safe boxes were not affected by the fire. Five laboratory technicians of Grande City Clinic and Diagnostic Services, situated on the second floor of the building, were injured by the fire [37]. Another fire caught at Bhimsengola, Ward No. 9 on 9 March 2014, where 50 huts were gutted due to a short circuit at a scrap store. The settlement was inhabited by landless people near to the Bagmati River. This fire also spread to adjoining three-storey building, causing minor damage. However, there were no causalities in this incident [38].

6. Conclusions

The AHP method is one of the most widely used multi-criteria decision analysis approaches, based on the expert-judgment method with the facility to check the consistency of the rating provided by the expert. Moreover, pair-wise comparisons between parameters are appealing to users as in this method pair-wise comparisons (A is more important than B) can be converted into a set of numbers representing the relative priority of each of the criteria.
In this study, three causative factors were considered, i.e., distance from fuel stations, land use and population density. The selection of these factors is based on the availability of data for the study area and the relevance with respect to fire incidents. However, more factors can be considered for further study if data are available.
The results show that the high fire potential zone covers only 9.04% of the study area, moderate fire potential zone covers 32.92% and low fire potential zone covers 58.04% of the study area. Moreover, large fire incidents in the past are clearly marked in the areas of high and moderate fire potential zones. These results show that the predicted fire potential levels are found to be in good agreement with the past fire incidents. However, it would have been better validation if a higher number of fire incidences actually occurred in each ward in the past. Hence, it is recommended to keep databases of each fire incident occurring in each ward of Kathmandu Metropolitan City Office, which will indeed help to validate the present fire potential zonation map.
The fire potential zonation map presented in this study can be a good source for concerned authorities, urban planners, geographers and engineers. Furthermore, this map can be used by the concerned authorities in disaster management planning. High fire potential zones are problems for the city that need effective protection measures to prevent future fire incidents. Hence, Kathmandu Metropolitan City Office can set up further fire brigade stations in those areas, train local people by various community-based fire risk preparedness programs focusing on strengthening the capacity of communities to prepare for and mitigate fire risks.

Acknowledgments

The authors are grateful to the Department of Survey, Government of Nepal; Central Bureau of Statistics (CBS), Government of Nepal; and Nepal Oil Corporation (NOC) for providing necessary data and digital maps for this research. The authors are also acknowledged to Nepal Engineering College, Acme Engineering College and Attic Consulting Service for providing laboratory facilities. Thanks are due to Megh Raj Dhital, Central Department of Geology, Tribhuvan University; Pradip Kumar Paudyal, Acme Engineering College; Niraj Prakash Joshi, Hiroshima University; Narayan Kumar Shrestha, Nepal Engineering College; Col. (Retd.) Ratindra Khatri, Nepal Army; Kiran Man Joshi, Attic Consulting Service; Bhupendra Lal Maskey, Kathmandu Metropolitan City; Gautam Prasad Khanal, Department of Mines and Geology for providing expert advices in this research. The authors are also thankful to three anonymous reviewers for constructive suggestions to improve the quality of paper.

Author Contributions

Both authors have contributed equally to the research and writing of this paper.

Conflicts of Interest

The authors declare no conflict of interest.

References

  1. Gautam, D. A Needs and a Capacity Assessment of Fire Preparedness in the Municipalities of Nepal; Ministry of Local Development, Government of Nepal and Disaster Risk Reduction at the National Level in Nepal, UNDP: Kathmandu, Nepal, 2011; p. 40. [Google Scholar]
  2. Erten, E.; Kurgun, V.; Musao, N. Forest fire risk zone mapping from satellite imagery and GIS a case study. In Proceedings of the XXth ISPRS Congress, Istanbul, Turkey, 12–23 July 2004; pp. 33–39.
  3. Carmel, Y.; Paz, S.; Jahashan, F.; Shoshany, M. Assessing fire risk using Monte Carlo simulations of fire spread. For. Ecol. Manag. 2009, 257, 370–379. [Google Scholar] [CrossRef]
  4. Sharma, D.; Hoa, P.V.; Cuong, T.V.; Tuyen, H.T.; Sharma, N. Forest fire risk zonation for Jammu district forest division using remote sensing and GIS. In Proceedings of the 7th FIG Regional Conference Spatial Data Serving People: Land Governance and the Environment—Building the Capacity, Hanoi, Vietnam, 19–22 October 2009; pp. 1–12.
  5. Wu, W.-B.; Ma, M.-Z.; Zhang, K.-X.; Fan, S. GIS-based fuzzy comprehensive evaluation of forest fire-potential zone-grading. In Proceedings of the International Conference on Geo-Spatial Solutions for Emergency Management and the 50th Anniversary of the Chinese Academy of Surveying and Mapping, Beijing, China, 14–16 September 2009; pp. 286–289.
  6. Nisanci, R. GIS based fire analysis and production of fire-risk maps: The Trabzon experience. Sci. Res. Essays 2010, 5, 970–977. [Google Scholar]
  7. Nisanci, R.; Yildirim, V.; Erbas, Y.S. Fire analysis and production of fire risk maps: The Trabzon experience. In Risk Management for the Future—Theory and Cases; Emblemsvåg, J., Ed.; InTech Europe: Rijeka, Croatia, 2012; pp. 215–232. [Google Scholar]
  8. Mahdavi, A.; Shamsi, S.R.F.; Nazari, R. Forests and rangelands’ wildfire risk zoning using GIS and AHP techniques. Casp. J. Environ. Sci. 2012, 10, 43–52. [Google Scholar]
  9. Chavan, M.E.; Das, K.K.; Suryawanshi, R.S. Forest fire risk zonation using remote sensing and GIS in Huynial watershed, Tehri Garhwal district, UA. Int. J. Basic Appl. Res. 2012, 2, 6–12. [Google Scholar]
  10. Bian, H.; Zhang, H.; Zhou, D.; Xu, J.; Zhang, Z. Integrating models to evaluate and map grassland fire risk zones in Hulunbuir of Inner Mongolia, China. Fire Saf. J. 2013, 61, 207–216. [Google Scholar] [CrossRef]
  11. Rajabi, M.; Alesheikh, A.; Chehreghan, A.; Gazmeh, H. An innovative method for forest fire risk zoning map using fuzzy inference system and GIS. Int. J. Sci. Technol. Res. 2013, 2, 57–64. [Google Scholar] [CrossRef]
  12. Kanga, S.; Sharma, L.K.; Pandey, P.C.; Nathawat, M.S.; Sharma, S.K. Forest fire modeling to evaluate potential hazards to tourism sites using geospatial approach. J. Geomat. 2013, 7, 93–99. [Google Scholar]
  13. Malik, T.; Rabbani, G.; Farooq, M. Forest fire risk zonation using remote sensing and GIS technology in Kansrao Forest Range of Rajaji National Park, Uttarakhand, India. Int. J. Adv. Remote Sens. GIS 2013, 2, 86–95. [Google Scholar]
  14. Arpaci, A.; Malowersching, B.; Sass, O.; Vacik, H. Using multi-variate data mining techniques for estimating fire susceptibility of Tyrolean forests. Appl. Geogr. 2014, 53, 258–270. [Google Scholar] [CrossRef]
  15. Alam, M.J.B.; Baroi, G.N. Fire hazard categorization and risk assessment for Dhaka city in GIS framework. J. Civ. Eng. (IEB) 2004, 32, 35–45. [Google Scholar]
  16. Rohde, D.; Corcoran, J.; Chhetri, P. Spatial forecasting of residential urban fires: A Bayesian approach. Comput. Environ. Urban Syst. 2010, 34, 58–69. [Google Scholar] [CrossRef]
  17. Srivanit, M. Community risk assessment: Spatial patterns and GIS-based model for fire risk assessment—A case study of Chiang Mai Municipality. J. Archit. Plan. Res. Stud. 2011, 8, 113–126. [Google Scholar]
  18. Santos, C.; Ferreira, T.M.; Vicente, R.; Raimundo Mendes da Silva, J.A. Building typologies identification to support risk mitigation at the urban scale—Case study of the old city centre of Seixal, Portugal. J. Cult. Herit. 2013, 14, 449–463. [Google Scholar] [CrossRef]
  19. Sur, U.; Sokhi, B.S. GIS in city fire hazard: Petrol station vicinity vulnerability assessment. GIM Int. 2006, 20, 50–52. [Google Scholar]
  20. Das, A.; Harinarayana, T. A study on the possible oil spill & gas leakage vulnerable zones of Gujarat State using GIS tools. J. Indian Geophys. Union 2014, 18, 73–84. [Google Scholar]
  21. Saaty, T.L. A scaling method for priorities in hierarchical structures. J. Math. Psychol. 1977, 15, 234–281. [Google Scholar] [CrossRef]
  22. Saaty, T.L. The Analytic Hierarchy Process: Planning, Priority Setting, Resource Allocation; McGraw-Hill Book Co.: New York, NY, USA, 1980; p. 287. [Google Scholar]
  23. Sunwar, D.K. City Fuel Stations Vulnerable to Fire Hazard. 2009. Available online: http://devkit.wordpress.com/2009/02/14/city-fuel-stations-vulnerable-to-fire-hazard/ (accessed on 30 August 2014).
  24. Awale, S. Fuelling Concerns. The Himalayan Times. 2013. Available online: http://www.thehimalayantimes.com/perspectives/fullnews.php?headline=Fuelling+concern&newsid=MjQ1NQ== (accessed on 30 August 2014).
  25. Ghimire, B.; Sharma, N. Fuel Pumps Playing with Fire. The Kathmandu Post. 2012. Available online: http://www.ekantipur.com/the-kathmandu-post/2012/01/09/development/fuel-pumps-playing-with-fire/230219.html (accessed on 30 August 2014).
  26. Long, N.T.; De Smedt, F. Application of an analytical hierarchical process approach for landslide susceptibility mapping in A Luoi district, Thua Thien Hue Province, Vietnam. Environ. Earth Sci. 2012, 66, 1739–1752. [Google Scholar] [CrossRef]
  27. Kayastha, P.; Dhital, M.R.; De Smedt, F. Application of the analytical hierarchy process (AHP) for landslide susceptibility mapping: A case study from the Tinau watershed, west Nepal. Comput. Geosci. 2013, 52, 398–408. [Google Scholar] [CrossRef]
  28. El Baba, M.; Kayastha, P.; De Smedt, F. Landfill site selection using multi-criteria evaluation in the GIS interface: A case study from the Gaza Strip, Palestine. Arabian J. Geosci. 2014. [Google Scholar] [CrossRef]
  29. Malczewski, J.; Moreno-Sanchez, R.; Bojórquez-Tapia, L.A.; Ongay-Delhumeau, E. Multicriteria group decision making model for environmental conflict analysis in the Cape Region, Mexico. J. Environ. Plan. Manag. 1997, 40, 349–374. [Google Scholar] [CrossRef]
  30. Saaty, T.L. How to make a decision: The analytic hierarchy process. Eur. J. Oper. Res. 1990, 48, 9–26. [Google Scholar] [CrossRef]
  31. Saaty, T.L. The Fundamentals of Decision Making and Priority Theory with the Analytic Hierarchy Process, 2nd ed.; RWS Publications: Pittsburgh, PA, USA, 2000; Volume VI, p. 478. [Google Scholar]
  32. Ramanathan, R. A note on the use of the analytic hierarchy process for environmental impact assessment. J. Environ. Manag. 2001, 63, 27–35. [Google Scholar] [CrossRef]
  33. Habibi, K.; Lotfi, S.; Koohsari, M.J. Spatial analysis of urban fire station locations by integrating AHP model and IO logic using GIS: A case study of zone 6 of Tehran. J. Appl. Sci. 2008, 8, 3302–3315. [Google Scholar] [CrossRef]
  34. Ayalew, L.; Yamagishi, H.; Ugawa, N. Landslide susceptibility mapping using GIS-based weighted linear combination, the case in Tsugawa area of Agano River, Niigata prefecture, Japan. Landslides 2004, 1, 73–81. [Google Scholar] [CrossRef]
  35. Adhikari, A. 6 Killed in Kalimati Vegetable Market Fire. The Kathmandu Post. 2012. Available online: http://www.ekantipur.com/2012/03/04/top-story/6-killed-in-kalimati-vegetable-market-fire/349974.html (accessed on 30 August 2014).
  36. THT (The Himalayan Times) Property Worth Rs 20 Crore Gutted, 2013a. Available online: http://www.thehimalayantimes.com/fullNews.php?headline=Property+worth+Rs+20+crore+gutted&NewsID=376865 (accessed on 30 August 2014).
  37. THT (The Himalayan Times) Property Worth Millions Gutted in Jyoti Bhawan Fire, 2013b. Available online: http://www.thehimalayantimes.com/fullNews.php?headline=Property+worth+millions+gutted+in+Jyoti+Bhawan+fire&NewsID=389234 (accessed on 30 August 2014).
  38. TKP (The Kathmandu Post) 50 Huts Gutted in Bhimsengola Fire. 2014. Available online: http://www.ekantipur.com/2014/03/09/top-story/50-huts-gutted-in-bhimsengola-fire/386466.html (accessed on 30 August 2014).

