Article

Does the Visibility of Greenery Increase Perceived Safety in Urban Areas? Evidence from the Place Pulse 1.0 Dataset

Department of Geography, University of Connecticut, Storrs, CT 06269, USA
*
Author to whom correspondence should be addressed.
ISPRS Int. J. Geo-Inf. 2015, 4(3), 1166-1183; https://doi.org/10.3390/ijgi4031166
Submission received: 13 April 2015 / Revised: 27 June 2015 / Accepted: 2 July 2015 / Published: 9 July 2015

Abstract

:
Urban green space provides a series of esthetic, environmental and psychological benefits to urban residents. However, the relationship between the visibility of green vegetation and perceived safety is still in debate. This research investigated whether green vegetation could help to increase the perceived safety based on a crowdsourced dataset: the Place Pulse 1.0 dataset. Place Pulse 1.0 dataset, which was generated from a large number of votes by online participants, includes geo-tagged Google Street View images and the corresponding perceived safety score for each image. In this study, we conducted statistical analyses to analyze the relationship between perceived safety and green vegetation characteristics, which were extracted from Google Street View images. Results show that the visibility of green vegetation plays an important role in increasing perceived safety in urban areas. For different land use types, the relationship between vegetation structures and perceived safety varies. In residential, urban public/institutional, commercial and open land areas, the visibility of vegetation higher than 2.5 m has significant positive correlations with perceived safety, but there exists no significant correlation between perceived safety and the percentage of green vegetation in transportation and industrial areas. The visibility of vegetation below 2.5 m has no significant relationship with the perceived safety in almost all land use types, except for multifamily residential land and urban public/institutional land. In general, this study provided insight for the relationship between green vegetation characteristics and the perception of environment, as well as valuable reference data for developing urban greening programs.

1. Introduction

Urban green spaces (i.e., trees, shrubs, lawns and other forms of vegetation) have long been recognized as critical landscape design elements in urban environments [1,2,3]. Urban green spaces provide many benefits for the human wellbeing and health. There is increasing interest in studying the relationship between the amount of green space and perceived safety in urban areas in the literature [4,5]. Different from actual safety, perceived safety is an experienced feeling that is often connected to the fear of crime and other unsafe perception factors [5]. The perceived safety has no direct connection to the incidence of crimes, but it could actually affect a human’s walkability and preference for a specific site, which could have some other sorts of influences. Feeling safe is a prerequisite for wellbeing, good health and a high quality of life [6,7]. Low perceived safety could affect human behaviors, which could cause further negative consequences. Li et al. [8] found that low perceived safety causes the elderly to lose the possibility for a physically-active life. It was reported that fear of crime also has a negative relationship with mental and physical health [9,10].
Perceived safety should be considered as a complex phenomenon, which is not only affected by environmental characteristics [11,12,13], but also by culture, individual characteristics and many other social factors [4,5,14,15,16]. People with different cultures, genders, ages and experiences may have different perceived safety for the same place. The role of green space in perceived safety appears ambiguous [4]. Green space could be perceived as unsafe, because it provides hiding places for potential criminal activities [17,18]. For example, shrubs can obstruct “eyes on the street” in an urban area, which could facilitate crime activities. Donovan and Prestemon [19] found that low trees obstructing views from first floor windows on private lots are associated with increased crime occurrences. However, green space may also be associated with decreased crime activities. Urban green space offers opportunities for social integration and attracts people to spend time outdoors, which could further deter criminal activities by increasing “eyes on the street” [20,21,22]. More “eyes on the street” allow more checks on dangerous behavior [23]. It is easier for criminals to go unnoticed in paved areas with no vegetation, because these areas are often seen as a “no-man’s land”, which may further reduce “eyes on the street” and discourage residential interaction [13]. Vegetation characteristics and maintenance also affect perceived safety. Woodland vegetation with good visual access (being able to see the entire environment) and well-maintained urban vegetation both can help to increase perceived safety [24,25,26]. Donovan and Prestemon [19] speculated that the abundance of urban trees in housing units might signal to potential criminals that a house has more effective authority than houses with fewer trees. In terms of social safety, which refers to safety resulting from human behavior and interactions among people in public spaces, green space was reported as associated with enhanced feelings of safety in both rural residential and urban areas [4]. In addition, green space may also enhance safety feelings by reducing feelings of anger, frustration and aggression [12,27]. A considerable literature has mentioned that the vertical distribution of urban green space could affect humans’ perceived safety [25,26,28]. View-obstructing green spaces, such as smaller trees and shrubs, are associated with increased crimes, while larger trees are associated with reduced crimes [19]. Vegetation at eye level or between the knee and eye level has been reported as important for the perception of personal safety [11,25,26,28,29].
Most of the studies conducted to date on this topic have focused on relatively restricted geographic areas (e.g., housing units or neighborhoods) and homogeneous landscapes. For example, Shaffer and Anderson [24] examined the attractiveness and perceived security of 180 scenes of parking lots depicted in photographs to undergraduate students. Herzog and Kutzli [25] used photographs of environments with different combinations of vegetation to allow a group of students to assess the settings. To the best of our knowledge, there are few studies in the literature examining the associations between perceived safety and the visibility of green spaces for different land use types at city or regional scales. This is partly because there are few suitable methods for collecting such kinds of data at a large scale. However, as an important indicator of the physical environment, land use affects human perception of safety [30,31]. Therefore, in order to control the effects of different land use types on the association between green vegetation and perceived safety and to check the variation of the association, we incorporated the land use types into consideration for the association study.
In this study, we utilized static Google Street View (GSV) images combined with the land use map and crowdsourced perceived safety data in Boston, Massachusetts, to investigate whether the visibility of green vegetation is positively or negatively related to perceived safety or not. In addition, we examined whether the relationship between green vegetation and perceived safety varies in different land use types or not. Compared with the ambiguous concept of urban and rural areas used by Mass et al. [4], this study is based on well-defined land use types and may provide more information for urban planners to find suitable places to develop greening programs to increase residents’ perceived safety.

2. Data

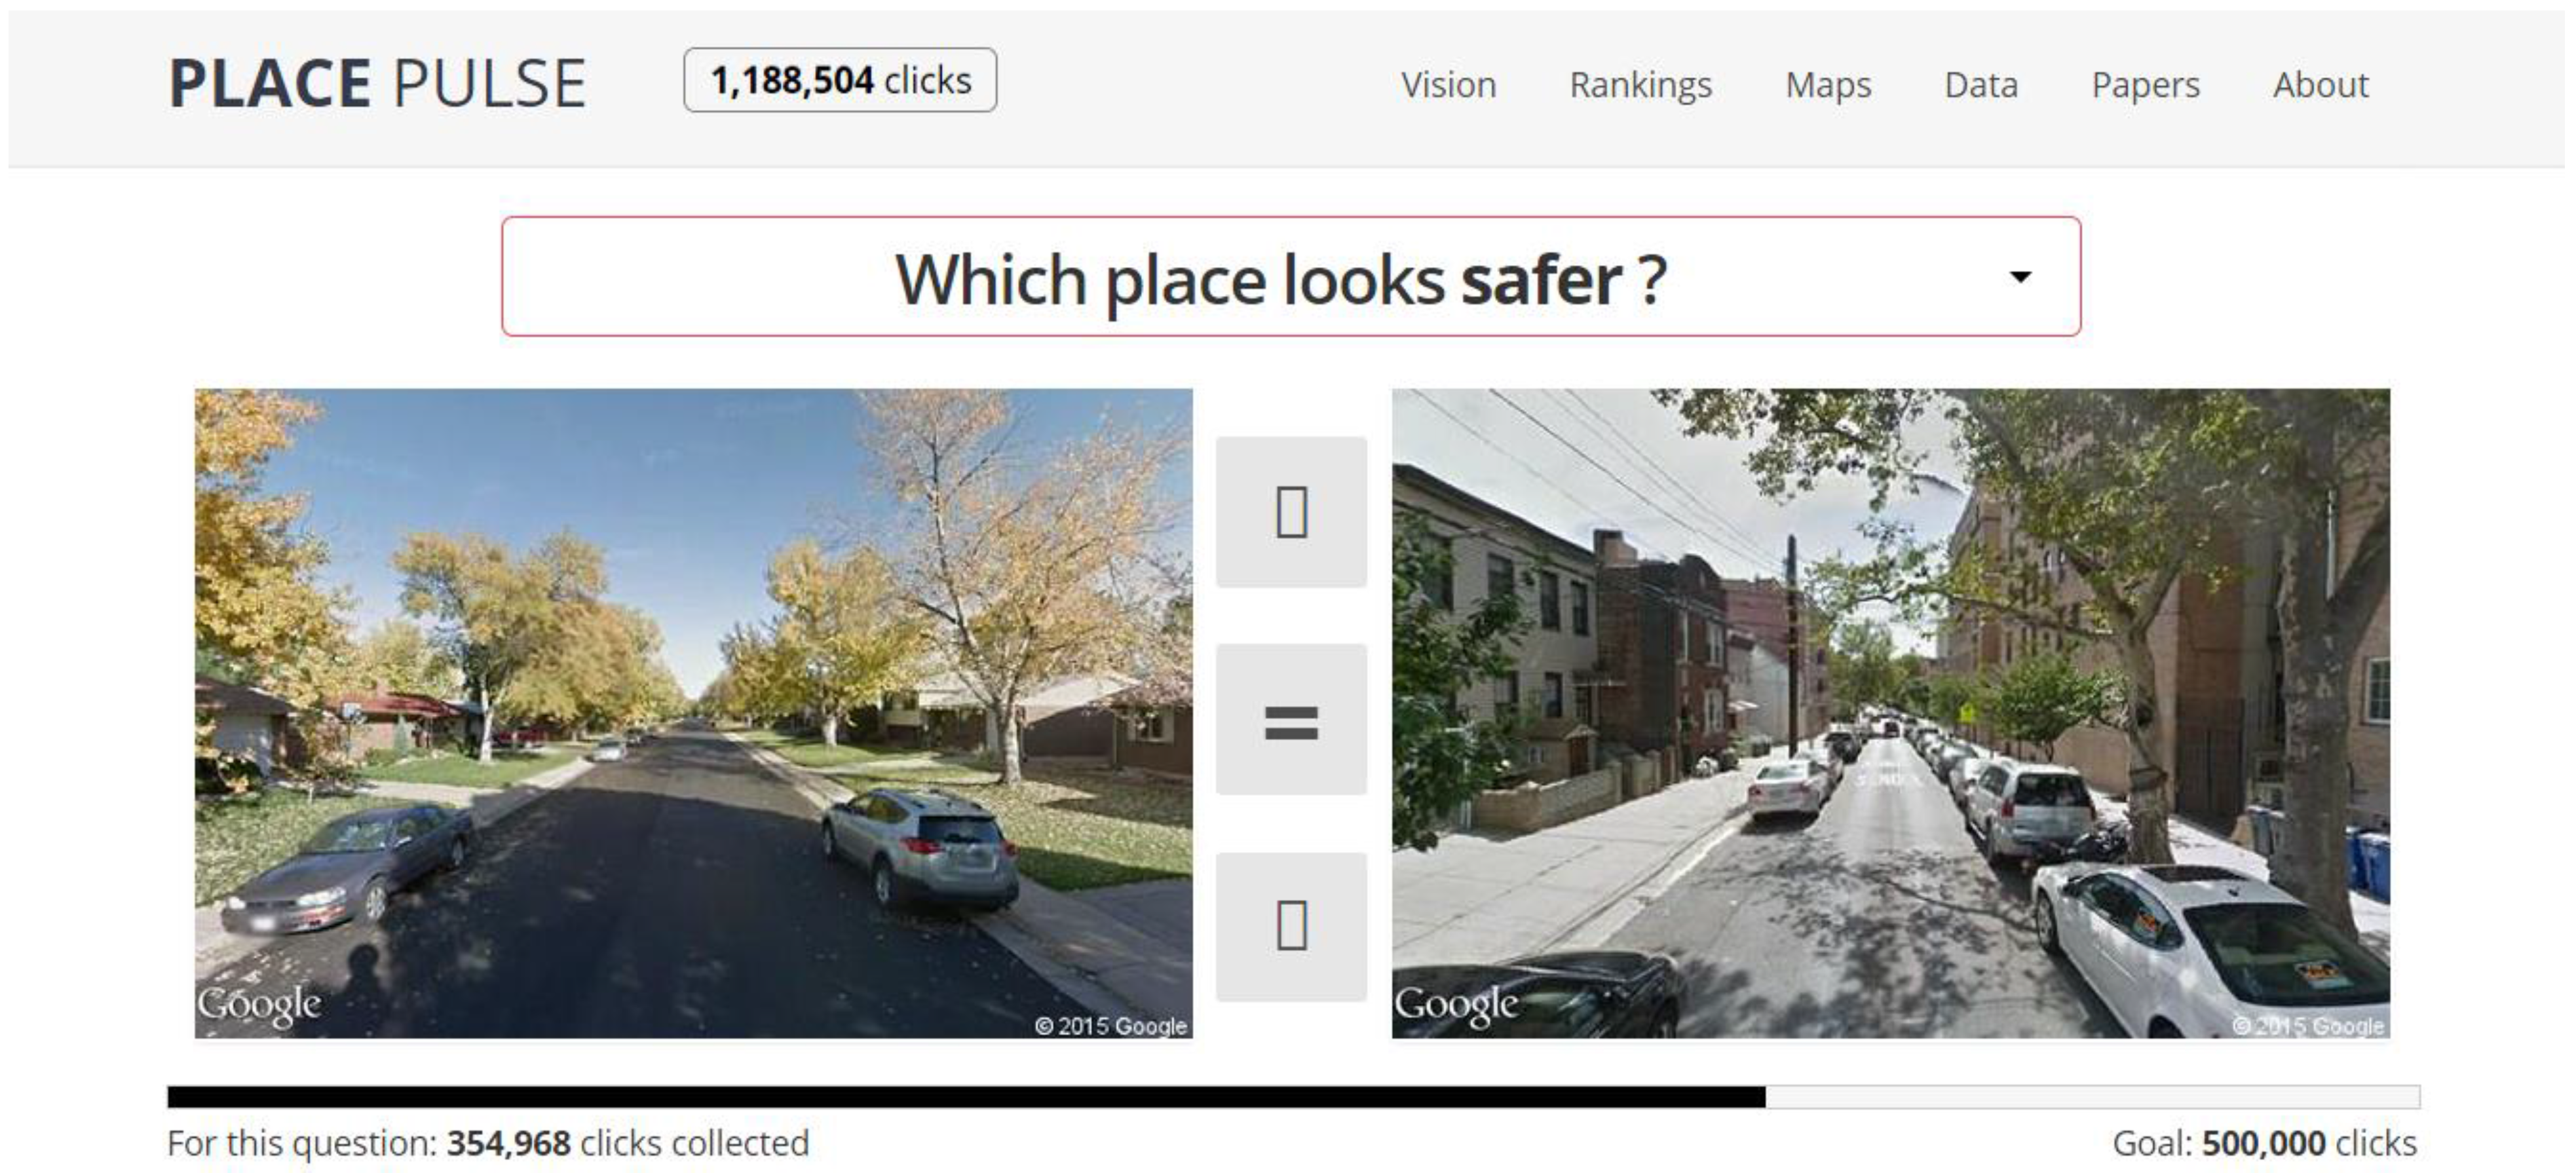
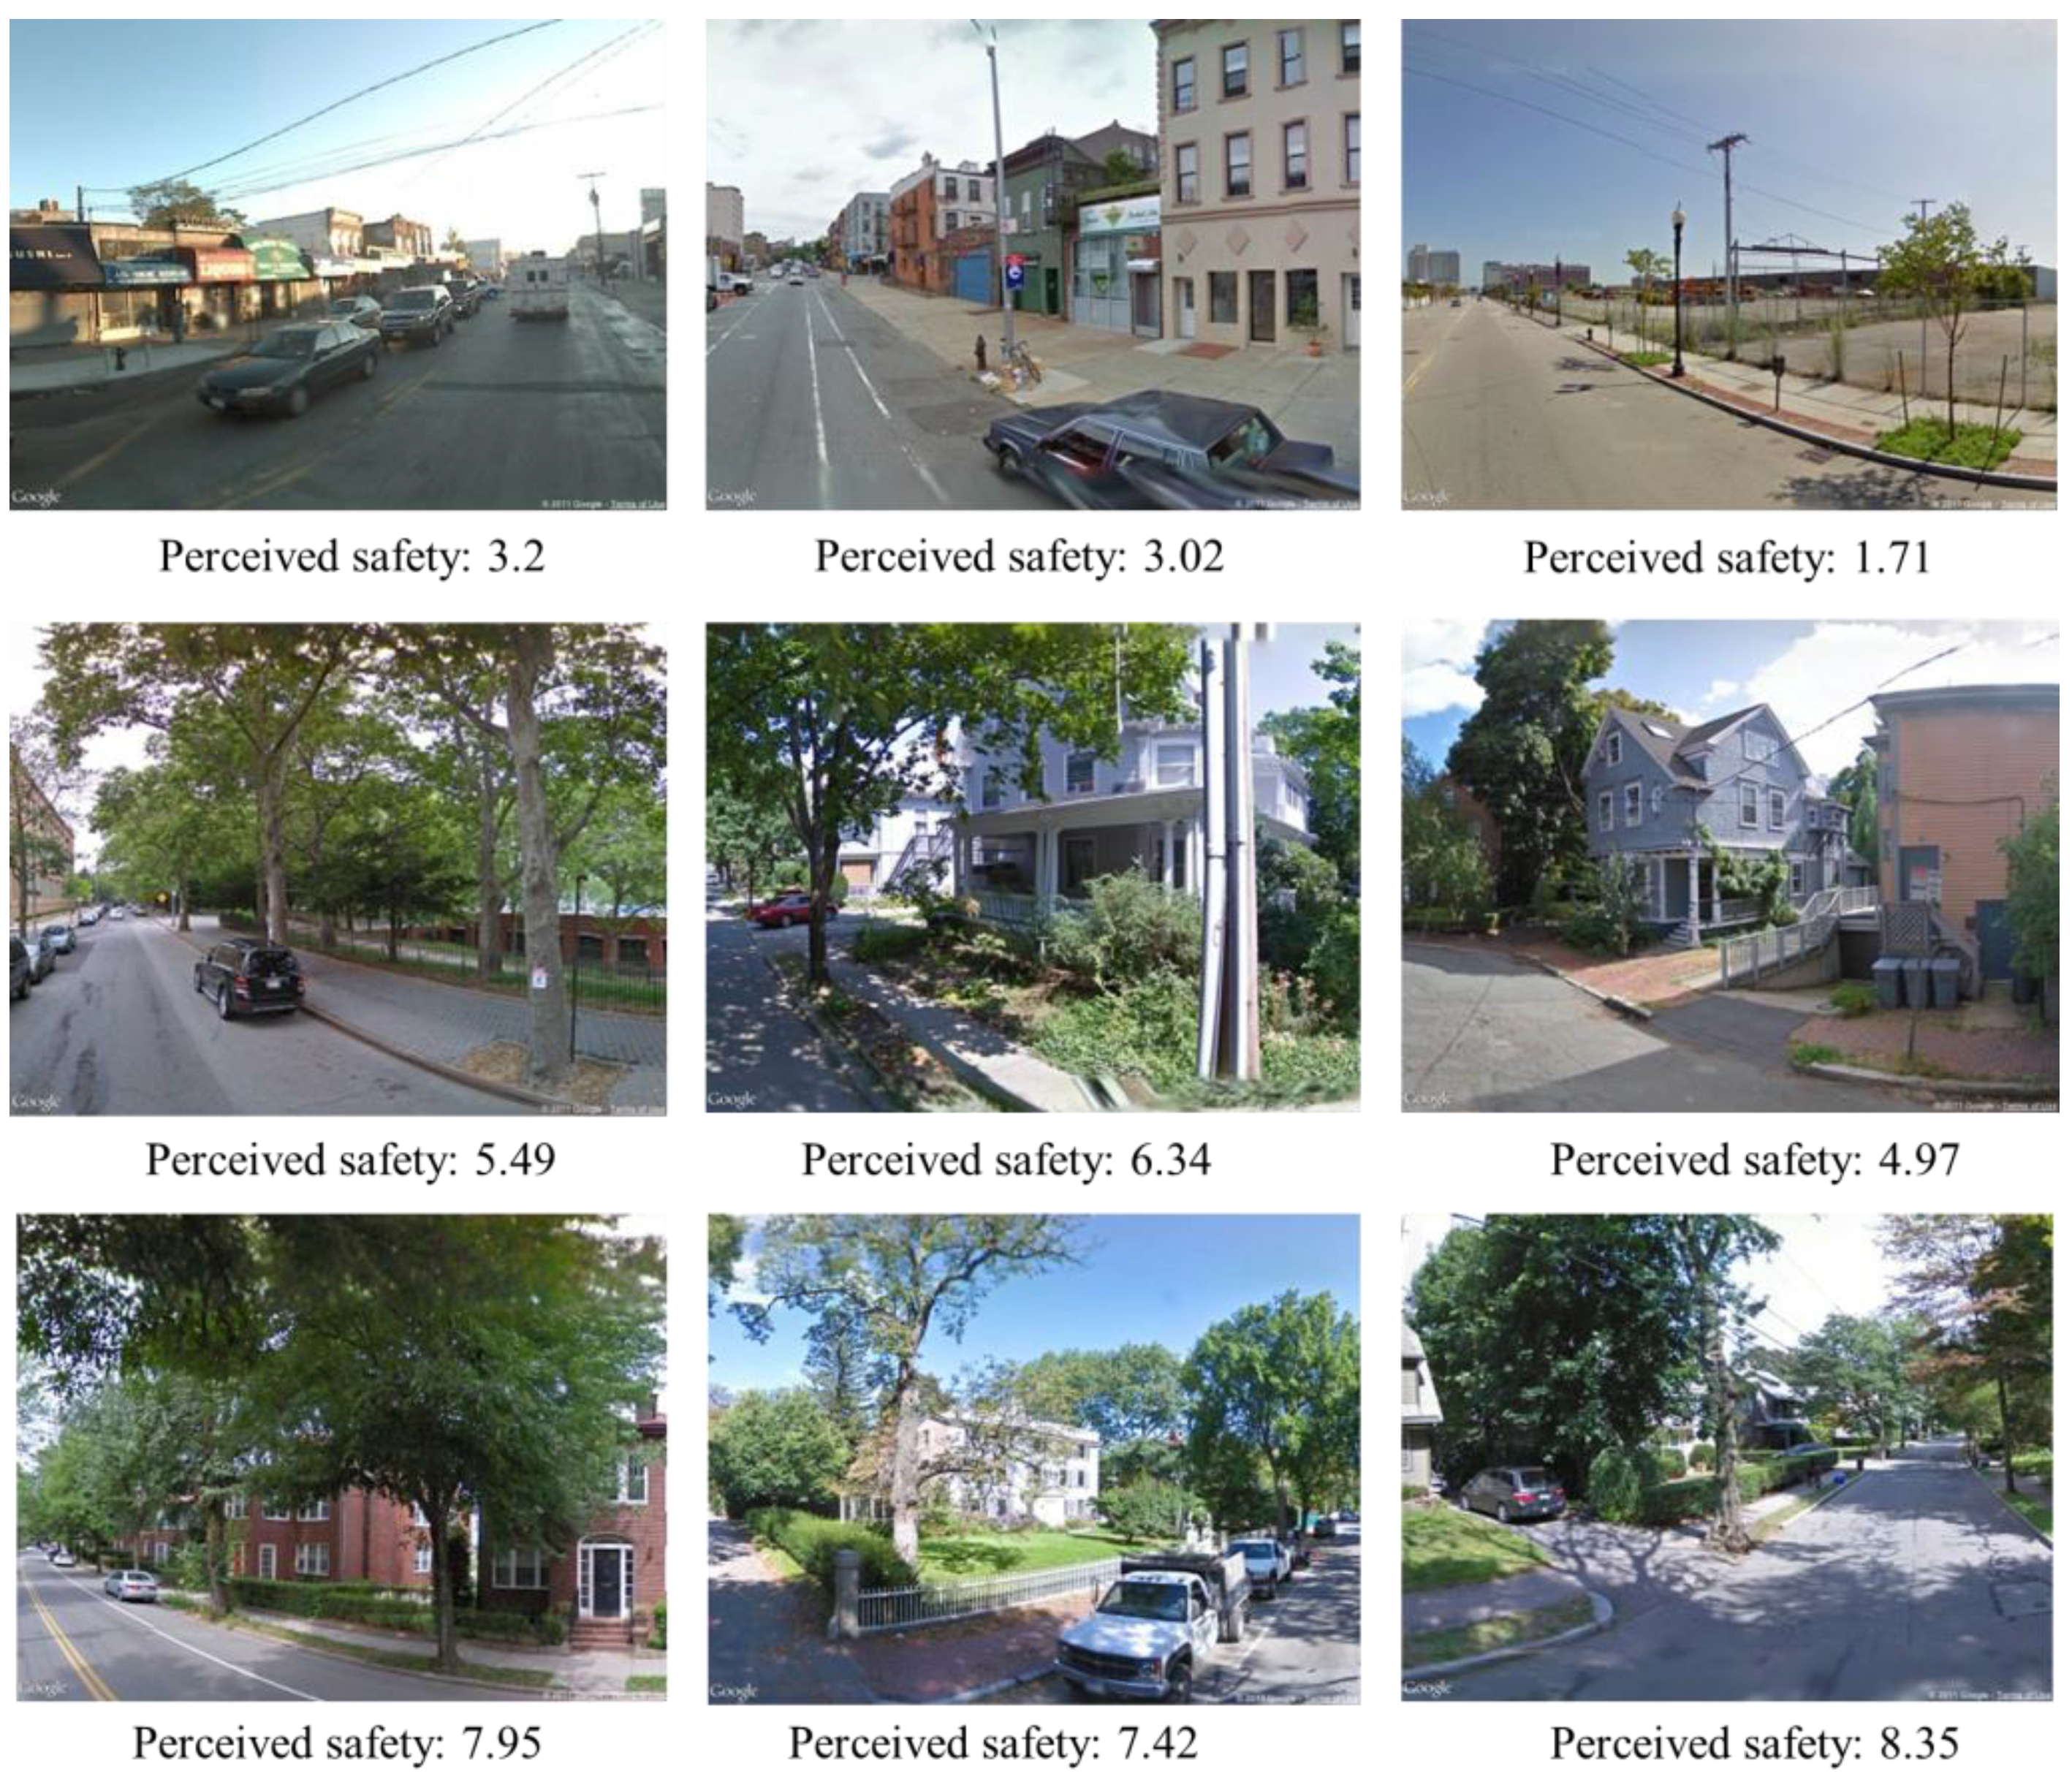
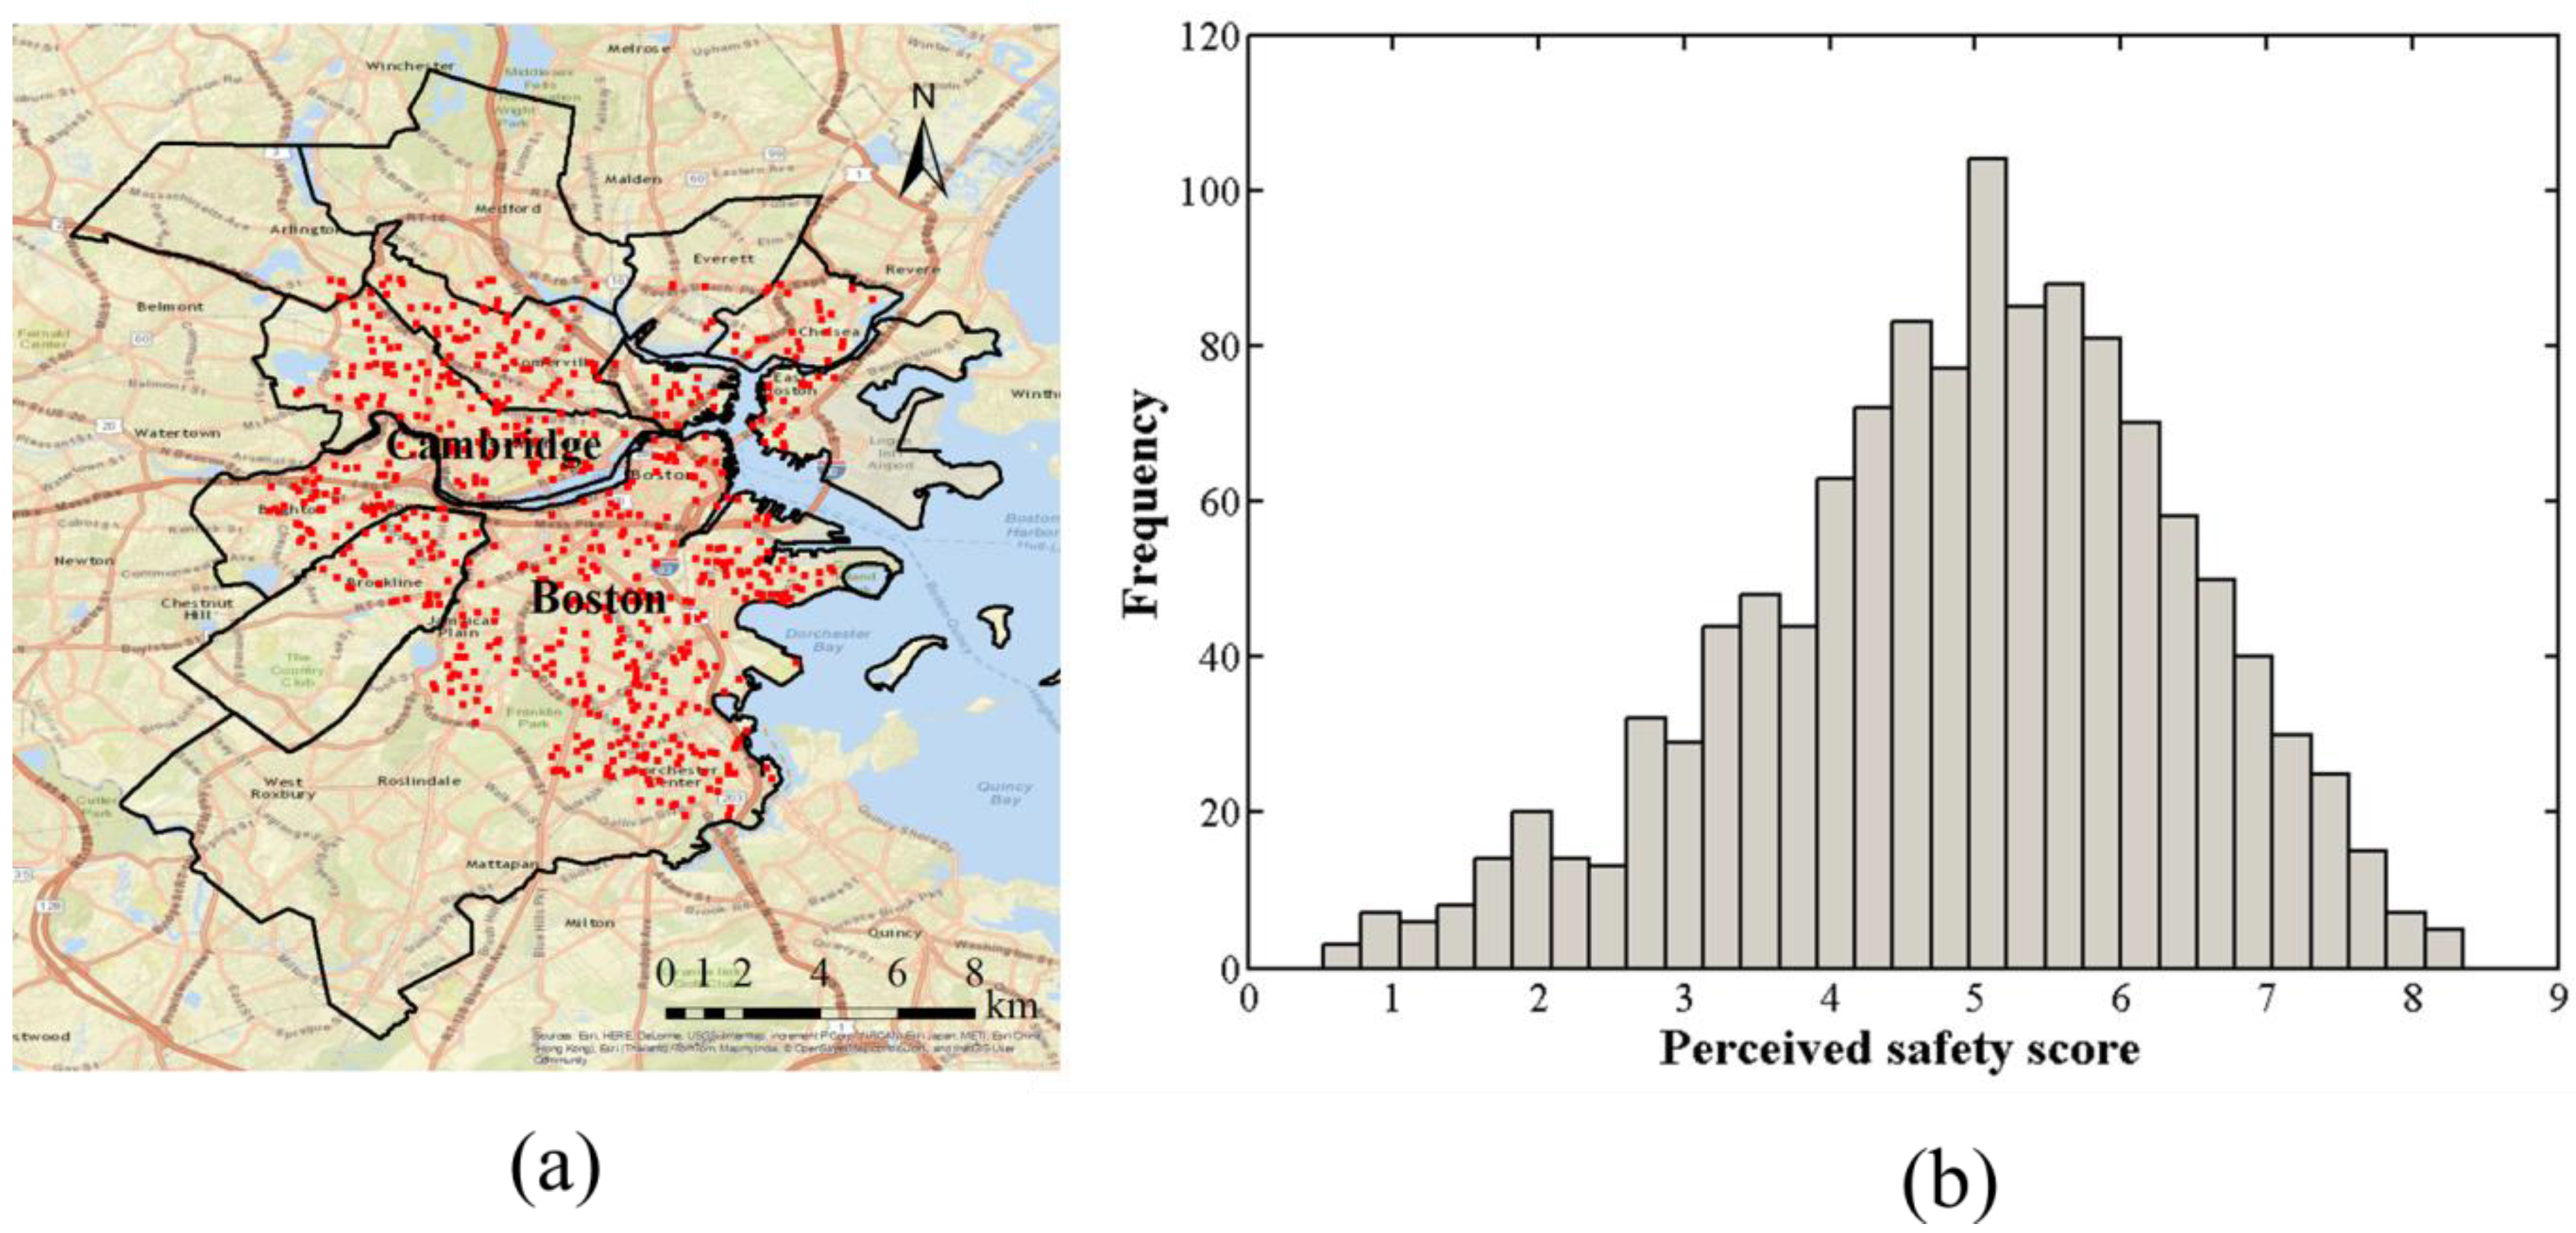
2.1. Place Pulse 1.0 Dataset

The Place Pulse 1.0 dataset is a publicly available dataset collected by MIT researchers and labeled using a crowdsourcing method between August and November 2011 [32]. It includes geo-tagged static GSV images and corresponding perception data for each image. Perception data were collected using a crowdsourcing website (Figure 1). Participants were shown two geo-tagged images randomly chosen from the cities of Boston, New York, Linz and Salzburg and were asked to choose which image looks safer, more upper-class and unique. The perceived safety score for image i (qi) is calculated based on the “strength of schedule” [33] as Equation (1),
q i = 10 3 ( W i + 1 w i j 1 = 1 w i W j 1 1 l i j 2 = 1 l i L j 2 + 1 )
W i = w i w i + l i + t i , L i = l i w i + l i + t i
where wi, li and ti denote the respective numbers of times that the image i wins, loses and ties compared with other images. The perceived safety scores fall in the range of 0 to 10. Figure 2 shows a couple of GSV images and their corresponding perceived safety scores from the Place Pulse 1.0 dataset.
Figure 1. Website for Place Pulse data collection.
Ijgi 04 01166 g001
Figure 2. GSV images from Place Pulse 1.0 datasets and corresponding perceived safety scores.
Ijgi 04 01166 g002
According to Salesses et al. [32], participants from 7872 unique IP addresses in 91 countries contributed 208,738 votes for the Place Pulse 1.0 dataset. A large number of participants and votes makes the dataset more objective than questionnaire surveys, which are usually based on a small number of samples. The regression analysis results indicate that the perceived safety scores are not driven by biases in age, gender or location of participants [32].
The original Place Pulse 1.0 dataset includes a total of 4136 geo-tagged Google Street View images from 4 cities in United States and Austria, and among them, 2941 images are from Boston (1235) and New York City (1706) in the United States. In this study, we only focus on using the geo-tagged GSV images from Boston. Figure 3a shows the spatial distribution of Place Pulse image sites in the Greater Boston area.
Figure 3. (a) The spatial distribution of Place Pulse image sites in Greater Boston. (b) Histogram of perceived safety scores in Greater Boston.
Ijgi 04 01166 g003

2.2. Land Use Map

The land use map used in this study is MassGIS Data-Land Use 2005, downloaded from the website of the Executive Office for Administration and Finance, Massachusetts (http://www.mass.gov). The 1235 Place Pulse image sites are located on 12 types of land use: multifamily residential land use (577), medium-density residential land use (16), high-density residential land use (135), urban public/institutional land use (149), transportation (51), transitional land use (4), commercial land use (187), industrial land use (69), cemetery (5), marina (4), open land (6) and participation recreation land use (32). There is only a small number of Place Pulse image sites from transitional land, cemetery, marina, cemetery, open land and medium-density residential land. Therefore, these sites were combined into similar major land use types. Table 1 shows the final combined seven land use types and their descriptions [34].
Table 1. Combined land use types in the Greater Boston and the description of each land use type.
Land Use TypeDescriptions
Multifamily residential landDuplexes (usually with two front doors, two entrance pathways and sometimes two driveways), apartment buildings, condominium complexes, including buildings and maintained lawns. In this study, it also includes medium-density residential land.
High-density residential landHousing on smaller than 1/4 acre lots.
Transportation landAirports (including landing strips, hangars, parking areas and related facilities), railroads and rail stations and divided highways (related facilities would include rest areas, highway maintenance areas, storage areas and on/off ramps).
Urban public/institutional landLands comprising schools, churches, colleges, hospitals, museums, prisons, town halls or court houses, police and fire stations, including parking lots, dormitories and university housing; also may include public open green spaces, like town commons.
Commercial landMalls, shopping centers and larger strip commercial areas, plus neighborhood stores and medical offices (not hospitals).
Industrial landLight and heavy industry, including buildings, equipment and parking areas.
Open landVacant land, idle agriculture, rock outcrops and barren areas. Vacant land is not maintained for any evident purpose, and it does not support large plant growth. In this study, it also includes participation recreation, marina, cemetery, transitional land.

3. Methodology

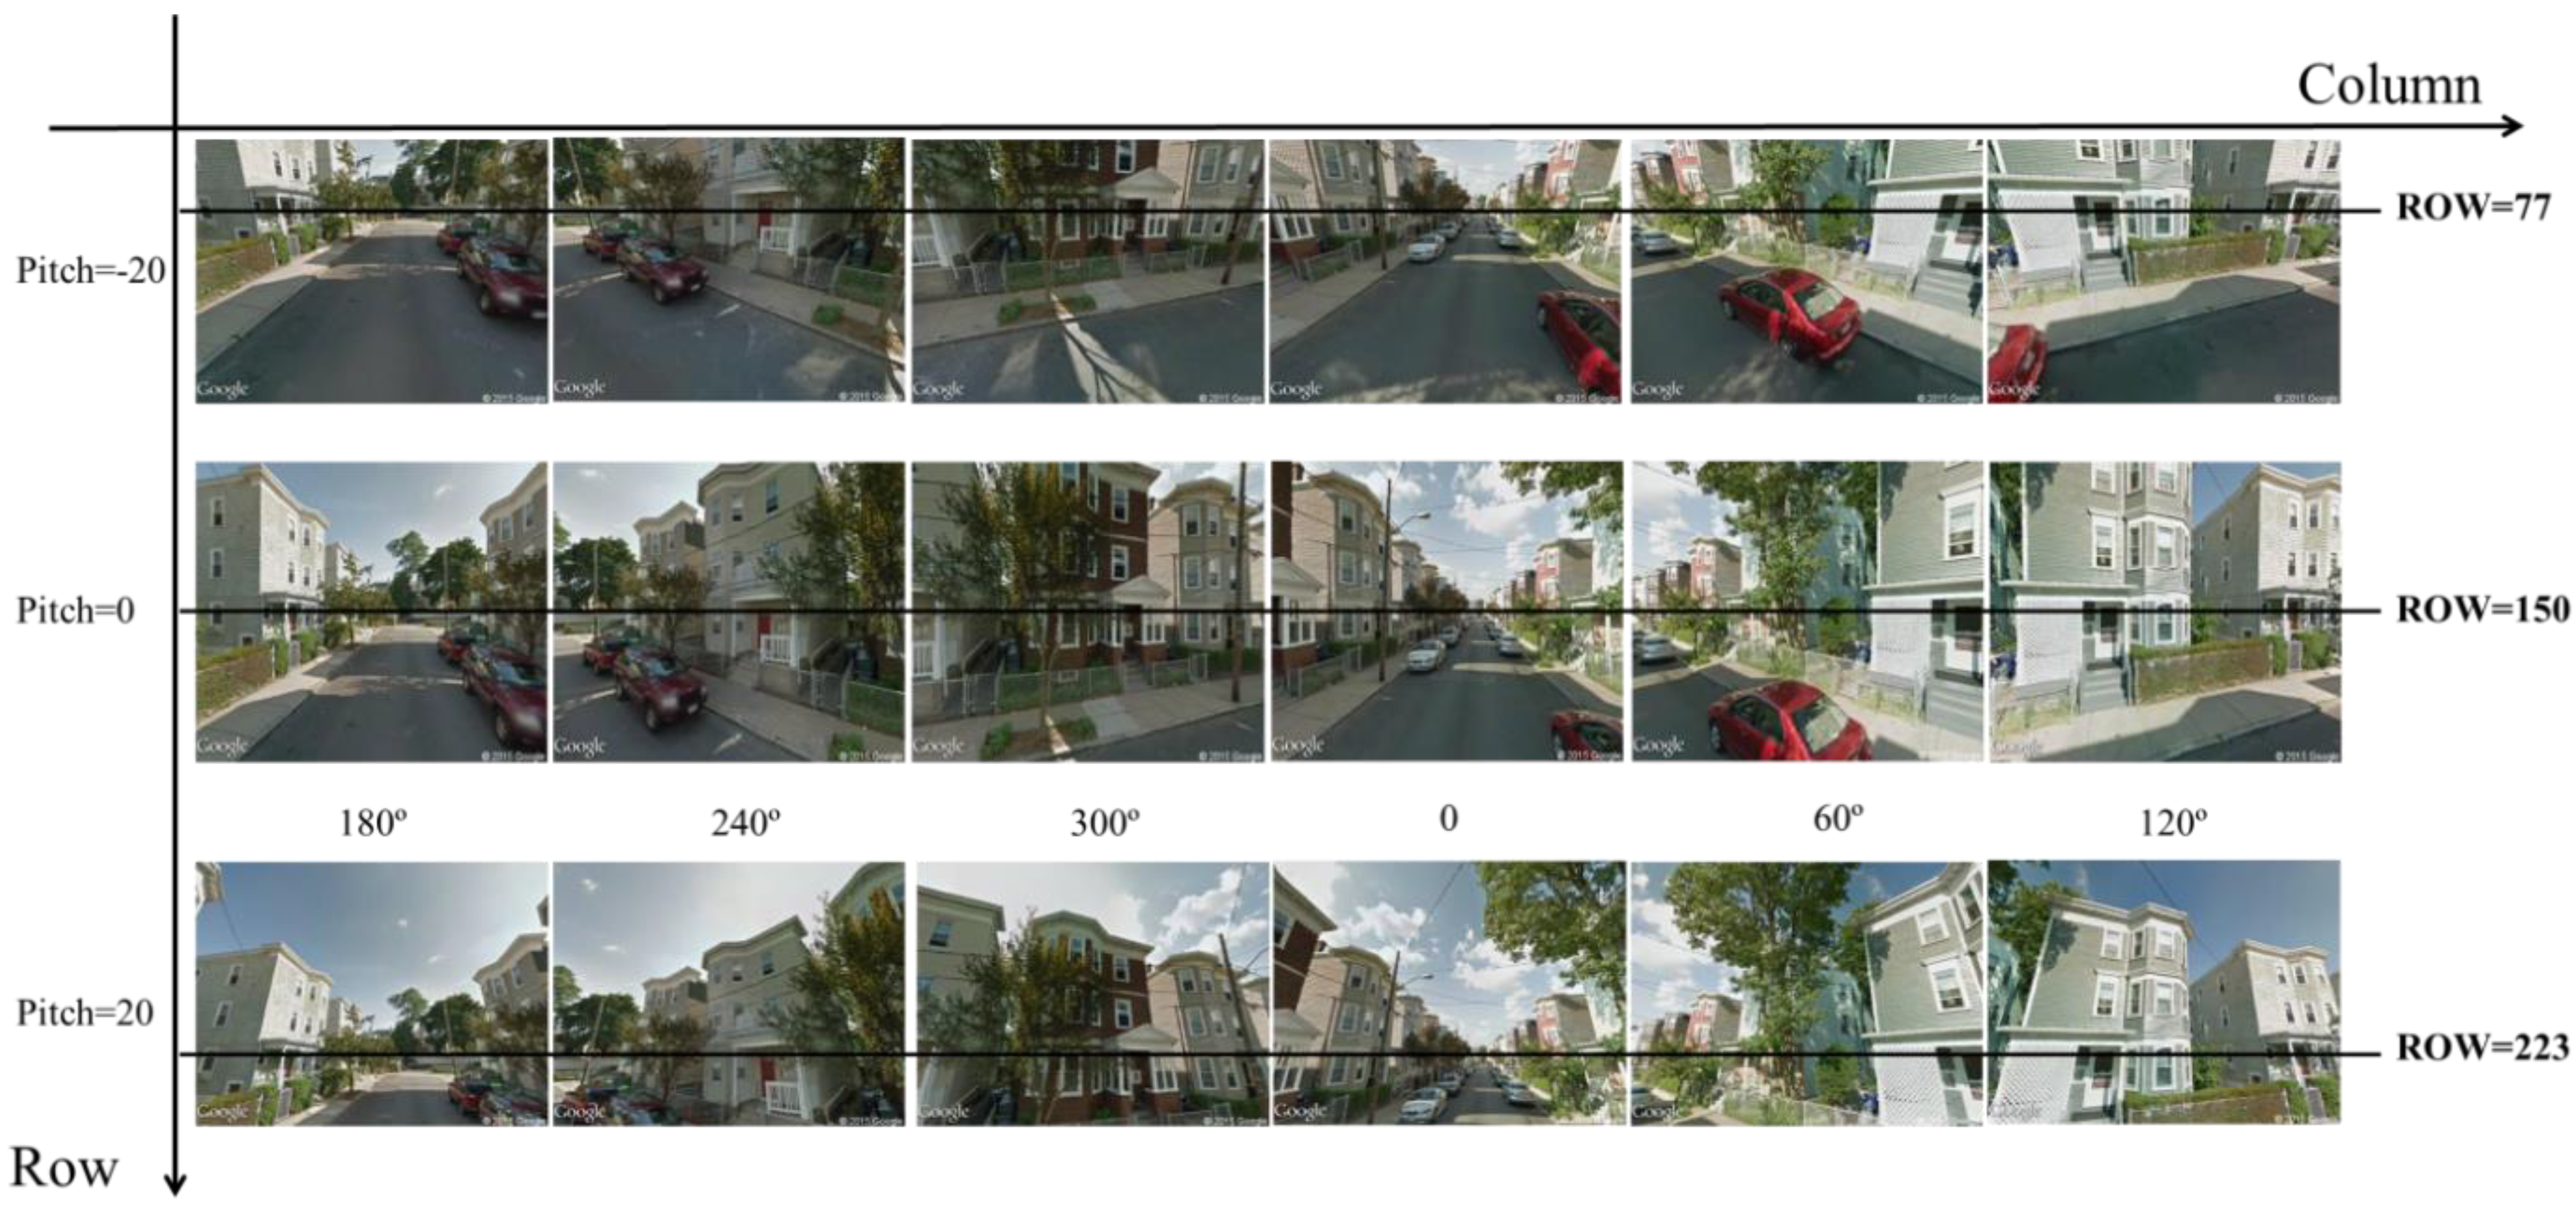
3.1. Extraction of Vegetation Information from GSV Images

3.1.1. Vegetation Classification from GSV Images

In this study, object-based image analysis was used to extract green vegetation from GSV images. The object-based method firstly segmented an image into homogeneous polygons that are physically meaningful and then assigned each polygon to different classes based on the spectral and geometrical properties of each polygon [35]. The object-based classification helped to eliminate spectral variability of the original GSV images and kept the integrity of different urban features as objects. Both characteristics made the object-based classification more suitable for green vegetation extraction from GSV images than pixel-based methods.
The spectral R, G and B components in the original 8-bit color RGB GSV images were firstly normalized to the range of [0, 1] before image segmentation. Then a Python module pymeanshift was used to conduct image segmentation. After segmentation, new thematic images were generated by setting the attribute of each object to the average value of pixels in that object at each of the three RGB bands. Excess green index (ExG = 2G – R − B) [36,37] was then used to enhance the contrast between green vegetation and non-green vegetation. Finally, the Otsu algorithm [38] was used for choosing the optimum threshold to differentiate green vegetation and non-green vegetation. The pseudo code for the green vegetation extraction algorithm is listed as follows.
Algorithm 1. Spectral rules for vegetation classification based on segmented GSV images.
Comment: G, R and B are three bands in segmented images
Comment: Vegetation is the vegetation extraction result
ExG = 2 × G – R – B
Threshold = OTSU(ExG)
for each pixel [i, j] in ExG:
  if ExG [i, j] > Threshold:
    Classify Vegetation [i, j] as green vegetation
Mask out pixels with values in green, red, blue band higher than 0.6 in the Vegetation image
This proposed vegetation classification algorithm (Algorithm 1) only classified the vegetation shown as green in the GSV images. Other urban green spaces, which were shadowed or faded by the bad illumination conditions and shown as non-green features, were not classified as green vegetation. In order to keep classification quality, we further checked the final classified results manually and deleted the 18 GSV images that have obvious non-vegetation features misclassified as green vegetation. We validated the classification results based on 100 randomly chosen GSV images. The validation result shows that the overall accuracy of vegetation extraction is higher than 85%; thus, it is qualified for further analysis. Considering that this study was trying to examine the relationship between the visibility of green vegetation and the perception of safety based on GSV images and that the users were only presented the GSV images, the discrepancy between in situ reality and the constrained amount of information in geo-tagged images did not have an influence on our analysis.

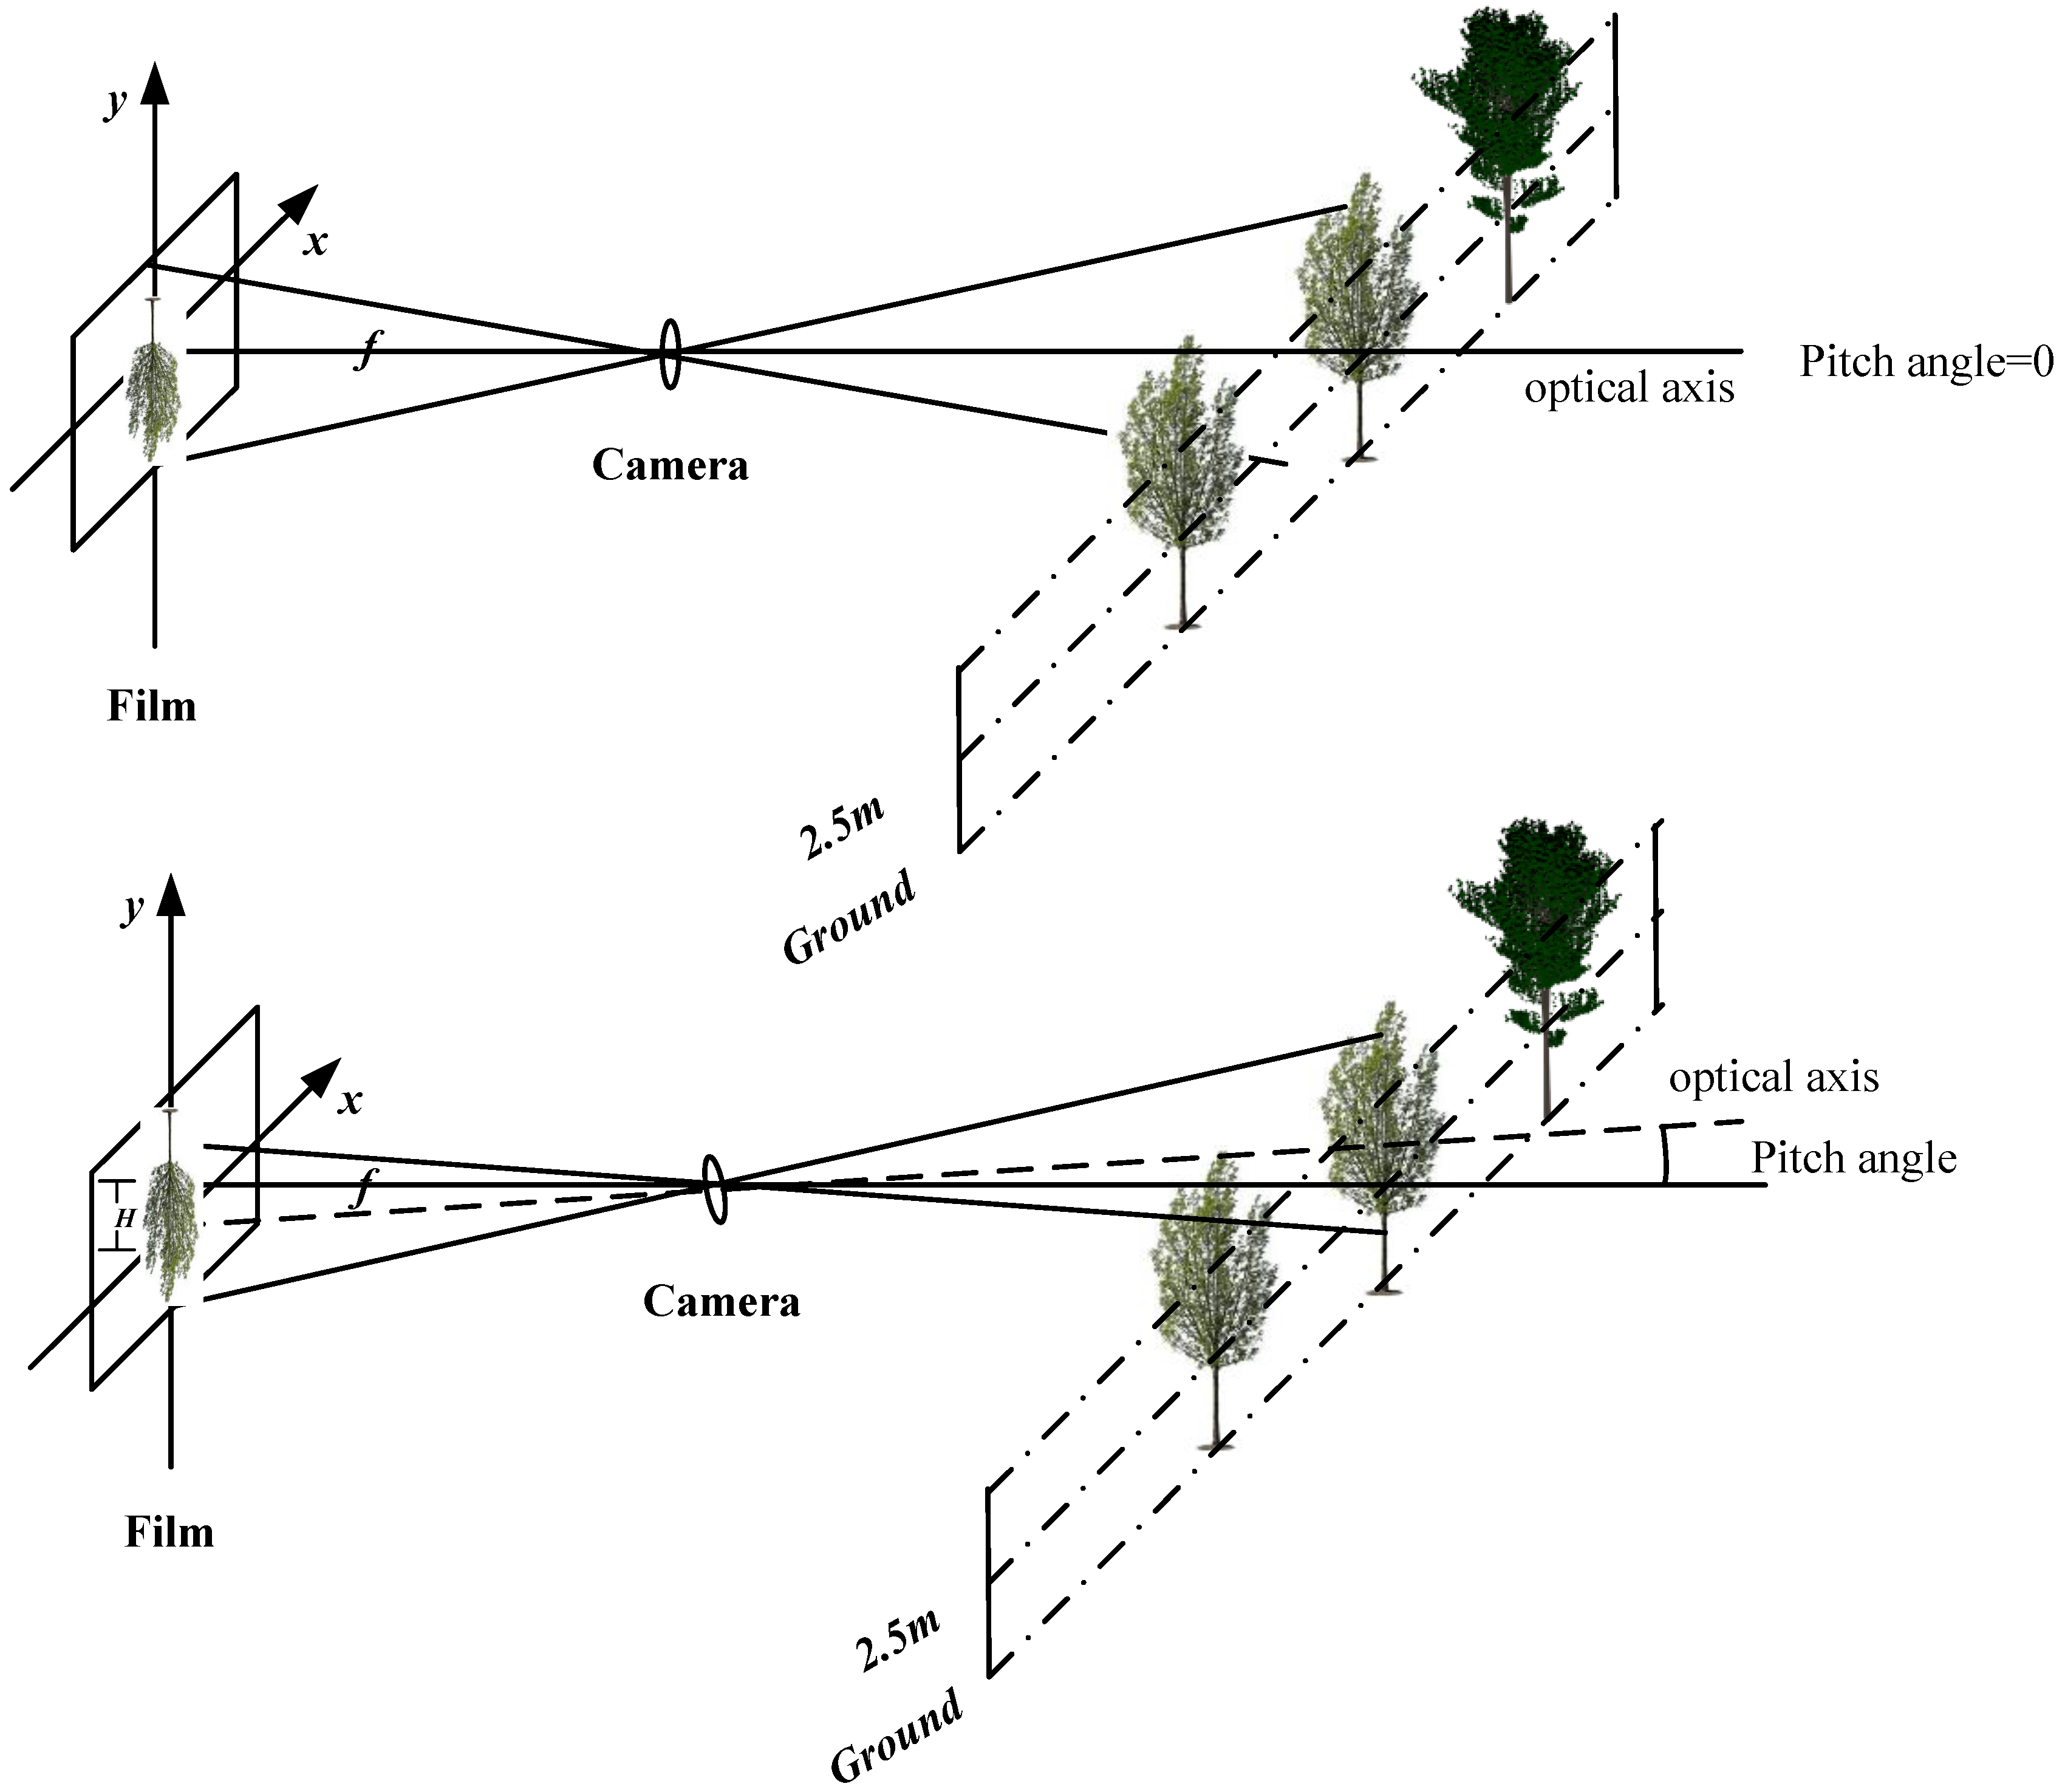
3.1.2. Vertical Distribution of Greenery

A considerable literature has mentioned that view-obstructing green vegetation and non-view-obstructing green vegetation have different effects on human perceived safety. GSV images taken by Google Street View cameras on the top of cars with a height of 2.5 m make it possible to measure the distributions of potential view-obstructing and non-view-obstructing green vegetation. The horizon of a scene is the edge of vision at the height of the camera (2.5 m), paralleling all features at the same height. When the camera is level (pitch angle = 0), the horizon line is centered in the viewport of the image. In this case, the middle line in a GSV image is the horizon line and the projection of all features with a height of 2.5 m. As the camera tilts up, the horizon line lowers; as it tilts down, the horizon line raises. Figure 4 shows the model of the horizon line changes with the change of the pitch angle.
The geo-tagged images in the Place Pulse 1.0 dataset were taken with a size of 400 × 300, a horizontal field of view 90° and a vertical field of view 74°. Therefore, the focal length (f) is 200 pixels. Therefore, based on the model shown in Figure 4, the horizon line moves up H in the film (moves down in GSV image) compared with the horizon with a pitch angle of 0,
H = f tan ( p i t c h ) = 200 tan ( p i t c h ) , u n i t : p i x e l
where pitch is the pitch angle for each geo-tagged image. Therefore, the horizon line for a geo-tagged image with pitch angle pitch will move from the middle line (Row 150 in the GSV images) to:
H o r i z o n = 150 + H = 150 + 200 tan( p i t c h ),  u n i t : p i x e l
Figure 4. Google Street View camera view model.
Ijgi 04 01166 g004
Figure 5. Static Google Street View images of one site (42.317948°N, 71.054739°W) in Boston at different directions and pitch angles. When the pitch angle is 0, the middle line (Row 150) is the horizon (2.5 m line).
Ijgi 04 01166 g005
Figure 5 shows static GSV images of one site in Boston at different directions and pitch angles. Based on Equation (4), when the pitch angle is −20°, the horizon line is on Row 77 in the GSV images; the horizon line is in the middle of the images in the case that the pitch angle equals zero, and when the pitch angle changes to 20°, the horizon line moves down to Row 223 in the images. Vegetation above the horizon line is higher than 2.5 m, and vegetation below the horizon is lower than 2.5 m. Those green spaces higher than 2.5 m are non-view-obstructing. Those green spaces lower than 2.5 m include non-view-obstructing lawns and view-obstructing shrubs and small trees.

3.2. Image Quality of Geo-Tagged Imagery

Since the perception data in the Place Pulse 1.0 dataset is based on the GSV images and participants are not shown the characteristics of the Place Pulse image sites, nor the locations of the images, variation in image quality (contrast, brightness) could introduce additional variation in the perceptions associated with geo-tagged images [32]. Because most of these GSV images were collected between 2007 and 2011, the quality of the images is not the same, and this could affect a user’s choice in judging which places look safer. In addition, the illumination conditions of the images, which are reflected as image brightness in GSV images, could also affect human perception of safety. To control the impact of image quality on the perceptions, two widely used indices were used to represent the quality of images.

3.2.1. Brightness

Brightness is the perception elicited by the luminance of a visual target. The brightness of an image reflects the illumination condition of an image, which is affected by the time of day, weather conditions and shadow. In this study, the mean value of GSV images at three visible bands was used to measure brightness.
B r i g h t n e s s = 1 3 × M × N b = 0 3 i = 0 N 1 j = 0 M 1 ( I b i j )
where Ibij is the digital number of pixel (i, j) in band b of a GSV image with size of M × N.

3.2.2. Contrast

Contrast is the difference in luminance and/or color that makes an object (or its representation in an image or display) distinguishable. The human visual system is more sensitive to contrast than absolute luminance. Root mean square contrast was used to measure the global contrast of each GSV image in this study.
C o n t r a s t = 1 3 b = 1 3 1 M × N i = 0 N 1 j = 0 M 1 ( I b i j I ¯ b ) 2
where Ibij is the digital number of pixel (i, j) in band b of a GSV image with size of M × N, and:
I ¯ b = 1 M × N i = 0 N 1 j = 0 M 1 I b i j

3.3. Variables’ Preparation and Regression Analysis

Based on extracted vegetation information, the percentages of green vegetation pixels below and above the horizon were calculated to indicate the visibility of green space for each geo-tagged image. Contrast and brightness were used to represent image quality. Four variables (percentage of vegetation below horizon, percentage of vegetation above horizon, brightness and contrast) derived from geo-tagged images and land use map were used as independent variables in this study. Considering that the structures of urban features in different land use types are significantly different and such differences could have an influence on human perception of safety, the land use map was also incorporated into the analysis. Land use categories were converted to dummy variables in the regression model. Given the fact that most Place Pulse image sites are located in multi-family residential areas, we coded multi-family residential land as the reference category (e.g., x1 = x2 = x3 = x4 = x5 = x6 = 0) and other land use types as comparison categories. The coding system for land use variables is:
  • High density residential land: x1 = 1, x2 = x3 = x4 = x5 = x6 = 0
  • Urban public/institutional land: x1 = 0, x2 = 1, x3 = x4 = x5 = x6 = 0
  • Transportation: x1 = x2 = 0, x3 =1, x4 = x5 = x6 = 0
  • Commercial land: x1 = x2 = x3 = 0, x4 = 1, x5 = x6 = 0
  • Industrial land: x1 = x2 = x3 = x4, x5 = 1, x6 = 0
  • Open land: x1 = x2 = x3 = x4 = x5 = 0, x6 = 1
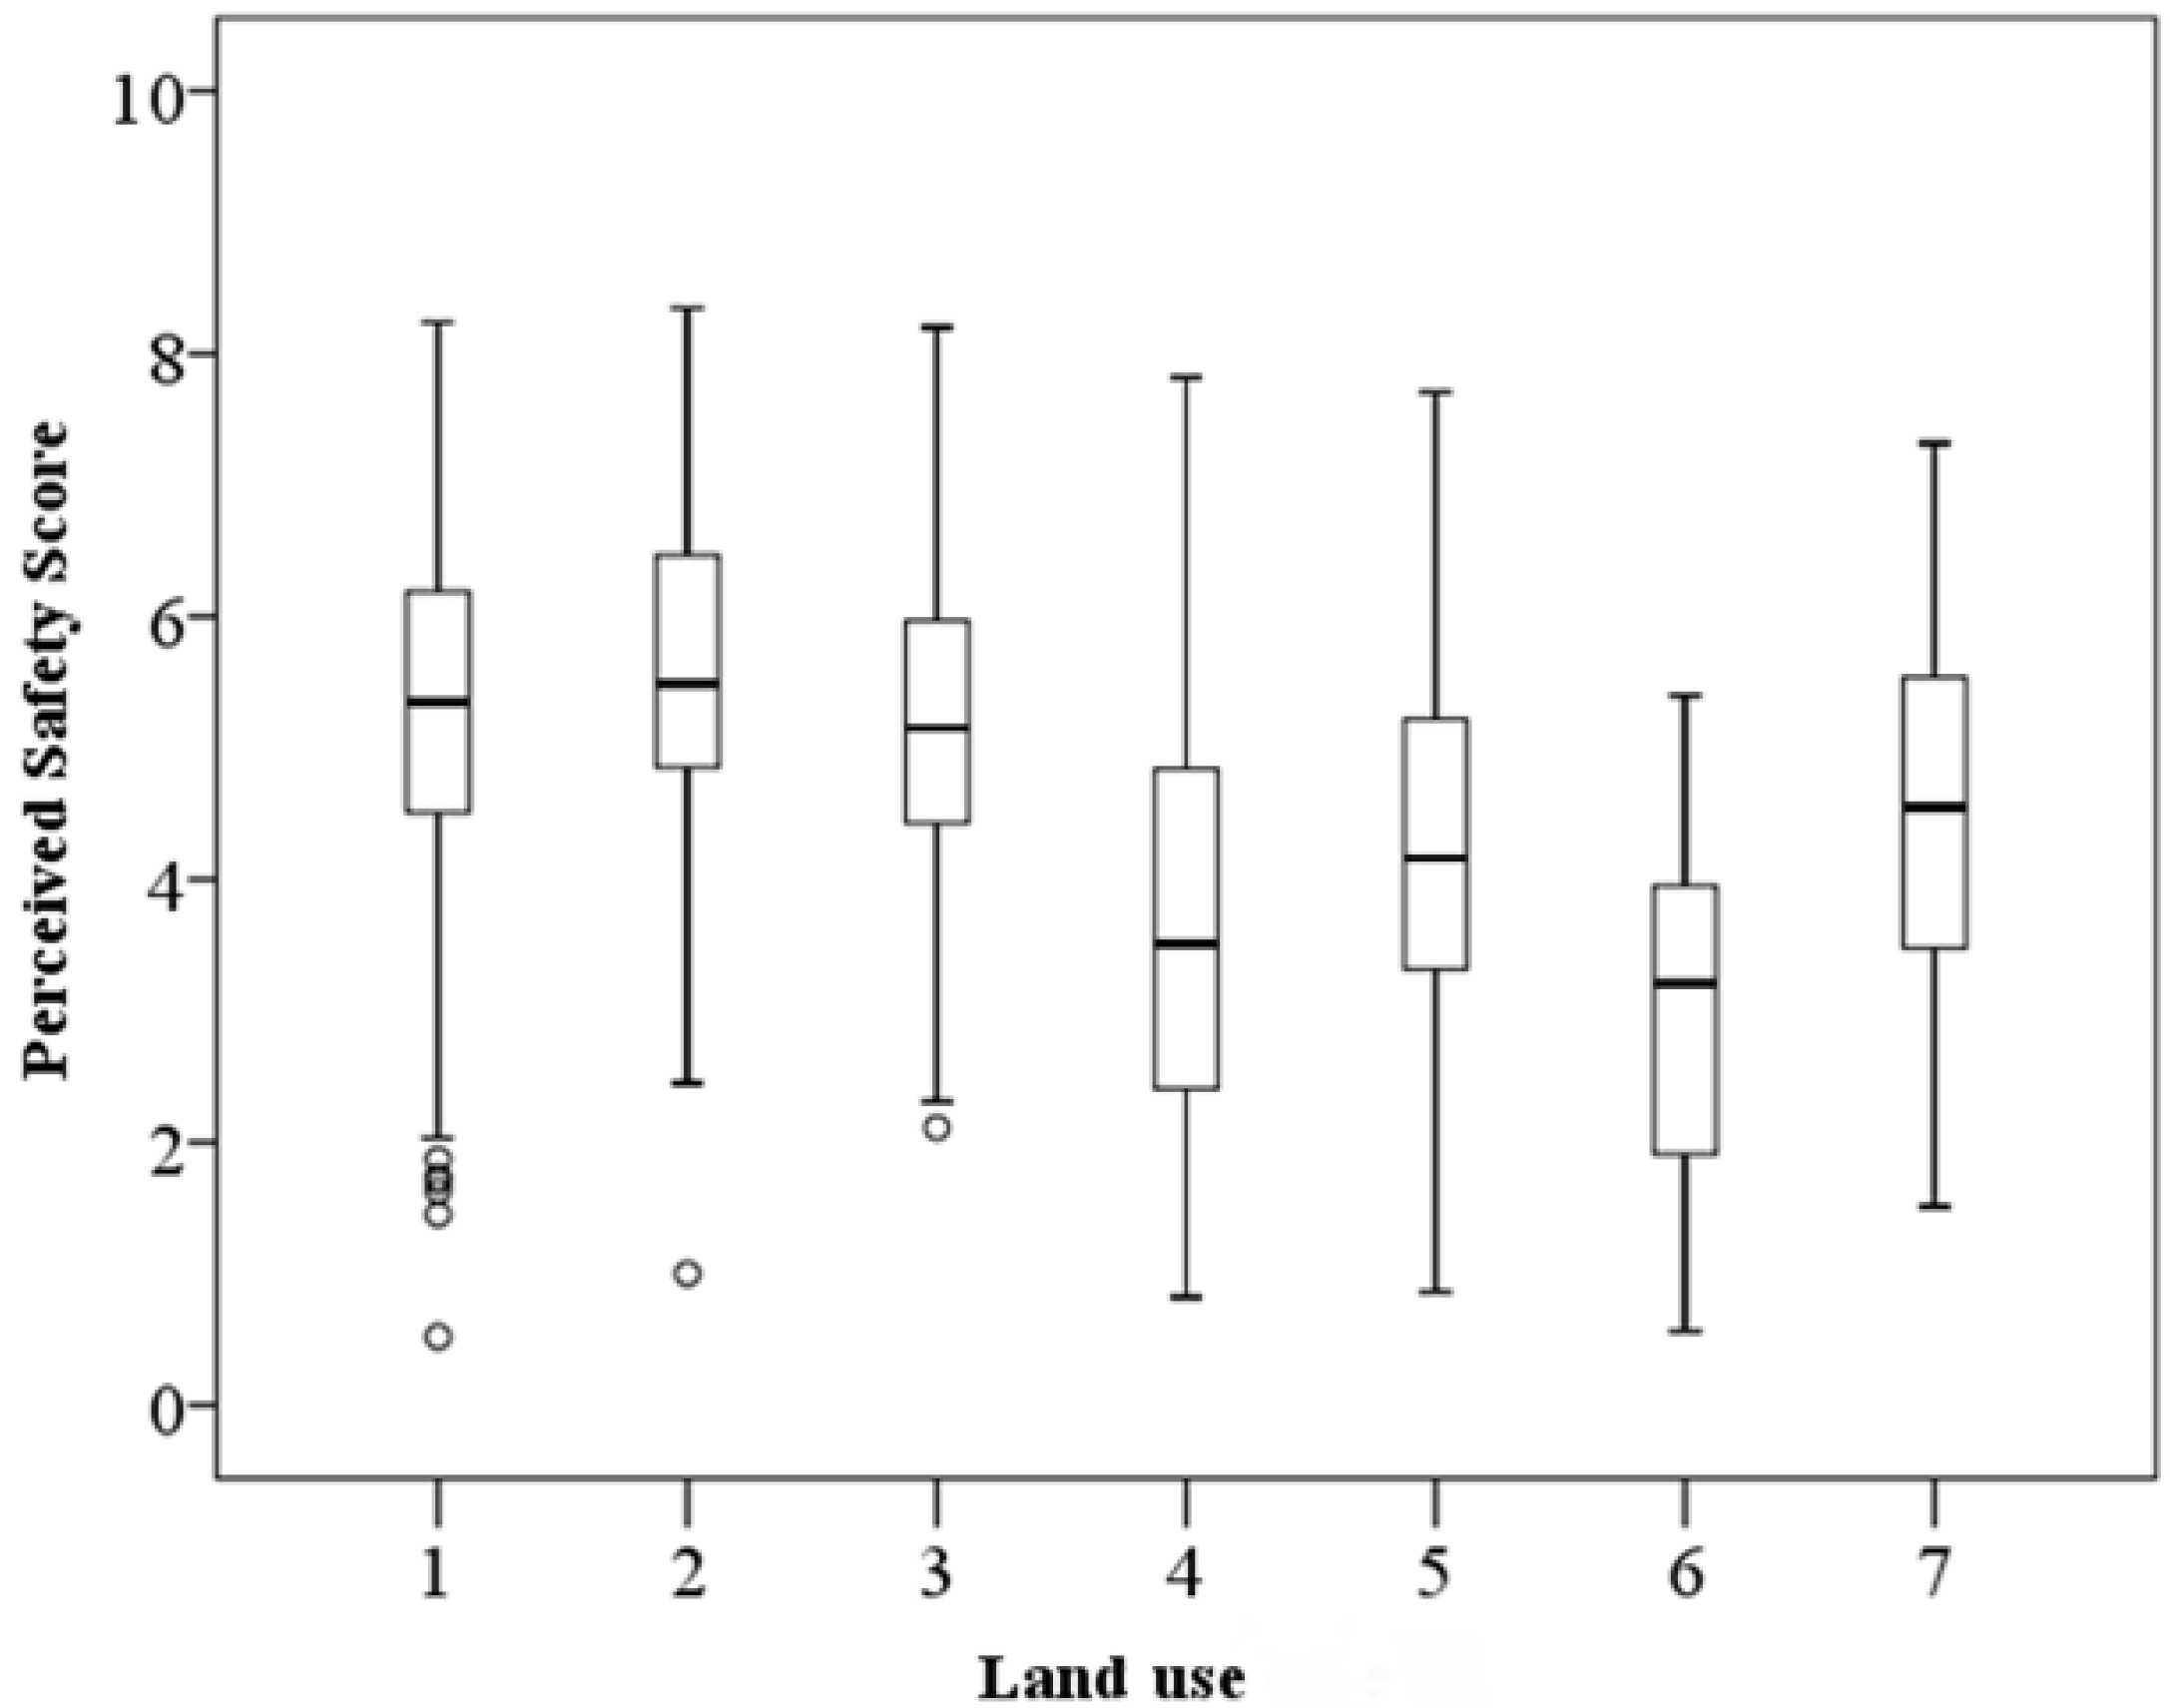
The statistical analysis was conducted in two stages. Firstly, an ordinary least squares (OLS) multivariate regression model was used to regress the perceived safety against all independent variables for all sites in the study area to check the relationship between perceived safety and the visibility of green vegetation with the control of image quality and land use types.
Secondly, seven OLS linear regression models were used to model the relationships of perceived safety with green vegetation below the horizon (2.5 m), vegetation above the horizon (2.5 m), brightness and contrast for the seven land use types, and they were also used to examine the variation in the associations between the dependent variable and the independent variables for different land use types.

4. Results

Among the finally chosen 1217 Place Pulse image sites in Greater Boston, perceived safety scores vary from 0.52 to 8.35, with a mean value of 4.94 and a standard deviation of 1.48. The histogram distribution of perceived safety scores for all Place Pulse image sites in Boston is shown in Figure 3b. Figure 6 presents the box plot of the perceived safety scores for different land use types in the study area. Five hundred eighty three image sites are located on multi-family residential land, 135 sites on high-density residential land, 149 sites on urban public/institutional land, 50 sites on transportation land, 182 sites on commercial land, 69 sites on industrial land and 49 sites on open land.
Figure 6. The box plot of the perceived safety scores for different land use types (1 denotes multifamily residential land, 2 denotes high density residential land, 3 denotes urban public/institutional land, 4 denotes transportation, 5 denotes commercial land, 6 denotes industrial land, 7 denotes open land).
Ijgi 04 01166 g006
Bivariate correlation analysis was conducted to investigate the correlations between the perceived safety and percentage of green vegetation and image quality (Table 2) for all Place Pulse sites. The percentage of green vegetation, both percentages of green vegetation below and above the horizon and GSV image contrast have significant positive correlations with the perceived safety. The brightness has a negative correlation with the perceived safety.
Table 2. Pearson’s correlation coefficients (r) between perceived safety and independent variables.
VariablesPearson’s CorrelationSig (2-tailed)N
Percentage of vegetation0.388**0.0001217
Percentage of vegetation above horizon0.358**0.000
Percentage of vegetation below horizon0.296**0.000
Brightness−0.188**0.000
Contrast0.304**0.000
** correlation is significant at the 0.01 level (2-tailed).
In order to study the relationships between perceived safety and the characteristics of vegetation, the percentage of vegetation was split into two variables: percentage of vegetation above the horizon and percentage of vegetation below the horizon. These two variables, instead of the percentage of vegetation, were used in multiple linear regression analysis. Table 3 reports the results of the multiple linear regression analysis between perceived safety and independent variables, including vegetation characteristics, image quality indices and land use types for the entire study area. Because the variance inflation factor (VIF) values for all independent variables in Table 3 are lower than 2.0, multicollinearity in the regression analysis is not significant. Coefficients in the regression model show that perceived safety increases significantly with increased percentages of both vegetation above the horizon and vegetation below the horizon. The relative importance of the two vegetation variables in the regression model can be evaluated on the basis of their corresponding t-statistic values. Apparently, the percentage of vegetation above the horizon is a stronger predictor of perceived safety scores than is the percentage of vegetation below the horizon. The significantly negative coefficients in Table 3 show that transportation land, commercial land, industrial land, open land and urban public/institutional land tend to have lower perceived safety scores than the multi-family residential land does. There is no significant difference between the multi-family residential land and the high-density residential land in terms of perceived safety considering the insignificant coefficient of high-density residential land.
Table 3. Summary of the multiple linear regression analysis between perceived safety and explanatory variables for all Place Pulse sites. VIF, variance inflation factor.
Multiple Linear Regression
Standardized Coefficientst-Valuep-ValueVIF
VegetationPercentage of vegetation above the horizon0.194**6.6030.0001.56
Percentage of vegetation below the horizon0.102**3.7730.0001.32
Image qualityContrast0.208**7.9500.0001.41
Brightness−0.111**−3.9860.0001.25
Land use typesHigh-density residential land0.0291.1730.2411.11
Urban public/institutional land−0.051*−2.0560.0401.11
Transportation land−0.132**−5.3960.0001.10
Commercial land−0.181**−7.1300.0001.18
Industrial land−0.284**−11.5120.0001.10
Open land−0.099**−4.1180.0001.05
R20.337
F-statistic61.178
Adjusted R20.331
Multicollinearity condition number21.863
* Significant at the 0.05 level (2-tailed); ** significant at the 0.01 level (2-tailed).
The association between green vegetation and perceived safety varies with different land use types. Table 4 presents the results of seven regression models for the dependent variable and the four independent variables. From the table, it can be seen that there exist significant positive correlations between the perceived safety and the percentage of vegetation above the horizon at the 99% confidence level in multi-family residential, urban public/institutional and commercial areas. In high-density residential land and open land, the perceived safety also has obvious positive correlations with the percentage of vegetation above the horizon. Perceived safety increases significantly with increased percentage of vegetation below the horizon only in multi-family residential and urban public/institutional lands. However, there exists no significant correlation between the perceived safety and percentage of vegetation below the horizon in other land use types, except multi-family residential and urban public/institutional lands. In transportation and industrial lands, perceived safety has no significant relationship with both the percentage of vegetation above the horizon and the percentage of vegetation below the horizon.
Image quality indices (i.e., contrast and brightness) also show significant correlations with perceived safety scores in some land use types. Nevertheless, the significant correlations of the two indices with perceived safety are opposite in transportation, commercial and industrial lands.
Table 4. Multivariate linear regression coefficients of vegetation above the horizon, vegetation below the horizon, contrast and brightness against perceived safety for different land use types. Standardized coefficients (betas) are reported here.
Dependent Variable: Perceived Safety
Independent VariablesMultifamily ResidentialHigh-Density ResidentialUrban Public/ InstitutionalTransportationCommercialIndustrialOpen Land
Vegetation above horizon0.180 **0.247 *0.320 **0.1150.258 **−0.0130.451 *
Vegetation below horizon0.164 **0.1230.186 *−0.0540.0150.159−0.144
Contrast0.165 **0.328 **0.0470.476 **0.259 **0.408 **0.197
Brightness−0.075−0.052−0.037−0.376 **−0.237 **−0.312 **−0.082
F-statistic21.2399.3108.6806.98412.396.3624.646
R20.1280.2230.1940.3830.2190.2850.297
Adjust R20.1220.1990.1720.3280.2010.2400.233
Multicollinearity condition number20.29623.72420.77324.49422.16019.37228.852
* Significant at the 0.05 level (2-tailed); ** significant at the 0.01 level (2-tailed).

5. Discussions

Reducing fear by designing the environment has become an important idea for making cities more livable. However, quantitatively studying the relationship between human perceived safety and environmental design, such as a green vegetation design, has been difficult, especially at large scales, due to the lack of reliable data. Data collection has always been a major obstacle in this kind of study. In this study, crowdsourced data, the Place Pulse 1.0 dataset, were used for the first time to investigate the relationship between the visibility of green vegetation and human perceived safety, with the use of GSV images for green vegetation data extraction. The statistical analysis results obtained in this study show that at the city level, the visibility of green vegetation (including both vegetation above the horizon and vegetation below the horizon) is positively correlated with human perceived safety, and the vegetation above the horizon is a stronger predictor of perceived safety scores than is the vegetation below the horizon. Vegetation above the horizon (i.e., that higher than 2.5 m) in GSV images is mainly composed of non-view-obstructing urban trees. Therefore, this proves that the visibility of urban trees is positively related to human perceived safety. This finding is in agreement with the previous finding that urban trees could help increase perceived safety [19]. In terms of image quality, perceived safety is positively correlated with high image contrast and low image brightness. This could be explained by the fact that people usually have negative opinions of images with low contrast, and high brightness images usually are associated with more non-vegetation features, like concrete buildings and paved ground, which further impact human opinions negatively. Among those land use types, transportation land, commercial land, industrial land, open land and urban public/institutional land tend to have lower perceived safety scores than the multi-family residential land does. There is no significant difference between the multi-family residential land and the high-density residential land in terms of perceived safety. As an indicator of the condition of the land, land use reflects the quality of the physical environment. Previous studies suggest that nonresidential lands increase physical deterioration of the environment [39,40]. The deteriorated environment may in turn facilitate potential crimes [41]. In addition, nonresidential lands usually are accompanied by more strangers, which may further increase opportunities for crimes [31].
The relationships between green vegetation and perceived safety vary with different land use types when checking the relationships at a finer level (land use type level). Although in residential land, urban public/institutional land, commercial land and open land, the perceived safety has a significantly positive relationship with the percentage of vegetation above the horizon, no significant relationship was found between the perceived safety and the percentage of vegetation above the horizon in transportation and industrial lands based on the Place Pulse 1.0 dataset. The coefficient of vegetation above the horizon in the regression model of open land is obviously higher than coefficients in models of other land use types (Table 4). This may be explained by the mixed land use types in open land. Please note that considering the small sample sites, in this study, the land use types of participation recreation, cemetery and marina were merged into one land use type: open land. The typical open land includes vacant land and barren areas, and it is not maintained for any evident purpose nor does it support large plant growth. Those sites having a large percentage of vegetation above the horizon are usually located in places of participation recreation or other places with well-maintained urban trees, which usually have higher perceived safety scores. Vegetation below the horizon is a little more complex, and it is composed of grasslands, lawns and view-obstructing shrubs and small trees. Since the image analysis algorithm in this study cannot differentiate between the view-obstructing shrubs and non-view-obstructing lawns and grasslands, it is difficult to investigate the associations of perceived safety with lawns and shrubs, respectively. At the city level, perceived safety is positively correlated with the visibility of vegetation below the horizon, as indicated from the results in Table 3. However, from Table 4, it can be seen that the relationship is positive only in a few of the land use types when studying the relationship at a finer level: the land use type level. In multi-family residential and urban public/institutional lands, perceived safety is positively correlated with the visibility of vegetation below the horizon. This may be because in multi-family residential and urban public/institutional lands, vegetation below the horizon is mostly composed of well-maintained lawns and shrubs. Previous studies reported that a well-maintained green space is positively associated with higher perceived safety [12,22,27]. However, in high-density residential land, transportation land, commercial land, industrial land and open land, there is no significant relationship between the perceived safety and the percentage of vegetation below the horizon. This could be explained by the mixed function of different kinds of vegetation. Transportation, commercial and industrial lands are mostly distributed in dense urban areas, and vegetation below 2.5 m is mainly composed of both lawns and view-obstructing small trees and shrubs in those lands. Lawns are believed to increase perceived safety [12]; view-obstructing small trees and shrubs are, however, believed to have a negative effect on human perceived safety. The positive effect of non-view-obstructing lawns may be offset by the negative effect of view-obstructing shrubs and small trees. Therefore, the overall relationship between the perceived safety and the percentage of vegetation below the horizon is not significant.
The statistical results may provide a reference for future urban planning and greening projects. While, in general, increasing visibility of green vegetation could help to increase residents’ perceived safety and make cities more livable, the effects of increased vegetation vary for different land use types. The statistical analysis based on the Place Pulse data shows that in transportation and industrial lands, increasing presence of vegetation is not a very useful way for changing people’s opinions on the perceived safety. In dense urban areas, such as high-density residential land and commercial land, increasing the visibility of lawns and shrubs may also not be an effective way to increase perceived safety. In addition, this study also proved that combining the crowdsourced data and GSV images could be a good approach for urban studies.
While this study provides new insight into investigating the relationship between perceived safety and the visibility of green vegetation, it still has some limitations. Firstly, the Place Pulse 1.0 dataset was collected randomly in Greater Boston, and the sampling process was not conducted under strict sampling criteria. Most of the sample sites are located in residential land, and not all types of urban land use types were covered in this study. In addition, the participants’ personal information was not available for this study. All of these could possibly bias the results. Secondly, the local digital elevation model could affect the pitch angle, which could further affect the shift of the horizon in the GSV images. In this study, the study area is flat, so local terrain factors were not considered. In addition, the current method for vegetation extraction did not consider the differences among shrubs, lawns and grasslands. All vegetation below the 2.5-m horizon line was categorized into one class: vegetation below the horizon. This possibly explains why there exists no significant relationship between perceived safety and vegetation below the horizon for several land use types.
Finally, although the crowdsourced Place Pulse 1.0 dataset was collected from many participants, the dataset may still contain some errors and much uncertainty in indicating perceived safety, considering the fact that perceived safety is a kind of complex feeling affected by many factors. In future research, more elaborated methods need to be developed to deal with errors and uncertainty in the collected Place Pulse 1.0 dataset.

6. Conclusions

Statistical analysis results based on crowdsourced dataset Place Pulse 1.0 show that the visibility of vegetation and vegetation vertical distribution both affect human perceived safety in Greater Boston. The connection between the visibility of green vegetation and human perceived safety varies in different kinds of land use types. Although this study is still preliminary, the results have provided some interesting information, which may be valuable to urban planning decision making and human psychology study. In general, increasing the visibility of green vegetation could help to increase residents’ perceived safety in cities. Increasing the visibility of vegetation above 2.5 m, like planting trees, is more effective than vegetation below 2.5 m to increase the perceived safety. This is very important in dense urban areas, where space is very limited. For different land use types, choosing the right types of green vegetation may maximize the benefits provided by urban green vegetation. In residential land, urban public/institutional land, commercial land and open land, increasing the visibility of trees could help to increase perceived safety. However, the same measure may not be effective in transportation and industrial lands. Further studies should consider how to deal with the limitations contained in this study and explore the spatial patterns of perceived safety in relation to varying environments.

Acknowledgments

The authors thank the anonymous reviewers and Vicente Ordonez from the University of North Carolina at Chapel Hill for his kindness in providing the static images from the Place Pulse 1.0 dataset. The authors also thank the MIT media lab for sharing the Place Pulse dataset. Zhang’s research was supported in part by USA NSF Grant No. 1414108.

Author Contributions

Xiaojiang Li was responsible for designing and conducting the study. He wrote this manuscript. Chuanrong Zhang and Weidong Li helped to revise the manuscript.

Conflicts of Interest

The authors declare no conflict of interest.

References

  1. Fernow, B.E. The Care of Trees in Lawn, Street and Park; Henry Holt and Company: New York, NY, USA, 1910. [Google Scholar]
  2. Schroeder, H.W.; Cannon, W.N., Jr. The esthetic contribution of trees to residential streets in Ohio towns. J. Arboric. 1983, 9, 237–243. [Google Scholar]
  3. Wolf, K.L. Business district streetscapes, trees, and consumer response. J. For. 2005, 103, 396–400. [Google Scholar]
  4. Maas, J.; Spreeuwenberg, P.; van Winsum-Westra, M.; Verheij, R.A.; de Vries, S.; Groenewegen, P.P. Is green space in the living environment associated with people’s feelings of social safety? Environ. Plan. A 2009, 41, 1763–1777. [Google Scholar] [CrossRef]
  5. Jansson, M.; Fors, H.; Lindgren, T.; Wiström, B. Perceived personal safety in relation to urban woodland vegetation—A review. Urban For. Urban Green. 2013, 12, 127–133. [Google Scholar] [CrossRef]
  6. Chivite-Matthews, N.; Maggs, P. Crime, Policing and Justice: The Experience of Older People. Findings from the British Crime Survey, England and Wales; Home Office Research, Development and Statistics Directorate: London, UK, 2002. [Google Scholar]
  7. Green, G.; Gilbertson, J.M.; Grimsley, M.F.J. Fear of crime and health in residential tower blocks: A case study in Liverpool UK. Eur. J. Public Health 2002, 12, 10–15. [Google Scholar] [CrossRef] [PubMed]
  8. Li, F.; Fisher, J.; Brownson, R.C.; Bosworth, M. Multilevel modeling of built environment characteristics related to neighbourhood walking activity in older adults. J. Epidemiol. Community Health 2005, 59, 558–564. [Google Scholar] [CrossRef] [PubMed]
  9. Strafford, M.; Chandola, T.; Marmot, M. Association between fear of crime and mental health and physical functioning. Am. J. Public Health 2007, 97, 2076–2081. [Google Scholar] [CrossRef] [PubMed]
  10. Jackson, J.; Stafford, M. Public health and fear of crime: A prospective cohort study. Br. J. Criminol. 2009, 49, 832–847. [Google Scholar] [CrossRef]
  11. Jorgensen, A.; Hitchmough, J.; Calvert, T. Woodland spaces and edges: Their impact on perception of safety and preference. Landsc. Urban Plan. 2002, 60, 135–150. [Google Scholar] [CrossRef]
  12. Kuo, F.E.; Sullivan, W.C. Environment and crime in the inner city: Does vegetation reduce crime? Environ. Behav. 2001, 33, 343–367. [Google Scholar] [CrossRef]
  13. Troy, A.; Grove, J.M.; O’Neil-Dunne, J. The relationship between tree canopy and crime rates across an urban-rural gradient in the greater Baltimore region. Landsc. Urban Plan. 2012, 106, 262–270. [Google Scholar] [CrossRef]
  14. Day, K.; Stump, C.; Carreon, D. Confrontation and loss of control: Masculinity and men’s fear in public space. J. Environ. Psychol. 2003, 23, 311–322. [Google Scholar] [CrossRef]
  15. Van der Wurff, A.; van Staalduinen, L.; Stringer, P. Fear of crime in residential environments: Testing a social psychological model. J. Soc. Psychol. 1989, 129, 141–160. [Google Scholar] [CrossRef]
  16. Farrall, S.; Bannister, J.; Ditton, J.; Gilchrist, E. Social psychology and the fear of crime: Re-examining a speculative model. Br. J. Criminol. 2000, 40, 399–413. [Google Scholar] [CrossRef]
  17. Fisher, B.S.; Nasar, J.L. Fear of crime in relation to three exterior site features prospect, refuge, and escape. Environ. Behav. 1992, 24, 35–65. [Google Scholar] [CrossRef]
  18. Nasar, J.; Fisher, B.; Grannis, M. Proximate physical cues to fear of crime. Landsc. Urban Plan. 1993, 26, 161–178. [Google Scholar] [CrossRef]
  19. Donovan, G.H.; Prestemon, J.P. The effect of trees on crime in Portland, OR. Environ. Behav. 2012, 44, 3–30. [Google Scholar] [CrossRef]
  20. Coutts, C. Greenway accessibility and physical-activity behavior. Environ. Plan. B: Plan. Des. 2008, 35, 552–563. [Google Scholar] [CrossRef]
  21. Lee, A.C.K.; Maheswaran, R. The health benefits of urban green spaces: A review of the evidence. J. Public Health 2011, 33, 212–222. [Google Scholar] [CrossRef] [PubMed]
  22. Kuo, F.E. The role of arboriculture in a healthy social ecology. J. Arboric. 2003, 29, 148–155. [Google Scholar]
  23. Jacobs, J. The Death and Life of Great American Cities; Random House: New York, NY, USA, 1961. [Google Scholar]
  24. Shaffer, G.S.; Anderson, L.M. Perceptions of the security and attractiveness of urban parking lots. J. Environ. Psychol. 1985, 5, 311–323. [Google Scholar] [CrossRef]
  25. Herzog, T.; Kutzli, H. Preference and perceived danger in field/forest settings. Environ. Behav. 2002, 34, 858–874. [Google Scholar] [CrossRef]
  26. Herzog, T.R.; Bryce, A.G. Mystery and preference in within-forest settings. Environ. Behav. 2007, 39, 779–796. [Google Scholar] [CrossRef]
  27. Kuo, F.E.; Sullivan, W.C. Aggression and violence in the inner city effects of environment via mental fatigue. Environ. Behav. 2001, 33, 543–571. [Google Scholar] [CrossRef]
  28. Roovers, P.; Dumont, B.; Gulinck, H.; Hermy, M. Recreationists’ perceived obstruction of field and shrub layer vegetation. Urban For. Urban Green. 2006, 4, 47–53. [Google Scholar] [CrossRef]
  29. Schroeder, H.W.; Anderson, L.M. Perception of personal safety in urban recreation sites. J. Leis. Res. 1984, 16, 178–194. [Google Scholar]
  30. Anselin, L.; Cohen, J.; Cook, D.; Gorr, W.; Tita, G. Spatial analyses of crime. Crim. Justice 2000, 4, 213–262. [Google Scholar]
  31. Wilcox, P.; Quisenberry, N.; Cabrera, D.T.; Jones, S. Busy places and broken windows? Toward defining the role of physical structure and process in community crime models. Sociol. Q. 2004, 45, 185–207. [Google Scholar]
  32. Salesses, P.; Schechtner, K.; Hidalgo, C.A. The collaborative image of the city: Mapping the inequality of urban perception. PloS one 2013, 8. [Google Scholar] [CrossRef] [PubMed] [Green Version]
  33. Park , J.; Newman, M.E.J. A network-based ranking system for US college football. J. Stat. Mech.: Theory Exp. 2005, 10. [Google Scholar] [CrossRef]
  34. MassGIS Data—Land Use (2005). Available online: http://www.mass.gov/anf/research-and-tech/it-serv-and-support/application-serv/office-of-geographic-information-massgis/datalayers/lus2005.html (accessed on 23 December 2014).
  35. Li, X.; Meng, Q.; Gu, X.; Jancso, T.; Yu, T.; Wang, K.; Mavromatis, S. A hybrid method combining pixel-based and object-oriented methods and its application in Hungary using Chinese HJ-1 satellite images. Int. J. Remote Sens. 2013, 34, 4655–4668. [Google Scholar] [CrossRef]
  36. Woebbecke, D.M.; Meyer, G.E.; von Bargen, K.; Mortensen, D.A. Shape features for identifying young weeds using image analysis. Trans. ASAE 1995, 38, 271–281. [Google Scholar] [CrossRef]
  37. Ribeiro, A.; Fernández-Quintanilla, C.; Barroso, J.; García-Alegre, M.C. Development of an image analysis system for estimation of weed. In Proceedings of the 5th European Conference on Precision Agriculture (5ECPA), Uppsala, Sweden; 2005; pp. 169–174. [Google Scholar]
  38. Otsu, N. A threshold selection method from gray-level histograms. Automatica 1975, 11, 23–27. [Google Scholar]
  39. Taylor, R.B.; Koons, B.A.; Kurtz, E.M.; Greene, J.R.; Perkins, D.D. Street blocks with more nonresidential land use have more physical deterioration: Evidence from Baltimore and Philadelphia. Urban Aff. Rev. 1995, 31, 120–136. [Google Scholar] [CrossRef]
  40. Sampson, R.J.; Raudenbush, S.W. Systematic social observation of public spaces: A new look at disorder in urban neighborhoods. Am. J. Sociol. 1999, 105, 603–65l. [Google Scholar] [CrossRef]
  41. Kelling , G.L.; Wilson, J.Q. Broken windows. Atl. Mon. 1982, 249, 29–38. [Google Scholar]

