Article

Prototype of a Web-based Participative Decision Support Platform in Natural Hazards and Risk Management

1
Institute of Earth Sciences (ISTE), University of Lausanne, Géopolis, 1015 Lausanne, Switzerland
2
Faculty of Geo-Information Science and Earth Observation (ITC), University of Twente, 7500 AE Enschede, The Netherlands
*
Author to whom correspondence should be addressed.
ISPRS Int. J. Geo-Inf. 2015, 4(3), 1201-1224; https://doi.org/10.3390/ijgi4031201
Submission received: 23 December 2014 / Revised: 25 May 2015 / Accepted: 1 June 2015 / Published: 14 July 2015

Abstract

:
This paper presents the current state and development of a prototype web-GIS (Geographic Information System) decision support platform intended for application in natural hazards and risk management, mainly for floods and landslides. This web platform uses open-source geospatial software and technologies, particularly the Boundless (formerly OpenGeo) framework and its client side software development kit (SDK). The main purpose of the platform is to assist the experts and stakeholders in the decision-making process for evaluation and selection of different risk management strategies through an interactive participation approach, integrating web-GIS interface with decision support tool based on a compromise programming approach. The access rights and functionality of the platform are varied depending on the roles and responsibilities of stakeholders in managing the risk. The application of the prototype platform is demonstrated based on an example case study site: Malborghetto Valbruna municipality of North-Eastern Italy where flash floods and landslides are frequent with major events having occurred in 2003. The preliminary feedback collected from the stakeholders in the region is discussed to understand the perspectives of stakeholders on the proposed prototype platform.

1. Introduction

During the past decades, the losses caused by the natural disasters have risen with severe impact, particularly on the poor. The changing climate, demographic, socio-economic settings, environmental degradation and unstructured urbanization, and so on were the root causes of losses [1]. According to the global assessment report on disaster risk reduction [2], the direct economic losses caused by natural disasters were over $100 billion during three consecutive years, even without mentioning the uninsured losses. As per insurance research of Swiss Re Group [3], $37 billion of insured losses were caused by natural catastrophes in 2013. Though there has been a growing understanding and recognition of the importance of natural disaster risk with increased emergency preparedness and response activities, the disaster risk management and reduction continues to pose a global challenge in making the world a safer and sustainable place. The disaster risk management framework can be divided into two phases: the pre-disaster phase and the post-disaster phase. The first phase includes risk assessment, risk mitigation and preparedness while the latter is composed of emergency response, rehabilitation and reconstruction [4]. Disaster Risk Reduction (DRR) is defined as “the concept and practice of reducing disaster risks through systematic efforts to analyze and manage the causal factors of disasters, including through reduced exposure to hazards, lessened vulnerability of people and property, wise management of land and the environment, and improved preparedness for adverse events” [5] (p. 10). In this research, with the aim of promoting the culture of risk prevention, the primary focus is placed on prevention and mitigation in the first phase of the risk management cycle rather than emergency preparedness and management when the event has occurred. According to UNISDR’s terminology, prevention “expresses the concept and intention to completely avoid potential adverse impacts through action taken in advance” [5] (p. 22). Some examples of prevention include dams to eliminate flood risks and land-use planning regulations to restrict any settlement in high risk areas. This prevention task transforms to mitigation when complete avoidance of losses is not possible. Hence, the terms “prevention” and “mitigation” are sometimes used interchangeably [5]. Investment in prevention and mitigation before the occurrence of an emergency situation can greatly reduce the cost of recovery afterwards. It can contribute to long lasting improvement in safety and is essential to integrated risk management since disaster response alone is not sufficient and only produces temporary results at a very high cost.
Disasters are spatial in nature and occur in a certain geographic location. With the help of advanced web services, standards and geospatial technologies such as remote sensing and photogrammetry, Geographic Information Systems (GIS), Global Positioning Systems (GPS), Spatial Data Infrastructure (SDI) and Open Geospatial Consortium (OGC) web services, nowadays, it is possible to deliver, access, analyze and share rich spatial information over the web. This is particularly relevant to the emergency response and disaster management activities since it is important to rapidly share, integrate and apply geospatial information. Open source gained popularity with the advancement of the Internet and some examples of open-source tools in risk assessment and management include PIER (Profiler for Insurance Exposure and Risk, a GIS Based Comprehensive Risk Assessment Tool for earthquake, cyclone and flood hazards in India), InaSAFE (a plugin aims to provide the natural hazard impact scenarios based on hazard and exposure data for better planning, preparedness and response activities) in Quantum GIS, OpenQuake (an open-source software of Global Earthquake Model for seismic risk assessment) engine and Sahana (an open-source web-based collaboration tool to address the coordination problems during a disaster such as finding missing people, managing aids and volunteers, tracking camps between victims, government groups and NGOs). There are also portals and platforms based on Geonode (an open source platform which facilitates the creation, sharing, and collaborative use of geospatial data) to facilitate open access data and information sharing. During the last few decades, there has been increased research into the application of collaborative and participatory approaches to planning and decision making through the application of geo-information technologies [6]. The contexts and applications of these approaches vary in the literature from land planning to natural resources management [7,8,9,10,11,12] as well as in the field of natural hazards and management [13,14,15,16].
This paper reports on the development of a prototype web-based participative decision support platform to aid in the selection of different risk reduction strategies, in particular for flood and landslide management, using open-source software and decision technologies. The participatory approach is applied to improve the level of coordination and collaboration between different risk management institutions through integration of stakeholders’ knowledge in local territory. Decision support platforms, managed via a web-GIS interface, have the potential to provide risk managers and decision makers with a means to make better planning and informed decisions referenced to particular geographic locations. On account of the flexible technologies inherent in web and web-GIS, risk managers and decision makers may become active participants in the analysis of risk information and the decision making process of managing the risk. This prototype platform is designed not only as a common online platform for the centralized sharing of data and information but also as an integrated platform of risk management where the risk managers can analyze risk information and identify and evaluate possible preliminary alternative options for risk reduction.
The conceptual framework of the platform is explained in Section 2 with its open-source background architecture and development in Section 3. In Section 4, the prototype is demonstrated with an example case study area, Malborghetto Valbruna commune of Italy, which is one of the study sites of the European CHANGES project, along with the discussion of preliminary feedback collected from stakeholders of the study area in Section 5 to highlight the opinions and suggestions of local stakeholders.

2. Conceptual Framework of the Platform

Disaster risk reduction hinges on the involvement of concerned stakeholders from different organizations who are dealing with risk. Multi-stakeholder engagement is a catalyst for proactive commitment in disaster issues [17] and therefore, from the beginning of the process, it is important to clearly define and formulate the steps in which the stakeholders will be involved and how they can be incorporated into the process [18]. In this research, a two-phase workflow is designed (Figure 1) with involvement of various experts and decision makers at each phase of the process. The web-GIS interface with decision support tool improves the accessibility of the platform and centralizes the information at the same time for formulation and selection of different risk management alternatives.
Figure 1. A two-stage workflow of the participative platform.
Ijgi 04 01201 g001
Different risk scenarios are mainly served as input to the platform for the formulation (Step 1 of Section 2.1), evaluation and comparison of different risk management strategies (Step 2 of Section 2.2). A risk scenario can be defined as the expected losses (damages and casualties, for example) for given hazard events over a specified period of time and is composed of three elements: hazard, expressed in terms of frequency and severity; exposure of human activities to that hazard; and vulnerability of the exposed elements-at-risk [17]. Potential risks can be reduced based on these contributing factors to risk through the implementation of effective risk management strategies. It is also important to reduce not only the physical vulnerability but also the socio-economic vulnerability of exposed elements through land planning, education, capacity building, emergency preparedness and so on.
Within the platform, the user access rights, interfaces and functionalities of each phase vary according to the roles and responsibilities of stakeholders. In general, two main groups of stakeholders can be categorized (Table 1): low and high-level: experts and decision makers, respectively. The low-level group is mainly formed with experts such as geologists, engineers, geomorphologists and spatial planners while the high-level group is composed of decision makers such as civil protection, the mayor, and public representatives of the municipality including low-level experts. The participation of stakeholders and user groups within the platform can be different and adjusted by the administrative (moderator) users depending on the institutional settings of a certain study area. The moderator user has the administrative rights of the platform, and typically, the moderator can be one of the low-level experts who has the capacity to act and guide the whole process as a moderator. It is clear that the hierarchy of the decision-making process and respective responsibilities of stakeholders is far beyond our paper. Here, we consider that the final decision is limited to the local decision makers who have the legal responsibilities for safety of the citizens of the considered study area. For example, the mayor is the main decision maker and responsible for any decisions made by the municipality. However, this could be different according to the country context where the platform is applied.
Table 1. The potential end-users (stakeholders) and their different access rights to the main modules of the online participative platform.
Identification of Risk Management StrategiesSelection of Risk Management StrategiesUser Management
Low-level (Experts)Admin (moderator)XXX
GeologistsXX
Spatial plannersXX
…..XX
High-level (Decision Makers)MayorX
Civil ProtectionX
Public (representatives)X
…..X

2.1. Formulation of Alternatives

An “alternative” scenario is defined as a combination of structural and/or non-structural risk reduction measures. Structural measures are defined as “any physical construction to reduce or avoid possible impacts of hazards, or application of engineering techniques to achieve hazard-resistance and resilience in structures or systems” while non-structural measures as “any measure not involving physical construction that uses knowledge, practice or agreement to reduce risks and impacts, in particular through policies and laws, public awareness raising, training and education” [5] (p. 28). Examples of structural mitigation measures include dams, flood levies, slope stabilizations, hazard-resistant constructions, maintenance and planning of hydraulic works and so on. Non-structural measures concern non-physical actions such as insurance, relocation, land planning, building codes, early-warning systems and risk awareness training and education, etc.
Based on the available risk information, preliminary alternative scenarios are proposed by the experts (in this case, low-level users) such as a dike, relocation of the exposed settlement or restriction of building new houses in the area. Allowing expert users to interactively propose risk management measures not only promotes the coordination activities but also facilitates the centralized sharing of information between different organizations. While it is a preliminary proposition of potential alternatives, it is nevertheless an important phase to achieve the combined risk management strategies for the integrated risk management framework. For this initial identification phase of possible alternatives, only low-level experts are mainly involved because of their technical capacities and responsibilities. However, public and decision makers can provide their feedback on the proposed (preliminary) alternatives during the next selection phase, and therefore, this process is considered as a two-way, iterative process with all concerned stakeholders.
The conceptual scheme of the process is demonstrated in Figure 2. Depending on whether the proposed alternative scenario consists of measures to be localized (mapped) on the map, the expert can either sketch these measures using the interactive web-GIS based sketching tool or upload the vector layer (shape file) using the upload option. The sketching tool provides the necessary functionality to draw point, line and polygon geometry vector features as in desktop-based GIS applications and allows the user to save the sketched layer with necessary information such as the type and name of each sketched measure within the proposed alternative scenario. In addition, the visualization of these alternative scenarios can also be shared among all users within the platform to support the on-line participatory and decision making process.
Figure 2. Process flow of the definition of a new alternative scenario.
Ijgi 04 01201 g002
The potential reduced risk for each alternative scenario can also be recalculated by updating the existing maps and data used in risk calculation (i.e., hazards, assets maps with occupancy of people and vulnerability data). Regarding this aspect of recalculating risk for alternative scenarios, there are two possible options: the experts can either carry out a preliminary risk calculation, for example, through the manual editing of maps in the web-GIS mapping interface applying their local knowledge and expertise, or obtain updated hazard and assets maps from the relevant organizations for a more detailed risk analysis of each alternative scenario. Within the prototype, risk analysis module is developed to support the decision making process. However, risk component will not be further explained since this is not the main focus of this paper. Instead, we plan to publish it as a forthcoming paper.

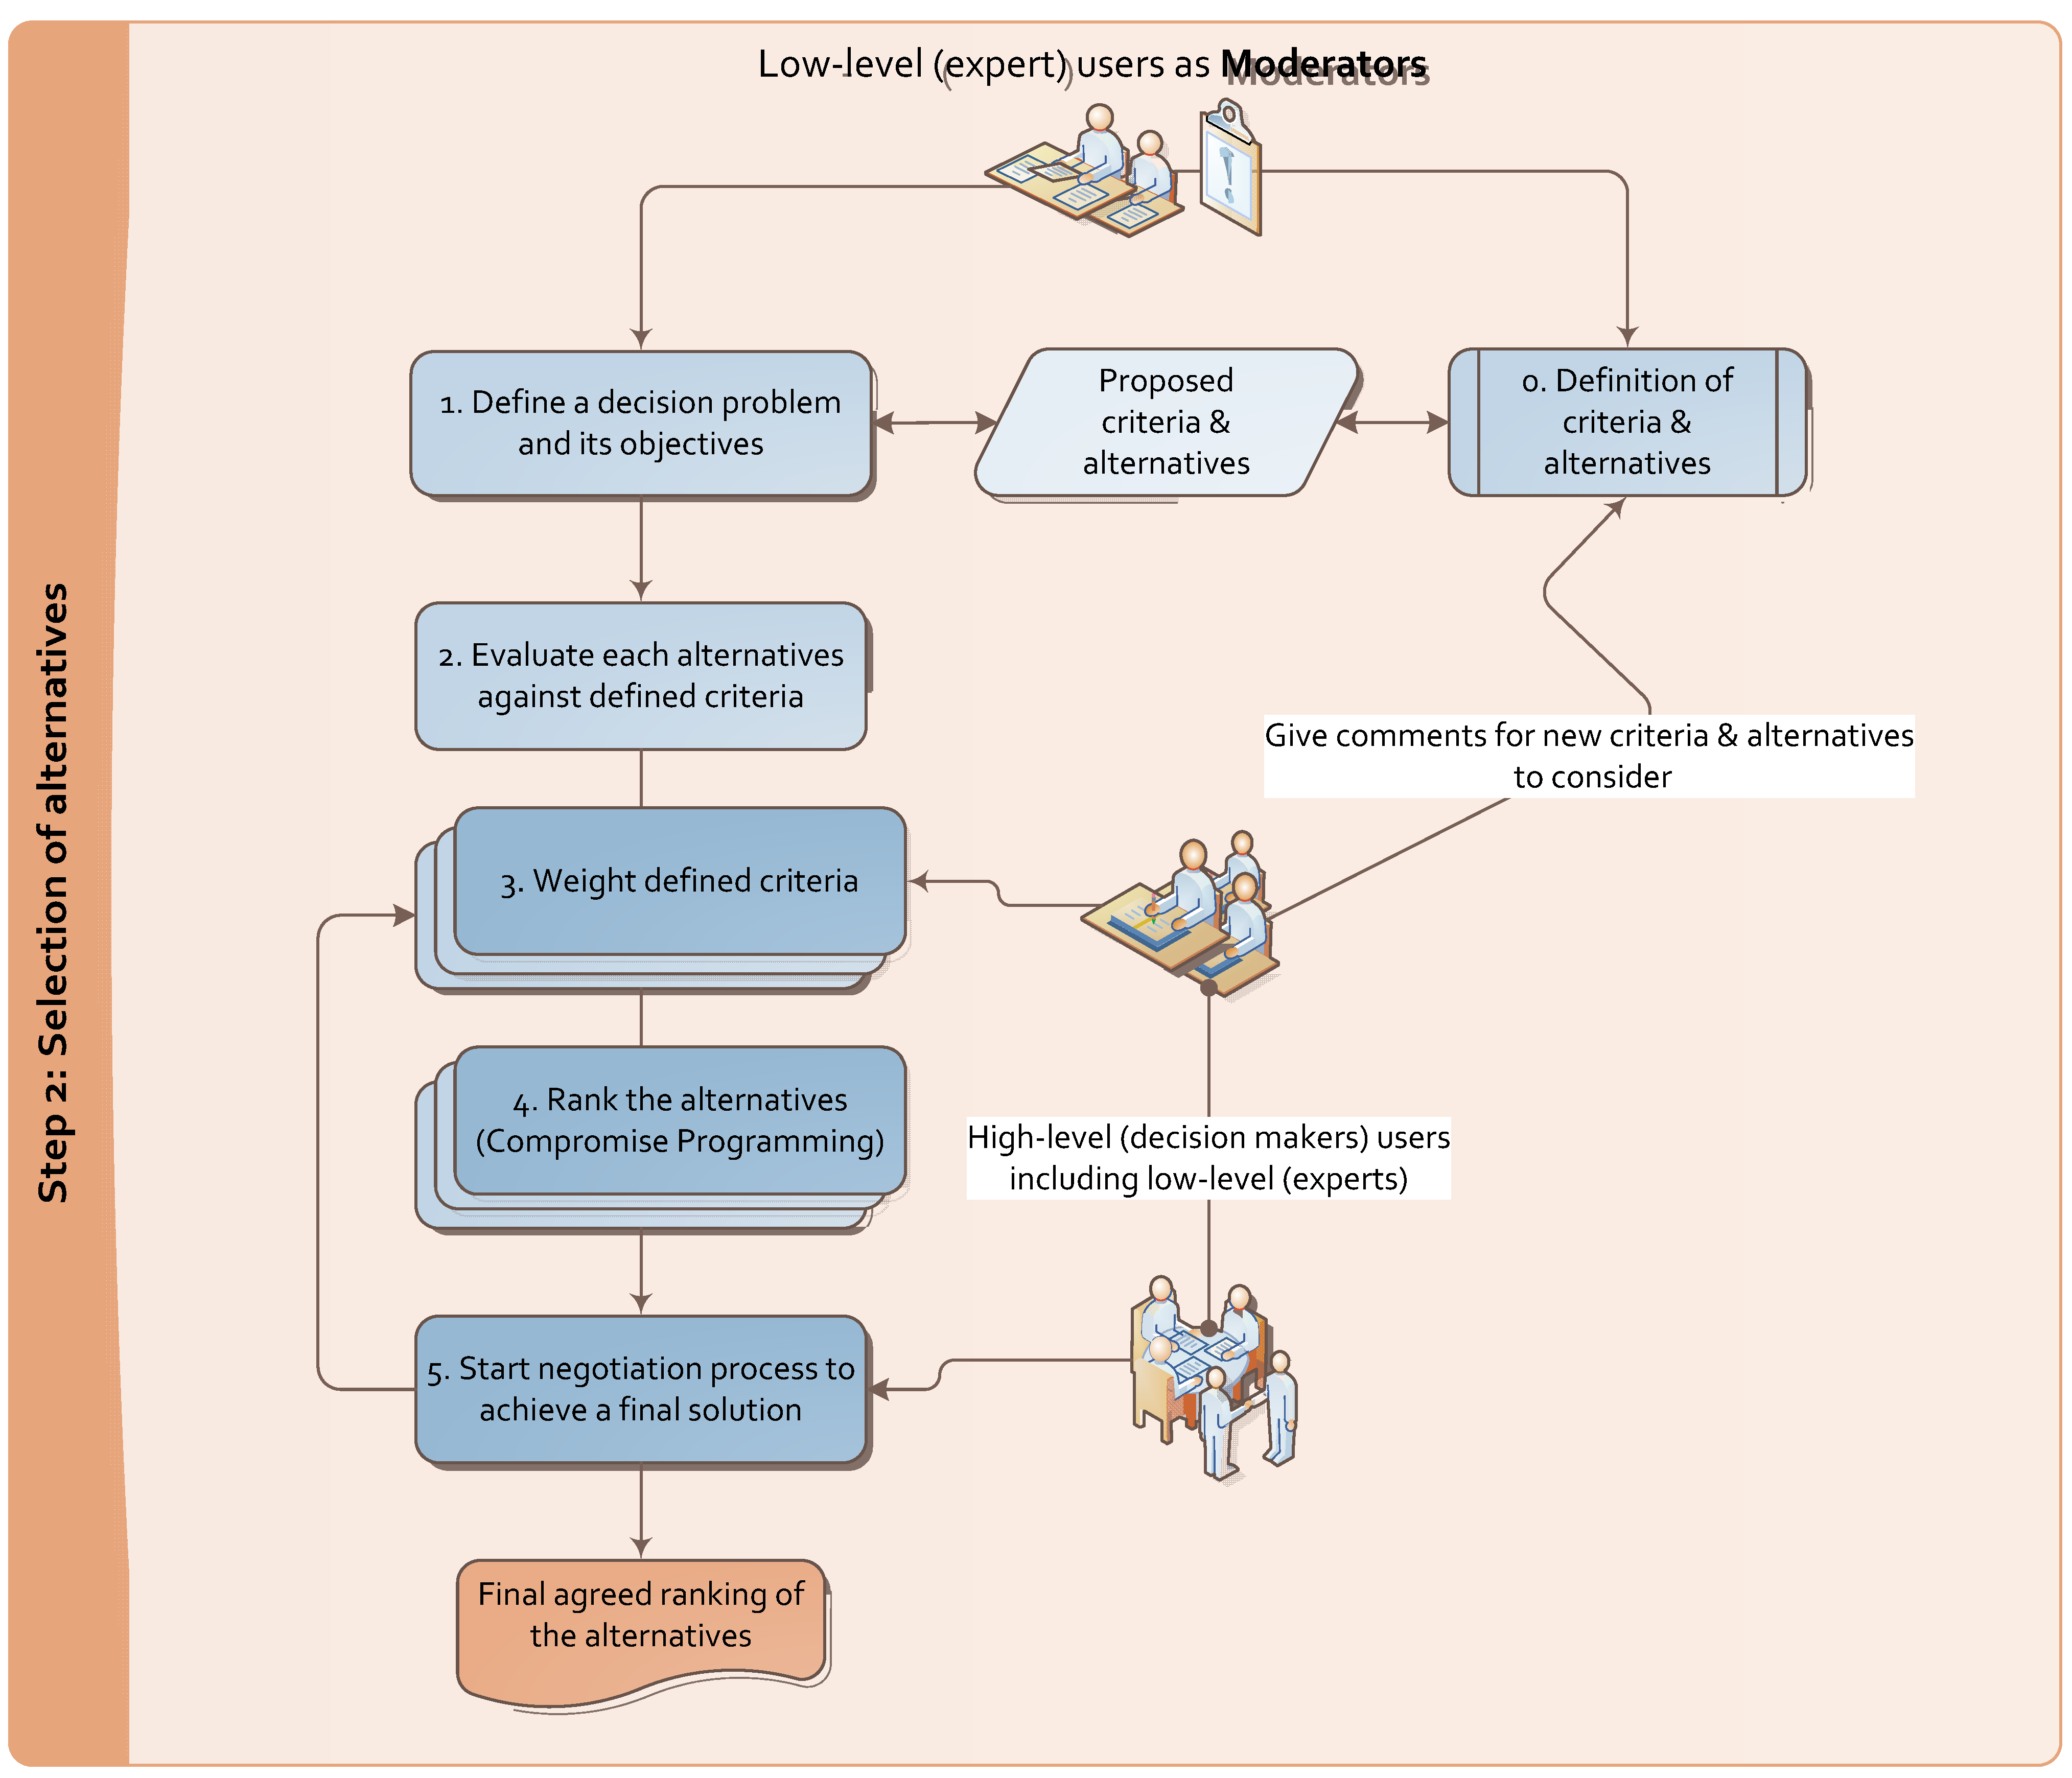
2.2. Selection of Alternatives

The alternatives proposed by the experts are applied in this second phase for the “selection and ranking of alternatives” with the participation of all involved stakeholders since the need to involve experts, decision makers and the society is a key to risk management for the implementation of effective and efficient risk management strategies [17]. In this study, selection of alternatives is based on one of the Multi-criteria Evaluation (MCE) methods as these methods consider different alternative options of a decision problem with the aim of addressing trade-offs between alternatives with inclusion of more additional important criteria than the traditional cost-benefit analysis [19]. It also allows the representation of different (conflicting) views of stakeholders and facilitates the decision-making process through the comparison of alternatives [20]. There exist a number of MCE methods in the literature such as the Analytic Hierarchy Process [21,22], goal programming [23,24], ELECTRE [25] and compromise programming [26,27,28]. For the prototype platform, Compromise Programming (CP) method is used to calculate the ranking of alternative options due to its simplicity, transparency and easy adaptation to different settings of problems, and it has been recommended to be applied in disaster risk management [29] problems. This method identifies alternatives which are closest to the ideal solution as determined by distance values (measures of closeness). This ideal solution is defined as the vector of best values of evaluated criteria derived from a payoff matrix A of Equation (1) (an evaluation matrix of m Alternatives against n Criteria), depending on the types of the criteria (cost or benefit).
A = [ a i j ] = [ a 11 a 12 ... a 1 n a 21 a 22 ... a 2 n ... ... ... ... a m 1 a m 2 ... a m n ] subject to  a ij = Evaluation value of Alternative i for Criteria j m =  number of alternatives n =  number of criteria
The distance measure of an alternative Lp (x) is “a function of the criteria values themselves, the relative importance of the various criteria to the decision makers (αi), and the importance of the maximal deviation from the ideal solution (p)” as illustrated in Equation (2) [29] (p. 274).
L p ( x p * ) = M i n { L p ( x ) = [ i = 1 r α i p ( Z i * Z i ( x ) Z i * Z i * * ) p ] 1 p } subject to  x X 1 p Z i ( x ) = A i ( x ) =  the evaluation value of an alternative ( x )  for the considered criterion (i) Z i * = the maximum function value of the considered criterion Z i * * = the minimum function value of the considered criterion α i = the weight (relative importance) of the considered criterion =  the importance of the maximal deviation from the ideal solution =  the number of criteria
Thereafter, the compromise solution is calculated based on the defined values with given αi and p, to determine the distance value of each alternative from the ideal solution. The “best compromise solution” is determined by selecting the alternative with minimum distance value with a given parameter p (value of 2 is suggested [29]) and a fixed set of decision maker’s preferences. The “most robust compromise solution” can also be achieved through a systematic sensitivity analysis or the iteration of Equation (2) with various sets of decision maker’s preferences αi with one value of distance parameter p (again with value 2), where there is an alternative which scores a high rank for most of the various sets of defined preferences [29].
Figure 3. Process flow of the selection of proposed alternative scenarios.
Ijgi 04 01201 g003
The conceptual scheme of the process is demonstrated in Figure 3. The low-level expert user acts as a moderator to moderate the decision making process in selection of alternatives. Firstly, the criteria to be evaluated for each alternative are defined by the experts to consider in the decision problem. These criteria can also be adjusted and defined with the feedback given by high-level decision makers. Each criterion can be either qualitative or quantitative depending on the nature and data availability of that criterion; for example, local agreement of a certain alternative scenario can be either in terms of qualitative scale or quantitative voting count. After this step of criteria definition, the moderator defines a decision problem by including alternatives and criteria to be considered with the objective of selecting the most appropriate alternative to mitigate the risk, for example. The moderator then carries out the evaluation process of each alternative against all criteria to obtain the impact (evaluation) matrix (Equation (1)). Upon the completion of the evaluation process, the moderator assigns the participants to give their weights (preferences) of the criteria. These weight sets are then used to produce ranking of alternatives for each participant based on CP method (Equation (2)). At the end of weighting process, a negotiation process takes place in order to achieve a final agreeable solution by all involved decision makers. The aggregation of all weight sets could be done by implementing aggregation methods [30,31,32] in the platform to combine individual weight sets of participants into a group weight set. At present, however, it is unlikely that we can possibly give a weighting (balance) to different groups of stakeholders due to their different responsibilities in decision making. During the selection process, the decision makers can also send signals to the moderator by commenting in the platform to adjust alternatives and criteria, and the whole process is iterated with feedback of decision makers.

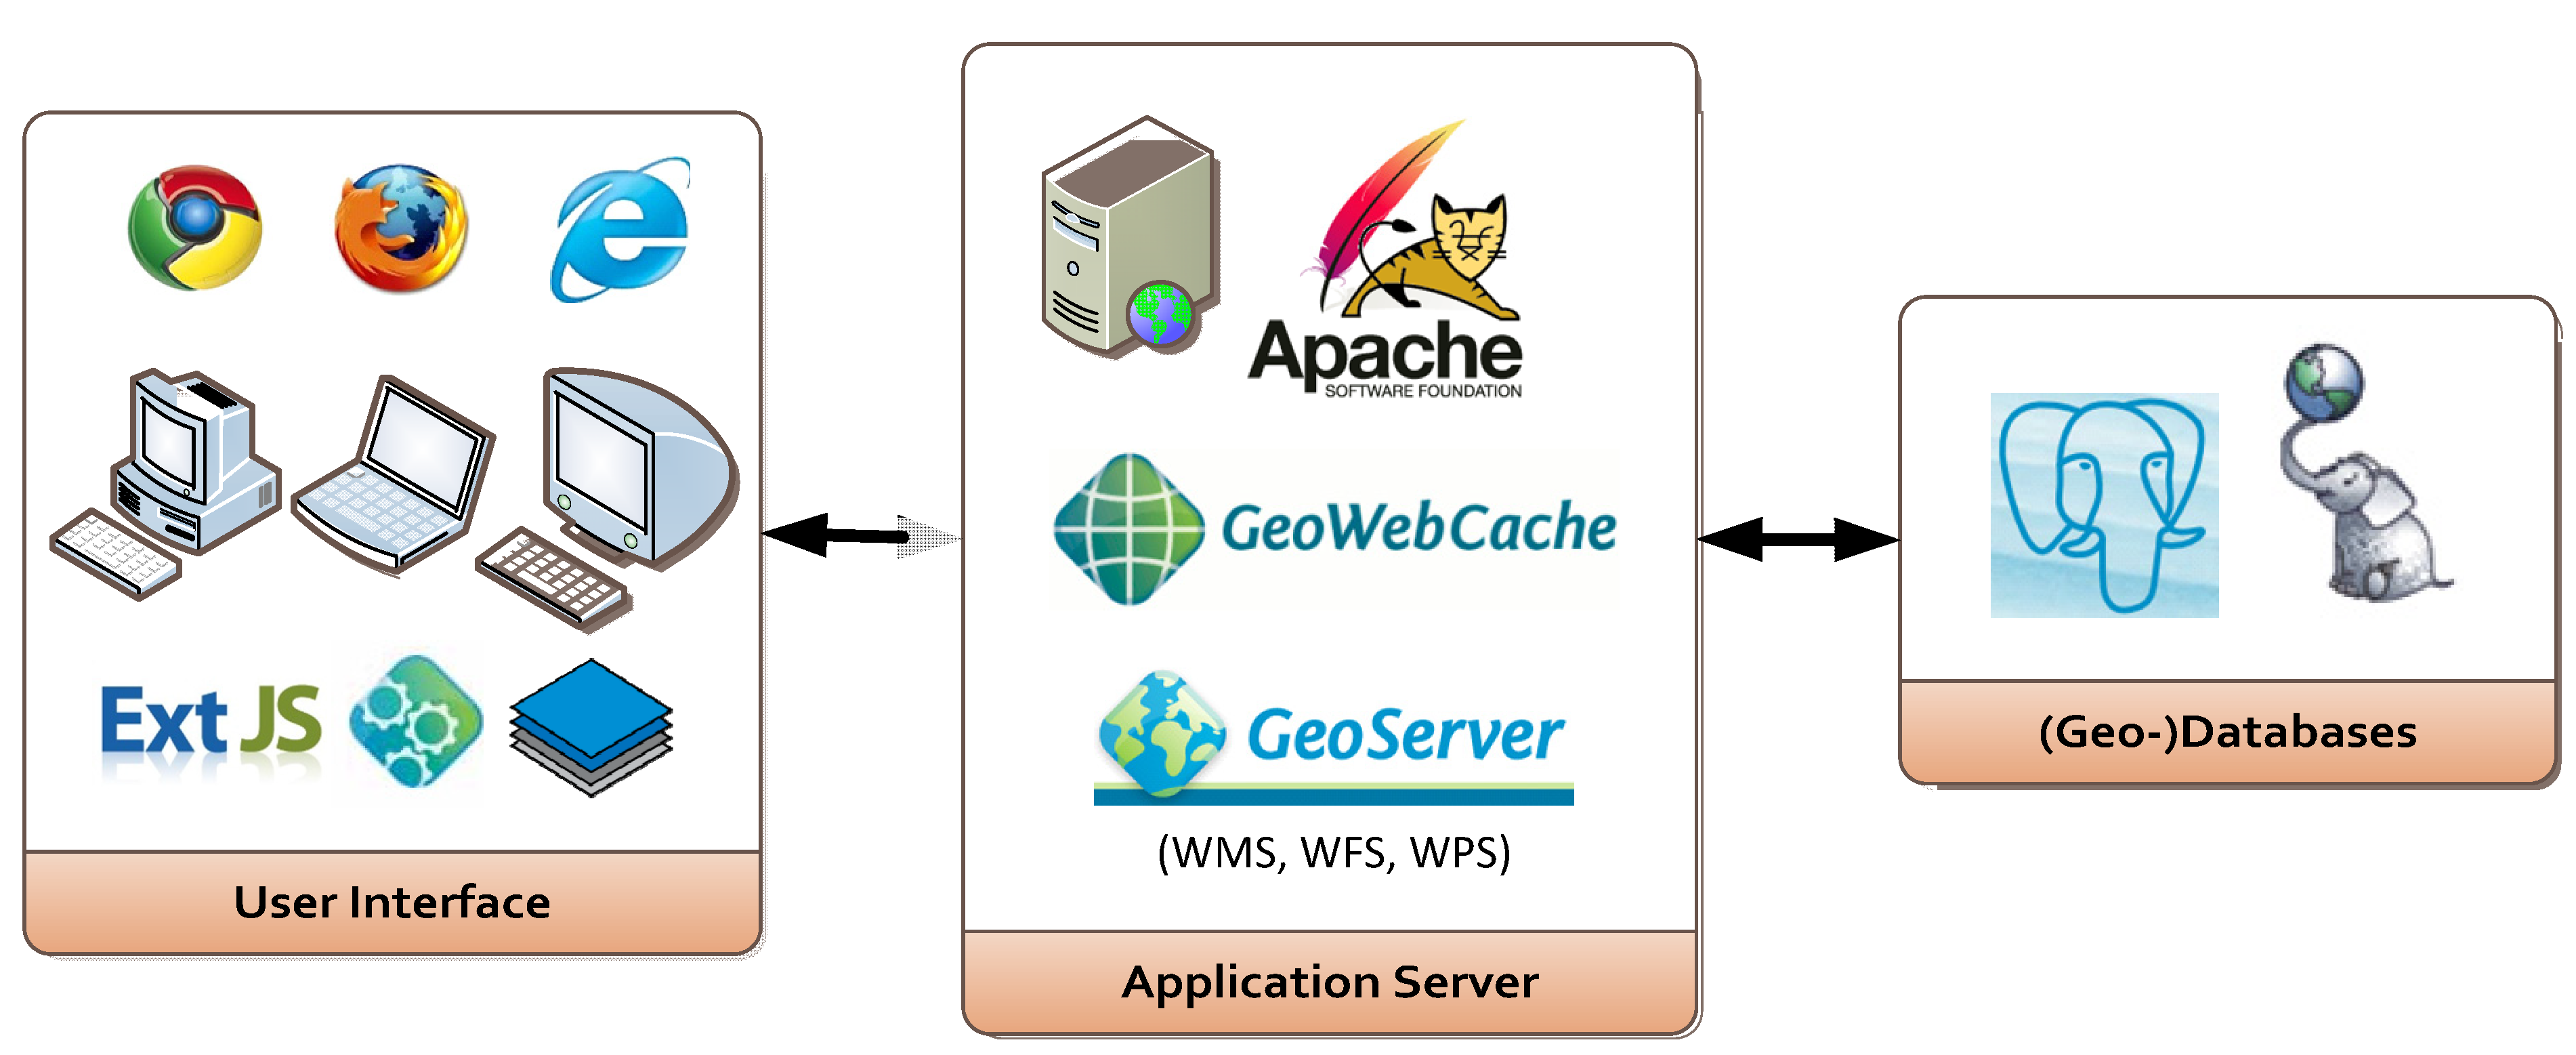
3. Architecture of the Platform

In this research, web-GIS interface is integrated within the decision support platform to visualize maps, exchange (spatial) risk information and provide certain geo-processing capabilities on the web, which can be easily accessible by different organizations located in the case study site. The background architecture of the prototype is based on the client-server architecture model in which clients send requests to a server and receive appropriate information in response. The client-server model was chosen in order to facilitate the maintenance of the application and allow its functionality to be upgraded or modified at any time without involving the end user’s computer system [13]. In a thin-client application, the clients only have user interfaces to communicate with the server and display the results. Most of the processing is thus done on the server, and hence, the server computers typically have more power than the client to manage the centralized resources [33]. For the web-based applications, complex software is not needed on the client side and only a browser is sufficient for most cases [34]. Besides, the system performance is not dependent on the client, and therefore, if there is a need to revise or update the system functionality, it can be done on the server-side easily without affecting the clients. However, the speed of the application could be limited as the processing take places on the server and the internet connection of the client’s network. Recently, Sun [35] compared server-client and cloud-based web-GIS platforms for enabling participatory decision makings. Cloud computing approaches can be adopted if maintenance costs and user accessibility turned out to be a bottleneck issue.
The development of the prototype is based on Boundless (formerly OpenGeo suite) [36] and its client side SDK application. Boundless framework is a complete geospatial software stack with modular components based on the open source geospatial software for data management, publishing maps and building interactive web map (geospatial) applications across web browsers and mobile devices [36]. It allows the users to access and update geospatial data through such OGC (Open Geospatial Consortium) standards like Web Map Services (WMS), Web Feature Services (WFS), Web Processing Services (WPS), Web Coverage Services (WCS), etc. These OGC services support the interoperable solutions which “geo-enable” the Web and provide an open source framework for web based access, integration and analysis of online geospatial data sources.
The adopted boundless architecture (Figure 4) is composed of open source components: PostgreSQL database with PostGIS spatial extension for database (storage) layer, GeoServer and GeoWebCache for application servers with tile cache in the middle and GeoExt, ExtJS and OpenLayers JavaScript libraries for user interface layer. The database and application layers interact through SQL (Standard Query Language) with OGC spatial extensions while the application and user interface layers interact through encoded documents such as XML (Extensible Markup Language), JSON (JavaScript Object Notation) and images over an HTTP (Hypertext Transfer Protocol) transfer.
Figure 4. Open-source software stack of the prototype.
Ijgi 04 01201 g004
The Boundless SDK backed by OpenGeo suite is used to build and deploy the prototype platform since it provides tools for creating JavaScript-based web applications with customizable components and data utility classes, which are based on GXP (a Javascript SDK for developing high level GeoExt based Applications), GeoExt and OpenLayers. This GXP component extends map related functionality to the equivalent classes in Ext and is configured to work with GeoExt and provides the powerful ability to create self-customized plugins and widgets for the application development. The different modules of the platform are developed as separate plugins (dependencies) and declared as add-ons components within the main JavaScript application, which facilities the plugging and unplugging of designed components within the platform as needed. The built-in plugins and widgets make the development phase faster and make it easier to integrate existing map tools and functionality within the platform. The prototype application is also configured to work with PEAR (PHP Extension and Application Repository, a framework and distribution system for reusable PHP components) Mail library in order to send emails from the platform by the administrative users to the participants for the weighting component of the platform. In addition, the deployed web application is combined with Bootstrap (an open source framework for creating websites and web applications containing HTML and CSS design templates) framework for customized HTML (HyperText Markup Language) and CSS (Cascading Style Sheets) templates.

3.1. GeoServer Configuration (Roles, Users and Services)
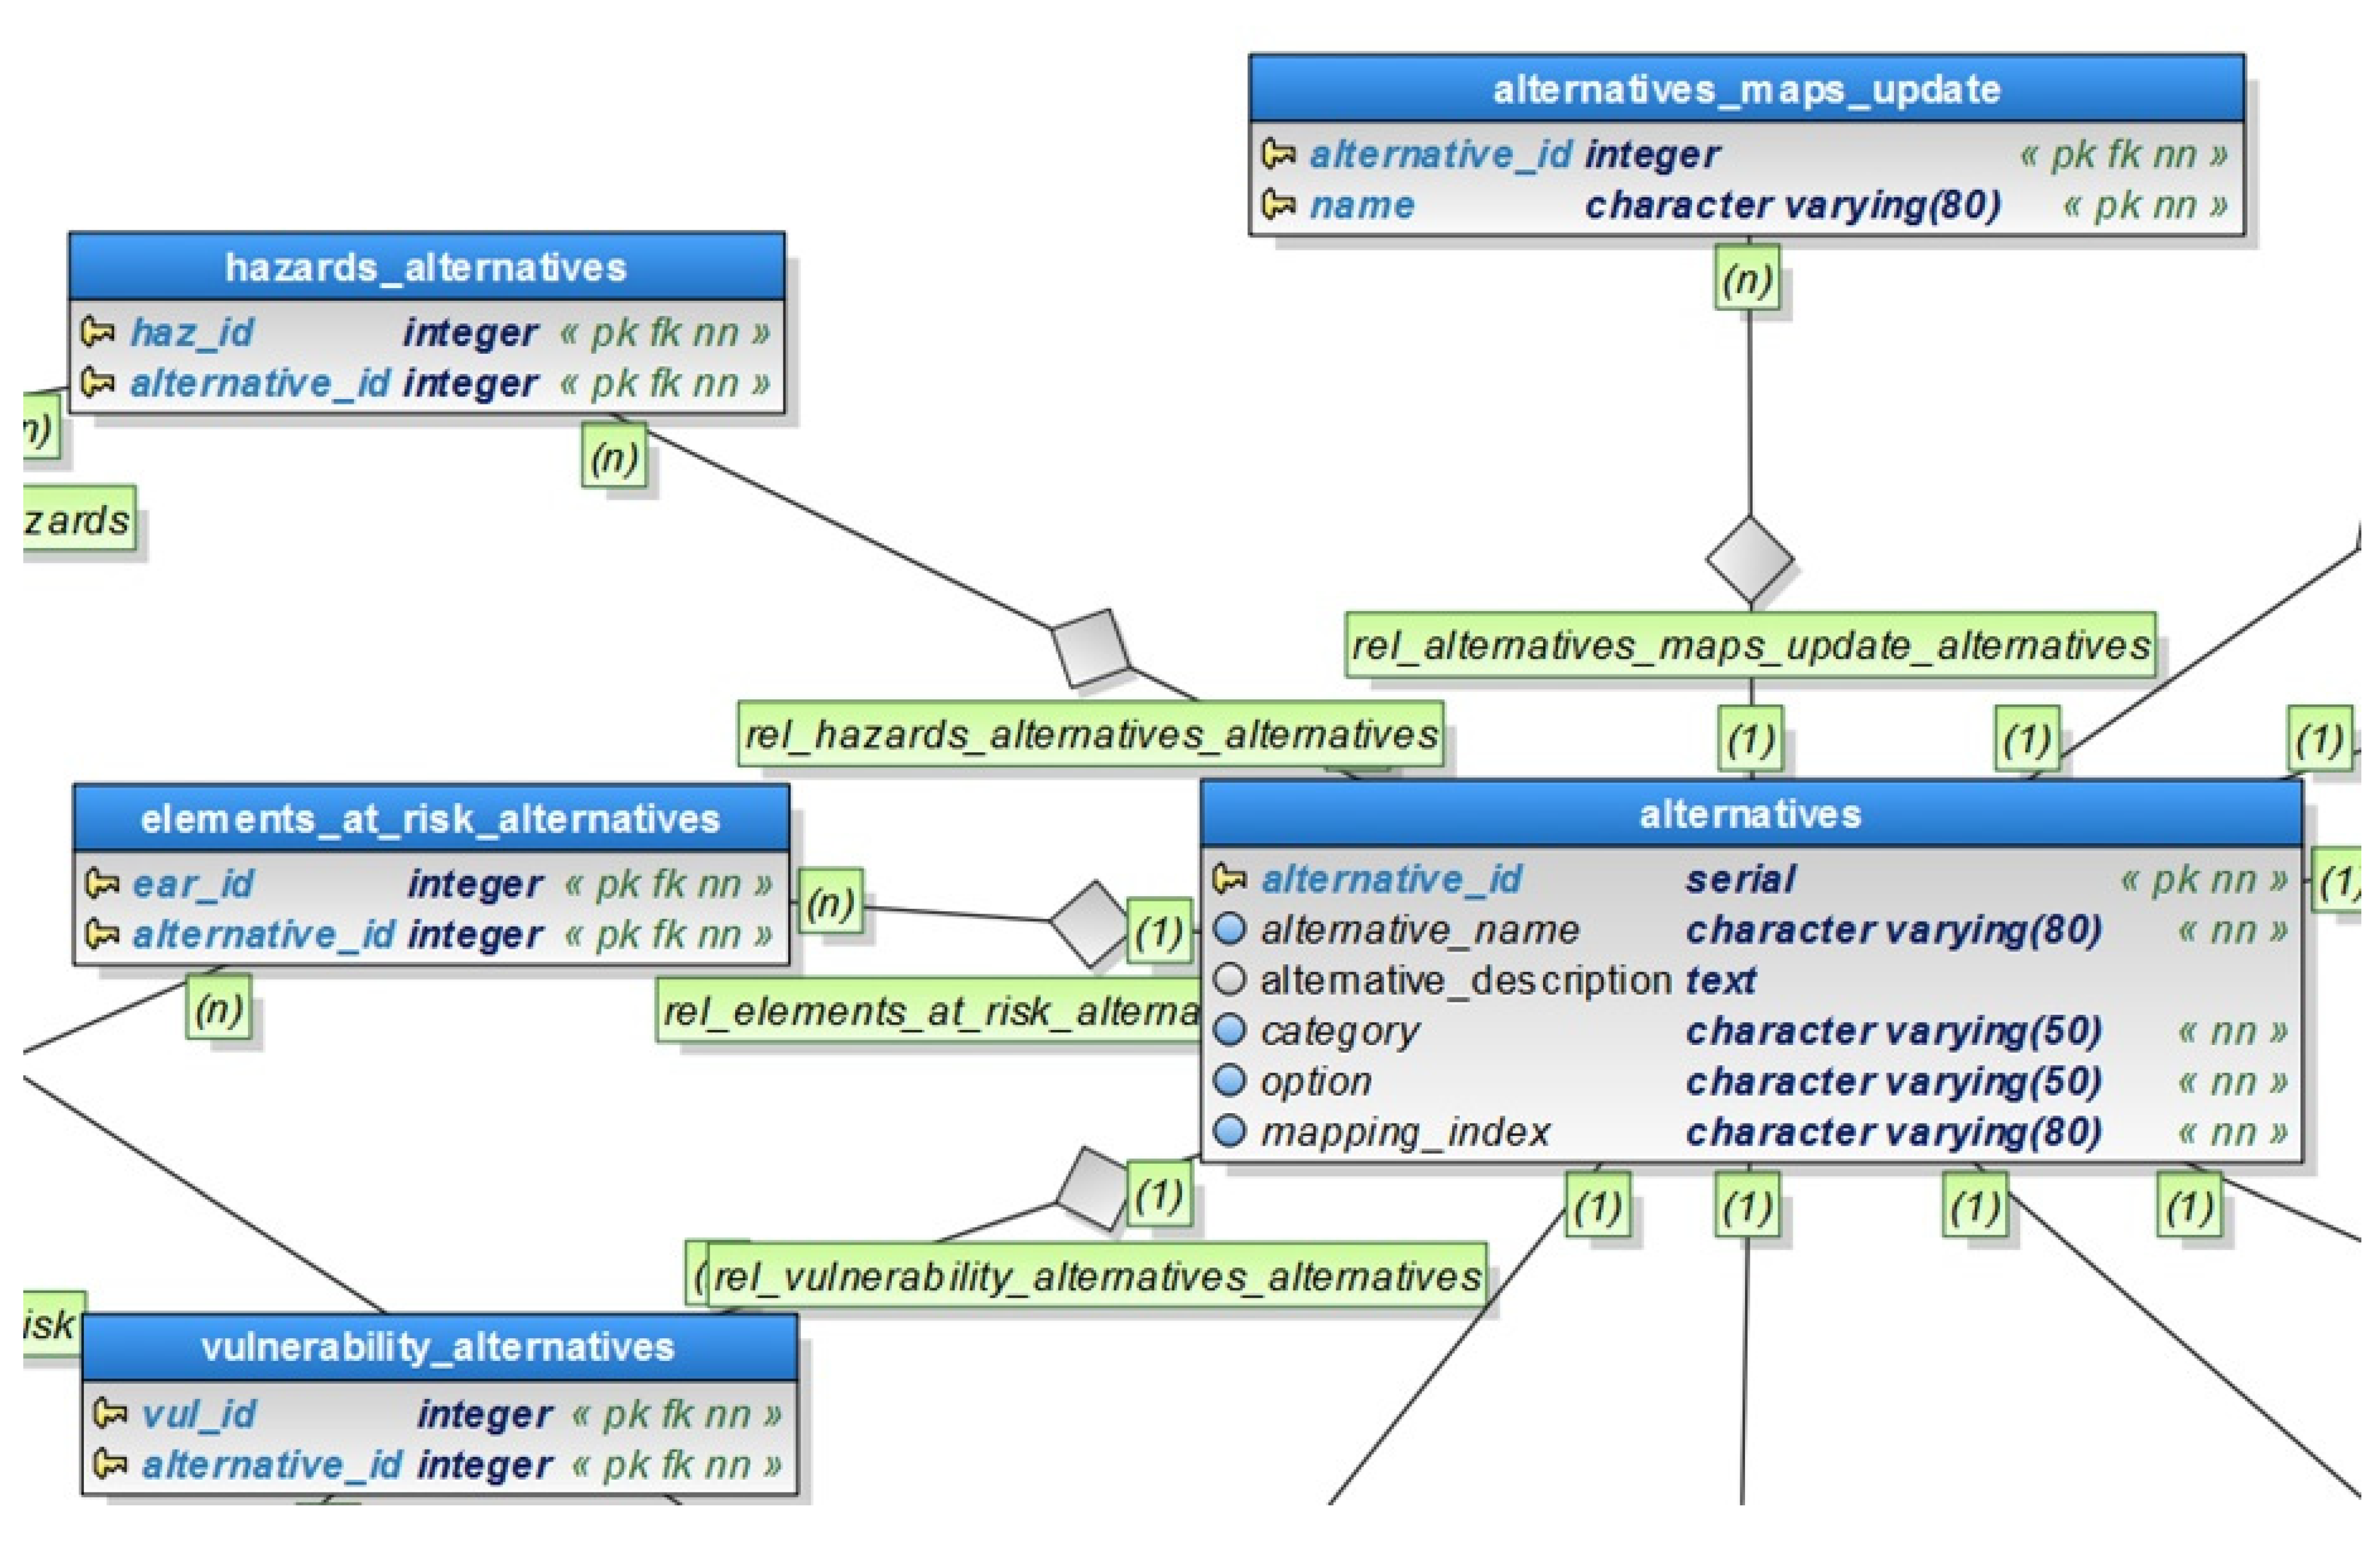
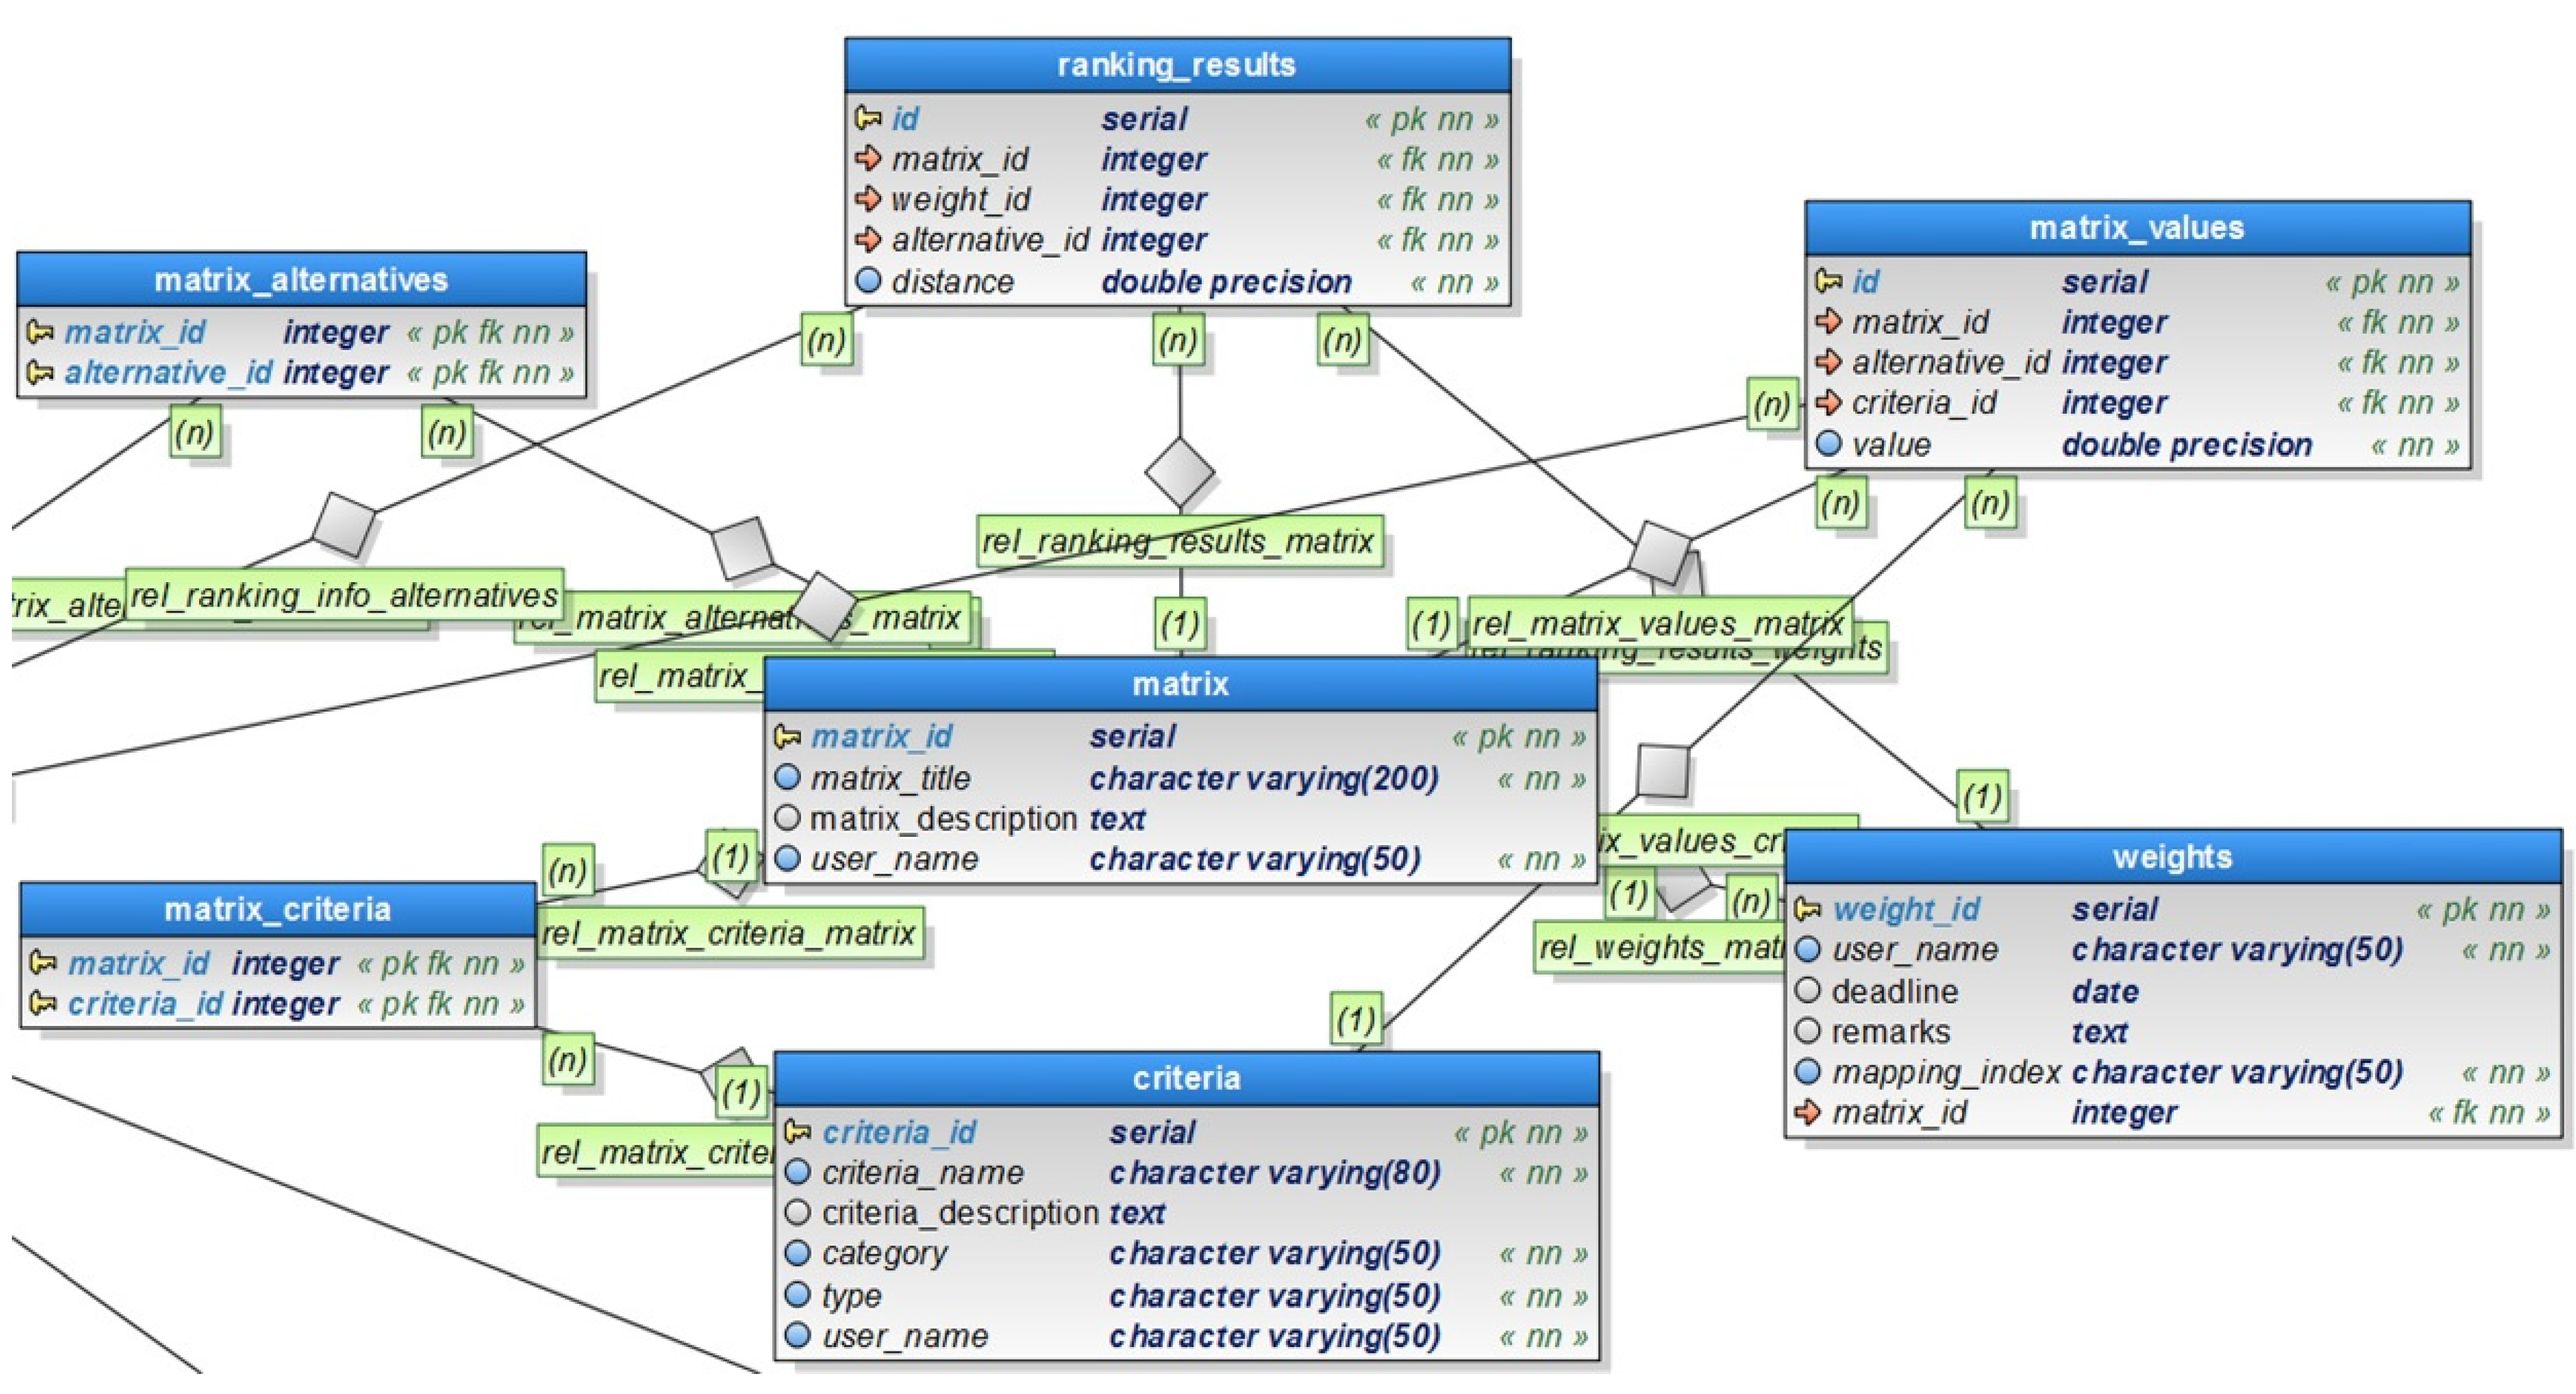
Within the GeoServer, it is possible to configure different user groups, roles and services based on the needs of the web application for the map related services. In the platform, as there exist the different levels of stakeholders’ involvement, the two user groups are defined within the GeoServer for different access rights to the map layers: admin and public. The users of the admin group (low-level experts) can access to all the services provided by GeoServer (i.e., WMS, WFS, WPS, WCS, GWC) and its respective methods while the public group (high-level decision makers) can only access WMS and WFS services and methods within the application interface. As a result of this configuration, the public group users can only visualize the maps and query the feature (layer) information with associated styles and legends while having no rights to make any changes to the accessed layer. This access is configured through Spring Security (a framework which provides a powerful and customizable authentication and access-control to Java based applications) Check of GeoServer depending on the logged in roles of the users.

3.2. Schema Design

In the prototype platform, different case study sites (workspace) can be defined and each study site corresponds to a schema within the main database of the application, meaning the study data are stored accordingly within the specific schema of the database. Figure 5 shows the data model of Alternative Management module of the prototype platform. Each of the alternative scenarios (including “Do Nothing” scenario) is associated with hazard, elements-at-risk maps and vulnerability information which have been uploaded into the platform. Upon the creation of a new alternative scenario with sketch option, a new table is created dynamically to store the mapped measures of that scenario along with its attribute information, which is then linked to “alternatives” table via an attribute named “mapping index”. In addition, maps which need to be updated for a specific alternative scenario to recalculate risk are also stored in the database to track and process later for further analysis.
Figure 5. Data Model of the Alternative Management Module.
Ijgi 04 01201 g005
In the Decision Analysis model (Figure 6), each decision problem (i.e., a “matrix” table) has the relationships with “alternatives” and “criteria” tables to be evaluated against each other. The resulted evaluated values of each alternative for all criteria are stored in the impact matrix (i.e., “matrix_value” table) as explained in Equation (1) of Section 2.2 in order to calculate the rankings of alternatives based on the weights given by the different participants. The assigned participants’ weight sets are stored accordingly in the “weights” table referencing to a specific decision matrix. Using the CP method (Equation (2) of Section 2.2), the calculated ranking results of each participants are then saved in the “ranking_results” table along with the distance (measure of closeness) values of considered alternatives for a certain decision problem.
Figure 6. Data Model of the Decision Analysis Module.
Ijgi 04 01201 g006

4. Demonstration of the Prototype

In this paper, we demonstrate the application of prototype based on a local scale case study site. Malborghetto Valbruna municipality (Figure 7) is located in the Friuli-Venezia-Giulia (FVG) region of the North-Eastern Italy, bordered with Austria and Slovenia [37].
The hydro-meteorological hazards such as flash floods and landslides occur frequently in this study area and it is one of the highest rainfall areas in Italy as well as in Europe. The heavy rainfall in combination with the other conditions triggered debris flow channels, and in August 2003, the major landslide events occurred and caused a major flood of the Fella River (Figure 8). Malborghetto Valbruna (with a population of about 1028 inhabitants) is one of the municipalities located in the Val Canale valley of the Fella River basin. During this event of August 2003, the damages incurred for the whole valley were estimated to be 435 million Euros [37]. This study area serves as an interesting example due to its decision problems for implementation of mitigation measures after the event in 2003. There was a debate regarding the efficacy of hydraulic works versus flood management measures to increase resilience by incorporating local people and their knowledge in the decision making process [37]. Furthermore, there were overriding political interests in maintaining occupation of the valley in the face of continuous outmigration, which resulted in a preference for big structural mitigation measures to be implemented as an effective option in order to prevent relocation of few houses in the area [38].
Figure 7. Malborghetto Valbruna municipality (Source: Google Map).
Ijgi 04 01201 g007
Figure 8. Debris flow events occurred in Malborghetto-Cucco in August 2003 (© Civil Protection of FVG region, Italy).
Ijgi 04 01201 g008

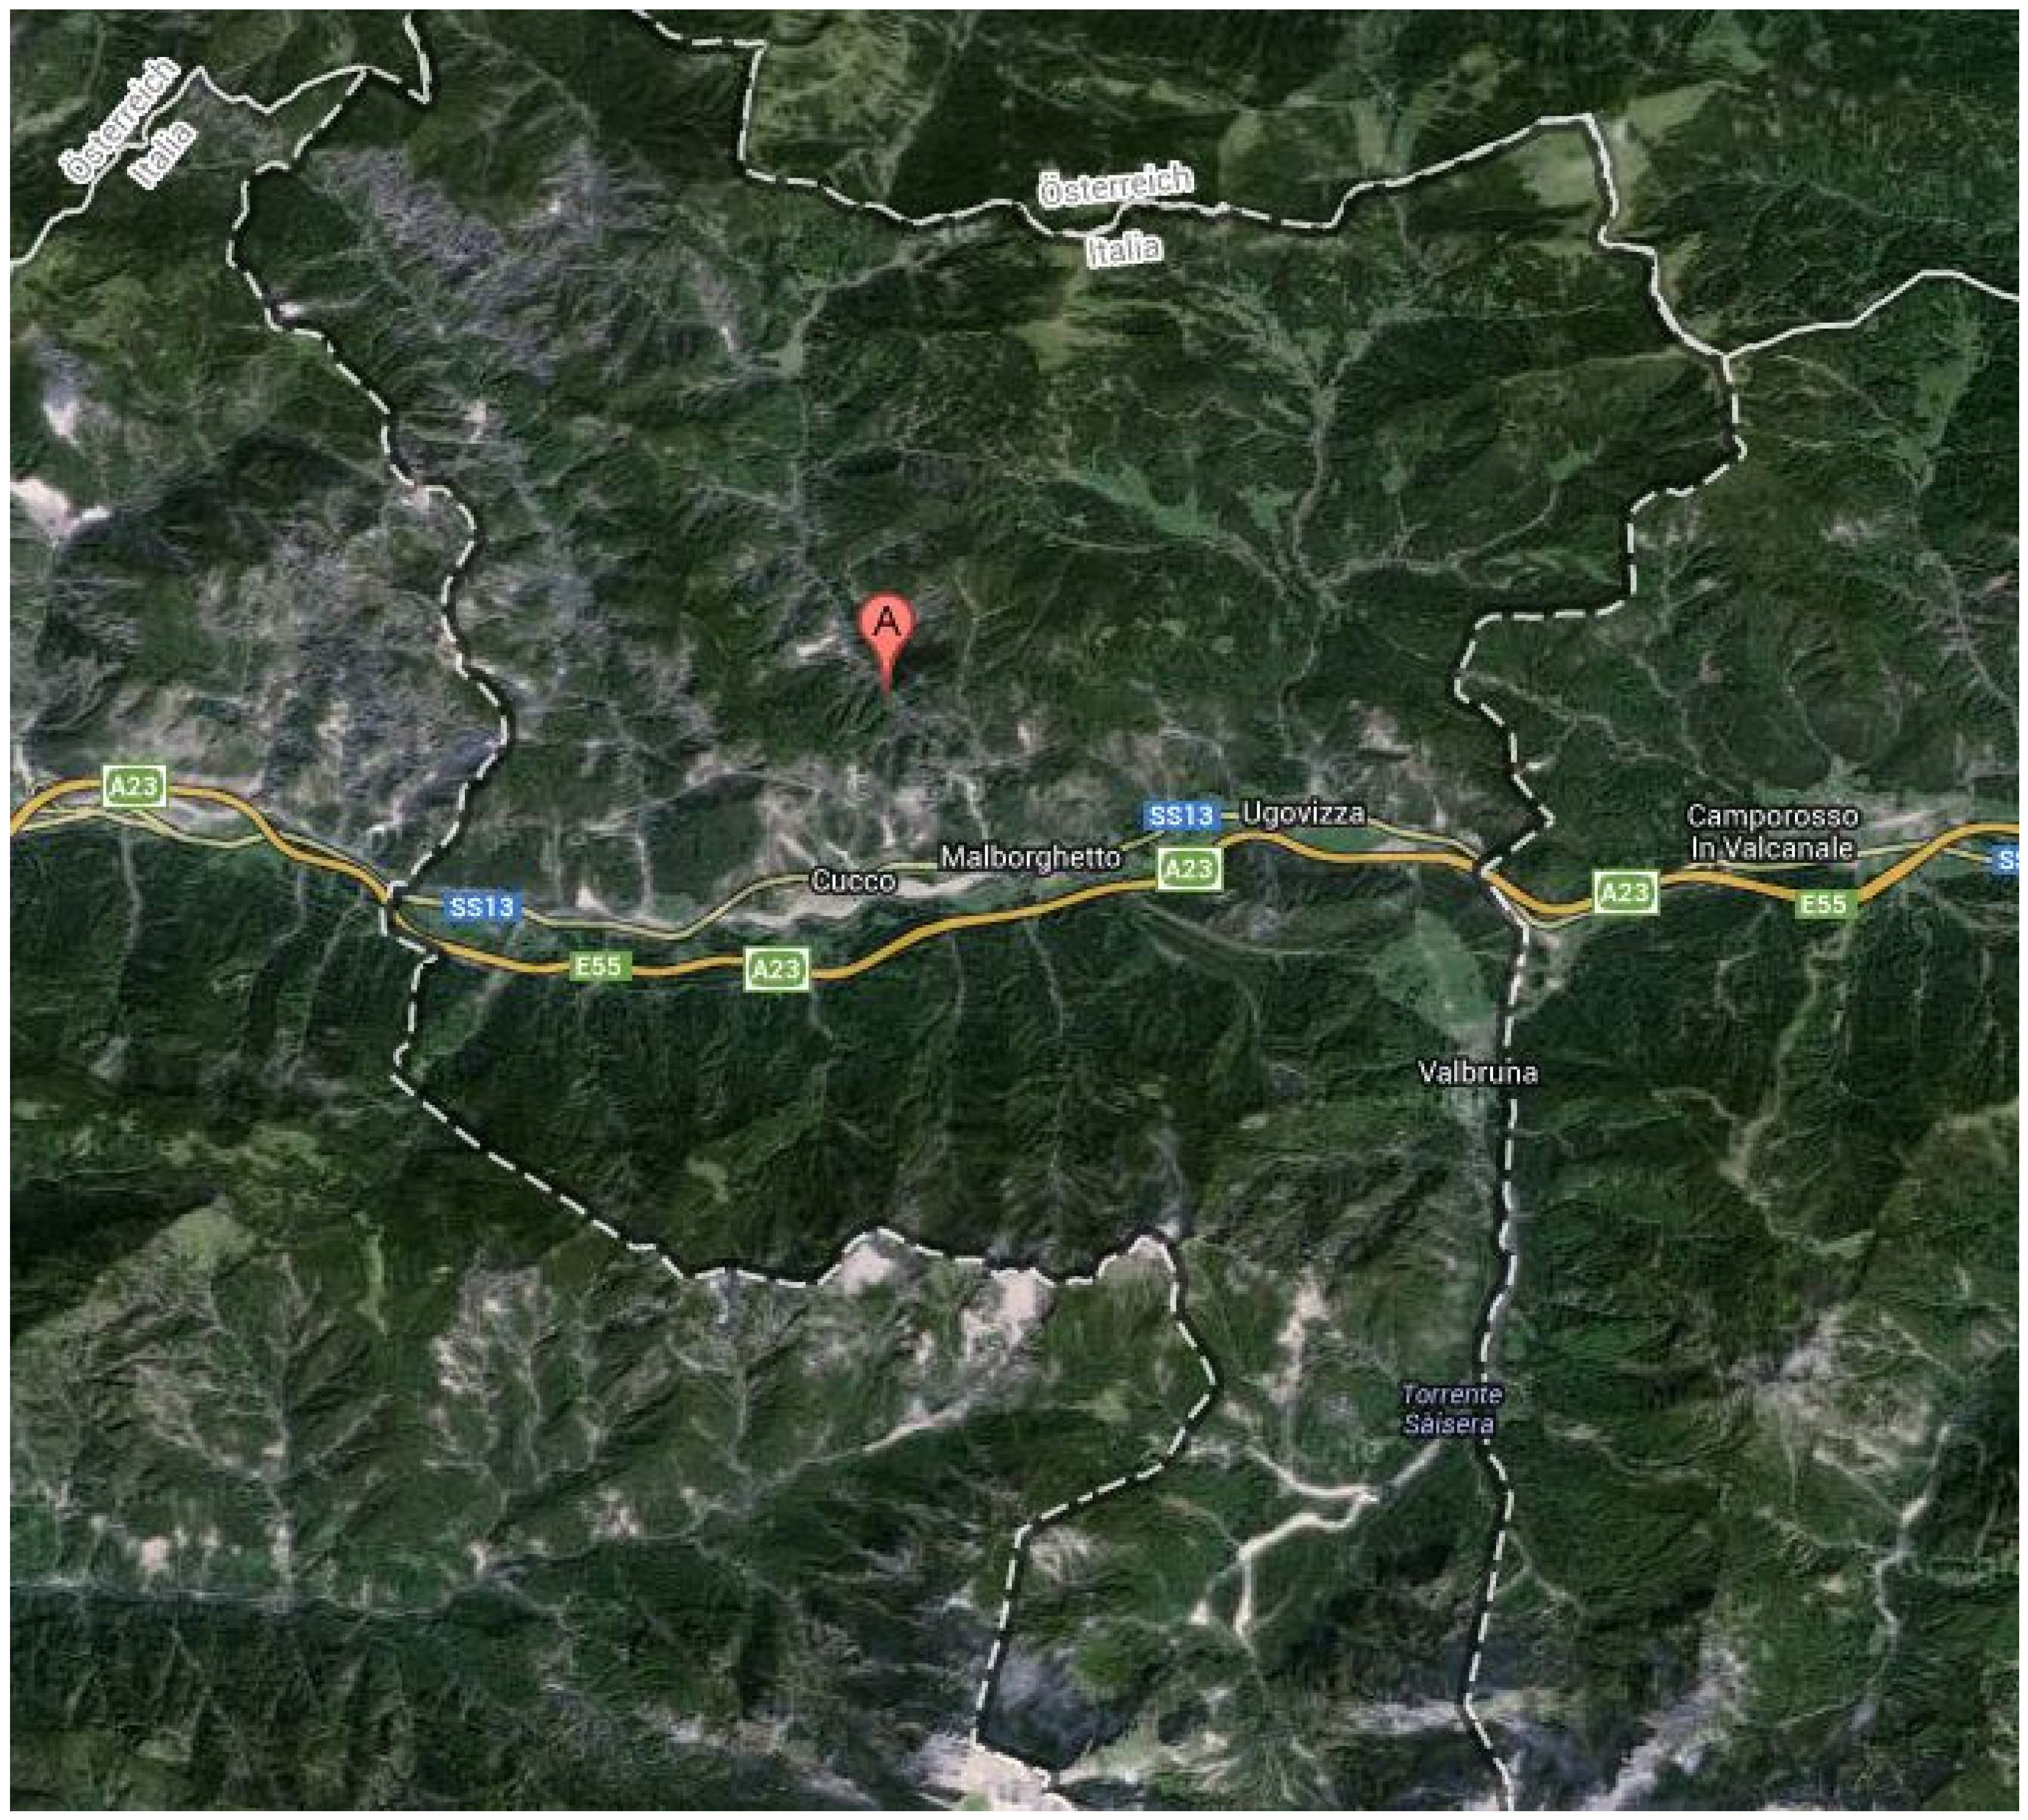
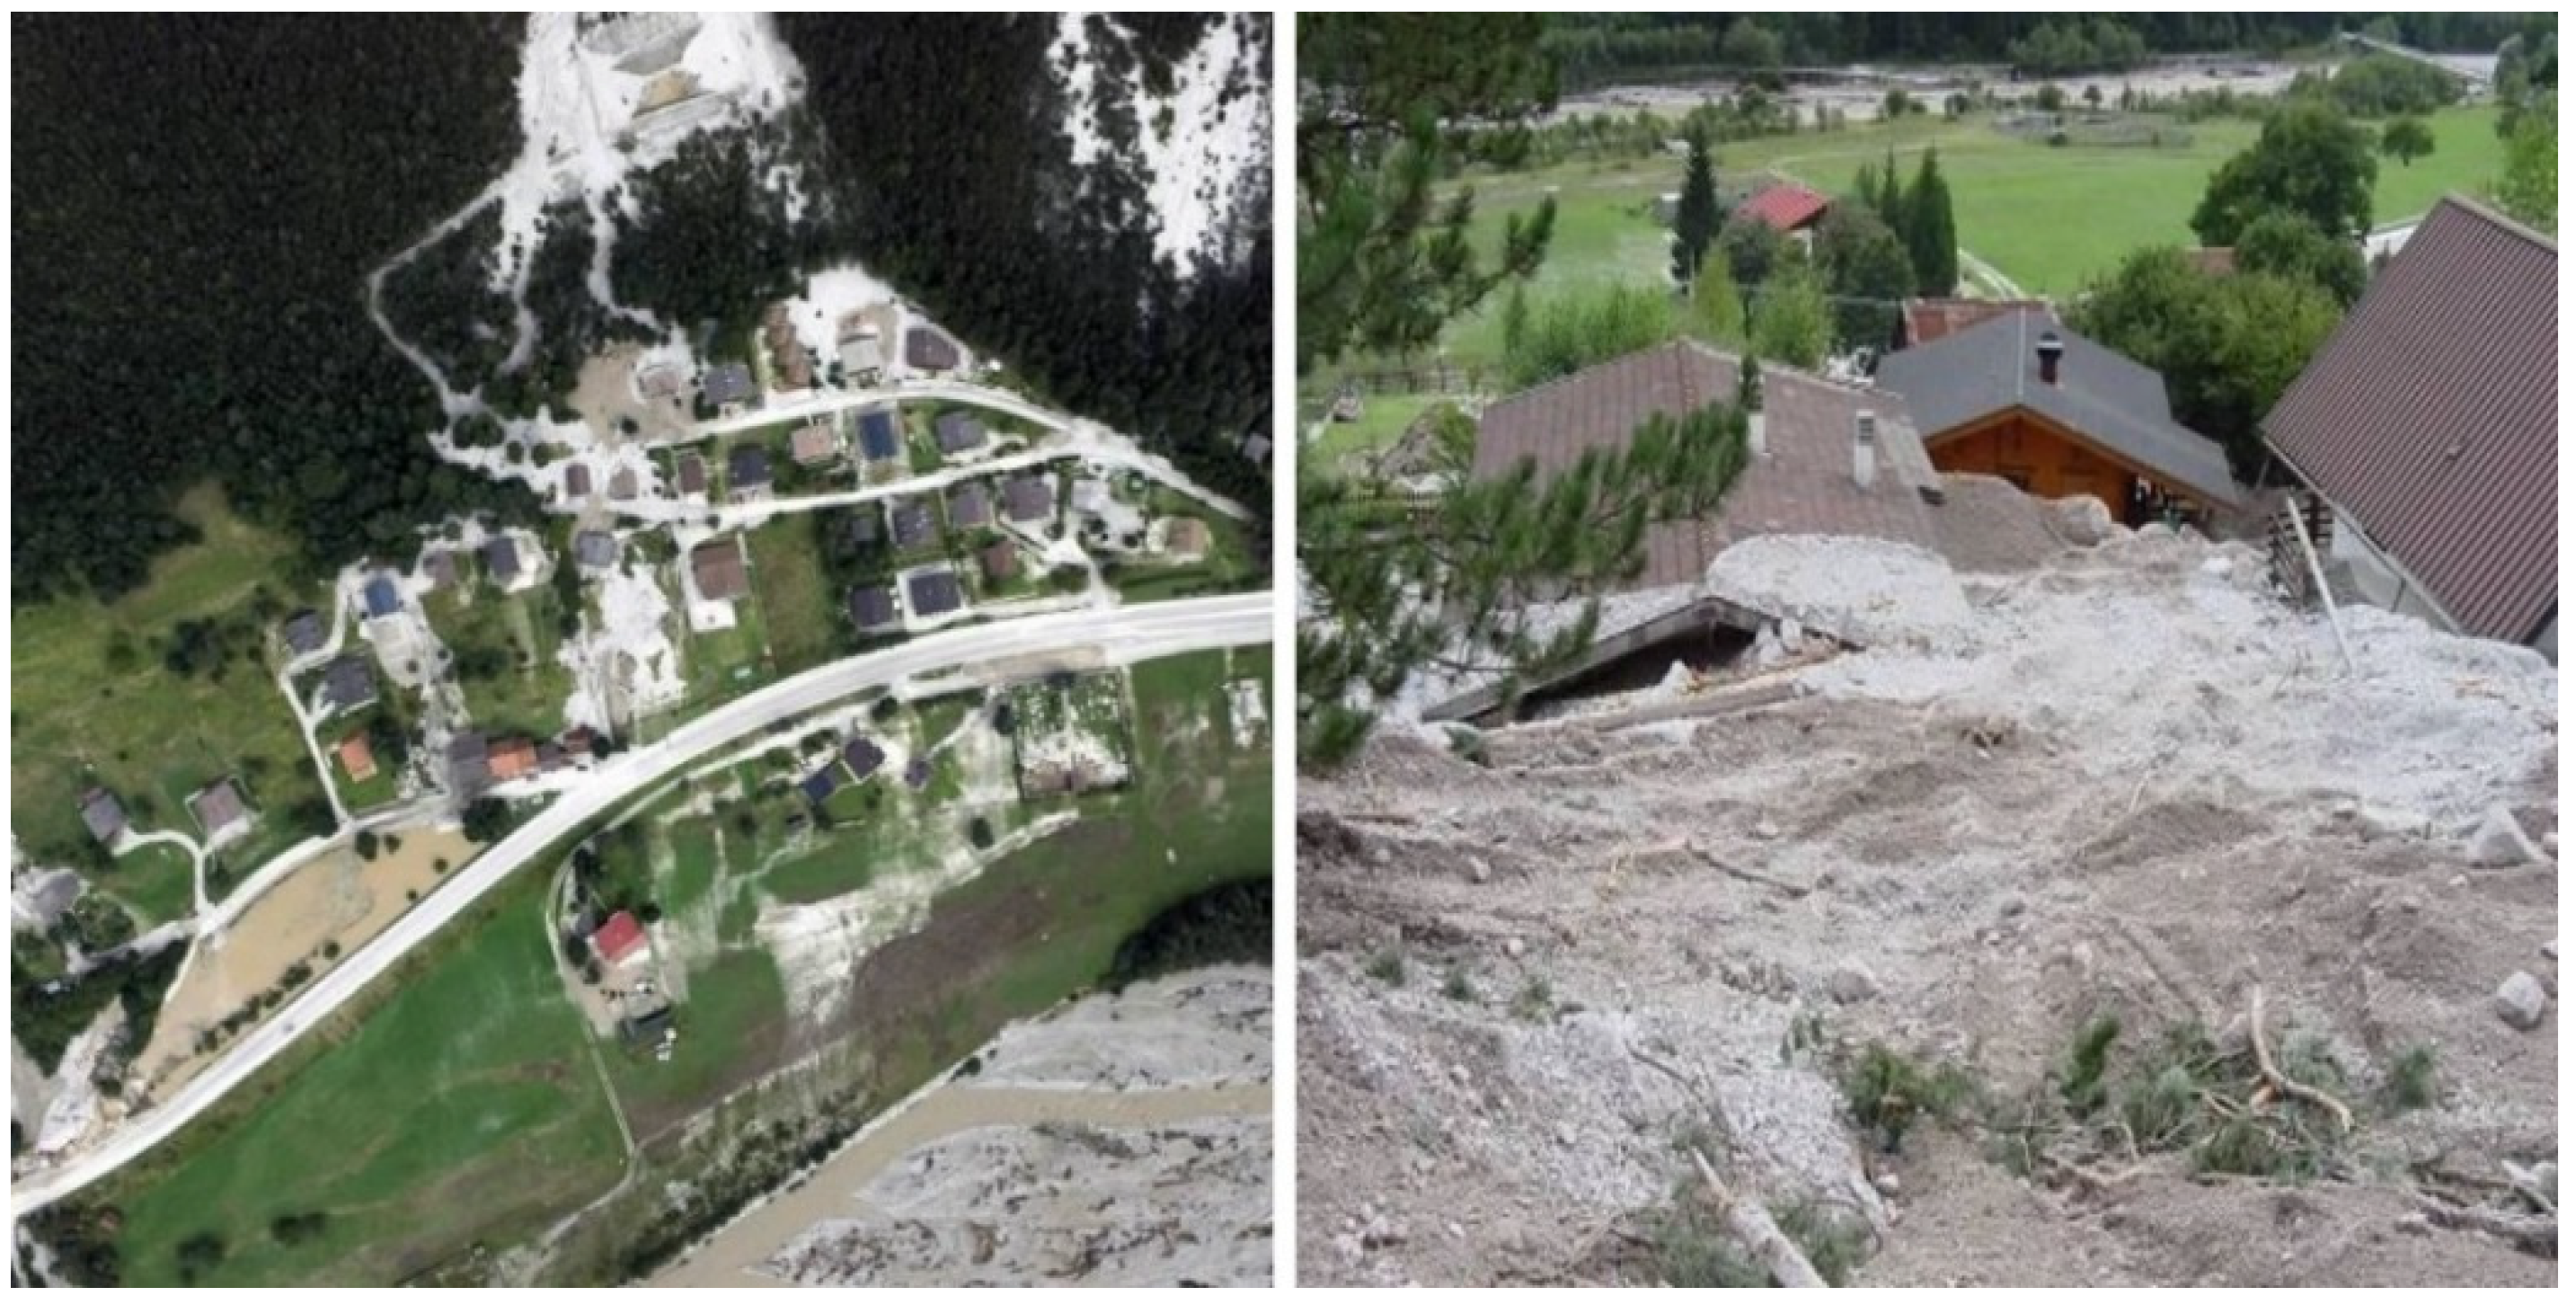
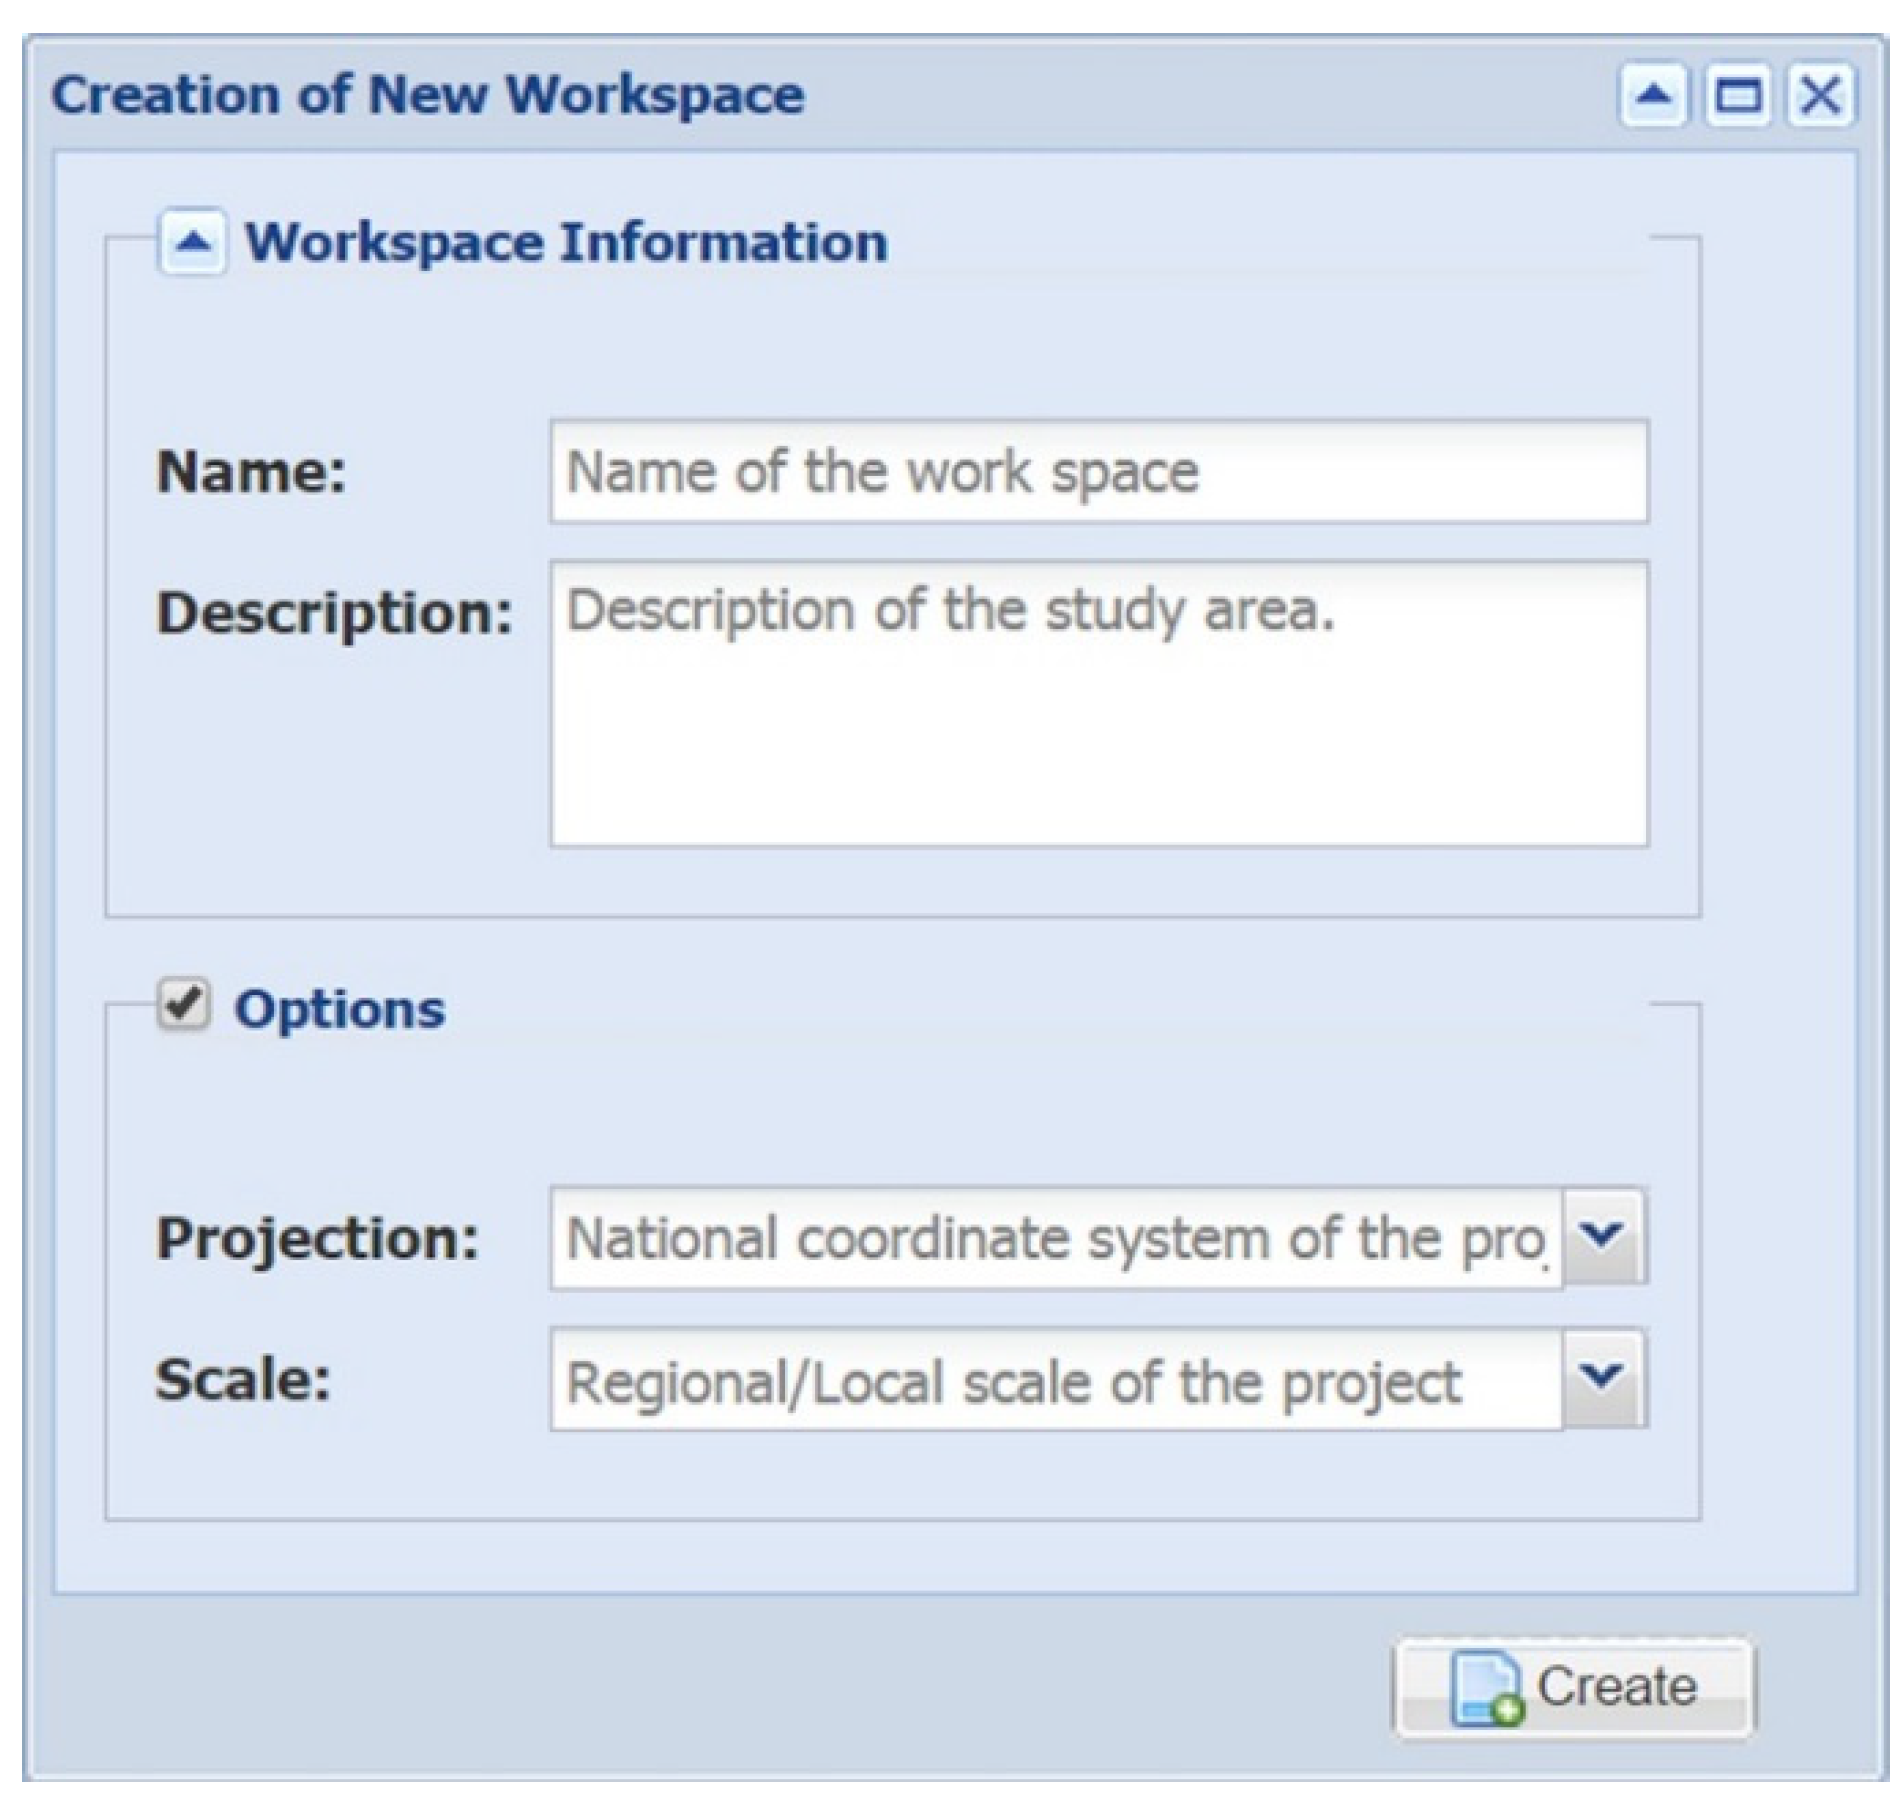
4.1. Definition of a Workspace (Case Study Site)

A “workspace” belongs to a certain case study site for the groups of users to access, store and update all related information of that study site in the database. This workspace can only be created by the responsible administrative user of the study site and it is configured to automatically generate a database schema with default tables upon a new workspace creation as explained in Section 3.2 (Figure 9). Within the existing workspace, admin user can create and assign roles to user accounts according to the responsibilities of the involved stakeholders in the study area. The users can also switch to another workspace if they are assigned to more than one study area and can access the available data and functionality depending on their assigned roles within the platform, for example, only the admin user can access the User Management Module of the platform to create and manage the users’ roles of a workspace. Presently, at this stage of development, the platform does not support the connection to the other external databases to manage workspaces, which can be further improved in the future version of the platform.
Figure 9. Creation of a new study site (workspace).
Ijgi 04 01201 g009

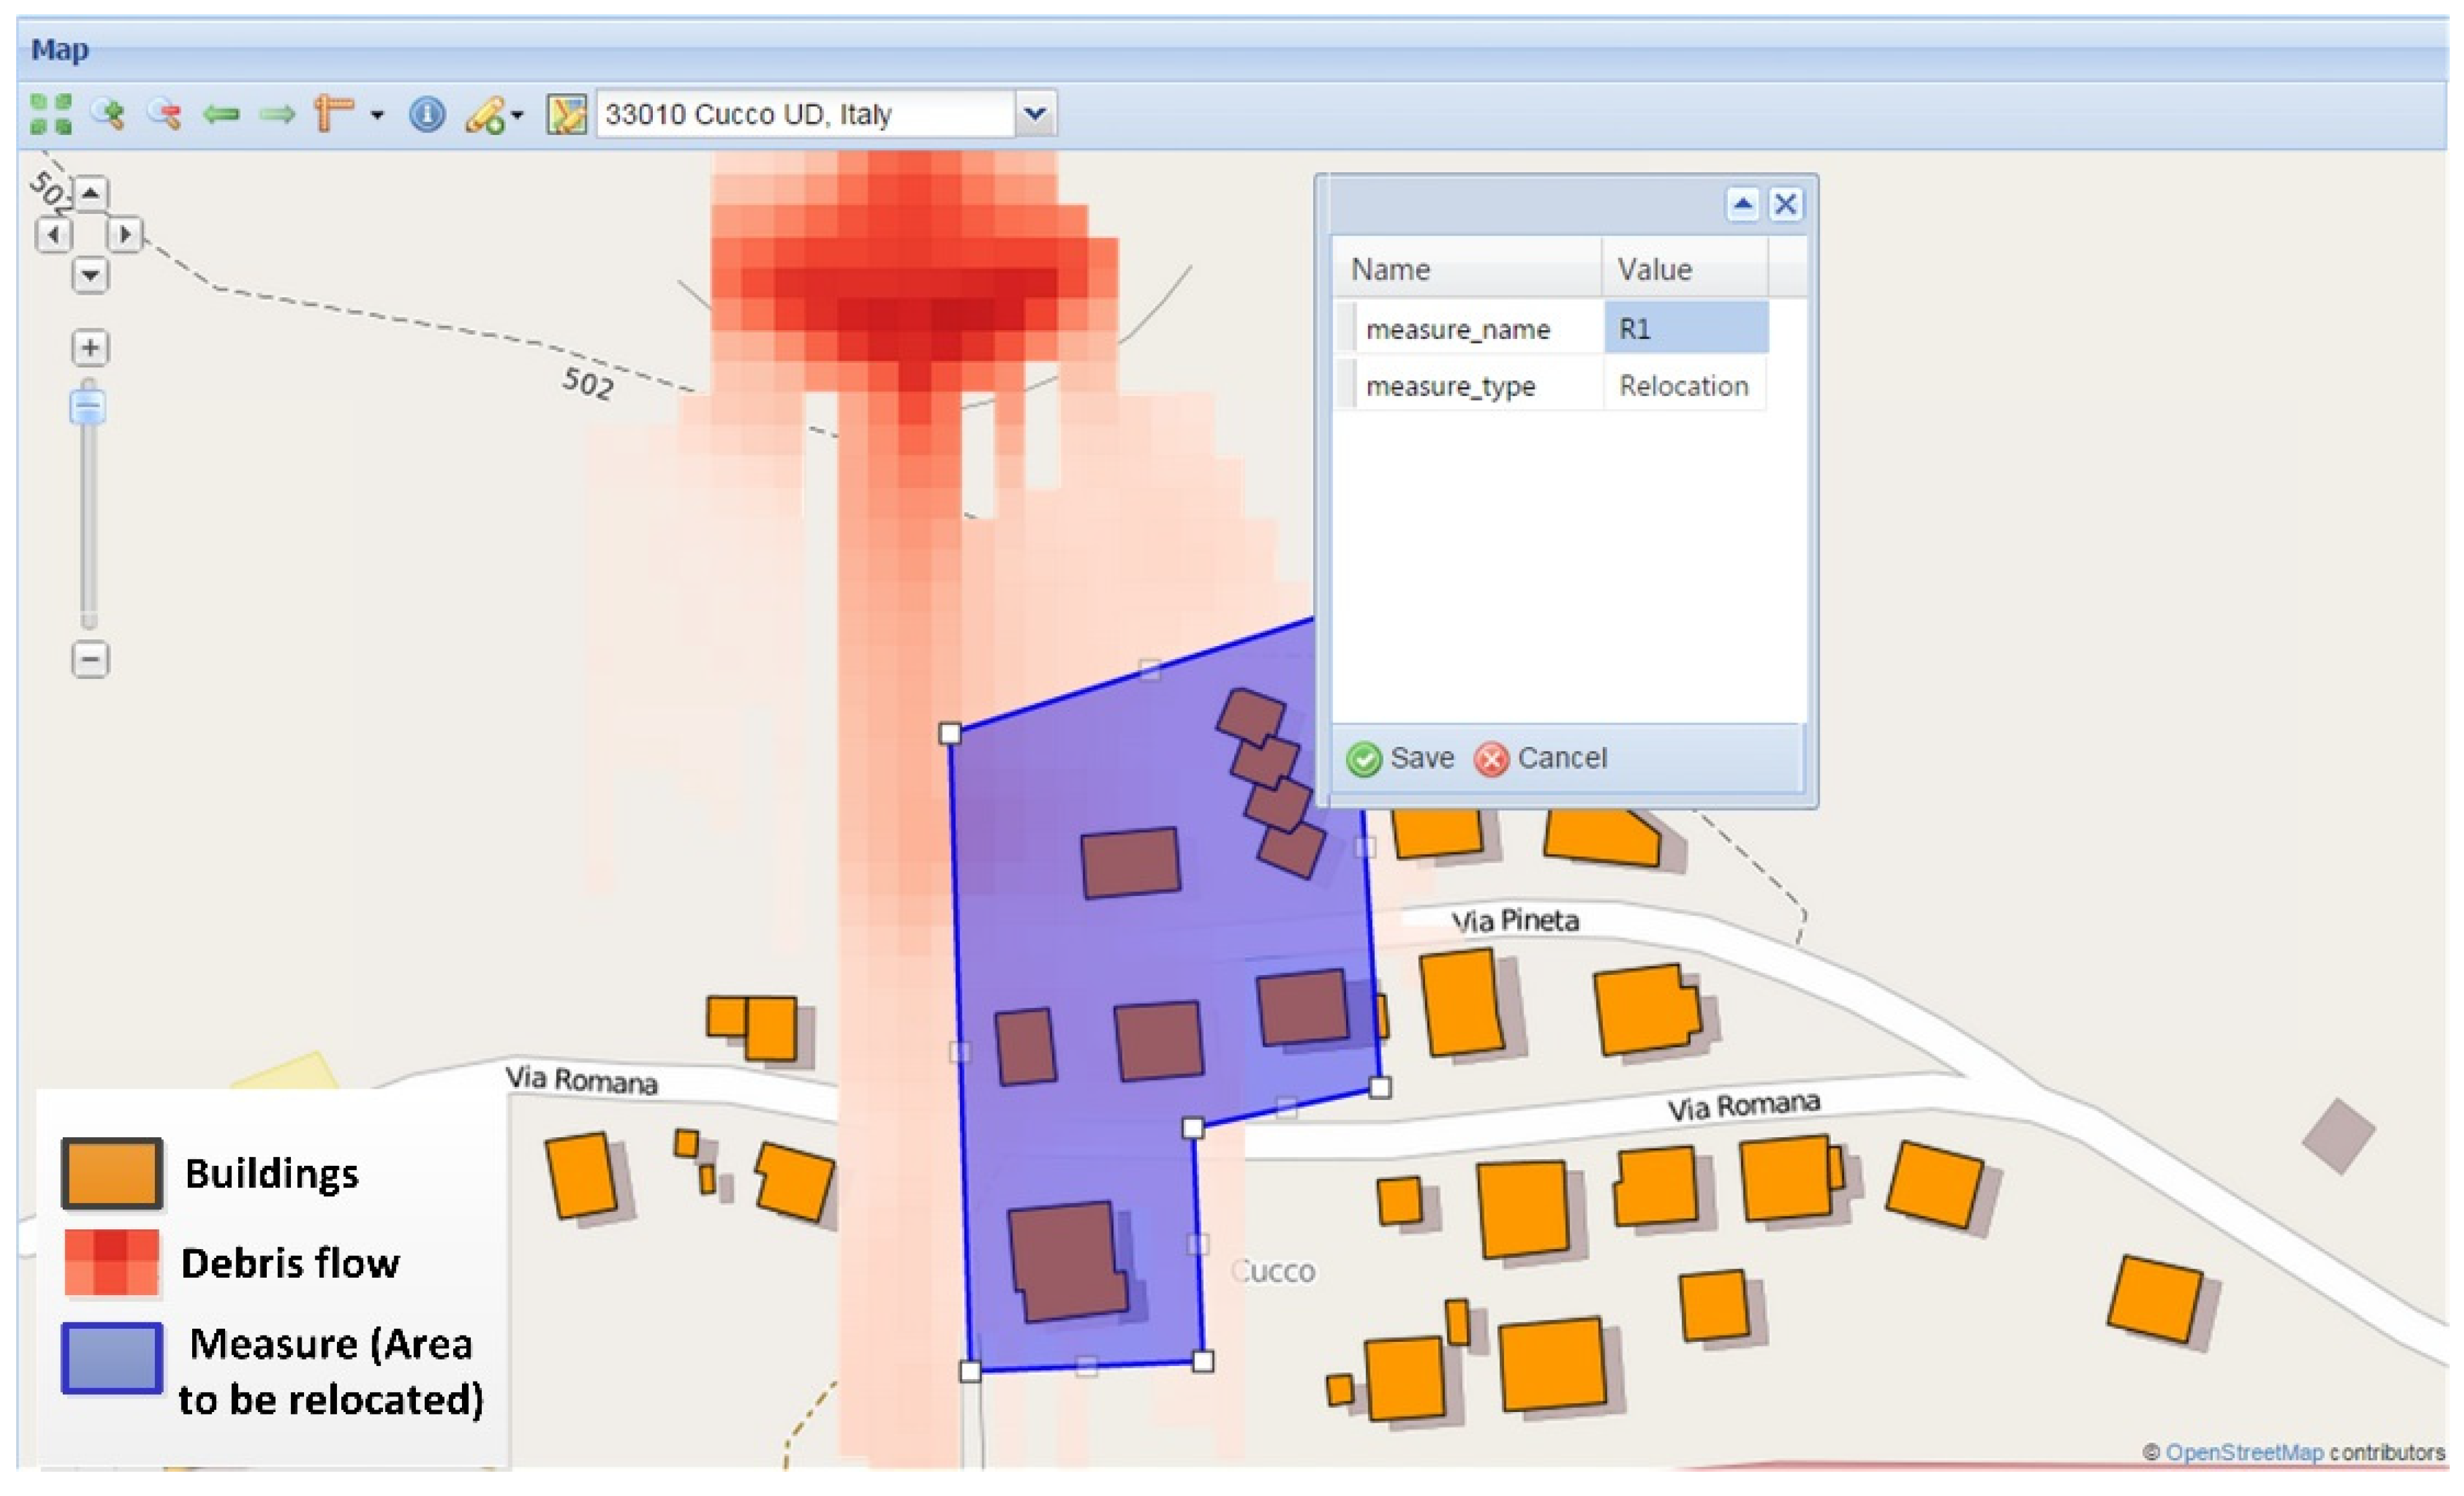
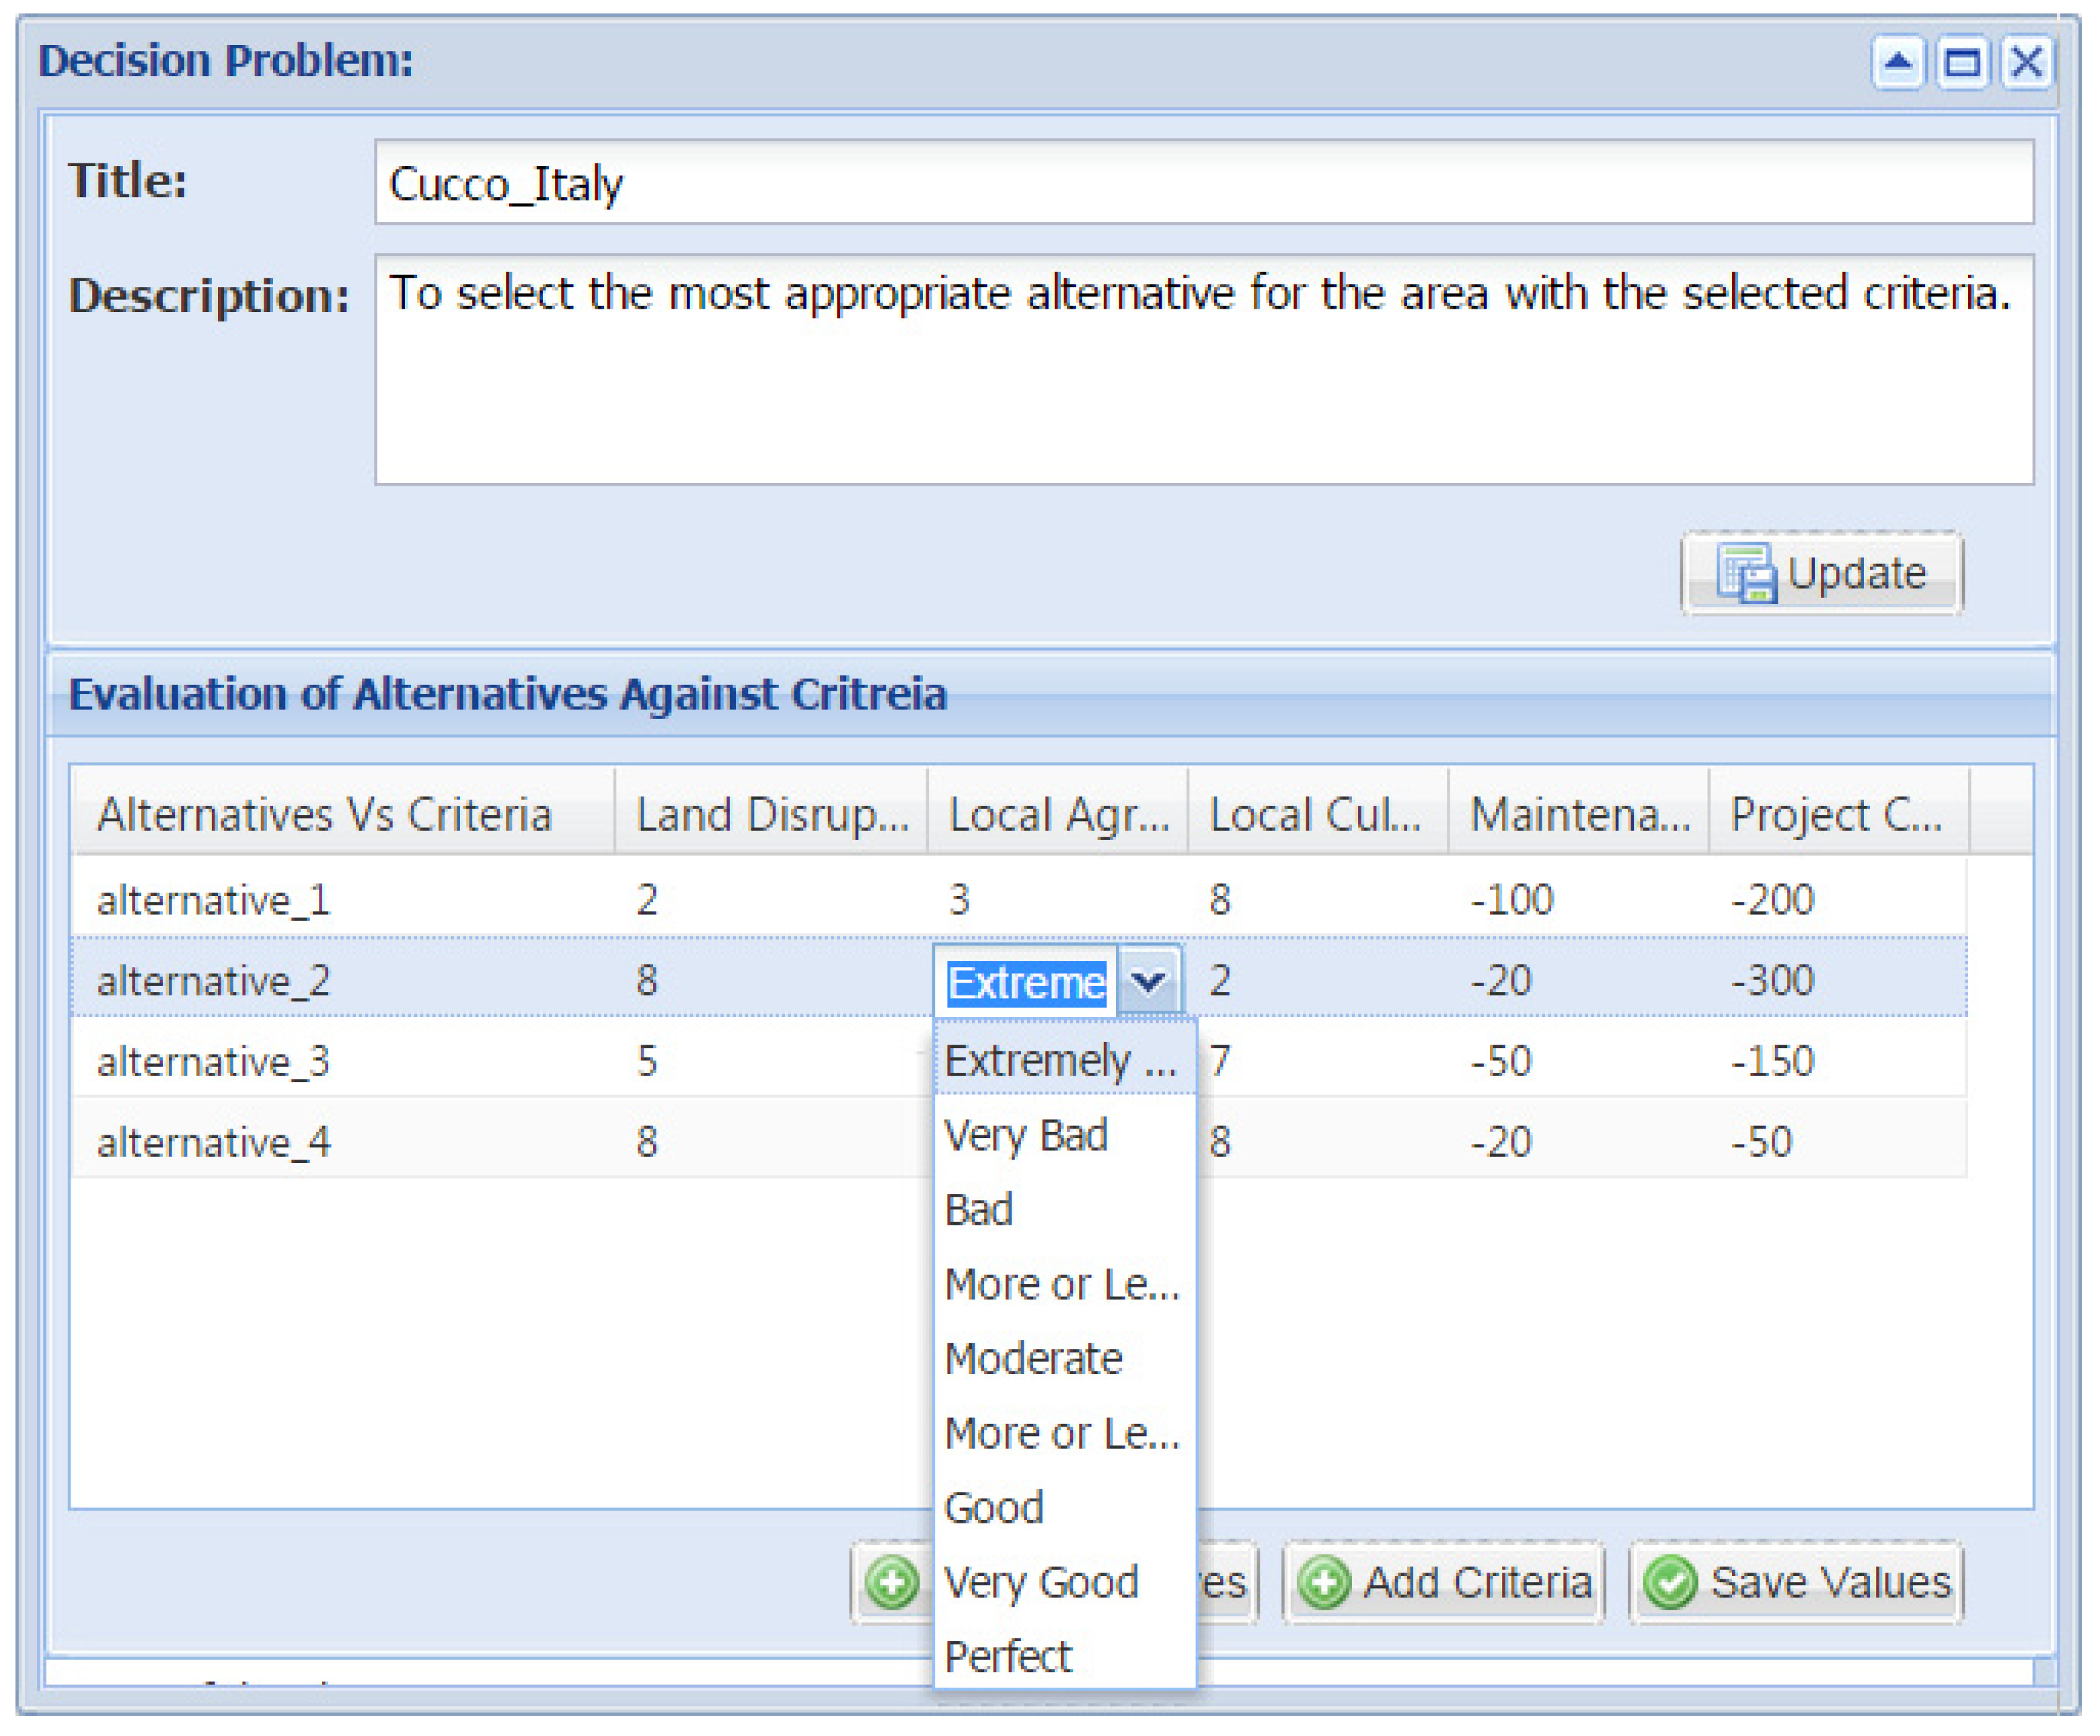
4.2. Alternative Management Module

The expert users (i.e., low-level experts) propose preliminary alternative scenarios (Figure 10), either by sketching or uploading the vector layer (in shape format) into the platform. With the sketching tool, the user can either map a point or line or polygon feature or an event with no geometry information. As an example, sketching of an alternative scenario is shown in Figure 11, where an expert user proposes to relocate the exposed houses to the debris flow by mapping a polygon in the web-GIS interface. The modeled debris flow map of Cucco village, Malborghetto municipality, is based on forward-prediction modelling with latest Digital Elevation Model (DEM) obtained in June 2008, using the best performing parameter values obtained from the back-analysis of the 2003 debris flow event [39]. The debris flow and building asset maps of Cucco are obtained from the research group of European projects: CHANGES [40] and IncREO [41].
Figure 10. Definition of a new alternative scenario.
Ijgi 04 01201 g010
Figure 11. Sketching of a new measure (e.g., relocation) in the alternative scenario.
Ijgi 04 01201 g011
This phase allows expert users to interactively propose the preliminary alternatives based on their expertise and knowledge of the local territory. This would be supportive in achieving combined risk management strategies which are applicable to the local study area. This module could be further improved with integration of a component which produces on-the-fly interactive maps based on knowledge and input given by experts for estimation of new risks after the implementation of preliminary alternatives.

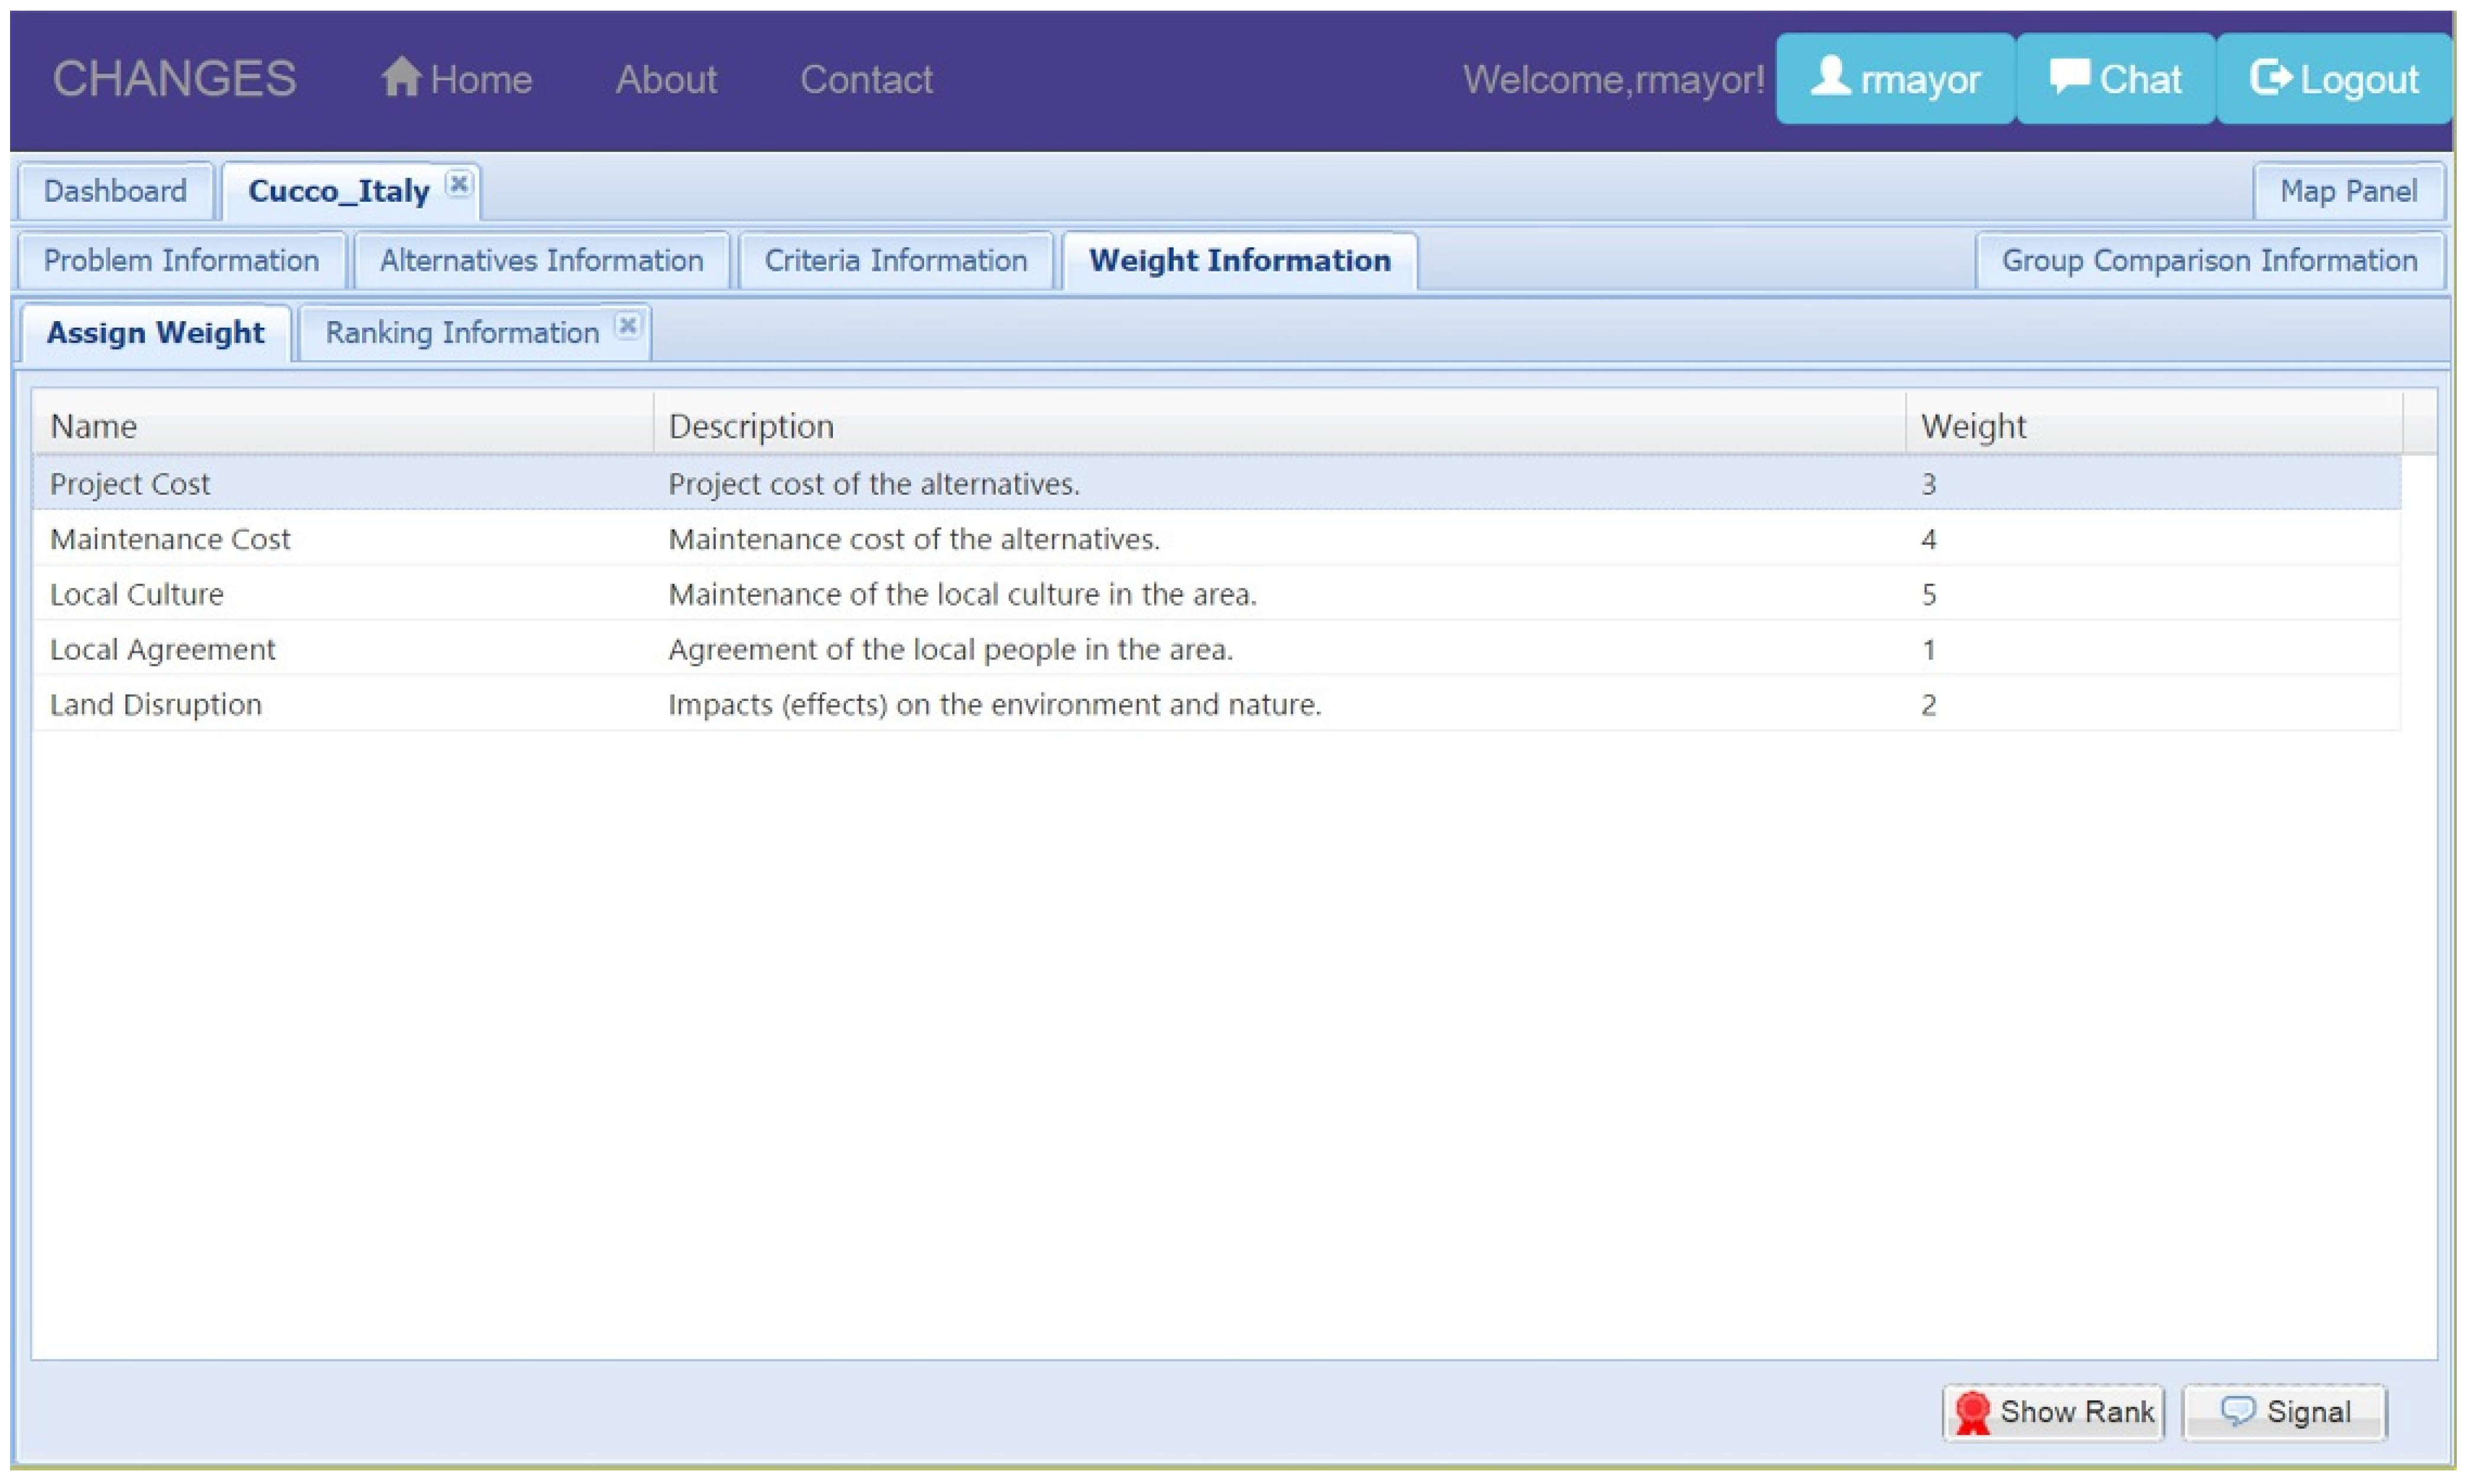
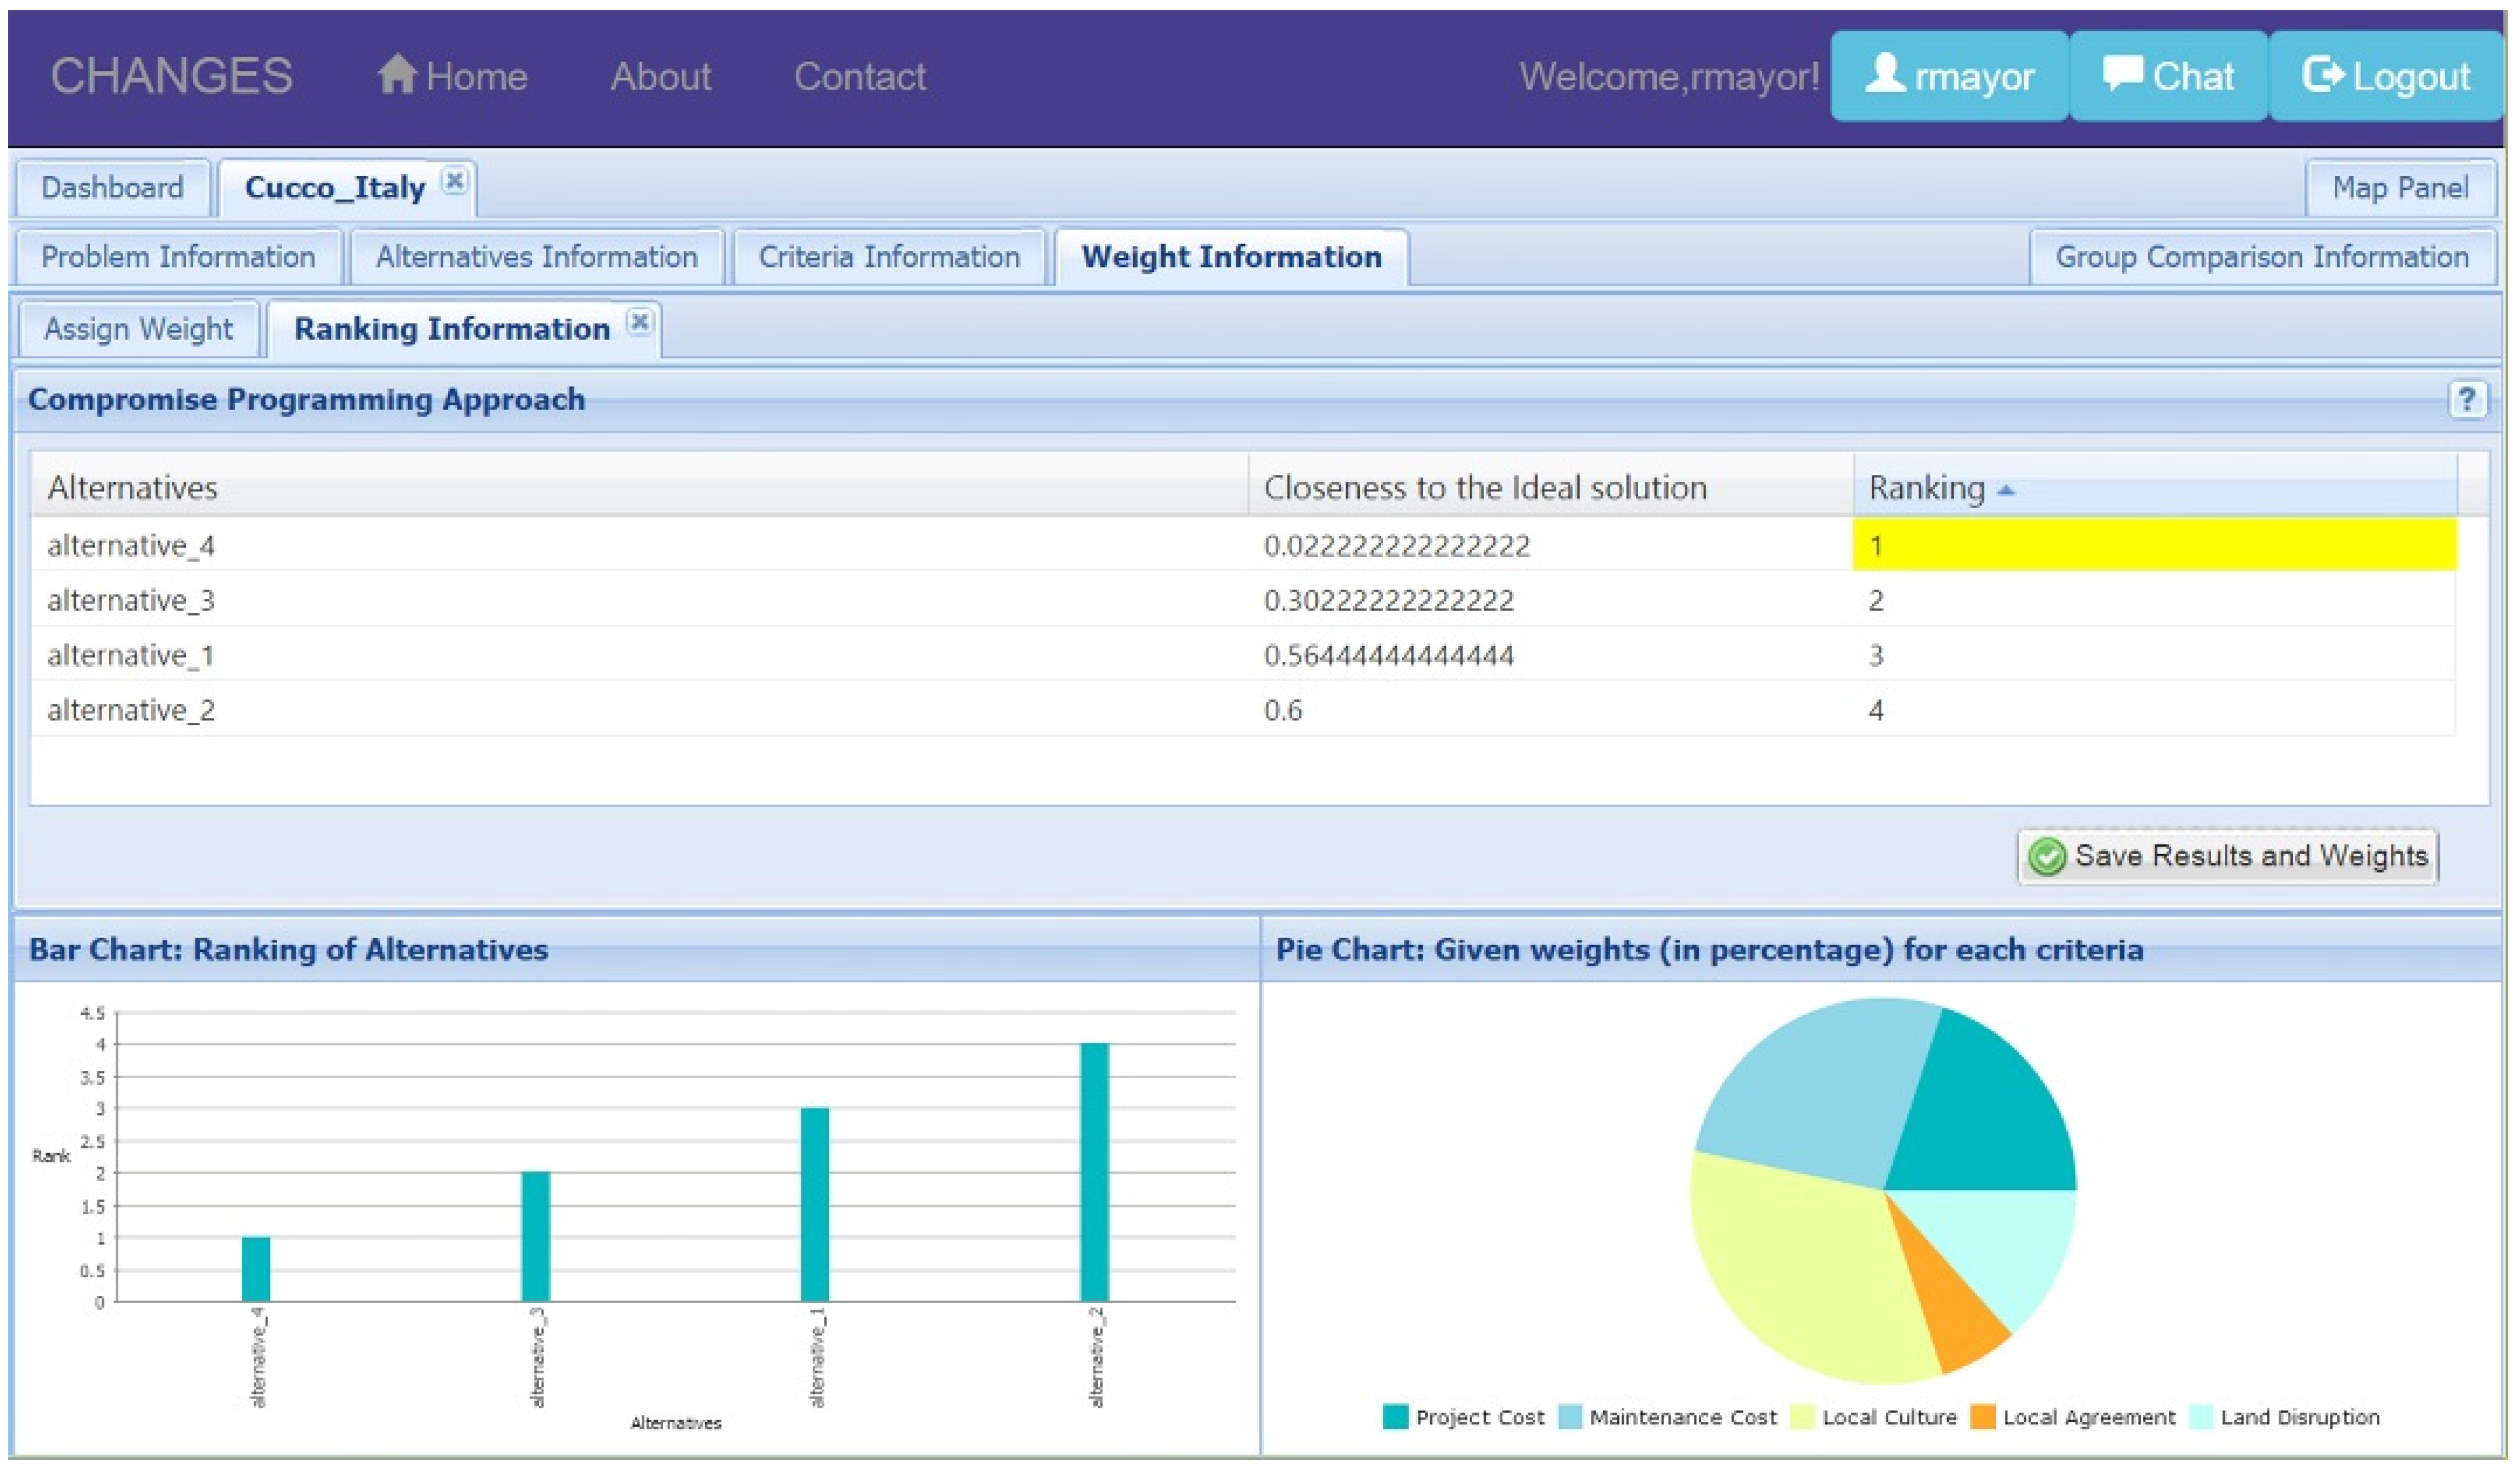
4.3. Decision Making Module

The following steps are taken in accordance with the conceptual workflow of Decision Making module as illustrated in Figure 3 of Section 2.2. Based on the alternative scenarios obtained in Section 4.2, firstly, the expert users can define criteria to evaluate the proposed alternatives. There are three different categories of criteria: social, economic and environmental criteria, with either qualitative or quantitative type. Figure 12 shows an example list of criteria defined by an expert user with the possibility of updating a criterion. For example, “Project Cost” is an economic criterion with quantitative (numeric) data input value.
As a next step, the moderator set up a decision problem (in this case, Cucco village) by selecting alternatives and criteria to be evaluated within the impact (evaluation) matrix (Figure 13). The moderator can enter the corresponding values (either quantitative value or qualitative scale ranging from extremely bad to perfect) depending on the defined criterion’s type, for example, “Project Cost” is a quantitative criterion where minus symbol indicates that it is a “cost” criteria.
Figure 12. An example list of defined criteria for the study area.
Ijgi 04 01201 g012
Figure 13. An example evaluation of Alternatives vs. Criteria.
Ijgi 04 01201 g013
Figure 14. An example assigned weight set by the user.
Ijgi 04 01201 g014
This evaluation matrix corresponds to the matrix A (see Equation (1) of Section 2.2) and after the preparation of this matrix, in order to calculate the rankings of the alternatives based on Compromise Programming method (see Equation (2) of Section 2.2 for calculation procedure), the moderator allocates the involved participants (i.e., a group of decision makers and/or experts) to assign their weights on the criteria in the next step. Subsequently, each participant can log on to the platform and indicate their weights (preferences of criteria) within the specified time frame if available. The following Figure 14 illustrates an example of how the weights can be assigned by the user (in this case, mayor of the municipality is logged in as role “decision maker”). During this weighting process, the user can also send a “signal” to the moderator by commenting in the platform to propose new criteria or alternatives to be considered. The whole process is iterated with the feedback given by high-level decision makers.
Figure 15 shows the customized interface of high-level decision makers where the user can visualize the ranking information of alternatives based on the assigned weights; for example, in this case, alternative 4 ranked first achieving the least distance value amongst all alternatives. This ranking of alternatives (distance value or closeness of measure to the ideal solution) is calculated dynamically and immediately with the given weight set of the user and evaluation matrix using the compromise programming (Equation (2) of Section 2.2). The left bar chart of Figure 15 shows the ranking of alternatives (in ranked order) while the right pie chart represents the given weights of user for criteria (in percentage). To improve the user-friendliness and simplicity of the platform, the interface of high-level decision makers is differently customized with simplified information and functionality than the low-level experts. The users can not only assign their weights but also visualize proposed alternatives and criteria information under different tabs of the interface (Figure 15).
Figure 16 shows the comparison of resultant ranking outcomes of the participated stakeholders (in terms of closeness to the ideal solution). The shortest color represents the best compromise solution and in this case, alternative 4 is nominated by all participants. This comparison of results would assist in facilitating the negotiation process (if ranking results are different) in order to obtain a final weight set and ranking of the alternatives. As mentioned in Section 2.2, an aggregation method could be applied, however, aggregation methods need to be further explored since the aggregation of all weight sets could introduce a decision bias in the decision making if it is not properly aggregated based on the responsibilities of stakeholders in the specific study area. Nevertheless, these ranking outcomes of different stakeholder groups serve as a good starting point for the negotiation process, and the moderator can later assign a final agreeable weight set in the platform. We consider that the decision support tool aims to assist the users in making better and informed decisions by providing necessary inputs and information while the final decision still needs to be made by local decision makers according to their legal responsibilities and institutional structures of the study area. There could also be several improvements in this module such as improving the visualization options of the ranking results, introducing a voting scheme of the alternatives and integrating additional MCE methods, etc.
Figure 15. Visualization of ranking results for weights assigned by the user.
Ijgi 04 01201 g015
Figure 16. Group comparison of the ranking results by the participants.
Ijgi 04 01201 g016
The developed approach encouraged the involvement of different groups of stakeholders in a participative manner via an interactive web-based platform, aiming to achieve a better decision making process with the use of open-source software tools in selection of a wide range of mitigation measures. This approach also considered not only economic criteria but also other important criteria such as agreement of local population and potential effects on the environment in long term. Consideration of multiple criteria and the preferences of stakeholders in the decision-making process is particularly relevant in the case study area of 2003 event, where the enormous and costly structural mitigation works were implemented to prevent outmigration and to protect the existing small settlements in the area while residual risk and long-term maintenance of structures continue to exist in the future development. In addition, the construction of protection works initiated by regional civil protection faced opposition that the local interest groups were not consulted during the decision-making process, claiming that local knowledge could propose better alternatives [37]. This stressed the importance of participative approach with all concerned parties in decision making, and this is why the presented two-phase participatory framework is realized for the development of such a web-based platform.

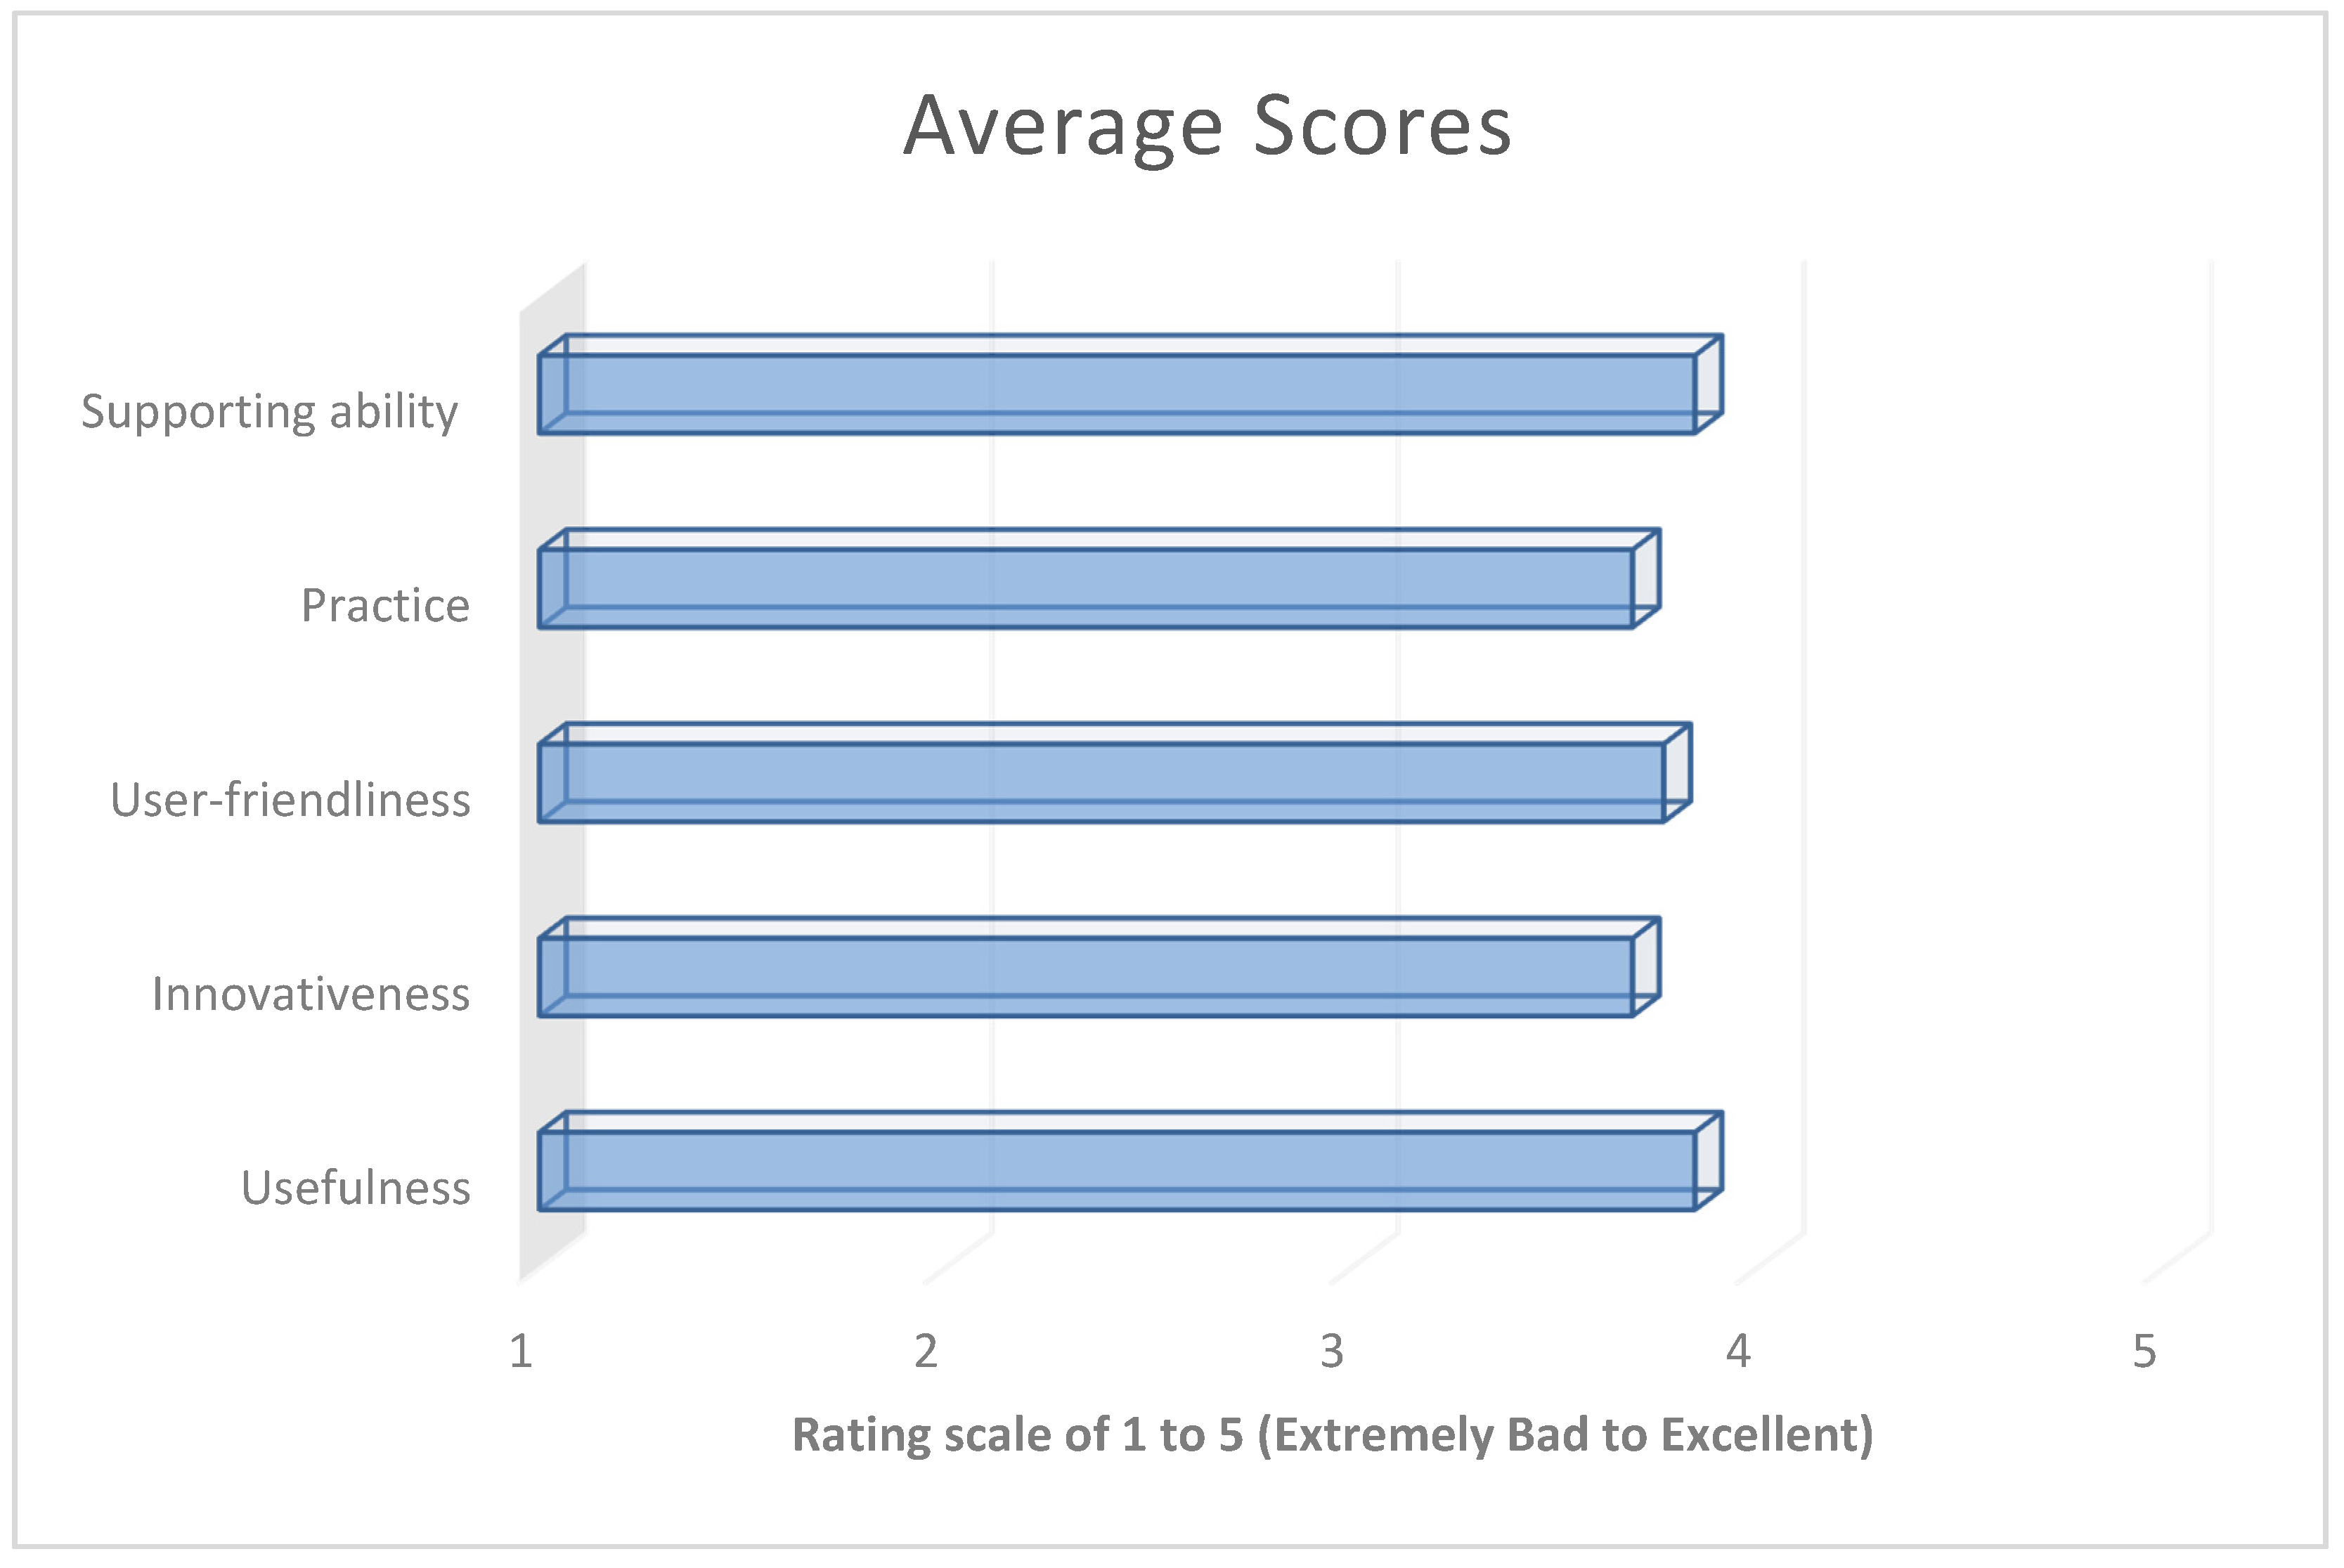
5. Feedback Discussion

This prototype was presented to the local and regional stakeholders of the study area to collect the valuable preliminary feedback of representatives from: the Geological Survey; Hydraulic Services; Forestry and Mountain Services; Civil Protection Services of Friuli-Venezia Giulia region and Trento province; students from University of Trieste and researchers from the Institute for Geo-Hydrological Protection, Italian National Research Council (CNR-IRPI), Padova. After the presentation of the prototype, one-page feedback forms were given to the participants and the analysis of 13 received feedback forms is presented in Figure 17 with the answers given by the participants.
Figure 17. Quantitative feedback (Average scores out of 13 responses).
Ijgi 04 01201 g017
There are five different categories in the form for rating the prototype: usefulness, innovativeness, user-friendliness, practice and supporting collaborative ability. As we can see from the average scores out of 13 responses given by the stakeholders, the usefulness and supporting ability of the platform achieved the best score out of the five categories rated as 3.8 (can be interpreted as good enough in terms of the scale of 5 used for the analysis). It can be concluded, in general, that the participants found the platform interesting, useful and supportive as a good instrument in decision making. During the discussion, the stakeholders mentioned their main interests in possibility of integrating cost-benefit analysis tool for comparison of alternatives and interactive spatial query tool for analysis of impacts of a certain hazard event in the exposed area. In addition, the stakeholders suggested the following aspects of the platform be improved:
  • the possibility to easily import available data,
  • the possibility to use available data of existing platforms,
  • the possibility of involving all stakeholders via web in the endangered areas,
  • the need to simplify the interface and the possibility to connect to external databases,
  • the balance (importance) of different experts’ opinions in reaching agreed alternatives,
  • the clarification of interactions with end-users (stakeholders) and
  • the definition of alternatives with interactive spatial query.

6. Conclusions

This paper presented the current state and development of a web-GIS based participative decision support platform in the field of risk management, especially focusing on the phase of risk prevention and mitigation of the disaster risk management cycle. The aim of the platform is to assist stakeholders (experts and decision makers) in managing the risk through a two-phase participative framework, where the experts can propose different risk mitigation alternatives and select the most appropriate one with the engagement of experts, decision makers and the community. This presented approach is considered as a two-way, iterative process in which decision makers and community can provide their feedback on proposed alternatives with the involvement of a moderator (expert). The development of such a platform can also be envisaged as a communication channel between different organizations in making decisions for risk management collaboratively as well as in disseminating information via a centralized online platform.
The conceptual framework of the platform is based on initial feedbacks, observations and stakeholder meetings carried out in the case study site and field visits. The platform is designed in a generic and flexible approach so that it can be applicable not only to the study area but also to other regions to achieve the high adaptability of the platform. Since the case-study oriented approaches need to re-design the framework based on the specific needs of the study areas, the applicability and adaptability of the applications can be quite limited. On the other hand, generic approaches could question the usability and functional requirements of the stakeholders as their interests could be varied depending on the study area. This prototype was implemented through the use of Boundless architecture and its SDK environment, it being easy and flexible, open-source architecture with extensible components for the prototype development.
This prototype platform was presented to local stakeholders of the study site. It can be further improved with preliminary feedback inputs given by stakeholders such as interactive spatial query (i.e., querying an area of interests or an administrative unit) to analyze the impacts of hazards on the exposed elements-at-risk. The inclusion of an interactive virtual playground would be especially useful for experts in re-analyzing new areas at risk after implementation of certain mitigation measures in the area. Metamodel approaches [42] could be considered to interactively examine the effects of mitigation measures at the abstract level for public and decision maker users. Furthermore, different ranking methods with sensitivity analysis and better visualization options could be integrated in the decision analysis module of the prototype. As a future perspective of this paper, we are considering implementation of these improvements in the next version of the platform and plan to make it open-source when all the components are completed.

Acknowledgments

The authors would like to express their heartfelt thanks to the local stakeholders and organizing team (CNR-IRPI, Padova) of the case study area, Malborghetto Valbruna, Fella River Basin of Italy for their valuable support, feedback and suggestions. We also like to acknowledge the research group having worked in the same case study site of CHANGES and IncREO (Increasing Resilience through Earth Observation, Grant Agreement No. 312461) projects for sharing of their research data, results and deliverables of the projects. This research is funded by the European Commission within the Marie Curie Research and Training Network “CHANGES: Changing Hydro-meteorological Risks as Analyzed by a New Generation of European Scientists” (2011–2014, Grant Agreement No. 263953) under 7th framework program.

Author Contributions

All the authors have contributed either conceptually or physically to materialize the development of this paper and conceptual framework of the prototype platform. Zar Chi Aye realized the design and development of the prototype and wrote the manuscript under the kind assistance, guidance and editing support of the remaining authors of the manuscript.

Conflicts of Interest

The authors declare no conflict of interest.

References

  1. United Nations. Hyogo Framework for Action 2005–2015: Building the Resilience of Nations and Communities to Disasters. Available online: http://www.unisdr.org/2005/wcdr/intergover/official-doc/L-docs/Hyogo-framework-for-action-english.pdf (accessed on 4 December 2014).
  2. United Nations International Strategy for Disaster Reduction (UNISDR). Global Assessment Report on Disaster Risk Reduction 2013, From Shared Risk to Shared Value: The Business Case for Disaster Risk Reduction. Available online: http://www.preventionweb.net/english/hyogo/gar/2013/en/gar-pdf/GAR2013_EN.pdf (accessed on 22 July 2014).
  3. Sigma study of Swiss Reinsurance Company: Swiss Re. Insured Losses in 2013 Were 45 Billion. Available online: http://www.swissre.com/media/news_releases/nr_20140326_sigma_insured_losses_in_2013.html (accessed on 16 December 2014).
  4. Freeman, P.K.; Martin, L.A.; Linnerooth-Bayer, J.; Mechler, R.; Pflug, G.; Warner, K. Disaster Risk Management: National Systems for the Comprehensive Management of Disaster Risk and Financial Strategies for Natural Disaster Reconstruction; IDB: Washington, DC, USA, 2003. [Google Scholar]
  5. United Nations International Strategy for Disaster Reduction (UNISDR). UNISDR Terminology on Disaster Risk Reduction, Geneva. Available online: http://www.unisdr.org/files/7817_UNISDRTerminologyEnglish.pdf (accessed on 3 December 2014).
  6. McCall, M.K.; Dunn, C.E. Geo-information tools for participatory spatial planning: Fulfilling the criteria for “good” governance? Geoforum 2012, 43, 81–94. [Google Scholar] [CrossRef]
  7. Faber, B.; Wallace, W.; Cuthbertson, J. Advances in collaborative GIS for land resource negotiation. In Proceedings of the GIS ’95 Symposium, Vancouver, BC, Canada, 27–30 March 1995.
  8. Jankowski, P.; Stasik, M. Spatial understanding and decision support system: A prototype for public GIS. Trans. GIS 1997, 2, 73–84. [Google Scholar] [CrossRef]
  9. Jankowski, P.; Nyerges, T. Geographic Information Systems for Group Decision Making: Towards a Participatory, Geographic Information Science; Taylor and Francis: New York, NY, USA, 2001. [Google Scholar]
  10. Meredith, T.; Yetmen, G.; Frias, G. Mexican and Canadian case studies of community-based spatial information management for biodiversity conservation. In Community Participation and Geographic Information Systems; Craig, W., Harris, T., Weiner, D., Eds.; Taylor and Francis: London, UK, 2002; pp. 205–217. [Google Scholar]
  11. Balram, S.; Dragicevic, S.; Meredith, T. Achieving effectiveness in stakeholder participation using the GIS-based Collaborative Spatial Delphi methodology. J. Environ. Assess. Policy Manag. 2003, 5, 365–394. [Google Scholar] [CrossRef]
  12. Steinman, R.; Krek, A.; Blaschke, T. Can online map-based applications improve citizen participation? In Proceedings of the Lecture Notes in Computer Science, Bolzano, Italy, 2–4 March 2005.
  13. Sugumaran, R.; Meyer, J.; Davis, J. A Web-Based Environmental Decision Support System (WEDSS) for environmental planning and watershed management. J. Geogr. Syst. 2004, 6, 1–16. [Google Scholar] [CrossRef]
  14. Simonovic, S.P.; Akter, T. Participatory floodplain management in the Red River Basin, Canada. Annu. Rev. Control 2006, 30, 183–192. [Google Scholar] [CrossRef]
  15. Zhang, Y.; Sugumaran, R.; McBroom, M.; DeGroote, J.; Kauten, R.L.; Barten, P.K. Web-based spatial decision support system and watershed management with a case study. Int. J. Geosci. 2011, 2, 195–203. [Google Scholar] [CrossRef]
  16. Ivanov, S.V.; Kovalchuk, S.V.; Boukhanovsky, A. Workflow-based collaborative decision support for flood management systems. Procedia Comput. Sci. 2013, 18, 2213–2222. [Google Scholar] [CrossRef]
  17. APFM. Social Aspects and Stakeholder Involvement in Integrated Flood Management; WMO: Gevena, Switzerland, 2006. [Google Scholar]
  18. Aaltonen, S.; Kreutz, E. Engage Your Stakeholders—Stakeholder Involvement Toolkit; UBC Commission on Environment (EnvCom): Turku, Finland, 2009. [Google Scholar]
  19. Munda, G. Social Multi-Criteria Evaluation (SMCE): Methodological foundations and operational consequences. Eur. J. Op. Res. 2004, 158, 662–677. [Google Scholar] [CrossRef]
  20. Kiker, G.A.; Bridges, T.S.; Varghese, A.; Seager, T.P.; Linkovjj, I. Application of multicriteria decision analysis in environmental decision making. Integr. Environ. Assess. Manag. 2005, 1, 105–108. [Google Scholar] [CrossRef]
  21. Zahedi, F. The analytic hierarchy process—A survey of the method and its applications. Interfaces 1986, 16, 96–108. [Google Scholar] [CrossRef]
  22. Saaty, T.L. Fundamentals of the analytic hierarchy process. In the Analytic Hierarchy Process in Natural Resource and Environmental Decision Making; Schmoldt, D.L., Kangas, J., Mendoza, G.A., Pesonen, M., Eds.; Kluwer Academic Publishers: Dordrecht, The Netherlands, 2001; pp. 15–35. [Google Scholar]
  23. Mendoza, G.A. Goal programming formulations and extensions: An overview and analysis. Can. J. Forest Res. 1987, 17, 575–581. [Google Scholar] [CrossRef]
  24. Romero, C. Handbook of Critical Issues in Goal Programming; Pergamon Press: Oxford, UK, 1990. [Google Scholar]
  25. Roy, B. Classement et choix en présence de points de vue multiples (la méthode ELECTRE). RIRO 1968, 8, 57–75. [Google Scholar]
  26. Zeleny, M. Compromise programming. In Multiple Criteria Decision Making; Cochrane, J.L., Zeleny, M., Eds.; University of South Carolina Press: Columbia, SC, USA, 1973; pp. 262–301. [Google Scholar]
  27. Zeleny, M. Linear Multiobjective Programming; Springer Verlag: Berlin, Germany, 1974. [Google Scholar]
  28. Nirupama; Simonovic, S.P. A Spatial Fuzzy Compromise Approach for Flood Disaster Management; The University of Western Ontario: London, UK, 2002. [Google Scholar]
  29. Simonovic, S.P. Systems Approach to Management of Disasters: Methods and Applications; Wiley & Sons Inc.: New York, NY, USA, 2010. [Google Scholar]
  30. Lansdowne, Z.F. Ordinal ranking methods for multi-criteria decision ranking. Nav. Res. Logist. 1996, 43, 613–627. [Google Scholar] [CrossRef]
  31. Wei, Q.; Yan, H.; Ma, J.; Fan, Z. A compromise weight for multi-criteria group decision making with individual preference. J. Op. Res. Soc. 2000, 51, 625–634. [Google Scholar] [CrossRef]
  32. Barzilai, J.; Lootsma, F.A. Power relations and group aggregation in the multiplicative AHP and SMART. J. Multi-Criteria Decis. Anal. 1997, 6, 155–165. [Google Scholar] [CrossRef]
  33. Alesheikh, A.A.; Helali, H.; Behroz, H.A. Web GIS: Technologies and its applications. In Proceedings of the Symposium on Geospatial Theory, Processing and Applications, Ottawa, ON, Canada, 9–12 July 2002.
  34. Kobben, B.; Lemmens, R.; Husiman, O. Client Server Architectures; University of Twente: Enschede, The Netherlands, 2010. [Google Scholar]
  35. Sun, A. Enabling collaborative decision-making in watershed management using cloud-computing services. Environ. Model. Softw. 2013, 41, 93–97. [Google Scholar] [CrossRef]
  36. Boundless. Available online: http://boundlessgeo.com/ (accessed on 16 December 2014).
  37. Scolobig, A.; Castn Broto, V.; Zabala, A. Integrating multiple perspectives in social multicriteria evaluation of flood-mitigation alternatives: The case of Malborghetto-Valbruna. Environ. Plan. C Gov. Policy 2008, 26, 1143–1161. [Google Scholar] [CrossRef] [Green Version]
  38. Prenger-Berninghoff, K.; Cortes, V.J.; Sprague, T.; Aye, Z.C.; Greiving, S.; Głowacki, W.; Sterlacchini, S. The connection between long-term and short-term risk management strategies: Examples from land-use planning and emergency management in four European case studies. Nat. Hazards Earth Syst. Sci 2014, 14, 3261–3278. [Google Scholar] [CrossRef]
  39. Hussin, H.Y.; Ciurean, R.; Frigerio, S.; Marcato, G.; Calligaris, C.; Reichenbach, P.; Van Westen, C.J.; Glade, T. Assessing the effect of mitigation measures on landslide hazard using 2D numerical runout modelling. In Landslide Science for a Safer Geoenvironment; Sassa, K., Canuti, P., Yin, Y., Eds.; Springer: Berlin, Germany, 2014; pp. 679–684. [Google Scholar]
  40. CHANGES. Available online: http://www.changes-itn.eu/ (accessed on 16 December 2014).
  41. IncREO. Available online: http://www.increo-fp7.eu/ (accessed on 16 December 2014).
  42. Sun, A.Y.; Miranda, R.M.; Xu, X. Development of multi-metamodels to support surface water quality management and decision making. Environ. Earth Sci. 2015, 73, 423–434. [Google Scholar] [CrossRef]

