Article

Excitation and Adaptation in Bacteria–a Model Signal Transduction System that Controls Taxis and Spatial Pattern Formation

1
School of Mathematics, University of Minnesota, Minneapolis,MN 55455, USA
2
Department of Mathematics, Ohio State University, Columbus, OH 43210, USA
*
Author to whom correspondence should be addressed.
Int. J. Mol. Sci. 2013, 14(5), 9205-9248; https://doi.org/10.3390/ijms14059205
Submission received: 1 February 2013 / Revised: 20 March 2013 / Accepted: 22 March 2013 / Published: 26 April 2013
(This article belongs to the Special Issue Signalling Molecules and Signal Transduction in Cells)

Abstract

:
The machinery for transduction of chemotactic stimuli in the bacterium E. coli is one of the most completely characterized signal transduction systems, and because of its relative simplicity, quantitative analysis of this system is possible. Here we discuss models which reproduce many of the important behaviors of the system. The important characteristics of the signal transduction system are excitation and adaptation, and the latter implies that the transduction system can function as a “derivative sensor” with respect to the ligand concentration in that the DC component of a signal is ultimately ignored if it is not too large. This temporal sensing mechanism provides the bacterium with a memory of its passage through spatially- or temporally-varying signal fields, and adaptation is essential for successful chemotaxis. We also discuss some of the spatial patterns observed in populations and indicate how cell-level behavior can be embedded in population-level descriptions.

1. Introduction

Most organisms have developed signal detection systems that extract information from their environment to enable them to find food and mates, initiate developmental changes, avoid harmful environments or execute any of the multitude of actions and behaviors in their repertoire. Since most organisms maintain a clear distinction between inside and outside, many primary environmental signals do not penetrate the organism very far, and therefore mechanisms for transducing an external signal into an internal signal, and where appropriate, an internal response are needed. For example, at the cellular level extracellular hydrophilic first messenger signals elicit a response via receptors in the cell membrane that transduce the signal into an intracellular second messenger signal. Similarly, in the sensory systems of higher organisms light or mechanical stimuli are transduced into an electrical signal that is processed at a higher level. The overall process from signal to response in E. coli, the model system described in detail later, can be summarized as follows.
Ijms 14 09205f11
The response at the individual level to changes in the signal involves changes in the bias of the flagellar motor, and this can also lead to a response in the form of spatial pattern formation at the population level.
Signal transduction systems often filter the signal as well, since not all features of a signal are equally important. Often the important information in a signal is the short-term change in amplitude, rather than the absolute amplitude itself, and many systems have evolved to ignore constant background signals, yet remain responsive to changes in the signal. In such systems a step change in the signal from one constant level to another may elicit a transient change in one or more components of the internal state and some behavior of the organism, followed by a return to a basal level of that component or behavior. The process that leads to termination of the response in the face of a constant stimulus is called desensitization, habituation, or adaptation, depending on the context, but here we use adaptation when the stimulus does not provoke any gross rearrangements or alterations in the signal-processing machinery, whereas desensitization may involve structural changes such as the degradation of receptors. The visual system and mechanoreceptors in the dermis of mammals provide examples of adaptation to certain stimuli, but this capability is very common in sensory systems. In general adaptation also involves maintenance of sensitivity to further changes in the signal, and here we define an adapting sensory system as one that responds transiently to a transient change in the signal, returns to a basal activity level in the presence of a prolonged constant stimulus, and retains sensitivity to further changes in the stimulus. These characteristics are shown schematically for another cellular model system in Figure 1; detailed models of adaptation in E. coli will be discussed later. Clearly adaptation represents a form of memory, since having it in a signal transduction system enables the organism to avoid responding to a constant signal when such a response is not advantageous. In addition, by adapting to background levels of a signal (or equivalently, changing the sensitivity to the amplitude of signals) the sensory system can process a far greater range of amplitudes. In fact the range of signal amplitudes that can be tolerated is enormous. For example, the visual system in certain amphibians can detect and respond to light stimuli whose amplitude ranges over five or more orders of magnitude [2].

2. Signal Transduction in E. coli

At the cellular level and higher, the response to environmental signals frequently involves taxis, which is directed movement toward or away from an external stimulus. If it is toward the stimulus the taxis is positive, and otherwise it is negative. Many different types of taxis are known, including aerotaxis, chemotaxis, geotaxis, haptotaxis, and others. The purposes of taxis range from movement toward food and avoidance of noxious substances to large scale aggregation for the purpose of survival. The process by which a cell alters its speed or frequency of turning in response to an extracellular chemical signal is also frequently called chemotaxis, although it is more accurate to describe it as chemokinesis. Chemotaxis in this broader sense has been most thoroughly studied in the peritrichous bacteria Escherichia coli and Salmonella Typhimurium, particularly in E. coli. In this section, we first discuss the chemotactic behavior of E. coli, then describe the biochemical aspects of the signal transduction system. Later we discuss mathematical models and analysis of the system.

2.1. Cell Movement and Taxis

E. coli cells move by rotating rigid flagella in a corkscrew-like manner [3]. Each cell contains 6–8 flagella distributed uniformly over the cell surface, and when rotated counterclockwise (CCW), the flagella coalesce into a propulsive bundle, resulting in a relatively straight “run” [4]. When rotated clockwise (CW) they fly apart, resulting in a “tumble” which reorients the cell but causes no significant change of location. The cell thus alternates between runs and tumbles. In the absence of stimuli, the probability of a tumble is essentially independent of when the last tumble occurred [5]. The mean run interval is about 1 s in the absence of chemotaxis; the mean tumble interval is about 0.1 s [6]. Both are distributed exponentially, with shorter intervals more probable. The mean run length is 35 μm [6], and the speed may range from 20 to 60 μm s1 [5]. Because of rotational Brownian movement, runs are not perfectly straight, and cells can veer off course by as much as 90° in 10 s [6]. The angles between two successive runs appear to be gamma distributed [7], with a mean of 68° in a medium of low viscosity and 103° in one of medium viscosity [7,8]. In the absence of chemotaxis, the diffusion constant of cells in liquid culture is around 4.8 − 5.2 × 106cm2s1 [6,9].
A chemoeffector alters the probabilities that the flagella will rotate in a given direction, thereby changing the frequencies of runs and tumbles, and these probabilities change in response to temporal changes in the chemoeffector concentrations detected by the cell. A transient increase in the concentration of an attractant or a decrease in that of a repellent leads, after a 0.2 s. latency period, to an increase in the probability of counterclockwise rotation (p(CCW)) above the baseline probability of 0.64 [4]. For modest steps p(CCW) reaches a maximum at 0.4 s, crosses below the baseline at 1 s, reaches a minimum at 1.5 s, and returns to the baseline at about 4 s. A ramp or spatial gradient must exceed a threshold level in order to elicit a response [10]. A decrease in attractants or increase in repellents causes a decrease in p(CCW) [4], and the response is more rapid than that for a positive gradient. However, the response threshold for a negative gradient is large, so that p(CCW) remains at baseline for most negative gradients encountered in the wild [6]. When a gradient exceeds threshold, it is found experimentally that p(CCW) is proportional to the time derivative of the level of chemoreceptor occupancy, and this relationship holds for concentrations in a range near the receptor dissociation constant [10].
E. coli respond chemotactically to a variety of attractants and repellents over a range of concentrations which exceed a threshold concentration but do not saturate a cell’s receptors [6]. The response to aspartate may range over 5 orders of magnitude [11], with a threshold of 3 × 10⁸ M [12] or 6 × 10⁸ M [13] (depending on what medium and form of aspartate are used) and a peak chemotactic response at 102 M[13]. The response is sensitive to changes in aspartate occupancy of 0.1–0.2%, which corresponds to the binding of one or two ligand molecules per cell [11]. If we define the gain in signal transduction as the change in rotational bias divided by the change in receptor occupancy, the gain can be as high as 55 [14]. If we define the upstream signaling gain as the ratio of the relative change in kinase activity divided by the change in receptor occupancy, it is up to 35 [15].

2.2. The Biochemistry of Signal Processing in E. coli

Two essential properties of the E. coli chemotaxis are excitation and adaptation, which stem from a signal processing system comprised of five chemoreceptor types–(Tsr - taxis to serine and repellents, Tar-taxis to aspartate and repellents, Tap - taxis to dipeptides, Trg-taxis to ribose and galactose, and Aer-taxis to oxygen) and six Che-proteins (CheA, CheW, CheY, CheZ, CheR, and CheB). The signal transduction pathway based on these proteins is depicted in Figure 2 and discussed below.
Chemoreceptors are the transmembrane methyl-accepting chemotaxis proteins (MCP) that bacteria use to detect chemicals, light, or temperature. Among the five classes, Tsr and Tar are the major-type receptors with a few thousand copies per cell; Tap, Trg, and Aer are the minor types with a few hundred copies per cell. The functional form of chemoreceptors is a helical, intertwined homodimer. Each monomer consists of a variable periplasmic ligand-binding domain, a transmembrane domain, and a conserved cytoplasmic signaling domain. The ligand-binding domain contains a four-α-helix bundle (α1–α4 in Figure 3) arranged in parallel to form a cluster of eight helices in the dimer [16]. The helices α1 and α4 of the bundle extend to the helices TM1 and TM2 of the transmembrane domain respectively, and TM2 is linked to the cytoplasmic domain. The molecular symmetry generates two ligand-binding sites, each at the dimer interface within the quasi-four-helix bundle near the top of the molecule, distal from the membrane. Aspartate binding is negatively cooperative in that binding of an aspartate to either site causes an asymmetric change in the dimer that precludes binding at the second site.
The cytoplasmic domain extends from the transmembrane domain and bends back via a “U” turn (α5–α9 in Figure 3) [17]. This domain is highly conserved and the degree of sequence identity is maximal in the “U” turn region and declines away from the center [18,19]. The cytoplasmic domain consists of four primary functional regions: (1) histidine kinase, adenylyl cyclase, methyl-binding proteins and phosphatase (HAMP) region (α5 in Figure 3); (2) adaptation region, including two helixes (α6 and α9 in Figure 3); (3) flexible bundle region; and (4) signaling region (α7 and α8 in Figure 3). The structure of the HAMP subdomain is proposed as two amphiphilic helices joined by a connector in the monomer and a parallel, four-helix bundle in the dimer, which fits the role in converting ligand-binding conformational changes into intracellular signaling [20,21]. The subdomains (2)–(4) in the homodimer is a continuous four-α-helix, antiparallel coiled-coil containing two helixes from each monomer with a hairpin turn at its membrane distal end [17]. The adaptation region of each monomer contains four or more glutamyl residues, glutamate (E) or glutamine (Q), located midway along the coiled-coil (circles shown in Figure 3), which can be modified by the methyltransferase CheR and the methylesterase CheB [2224]. These residues are spaced in heptad repeats along one face of each helix [25]. The flexible bundle region contains a conserved glycine hinge consisting of six glycine residues in a plane helix bundle in each monomer, which allows its long axis to bend 10° [26,27]. The region is known to be crucial for kinase control in that substitution of larger residues for glycine locks the receptor in the kinase-on or -off state [27]. The signaling region, bracketing the hairpin turn, is highly conserved and serves as a substrate for interaction with CheA and CheW [22]. The carboxyl terminus of Tar and Tsr carries a conserved pentapeptide (NWETF or NWESF) that binds with CheR and CheB [28,29].
In addition to the chemoreceptors, the excitation phase involves a two-component signal transduction system to controlmotor behavior, based on CheA, a histidine protein kinase (HPK), and CheY, a response regulator. HPK is linked to a sensory unit that detects changes in the environmental condition and when activated by the unit, the kinase catalyzes phosphotransfer from ATP to its own histidine residue. The response regulator, when phosphorylated by HPK, acts directly to modify the bias of the motor, and thereby leads to a change in cellular behavior. In E. coli CheA, which functions as a dimer, associates with receptors as well as with a monomeric protein CheW, which serves as a scaffold for receptor and CheA, to form stable ternary signaling complexes. The complexes sense environmental changes and regulate autophosphorylation of CheA in the presence of ATP. Attractant binding or repellent release inhibits the kinase activity; attractant release or repellent binding promotes it. CheY, reversibly bound to CheA, is phosphorylated by CheAp and then diffuses to the flagellar motors. CheYp binds to the protein FliM at the base of the motors and changes the rotational bias of the flagella, enhancing the probability of clockwise rotation (p(CW)) and therefore promoting the tumbling of the cell. The dimeric protein phosphatase CheZ assists in dissipating CW signals by forming CheYp–CheZ oligomer and enhancing dephosphorylation of CheYp. In E. coli and S. typhimurium, the gene cheA encodes two forms of CheA: the full-length CheAl, which plays an essential role in chemotaxis, and the short CheAs, which lacks the phosphorylation site [31]. CheZ binds to the N-terminus of CheAs and forms mixed oligomers, and the CheAs-CheZ complex formed in vitro shows a greater dephosphorylation activity on CheYp than free CheZ [31,32]. Therefore, CheAs contributes to recruiting CheZ to the signaling complexes and then CheZ-dependent localization of CheY [33,34].
The adaptation phase involves CheR and CheB, proteins involved in changes of the methylation level of chemoreceptors. CheR methylates glutamate (EEM); CheB demethylates glutamate (EME) and deamidates glutamine to glutamate (QE). The activity of CheR is unregulated, whereas that of CheB is strongly enhanced upon phosphorylation by CheAp thus CheB is activated by feedback signals from the signaling complexes, which generates a negative feedback loop. The methylation level of a receptor affects the autophosphorylation rate of CheA, in that each addition of a methyl group increases CheA activity and each removal of a methyl group decreases CheA activity. Since methylation by CheR counteracts the effect of attractant binding or repellent release and demethylation by CheB counteracts the effect of attractant release or repellent binding, they are responsible for the relatively slow phase of adaptation to stimuli after the initial excitation phase. CheR is targeted to receptors through binding to the C-terminal pentapeptide sequence NWETF or NWESF that two major chemoreceptors Tar and Tsr contain, which the minor types do not [35]. The low-abundance receptors lack the docking site for CheR and are defective in methylation. They stimulate kinase only weakly in vitro and cannot support chemotaxis when expressed alone, but they mediate strong responses to stimuli in wild-type cells. One explanation could be that methylation occurs via an inter-dimer process. It has been found that CheR bound to one monomer in a Tsr dimer catalyzes the addition of methyl groups to a monomer in an adjacent dimer [36]. CheB also binds to the pentapeptide sequence, but with a much lower affinity than CheR. Interaction of CheB with the sequence activates demethylation by allosterically activating the receptor substrate and thereby increasing the reaction rate, whereas CheR binding at the sequence increases the enzymatic activity near the methyl-accepting glutamates [37].
The high signaling sensitivity and wide response range in E. coli chemotaxis probably stem from chemoreceptor clustering [38,39]. Though the exact organization of chemoreceptor clusters has not been determined unequivocally, it is known that chemoreceptors form stable homodimers [16,4044], that three homodimers assemble into a trimer of dimers [17,4548], that a large number of trimers cluster into an approximately hexagonal array [4955], and that several arrays localize at the cell poles [38]. First, the trimer of dimers is formed through direct dimer-dimer interaction at the helical hairpin tips, and the trimer contact residues are identical in all five types of chemoreceptors [17]. The homodimers within a trimer can be either pure-type or mixed-type, which reflects the relative cellular abundance [46]. Receptors still form trimers of dimers in the absence of other chemotactic proteins [46], but without CheA or CheW, trimers exchange their dimer members, and in the presence of both, the exchanges do not take place [47]. Thus, CheA and CheW stabilize trimer assemblies, probably through binding interaction with receptors. However, overexpression of CheWinterferes with trimer formation, probably because bound CheW masks the trimer contact surfaces [47,56], and CheW competes for binding sites on receptors with CheA [57,58]. The stoichiometry of receptors, CheA and CheW in the ternary signaling complex has not been firmly established. Though several earlier studies reported different results [5861], the recent studies presented the consistent stoichiometry of MCP : CheA : CheW = 6 : 1 : 1, suggesting that the ternary signaling complex is composed of 2 trimer of MCP dimers, 1 CheA dimer, and 2 CheW monomers [54,55,62]. An in vivo study estimates the stoichiometry as 3.4 receptor dimers/1.6 CheW monomers/1 CheA dimer, suggesting that the ternary signaling complex is composed of one trimer of MCP dimers, one CheA dimer, and two CheW monomers [61]. Secondly, in respect to the larger patches of MCP-CheA-Chew signaling complexes that are roughly hexagonally packed, about 80 percent are located at one or both cell poles and the rest are distributed in non-polar, lateral patches at future division sites [63]. The polar patches are mobile within the curved membrane of the pole, and the lateral patches are fixed [63]. The patches appear circular or ellipsoid with varying sizes and an average diameter 250 nm [61]. The patch size is not variable with the expression level of MCP, CheA and CheW, and the packing density is slightly variable with the culture conditions [53]. Recently, two imaging studies show that the hydrophobic interaction between CheW and CheA (the P5 regulatory domain) connects the trimer of dimers into an extended hexagonal receptor array [54,55]. Lastly, as to polar localization, knock-out of CheA or CheWreduces the number and size of polar patches, especially CheW, while CheY, CheZ, CheB and CheR are not required [38,64]. Localization and clustering seem independent since the minor receptors Trg and Tap are deficient in clustering if locked in the state of fully inhibited CheA, but polar localization is not altered [65].
With the preceding description of the structure of the chemoreceptor clusters, which involve multiple levels of organization, at hand, we discuss the structure-function relationship (summarized in Table 1). The receptor homodimer is the minimal stable structural unit of receptor clusters. A single homodimer is able to perform ligand binding, signal transmission from periplasm to cytoplasm, and adaptational modification, all of which are not dependent on the dimer-dimer interaction, but fails to perform CheA kinase activity control and thus chemotactic response [48,66]. The trimer of dimers is a core structure in chemoreceptor clusters and plays a central role in the signaling function. It is structurally the smallest stable signaling complex when bound with CheA and CheW [17,4547], and serves as the architectural unit of the larger receptor array [4953]. Functionally, the trimer of dimers is the minimal signaling unit, and is necessary for most of the functions (Table 1). The homodimer fails to control CheA kinase activity, and compared to other larger clusters, the trimer of dimers has the maximal kinase activation [48,66]. The interaction among dimers within a trimer is probably more important for the signaling function than the longer-range interaction among trimers, considering that the extremely high cooperativity of receptors (the Hill coefficient measured in kinase activity responses is larger than 3) is only observed in two special cases, the responses by the cheRcheB mutant cells with Tar or Tsr highly overexpressed [39] or by the receptor Tsr in vitro [67], while in wild-type cells and other cheRcheB mutant strains, the cooperativity is moderate (the Hill coefficient is less than 3). A recent study on CheW provides indirect support for the central role of the trimer of dimers, in that chemotaxis is reduced in cells with CheW overexpressed, because the excess level of CheW prevents trimer formation [56]. In evolutionary terms, the structural unit of a trimer of dimers and the underlying signaling mechanism are highly conserved and could be a universal architecture for many bacterial species [52].
Finally, we discuss the conformational aspect of the signaling mechanism of receptor clusters. A homodimer is usually treated as a two-state (active or inactive) switch. Ligand binding, methylation/demethylation, and interaction with neighboring receptors can shift the equilibrium-between the two signaling states in a dimer. In more detail, attractant binding initiates a piston-like sliding of the transmembrane signaling helix (TM2 in Figure 3) towards the cytoplasm along its long axis perpendicular to the membrane, by ~ 0.15 nm [68], and adaptional modification reverses the motion and drives the movement towards the periplasm. The conformational signaling of the HAMP region is not clear yet, but presumably it interconverts the ligand binding-induced sliding of the transmembrane helix and the conformational change of the adjacent adaptation region. The signal conversion should not involve large helical displacements in that the HAMP domain, which is constrained by disulfides across the two helices or the adjoining subunit interface, still transmits the attractant-generated signals [21,44]. The conformational signaling of the adaptation region involves weakening or strengthening the subunit interactions of the domain corresponding to the off or on state, respectively. The ligand binding-induced signal changes the subunit interface (destabilized by attractants and stabilized by repellents) through mechanical forces [44,69], and methylation/demethylation alters the interface via electrostatic forces [70]. Specifically, the glutamates and several other side chains located in the interface are anionic, and covalent neutralization of them by methyl esterification or amidation stabilizes the interface and activates the kinase. The flexible bundle region enables the cytoplasmic domain to bend and/or twist, increasing (kinase deactivation) or decreasing (kinase activation) its flexibility. The conformational change of the signaling region is still under investigation, but like the adaptation region, the subunit interface seemingly plays an important role here in that some mutations at interfacial locations lock the receptor in the active state [44,71]. When extending conformational signaling to the scale of trimers of dimers, a recent study proposes a two-state model for kinase control (trimer expansion or closing, corresponding to kinase deactivation or activation, respectively) [68]. Attractant binding drives piston sliding of the transmembrane helix in one dimer member of a trimer, then the displacement induces bending of the dimer around the HAMP domain, and finally the trimer of dimers expands, leading to kinase deactivation. Two other conformational changes have been suggested to take place when the trimer of dimers changes states [30], rotation of the periplasmic domain of each dimer about its long axis [72], and tilting of dimers relative to the central trimer axis [73,74], both of which could be driven by the change in flexibility of the four-helix bundle in the cytoplasmic domain [27,70]. With respect to the larger receptor clusters, the mechanism remains open. The advanced imaging for chemoreceptor arrays by cryoelectron tomography suggests that the interconnected CheA and CheW proteins might serve the molecular basis for the conformational spread throughout the receptor array of an attractant signal originating at one MCP dimer [54,55]. A more comprehensive review is given in [30]; we turn next to some general considerations about excitation and adaptation and then describes mathematical models of signal transduction in E. coli.

3. Models of Signal Transduction and Adaptation

The chemotaxis signal transduction system in E. coli must cope with a wide range of changes in ligand levels that are transduced into the bias of the flagella via the level of CheYp. It was predicted theoretically [75] and later verified experimentally [76] that much of the observed gain arises either in the interaction of CheYp with the motor, or from interaction between motor subunits. As a result, small changes in CheYp are strongly amplified in either or both of these steps, and therefore it is necessary that CheYp return to a level close to its prestimulus value after a change in ligand concentration. Otherwise there would only be a narrow range of ligand concentrations over which the bias does not saturate (at one or zero). Thus to maintain both sensitivity and responsiveness to a wide range of ligand levels, it is necessary that the tumble signal adapt, i.e., to return to a level very close to its prestimulus value, and if it returns to exactly its prestimulus level for all ligand concentrations we say that it adapts perfectly.
This raises the question as to how adaptation can be ensured in a system of chemical reactions. To illustrate that this is not easy to answer in general, we observe that for any network of chemical reactions, adaptation of a given component does not necessarily ensure adaptation of a particular species located further “downstream” in the kinetic pathway. This is demonstrated with several schematic counterexamples in Figure 4.
In addition to the problem inherent in specifying an upstream adapting quantity a priori, some models invoke unwarranted restrictions on the system’s kinetics in order to facilitate calculation of the steady state levels of the upstream quantity. Goldbeter and Koshland [77] assume that a receptor cannot be both methylated and free of ligand at the same time. Asakura and Honda [78] likewise assume that certain receptor states cannot be attained, and further assume that the ratio of the methylation and demethylation rates is the same for each methylation state, that a receptor generating a tumble signal cannot be methylated, and that an attractant-bound receptor can neither be demethylated nor generate a tumble signal, regardless of its methylation state.

3.1. Adaptation in Model Systems
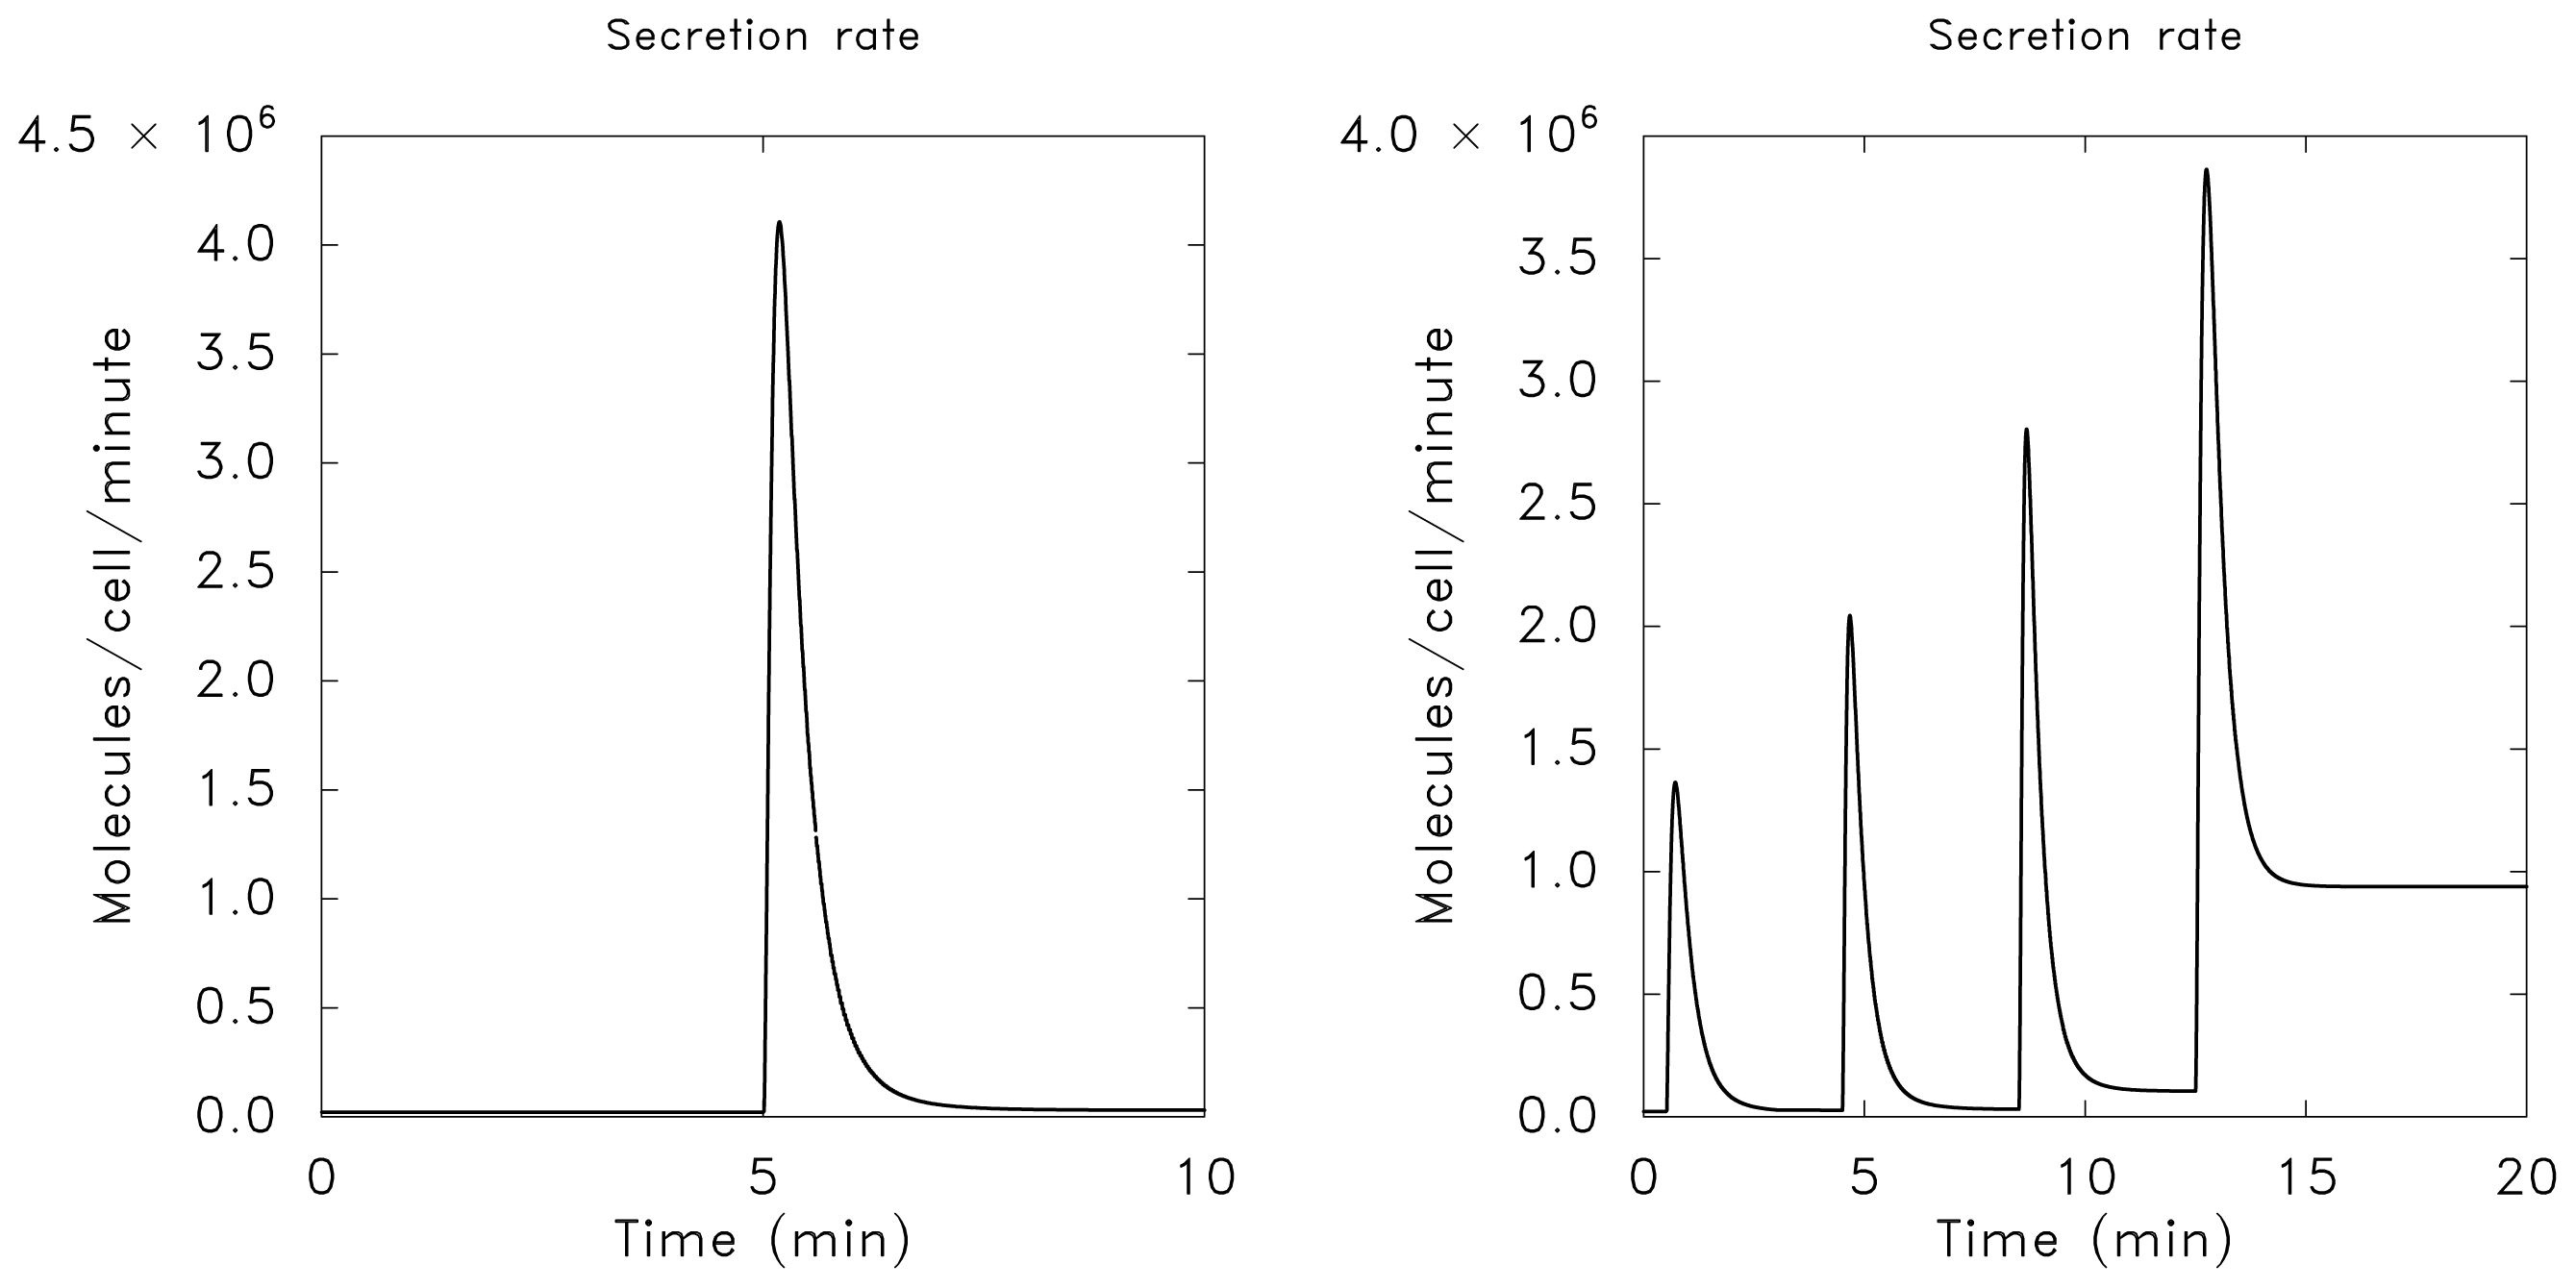
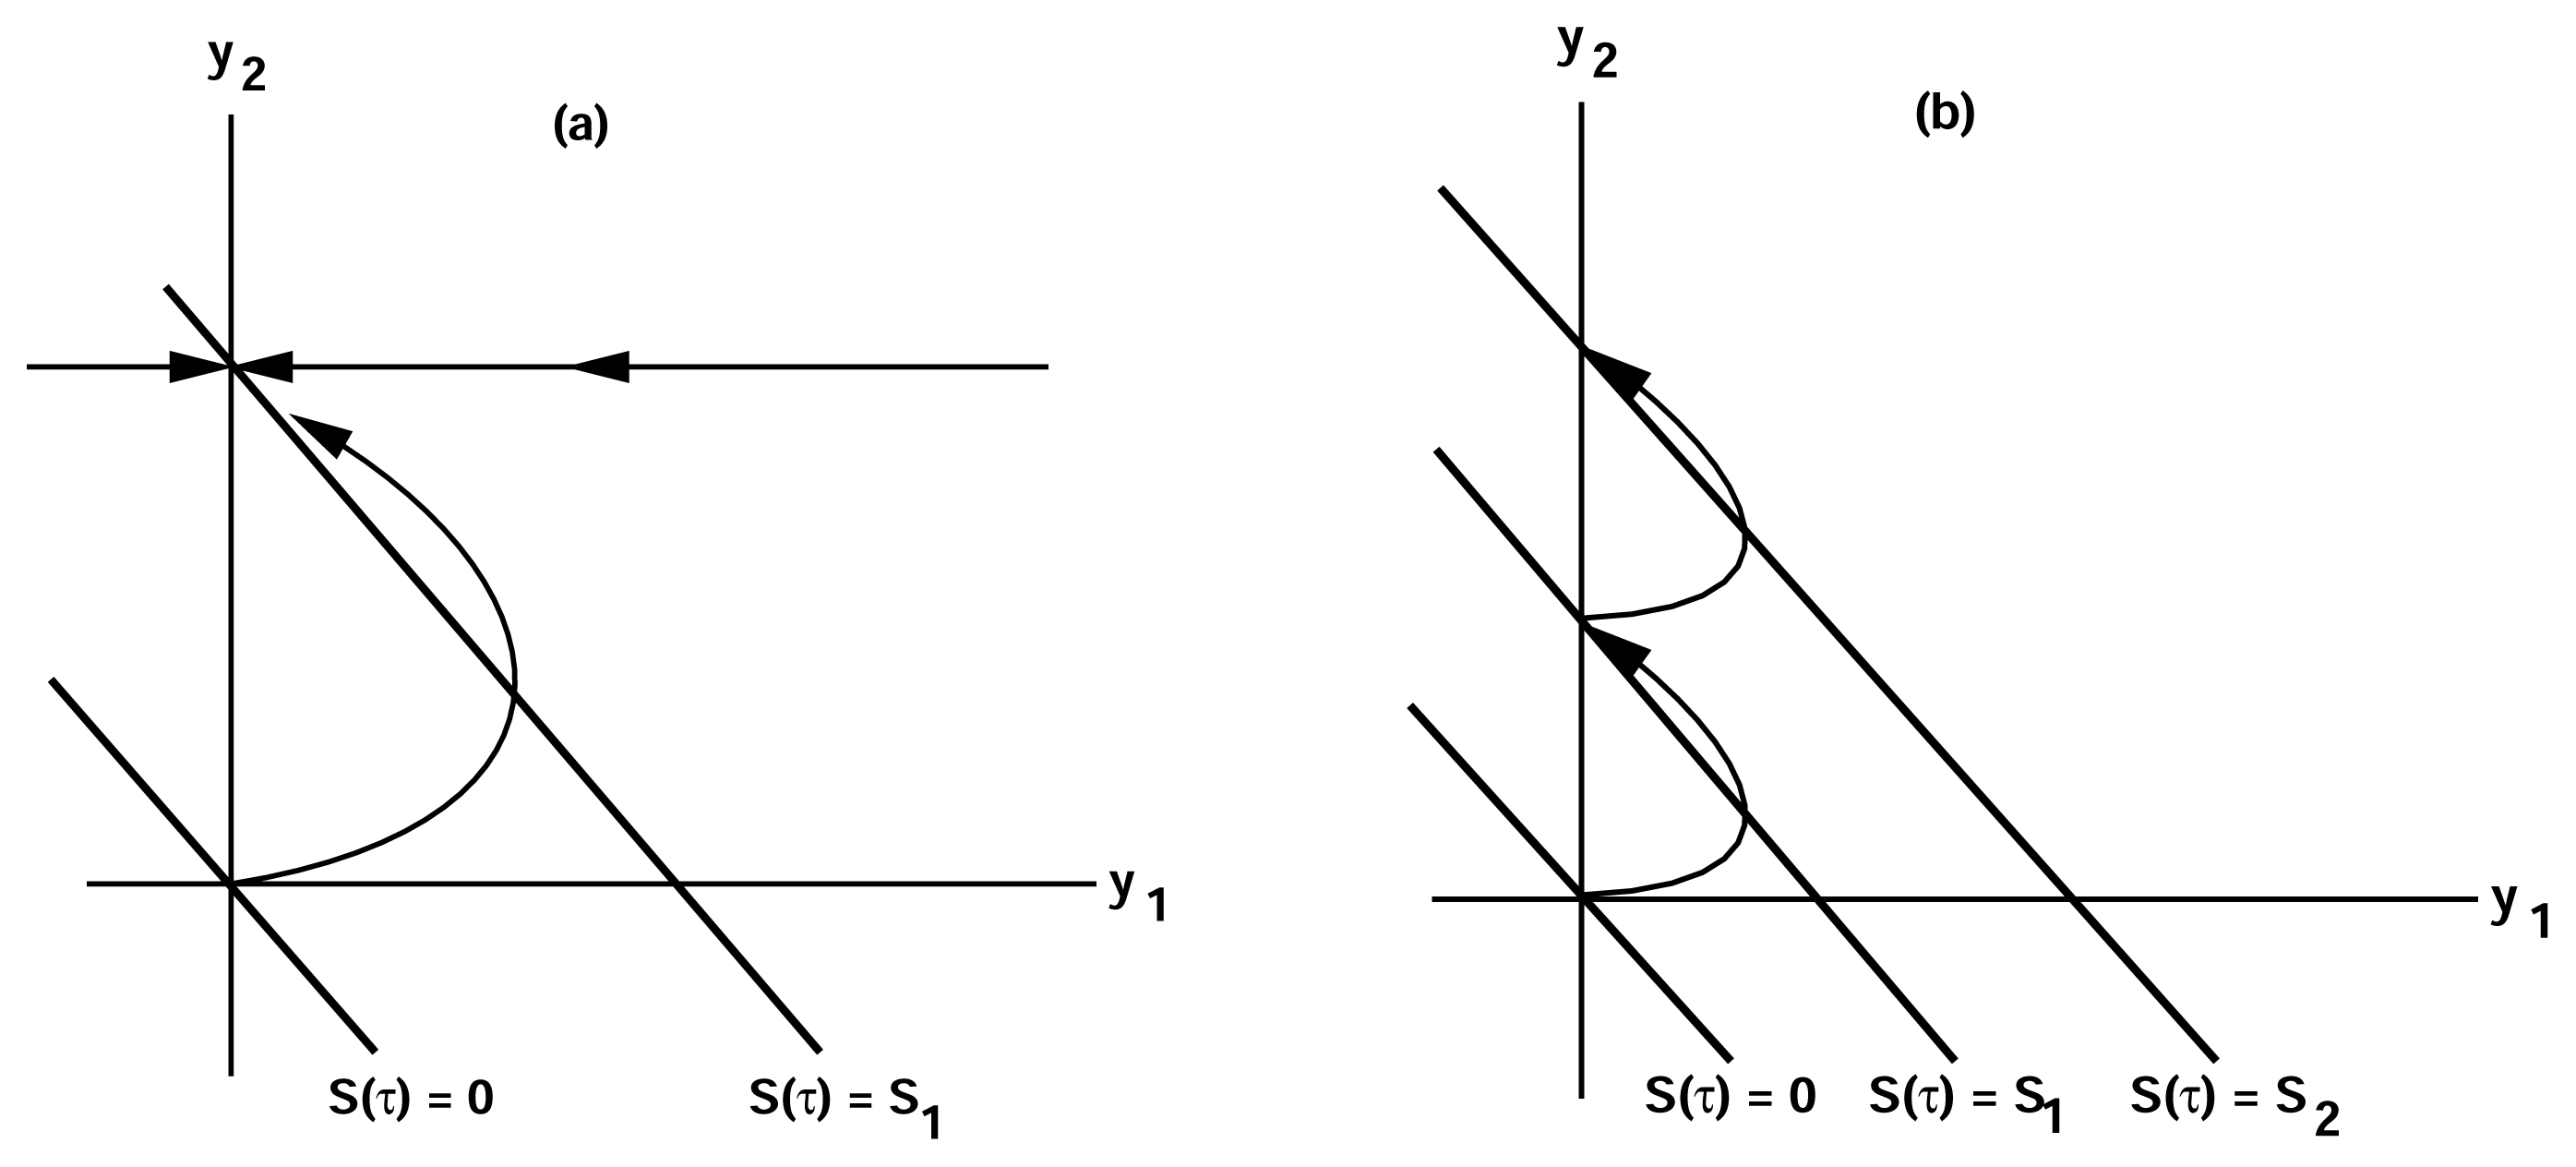
In view of the fact that ad hoc assumptions may lead to models with limited applicability, we present a method for determining relations among rate constants which, where applicable, ensures that perfect adaptation occurs. The method is applicable to a variety of chemical systems, requires no a priori assumptions regarding a second adapting quantity, and places few restrictions on the kinetics. By perfect adaptation, we mean that there is a species in the transduction pathway whose concentration changes transiently in response to a change in the level of some stimulus, but whose steady state concentration is independent of the stimulus level. Our analysis deals with the question of what guarantees that the quantity in question returns to its basal level; the question of whether the transient response is suitable must be answered a case-by-case.
As we will see later, the signal transduction system in a single bacteriuum can be described by a finite number of state variables and an evolution equation that determines how the state changes under prescribed inputs or stimuli. We denote the state vector by u(·) ε Rn and write the evolution equation in the form
d u d τ = F ( u , S )
where S ε R represents the stimulus or input to the system. In general a change in S leads to a change in the transient and steady-state values of u, but in systems that adapt, some functional of u should be independent of S when S is time-independent. Thus suppose that the response of the system is a functional Ijms 14 09205f12 of the state u given as follows:
R ( τ ) = G ( u ( τ ) )
More generally, Ijms 14 09205f12 could depend on the derivatives of the state variables, their past history, or directly on the stimulus and its derivatives. If we only consider systems whose “basal dynamics” are time independent, which means that the system has an asymptotically stable steady state in the presence of any constant stimulus, we can define perfect adaptation to constant stimuli as follows.
Definition 1The response of a system whose dynamics are governed by Equation (1) is said to adapt to constant stimuli if the steady state response is independent of the magnitude of the stimulus S.
Evidently this definition allows for the trivial case when F is independent of S, in which case there is no change in response to any changes in S. Furthermore this definition of adaptation does not imply that the steady state values of all variables must be independent of S, and in fact some of the state variables must generally change to compensate for the stimulus changes. In the case of E. coli the methylation level compensates for the background signal level, and thus does not adapt. The reader can consult [75,77,7981] for a review of models that involve adaptation, including some for bacterial chemotaxis and adenylyl cyclase. A very general result that defines the structure necessary in a dynamical system in order that it can adapt is given in [82].
A widely-used model system that illustrates some of the essential features of an adaptive system is given as follows. Suppose that there are two internal state variables u1 and u2, and that these variables evolve according to the following equations.
d u 1 d τ = f ( S ( τ ) ) - ( u 1 + u 2 ) τ e d u 2 d τ = f ( S ( τ ) ) - u 2 τ a
In these equations the function f(·) encodes the signal transduction steps, and it should have the property that f(0) = 0. For concreteness we suppose that the response is proportional to u1, i.e., Ijms 14 09205f12 (u(τ)) = au1(τ) where a is a constant. Then this simple scheme can be viewed as having two input pathways, an excitatory one in which the stimulus increases the production of u1 and hence increases the response, and an inhibitory one that increases the production of u2, which in turn shuts off the response.
Since this system is linear, the solution can be obtained by quadrature once the stimulus is specified. For the special case in which u1(0) = u2(0) = 0 and S(τ) is a step function of amplitude S0 that turns on at τ = 0, the solution is as follows.
u 1 = f ( S 0 ) τ a τ a + τ e ( e - τ / τ a - e - τ / τ e ) u 2 = f ( S 0 ) ( 1 - e - τ / τ a )
Thus the response occurs on two time scales, the scale of excitation, which is characterized by τe, and the scale of adaptation, which is characterized by τa. From this one sees that if τe<< τa, then whenever τ >> τe, u1 relaxes to
u 1 ~ f ( S 0 ) e - τ / τ a f ( S 0 ) - u 2 ( τ )
This is just the pseudo-steady-state value of u1 which is gotten by setting du1/dτ = 0. On the other hand, if τa<< τe then adaptation is rapid compared to excitation, u1 never rises significantly above zero, and there is no significant response. The typical response for a single step in the stimulus when τe< τa is shown in Figure 5(a), where one can see that when the system begins at (u1, u2) = (0, 0) neither u1 nor u2 exceed S1. The response to two step changes that are well separated compared to the adaptation time are shown in Figure 5(b).
We note from Equation (3) that when the stimulus S(τ) is constant the steady state level of u1 is zero, i.e., the response adapts perfectly to any constant stimulus, but the level of u2 does not adapt. Moreover, when τe<< τa the system is excitable in the following sense. The rest state in the absence of a stimulus ((u1, u2) = (0, 0)) is asymptotically stable, but a brief stimulus of the proper type can produce a significant response, followed by a return to the steady state. Thus if f is linear, if the system is initially at (0, 0), and if S(τ ) = S1 for τ ε (0, τe) and zero thereafter, then u1 will rise to approximately 2S1/3 and then return to zero. Usually an excitable system is considered as one that has a threshold and shows an all-or-nothing response, such as the firing of a neuron, depending on the magnitude of the stimulus. In contrast to this, the response of the present system is graded in that there is a response to any stimulus level. Other excitable systems that show a graded rather than an all-or-none response occur in models of intracellular calcium dynamics [8385].
This simple model illustrates some of the basic features necessary in an adapting system, but there is no explicit biochemical basis for it. However the excitation variable y1 can represent the active state of a ligand-occupied receptor, whereas the adaptation variable could represent an internal variable that desensitizes the receptor. Of course the actual physical quantities should remain non-negative. A more realistic four-dimensional model, which is sometimes called the adapting box model, was first proposed and analyzed by Katz and Thesleff [86] in a study of adaptation produced by acetylcholine at the motor end-plate of frog muscle, and more general forms were subsequently used by others in a similar context ([87] and references therein). More realistic models for E. coli are described in the following sections.

4. Models of Signal Transduction in E. coli

E. coli chemotaxis has been the subject of various mathematical modeling studies since the early 1970s (Table 2). In recent work the focus of the models has changed from the basic excitation and adaptation properties of the signal transduction pathway to other properties of the system, such as receptor clustering-induced cooperativity and sensitivity. The modeling methods have ranged from classical chemical kinetics to statistical mechanics, and the simulation techniques used have varied from numerical methods for deterministic differential equations to Monte Carlo methods for stochastic processes. Quantitative modeling has played a significant role in understanding this system by providing a framework for interpreting existing data and stimulating new experiments, with the result that the multitude of experimental results are beginning to fit into a coherent picture.
We first focus on theoretical studies of the excitation and adaptation characteristics of the signal transduction pathway and the underlying mechanism for system robustness. The early modeling studies were directed toward understanding the observed adaptation in bacterial chemotaxis [4,10,88,89]. Macnab and Koshland [90] proposed a conceptual network for chemotactic responses in which a response regulator is upregulated by a fast enzyme activity and downregulated by a slow enzyme activity, and later Koshland proposed that methylation/demethylation of receptors was probably the source of the slow enzyme activity [89]. Block et al. [4] postulated a two-state assumption for the system and then formulated a deterministic model that includes a description of adaptation [10]. Goldbeter and Koshland proposed the first adaptation model that includes the ligand binding and one-site methylation reactions [91], and Segel and Goldbeter modified the model by allowing receptor modification to occur on both ligand-free and ligand-bound receptors [92]. Asakura and Honda [78] extended Goldbeter and Koshland’s model to multiple-site methylation. Bray et al. [93] first modeled the excitation response of chemotaxis using a simplified network without methylation and demethylation and later added a hypothetical reaction network for formation of the ternary MCP/CheA/CheWsignaling complexes [94]. Hauri and Ross [113] developed a model of the signal transduction pathway that exhibits both chemotactic excitation and adaptation to attractants and repellents. Spiro et al. [75] developed a model of the complete pathway based on three methylation states that included the phosphotransfer steps, and showed that the model accurately reproduces the step, ramp and saturation responses to aspartate on the correct time scales. That model was used predict that a high Hill coefficient ≤ 11 in binding of CheYp to FliM is needed to explain a modest gain 3 to 6 in the absence of cooperativity upstream in the signal transduction pathway, and this was later confirmed experimentally [76].
A long-standing question is how biological systems maintain the stability of their functions in the face of perturbations of parameters or state variables such as reaction rates or molecular concentrations. Barkai and Leibler [96] constructed a signal transduction model that includes the ligand binding and methylation/demethylation reactions among three components (MCP, CheR and CheB), and the model shows robustness of the ratio of adapted steady-state system activity over prestimulus activity. Following earlier two-state models for the receptor, they made the key assumptions that each receptor is either active or inactive, and that CheB acts only on active receptors at a rate that is independent of ligand binding. The direct coupling between kinase activity and demethylation rate provides an integral feedback control in their model and leads to robust perfect adaptation, as was demonstrated later [81]. However, the robustness of the output of the system such as the concentration of CheYp or the rotational bias of flagellar motors was not addressed since CheY was not included in the model. Later, an experimental study showed that the working range of the concentration of CheYp for the proper response of flagellar motors is so narrow that the level of CheYp in adapted cells can vary only about one-third from its optimal value [76], which indicates that the stationary concentration of CheYp should be tightly controlled. Kollmann et al. [111] showed that the signaling network topology of E. coli chemotaxis (with only a single methylation site considered) is robust to the intercellular variation in chemotactic protein concentrations arising from gene expression, and the variation of CheYp is much smaller than that of other proteins, and this has been confirmed by the experimental finding that the cells maintain the concentration of CheYp in the right range and still remain chemotactic upon up to 6.6-fold overexpression of all proteins in the system [111]. It was also reported that the fine-tuned adaptation systems [75,113] behave differently than the robust adaptation system [96], when examining the effects on the level of CheYp and the motor bias by the coordinate overexpression of all seven che- genes [114]. Other analyses, both deterministic and stochastic, are described in Table 2.
A comparison of the fine-tuned and the robust adaptation models shows that the significant difference lies in the treatment of methylation by CheR and demethylation by CheBp especially the latter. In the fine-tuned systems [75,113], CheR and CheBp can modify receptors in all states, while in the robust ones [96,99,111,116], CheBp can only access receptors in the active state and CheR in the inactive state (except in [96], where CheR is assumed to work at saturation in a constant rate on all receptors). Though a mechanism of the receptor activity-dependent methylation/demethylation leading to robustness of adaptation has been proposed theoretically [81,111], it remains to confirm it experimentally.
Next we review a large number of models that employ a receptor clustering-based explanation for the high signaling sensitivity, large transduction gain, and wide dynamic range of the signaling system. Bray et al. [118] proposed that receptor clustering could account for the observed sensitivity and dynamic range. Each receptor existing in an extended lattice interacts with its neighbors and conformational spread occurs from ligand-bound receptors to neighbors so that at low concentrations, deactivation of a single receptor is magnified and can inhibit the phosphorylation cascade to the flagella, while at high concentrations, the methylation/demethylation-induced adaptation can free those affected receptors to respond to further changes. Thereafter, many models have emerged, and we separate them into two categories.

Category I

The models in this category are based on the hypothesis that receptors exist in an extended, weakly-coupled lattice network and use the Ising-type framework. As an implementation of Bray’s idea [118], Shi and Duke first adopted the Ising model developed for ferromagnetism to the chemotactic signaling. This application was based on the similarity of the two systems, in that each unit of the lattice lies in two stable states, active or inactive, that the probability of being in a state state is determined by not only its own properties but also the states of its neighbors, and that the ligand input could be treated as a magnetic field [97]. A Monte Carlo simulation of the model shows that a two-dimensional lattice of coupled receptors generates the higher sensitivity to external stimuli and the wider functional range of ambient ligand concentrations than an array of independent receptors [119]. Shi extended the previous model [97] by incorporating the effect of CheR and CheBp, and made a perfectly-adapting Ising model [98]. Then Shi compared the theoretical predictions of his models [97,98] with the experimental measures and found good agreement on the ratio of attractant binding to receptor-receptor interactions, the adaptation time, as well as the ratio of pre- and post-stimulus CheA phosphorylation [120]. Following that, Shi incorporated the effect of receptor movement into the model and showed that the receptor correlation remains strong for nearby receptors and decays exponentially with increasing distance between receptors [121]. Shimizu et al. incorporated the Ising-type description of receptor clustering into the stochastic model they developed earlier [99], compared the effects of size and geometry of receptor arrays, and convincingly showed the enhanced signal gain through receptor-receptor interaction [123]. Mello and Tu proposed a deterministic version of the Ising-type lattice model, taking into account receptor interactions among different species Tar and Tsr, and including methylation/demethylation [100]. Later, the mean-field theory was applied to simplify the model and also the Monte Carlo simulation was implemented [124]. Both models reproduced Sourjik and Berg’s FRET data on the cheR/cheB/cheRcheB mutant strains as well as the wild-type cells [15], although using two different parameter sets.

Category II

These models hypothesize that receptors exist in several strongly coupled clusters and use the Monod-Wyman-Changeux (MWC)-type framework. The FRET experiments in Sourjik and Berg [39] indicate that the clustered chemoreceptors work in high cooperativity and the functional interaction mimics the behavior of multi-subunit allosteric proteins, and thus they proposed to use the classical MWC model [125] to explain it. Subsequently, Mello and Tu reported a generalized MWC model for allosteric interaction and multiple signal integration in heterogeneous receptor clusters, and it reproduces the measured responses for 14 mutant strains with varied expression levels of Tar and/or Tsr [107]. Further, the authors proposed a simplified version for homogeneous receptor complexes and studied the underlying mechanism of how the cells maintain high sensitivity over a wide range of backgrounds [126]. Recently, the Wingreen group pointed out that the differences of FRET data between wild-type, cheR, and cheRcheB mutant cells suggest two regimes of receptor behavior: regime I is characterized by low to moderate kinase activity and a low, constant inhibition number for half-maximal activity Ki, in which coupling of receptors leads to high sensitivity (in the case of wild-type and cheR mutant cells); regime II is characterized by high kinase activity and a high Ki, increasing with the methylated level of receptors, in which coupling leads to high cooperativity (in the case of cheRcheB mutant cells) [106]. Following the modified MWC framework and inspired by the recent experimental finding “assistance neighborhoods” that CheR and CheB can access five to seven receptors when tethered to a particular receptor [105], Endres and Wingreen extended the Barkai and Leibler model [96] to the mixed Tar-Tsr clusters and showed that “assistance neighborhoods” are necessary for precise adaptation because the probability of the enzymes CheR and CheB encountering fully methylated or demethylated receptors, which is believed to induce imprecise adaptation, is greatly reduced due to a large number of modification sites available [110]. Recently, Hansen et al. extended the ‘assistance neighborhood’ model by including binding and unbinding of CheR and CheB so that the authors could further consider the adaptation limits from the angle of CheR and CheB kinetics [127]. Using a similar model, Meir et al. analyzed the characteristics of precise adaptation and found the asymmetries (i.e., different adaptation time) in responses to addition and removal of attractants, and proposed two possible resources of the asymmetry: (1) dynamic phosphorylation of CheB and (2) scarcity of methylation site [128]. To dissect the Ising-type and the MWC-type models, the Wingreen group also compared the activity response of coupled receptors from three different models: a one-dimensional Ising-type model for a weakly-coupled receptor lattice, a two-dimensional Ising-type model for weakly-coupled receptor lattice, and a two-regime MWC-type model for isolated strongly-coupled receptor clusters. They found that Sourjik and Berg’s FRET data of activity responses to steps of chemoattractants for wild-type and cheR mutant strains [15] are inconsistent with the Ising-type model, but consistent with the MWC-type model, which seemingly suggests that receptors form isolated strongly-coupled clusters [129].
The models addressed above, either of Ising-type or MWC-type, treat the receptor homodimer as the basic functional unit and thus the receptor interaction is at the dimer-dimer level. However, it is now established that the trimer of homodimers serves as the core unit in signaling, especially in kinase control [48]. An increasing number of models concentrate on this unique structure. Albert et al. [102] developed a dynamic trimer formation model to account for high upstream sensitivity, which assumes that the time scale of association and dissociation of a trimer of dimers is comparable to that of ligand binding and kinase activity. The model produced good agreement with experimental data, but later the their assumption was disproved in that the half-life of trimers was experimentally estimated to be around 5 min [103] and thus a static scheme is more appropriate. Rao et al. reported a MWC-type model of the static trimer of dimers [130] and later Endres et al. reported another static trimer model [131] following the modified MWC framework [106]. The two models mainly explain in vitro kinase activity data on Tar [104,108,109] and Tsr receptors [67]. Park et al. performed sensitivity analysis for the trimer of dimers-based signaling [132].
Thus far the MWC-type models reviewed all have a prescribed stoichiometry and a fixed size of receptor clusters. In cells, the number of the receptor complexes involved in chemotactic responses probably varies with the stimulus magnitude. Recently, theoreticians have begun to develop models for dynamic signaling receptor clusters with a variable size. Endres et al. used a backward approach, determining the sizes of the signaling clusters through best fitting in vivo FRET data with the model [106], and found that the size increases with the methylation level, up to 2–3 fold [133]. Intrigued by this finding, Hansen et al. presented a model of dynamic signaling clusters of trimers of dimers, the boundaries of which are able to change during a simulation course, and the model shows that the active trimers of dimers seem to couple more strongly than inactive ones [134]. In a very recent study, a cutoff distance was used to determine the range of interacting receptors and the simulation on size-varied signaling clusters was performed to explore the effect of lateral density of receptor arrays on signaling sensitivity [53].
Next we discuss several models analyzing other features of the system. Lipkow et al. [135] did a stochastic simulation of the downstream pathway, including CheY phosphorylation, CheY/CheYp diffusion, CheYp binding to FliM and dephosphorylation, which has two important features (1) it incorporated diffusion of molecules in the stochastic simulation of chemical reactions and (2) it tracked the spatial locations of individual molecules in 3D. The model shows that when CheZ is restricted to receptor ends, the concentration of CheYp is constant throughout the cytoplasm, but when CheZ is free to diffuse, CheYp has an exponential gradient across the length of the cell, highest at the anterior end [135]. Later, Lipkow used the model to study the effect of CheZ localization and noted that clustering of the CheZ, CheYp and CheAs complexes at the cell poles introduces a negative feedback to maintain the CheYp level, which could play a secondary adaptation role and explain the overshoot of CheYp in cheRcheB mutant cells [136]. Recently, Endres [137] addressed the question of what determines the size of receptor clusters at the cell poles. The receptor cluster-membrane elastic energy disfavors large clusters due to their high intrinsic curvature, while the receptor-receptor coupling favors large clusters. The author hypothesized that the cluster size is determined by minimizing the cluster-membrane free energy and developed a free energy-based model for formation of clusters of trimer of dimers. Besides E. coli, Rao et al. modeled bacterial chemotaxis in a different species Bacillus subtilis and argued that the core control strategy of the two signaling pathways remains the same [138]. The modeling for the signaling pathway of Rhodobacter sphaeroides chemotaxis has begun and is becoming a new model system [139141]. For further reading we recommend a comprehensive review on mathematical modeling of bacterial chemotaxis in 1976–2006 in Tindall et al. [144].
Lastly, we introduce a recent, trimer of dimers-based model [143]. The accumulating evidence that demonstrates the key role played by the trimer of dimers in signaling function for bacterial chemotaxis, especially Boldog et al.’s experiments showing that homodimers fail to regulate kinase activity and trimers of dimers perform the maximal kinase activation compared with other higher-order structures [48], suggested further study of the dynamics of the molecular structure. The existing models for the single trimer of dimers restrict to the equilibrium behavior and only consider the ligand binding and kinase activity control reactions, excluding the downstream phosphoryl transfer and methylation chain [130132]. In contrast, we treat the ternary complex of one trimer of receptor dimers, one CheA dimer, and two CheW monomers as a signaling complex (depicted in Figure 2), incorporate the sensing unit into the overall signal transduction pathway (shown in Figure 2 and the corresponding transition network shown in Figure 6), and simulate the dynamics of the network in response to multiple stimuli [143]. The single trimer model could explain the kinase activity variation with ligand concentration for the methylation-fixed receptors Tar [104,108,109] and Tsr [67]in vitro and the CheYp responses in cheRcheB/cheR/cheB mutant cells in vivo [15]. We then did a sensitivity analysis for each stage of the signal transduction pathway and showed the enhancement of upstream sensitivity in ligand binding and activity regulation due to the structural assembly from homodimers to trimers of dimers. We also tested the robustness to model parameters and found that precise adaptation is well-preserved when varying the expression levels of protein components in individual or concert. However, in such cases the steady-state level of CheYp is not invariant and the adaptation time is also variable. Therefore, we make several new predictions as to how the adaptation time and the CheYp level vary with the quantity of signaling proteins. Because of the complex network and various states, the full model consists of 158 ODEs. To facilitate computation and further analysis, we do model reduction by applying multi-time-scale analysis and mean-field theory and simplify it into the 16-ODE and 4-ODE systems, respectively, while keeping the key features intact.
The single trimer model cannot reproduce the higher receptor cooperativity, i.e., the Hill coefficient of response larger than 3, and fails to explain the data of the cheRcheB mutant cells with Tar or Tsr highly overexpressed [39]. It suggests that the trimers of dimers are not independent of each other and that larger receptor clusters with trimer-trimer interaction must be involved. Here we extend the single trimer model to a trimer cluster model. We first consider the pure-type trimer of dimers (all three homodimers are of the same receptor type). For a given methylation level, a trimer of dimers has two activity states and four ligand-binding states. Therefore, a trimer of dimers at a fixed methylation level could exist in eight distinct free-energy levels. We denote the free-energy level for the active ligand-free trimer as E o n m, and similarly the free-energy level for the inactive ligand-free trimer as Eoff. All energies are in unit of the thermal energy kBT. For simplicity, we specify E o n m as a function of the methylation level m and Eoff independent of m, since only an offset energy, the relative difference between the two energy levels, appears when use Boltzmann’s law to derive the formula for the probability of each state. Next, we deal with the ligand-binding states. We consider the first ligand binding to, or releasing from, an active trimer. In the steady state,
3 k 1 o n , m L k - 1 o n , m = e - Δ E 1 o n , m
Δ E 1 o n , m is the free-energy change upon the first ligand binding to the active trimer of dimers. L is the ligand concentration. Therefore,
Δ E 1 o n , m = - log ( 3 k 1 o n , m L k - 1 o n , m ) = - log ( 3 L K d 1 o n , m )
where K d 1 o n , m is the first ligand dissociation constant of an active trimer and K d 1 o n , m = k - 1 o n , m / k 1 o n , m. Therefore, the free-energy level for the active trimer with one-ligand bound is
E o n m + Δ E 1 o n , m = E o n m - log ( 3 L K d 1 o n , m )
Similarly, we obtain the free-energy levels for the pure-type trimer of dimers, shown in Table 3.
Using Boltzmann’s law, the probability that the pure-type trimer of dimers is active is as below.
p o n = 1 1 + e Δ f m
Δ f m = E o n m - E o f f + log ( 1 + 3 L K d 1 o f f , m + 3 L 2 K d 1 o f f , m K d 2 o f f , m + L 3 K d 1 o f f , m K d 2 o f f , m K d 3 o f f , m 1 + 3 L K d 1 o n , m + 3 L 2 K d 1 o n , m K d 2 o n , m + L 3 K d 1 o n , m K d 2 o n , m K d 3 o n , m )
Now, we consider a receptor cluster with n trimers of dimers. We assume that the energy for a cluster depends linearly on the number of trimers, that is, the free-energy level for the cluster to be in a certain state is the sum of the free-energy level for each trimer of dimers to be in the same state. Thus, the probability of the n-trimer cluster being active at equilibrium is
p o n = 1 1 + e n Δ f m
Finally, we consider a cluster of mixed-type receptors. Here, we work on the case of two types, Tar and Tsr, as an example. In this case, a trimer could contain three Tar homodimers, three Tsr homodimers, or a combination of Tar and Tsr homodimers. For simplicity, we use the approximation wherein only trimers made of the same homodimers exist in a mixed-type receptor cluster. With this assumption, a Tar-Tsr cluster only consists of the pure Tar trimers and the pure Tsr trimers. We only consider the response of the mixed-type cluster to a single type of ligands. The probability of the mixed-type receptor cluster with na Tar trimers and ns Tsr trimers coupled being active at equilibrium is
p o n = 1 1 + e ( n a Δ f a m + n s Δ f s m
Δ f a m = E o n , a m - E o f f , a + log ( 1 + 3 L K d 1 , a o f f , m + 3 L 2 K d 1 , a o f f , m K d 2 , a o f f , m + L 3 K d 1 , a o f f , m K d 2 , a o f f , m K d 3 , a o f f , m 1 + 3 L K d 1 , a o n , m + 3 L 2 K d 1 , a o n , m K d 2 , a o n , m + 3 L 2 K d 1 , a o n , m K d 2 , a o n , m K d 3 , a o n , m )
Δ f s m = E o n , s m - E o f f , s + log ( 1 + 3 L K d 1 , s o f f , m + 3 L 2 K d 1 , s o f f , m K d 2 , s o f f , m + L 3 K d 1 , s o f f , m K d 2 , s o f f , m K d 3 , s o f f , m 1 + 3 L K d 1 , s o n , m + 3 L 2 K d 1 , s o n , m K d 2 , s o n , m + L 3 K d 1 , s o n , m K d 2 , s o n , m K d 3 , s o n , m )
We use this model to explain the observed ultrahigh cooperativity. We simulate the responses to methyl-aspartate (MeAsp) and serine in the cheRcheB mutants with different expression levels of the receptors Tar and Tsr and compare to Sourjik and Berg’s experiments. In Figure 7(A) are shown the responses to MeAsp in the cheRcheB mutants with only Tar expressed (compare to Figure 2(a) in [39]), in Figure 7(B) are the responses to serine with only Tsr expressed (compare to Figure 2(b) in [39]), in Figure 7(C) are the responses to MeAsp with native-level Tsr and varied-level Tar expressed (compare to Figure 1(c) in [39]), and in Figure 7(D) are shown the responses to serine with native-level Tar and varied-level Tsr expressed (compare to Figure 1(d) in [39]). We also simulate the kinase activity responses of Tsr to serine in vitro, shown in Figure 7(E) and compare to Li and Weis’ experiments (Figure 3 in [67]). Data fitting with the Hill function shows that the simulation results have quantitative agreement with the measures. The details of the simulations, such as parameter values and data fitting, are omitted here but documented in [145]. Our modeling on a single trimer of dimers and extension to a cluster of trimer of dimers indicates that the strongly-coupled trimer of dimers is the core unit for signaling function, that the short-range interaction between dimer members of a trimer, which we call the intratrimer interaction, plays a key role, and that the long-range interaction between trimers in a loosely coupled cluster, which we call the intertrimer interaction, is responsible for ultrahigh cooperativity.

5. Spontaneous Spatial Pattern Formation in Populations

At the population level, cell-cell-signaling and chemotaxis provide a mechanism for long-range cell-cell communication and formation of multicellular spatial patterns [9,146152]. The spectacular growth patterns observed in cultures provide a simple and manipulable system for studying bacterial population chemotaxis in more complex environments, such as in biofilm formation, and in bioremediation, which is a process that uses microorganisms to remove pollutants [153,154]. The excitation and adaptation response of bacteria are crucial in the formation of these patterns. In this section, we review biological experiments and mathematical models for the patterns formed by cells such as E. coli that use a run-and-tumble strategy. Pattern formation in other bacterial colonies, e.g., Bacillus, Proteus and Myxococcus, and mathematical models of more complicated biofilms are discussed in [155165].

5.1. Pattern Formation in Bacterial Colonies

Chemotaxis of E. coli can lead to spontaneous, self-organized pattern formation. In the 1960’s it was found that a E. coli colony forms moving bands/rings when exposed to a nutrient that also serves as a chemoattractant [167]. In the 1990’s, it was shown that E. coli colonies can organize into stable spatial patterns in either a semi-solid agar or liquid medium, by responding to a self-secreted chemoattractant (aspartate and analogues) [9,146]. When grown in semi-solid agar with a single nutrient source (e.g., succinate), a droplet of E. coli grows and depletes nutrient locally, and over the following three days, a concentric swarm ring forms and spreads radially from the inoculation site. A symmetric array of spots or stripes may form sequentially in the wake of the spreading ring depending on the initial nutrient concentration [9,146]. The speed of the swarm ring is observed to be inversely proportional to the initial nutrient concentration. When grown in a liquid medium, E. coli cells secrete attractant and self-organize into network patterns initially, and the networks subsequently collapse into moving aggregates which merge over time. The timescale of patterning for the liquid suspension experiments is of the order of minutes. Mittal et al. [166] studied E. coli aggregate formation in a quasi-2D system, and showed that the size of an aggregate is about 150 ~ 200 μm in diameter and depends primarily on the adaptation time scale of the bacteria and only weakly on the total number of cells. Recently, E. coli traveling pulse patterns have also been observed in more complicated nutrients [168,169]. Due to the complicated nature of the nutrient, the exact chemical signal that leads to these patterns is not known, although the mechanism is believed to be similar to Budrene-Berg experiments. The adoption of the recent microfluidic techniques, allows precise tracking of individual trajectories of cells and analyze their movement in great detail. In [169], it is found that not only the mean run length of cells but also the directional persistence are larger in the direction of wave propagation. By incorporating these asymmetries of cell movement to a kinetic model similar to the hybrid cell-based model discussed later, these authors matched numerical simulations to experimental data seamlessly.
The enteric bacterium P. mirabilis, which is a pathogen that forms biofilms in vivo and has a similar chemotactic system to E. coli, can swarm over hard surfaces and form a variety of spatial patterns in colonies. It has been shown that P. mirabilis colonies, when grown on hard surfaces, can grow and expand, and form radial and spiral stream patterns in the center of the colony [170]. Remarkably, the spiral streams always wind counterclockwise in repeated experiments. Xue et al. [170] showed that assuming that cell secrete a chemoattractant, the formation of streams can be explained as a result of the instability induced by local production of attractant by cells, and the spiral rotation of the population results from the fact that cells swim with a rightward bias when moving close to a surface [171,172].

5.2. Mathematical Models of E. coli Pattern Formation

The formation of these bacterial patterns involves a complex interplay between different processes, including consumption of nutrients, production of chemoattractants, tactic movement towards the attractant, and hydrodynamic interaction with the environment. Moreover, formation of these spatial patterns can involve millions of cells. Mathematical models of the patterns include continuum models that incorporate these processess in a phenomenological way, and hybrid cell-based models that allow detailed description of the microscopic behavior. The continuum models are easier to implement numerically and more amenable to mathematical analysis, but justification of these models has to be addressed. Hybrid cell-based models can be used to integrate better descriptions of the experimental picture, but can be computationally expensive.
Continuum approaches to bacterial pattern formation
A variety of Patlak-Keller-Segel type systems
n t = · ( D n n - χ ( S ) n S ) + f ( n , S , F ) S t = D s Δ S + g s ( n , S , F ) F t = D f Δ F + g f ( n , S , F )
have been developed and applied to model E. coli patterns [147,173182]. Here n is the cell density, S is the concentration of the extracellular chemical, F is nutrient, Dn, Ds and Df are the diffusion coefficients, χ(S) is the chemotaxis sensitivity, and f(n, S, F), gs(n, S, F) and gf (n, S, F) represent the local dynamics. The first equation in the system is called the Patlak-Keller-Segel chemotaxis equation, or PKS equation for short. Mathematical properties of the system (14) have been studied, for example in [182], and also see [183,184] for recent reviews.
Traveling wave solutions of the system (14) have been studied extensively as a means of describing the moving band formation observed in E. coli colonies. Keller and Segel [173] first applied the chemotaxis model without the F equation and cell growth term to describe Adler’s experiments of E. coli chemotactic band formation. They showed that the system of equations allow for an analytic traveling wave solution, but they required a singular chemotaxis sensitivity which violates the fact that cells have finite speed when S becomes small. A nonsingular chemotactic sensitivity, however, would lead to a moving band with decreasing speed and broadening density profile due to the diffusive effect of cell run-and-tumble. Later [174,175] showed numerically that by incorporating cell growth and death the shape and the speed of the band can be stabilized. More recent work based on the velocity-jump process described later has substantially clarified the picture [168].
Numerous extensions of the PKS model at system 14 have been proposed to model the E. coli swarm ring and aggregation patterns found by Budrene and Berg [9,146]. Ben-Jacob et al. [176] and Tsimring et al. [177] added a repellent field that was assumed to autocatalyze the production of attractant but to date there is no experimental confirmation of a repellent. In a model proposed by Polezhaev et al. [181] cells become immobile upon starvation, and simulations of the model predict the formation of a swarm ring and stable aggregation patterns composed of immobile cells. However, the swarm ring formed has a very diffuse front, in contrast to what is observed experimentally. The above models can produce patterns with some similarity to those in the semi-solid agar experiments, but how different processes control the patterns is not clear. To address this, Brenner et al. [185] analyzed a model of the form system (14), and suggested that movement of the swarm ring was driven by local nutrient depletion., The integrity of the swarm ring results from the high attractant concentration at the ring, whereas aggregates are suggested to form within the ring through fluctuations about the unstable uniform cell density. In a subsequent paper [186] an analysis of the transformation of high cell density cylinders into regularly spaced aggregates from the swarm ring was undertaken, with the conclusion that a shifting balance between diffusion and chemotaxis leads to collapse of the strands. Despite numerous attempts, there is at present no complete understanding of the pattern-forming process in E. coli.

5.2.1. Hybrid Cell-based Models

Hybrid cell-based models for bacterial pattern formation have also been developed [170,187,188]. In these models, each cell is characterized by its position x ε ℝN, velocity v ε V ⊆ ℝN, internal state y and other auxillary variables indicating the metabolic state of the cell. The movement of each cell is modeled as a velocity jump processes with instantaneous velocity jumps mimicking the relatively short tumbles. Because in the aformentioned experiments, the average volume fraction of the cell population in the substrate is small, these models assumed that cells are well separated with no mechanical interactions between them, which means that cell movements are independent of each other. The rate of velocity jumps depends on the internal variables which describe intracellular signaling, and this can lead to large systems for the internal network. To reduce computational time, and with the goal of understanding the role of excitation and adaptation of cell signaling to the population behavior, the abstract linear cartoon model discussed earlier was used to describe the excitation and adaptation components of cell signaling,
d y 1 i d t = G ( S ( x i , t ) ) - ( y 1 i + y 2 i ) t e d y 2 i d t = G ( S ( x i , t ) ) - y 2 i t a
Here the superscript i is the index of the cell, S is the local attractant concentration and te and ta (with teta) are constants defining excitation and adaptation timescales. The function G(S) models the detection of the extracellular (chemoattractant) signals. To model the run and tumble movement, these models describe the velocity jumps using a turning kernel T and a turning rate λ for each cell, given by forms similar to the following
T = 1 | V |             and            λ i = λ 0 ( 1 - y 1 i γ 0 + | y 1 i | )
Since particles are conserved in the turning process
v T ( v , v ) d v = 1
The foregoing individual-based model for cell movement can be coupled with continuum reaction-diffusion equations to describe the evolution of the extracellular nutrient and attractant concentrations. The combined system is solved with a hybrid scheme in which the movement of each cell is simulated by a Monte Carlo method while the reaction-diffusion equations are solved with an alternating direction method. The details of this algorithm can be found in [189].
To model the experiments done by Budrene and Berg, the hybrid cell-based model was coupled with the following equations for the attractant and nutrient concentrations in [187]
S t = D s Δ S + γ n = 1 N δ ( x - x i ) + μ F t = D f Δ F - k n = 1 N δ ( x - x i ) S ( x , 0 ) = 0 F ( x , 0 ) = f 0
where Ds and Df are the diffusion rates, γ defines the secretion rate of attractant by cells, k is the consumption rate of the nutrient, and μ is an unspecified degradation rate. Simulations of the hybrid cell-based model can predict the time sequence of the network and aggregate formation in liquid medium and swarm ring formation in agar as in the experiments of Budrene and Berg (cf. Figure (8)). In particular, these simulations can reproduce the sharp wave front of the swarm rings, in agreement with experiments.
To model the traveling band formation observed by Adler, the hybrid model was coupled with the following equation for S [188],
S t = D s Δ S - γ n = 1 N δ ( x - x i ) S ( x , 0 ) = 1
where γ is the consumption rate of the signal S by cells. Here γ becomes negative because in this set of experiments, the signal becomes the nutrient source of the cells and they consume it instead of secrete it. It was found that the cell population moves towards higher concentrations of signal at a constant speed, and the profile of the traveling cell population shows a dropout phenomena which has not been reported by any continuum model [188]. When coupled with cell growth, the wave shape and speed can be stabilized, but oscillations of the wave speed have been observed in the hybrid model [190].
The hybrid cell-based model has also been applied to model radial and spiral stream formation of P. mirabilis. The difference from the application to E. coli patterns is that in the patterns formed by P. mirabilis, cells move close to a surface, and thus have a clockwise bias in their movement when observed from above the cell looking toward the surface. To incorporate the bias, Xue et al. [170] added an angular component to the velocity of each cell. Remarkably, the hybrid cell-based model predicts the spiral stream patterns with the correct chirality qualitatively (Figure 9). Further parameterization of the model with refined experimental measurements are needed to obtain quantitative comparisons between experiments and modeling.
Hybrid cell-based models based on simplified descriptions of cell signaling have also been used to study E. coli population chemotaxis in well-controlled spatially and temporally varying signal fields [191,192]. Quantitative agreement of the cell density profile between experiments and models were achieved by refining the parameters of these models with single cell data.

5.2.2. From Cell-based Models to Continuum Models

The hybrid cell-based models described above can be used to integrate details on cell signaling and movement faithfully. However, when used to simulate population behavior, it becomes computationally intensive, especially when some parameters of the model are unknown and parameter exploration is needed. The continuum models such as those based on PKS equations are computationally managable and analytically amenable. However, justification of these models under different scenarios of signals, and the relationship between macroscopic parameters in these models with parameters known in the signal transduction steps, are not rigorously established in the original PKS equation.
To fill in this gap, significant effort has been put in deriving continuum models from cell-based models for chemotaxis of E. coli. Early works derived the PKS equation from cell movement modeled as biased random walks with signal-dependent parameters [193203]. Recently, the simplified description of Equation (15) of signal transduction has also been incorporated, and the PKS equation was derived when the signal detected by cells changes slow enough so that cells are close to their fully adapted state [189,204,205]. The derivation of the equation starts from linearization of the cartoon model of signal transduction around its adapted state, by introducing the equivalent variable = y − (0,G(S))T, which satisfies
d z 1 d t = - z 1 t e d z 2 d t = - z 1 - z 2 t a
and involves asymptotic approximations of the resulting master equation of the velocity jump process,
p ( x , v , z ¯ , t ) t + x · ( v p ( x , v , z ¯ , t ) ) + z 1 · [ ( - z 1 t e ) p ( x , v , z ¯ , t ) ] + z 2 · [ ( - z 1 - z 2 t a ) p ( x , v , z ¯ , t ) ] = λ ( z 1 ) ( - p ( x , v , z ¯ , t ) + V T ( v , v ) p ( x , v , z ¯ , t ) d v )
Here p(x,v, z̄, t) is the probability density for a cell to be at position x ε ℝN, with velocity v ε V ⊂ ℝN, and intracellular state ε ℝq. The formal derivation of the approximation involves rescaling of Equation (20) on the diffusion space and time scales, calculating the internal state moment equations, and closing the infinite moment system. When the signal gradient is small, the adaptation time scale of the cell is much smaller than the time scale for signal variation, and the ratio of these times scales becomes a natural small parameter for closing the infinite moment system and applying perturbation methods to the closed moment system. This leads to a hierarchy of approximations of the lowest order moments such as the cell density n(x, t) = ∫ pdvd. The first order closure of n(x, t) satisfies the following PKS equation [189],
n t = · ( s 0 2 N λ 0 n - b s 0 2 t a N λ 0 ( 1 + λ 0 t a ) ( 1 + λ 0 t e ) S )
where s0 is the cell speed, N is the space dimension, λ0 is the basal turning rate, and b is the derivative ∂z1λ(0).
This PKS equation, in which the chemotactic sensitivity is defined in terms of cell parameters, provides a very good approximation to the spatial-temporal dynamics observed in the cell-based models under a variety of signal regimes, as long as the signal gradient times the cell is small compared to the reciprocal of the adaptation time [189]. Figure 10 shows a typical comparison between the results of a stochastic simulation of the cell-based model with numerical solutions of Equation (21) for a given piecewise linear signal with a peak at x = 2mm.
However when the signal changes rapidly along the cell’s trajectory, the underlying assumption of the derivation is not satisfied and Equation (21) is not adequate to describe the population dynamics [170]. The main reason is that due to fast signal variation, intracellular signaling is far from its adapted state, and this derivation has to be accounted for in a continuum model by introducing new variables such as higher-order moments of the internal states. Recently, such a continuum model has been proposed by including a mean methylation level of receptors [206], and the model can be used to capture certain macroscopic quantities of the cell population such as the mean position of a colony compared to experiments and cell-based simulations. However, matching between solutions of the proposed continuum model and underlying cell-based model/experimental data as spatial-temporal functions was not achieved in a satisfactory manner. Thus deriving continuum models for bacterial chemotaxis that can quantitatively predict the evolution of cell density in large signal gradients is still an open problem.

6. Discussion

The signal transduction pathway that governs bacterial chemotaxis in E. coli is one of the most thoroughly understood molecular systems. At the single-cell level it involves excitation and adaptation responses to signals, which enable cells to move to more favorable environments. At the population level, it provides a mechanism for cell-cell communication by secretion of the attractant and for formation of multicellular structures. To understand these phenomena at different spatial and temporal scales quantitatively, biologists, physicists, and mathematicians have been involved in experimentation and modeling. Although much is known, there are still many questions to be addressed.
At the receptor homodimer level, there are questions concerning conformational changes of the cytoplasmic domain for signaling, especially in the HAMP region and the signaling region. At the trimer of dimers level, further studies to determine the stoichiometry of the ternary MCP-CheA-CheWsignaling complexes, and how the signaling-induced conformational changes of one homodimer affect other dimer members within a trimer, are needed. Major questions remain at the receptor cluster level, where a cluster of trimers of dimers is probably used. One hypothesis that could be tested in this context is that for short-range interaction among three dimers of the same trimer, the protein interaction is primarily due to the direct coupling of dimers in the cytoplasmic domain, while for longer-range interaction among trimers (dimers of different trimers), the protein interaction is due to indirect coupling through the interconnected CheA and CheW network, or possibly membrane-mediated elastic interaction.
At the population level open questions include: how to derive a quantitative macroscopic description of bacterial population chemotaxis when the external signal changes rapidly, or whether such an approach is even possible. Currently continuum models are only derived from coarse-grained or abstract models of signal transduction that can perform excitation and adaptation. Derivation of continuum models from cell-based models that take into account detailed descriptions of cell signaling is currently under investigation and will be published elsewhere.

Acknowledgements

This research is supported in part by NIH grant # GM 29123 and by NSF grant DMS- 0517884. CX would like to thank the Mathematical Biosciences Institute at the Ohio State University for support as a long-term visitor through NSF-DMS 0931642.

References

  1. Othmer, H.G.; Schaap, P. Oscillatory cAMP signaling in the development of Dictyostelium discoideum. Comments Theor. Biol 1998, 5, 175–282. [Google Scholar]
  2. Koutalos, Y.; Yau, K.Y. Regulation of sensitivity in vertebrate rod photoreceptors by calcium. Trends Neurosci 1996, 19, 73–81. [Google Scholar]
  3. Purcell, E.M. Life at low Reynolds number. Am. J. Phys 1977, 45, 3–11. [Google Scholar]
  4. Block, S.M.; Segall, J.E.; Berg, H.C. Impulse responses in bacterial chemotaxis. Cell 1982, 31, 215–226. [Google Scholar]
  5. Stewart, R.C.; Dahlquist, F.W. Molecular components of bacterial chemotaxis. Chem. Rev 1987, 87, 997–1025. [Google Scholar]
  6. Berg, H.C. Bacterial microprocessing. Cold Spring Harbor Symp. Quantit. Biol 1990, 55, 539–545. [Google Scholar]
  7. Berg, H.C.; Brown, D.A. Chemotaxis in Escherichia coli analysed by three-dimensional tracking. Nature 1972, 239, 500–504. [Google Scholar]
  8. Berg, H.C. Random Walks in Biology; Princeton University Press: Princeton, NJ, USA, 1993. [Google Scholar]
  9. Budrene, E.O.; Berg, H.C. Complex patterns formed by motile cells of Escherichia coli. Nature 1991, 349, 630–633. [Google Scholar]
  10. Block, S.; Segall, J.; Berg, H. Adaptation kinetics in bacterial chemotaxis. J. Bacteriol 1983, 154, 312–323. [Google Scholar]
  11. Bourret, R.B.; Borkovich, K.A.; Simon, M.I. Signal transduction pathways involving protein phosphorylation in prokaryotes. Ann. Rev. Biochem 1991, 60, 401–441. [Google Scholar]
  12. Macnab, R.M. Motility and Chemotaxis. In Escherichia coli and Salmonella typhimurium: Cellular and Molecular Biology; American Society for Microbiology: Washington, DC, USA, 1987; pp. 732–759. [Google Scholar]
  13. Mesibov, R.; Adler, J. Chemotaxis toward amino acids in Escherichia coli. J. Bacteriol 1972, 112, 315–326. [Google Scholar]
  14. Segall, J.E.; Block, S.M.; Berg, H.C. Temporal comparisons in bacterial chemotaxis. Proc. Natl. Acad. Sci. USA 1986, 83, 8987–8991. [Google Scholar]
  15. Sourjik, V.; Berg, H.C. Receptor sensitivity in bacterial chemotaxis. Proc. Natl. Acad. Sci. USA 2002, 99, 123–127. [Google Scholar]
  16. Milburn, M.V.; Prive, G.G.; Milligan, D.L.; Scott, W.G.; Yeh, J.; Jancarik, J.; Koshland, D.E.; Kim, S.H. Three-dimensional structures of the ligand-binding domain of the bacterial aspartate receptor with and without a ligand. Science 1991, 254, 1342–1347. [Google Scholar]
  17. Kim, K.K.; Yokota, H.; Kim, S.H. Four-helical-bundle structure of the cytoplasmic domain of a serine chemotaxis receptor. Nature 1999, 400, 787–792. [Google Scholar]
  18. Moual, H.L.; Koshland, D.E., Jr. Molecular evolution of the C-terminal cytoplasmic domain of a superfamily of bacterial receptors involved in taxis. J. Mol. Biol 1996, 261, 568–585. [Google Scholar]
  19. Zhulin, I.B. The superfamily of chemotaxis transducers: From physiology to genomics and back. Adv. Microb. Physiol 2001, 45, 157–98. [Google Scholar]
  20. Hulko, M.; Berndt, F.; Gruber, M.; Linder, J.U.; Truffault, V.; Schultz, A.; Martin, J.; Schultz, J.E.; Lupas, A.N.; Coles, M. The HAMP domain structure implies helix rotation in transmembrane signaling. Cell 2006, 126, 929–940. [Google Scholar]
  21. Butler, S.L.; Falke, J.J. Cysteine and disulfide scanning reveals two amphiphilic helices in the linker region of the aspartate chemoreceptor. Biochemistry 1998, 37, 10746–10756. [Google Scholar]
  22. Surette, M.G.; Stock, J.B. Role of alpha-helical coiled-coil interactions in receptor dimerization, signaling, and adaptation during bacterial chemotaxis. J. Biol. Chem 1996, 271, 17966–17973. [Google Scholar]
  23. Terwilliger, T.C.; Bogonez, E.; Wang, E.A.; Koshland, D.E. Sites of methyl esterification on the aspartate receptor involved in bacterial chemotaxis. J. Biol. Chem 1983, 258, 9608–9611. [Google Scholar]
  24. Terwilliger, T.C.; Koshland, D.E. Sites of methyl esterification and deamination on the aspartate receptor involved in chemotaxis. J. Biol. Chem 1984, 259, 7719–7725. [Google Scholar]
  25. Lupas, A.; Dyke, M.V.; Stock, J. Predicting coiled coils from protein sequences. Science 1991, 252, 1162–1164. [Google Scholar]
  26. Alexander, R.P.; Zhulin, I.B. Evolutionary genomics reveals conserved structural determinants of signaling and adaptation in microbial chemoreceptors. Proc. Natl. Acad. Sci. USA 2007, 104, 2885–2890. [Google Scholar]
  27. Coleman, M.D.; Bass, R.B.; Mehan, R.S.; Falke, J.J. Conserved glycine residues in the cytoplasmic domain of the aspartate receptor play essential roles in kinase coupling and on-off switching. Biochemistry 2005, 44, 7687–7695. [Google Scholar]
  28. Wu, J.; Li, J.; Li, G.; David, G.; Weis, R.M. The receptor binding site for the methyltransferase of bacterial chemotaxis is distinct from the sites of methylation. Biochemistry 1996, 35, 4984–4993. [Google Scholar]
  29. Barnakov, A.N.; Barnakova, L.A.; Hazelbauer, G.L. Efficient adaptational demethylation of chemoreceptors requires the same enzyme-docking site as efficient methylation. Proc. Natl. Acad. Sci. USA 1999, 96, 10667–10672. [Google Scholar]
  30. Hazelbauer, G.L.; Falke, J.J.; Parkinson, J.S. Bacterial chemoreceptors: High-performance signaling in networked arrays. Trends Biochem. Sci 2008, 33, 9–19. [Google Scholar]
  31. Wang, H.; Matsumura, P. Characterization of the CheAS/CheZ complex: A specific interaction resulting in enhanced dephosphorylating activity on CheY-phosphate. Mol. Microbiol 1996, 19, 695–703. [Google Scholar]
  32. Falke, J.J.; Bass, R.B.; Butler, S.L.; Chervitz, S.A.; Danielson, M.A. The two-component signaling pathway of bacterial chemotaxis: A molecular view of signal transduction by receptors, kinase, and adaptation enzymes. Ann. Rev. Cell Dev. Biol 1997, 13, 457–512. [Google Scholar]
  33. McNamara, B.; Wolfe, A. Coexpression of the long and short forms of CheA, the chemotaxis histidine kinase, by members of the family Enterobacteriaceae. J. Bacteriol 1997, 179, 1813–1818. [Google Scholar]
  34. Cantwell, B.J.; Draheim, R.R.; Weart, R.B.; Nguyen, C.; Stewart, R.C.; Manson, M.D. CheZ phosphatase localizes to chemoreceptor patches via CheA-short. J. Bacteriol 2003, 185, 2354–2361. [Google Scholar]
  35. Shiomi, D.; Zhulin, I.B.; Homma, M.; Kawagishi, I. Dual recognition of the bacterial chemoreceptor by chemotaxis-specific domains of the CheR methyltransferase. J. Biol. Chem 2002, 277, 42325–42333. [Google Scholar]
  36. Li, J.; Li, G.; Weis, R.M. The serine chemoreceptor from Escherichia coli is methylated through an inter-dimer process. Biochemistry 1997, 36, 11851–11857. [Google Scholar]
  37. Banno, S.; Shiomi, D.; Homma, M.; Kawagishi, I. Targeting of the chemotaxis methylesterase/deamidase CheB to the polar receptor-kinase cluster in an Escherichia coli cell. Mol. Microbiol 2004, 53, 1051–1063. [Google Scholar]
  38. Maddock, J.R.; Shapiro, L. Polar location of the chemoreceptor complex in the Escherichia coli cell. Science 1993, 259, 1717–1723. [Google Scholar]
  39. Sourjik, V.; Berg, H.C. Functional interactions between receptors in bacterial chemotaxis. Nature 2004, 428, 437–441. [Google Scholar]
  40. Milligan, D.L.; Koshland, D.E. Site-directed crosslinking: Establishing the dimeric structure of the aspartate receptor of bacterial chemotaxis. J. Biol. Chem 1988, 263, 6268–6275. [Google Scholar]
  41. Pakula, A.A.; Simon, M.I. Determination of transmembrane protein structure by disulfide cross-linking: The Escherichia coli Tar receptor. Proc. Natl. Acad. Sci. USA 1992, 89, 4144–4148. [Google Scholar]
  42. Lee, G.F.; Burrows, G.G.; Lebert, M.R.; Dutton, D.P.; Hazelbauer, G.L. Deducing the organization of a transmembrane domain by disulfide cross-linking. The bacterial chemoreceptor Trg. J. Biol. Chem 1994, 269, 29920–29927. [Google Scholar]
  43. Chervitz, S.A.; Lin, C.M.; Falke, J.J. Transmembrane signaling by the aspartate receptor: Engineered disulfides reveal static regions of the subunit interface. Biochemistry 1995, 34, 9722–9733. [Google Scholar]
  44. Bass, R.B.; Falke, J.J. The aspartate receptor cytoplasmic domain: In situ chemical analysis of structure, mechanism and dynamics. Structure 1999, 7, 829–840. [Google Scholar]
  45. Ames, P.; Studdert, C.A.; Reiser, R.H.; Parkinson, J.S. Collaborative signaling by mixed chemoreceptor teams in Escherichia coli. Proc. Natl. Acad. Sci. USA 2002, 99, 7060. [Google Scholar]
  46. Studdert, C.A.; Parkinson, J.S. Crosslinking snapshots of bacterial chemoreceptor squads. Proc. Natl. Acad. Sci. USA 2004, 101, 2117–2122. [Google Scholar]
  47. Studdert, C.A.; Parkinson, J.S. Insights into the organization and dynamics of bacterial chemoreceptor clusters through in vivo crosslinking studies. Proc. Natl. Acad. Sci. USA 2005, 102, 15623–15628. [Google Scholar]
  48. Boldog, T.; Grimme, S.; Li, M.; Sligar, S.G.; Hazelbauer, G.L. Nanodiscs separate chemoreceptor oligomeric states and reveal their signaling properties. Proc. Natl. Acad. Sci. USA 2006, 103, 11509. [Google Scholar]
  49. Zhang, P.; Khursigara, C.M.; Hartnell, L.M.; Subramaniam, S. Direct visualization of Escherichia coli chemotaxis receptor arrays using cryo-electron microscopy. Proc. Natl. Acad. Sci. USA 2007, 104, 3777. [Google Scholar]
  50. Briegel, A.; Ding, H.J.; Li, Z.; Werner, J.; Gitai, Z.; Dias, D.P.; Jensen, R.B.; Jensen, G.J. Location and architecture of the Caulobacter crescentus chemoreceptor array. Mol. Microbiol 2008, 69, 30–41. [Google Scholar]
  51. Khursigara, C.M.; Wu, X.; Subramaniam, S. Chemoreceptors in Caulobacter crescentus: Trimers of receptor dimers in a partially ordered hexagonally packed array. J. Bacteriol 2008, 190, 6805–6810. [Google Scholar]
  52. Briegel, A.; Ortega, D.R.; Tocheva, E.I.; Wuichet, K.; Li, Z.; Chen, S.; Müller, A.; Iancu, C.V.; Murphy, G.E.; Dobro, M.J.; et al. Universal architecture of bacterial chemoreceptor arrays. Proc. Natl. Acad. Sci. USA 2009, 106, 17181–17186. [Google Scholar]
  53. Khursigara, C.M.; Lan, G.; Neumann, S.; Wu, X.; Ravindran, S.; Borgnia, M.J.; Sourjik, V.; Milne, J.; Tu, Y.; Subramaniam, S. Lateral density of receptor arrays in the membrane plane influences sensitivity of the E. coli chemotaxis response. EMBO J 2011, 30, 1719–1729. [Google Scholar]
  54. Briegel, A.; Li, X.; Bilwes, A.M.; Hughes, K.T.; Jensen, G.J.; Crane, B.R. Bacterial chemoreceptor arrays are hexagonally packed trimers of receptor dimers networked by rings of kinase and coupling proteins. Proc. Natl. Acad. Sci. USA 2012, 109, 3766–3771. [Google Scholar]
  55. Liu, J.; Hu, B.; Morado, D.R.; Jani, S.; Manson, M.D.; Margolin, W. Molecular architecture of chemoreceptor arrays revealed by cryoelectron tomography of Escherichia coli minicells. Proc. Natl. Acad. Sci. USA 2012, 109, E1481–E1488. [Google Scholar]
  56. Cardozo, M.J.; Massazza, D.A.; Parkinson, J.S.; Studdert, C.A. Disruption of chemoreceptor signalling arrays by high levels of CheW, the receptor–kinase coupling protein. Mol. Microbiol 2010, 75, 1171–1181. [Google Scholar]
  57. Asinas, A.E.; Weis, R.M. Competitive and cooperative interactions in receptor signaling complexes. J. Biol. Chem 2006, 281, 30512–30523. [Google Scholar]
  58. Levit, M.N.; Grebe, T.W.; Stock, J.B. Organization of the receptor-kinase signaling array that regulates Escherichia coli chemotaxis. J. Biol. Chem 2002, 277, 36748–36754. [Google Scholar]
  59. Liu, Y.; Levit, M.; Lurz, R.; Surette, M.G.; Stock, J.B. Receptor-mediated protein kinase activation and the mechanism of transmembrane signaling in bacterial chemotaxis. EMBO J 1997, 16, 7231. [Google Scholar]
  60. Francis, N.R.; Wolanin, P.M.; Stock, J.B.; DeRosier, D.J.; Thomas, D.R. Three-dimensional structure and organization of a receptor/signaling complex. Proc. Natl. Acad. Sci. USA 2004, 101, 17480–17485. [Google Scholar]
  61. Li, M.; Hazelbauer, G.L. Cellular stoichiometry of the components of the chemotaxis signaling complex. J. Bacteriol 2004, 186, 3687–3694. [Google Scholar]
  62. Li, M.; Hazelbauer, G.L. Core unit of chemotaxis signaling complexes. Proc. Natl. Acad. Sci. USA 2011, 108, 9390–9395. [Google Scholar]
  63. Thiem, S.; Kentner, D.; Sourjik, V. Positioning of chemosensory clusters in E. coli and its relation to cell division. EMBO J 2007, 26, 1615–1623. [Google Scholar]
  64. Lybarger, S.R.; Maddock, J.R. Clustering of the chemoreceptor complex in Escherichia coli is independent of the methyltransferase CheR and the methylesterase CheB. J. Bacteriol 1999, 181, 5527–5529. [Google Scholar]
  65. Lybarger, S.R.; Nair, U.; Lilly, A.A.; Hazelbauer, G.L.; Maddock, J.R. Clustering requires modified methyl-accepting sites in low-abundance but not high-abundance chemoreceptors of Escherichia coli. Mol. Microbiol 2005, 56, 1078–1086. [Google Scholar]
  66. Amin, D.N.; Hazelbauer, G.L. The chemoreceptor dimer is the unit of conformational coupling and transmembrane signaling. J. Bacteriol 2010, 192, 1193–1200. [Google Scholar]
  67. Li, G.; Weis, R.M. Covalent modification regulates ligand binding to receptor complexes in the chemosensory system of Escherichia coli. Cell 2000, 100, 357–365. [Google Scholar]
  68. Hall, B.A.; Armitage, J.P.; Sansom, M.S.P. Mechanism of bacterial signal transduction revealed by molecular dynamics of Tsr dimers and trimers of dimers in lipid vesicles. PLoS Comput. Biol 2012, 8, e1002685. [Google Scholar]
  69. Winston, S.E.; Mehan, R.; Falke, J.J. Evidence that the adaptation region of the aspartate receptor is a dynamic four-helix bundle: Cysteine and disulfide scanning studies. Biochemistry 2005, 44, 12655–12666. [Google Scholar]
  70. Starrett, D.J.; Falke, J.J. Adaptation mechanism of the aspartate receptor: Electrostatics of the adaptation subdomain play a key role in modulating kinase activity. Biochemistry 2005, 44, 1550. [Google Scholar]
  71. Bass, R.B.; Falke, J.J. Detection of a conserved α-helix in the kinase-docking region of the aspartate receptor by cysteine and disulfide scanning. J. Biol. Chem 1998, 273, 25006–25014. [Google Scholar]
  72. Irieda, H.; Homma, M.; Homma, M.; Kawagishi, I. Control of chemotactic signal gain via modulation of a pre-formed receptor array. J. Biol. Chem 2006, 281, 23880–23886. [Google Scholar]
  73. Vaknin, A.; Berg, H.C. Osmotic stress mechanically perturbs chemoreceptors in Escherichia coli. Proc. Natl. Acad. Sci. USA 2006, 103, 592–596. [Google Scholar]
  74. Vaknin, A.; Berg, H.C. Physical responses of bacterial chemoreceptors. J. Mol. Biol 2007, 366, 1416–1423. [Google Scholar]
  75. Spiro, P.A.; Parkinson, J.S.; Othmer, H.G. A model of excitation and adaptation in bacterial chemotaxis. Proc. Nat. Acad. Sci. USA 1997, 94, 7263–7268. [Google Scholar]
  76. Cluzel, P.; Surette, M.; Leibler, S. An ultrasensitive bacterial motor revealed by monitoring signaling proteins in single cells. Science 2000, 287, 1652–1655. [Google Scholar]
  77. Goldbeter, A.; Koshland, D.E., Jr. Simple molecular model for sensing and adaptation based on receptor modification with application to bacterial chemotaxis. J. Mol. Biol 1982, 161, 395–416. [Google Scholar]
  78. Asakura, S.; Honda, H. Two-state model for bacterial chemoreceptor proteins. J. Mol. Biol 1984, 176, 349–367. [Google Scholar]
  79. Othmer, H.G.; Monk, P.B.; Rapp, P.E. A model for signal relay and adaptation in Dictyostelium discoideum Part II. Analytical and numerical results. Math. Biosci 1985, 77, 77–139. [Google Scholar]
  80. Tang, Y.; Othmer, H.G. A G-protein-based model of adaptation in Dictyostelium discoideum. Math. Biosci 1994, 120, 25–76. [Google Scholar]
  81. Yi, T.M.; Huang, Y.; Simon, M.I.; Doyle, J. Robust perfect adaptation in bacterial chemotaxis through integral feedback control. Proc. Natl. Acad. Sci. USA 2000, 97, 4649–4653. [Google Scholar]
  82. Sontag, E.D. Adaptation and regulation with signal detection implies internal model. Syst. Control Lett 2003, 50, 119–126. [Google Scholar]
  83. Othmer, H.G.; Tang, Y. Oscillations and Waves in a Model of INSP3-controlled Calcium Dynamics. In Experimental and Theoretical Advances in Pattern Formation; Othmer, H.G., Maini, P.K., Murray, J.D., Eds.; Plenum Press: New York, NY, USA, 1993; pp. 277–313. [Google Scholar]
  84. Tang, Y.; Othmer, H.G. A model of calcium dynamics in cardiac myocytes based on the kinetics of ryanodine-sensitive calcium channels. Biophys. J 1994, 67, 2223–2235. [Google Scholar]
  85. Tang, Y.; Stephenson, J.L.; Othmer, H.G. Simplification and analysis of models of calcium dynamics based on IP3-sensitive calcium channel kinetics. Biophys. J 1996, 70, 246–263. [Google Scholar]
  86. Katz, B.; Thesleff, S. A study of the ‘desensitization’ produced by acetylcholine at the motor end-plate. J. Physiol 1957, 138, 63–80. [Google Scholar]
  87. Gero, A. Desensitization, two-state receptors and pharmacological parameters. J. Theor. Biol 1983, 103, 137–162. [Google Scholar]
  88. Segel, L. Incorporation of receptor kinetics into a model for bacterial chemotaxis. J. Theor. Biol 1976, 57, 23–42. [Google Scholar]
  89. Koshland, D., Jr. A response regulator model in a simple sensory system. Science 1977, 196, 1055–1063. [Google Scholar]
  90. Macnab, R.M.; Koshland, D.E. The Gradient-sensing mechanism in bacterial chemotaxis. Proc. Natl. Acad. Sci. USA 1972, 69, 2509–2512. [Google Scholar]
  91. Goldbeter, A.; Koshland, D., Jr. Simple molecular model for sensing and adaptation based on receptor modification with application to bacterial chemotaxis. J. Mol. Biol 1982, 161, 395–416. [Google Scholar]
  92. Segel, L.; Goldbeter, A.; Devreotes, P.; Knox, B. A mechanism for exact sensory adaptation based on receptor modification. J. Theor. Biol 1986, 120, 151–179. [Google Scholar]
  93. Bray, D.; Bourret, R.B.; Simon, M.I. Computer simulation of the phosphorylation cascade controlling bacterial chemotaxis. Mol. Biol. Cell 1993, 4, 469–482. [Google Scholar]
  94. Bray, D.; Bourret, R.B. Computer analysis of the binding reactions leading to a transmembrane receptor-linked multiprotein complex involved in bacterial chemotaxis. Mol. Biol. Cell 1995, 6, 1367–1380. [Google Scholar]
  95. Morton-Firth, C.; Bray, D. Predicting temporal fluctuations in an intracellular signaling pathway. J. Theor. Biol 1998, 192, 117–128. [Google Scholar]
  96. Barkai, N.; Leibler, S. Robustness in simple biochemical networks. Nature 1997, 387, 913–917. [Google Scholar]
  97. Shi, Y.; Duke, T. Cooperative model of bacterial sensing. Phys. Rev. E 1998, 58, 6399–6406. [Google Scholar]
  98. Shi, Y. Adaptive Ising model and bacterial chemotactic receptor network. Europhys. Lett 2000, 50, 113–119. [Google Scholar]
  99. Morton-Firth, C.J.; Shimizu, T.S.; Bray, D. A free-energy-based stochastic simulation of the tar receptor complex. J. Mol. Biol 1999, 286, 1059–1074. [Google Scholar]
  100. Mello, B.A.; Tu, Y. Quantitative modeling of sensitivity in bacterial chemotaxis: The role of coupling among different chemoreceptor species. Proc. Natl. Acad. Sci. USA 2003, 100, 8223–8228. [Google Scholar]
  101. Goldman, J.; Andrews, S.; Bray, D. Size and composition of membrane protein clusters predicted by Monte Carlo analysis. Europ. Biophys. J 2004, 33, 506–512. [Google Scholar]
  102. Albert, R.; Chiu, Y.; Othmer, H.G. Dynamic receptor team formation can explain the high signal transduction gain in Escherichia coli. Biophys. J 2004, 86, 2650–2659. [Google Scholar]
  103. Liberman, L.; Berg, H.C.; Sourjik, V. Effect of chemoreceptor modification on assembly and activity of the receptor-kinase complex in Escherichia coli. J. Bacteriol 2004, 186, 6643–6646. [Google Scholar]
  104. Bornhorst, J.A.; Falke, J.J. Evidence that both ligand binding and covalent adaptation drive a two-state equilibrium in the aspartate receptor signaling complex. J. Gen. Physiol 2001, 118, 693–710. [Google Scholar]
  105. Li, M.; Hazelbauer, G.L. Adaptational assistance in clusters of bacterial chemoreceptors. Mol. Microbiol 2005, 56, 1617–1626. [Google Scholar]
  106. Keymer, J.E.; Endres, R.G.; Skoge, M.; Meir, Y.; Wingreen, N.S. Chemosensing in Escherichia coli: Two regimes of two-state receptors. Proc. Natl. Acad. Sci. USA 2006, 103, 1786–1791. [Google Scholar]
  107. Mello, B.A.; Tu, Y. An allosteric model for heterogeneous receptor complexes: Understanding bacterial chemotaxis responses to multiple stimuli. Proc. Natl. Acad. Sci. USA 2005, 102, 17354–17359. [Google Scholar]
  108. Shrout, A.; Montefusco, D.; Weis, R. Template-directed assembly of receptor signaling complexes. Biochemistry 2003, 42, 13379–13385. [Google Scholar]
  109. Lai, R.; Manson, J.; Bormans, A.; Draheim, R.; Nguyen, N.; Manson, M. Cooperative signaling among bacterial chemoreceptors. Biochemistry 2005, 44, 14298–14307. [Google Scholar]
  110. Endres, R.G.; Wingreen, N.S. Precise adaptation in bacterial chemotaxis through “assistance neighborhoods”. Proc. Natl. Acad. Sci. USA 2006, 103, 13040. [Google Scholar]
  111. Kollmann, M.; Loevdok, L.; Bartholome, K.; Timmer, J.; Sourjik, V. Design principles of a bacterial signalling network. Nature 2005, 438, 504–507. [Google Scholar]
  112. Tu, Y.; Shimizu, T.; Berg, H. Modeling the chemotactic response of Escherichia coli to timevarying stimuli. Proc. Natl. Acad. Sci. USA 2008, 105, 14855–14860. [Google Scholar]
  113. Hauri, D.C.; Ross, J. A model of excitation and adaptation in bacterial chemotaxis. Biophys. J 1995, 68, 708–722. [Google Scholar]
  114. Levin, M.D.; Morton-Firth, C.J.; Abouhamad, W.N.; Bourret, R.B.; Bray, D. Origins of individual swimming behavior in bacteria. Biophys. J 1998, 74, 175–181. [Google Scholar]
  115. Almogy, G.; Stone, L.; Ben-Tal, N. Multi-stage regulation, a key to reliable adaptive biochemical pathways. Biophysical journal 2001, 81, 3016–3028. [Google Scholar]
  116. Mello, B.A.; Tu, Y. Perfect and near-perfect adaptation in a model of bacterial chemotaxis. Biophys. J 2003, 84, 2943–2956. [Google Scholar]
  117. Arocena, M.; Acerenza, L. Necessary conditions for a minimalmodel of receptor to show adaptive response over a wide range of levels of stimulus. Jour. Theor. Biol 2004, 229, 45–57. [Google Scholar]
  118. Bray, D.; Levin, M.D.; Morton-Firth, C.J. Receptor clustering as a cellular mechanism to control sensitivity. Nature 1998, 393, 85–88. [Google Scholar]
  119. Duke, T.A.J.; Bray, D. Heightened sensitivity of a lattice of membrane receptors. Proc. Natl. Acad. Sci. USA 1999, 96, 10104–10108. [Google Scholar]
  120. Shi, Y. Effects of thermal fluctuation and the receptor-receptor interaction in bacterial chemotactic signaling and adaptation. Phys. Rev. E 2001, 64, 1–8. [Google Scholar]
  121. Shi, Y. Clustering and signalling of cell receptors. Phys. Stat. Mech. Appl 2002, 311, 199–212. [Google Scholar]
  122. Levin, M.; Shimizu, T.; Bray, D. Binding and diffusion of CheR molecules within a cluster of membrane receptors. Biophys. J 2002, 82, 1809–1817. [Google Scholar]
  123. Shimizu, T.S.; Aksenov, S.V.; Bray, D. A spatially extended stochastic model of the bacterial chemotaxis signalling pathway. J. Mol. Biol 2003, 329, 291–309. [Google Scholar]
  124. Mello, B.A.; Shaw, L.; Tu, Y. Effects of receptor interaction in bacterial chemotaxis. Biophys. J 2004, 87, 1578–1595. [Google Scholar]
  125. Monod, J.; Wyman, J.; Changeux, J.P. On the nature of allosteric transitions: A plausible model. J. Mol. Biol 1965, 12, 88–118. [Google Scholar]
  126. Mello, B.A.; Tu, Y. Effects of adaptation in maintaining high sensitivity over a wide range of backgrounds for Escherichia coli chemotaxis. Biophys. J 2007, 92, 2329–2337. [Google Scholar]
  127. Hansen, C.H.; Endres, R.G.; Wingreen, N.S.; Bourne, P.E. Chemotaxis in Escherichia coli: A molecular model for robust precise adaptation. PLoS Comput. Biol 2008, 4, e1. [Google Scholar]
  128. Meir, Y.; Jakovljevic, V.; Oleksiuk, O.; Sourjik, V.; Wingreen, N. Precision and kinetics of adaptation in bacterial chemotaxis. Biophys. J 2010, 99, 2766–2774. [Google Scholar]
  129. Skoge, M.L.; Endres, R.G.; Wingreen, N.S. Receptor-receptor coupling in bacterial chemotaxis: Evidence for strongly coupled clusters. Biophys. J 2006, 90, 4317–4326. [Google Scholar]
  130. Rao, C.V.; Frenklach, M.; Arkin, A.P. An allosteric model for transmembrane signaling in bacterial chemotaxis. J. Mol. Biol 2004, 343, 291–303. [Google Scholar]
  131. Endres, R.G.; Falke, J.J.; Wingreen, N.S. Chemotaxis receptor complexes: From signaling to assembly. PLoS Comput. Biol 2007, 3, 1385–1393. [Google Scholar]
  132. Park, M.J.; Dahlquist, F.W.; Doyle, F.J., III. Simultaneous high gain and wide dynamic range in a model of bacterial chemotaxis. IET Syst. Biol 2007, 1, 222–229. [Google Scholar]
  133. Endres, R.; Oleksiuk, O.; Hansen, C.; Meir, Y.; Sourjik, V.; Wingreen, N. Variable sizes of Escherichia coli chemoreceptor signaling teams. Mol. Syst. Biol 2008, 4, 211–219. [Google Scholar]
  134. Hansen, C.; Sourjik, V.; Wingreen, N. A dynamic-signaling-team model for chemotaxis receptors in Escherichia coli. Proc. Natl. Acad. Sci. USA 2010, 107, 17170–17175. [Google Scholar]
  135. Lipkow, K.; Andrews, S.S.; Bray, D. Simulated diffusion of phosphorylated CheY through the cytoplasm of Escherichia coli. J. Bacteriol 2005, 187, 45–53. [Google Scholar]
  136. Lipkow, K. Changing cellular location of CheZ predicted by molecular simulations. PLoS Comput. Biol 2006, 2, e39. [Google Scholar]
  137. Endres, R. Polar chemoreceptor clustering by coupled trimers of dimers. Biophys. J 2009, 96, 453–463. [Google Scholar]
  138. Rao, C.V.; Kirby, J.R.; Arkin, A.P. Design and diversity in bacterial chemotaxis: A comparative study in Escherichia coli and Bacillus subtilis. PLoS Biol 2004, 2, 239–252. [Google Scholar]
  139. Roberts, M.; August, E.; Hamadeh, A.; Maini, P.; McSharry, P.; Armitage, J.; Papachristodoulou, A. A model invalidation-based approach for elucidating biological signalling pathways, applied to the chemotaxis pathway in R. sphaeroides. BMC Syst. Biol 2009, 3, 105. [Google Scholar]
  140. Tindall, M.; Porter, S.; Maini, P.; Armitage, J. Modeling chemotaxis reveals the role of reversed phosphotransfer and a bi-functional kinase-phosphatase. PLoS Comput. Biol 2010, 6, e1000896. [Google Scholar]
  141. Hamadeh, A.; Roberts, M.; August, E.; McSharry, P.; Maini, P.; Armitage, J.; Papachristodoulou, A. Feedback control architecture and the bacterial chemotaxis network. PLoS Comput. Biol 2011, 7, e1001130. [Google Scholar]
  142. Clausznitzer, D.; Oleksiuk, O.; Løvdok, L.; Sourjik, V.; Endres, R. Chemotactic response and adaptation dynamics in Escherichia coli. PLoS Comput. Biol 2010, 6, e1000784. [Google Scholar]
  143. Xin, X.; Othmer, H. A “Trimer of Dimers”-based model for the chemotactic signal transduction network in bacterial chemotaxis. Bull. Math. Biol 2012, 74, 2339–2382. [Google Scholar]
  144. Tindall, M.J.; Porter, S.L.; Maini, P.K.; Gaglia, G.; Armitage, J.P. Overview of mathematical approaches used to model bacterial chemotaxis I: The single cell. Bull. Math. Biol 2008, 70, 1525–1569. [Google Scholar]
  145. Xin, X. Mathematical Models of Bacterial Chemotaxis. Ph.D. Dissertation, University of Minnesota, Minneapolis, MN, USA, 2010. [Google Scholar]
  146. Budrene, E.O.; Berg, H.C. Dynamics of formation of symmetrical patterns by chemotactic bacteria. Nature 1995, 376, 49–53. [Google Scholar]
  147. Woodward, D.; Tyson, R.; Myerscough, M.; Murray, J.; Budrene, E.; Berg, H. Spatio-temporal patterns generated by Salmonella typhimurium. Biophys. J 1995, 68, 2181–2189. [Google Scholar]
  148. Ben-Jacob, E.; Schochet, O.; Tenenbaum, A.; Cohen, I.; Czirok, A. Generic modelling of cooperative growth patterns in bacterial colonies. Nature 1994, 368, 46–49. [Google Scholar]
  149. Ben-Jacob, E.; Cohen, I.; Czirok, A.; Vicsek, T.; Gutnick, D.L. Chemomodulation of cellular movement, collective formation of vortices by swarming bacteria, and colonial development. Physica A 1997, 238, 181–197. [Google Scholar]
  150. Law, A.M.J.; Aitken, M.D. Continuous-flow capillary assay for measuring bacterial chemotaxis. Appl. Environ. Microbiol 2005, 71, 3137–3143. [Google Scholar]
  151. Kalinin, Y.V.; Jiang, L.; Tu, Y.; Wu, M. Logarithmic sensing in Escherichia coli bacterial chemotaxis. Biophys. J 2009, 96, 2439–2448. [Google Scholar]
  152. Saragosti, J.; Calvez, V.; Bournaveas, N.; Perthame, B.; Buguin, A.; Silberzan, P. Directional persistence of chemotactic bacteria in a traveling concentration wave. Proc. Nat. Acad. Sci. USA 2011, 108, 16235–16240. [Google Scholar]
  153. Pandey, G.; Jain, R.K. Bacterial chemotaxis toward environmental pollutants: Role in bioremediation. Appl. Environ. Microbiol 2002, 68, 5789–5795. [Google Scholar]
  154. Law, A.M.J.; Aitken, M.D. Bacterial chemotaxis to naphthalene desorbing from a nonaqueous liquid. Appl. Environ. Microbiol 2003, 69, 5968–5973. [Google Scholar]
  155. Ben-Jacob, E.; Cohen, I.; Levine, H. Cooperative self-organization of microorganisms. Adv. Phys 2000, 49, 395–554. [Google Scholar]
  156. Kaiser, D. Coupling cell movement to multicellular development in myxobacteria. Nat. Rev. Microbiol 2003, 1, 45–54. [Google Scholar]
  157. Kaiser, D. Myxococcus–from single-cell polarity to complex multicellular patterns. Ann. Rev. Genet 2008, 42, 109–130. [Google Scholar]
  158. Wu, Y.; Kaiser, A.D.; Jiang, Y.; Alber, M.S. Periodic reversal of direction allows Myxobacteria to swarm. Proc. Natl. Acad. Sci. USA 2009, 106, 1222–1227. [Google Scholar]
  159. Wu, Y.; Jiang, Y.; Kaiser, A.D.; Alber, M. Self-organization in bacterial swarming: Lessons from myxobacteria. Phys. Biol 2011, 8, 055003. [Google Scholar]
  160. Du, H.; Xu, Z.; Shrout, J.D.; Alber, M. Multiscale modeling of Pseudomonas aeruginosa Swarming. Math. Models Methods Appl. Sci 2011, 21, 939–954. [Google Scholar]
  161. Be’er, A.; Zhang, H.P.; Florin, E.L.; Payne, S.M.; Ben-Jacob, E.; Swinney, H.L. Deadly competition between sibling bacterial colonies. Proc. Natl. Acad. Sci. USA 2009, 106, 428–433. [Google Scholar]
  162. Be’er, A.; Ariel, G.; Kalisman, O.; Helman, Y.; Sirota-Madi, A.; Zhang, H.P.; Florin, E.L.; Payne, S.M.; Ben-Jacob, E.; Swinney, H.L. Lethal protein produced in response to competition between sibling bacterial colonies. Proc. Natl. Acad. Sci. USA 2010, 107, 6258–6263. [Google Scholar]
  163. Wang, Q.; Zhang, T. Review of mathematical models for biofilms. Solid State Commun 2010, 150, 1009–1022. [Google Scholar]
  164. Cogan, N.G.; Gunn, J.S.; Wozniak, D.J. Biofilms and infectious diseases: Biology to mathematics and back again. FEMS Microbiol. Lett 2011, 322, 1–7. [Google Scholar]
  165. Cogan, N.G.; Wolgemuth, C.W. Two-dimensional patterns in bacterial veils arise from self-generated, three-dimensional fluid flows. Bull. Math. Biol 2011, 73, 212–229. [Google Scholar]
  166. Mittal, N.; Budrene, E.O.; Brenner, M.P.; Oudenaarden, A. Motility of Escherichia coli cells in clusters formed by chemotactic aggregation. Proc. Natl. Acad. Sci. USA 2003, 100, 13259–63. [Google Scholar]
  167. Adler, J. Chemotaxis in bacteria. Science 1966, 153, 708–716. [Google Scholar]
  168. Saragosti, J.; Calvez, V.; Bournaveas, N.; Buguin, A.; Silberzan, P.; Perthame, B. Mathematical description of bacterial traveling pulses. PLoS Comput. Biol 2010, 6, e1000890. [Google Scholar]
  169. Saragosti, J.; Calvez, V.; Bournaveas, N.; Perthame, B.; Buguin, A.; Silberzan, P. Directional persistence of chemotactic bacteria in a traveling concentration wave. Proc. Natl. Acad. Sci. USA 2011, 108, 16235–16240. [Google Scholar]
  170. Xue, C.; Budrene, E.O.; Othmer, H.G. Radial and spiral stream formation in Proteus mirabilis colonies. PLoS Comput. Biol 2011, 7, e1002332. [Google Scholar]
  171. Frymier, P.D.; Ford, R.M.; Berg, H.C.; Cummings, P.T. Three-dimensional tracking of motile bacteria near a solid planar surface. Proc. Natl. Acad. Sci. USA 1995, 92, 6195–6199. [Google Scholar]
  172. DiLuzio, W.R.; Turner, L.; Mayer, M.; Garstecki, P.; Weibel, D.B.; Berg, H.C.; Whitesides, G.M. Escherichia coli swim on the right-hand side. Nature 2005, 435, 1271–1274. [Google Scholar]
  173. Keller, E.F.; Segel, L.A. Traveling bands of chemotactic bacteria: A theoretical analysis. J. Theor. Biol 1971, 30, 235–248. [Google Scholar]
  174. Lapidus, I.R.; Schiller, R. A model for traveling bands of chemotactic bacteria. Biophys J 1978, 22, 1–13. [Google Scholar]
  175. Lauffenburger, D.; Kennedy, C.R.; Aris, R. Traveling bands of chemotactic bacteria in the context of population growth. Bull. Math. Biol 1984, 46, 19–40. [Google Scholar]
  176. Ben-Jacob, E.; Cohen, I.; Shochet, O.; Aranson, I.; Levine, H. Complex bacterial patterns. Nature 1995, 373, 566–557. [Google Scholar]
  177. Tsimring, L.; Levine, H.; A.I.; Ben-Jacob, E.; Cohen, I.; Shochet, O.; Reynolds, W.N. Aggregation patterns in stressed bacteria. Phys. Rev. Let 1995, 75, 1859–1862. [Google Scholar]
  178. Tyson, R.; Lubkin, S.R.; Murray, J.D. A minimal mechanism for bacterial pattern formation. Proc. R. Soc. Lond. B 1999, 266, 299–304. [Google Scholar]
  179. Tyson, R.; Lubkin, S.R.; Murray, J.D. Model and analysis of chemotactic bacterial patterns in a liquid medium. J. Math. Biol 1999, 38, 359–375. [Google Scholar]
  180. Tyson, R.; Stern, L.G.; LeVeque, R.J. Fractional step methods applied to a chemotaxis model. J. Math. Biol 2000, 41, 455–475. [Google Scholar]
  181. Polezhaev, A.A.; Pashkov, R.A.; Lobanov, A.I.; Petrov, I.B. Spatial patterns formed by chemotactic bacteria Escherichia coli. Int. J. Dev. Biol 2006, 50, 311–338. [Google Scholar]
  182. Calvez, V.; Perthame, B. A Lyapunov function for a two-chemical species version of the chemotaxis model. BIT Numer. Math 2006, 46, 85–97. [Google Scholar]
  183. Hillen, T.; Painter, K.J. A user’s guide to PDE models for chemotaxis. J. Math. Biol 2009, 58, 183–217. [Google Scholar]
  184. Horstmann, D. From 1970 until present: The Keller-Segel model in chemotaxis and its consequences. Jahresbericht der DMV 2003, 105, 103–165. [Google Scholar]
  185. Brenner, M.; Levitov, L.; Budrene, E. Physical mechanisms for chemotactic pattern formation by bacteria. Biophys. J 1998, 74, 1677–1693. [Google Scholar]
  186. Betterton, M.D.; Brenner, M.P. Collapsing bacterial cylinders. Phys. Rev. E 2001, 64, 061904. [Google Scholar]
  187. Othmer, H.G.; Painter, K.J.; Umulis, D.; Xue, C. The intersection of theory and application in elucidating pattern formation in developmental biology. Math. Model. Nat. Phenom 2009, 4, 3–82. [Google Scholar]
  188. Franz, B.; Erban, R. Hybrid Modelling of Individual Movement and Collective Behaviour. In Dispersal, Individual Movement and Spatial Ecology: A Mathematical Perspective; 2013; to appear. [Google Scholar]
  189. Xue, C.; Othmer, H.G. Multiscale models of taxis-driven patterning in bacterial populations. SIAM J. Appl. Math 2009, 70, 133–167. [Google Scholar]
  190. Franz, B.; Xue, C.; Painter, K.J.; Erban, R. Travelling waves in hybrid chemotaxis models. submitted. 2013. [Google Scholar]
  191. Jiang, L.; Ouyang, Q.; Tu, Y. Quantitative modeling of Escherichia coli chemotactic motion in environments varying in space and time. PLoS Comput. Biol 2010, 6, e1000735. [Google Scholar]
  192. Zhu, X.; Si, G.; Deng, N.; Ouyang, Q.; Wu, T.; He, Z.; Jiang, L.; Luo, C.; Tu, Y. Frequency-dependent Escherichia coli chemotaxis behavior. Phys. Rev. Lett 2012, 108, 128101. [Google Scholar]
  193. Patlak, C.S. Random walk with persistence and external bias. Bull. Math. Biophys 1953, 15, 311–338. [Google Scholar]
  194. Alt, W. Biased random walk models for chemotaxis and related diffusion approximations. J. Math. Biol 1980, 9, 147–177. [Google Scholar]
  195. Othmer, H.G.; Dunbar, S.R.; Alt, W. Models of dispersal in biological systems. J. Math. Biol 1988, 26, 263–298. [Google Scholar]
  196. Hillen, T.; Othmer, H.G. The diffusion limit of transport equations derived from velocity-jump processes. SIAM J. Appl. Math 2000, 61, 751–775. [Google Scholar]
  197. Othmer, H.G.; Hillen, T. The diffusion limit of transport equations II: Chemotaxis equations. SIAM J. Appl. Math 2002, 62, 1222–1250. [Google Scholar]
  198. Chen, K.C.; Ford, R.M.; Cummings, P.T. Cell balance equation for chemotactic bacteria with a biphasic tumbling frequency. J. Math. Biol 2003, 47, 518–546. [Google Scholar]
  199. Othmer, H.G.; Stevens, A. Aggregation, blowup, and collapse: The ABC’s of taxis in reinforced random walks. SIAM J. Appl. Math 1997, 57, 1044–1081. [Google Scholar]
  200. Alber, M.; Chen, N.; Glimm, T.; Lushnikov, P.M. Multiscale dynamics of biological cells with chemotactic interactions: From a discrete stochastic model to a continuous description. Phys. Rev. E Stat. Nonlin. Soft Matt. Phys 2006, 73, 051901. [Google Scholar]
  201. Lushnikov, P.M.; Chen, N.; Alber, M. Macroscopic dynamics of biological cells interacting via chemotaxis and direct contact. Phys. Rev. E Stat. Nonlin. Soft Matt. Phys 2008, 78, 061904. [Google Scholar]
  202. Levy, D.; Requeijo, T. Modeling group dynamics of phototaxis: From particle systems to PDEs. Discret. Contin. Dyn. Syst. Series B 2008, 9, 103. [Google Scholar]
  203. Ha, S.Y.; Levy, D. Particle, kinetic and fluid models for phototaxis. Discret. Contin. Dyn. Syst. B 2009, 12, 77–108. [Google Scholar]
  204. Erban, R.; Othmer, H.G. From individual to collective behavior in bacterial chemotaxis. SIAM J. Appl. Math 2004, 65, 361–391. [Google Scholar]
  205. Erban, R.; Othmer, H. From signal transduction to spatial pattern formation in E. coli: A paradigm for multiscale modeling in biology. Multiscale Model. Simul 2005, 3, 362–394. [Google Scholar]
  206. Si, G.; Wu, T.; Ouyang, Q.; Tu, Y. Pathway-based mean-field model for Escherichia coli chemotaxis. Phys. Rev. Lett 2012, 109, 048101. [Google Scholar]
Figure 1. Two examples of the response of an adapting system to changes in the stimulus level. We show the predicted cyclic AMP (cAMP) relay response, as measured by the secreted cAMP, to extracellular cAMP stimuli in the cellular slime mold Dictyostelium discoideum. Left: A step change in extracellular cAMP from 0 to 108 M elicits a single pulse of secreted cAMP. Right: The system responds and adapts to a sequence of step increases ranging from 109 M to 106 M, but at the highest stimulus the transduction system saturates. (From [1], with permission.)
Ijms 14 09205f1
Figure 2. A schematic of the signal transduction pathway in E. coli. The trimer of chemoreceptor homodimers spans the cytoplasmic membrane, with a ligand-binding domain on the periplasmic side and a signaling domain on the cytoplasmic side. The cytoplasmic signaling proteins, denoted Che in the text, are identified by single letters, e.g., A = CheA. Proteins and reactions in red promote counterclockwise (CCW) rotation of flagella, and those in blue promote clockwise (CW) rotation of flagella. Receptor methylation sites involved in adaptation are shown as white (demethylated) and black (methylated) circles.
Ijms 14 09205f2
Figure 3. The structure of chemoreceptors. The schematic view of a chemoreceptor monomer (left) demonstrates the primary architecture consisting of ligand-binding domain (α1–α4), transmembrane domain (TM1–TM2), and cytoplasmic domain (α5–α9). The cytoplasmic domain can be further divided into four functional subdomains: the HAMP region, the adaptation region, the flexible bundle region, and the signaling region. The schematic view of a chemoreceptor homodimer (middle) illustrates the spatial organization, and the conformational changes of the homodimer involved in the excitation and adaptation phases are shown in the flowchart (right), summarized from [30].
Ijms 14 09205f3
Figure 4. Examples of various adapting and non-adapting systems. (a) A signal transduction pathway in which a specified upstream quantity adapts, but the output species further downstream does not, because the output depends on a non-adapting subcomponent of the upstream adapting quantity; (b) Similar to that in (a), except that here the upstream quantity does not adapt, but the subcomponent adapts, and so the output species adapts as well. We will see later that one may think of the adapting subcomponent as the sum of the states of the receptor containing phosphorylated CheA, and the upstream non-adapting quantity as some other function involving the various phosphorylated and unphosphorylated states; (c) An example of a signal transduction pathway in which a specified upstream quantity adapts, but the output species further downstream does not, because the output depends on both the adapting quantity and another non-adapting quantity; (d) An example of a signal transduction pathway in which a specified upstream quantity adapts, but the output specified further downstream does not because it depends on an intermediate subsystem which possesses more than one stable steady state. Transient changes in the upstream quantity may cause the intermediate subsystem to reach a steady state different from its prestimulus state.
Ijms 14 09205f4
Figure 5. The response to single (a) and multiple (b) steps in the signal for the model adapting system described by Equation (3) when f is a linear function.
Ijms 14 09205f5
Figure 6. Signal transduction network. The basic unit of the network is the signaling complex, denoted by T. The three indices used to denote the properties of the complex are shown in the upper left corner. In the reaction network, vertical transitions are ligand binding and release, horizontal transitions are methylation and demethylation, and front-to-rear and reverse transitions are kinase activation, deactivation, phosphorylation and dephosphorylation. The details of the phosphotransfer transitions are depicted at the left. Adopted with permission from [143].
Ijms 14 09205f6
Figure 7. Responses of receptor Tsr in vitro and cheRcheB mutants with varied expression levels of Tar or Tsr. (A) Simulated responses to MeAsp of cheRcheB mutant cells expressing only Tar at 1 (○), 2 (□) and 6 (◇) times the native level; (B) Simulated responses to serine of cheRcheB mutant cells expressing only Tsr at 0.3 (○), 0.7 (□) and 5 (◇) times the native level; (C) Simulated responses to MeAsp of cheRcheB mutant cells expressing Tsr at the native level and Tar at 0 (*), 0.6 (◇), 1 (○), 2 (□) and 6 (△) times the native level; (D) Simulated responses to serine of cheRcheB mutant cells expressing Tsr at the native level and Tar at 0 (*), 0.6 (◇), 1 (○), 2 (□) and 6 (△) times the native level; (E) Simulated responses to serine by the receptor Tsr at the methylation state QQQQ (○), QEQE (◇) and EEEE (△).
Ijms 14 09205f7
Figure 8. Simulated E. coli patterns by a cell-based model. (a) Network formation from an uniform cell lawn; (b) Aggregate formation from the network; (c) Traveling wave formation from a single inoculum in the center. Adapted from [187] with permission.
Ijms 14 09205f8
Figure 9. Spiral streams in a growing Proteus mirabilis colony. Reproduced from [170] with permission.
Ijms 14 09205f9
Figure 10. Comparison of solutions of the derived PDE (21) with stochastic simulations of the cell-based model. Parameters used: s0 = 20μ/s, λ0 = 1, b = 4. 104 cells are used for the cell-based model. Bars: histogram of the cell positions computed from the cell-based model with a total number 104 cells. Red lines: numerical solutions of Equation (21).
Ijms 14 09205f10
Table 1. Structure-function relationship of chemoreceptor clusters in E. coli chemotaxis.
DimerTrimer of dimersCluster of trimers
Ligand bindingYes
minimal structural unit
YesYes
Adaptational modificationYes
minimal structural unit
YesYes
Transmembrane signalingYes
minimal structural unit
YesYes
Kinase activity controlNoYes
minimal structural unit, core functional unit (maximal kinase activation)
Yes
CooperativityLow
Hill coefficient~1
Moderate
Hill coefficient~2-3; in wild-type cells and some cheR/cheB/cheRcheB mutant strains
High
Hill coefficient≫3; in cheRcheB mutant strains with Tar or Tsr highly overexpressed, in receptor Tsr in vitro
Table 2. Mathematical models of bacterial chemotaxis (1982–2012).
Excitation, adaptation, and robustness
ModelMethodsAssumptions and Outcomes
Goldbeter and Koshland Jr [91]ODEIncludes ligand binding and one-site methylation; Uses two-state assumption (methylated and demethylated); Demonstrates that perfect adaptation could be achieved via methylation whose reaction rates depend on receptor occupancy.
Block et al. [10]ODEUses two-state assumption (CW and CCW); Includes adaptation; Demonstrates that transition between the run and tumble states depends on adaptation to the sensory input.
Asakura and Honda [78]ODEIncludes ligand binding and multiple-site methylation; Uses two-state assumption (methylated and demethylated); Shows adaptation to attractants and repellents at both low and high background concentrations via multiple methylation.
Segel et al. [92]ODESimilar with Goldbeter and Koshland Jr [91] but allows receptor modification to occur on both ligand-free and ligand-bound receptors.
Bray et al. [93]ODEIncludes ligand binding, phosphorylation cascade, and motor control; Reproduces the motor bias response to step changes in attractants and repellents ; Does not include methylation/demethylation and model for adaptation.
Bray and Bourret [94]ODEModels the ternary MCP/CheA/CheWsignaling complex formation and adds it into Bray et al. [93] to study the effect of the signaling complex formation on motor bias.
Hauri and Ross [113]ODEModels the complete signal transduction pathway and reproduces the excitation and adaptation phases of bacterial chemotaxis in the experimentally agreed timescales; Assumes that CheA autophosphorylation rate dependent on the methylation level of receptors.
Spiro et al. [75]ODEModels the complete signal transduction pathway with reduced three methylation states and reproduces excitation and adaptation in the experimentally agreed timescales. Assumes the autophosphorylation rate increases with the methylation level, the methylation rate is greater for attractant-bound than attractant-free receptors, and the demethylation rate is independent of ligand binding of receptors.
Barkai and Leibler [96]ODEIncludes ligand binding and methylation/demethylation for a three-component system (MCP, CheR and CheB); Uses two-state assumption (active or inactive for receptors); Assumes that CheR works at saturation in a constant rate and CheB acts only on active receptors in a rate independent of ligand binding; Shows perfect adaptation of receptor activity and robustness of the ratio of adapted steady-state receptor activity over prestimulus activity for a wide range of parameter values.
Levin et al. [114]ODEInvestigates the effect of changes in chemotactic protein expression levels on the concentration of CheYp, and compares the fine-tuned and the robust adaptation models in this aspect.
Morton-Firth and Bray [95]Free-energy-based stochastic simulationIncludes phosphorylation cascade; Simulates the temporal fluctuation of CheYp.
Morton-Firth et al. [99]Free-energy-based stochastic simulationIncludes phosphorylation cascade (based on [95]) and methylation/demethylation (based on [96]); Assumes that CheR only methylates inactive receptors and CheBp only demethylates active receptors; Shows excitation and adaptation;
Yi et al. [81]ODEAnalyzes the Barkai and Leibler’s model and shows an integral feedback control imbedded in the system that leads to robust perfect adaptation.
Almogy et al. [115]ODEProposes an alternative adaptation mechanism that is through dephosphorylation of CheYp by both CheZ and the CheAs–CheZ complex rather than methylation/demethylation of receptors.
Mello and Tu [116]ODEStudies the robust adaptation problem analytically and proposes six conditions for achieving perfect adaptation, confirming those key assumptions that Barkai and Leibler use [96].
Arocena and Acerenza [117]ODEStudies the response range of bacterial chemotaxis, and shows the wider range when receptor modification is through methylation and phosphorylation than through attractant binding.
Kollmann et al. [111]ODEUses a simplified signaling network only including a single methylation site; Shows the robustness to the intercellular variation in chemotactic protein concentrations arising from gene expression, and the variation of CheYp is much smaller than that of other proteins.
Tu et al. [112]ODE, mean-field theorySimulates chemotactic responses to time-varying exponential ramp, sine wave, and impulsive signals.
Receptor clustering and signaling sensitivity
Bray et al. [118]probability analysisConceptual model; Shows that receptor clustering and conformational spread among neighboring receptors can explain high sensitivity.
Shi and Duke [97]statistical mechanics, Ising modelIsing-type model and mean-field theory applied; Shows that receptor coupling strength affects response more than attractant binding.
Duke and Bray [119]Monte Carlo methodsMonte Carlo simulation of [97]; Shows higher signaling sensitivity than the uncoupled system and ability to respond to over five order of magnitude of attractant concentrations.
Shi [98]statistical mechanics, Ising modelAdaptive Ising-type model with CheR, CheBp, and their negative feedback effect on receptor activity included; More robust than [97] because of relaxation of the filed strength assumptions; Shows high sensitivity.
Shi [120]Ising modelCompares simulations of the models [97,98] with experiments and shows good agreement on the ratio of attractant binding to receptor-receptor interactions, the adaptation time, as well as the ratio of pre- and post-stimulus CheA phosphorylation.
Shi [121]Ising model, Monte Carlo methodsConsiders the receptor movement and allows them to float; Shows strong correlation for neighboring receptors and exponential decay with increasing receptor-receptor distance.
Levin et al. [122]Monte Carlo methodsStudies effect of binding and diffusion of CheR through receptor clusters with the model [99]; Shows that if binding is within the physiological limits, CheR can access and modify a large number of receptors in cluster.
Shimizu et al. [123]Ising model, free-energy-based stochastic simulationIsing model incorporated into [99]; Compares effect of receptor array size and geometry on sensitivity, gain and signal-to-noise ratio; Reproduces overshoot.
Mello and Tu [100]Ising modelDeterministic version of Ising-type model; Includes receptor interactions between Tar and Tsr; Includes methylation/demethylation (same assumptions as [96,99]); Reproduces the FRET data on cheR/cheB/cheRcheB mutant and wild-type cells [15] using two different parameter sets.
Mello et al. [124]Ising model, mean-field theory, Monte Carlo methodsMean-field theory applied to and Monte Carlo simulation of [100].
Goldman et al. [101]Lattice gas model, Monte Carlo methodsApplies 2-D lattice gas model of protein association to chemoreceptor clusters.
Sourjik and Berg [39]MWC modelApplies MWC model to explain their FERT data.
Albert et al. [102]ODEModel for dynamic formation of trimer of dimers; Assumes the time scale of association and dissociation of trimer of dimers comparable to that of ligand binding and kinase activity, which was disproved later by experiments [103].
Rao et al. [130]MWC modelModel of static trimer of dimers; Reproduces in vitro kinase activity data on Tar [104] and Tsr [67] as well as in vivo data on mutant cells [15]
Mello and Tu [107]MWC modelGeneralizes MWC model for allosteric interaction and multiple signal integration in heterogeneous receptor clusters; Reproduces measured responses for 14 mutant strains with varied expression levels of Tar and/or Tsr [39].
Keymer et al. [106]MWC modelProposes two regimes for a two-state receptor: regime I is characterized by low to moderate kinase activity and a low, constant inhibition number for half-maximal activity Ki, in which coupling of receptors leads to high sensitivity (in the case of wild-type and cheR mutant cells); regime II is characterized by high kinase activity and a high Ki, increasing with the methylated level of receptors, in which coupling leads to high cooperativity (in the case of cheRcheB mutant cells); Accordingly proposes a modified MWC model; Reproduces Sourjik and Berg’s FRET data [15].
Endres and Wingreen [110]MWC modelAdaptation model based on ‘assistant-neighborhoods’ [105], using the key assumptions on CheR and CheBp as [96,99]; Incorporates the MWC model [106]; Shows sensitivity and adaptation for mixed-type receptors observed in [15]; Suggests two limits of adaptation to attractants: (1) saturation of ligand binding sites on receptors; (2) full methylation of receptors.
[129]MWC model, Ising modelCompares activity response of receptor clusters generated by one-dimensional Ising-type model, two-dimensional Ising-type model, and two-regime MWC-type model; Shows that the outputs of Ising-type models are not consistent with the FRET data on activity responses to steps of attractants for wild-type and cheR mutant cells [15], which the MWC-type model can reproduce; Suggests strongly-coupled receptor clusters.
Mello and Tu [126]MWC modelStudies the mechanism how the cells maintain high sensitivity over a wide range of backgrounds based on a simplified version of [107] for homogeneous receptor complexes.
Endres et al. [131]statistical mechanics, MWC modelModel of static trimer of dimers; Reproduces in vitro kinase activity data on Tar [104,108,109].
Park et al. [132]sensitivity analysisPerforms sensitivity analysis for trimer of dimers and shows enhanced signaling sensitivity compared with dimers.
Hansen et al. [127]MWC modelRobust adaptation model extended from [110] including binding and unbinding of CheR and CheBp; Analyzes adaptation limits from the angle of CheR and CheB kinetics.
Endres et al. [133]MWC model, statistical methodDetermines the sizes of signaling clusters through best fitting in vivo FRET data with the model [106] using statistical PCA method; Shows the cluster sizes increasing with methylation levels.
Hansen et al. [134]statistical mechanics, MWC modelModel of dynamic signaling clusters of trimers of dimers, the boundaries of which are variable in simulation; Shows stronger coupling of active trimers of dimers than inactive.
Meir et al. [128]MWC model, ODEAnalyzes the characteristics of precise adaptation and finds the asymmetries (i.e., different adaptation time) in responses to addition and removal of attractants; Proposes two possible sources of the asymmetry: (1) dynamic phosphorylation of CheB and (2) scarcity of methylation site.
Clausznitzer et al. [142]MWC model, ODEStudies the dynamics (time courses) of adaptation and evaluate the existing adaptation models.
Khursigara et al. [53]MWC modelStudy with experiments and simulations combined; A cutoff distance used to determine the range of interacting receptors and the size of signaling receptor clusters variable; Shows that the size of receptor arrays is relatively stable, non-correlated with the protein expression level, and the packing density is slightly varied in difficult growth media.
Xin and Othmer [143]ODEModel of trimer of dimers; Simulates dynamics for the overall pathway; Explains a line of in vitro kinase activity data on Tar and Tsr [67,104,108,109] and in vivo FRET data in mutant cells [15] with the single trimer without higher-order clusters; Shows enhanced sensitivity and robustness to protein expressions generated by trimer of dimers.
Other features
Rao et al. [138]ODECompares signaling pathways between E. coli and Bacillus subtilis; Shows robust adaptation in both pathways but B. subtilis can perform methylation-independent chemotaxis because of existence of CheV-CheY pathway.
Lipkow et al. [135]spatiotemporal stochastic simulation3D stochastic simulation of CheY phosphorylation, CheY/CheYp diffusion, CheYp binding to FliM and dephosphorylation; Studies effects of CheZ localization, motor position, and macromolecular crowding on spatial concentration of CheYp; Shows a constant concentration of CheYp throughout the cytoplasm when CheZ is restricted to anterior ends and an exponential gradient across the length of the cell when CheZ diffuses freely.
Lipkow [136]spatiotemporal stochastic simulationStudies the effect of CheZ localization; Suggests that clustering of CheZ–CheAs–CheYp at the cell poles, introducing a negative feedback to the CheYp level, serves a secondary adaptation mechanism and explains the overshoot of CheYp in cheRcheB mutant cells.
Endres [137]statistical mechanicsFree energy-based model for formation of clusters of trimer of dimers; Studies the determining factors of the size of polar receptor clusters.
Roberts et al. [139]ODEDevelops a control engineering method and applies it to elucidating the signaling pathways of Rhodobacter sphaeroides chemotaxis.
Tindall et al. [140]ODEStudies the signal integration mechanism in Rhodobacter sphaeroides chemotaxis.
Hamadeh et al. [141]control theoryStudies the feedback configuration of Rhodobacter sphaeroides; Shows the role of cascade control in achieving robust functions.
Table 3. Free-energy levels for a pure-type trimer of dimers.
StateFree-energy Level (unit: kBT)
On with 0 ligand bound E o n m
On with 1 ligands bound E o n m - log ( 3 L K d 1 o n , m )
On with 2 ligands bound E o n m - log ( 3 L 2 K d 1 o n , m K d 2 o n , m )
On with 3 ligands bound E o n m - log ( L 3 K d 1 o n , m K d 2 o n , m K d 3 o n , m )

Off with 0 ligand boundEoff
Off with 1 ligands bound E o f f - log ( 3 L K d 1 o f f , m )
Off with 2 ligands bound E o f f - log ( 3 L 2 K d 1 o f f , m K d 2 o f f , m )
Off with 3 ligands bound E o f f - log ( L 3 K d 1 o f f , m K d 2 o f f , m K d 3 o f f , m )

