
Does Heterogeneity in COVID-19 News Affect Asset Market? Monte-Carlo Simulation Based Wavelet Transform

1
Management Science Department, COMSATS University Islamabad, Islamabad 46000, Pakistan
2
Management Science Department, Bahria University Islamabad, Islamabad 44000, Pakistan
*
Author to whom correspondence should be addressed.
J. Risk Financial Manag. 2021, 14(10), 463; https://doi.org/10.3390/jrfm14100463
Submission received: 5 July 2021
/
Revised: 2 September 2021
/
Accepted: 16 September 2021
/
Published: 1 October 2021
(This article belongs to the Section Financial Markets)
Abstract
:The current study investigates the connectedness between US COVID-19 news, Dowes Jones Index (DJI), green bonds, gold, and bitcoin prices for the period 22 January 2020–3 August 2021. The study has employed wavelet coherency, the continuous wavelet transform, and the wavelet-based Granger causality methods to obtain the dependence result. The continuous wavelet transform (CWT) analysis reveals that the United States equity market prices are extremely sensitive with regard to spreading coronavirus (USCOVID-19) news and changes in the oil price. Green bonds, gold, and bitcoin have minimal connectedness with the equity market, which might lead to the hedge and safe haven role of these assets during the COVID-19 crisis period. Lastly, very strong comovement was found between bitcoin and gold during the entire sample. The results of the present study offer a number of fresh and noticeable policy implications for international investors and asset managers.
1. Introduction
Variation in financial assets prices is driven by number of macroeconomic variables and investors’ psychology, as supported by a number of studies since the 1980s (Flammer 2020; Kumar and Anandarao 2019; Hayes 2017). Though the efficient market hypothesis (EMH) asserts that prices of assets are entirely reflected by existing information, contrary to the EMH theory, accurately predicting the prices of financial assets is not possible due to the importance of investor sentiment (the news-based impact). Various studies (Ahmed and Huo 2020; Reboredo 2018; Baur and Lucey 2010) highlighting the importance of behavioral finance have pointed out that the news-based event is one of the major ingredients of change in respect of financial assets prices. The worst impact of pandemic news changes the pattern of investors thinking and enhances co-integration between different financial assets (Tang and Zhang 2020; Huynh et al. 2020; Gharib et al. 2020). Therefore, it is worth examining the co-movement between COVID-19 news and financial assets. We have chosen financial assets from four different markets, including the traditional commodity market, green market instrument, digital asset, and stock market. One of the important objectives of this study is to explore which market has the capability to withstand the volatility of USCOVID-19 news and also to explore connectedness with each other.
The public health department of each country and the WHO, performing the mediating role to convey the amount of risk faced by investors due to COVID-19 news, obviously shape the sentiments of investors towards the epidemic (Ahinkorah et al. 2020; Devpura and Narayan 2020; Shahzad et al. 2016a). Selling and buying decisions regarding financial assets, especially commodities, are mainly dependent upon circulating news. The commodity market represents one of the oldest asset classes and a safe haven investment due to the low correlation with the equity market. Although a cyclical trend has been observed in the commodity market, so too has the capability to readjust quickly (Hu et al. 2018; Raza et al. 2016). Gold is traditionally considered a safe haven asset due to its low correlation with traditional equity and bonds (Devpura and Narayan 2020; Clapp and Pillay 2017; Baur and Lucey 2010). According to (Iqbal et al. 2021; Caporin et al. 2021), the beauty of gold is that it loves negative news and retains value during the bullish and bearish news periods. These unique properties coupled with inflation hedging properties makes gold an attractive investment during bad news periods.
Oil is also considered an important investment commodity used in the production of services and goods, so the primary rationale is that changes in the price directly affect the earning or clash flow of firms, ultimately affecting the performance of the stock market. The literature argues (Iyke 2020; Ahmed and Huo 2020; Kisswani and Elian 2017) that the volatility in oil prices has been observed with changes in the macroeconomic and financial news. In the current scenario, a notable slump in the oil prices has been observed during the pandemic period. Investors are interestingly searching for alternative investments which provide relatively stable returns during the health crisis.
Green bonds and cryptocurrency markets are two potential avenues for investment other than the traditional commodity market. Green bonds act like ordinary bonds, fixed debt instrument were first issued by the European Investment Bank (EIB) in 2007. However, green bonds offer additional benefits to provide funding for green/environment related projects. Investment in this niche market has been growing rapidly, from $3.4 billion in 2012 to $156 billion in 2017, so green bonds represent an important investment alternative during COVID-19. The cryptocurrency market is also considered a better alternative due to providing higher returns. The cryptocurrency market is an alternative digital currency and investment mode that is purely based upon the concept of a digital distributed ledger and blockchain technology (Baur and Lucey 2010; Hu et al. 2018). There are two benefits of investing in cryptocurrencies: (1) Cryptocurrencies give more returns as compared to other assets; (2) Cryptocurrencies could act as strong hedge instrument for portfolio against the risky portfolio as cryptocurrencies have zero or negative relationships with most of the other traditional assets (bonds, stocks, and precious metals) (Zhu et al. 2019; Forbes and Rigobon 2002). The present study adopts bitcoin, covering almost 70% of cryptocurrency market. The aim of the study is to establish links between health (COVID-19) news and financial assets (cryptocurrency market and green bonds). Previous research studies have provided inconclusive findings. A group of researches (Mensi et al. 2018; Tang and Zhang 2020) claims that the volatility of the cryptocurrency market increased rapidly, however other studies (Flammer 2020; Reboredo 2018) conclude that the cryptocurrency market casn be used as a hedging instrument during financial crises when negative news spreads everywhere.
News based events shape equity market performance. According to Le et al. (2021), news based uncertainty could affect the investor’s consumption and portfolio decisions, which would lead to a change in the equity market prices. COVID-19 news badly affects the united stock market. The DJIA index lost 35% of its value within a month (Gharib et al. 2020; Kang et al. 2019). Different studies (Devpura and Narayan 2020; Kisswani and Elian 2017) show that COVID-19 virus references decrease in economic and future earnings of equity sectors and assets prices. From the above discussion, it is highly recommendable to investigate the commodity market (oil, gold) and newly invented (green bonds, and bitcoin) potential avenues for investment and their association with the equity market during the COVID-19 period.
The present study considers a list of contributions in the field of financial economics. Firstly, the COVID-19 soaring market risk, investigating the financial effect of coronavirus news and changes in commodity prices (oil and gold), bitcoin, and green bonds on equity market. In the present study, we explicitly choose the United States (US) equity market for different reasons. First, the United States equity market represents the major source of a spillover effect across different regions and markets Ahmed and Huo (2020). Secondly, the US is the top of the list in term of COVID-19 patients and causalities, so spreading COVID-19 news largely impacts United States equity market investors. Thirdly, COVID-19 news is not only the risk factor for the US equity market, as the oil price slump and reassessing the role of gold (traditionally considered safe haven) in the US financial market are other important factors. Thus, the present study assesses the impact of COVID-19 news, as well as oil and gold prices on the Dows Jones index (DJI), so we can provide useful insights for the contagion and spillover effect studies in other countries and regions, contributing to this large and important research area. Lastly, the study applied wavelet approaches in order to get the results. The study specifically used wavelet coherence (WC) and continuous wavelet transform (CWT). The present study also implement wavelet based causality test for robustness check. There are many advantageous of wavelet approaches. First, continuous wavelet transforms can help to understand the variability of each variable in the different timescales and frequency bands. The wavelet coherency allow to find the lead-lag dependences correlation (association) between desired variables within frequency bands and timescales. The wavelet technique allows to find the correlation (association) between desired variables within frequency bands and timescales. So, we can develop the hypothesis that United States investors may behave/react differently due to differences in perceptions of systematic risk, heterogeneous expectations, and risk profiles. Therefore, investment decisions may vary across different investment horizons. Negative news might force short-term traders to sell. On the other hand, long-run traders might perceive a buying opportunity, even during turmoil periods (Kumar and Anandarao 2019; Kang et al. 2019). Moreover, wavelet approaches are well suited for the present study because they help to capture interactive non-linear lead-lag association between desired variables. Most risk management and financial economic data are non-linear, so the wavelet approach is best suited method.
2. Literature Review
Different studies have been conducted to find out the relationship between the impact of news and financial assets prices. An initial study conducted by (Niederhoffert 2014) and concluded that news significantly influences the performance of the stock market and investors’ investment decisions. Black (1976) pointed out that a negative association exists between equity market prices and their volatility, a term known as leverage theory. Epstein (2001) pointed out that investor’s distress creates and more volatility in the financial market by showing panic behavior. Shahzad et al. (2016b) reveals that significant and negative relationships between investor investors’ sentiments and equity market performance by using the VIX index and found a positive relationship between both variables. According to Hu et al. (2018), new based volatility (NVIX) creates much higher volatility in the equity market as compared to financial uncertainty (FU). Wang and Kutan (2013) reveal that good and bad news impact the equity returns inversely. Hu et al. (2018) forecasted the vulnerability of any potential pandemics news, adverse impact on consumer demand, foreign direct investment, employment productivity lost, and soaring social distancing costs. Tang and Zhang (2020) depict that asymmetric dependences persist between COVID-19 news and the underlying equity market. Iyke (2020) argues that COVID-19 has transformed in to large scale economic crisis through different financial channels. Some researchers conclude that volatility is increased by incoming negative news (Mensi et al. 2018; Tang and Zhang 2020). Meanwhile, other studies contradict the relationship between volatility and investors’ fear through news, and so conclude no relationship between investors’ fear and equity prices (Tang and Zhang 2020).
The literature (Pal and Mitra 2019; Bal et al. 2018; Ahmed and Huo 2020) related to the impact of news on financial asset (commodity prices, green bonds and cryptocurrency market) prices is quite limited. Even new health impacts on financial assets prices are more limited and unique. Tang and Zhang (2020) tried to find the relationship between U.S. macroeconomic news and energy prices with insignificant results. While Forbes and Rigobon (2002) observed that volatility increased in oil prices on even days. Another study conducted by (Peress 2014) takes two major classes in the commodity market (energy and precious metals). The findings reveal that, during negative news periods, oil volatility increased, while precious metals remained insensitive. Kisswani and Elian (2017) reports that positive co-movement has been observed between macroeconomic news and gold prices.
Most of the studies investigated cointegration among stock prices and commodities due to their exceptional role in the whole economy. Gold and oil are the most liquid commodities and both are synchronized in their price movements. Similarly, (Reboredo 2018) claimed that the co-movements among two different commodities like oil and gold prices gained most importance in the last couple of years due to their importance for the stock market as well as for the real economy. They used WTI weakly spot prices and gold prices in dollar tray/ounce over the period of January 2000 to September 2011. The main purpose of the study is to analyse the role of gold act as a hedge against oil price shocks. The result of TGARCH and ARMA models explained that there are significant positive correlations among oil and gold price movements while those that employ gold do not have the ability to hedge oil shocks due to their positive dependence. They also claimed that gold acts as a safe haven, especially in periods of adverse conditions in oil markets. However, (Shahzad et al. 2018) study the spillover from oil to precious metals through using quantile approaches. They find that, due to changing nature, the safe-haven role of precious metal is characterized as such because each precious metal could be a strong or weak safe-haven against upward or downward oil shocks. Moreover, several crises are seen in the economic history of the world, e.g., global financial crisis, Asian financial crisis 1998, Russian crisis 1997, OPEC decisions in 1994, ERM crisis, economic crisis 1970, and multiple other events which stimulated the interest of investors to investigate the possibility of other alternative assets that provide the benefits of diversification during economic turmoil.
A few studies have also been conducted to find the relationship between new financial assets (cryptocurrency market) and green finance. (Peng 2020) wanted to assess whether after the announcement of US monetary policy related to bitcoin, the prices of cryptocurrencies changed. While (Clapp and Pillay 2017) study is boarder in nature because they investigated the impact of macroeconomics news on cryptocurrency returns and concludes that bitcoin prices increased during bad news period. Kumar and Anandarao (2019) pointed out that black (conventional) and green bonds are quite sensitive and display time varying behavior. Both classes of bonds are sensitive to even daily economic activity, oil prices, economic policy uncertainty (EPU), changes in the magnitude of financial market volatility, and lastly sentiment related to good and bad news. (Devpura and Narayan 2020) take the traditional currencies and bitcoin and aim to find the type of relationship with investor’s sentiments. The findings tells that bitcoin prices changes both the period of negative and positive news. While traditional currencies prices slump during a bad news period, they sharply increased during positive news periods. Despite literature studies, we have found a lack of consensus regarding COVID-19 and financial news. Thus, we have taken COVID-19 news data which is the health news data and tried to find a relationship with different financial assets markets.
The large scale of lock down and confinement of global transportation and industries lead to automatically reduced oil demands and equity market growth during the pandemic (Bal et al. 2018; Kisswani and Elian 2017). According to the WHO estimate, world GDP might reduce 2% due to the pandemic. Iyke (2020) conduct an introductory to check the nature of an association between oil and the pandemic. Cepoi (2020) explore the pattern of energy (oil and gas) return during the pandemic. Some other studies claim that gold still has hedging and safe properties against the equity market during natural disasters like COVID-19 and SARS. Tang and Zhang (2020) conduct a cross correlation between the equity market and oil before and after COVID-19 and found no correlation present during the COVID-19 period. Atsalakis et al. (2020) assess the nature of association between gold and oil during the COVID-19 pandemic and reveal a bilateral relationship between these variables.
In light of the above discussed literature, we have found few studies investigating the impact of commodity prices on the equity market. Moreover, not even a single study investigates the importance of green bonds during the COVID-19 period. Moreover, the present study, for the first time, takes new COVID-19 data and theoretically considers news that can’t be ignored due to changes in the investment pattern and movement of financial/economic variables (Pal and Mitra 2019).Therefore, this study wanted to investigate the association of COVID-19 news, green bonds, gold, oil, and bitcoin prices with the United States equity market.
Literature Review Table
Table 1 shows the summary of literature review.
3. Data and Methodology
The present study want to investigate the level of connectedness between USCOVID-19 news, US equity market (DJI index), Bloomberg Barclays Global Green Bond Index USD—Average price, gold, and bitcoin price. The study used the daily price data from the period of 22 January 2020 to 3 August 2021. Bitcoin data were collected from CoinDesk (https://www.coindesk.com, accessed on 30 June 2021) and United States COVID-19 news extracted from Google trend. All remaining variables data (oil prices, DJI index and green bonds) has been extracted from DataStream. The current study used wavelet (employed wavelet coherency and the continuous wavelet transform) techniques to obtain the connectedness between the studied variables.
3.1. The Continuous Wavelet Transforms (CWT)
Wavelet consists of small waves showing upward and downward trends in a limited time period developed in the mid-1980s. Due to the asymmetric nature of the wavelet, this approach provides rich insights regarding the specific time series variables, their structure, and their correlation as compared to linear models (Pearson correlation). Moreover importantly, wavelet transform model show a comprehensive view of time-frequency based information. Fourier transforms do not have the capacity to automatically adjust the window size and dealing with non-stationary behavior of the data, the wavelet models have the advantage for automatically treating non-stationary signals without any adjustment and capability to adjust the window at low frequencies (short term) and high frequencies bands (long term) (Nguyen and Lambe 2021). Due to having a unique attribute, the wavelet transform approach is the most suitable methodology to analyze the dependence structure and safe haven status of commodities for equity sectors. The wavelet transform approach has two sub forms (1) continuous wavelet transform (CWT) and (2) the discrete wavelet transforms (DWT).
Small waves can be produced by employing the mother wavelet. The mother wavelet is expressed by the following function:
where and denotes normalization factor scale and time position, respectively. Two board techniques are used in order to perform wavelet analysis: (1) continuous wavelet transform (CWT) and (2) the discrete wavelet transform (DWT). CWT is a more recommendable approach because it provides many advantages compared to DWT. It provides the opportunity to choose wavelets per the length of used dataset, and the redundancy in CWT makes the interpretation and discovery of patterns or hidden information easier (Wang and Kutan 2013). The CWT reveals the estimation of a wavelet (.) by comparing the different time sequence K2(Ṟ), i.e.,
An important and core element of continuous wavelet transform is its capability to decompose series and then to recreate a time series K2(Ṟ):
In addition, CWT contain the power of the measurable (observable) time sequence,
In current paper, CWT is used to consider the information concerning insider volatility and connectedness is confirmed through the bivariate wavelet coherency model.
3.2. The Wavelet Coherence (WC)
The main aim of study is to analyze the level of connectedness between USCOVID-19 news, US equity market (DJI index), green bonds, gold, and bitcoin price, which can be analyzed by using wavelet coherence techniques. However, it is mandatory to first define the cross wavelet transform (CWT) and cross wavelet power. Torrence and Compo (1998) pointed out that the CWT can be defined as having two different time sequence and as:
where and represent two different continuous transforms (CW) of and . depicts the location index, while is the measure. Lastly, composite conjugate is represented by (*). Wavelet power can be estimated by employing cross wavelet.
The wavelet coherence approach (WCT) can be used to capture the sudden variation and co-movement in the specific part in the time-frequency domain. According to Torrence and Compo (1998), the equation of wavelet coherence is given as follows:
where W depicts the smoothing mechanism. This 0 ≤ 1 represented the relevant possible domain of wavelet coherence coefficient. When the coefficient of coherency is close to zero, this means zero correlation, while close to one means prefect correlation or strong co-movement. More importantly, the phase difference is described as:
where real and imaginary parameters of wavelet power spectrum. The phase difference is used to explain the arrows presented in the wavelet coherency. Monte Carlo simulation is used to analyze the hypothetical framework of wavelet coherence.
4. Results
The results of each methodology and robustness test are given in Section 4.1, Section 4.2 and Section 4.3.
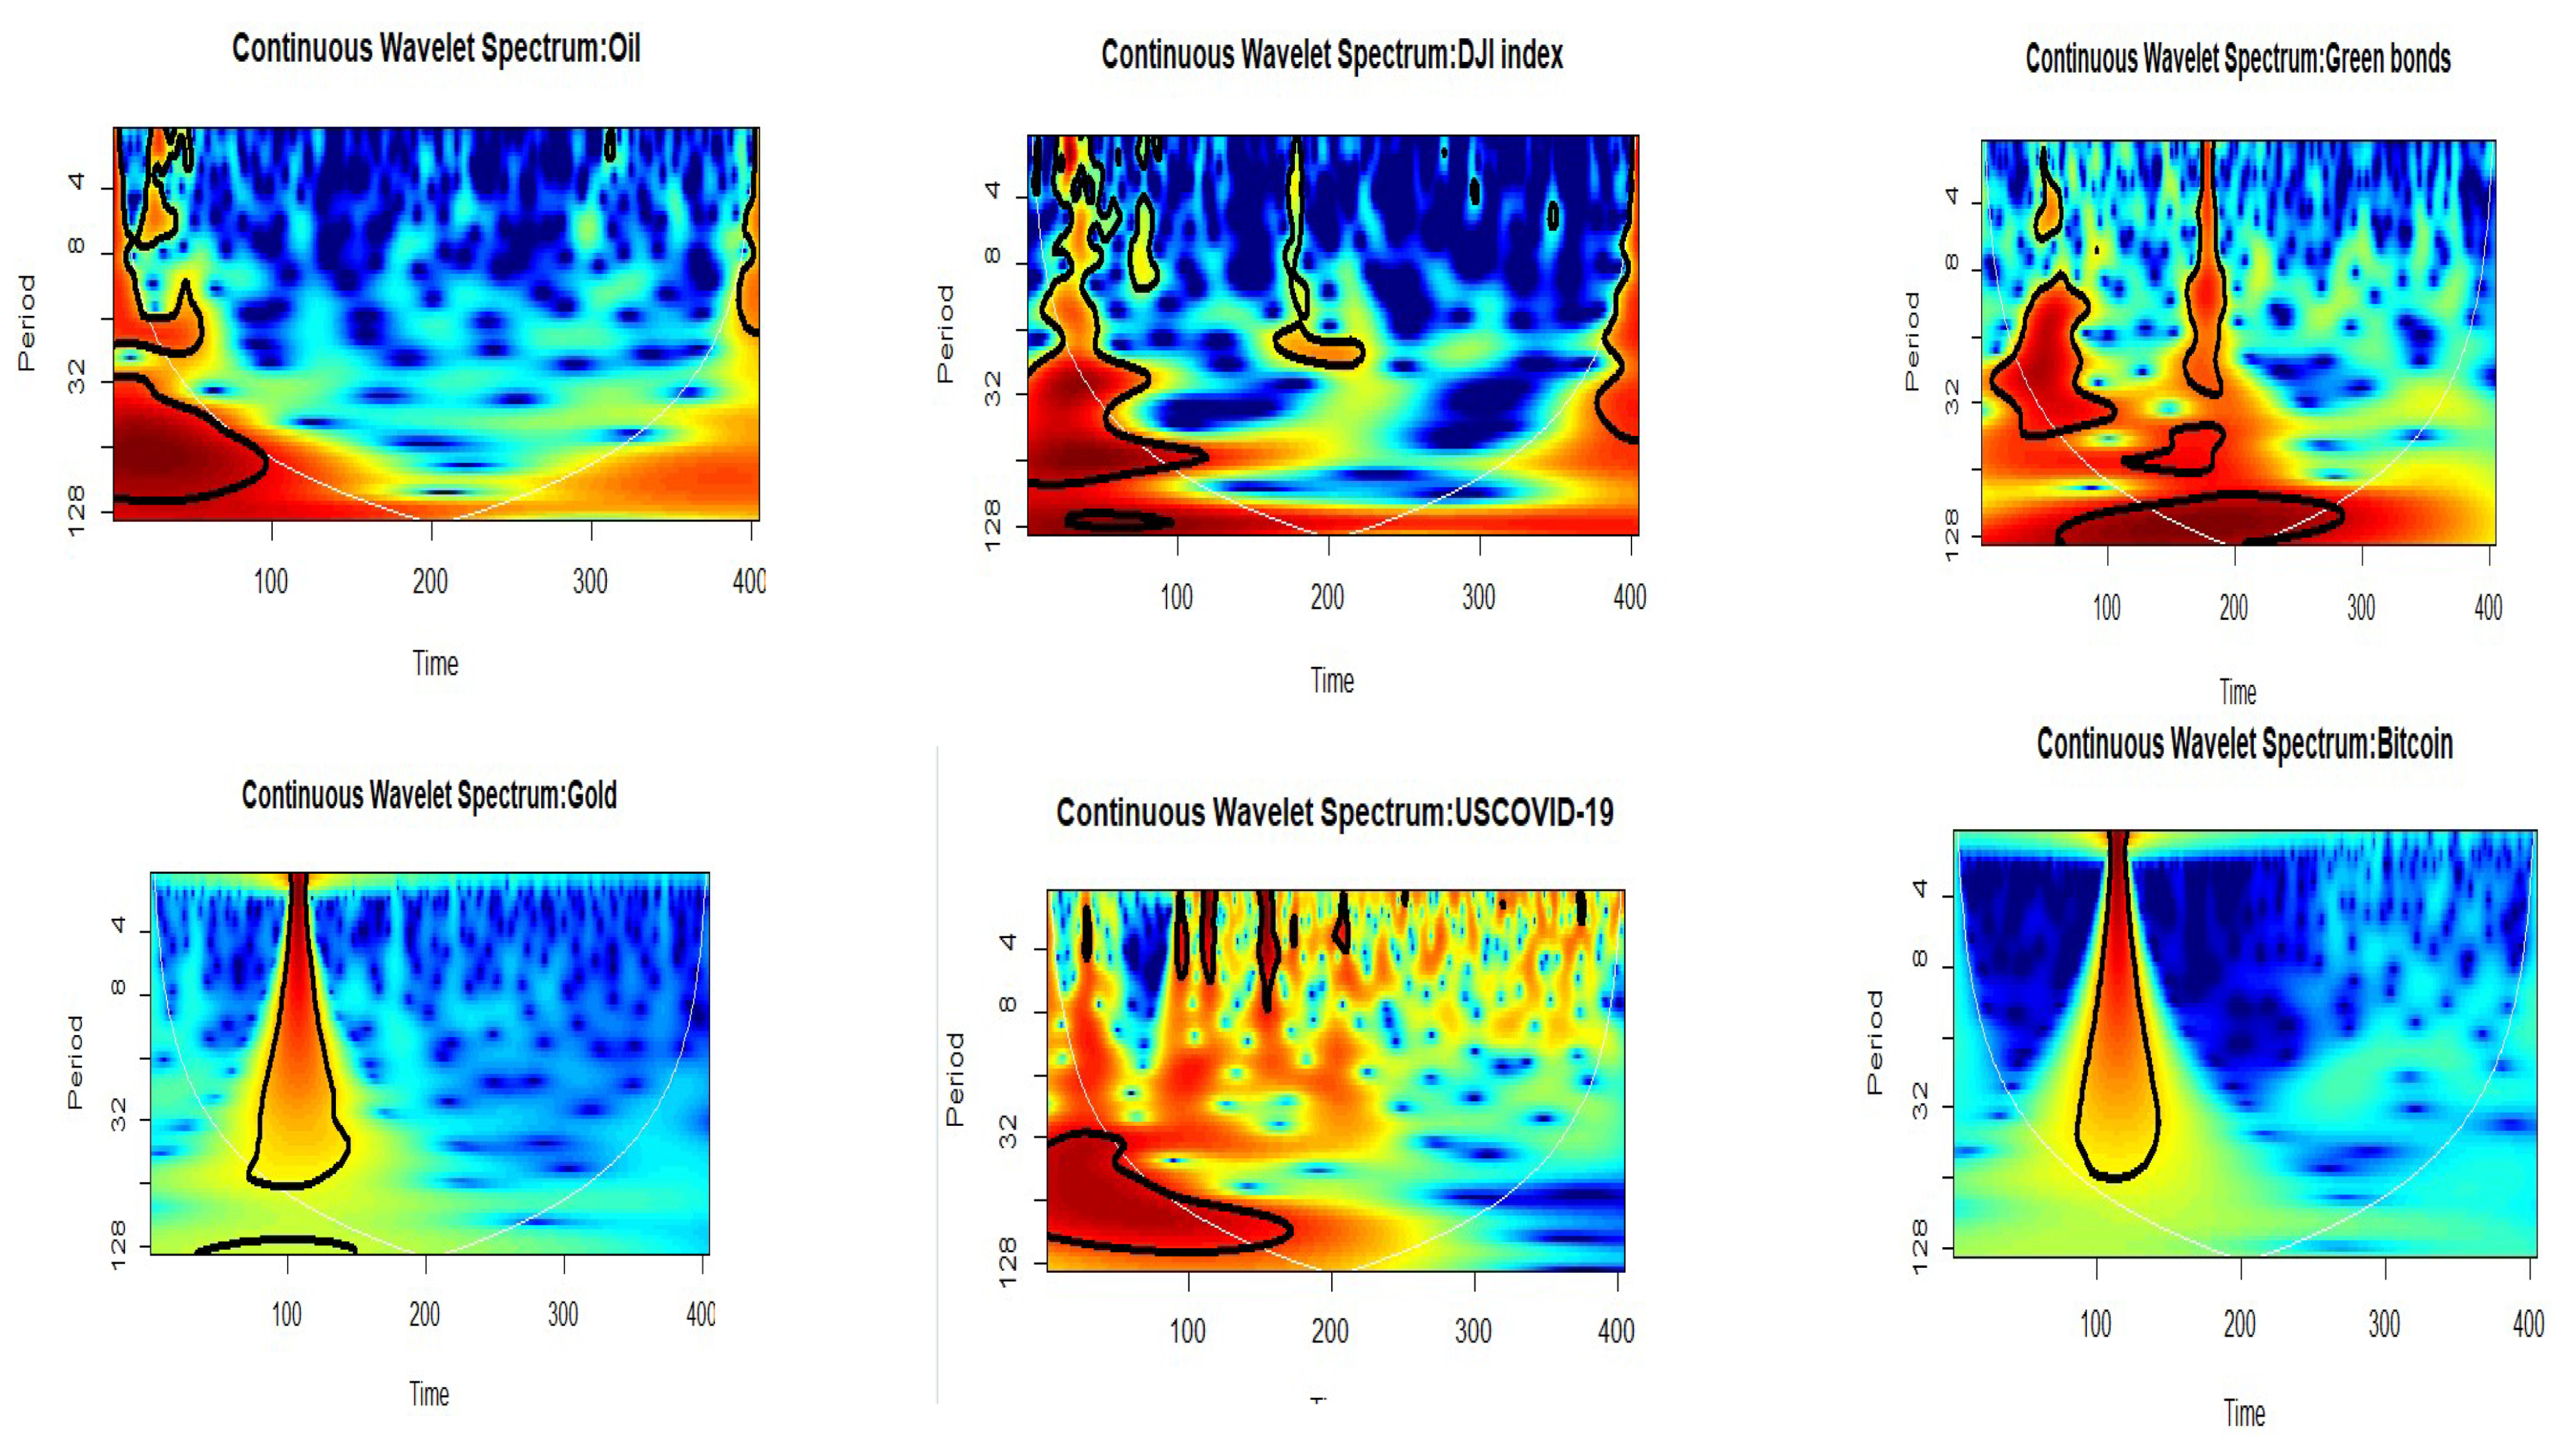
4.1. Continuous Wavelet Transforms Results
Figure 1 captures the plots of continuous wavelet transforms (CWT) of each variable. Large islands of volatility have been observed in (DJI index) during the months of March, April, and May during all frequencies (medium, short and long run) bands. This insider volatility in the US equity market is clearly depicted as the result of a cut in the oil price and outbreak of infectious disease (COVID-19). Red colour has also been observed during April and May in the short, medium, and long term frequencies bands (4–32 days), which also clearly point out the sharp decline in the oil prices. The high volatility in gold and bitcoin prices was monitored during May–June 2020 in all frequency bands. Commodity prices are dramatically low during this period, but upsurges in the prices of gold and bitcoin confirm the hedge and safe haven role of these financial products. Higher volatility in the prices green bonds was observed during May–October during long and very long term frequency bands. The CWT plot of USCOVID-19 news showed high volatility in the entire sample due to increased cases and death rates in the United States due to COVID-19.
4.2. Wavelet Coherence
Figure 2 represents the plots for each couple of variables captured by employing the wavelet coherency technique. The horizontal axis of figure depicts time domain, while vertical axis represent the frequency domain in number of days. The colour pallet represents the strength of wavelet squared coherence, whereby the hotter the colour, the higher the coherence, and thus the dependence between series. The directional arrows show the lead-lag relationship as well as the sign of the dependence. If the arrow points to the right, the two series are positively correlated, and if to the left, negatively correlated. If the arrow points upwards, the first series leads the other, and the opposite for a downward-pointing arrow. Let’s discuss each graph individually. Figure 2 contains the plot of DJI index and US COVID-19 news data. Overall, minimal correlation was found between both variables but some strong long term dependences are also present during the months of March, April and May, both long term and very long term. The arrow directions are left, indicating that COVID-19 and DJI has negative correlation. The U.S. equity market seems to react badly to the COVD-19 news. Figure 2 shows large islands of strong dependence (red colour) in the short, mid, and very long term at the beginning, the mid, and the end of the sample period over the 4–32 and 128 day frequency bands. Moreover, the right direction and upward arrows prove the positive relationship between oil and U.S. equity market. It can also be observed in the graph that oil prices lead the U.S. equity. On aggregate, the slum in the prices of oil reduce cost of production and increase revenue of stock market (reference). However, during COVID-19, production stopped due to lock down, so a slump in oil price further reduces U.S. equity market prices. Our finding is matched with (reference) the volatility of oil prices enhanced while increasing the searches for COVID-19 (news), but the direction of volatility is negative. Figure 2 reveals that bitcoin, gold, and green bonds have a minimal or no correlation with the U.S. Stock market, although small islands of strong dependence exist in the plots. However, overall results indicate that these financial assets can act as safe haven assets against U.S. equity market during the COVID-19 period. Figure 2 presents a wavelet graph between oil and U.S. COVID-19 news. The WC graphs identified different islands of strong coherency over the long term (32–64 days) frequency bands in the months of September and October. Arrows up-ward, right, and left confirm that the relationships between oil and COVID-19 are cyclical. The outbreak of respiratory disease COVD_19 and fake news have severe implications. Investors do not invest in oil stocks. In fact, they have withdrawn their investment due to fear that the oil supply will increase due to war between OPEC countries, while on the other side, a low demand for oil is due to the closing of production units during the COVID-19 period. The disequilibrium in demand and supply further reduces the price of oil during COVID-19. Figure 2 shows mostly covered with blue zone, it means that U.S. COVD_19 news has minimal level correlation with green bonds, gold and bitcoin. However, arrows up-ward (during the period of October–December 2020) and right reveal that COVID-19 news in the United States affects the prices of gold positively in the very long term frequency bands. Similarly, a few islands of dependence have also been observed in the cases of Bitcoin with COVID-19 news. The results indicate that green bonds, bitcoin and gold has proven safe haven even during bad news period (Covid-19). However, more importantly, we have observed that green bonds present a better minimal correlation among all three assets. Our results pointed out that bad news spread during COVID-19 but investors feel safe while investing in the niche market, i.e., green bonds rather than investing in the conventional market. The plot of U.S. COVID-19 news and DJI index shows that strong co-movement is observed during April–May 2020 in the long term frequency band, but for later periods the correlation remains minimal. Our results are consistent with the findings (reference) indicating that USD indices and the equity market are the main source of shocks transmitters before the outbreak of COVID-19. However, during the COVID-19 period, equity performance is directly linked with COVID-19 news. Figure 3, specifically an area of the graph covered with blue, point out that green bonds have no correlation with the financial assets (Oil and bitcoin), confirming the previous literature (Atsalakis et al. 2020; Peng 2020; Le Quéré et al. 2020; Clapp and Pillay 2017; Ahmed and Huo 2020; Corbet et al. 2018) due to low correlation with traditional assets green bonds could be used as safe haven assets. Notably, Gold has strong dependency with green bonds over the 4–32 day frequency bands from the start of 2021 to the end of sample. The directions of arrows are upward and right reveals that causality is going from Gold to green bonds. In addition, gold also has no price relationship with oil, but Figure 3 shows areas covered with large red zones. These results prove that strong dependency exists between bitcoin and gold. Moreover, arrows up-ward, right, and left confirm that relationships between oil and COVID-19 are cyclical, as confirmed by literature (Kang et al. 2019; Mensi et al. 2018).
4.3. Robustness Test, the Wavelet-Based Granger Causality
The present study apply the wavelet-based Granger Causality tests as a robustness check the results of WC and CWT. The study showed the results for original data and six sub frequency domains (D1–D6) presented in Table 2. The result indicates that the oil price causes volatility in the United States (DJI index) stock price during entire sample period (short, medium, and long term frequency bands). Our finding is consistent with the argument that the United States equity market demonstrates substantially sensitivity to the oil price positive and negative shocks (Ahinkorah et al. 2020; Bal et al. 2018; Pal and Mitra 2019; Huynh et al. 2020).The impact COVID-19 news on the DJI index is evidenced over short and medium investment horizons (D4 to D6). Furthermore, the gold price was slightly affected by COVID-19 but this did not much affect the prices of bitcoin and Green bonds. Throughout the wavelet-based causality results, we observe no significant effect of gold prices upon any asset price except bitcoin.
These results support our above wavelet coherency findings and literature argument that gold has zero correlation with the traditional equity market and financial assets. In other words, the finding of the study has confirmed the safe haven role of Gold even during the COVID-19 period. Similarly, regarding green bonds, low and zero causality were found with assets except Oil and COVID-19 news. During the COVID-19 period, the consumption of oil decreased due to the shutdown of production units. The literature supported the arguments that volatility in oil prices cause changes in the prices of and demand for green bonds (Tang and Zhang 2020; Clapp and Pillay 2017; Le et al. 2021)
5. Conclusions and Policy Implications
The most recent and uncertain health crisis (COVID-19) has affected the entire world, so investors, policy makers, and the society should be concerned about the social and economic costs of the pandemic. We examine the most important research question concerning whether United States COVID-19 (USCOVID-19) affects financial assets prices or not. We have taken different financial asset variables, including United States equity mark (DJI index), oil, gold, bitcoin, and green index price. Then, we have applied two time-frequency based approaches, namely the wavelet coherency and the continuous wavelet transform, and also applied wavelet-based Granger causality tests for robustness. The wavelet based techniques are well suited for the present study because they help to capture interactive non-linear lead-lag association between desired variables in different frequency bands. In this study, we have used the daily data from 22 January 2020 to 3 August 2021.
Heterogeneity in United States COVID-19 news affects the financial assets prices, but the intensity is different from one asset to another. The main findings of this study are summarized as follows. The wavelet analysis reveals that the United States equity market prices are extremely sensitive to spreading coronavirus (USCOVID-19) news and changes in the oil prices. The associations between the variables vary across time-scales and investment horizons, where both cyclical and anti-cyclical patterns of connectedness have been identified. DJI index and US COVID-19 news has on average minimal impact, but some islands of strong long term dependences are also present during the month of March, April, and May, long term and very long term. Low or no connectedness of gold, green bonds index, and bitcoin has been found with the most of other variables (except green bonds relation with oil and bitcoin relation with gold), which might lead to the hedge and safe haven role of these assets during the COVID-19 crisis period. Some islands of strong dependence between oil and green bonds over the 4–16 day frequency bands from the start of May to the end of sample. Moreover, very strong co-movement waasa found between bitcoin and gold in the entire sample, which is supported by the study (Atsalakis et al. 2020) that claims that bitcoin is considered new gold, because bitcoin satisfies many properties of gold, including scarcity, medium of exchange, etc.
The results of present study have a number of fresh and noticeable policy implications for decision-makers, international investors, and researchers. The findings clearly indicate that pandemic news in the United States disturbs the returns of the US equity market. The investors who want to maximize their investment returns by minimizing their risk should also consider health risk before investing in the financial market. Oil price sensitivity and slump would be the result of a US-COVID-19 plus OPEC deal. Our results are important for oil production, the hospitality industry, and transportation sector. Gold and bitcoin have low connectedness with the U.S. equity market, so these assets might acts as safe haven during covid-19 period in the United States. Green bonds also have low connectedness with the U.S. equity market. Indeed, green bonds might perform the role of safe haven, but also help to achieve low carbon investment objectives, and thereby help to achieve sustainable development goals set by Paris agreement (2015).
Author Contributions
Conceptualization, G.M.K. and A.S.; methodology, G.M.K.; software, A.S.; validation, G.M.K. and S.A.; formal analysis, A.S.; investigation, G.M.K. and S.A.; resources, A.S.; data curation, G.M.K.; writing—original draft preparation, A.S. and S.A.; writing—review and editing, G.M.K.; visualization, A.S.; supervision, G.M.K.; project administration, A.S. and S.A.; funding acquisition, G.M.K. All authors have read and agreed to the published version of the manuscript.
Funding
This research received no external funding.
Conflicts of Interest
The authors declare no conflict of interest.
References
- Ahinkorah, Bright Opoku, Edward Kwabena Ameyaw, John Elvis Hagan Jr., Abdul-Aziz Seidu, and Thomas Schack. 2020. Rising Above Misinformation or Fake News in Africa: Another Strategy to Control COVID-19 Spread. Frontiers in Communication 5: 2018–21. [Google Scholar] [CrossRef]
- Ahmed, Abdullahi D., and Rui Huo. 2020. Volatility transmissions across international oil market, commodity futures and stock markets: Empirical evidence from China. Energy Economics 93: 104741. [Google Scholar] [CrossRef]
- Atsalakis, George S., Elie Bouri, and Fotios Pasiouras. 2020. Natural disasters and economic growth: A quantile on quantile approach. Annals of Operations Research, 1–27. [Google Scholar] [CrossRef]
- Bal, Gnyana Ranjan, Amit Manglani, and Malabika Deo. 2018. Asymmetric volatility spillover between stock market and foreign exchange market: Instances from Indian market from pre-, during and post-subprime crisis periods. Global Business Review 19: 1567–79. [Google Scholar] [CrossRef]
- Baur, Dirk G., and Brian M. Lucey. 2010. Is gold a hedge or a safe haven? An analysis of stocks, bonds and gold. Financial Review 45: 217–29. [Google Scholar] [CrossRef]
- Black, F. 1976. Studies of stock market volatility changes. Paper presented at the 1976 Business Meeting of the Business and Economics Statistics Section, Washington, DC, USA. [Google Scholar]
- Caporin, Massimiliano, Rangan Gupta, and Francesco Ravazzolo. 2021. Contagion between real estate and financial markets: A Bayesian quantile-on-quantile approach. The North American Journal of Economics and Finance 55: 101347. [Google Scholar] [CrossRef]
- Cepoi, Cosmin-Octavian. 2020. Asymmetric dependence between stock market returns and news during COVID-19 financial turmoil. Finance Research Letters 36: 101658. [Google Scholar] [CrossRef]
- Clapp, Christa, and Kamleshan Pillay. 2017. Green Bonds and Climate Finance. Climate Finance, 79–105. [Google Scholar] [CrossRef]
- Corbet, Shaen, Andrew Meegan, Charles Larkin, Brian Lucey, and Larisa Yarovaya. 2018. Exploring the dynamic relationships between cryptocurrencies and other financial assets. Economics Letters 165: 28–34. [Google Scholar] [CrossRef] [Green Version]
- Devpura, Neluka, and Paresh Kumar Narayan. 2020. Hourly Oil Price Volatility: The Role of COVID-19. Environmental Research Letters 1: 1–5. [Google Scholar] [CrossRef]
- Epstein, Paul R. 2001. West Nile virus and the climate. Journal of Urban Health 78: 367–71. [Google Scholar] [CrossRef] [Green Version]
- Flammer, Caroline. 2020. Green Bonds: Effectiveness and Implications for Public Policy. NBER Working Paper, No. w25950. Cambridge: National Bureau of Economic Research. [Google Scholar]
- Forbes, Kristin J., and Roberto Rigobon. 2002. No contagion, only interdependence: Measuring stock market comovements. The Journal of Finance 57: 2223–61. [Google Scholar] [CrossRef]
- Gharib, Cheima, Salma Mefteh-Wali, and Sami Ben Jabeur. 2020. The bubble contagion effect of COVID-19 outbreak: Evidence from crude oil and gold markets. Finance Research Letters 38: 101703. [Google Scholar] [CrossRef]
- Hayes, Adam S. 2017. Cryptocurrency value formation: An empirical study leading to a cost of production model for valuing bitcoin. Telematics and Informatics 34: 1308–21. [Google Scholar] [CrossRef]
- Hu, Chunyan, Xinheng Liu, Bin Pan, Bin Chen, and Xiaohua Xia. 2018. Asymmetric Impact of Oil Price Shock on Stock Market in China: A Combination Analysis Based on SVAR Model and NARDL Model. Emerging Markets Finance and Trade 54: 1693–705. [Google Scholar] [CrossRef]
- Huynh, Toan Luu Duc, Erik Hille, and Muhammad Ali Nasir. 2020. Diversification in the age of the 4th industrial revolution: The role of artificial intelligence, green bonds and cryptocurrencies. Technological Forecasting and Social Change 159: 120188. [Google Scholar] [CrossRef]
- Iqbal, Najam, Muhammad Saqib Manzoor, and Muhammad Ishaq Bhatti. 2021. Asymmetry and Leverage with News Impact Curve Perspective in Australian Stock Returns’ Volatility during COVID-19. Journal of Risk and Financial Management 14: 314. [Google Scholar] [CrossRef]
- Iyke, Bernard Njindan. 2020. COVID-19: The reaction of US oil and gas producers to the pandemic. Environmental Research Letters 1: 1–7. [Google Scholar]
- Kang, Sang Hoon, Ron P. McIver, and Jose Arreola Hernandez. 2019. Co-movements between Bitcoin and Gold: A wavelet coherence analysis. Physica A: Statistical Mechanics and Its Applications 536: 120888. [Google Scholar] [CrossRef]
- Kisswani, Khalid M., and Mohammad I. Elian. 2017. Exploring the nexus between oil prices and sectoral stock prices: Nonlinear evidence from Kuwait stock exchange. Cogent Economics & Finance 5: 1–17. [Google Scholar] [CrossRef]
- Kumar, Anoop S., and Suvvari Anandarao. 2019. Volatility spillover in crypto-currency markets: Some evidences from GARCH and wavelet analysis. Physica A: Statistical Mechanics and Its Applications 524: 448–58. [Google Scholar] [CrossRef]
- Le, TN-Lan, Emmanuel Joel AikinsAbakahc, and Aviral Kumar Tiwari. 2021. Time and frequency domain connectedness and spill-over among fintech, green bonds and cryptocurrencies in the age of the fourth industrial revolution. Technological Forecasting and Social Change 162: 120382. [Google Scholar] [CrossRef]
- Le Quéré, Corinne, Robert B. Jackson, Matthew W. Jones, Adam J. P. Smith, Sam Abernethy, Robbie M. Andrew, Anthony J. De-Gol, David R. Willis, Yuli Shan, Josep G. Canadell, and et al. 2020. Temporary reduction in daily global CO2 emissions during the COVID-19 forced confinement. Nature Climate Change 10: 647–53. [Google Scholar] [CrossRef]
- Mensi, Walid, Besma Hkiri, Khamis H. Al-Yahyaee, and Sang Hoon Kang. 2018. Analyzing time–frequency co-movements across gold and oil prices with BRICS stock markets: A VaR based on wavelet approach. International Review of Economics & Finance 54: 74–102. [Google Scholar]
- Nguyen, Linh Hoang, and Brendan John Lambe. 2021. International tail risk connectedness: Network and determinants. Journal of International Financial Markets, Institutions & Money 72: 101332. [Google Scholar] [CrossRef]
- Niederhoffer, Victor. 2014. The Analysis of World Events and Stock Prices Author(s): Victor Niederhoffer the analysis of world events and stock prices. The Journal of Business 44: 193–219. [Google Scholar] [CrossRef]
- Pal, Debdatta, and Subrata K. Mitra. 2019. Oil price and automobile stock return co-movement: A wavelet coherence analysis. Economic Modelling 76: 172–81. [Google Scholar] [CrossRef]
- Peng, Xiaofan. 2020. Do precious metals act as hedges or safe havens for China’s financial markets? Finance Research Letters 37: 101353. [Google Scholar] [CrossRef]
- Peress, Joel. 2014. The media and the diffusion of information in financial markets: Evidence from newspaper strikes. The Journal of Finance 69: 2007–43. [Google Scholar] [CrossRef]
- Raza, Naveed, Jawad Shahzad, Aviral Tiwari, and Muhammad Shahbaz. 2016. Asymmetric impact of gold, oil prices and their volatilities on stock prices of emerging markets. Resources Policy 49: 290–31. [Google Scholar] [CrossRef]
- Reboredo, Juan C. 2018. Green bond and financial markets: Co-movement, diversification and price spillover effects. Energy Economics 74: 38–50. [Google Scholar] [CrossRef]
- Shahzad, Syed Jawad Hussain, Muhammad Zakaria, Mobeen Ur Rehman, Tanveer Ahmed, and Bashir Ahmed Fida. 2016a. Relationship Between FDI, Terrorism and Economic Growth in Pakistan: Pre and Post 9/11 Analysis. Social Indicators Research 127: 179–94. [Google Scholar] [CrossRef]
- Shahzad, Syed Jawad Hussain, Ronald Ravinesh Kumar, Sajid Ali, and Saba Ameer. 2016b. Interdependence between Greece and other European stock markets: A comparison of wavelet and VMD copula, and the portfolio implications. Physica A: Statistical Mechanics and its Applications 457: 8–33. [Google Scholar] [CrossRef] [Green Version]
- Shahzad, Syed Jawad Hussain, Muhammad Abubakr Naeem, Zhe Peng, and Elie Bouri. 2021. Asymmetric volatility spillover among Chinese sectors during COVID-19. International Review of Financial Analysis 75: 101754. [Google Scholar] [CrossRef]
- Tang, Dragon Yongjun, and Yupu Zhang. 2020. Do shareholders benefit from green bonds? Journal of Corporate Finance 61: 1–18. [Google Scholar] [CrossRef]
- Torrence, Christopher, and Gilbert P. Compo. 1998. A practical guide to wavelet analysis. Bulletin of the American Meteorological Society 79: 61–78. [Google Scholar] [CrossRef] [Green Version]
- Wang, Lin, and Ali M. Kutan. 2013. The impact of natural disasters on stock markets: Evidence from Japan and the US. Comparative Economic Studies 55: 672–86. [Google Scholar] [CrossRef]
- Zhu, Sha, Qiuhong Liu, Yan Wang, Yu Wei, and Guiwu Wei. 2019. Which fear index matters for predicting US stock market volatilities: Text-counts or option based measurement? Physica A: Statistical Mechanics and Its Applications 536: 122567. [Google Scholar] [CrossRef]
Figure 1.
CWT Plots.

Figure 2.
CWT of all variables.

Figure 3.
Wavelet coherence of all variables.


Table 1.
Literature review summary.
| Research Studies | Sample Countries | Data | Aims/Objective | Key Conclusions |
|---|---|---|---|---|
| Atsalakis et al. (2020) | 100 countries | 1979–2010 | The paper tries to explore the nature of relationship between economic growth and natural disaster. | The result reveals that some time natural disasters have positive relationship with economic growth depending on quantile |
| Ahinkorah et al. (2020) | January–February, 2020 | The study investigate fake new (bandwagon) of corona virus because the today is information era. | We have found several misinformations (fake news) exist between individual and business as well. | |
| Iyke (2020) | United States | 21 January–5 May 2020 | In the present study, the author wanted to examine the response of oil and gas producer by changing the condition of pandemic and applied descriptive statistics. | The study finding told us that 28 percent and 27 percent variation in oil and gas return is explained by pandemic. |
| Devpura and Narayan (2020) | Global database | July 2019–June 2020 (hourly data) | The recent paper explores the role of novel covid-19 for predicting the volatility of oil prices using descriptive statistics and graphs. | The paper results shows that by increasing death and infected patient of covid-19 led sharp increase in the volatility of oil price. |
| Cepoi (2020) | Italy, USA, Spain, Germany, UK and France | 3 February–17 April 2020 | The underlying article examines the role of covid-19 news impact on equity market of different countries by analysing panel quantile regression. | The results depict that asymmetric dependence persist between covid-19 news and equity market of underlying countries. |
| Ahmed and Huo (2020) | China | 2012–2017 | This paper investigate the dynamic relationship between Chinese stock market, commodity market and global oil prices. | The result shows that unidirectional spillover exist from oil to stock market. |
| Zhu et al. (2019) | United States | 1990–April 2019 | The main objective of this paper is to search out the role of fear while determining equity market volatility by using the Grach Midas model. | The conclusion of the paper reveals that VIX contribute more than emv index while predicting about the U.S. financial market volatility. |
| Pal and Mitra (2019) | United States and world index | 1996–2017 | The study investigated relationship between automobile sector returns and oil prices | The results confirm that oil price has both short and long term movement with automobile equity sector returns. |
| Kang et al. (2019) | Global database | 2012–2015 | The study tried to investigate the degree of movement (association) between gold and bitcoin by using wavelet coherency. | The results show that Bitcoin price has greater degree of co-movements with the traditional asset class (gold). |
| Mensi et al. (2018) | BRICS countries | 1997–2016 | The study analysed the comvement between oil, gold and equity market of different currencies. | The results show that no evidence of comovement between equity market and gold while oil comovement is found after the analysis. |
| Shahzad et al. (2018) | Global data | 2000–2016 | The study investigate the asymmetric spillover among oil and agriculture commodities | There is asymmetric spillover from oil to agriculture commodities that intensify especially during financial turmoil period. |
| Reboredo (2018) | United States, and global | 2014–2017 | The study investigated relationship between conventional bonds and green bonds. | The conclusion depicts that positive association present between these two financial assets. |
| Kisswani and Elian (2017) | Kuwait | 2012–2015 | The study examines the non-linear relationship between oil price and Kuwait sectoral stocks by using daily data by applying NARDL. | The result depicts that asymmetrically short term effects between some sectors and oil price but there are no long term effects. |
| Hayes (2017) | Australia | 1980–2003 | The study aims to investigate the relationship between natural events and stock market. | The estimates show that natural events have no significant impact on Australian equity market. |
| Raza et al. (2016) | 10 emerging markets | 2008–2015 | The study investigates the dynamic spillover relationship between oil, gold & their volatilities on the equity market by using NARDL. | Oil and Gold price has a negative effect on the equity market in both the long and short run. |
| Wang and Kutan (2013) | United States, Japan | 1982–2002 | The study examines the effect of natural disaster on equity market especially using insurance sector. | The results show that insignificant prevail in case of equity market, while significant relationship exist between insurance sector and natural disaster. |
| Forbes and Rigobon (2002) | 78 countries | 1960–1990 | The paper analyse the type of relationship between natural disaster and long term growth. | The result of study proves that high frequency of natural disasters reduce the long term growth of different countries |
Table 2.
The results for six sub frequency domains (D1–D6).
| Frequency Domains | Dependent Variables | Independent Variables | |||||
|---|---|---|---|---|---|---|---|
| US-Stock | USCOVID-19 | Oil | Gold | Bitcoin | Green Bond | ||
| D1 | US-stock | 0.4304 | 0.0296 | 0.2771 | 0.003 | 0.6729 | |
| USCOVID-19 | 0.4722 | 0.5671 | 0.3001 | 0.0048 | 0.1806 | ||
| Oil | 0.4108 | 0.9915 | 0.037 | 0.6005 | |||
| Gold | 0.7005 | 0.8305 | 0.0651 | 0.0061 | 0.0822 | ||
| Bitcoin | 0.4303 | 0.0000 | 0.7843 | 0.8988 | 0.5779 | ||
| Green bond | 0.4943 | 0.5517 | 0.4741 | 0.4875 | 0.3819 | ||
| D2 | US-stock | 0.3549 | 0.0492 | 0.5003 | 0.4139 | 0.7453 | |
| USCOVID-19 | 0.578 | 0.8974 | 0.3612 | 0.4884 | 0.9751 | ||
| Oil | 0.7605 | 0.8442 | 0.9206 | 0.6042 | |||
| Gold | 0.8536 | 0.2776 | 0.9428 | 0.4469 | 0.5731 | ||
| Bitcoin | 0.6893 | 0.000483 | 0.8562 | 0.003182 | 0.9939 | ||
| Green bond | 0.7194 | 0.9408 | 0.0415 | 0.9066 | 0.9415 | ||
| D3 | US-stock | 0.2011 | 0.3709 | 0.7042 | 0.4205 | 0.62377 | |
| USCOVID-19 | 0.1263 | 0.7069 | 0.001236 | 0.5408 | 0.6917 | ||
| Oil | 0.4219 | 0.8177 | 0.9494 | 0.6652 | 0.7142 | ||
| Gold | 0.7635 | 0.19081 | 0.8005 | 0.0001 | 0.5300 | ||
| Bitcoin | 0.4258 | 0.0066 | 0.9055 | 0.0000 | 0.9091 | ||
| Green bond | 0.09077 | 0.3214 | 0.0149 | 0.2463 | 0.5761 | ||
| D4 | US-stock | 0.0917 | 0.5281 | 026938 | 0.71903 | 0.4872 | |
| USCOVID-19 | 0.0009 | 0.0232 | 0.0035 | 0.0000 | 0.0365 | ||
| Oil | 0.0000 | 0.0035 | 0.7524 | 0.7546 | 0.6708 | ||
| Gold | 0.6285 | 0.0097 | 0.7533 | 0.0000 | 0.7627 | ||
| Bitcoin | 0.6193 | 0.0134 | 0.9536 | 0.0080 | 0.7322 | ||
| Green bond | 0.1921 | 0.0010 | 0.0968 | 0.8955 | 0.7378 | ||
| D5 | US-stock | 0.0000 | 0.0000 | 0.0000 | 0.000 | 0.000 | |
| USCOVID-19 | 0.0000 | 0.0000 | 0.6938 | 0.0000 | 0.000 | ||
| Oil | 0.0000 | 0.0000 | 0.06072 | 0.0623 | 0.000 | ||
| Gold | 0.04434 | 0.6156 | 0.1962 | 0.0764 | 0.1879 | ||
| Bitcoin | 0.7579 | 0.6284 | 0.9495 | 0.000 | 0.9998 | ||
| Green bond | 0.0000 | 0.0000 | 0.000 | 0.0007 | 0.0363 | ||
| D6 | US-stock | 0.9208 | 0.2016 | 0.003 | 0.029 | 0.7872 | |
| USCOVID-19 | 0.0000 | 0.000 | 0.0000 | 0.0000 | 0.0006 | ||
| Oil | 0.4189 | 0.000 | 0.0000 | 0.000 | |||
| Gold | 0.0000 | 0.007951 | 0.04875 | 0.0000 | 0.000346 | ||
| Bitcoin | 0.1040 | 0.02219 | 0.1337 | 0.0000 | 0.01189 | ||
| Green bond | 0.0000 | 0.01585 | 0.000 | 0.0000 | 0.0000 | ||
| Original | US-stock | 0.0497 | 0.6002 | 0.0000 | 0.0000 | 0.3944 | |
| US COVID-19 | 0.0000 | 0.0495 | 0.3887 | 0.5840 | 0.7563 | ||
| Oil | 0.0000 | 0.0065 | 0.8930 | 0.3819 | 0.0403 | ||
| Gold | 0.5139 | 0.7230 | 0.2754 | 0.0093 | 0.5937 | ||
| Bitcoin | 0.4702 | 0.0760 | 0.1859 | 0.0493 | 0.4062 | ||
| Green bond | 0.7364 | 0.0805 | 0.0021 | 0.7931 | 0.3825 | ||
Publisher’s Note: MDPI stays neutral with regard to jurisdictional claims in published maps and institutional affiliations. |
© 2021 by the authors. Licensee MDPI, Basel, Switzerland. This article is an open access article distributed under the terms and conditions of the Creative Commons Attribution (CC BY) license (https://creativecommons.org/licenses/by/4.0/).
Share and Cite
MDPI and ACS Style
Siddique, A.; Kayani, G.M.; Ashfaq, S. Does Heterogeneity in COVID-19 News Affect Asset Market? Monte-Carlo Simulation Based Wavelet Transform. J. Risk Financial Manag. 2021, 14, 463. https://doi.org/10.3390/jrfm14100463
AMA Style
Siddique A, Kayani GM, Ashfaq S. Does Heterogeneity in COVID-19 News Affect Asset Market? Monte-Carlo Simulation Based Wavelet Transform. Journal of Risk and Financial Management. 2021; 14(10):463. https://doi.org/10.3390/jrfm14100463
Chicago/Turabian StyleSiddique, Asima, Ghulam Mujtaba Kayani, and Saira Ashfaq. 2021. "Does Heterogeneity in COVID-19 News Affect Asset Market? Monte-Carlo Simulation Based Wavelet Transform" Journal of Risk and Financial Management 14, no. 10: 463. https://doi.org/10.3390/jrfm14100463