Adaptive Probabilistic Flooding for Information Hovering in VANETs
by
 , , , , and
Andreas Xeros
1,†,‡ ,
,
Taqwa Saeed
2,*,‡,
Marios Lestas
2,‡,
Maria Andreou
3,‡,
Cristiano M. Silva
4,5,‡ and
Andreas Pitsillides
1,‡ 1
Department of Computer Science, University of Cyprus, Nicosia 2109, Cyprus
2
Electrical Engineering Department, Frederick University, Nicosia 1036, Cyprus
3
School of Science and Engineering of the Open University of Cyprus, Nicosia 2220, Cyprus
4
Departamento de Tecnologia, Universidade Federal de São João del-Rei (DTECH/UFSJ), Ouro Branco 36420-000, Brazil
5
Departamento de Computação, Universidade Federal de Ouro Preto (DECOM/UFOP), Ouro Preto 35400-000, Brazil
*
Author to whom correspondence should be addressed.
†
Nicosia 2109, Cyprus.
‡
These authors contributed equally to this work.
J. Sens. Actuator Netw. 2020, 9(2), 29; https://doi.org/10.3390/jsan9020029
Submission received: 7 May 2020
/
Revised: 29 May 2020
/
Accepted: 4 June 2020
/
Published: 11 June 2020
(This article belongs to the Special Issue Advances in Vehicular Networks)
Abstract
:Information hovering is an information dissemination concept over a mobile set of peers which has not been investigated to the extent that other information dissemination paradigms have. It naturally appears in many vehicular network applications where information must be made available to vehicles within a confined geographical area for during some time period. One elementary strategy is to flood the area with data. Even in this case, some vehicles may never receive the content due to potential partitions created by low traffic density. In order to address this issue, in this work we propose a strategy based on epidemic routing in the hovering area, and probabilistic flooding outside it. Vehicles outside the hovering area serve as bridges towards partitions, leading to high reachability. We highlight the adaptive feature of the protocol, where the rebroadcast probability in partitions is adaptively regulated based on estimates of the density of vehicles in the hovering area. The performance of the proposed scheme is evaluated in VISSIM, using as the reference model in all simulation experiments a section of the road network in cities of Washington. The proposed protocol is shown to achieve the set design goals.
1. Introduction
Vehicular networks [1], despite many years of research, still constitute an area of intense research activity, as many issues remain unresolved and are further challenged by emerging technologies, such as Internet of Things (IoTs), 5G/6G networks [2], cloud computing, and so forth. Depending on the messages exchanged, vehicular ad-hoc networks (VANETs) can serve several purposes [3]. They can greatly improve safety by informing drivers of imminent road hazards [4], collision avoidance systems [5], synchronize traffic lights [6], improve comfort in driving by re-routing drivers to avoid traffic jams, monitor the driving style [7] and also serve as entertainment tools by enabling on-the-road interactive social networking [8], games, file sharing [9] and dissemination of advertisements to interested clients [10,11,12,13]. Vehicular applications typically require the exchange of messages logically attached to specific areas [14]. For instance, in the occurrence of traffic accidents, surrounding vehicles must be notified so as to take appropriate safety measures and hence avoid the critical region. Moreover, the information must lie in the area for a specific amount of time, so that joining vehicles are notified of the hazard [15,16]. A similar situation is found on commercial enterprises advertising products to possible customers. They can rely on the existing vehicular network to spread announcements in the surrounding region.
In the aforementioned situations, useful information must be broadcast to all vehicles in a specific region, and the information must be available during a predefined time period (depending on the application) in order to be noticed by vehicles. The requirements, as described above, are closely related to the more general concept of information hovering. The term ‘information hovering’ is becoming an established concept of information dissemination over a mobile set of peers. It was firstly introduced in Reference [17] and refined in References [18,19,20,21,22,23]. According to Reference [24], information hovering involves decoupling the hovering information from its host and coupling it to a given region called anchor location. Hovering information becomes attached to the specific region (called anchor area). Data moves from one mobile device to another trying to remain as closest as possible to the target region. Information hovering can be employed in several applications in mobile networks [21,25,26,27]. In the subsequent text, the terms target area, hovering area, and anchor area are used interchangeably.
One problem often encountered is the problem of low reachability within the hovering area when the network is partitioned. One solution is to allow exchange of messages outside the hovering area, originally employed in Reference [28]. This work which is based on our previous effort described in Reference [24] considers an alternative strategy based on epidemic routing within the hovering area and adaptive probabilistic flooding outside the area. Our approach allows controlled exchange of messages in the entire network offering more available paths towards the hovering area, leading to more reachability. Through simulations, we demonstrate that our approach outperforms the scheme proposed in Reference [28] by reducing the number of required messages in order to achieve high reachability. The major challenge is related to designing the rebroadcast probability function. Among several candidate functions, we select the one providing better performance, and we tune its parameters considering the phase transition phenomena (typical in probabilistic flooding schemes [29]). The proposed protocol is adaptive in the sense that the rebroadcast probability outside the hovering area is adaptively regulated based on estimates of the density of vehicles inside the hovering area. The estimates are obtained using the number of neighbors of each vehicle. The analytical formulation relating both quantities is derived using a simple model of the transportation network within the hovering area.
The results indicate that the proposed strategy satisfies the design goals and outperforms important baselines, such as epidemic routing and the scheme proposed in Reference [28]. Furthermore, we also demonstrate that in the case we use the same design methodology to render the protocol proposed in Reference [28] adaptive, its performance becomes comparable to the performance of the scheme proposed in this paper. However, our contribution in this work is more generalised, and extends to the introduction of a design procedure which can be used to design a class of density adaptive hovering protocols in other environments beyond the specific information hovering protocol. It is important to note that the universality of the proposed protocol and its applicability in areas beyond the vehicular ad hoc networking context considered in this paper, was demonstrated by the authors in Reference [30]. Therein, the proposed information hovering protocol was successfully used as a data dissemination offloading tool in a wireless data broadcasting application. The collaborative scheme between wireless broadcasting and information hovering was successful in significantly reducing the mean waiting times, thus improving the overall system performance.
An original version of this work was presented in Reference [24]. This paper extends the original work as detailed below:
- It includes a more extensive literature review, reporting recent works pertinent to the considered problem.
- It demonstrates the effectiveness of the proposed estimation algorithm by comparing the performance of the proposed protocol (which uses the estimation algorithm) with that of a modified version which assumes a known density.
- The effectiveness of the proposed methodology is demonstrated by designing a density adaptive extended area scheme which adaptively regulates an area beyond the hovering in which message exchange is allowed. This scheme is an adaptive version of the scheme proposed in Reference [28] and has not been presented in any previous work.
The remainder of this work is organized as follows. Section 2 presents the related work. Section 3 provides a formal definition of the information hovering problem in VANETs. Section 4 presents the adopted methodology leading to the development of the proposed information hovering protocol. Section 5 derives and validates the mathematical model relating the vehicle density within the hovering area and the number of neighbors of each vehicle. Section 6 evaluates the performance of the proposed scheme using simulations. Section 7 concludes the work.
2. Related Work
Information hovering deals with the persistent information dissemination of messages to all interested clients in a particular geographical area. This paradigm is highly relevant and can be realized using other information dissemination concepts as for example multi-casting, geocasting, broadcasting, beaconing and vehicular delay tolerant networks. Now, we review the aforementioned concepts and explain how our proposed approach can be placed in the presented context. A popular method for disseminating messages to interested clients is broadcasting. Despite its simplicity and high reachability, simple broadcasting (i.e., blind flooding) is avoided in highly dense networks because of the congestion and potential network meltdown it causes as a result of the high numbers of redundant messages [31]. Therefore, a number of message control schemes have been proposed in the literature to suppress the number of rebroadcasting nodes as for example: distance-based schemes, location-based schemes, neighbor knowledge schemes, counter-based schemes and probability based schemes [32]. The use of a hybrid architecture involving static and mobile antennas is presented in Reference [33].
Distance and location based methods [34,35,36,37] determine a rebroadcast according to estimates of the distance between the transmitter and the receiver. Nodes closer to the boundary of the transmitter range are chosen for retransmission, since this would lead to a larger coverage area. Distance and location based schemes both require measurements or estimates of the distance which is typically done using received signal strength as in distance based schemes or using a positioning system as in location based schemes, methods which are prone to errors and increase the implementation complexity. Neighbor knowledge or density-based schemes estimate the density of the network based on calculations of the number of neighbors to decide whether or not to retransmit [38,39,40,41]. High density is indicated by larger number of neighbors which implies that a small number of retransmission satisfies the demand of information delivery. Counter based schemes, on the other hand, monitor the number of duplicate messages received to determine a transmission [42,43]. A node receiving small number of received copies of the message is considered lying in a lightly dense area or at the boundary.
Moreover, probabilistic methods [44] where a node decides to retransmit a message based on a particular probability. The calculation of the transmission probability can be as simple as a fixed probability used by all nodes in the network, or can be based on one or more of the aforementioned parameters (i.e., distance, position, neighbor knowledge and received message statistics) [45]. Designing probabilistic methods often handles the trade-off between implementation complexity and performance. This versatility in designing probabilistic broadcasting methods, in addition to their robustness against nodes mobility and failures, renders them desirable candidates for information dissemination in wireless ad hoc networks. A combination of blind and probabilistic flooding is employed in the proposed method as discussed later in this work.
Since information hovering involves multiple nodes in a particular geographical area receiving the relevant information, multicasting and geocasting is also relevant [11,46]. Geocast protocols [47,48,49,50,51] disseminate the intended message among nodes in a specific area. However, the message is transmitted once and is not coupled with the reception area afterwards. This is different than the information hovering concept where the information is associated with the target area and transmitted to all nodes entering this area, which is similar in nature to the so called time-stable geocasting [52,53]. In Reference [52], authors propose geocasting methods based on unicasting the intended message to a node close to (or inside) the geocast region, and then use periodic flooding inside the region.
Many of the aforementioned methods are single-shot transmission methods intended for fully connected networks [54], which may not be always the case in vehicular networks. The high node mobility and the dynamic network topology may cause the links between nodes to frequently fail. Also, the network might be partitioned (or fragmented) due to physical obstacles, finite transmission ranges, and losses caused by congestion and interference [55]. In addition, vehicular networks can be deployed in rural areas, requiring connection in complex topographic forms, such as hills and dense forests, which may cause significant signal attenuation and reflection [46]. In fact, intermittent connectivity problem is a major challenge in the information hovering paradigm, as pointed out in Reference [18], and the proposed scheme in this work aims at addressing this problem. Persistent information dissemination has been used in literature to alleviate the problem, as for example, in methods incorporating roadside units (RSUs) as relay nodes, supplementing vehicle-to-vehicle communications with satellite communications, beaconing and Delay Tolerant Networks (DTN). Incorporating roadside units to connect sparse networks may require the deployment of a large number of units which can be costly and in some cases unfeasible [1,14]. Employing, on the other hand, satellite communications in vehicular networks does increase the connectivity [56], but it comes at a high cost.
Beaconing is the process of sending periodic short messages to direct neighbors, used by nodes in VANETs to exchange status information such as speed and location [57]. This method is relevant because of its persistent nature which ensures continuous delivery of the intended information to the targeted nodes. The exchange of beacons among nodes must be frequent enough to deliver reliable data and scarce enough not to overload or waste the network resources. One of the methods employed to achieve this balance is adaptive beaconing, which can be accomplished in different ways, as reviewed in Reference [58]. In Reference [58], authors classify adaptive beaconing approaches into message frequency control (MFC) approaches, transmit power control approaches, miscellaneous approaches and hybrid approaches which combine two or more of the former approaches. Similar to the aforementioned broadcast suppression approaches, message frequency control algorithms may also use the position and density of vehicles to determine the frequency of beaconing broadcasts [59,60]. Density adaptive beaconing is important in addressing the low connectivity challenges. In addition, message frequency control design can be highly affected by fairness considerations as these are dictated by event-driven messages which are given higher priority [61]. Transmit power control approaches (TPC), on the other hand, vary the transmission power of vehicles to alleviate congestion. The power can be regulated randomly or dictated by specific parameters, such as message fairness [62,63].
Delay Tolerant Networks are originally proposed for interplanetary communications [64], and have been adopted as a solution for MANETs with low connectivity. They have also been used for low connectivity vehicular delay tolerant networks (vDTNs) and a review is provided in Reference [55]. Similar to DTNs, regular IP networks also use store-and-forward switching. However, IP networks typically assume the existence of connected networks with reasonably short Store Times and short round trip times. On the other hand, Delay Tolerant Networks have to cope with high round trip times and network links which are not always available. Large round trip times pose specific challenges on protocol design as for example in TCP [65]. This problem has been addressed in DTNs by the so called Bundle approach [66], which collects data into bundles storing them when no links are available, and forwarding them when a communication channel is set up. This is widely known as the store-carry-and-forward approach. It is important to notice that vDTNs may have relay nodes, fixed in areas where the network is expected to be sparse, where client nodes may upload or download bundles when no other nodes are nearby [67].
A number of information dissemination concepts which have been proposed for ad hoc networks (e.g., flooding, probabilistic flooding and geographical routing) can be appropriately adapted to serve vDTNs [68]. Flooding in vDTN, can be achieved by opportunistically transmitting multiple copies of the intended bundle to different nodes. As expected, this increases the reachability of the transmission, at the cost however of potential congestion, and excessive resource utilization [69]. Another notable flooding based method is proposed in Reference [70]. Stochastic flooding in vDTN relies on random search of the destination node. For example, in First Contact scheme proposed in Reference [71] a node stochastically transmits bundles to the first node it comes in contact with. However, this random transmission may lead the bundle to sway back and forth within a set of nodes.
Moreover, geographical routing in vDTNs employs location information provided by positioning systems to choose the node that is closer to (or moving in the direction of) the destination as the next bundle forwarder. This method is receiving significant attention as means of improving the performance of routing in vDTNs [54,55], as it enables “carrying” the information towards the destination and thus enhancing the delivery rate of the store-carry-and-forward algorithm. For example, GeoSpray proposed in Reference [54] assumes prior knowledge of the position of the destination node. Then, multiple copies of the intended bundle are distributed to the nodes closer or moving towards the destination to increase the probability of delivery. It is worth mentioning that the number of transmitted copies is limited to mitigate the effects of flooding, however, transmitting more than a single copy is the main difference between GeoSpray and the previously proposed GeOpps which relies on single copy forward [72]. Other types of vDTN routing mechanisms are reviewed in Reference [68].
Limited number of works have considered information hovering as a data dissemination technique in VANETs environments [21]. Reference [73] proposes a hovering-based dissemination protocol for data transmission in road intersections. The method selects multiple one-time broadcasting nodes and only one periodically-broadcasting node at a time. The periodically broadcasting node must reside inside the hovering area and selects the new periodically broadcasting node before leaving the area. Complimentarily, Reference [23] discusses an algorithm that calculates the rebroadcasting period of the warning message. While References [73,74] target intersections in particular, Reference [23] requires the vehicle that initiates the broadcast to remain inside the hovering area, otherwise the algorithm terminates, which is not always feasible and can be unsuitable for the highly dynamic nature of VANETs. Another work that considers information hovering is Reference [75]. Vehicles inside the anchor area probabilistically rebroadcast the intended message. The broadcast probability is calculated based on the number of informed neighbors. This method requires constant update of neighbor tables which can cause a large overhead. Additional hovering-based schemes include References [76,77].
3. Problem Description
Next a formal definition of the information hovering problem in VANETs is presented.
We assume vehicles equipped with communication, information storage and processing capabilities able to form a vehicular adhoc network. Roadside units (RSU) aiming to enhance the communication may be present but are not considered here. The VANET may be represented by a graph G(V, E) where V represents the set of vehicles (nodes) participating in the VANET and E the set of edges with edge if vehicle lies in the communication range and can exchange messages with vehicle vehicle . We consider a bounded geographical area H referred to as the hovering area thus defining an induced subgraph consisting of all vehicles and their corresponding edges residing in H. It must be noted that vehicles (nodes) in G and are inherently mobile, abiding to any abstract mobility model thus rendering the graphs time varying. No specific mobility model is assumed. We initially assume that at least one vehicle residing in H possesses critical information. We refer to the vehicles initially possessing critical information as information sources with the objective being to disseminate the information to all vehicles within the hovering area. The way information sources initially generate or receive the critical information is not relevant to this problem formulation and hence it is not discussed in this work. The main objective of this study is to investigate how information sources can use the vehicular network to persistently disseminate the critical messages to all vehicles in the hovering area.
Persistent dissemination implies that the desired property of all vehicles receiving the message is not instantaneously achieved, but holds for an arbitrary time interval during which, vehicles dynamically enter and leave the hovering area. Different approaches can be adopted to solve the problem as described above. However, in our case we focus our solution space toward solutions which make efficient use of the available resources such as storage, power, bandwidth and so forth. Thus, to realise this goal, we pose the additional objective of minimizing the number of exchanged messages. By exchanging small numbers messages less storage, less power and less bandwidth may be utilized and above all a smaller latency of information delivery can be achieved, since phenomena like severe congestion and contention which lead to collisions are avoided.
Thus, given a road map area which we refer to as the hovering area and a single message information data, we seek to find an information protocol that when applied, all vehicles within the area receive the message, with as low as number of messages exchanged, as possible.
4. Proposed Traffic Adaptive Information Hovering Protocol
The problem of delivering a message to vehicles residing in a specific area, as discussed above, can be intuitively solved through the employment of epidemic routing inside the anchor area (in the subsequent text, hovering area, anchor area and target area are used interchangeably). However, in an area of sparse traffic, the network can be fragmented resulting in partitioned nodes which cannot receive a message broadcasted within other parts of the network. In this case, informed vehicles outside the target area may represent information bridges towards the partitioned nodes. Hence, epidemic routing throughout the entire network can improve reachability at the expense, however, of a significant increase in the number of redundant messages. Therefore, we propose the employment of epidemic routing inside the anchor area and probabilistic flooding outside the anchor area. Probabilistic flooding can considerably limit the number of unnecessary broadcasts.
The operation of our proposed information hovering protocol is the following: first, vehicles are assumed to be aware of their location via a positioning system (i.e., GPS) and of their neighbors through beaconing. The header of an intended message broadcasted by an information source inside the hovering area, must include a time-to-live (TTL) field and an anchor area field. The TTL field controls the expiration of the message and the anchor area field determines location of the hovering area. When the intended packet is transmitted for the first time, all the neighbors of the information source are marked as recipients. Receiving vehicles compare their location with the anchor area field. If a receiving vehicle lies inside the target area, the former periodically inspects its neighbors for uninformed nodes. The scanning frequency is the frequency with which a vehicles verifies that all its neighbors received the intended packet. Further description of the proposed approach is pursued with reference to introduced notation which is summarized in Table 1 for clarity of presentation.
Whenever an informed neighbor is discovered, the vehicle rebroadcasts the intended message and identifies all neighboring vehicles as informed nodes. When, however, the vehicle is outside the anchor area, it rebrodcasts with probability p and does nothing with probability . As mentioned earlier in the paper, the value of p can be dependent on many factors. Here, we calculate p based on a decreasing function, f, of the distance from the target area. The rationale is that the vehicles further away from the anchor area are unlikely to find, and connect, partitioned nodes inside the area. The value of TTL field, which controls the time of expiration of a packet, is locally stored in a receiving vehicle and periodically decremented. When the packet is rebroadcasted, its header TTL field is replaced with the current locally stored TTL value.
The most significant part of the overall design procedure is the determination of the probability function f. Our aim is to determine the appropriate non-increasing function and tune its parameters. In this paper, this is accomplished through a simulation study of different candidate functions and selecting the one that outperforms the others. The overall design procedure is depicted schematically in Figure 1. The first step involves selecting the appropriate rebroadcast probability function out of a set of candidate functions which is the one reporting the highest reachability using the least number of exchanged messages under common simulation settings. The second step involves tuning the parameters of the obtained function by identifying the critical parameter value at which phase transition occurs. This is done for different vehicle densities within the hovering area in order to obtain a critical parameter value vs. density curve. This is repeated for different hovering areas and the resulting curve, used in the proposed solution, is a best fit between the obtained curves. The final step involves a density estimation scheme based on the number of neighbors of each vehicle. The combination of the estimation scheme and the rebroadcast probability curve allows each vehicle to decide independently its rebroadcast probability based on the average number of neighbors and its location.
The candidate functions chosen are the following: (i) gaussian-like function (Equation (1)); (ii) step function (Equation (2)); (iii) linear function (Equation (3)); (iv) exponential-like function (Equation (4)).
In Equations (1)–(4), represents the standard deviation of the function, d represents the distance between the vehicle and the hovering area, while r indicates the transmission range. These parameters are tuned in order to make candidate probability functions exhibit the similar decreasing behavior shown in Figure 2. It must be noted that decreasing the step size of the step function improves the refinement at the expense of higher implementation overhead. However, the overall patterns reported are not significantly affected.
The reference model used in all simulation experiments, represents a section of the road network in the cities of Bellevue and Redmond in Washington. It includes congested arterial streets and a saturated freeway as shown in Figure 3. The modeled freeway includes lanes for general traffic, HOV/Bus lanes, three closely spaced interchanges, six ramp meters, and two collector-distributor roads. We identify six hovering areas in this road network which are shown in Figure 3, and for this set of experiments we consider area A. We conduct all the simulation experiments using VISSIM [78], a microscopic simulation tool. The aforementioned candidate non-increasing functions are incorporated in the said information hovering protocol producing four corresponding techniques. We evaluate the performance of these schemes with respect to the average reachability and the total number of received packets. The measurements of reachability are conducted for the simulation period after the system enters an equilibrium state.
Furthermore, the results achieved by the probabilistic schemes are compared with those of employing (i) epidemic routing in the entire network, that is, and (ii) epidemic routing solely inside the anchor area, that is, . The first technique achieves high reachability at the cost of increased number of the exchanged packets. The second technique on the other hand, minimizes the number of exchanged packets but can achieve low reachability levels in sparse traffic.
Figure 4a depicts the number of received messages, whereas Figure 4b shows the corresponding reachability values. As expected, epidemic routing in the entire network achieves the highest reachability levels and the highest number of messages. Whereas at the bottom of the reachability and the number of messages figures, lie the results of epidemic routing only inside the anchor area and the linearly decreasing probability function. While the rest of the schemes achieve reachability levels comparable to those of overall epidemic routing, they result in smaller numbers of messages. Since the Gaussian-like probability function reports the lowest overhead, it is selected for our intended information hovering protocol.
The second phase of our design procedure, after selecting the proper function, is the tuning of the parameter of this function for the best possible performance. The Gaussian-like function in Equation (5) is obtained by considering a zero mean normal curve with a standard deviation of . In order to maintain a rebroadcast probability of 1 at the edges of the target area, the normal curve is multiplied by . The value of indicates the area where vehicles rebroadcast with a high probability. A scenario with high network connectivity, implies the presence of a large number of rebroadcasting opportunities and thus the area of high rebroadcasting probability must be small to avoid overloading the network. On the other hand, in a network of low connectivity more nodes must rebroadcast with a higher probability to ensure high reachability. This shows that the value of must be adaptive to the connectivity of the network inside the anchor area.
Although it is difficult to obtain the connectivity of the network inside the target area through measurements, there are other network parameters which can give an indication of the connectivity. The value of can then be adaptively regulated according to the values of these parameters which can be locally available to each vehicle or estimated online. One such parameter is the transmission range of each vehicle. Here, we consider a transmission range of 180 m which is commonly considered for vehicular communications [79]. We leave studying the effect of the transmission range on the performance of the proposed protocol for future publications. The network connectivity is also dependent on the vehicle density. A low (high) density scenario implies low (high) network connectivity. Therefore, high densities inside the hovering area indicates that a small value of is sufficient for high reachability results. Through simulations, we define a function mapping density to the corresponding optimal . Various vehicle densities are considered. For each vehicle density, yielding the best performance is extracted. Despite the fact that the original simulation study is conducted in the mentioned area, the same design procedure is later applied in other hovering areas demonstrating the robustness of the derived function with respect to changing topologies.
In order to characterize the yielding the best performance, we fix the traffic density in an area at 6.7 vehicles/Km2, vary the value of between 0 and 405 and observe the reported number of received packets and the reachability level for each as depicted in Figure 5a,b, respectively. As expected, larger values of result into higher numbers of received packets. However, wherease the reachability-Sigma relationship starts as an increasing function, after a particular value of the reachability enters a saturation phase where it attains values close to . This particular value of is referred to as the critical value. For any vehicle density there exist a critical value of which minimizes the number of packets while maintaining high reachability values. The existence of this critical value is a strong indication of the presence of phase transition phenomena which are typical in the theory of percolation theory and random graphs and are also observed in VANETS in Reference [80]. The same type of behavior is observed in other hovering areas.
In Figure 6a the relationship between reachability and the number of packets in area B is shown for a vehicle density of 15 vehicles/Km2 which indicates a scenario of a very high density. In Figure 6b, on the other hand, the same relationship is depicted for area C when the vehicle density is 4.9 vehicles/Km2. The number of exchanged messages, as discussed earlier, can be varied through changing the value of . Thus, in the figure, each data point corresponds to a different value of (i.e., larger number of packets indicates higher values). We consider values of in the range 0–405. A value of equal to zero implies the employment of epidemic routing in the target area only, whereas a value of implies the application of epidemic routing in the entire network. The graphs indicate the existence of a critical value of , beyond which the achieved reachability is almost constant. Such critical values of are obtained for values of the traffic density in the range 2–16 vehicles/Km2 in all hovering areas depicted in Figure 3. Figure 7a shows that the relationship between the critical value of and the vehicle density is exponentially decreasing for all the considered anchor areas. Hence, the topology of the roadway has nearly no impact on the relationship and thus, a generalized function of the former can be derived. Here, we employ a least square fit between the curves to obtain such a function.
5. Estimation of the Vehicle Density
Accurate computation of a global information as the vehicle density at the node level is a difficult task, especially in intermittently connected networks. Therefore, for the often partitioned network that we consider, we resort to distributed algorithms in order to estimate the vehicle density online. The vehicle density is then incorporated in determining the sufficient rebroadcast probability outside the anchor area in the proposed information hovering protocol. The proposed vehicle density estimation mechanism relies on the average number of neighbors within the target area. The question is how to relate the vehicular density to the average number of neighbors in a roadway setting. The numerous ways a road network can be constructed renders the derivation of a general relationship between density and the number of neighbors infeasible. Therefore, we consider a simple model of an intersection of two two-way roads where the intersection is at the center of the circular hovering area, as depicted in Figure 8. Significant introduced notation is summarized in Table 2.
We aim to calculate the expected number of neighbors of each vehicle when the number of vehicles lying in the anchor area is equal to . In such case, the vehicle density is expressed by Equation (6), where R denotes the radius of the anchor area.
At any time instant, we assume that the location of each vehicle is randomly uniformly distributed over all possible locations in the considered roadway, and that two vehicles are considered to be neighbors when they lie within their transmission range. Considering the previous assumption, it follows that the events of any two vehicles being neighbors are independent, and the event of any two vehicles being neighbors is a bernoulli trial with probability of success equal to p. From the independence of the bernoulli trials, the number of neighbors of any vehicle is a binomially distributed random variable whose expected value is . So, in order to calculate the expected number of neighbors when the number of vehicles in the hovering area is equal to , it suffices to calculate the probability p of two vehicles being neighbors. We calculate this probability below.
The basic notations utilized in the subsequent analysis are defined next. Figure 8 depicts the considered hovering area where a pair of two-way straight line roads perpendicularly intersect at point . The one road extends from to and the other extends from to . We consider vehicles within the hovering area. Our objective is to determine the probability of two randomly selected vehicles to be neighbors, that is the distance between then is less than the fixed transmission range r. The represents the directional roadway link between points and . The direction of the traffic flow is from to . We partition the hovering area in three subareas A, B, C, as shown in Figure 8.
The shaded outer ring bounded from the outside by the circle of radius R and from the inside by the circle of radius represents area A as shown in Figure 8. Area B is the mid ring bounded by the circle of radius and the circle of radius r from the outside and the inside, respectively. Finally, area C covers the most inner circle of radius r. As shown in the figure the circles are all concentric.
The probability of vehicle residing in area A is denoted by . Similarly, we define and . Given that lies in area A, the probability that it has as a neighbor is constant and denoted by . Similarly, we define and . Due to areas A, B, and C constituting a partition of the hovering area, the desired probability p is given by Equation (7).
Probability is given by the ratio between the length of the road sector within area A and the length of the road sector within the anchor area. The lengths of the road in Area A and the road in the anchor area are equal to and , respectively, which yields:
Similarly, we can deduce that:
The probability is calculated as follows. First, let reside on road in at distance k from the boundary of the area. and can be neighbors with a probability of , where k is in the range of . Therefore, the conditional probability that is one of ’s neighbors while residing on in A, is expressed as . is declared a neighbor of in either of the following cases: (a) if it is residing in any side of the road between and and (b) if it is residing in any side of the road within a distance r from in between and . The probability that the first case is valid is equal to the length of the roadway section between and over the total length of the roadway in the hovering area, whereas the probability of the second case being valid due to its geometry is equal to . So, is equal to and is given by . Similarly we define and for . Moreover, we define and to be the probabilities that lies in road section , respectively in area A. It follows that . Due to the symmetry of the problem ∀ and ∀ . It follows that:
In area B, the fact that is located on road , implies that is a neighbor of if it is less than r apart from in both directions on or in road . In such a case, is equal to and is expressed by . Using the same arguments leading to Equation (11), it follows that
Finally, and are considered neighbors when is located in area C on road , while is lying at a distcance smaller than r from on roads and . Another scenario where is a neighbor of is when the former lies at a distance k from the intersection at on road and resides within a distance from on roads , , , . So, given that is in area C, the probability that the two vehicles are neighbors is given by . By setting , we get: . Using the same arguments leading to Equation (11), it follows that
Substituting Equations (8)–(13) in (7), Equation (14) is obtained. This implies that the expected number of neighbors , where X denotes the random variable of the number of neighbors of a vehicle in the hovering area, when the vehicle density is equal to is given by Equation (15):
The expressions above are obtained through considering a simple model simple model of a roadway system consisting of two intersecting roads only. Next, we investigate the extent to which our theoretical findings agree with a simulation experiment of a scenario with more relaxed settings. The results show prominent agreement between the theoretical findings and the simulation results despite the simplicity of the theoretical model. We consider Figure 3 and use all the hovering areas (A-F). All considered hovering areas are circular with radius R = 500 m. However, each area has a distinct roadway system that is more complex than the topology of the theoretical model, comprising multiple intersecting roads. Our simulation setup assumes a transmission range of m and several values of the vehicle density in each anchor area. For each vehicle density, simulation results are employed to obtain the average number of neighbors.
The results above are then compared with the function of Equation (14), which becomes when R and r are assigned the values considered here. In Figure 7b good agreement between the simulation results and our theoretical findings is observed, indicating that Equation (14) may serve the proposed hovering protocol. In order to estimate the average number of neighbors, each vehicle in the hovering area maintains the following state variables:
- (i)
- estimation of the average number of neighbors in the anchor area ();
- (ii)
- number of neighbors n;
- (iii)
- number of neighbors of each of its neighbors ( for j neighbor);
- (iv)
- estimates of the average number of neighbors of each of its neighbors( for the neighbor j).
The information of (ii), (iii) and (iv) are obtained through the exchange of beacon messages whose implementation details are not discussed in this paper. The following exponentially weighted moving average like algorithm is employed to adjust :
It is important to mention that this calculation is performed only by the nodes inside the anchor area. Vehicles outside the target area update their information about neighboring nodes through beaconing including information. A vehicle, upon receiving an average neighbor value from neighbor j, updates its estimate of the average number of neighbors within the hovering area according to Equation (17). Updates outside the hovering area are essential, as they ensure that most recent updates which are provided by vehicles exiting the hovering area quickly spread in the entire network and in addition improve the robustness of the system with respect to erroneous measurements.
6. Performance Evaluation
In this section, we assess the performance of the proposed protocol through simulation experiments. In these simulations we consider hovering areas, that were not considered in the design process, in the same previously considered road network which includes congested arterial streets and saturated freeway in the cities of Bellevue and Redmond in Washington. The considered areas are indicated in Figure 9 by the letters H and G. The experiments are conducted on VISSIM [78], a microscopic simulation tool. The VISSIM model is tuned priori to generate realistic mobility traces of the vehicles within the considered areas. These traces are then processed by custom made scripts realizing the protocols under consideration for evaluation purposes. We evaluate the performance in terms of the achieved reachability and communication overhead indicated by the number of packets.
6.1. Effectiveness of Adaptive Probabilistic Flooding
We first conduct a comparative study in order to investigate to what extent the proposed scheme achieves its design objectives relative to other schemes which have appeared in literature: (i) epidemic routing in the hovering area only; (ii) epidemic routing in the entire vehicular network; (iii) and the scheme proposed in Reference [28], which considers transmitting the intended message in a finite area outside the target area. The way the size of this area is determined is not specified in Reference [28]. Therefore, we assume the size of the extended area to be the same as the that of the anchor area. This is achieved by setting the radius of the area in which message exchange is allowed, equal to times the radius of the hovering area.
Figure 10a,b show the reachability levels and the number of exchanged packets reported by the four considered scheme for different values of the vehicle density, respectively. The low reachability achieved by all methods for small vehicle density values implies the presence of partitioned areas in the network where vehicles cannot receive intended message. Increasing the number of vehicles residing in the anchor area results in an improved reachability and an increased number of exchanged packets. Nonetheless, the proposed protocol outperforms the rest of the considered methods as it reports a small number of exchanged packets while maintaining reachability levels comparable to those achieved by employing epidemic routing within the entire network. Similar results are obtained in area G shown in Figure 11a,b, demonstrating the ability of the proposed scheme to work effectively in various hovering areas with different road topologies and traffic characteristics.
6.2. Effectiveness of the Estimation Algorithm
In this section we investigate the effect of the estimation algorithm on the performance of the proposed information hovering protocol. The questions we seek to answer relate to how the hovering protocol would perform had the actual vehicle density within the hovering area is known, and to what extent this performance is compromised if estimates which are generated by the estimation algorithm proposed in the previous section replace the actual values. Also, we consider the vehicle density within the hovering area known, and hence the hovering protocol uses this known density value to tune the parameter of the rebroadcast probability function according to the function depicted in Figure 7a.
We compare the performance of this protocol to the performance of the proposed information hovering protocol which replaces the unknown density values with estimates generated online. Simulation experiments are conducted in both areas G and H and the results are summarized in the plots of Figure 12, which indicate the number of exchanged messages and the reachability achieved by the two protocols as we increase the vehicle density. The two protocols exhibit similar behavior demonstrating that the estimation algorithm does not compromise the performance of the information hovering which could be achieved, had the vehicle density values be known. Therefore, the estimation algorithm can be considered successful in generating estimates of the unknown vehicle density, which are of acceptable accuracy.
6.3. Comparison with Adaptive Area Regulation
The proposed information hovering protocol aims to solve the problem of low reachability in cases of low traffic density by allowing controlled exchange of messages outside the hovering area. This is achieved by employing adaptive probabilistic flooding; a unique feature of the protocol. The adaptivity mechanism uses estimates of vehicle density, calculated online, to regulate the rebroadcast probability. The information hovering protocol proposed in Reference [28] is based on a different approach which allows message exchange in a restricted area outside the hovering area. As shown earlier, the information hovering protocol proposed in this work outperforms the protocol proposed in Reference [28] when the size of the restricted area is fixed. However, an interesting question is how the two approaches compare if the size of the restricted area had been adaptively regulated based on the vehicle density. The idea of adaptively regulating the area in which message exchange is allowed, based on estimates of the vehicle density, was briefly discussed in Reference [28], however no guidelines have been given on how to design the estimation algorithm and how to use the estimates that it generates to regulate the size of the area. Thus, in order to compare the algorithm proposed in Reference [28] fairly, we make it adaptive by using similar ideas and almost the same design procedure used to design the proposed information hovering protocol.
For the comparative evaluation we consider 12 different implementations of the protocol which applies epidemic routing in an extended circular area encompassing the hovering area itself, with radius R, differing in the size of the extended area. One implementation of the protocol applies epidemic routing in the hovering area only while the radius of the extended area of the rest of the implementation protocol differ by 0.2R. For a particular traffic density in a specific hovering area we compare the performance of the 12 implementations of the protocol and choose the one which exhibits superior performance in terms of high reachability achieved with the smallest possible number of exchanged messages. The radius of the extended area of this implementation is referred to as the critical radius. We repeat the same procedure for different traffic densities and different hovering areas and the resulting critical radius obtained are shown graphically in Figure 13. Similar to the critical sigma curve of Figure 7a, the critical radius curve exhibits an exponentially decreasing pattern as the vehicle density increases. This pattern does not vary significantly in each hovering area indicating that a universal curve may be obtained which is independent of the chosen road topology. Such a curve is extracted by applying a least squares fit between the curves of Figure 13. The least squares fit curve is also shown on the same diagram. Each vehicle estimates the vehicle density within the hovering area utilizing the methodology described in the previous section and uses the least squares curve to calculate the radius of the area in which message exchange is allowed. Then, upon receiving a relevant message each vehicle decides to rebroadcast the message if it lies within the calculated extended area.
The proposed information hovering protocol and the adaptive version of the protocol proposed in Reference [28] are compared using simulations in areas G and H. The simulation results are shown in Figure 14. We observe almost identical behavior, indicating that any of the two approaches can be used to satisfy the posed design objectives. However, our contribution goes beyond the proposal of a specific information hovering protocol but extends to the introduction of a design procedure which can be used to design a class of density adaptive hovering protocols in other setups.
7. Conclusions and Future Work
In this article we address the Information Hovering problem in VANETS, in which useful information needs to be made available to all vehicles within a confined geographical area for a specific time interval. This problem naturally applies not only in VANETS, but in many diverse transportation type applications. The performance of any information hovering protocol is affected by the traffic density of the considered network, especially in cases of low traffic density where partitioned uninformed areas may lead to low reachability. In this work, we propose a novel scheme which overcomes this problem by applying probabilistic flooding outside the hovering area, based on a probability function derived using simulation. Thus, informed vehicles which are outside the area can serve as information bridges towards partitioned uninformed areas, guiding the information back to these areas, hence leading to higher reachability. A unique feature of the proposed protocol is its adaptive mechanism, in which the rebroadcast probability outside the hovering area is adaptively regulated based on estimates of the vehicle density within the hovering area. The estimation of the vehicle density is based on a dynamically derived function. Simulation results show that the proposed protocol is successful in satisfying its design objectives and that it outperforms other candidate hovering protocols. Furthermore, we demonstrate that our contribution extends to the introduction of a design procedure which can be used to design a class of density adaptive hovering protocols, thus going beyond the proposal of a specific information hovering protocol. In order to further support the finding of this study, in the future we aim to use analytical tools from random graph theory.
Author Contributions
Conceptualization, M.L., A.P., A.X., and M.A.; methodology, All; software, A.X. and T.S.; validation, A.X., M.L., and T.S.; Mathematical analysis, A.X., M.A., and M.L.; investigation, All; resources, A.X., A.P., and M.L.; data acquisition, A.X. and T.S.; writing—original draft preparation, All; writing—review and editing, All; supervision, A.P., M.L., and C.M.S.; project administration, A.P. and M.L.; funding acquisition, M.L. and A.P. All authors have read and agreed to the published version of the manuscript.
Funding
This research was partially funded by the EM-VANETS project, CNPq (Conselho Nacional de Desenvolvimento Científico e Tecnológico) grant 303933/2017-8, CAPES (Coordenação de Aperfeiçoamento de Pessoal de Nível Superior), FAPEMIG (Fundação de Amparo à Pesquisa do Estado de Minas Gerais) grant APQ-02145-18, and the Federal University of São João del-Rei (UFSJ).
Conflicts of Interest
The authors declare no conflict of interest.
Abbreviations
The following abbreviations are used in this manuscript:
| DTN | Delay Tolerant Networks |
| MFC | Message Frequency Control |
| RTT | Round Trip Times |
| RSUs | Roadside Units |
| VANETs | Vehicular Adhoc Networks |
| TPC | Transmit Power Control |
| VDTNs | vehicular Delay Tolerant Networks |
| V2V | Vehicle-to-Vehicle |
| V2I | Vehicle-to-Infrastructure |
References
- Silva, C.M.; Masini, B.M.; Ferrari, G.; Thibault, I. A Survey on Infrastructure-Based Vehicular Networks. Mob. Inf. Syst. 2017, 2017, 28–56. [Google Scholar] [CrossRef] [Green Version]
- Swain, P.; Christophorou, C.; Bhattacharjee, U.; Silva, C.M.; Pitsillides, A. Selection of UE-based Virtual Small Cell Base Stations using Affinity Propagation Clustering. In Proceedings of the 2018 14th International Wireless Communications Mobile Computing Conference (IWCMC), Limassol, Cyprus, 25–29 June 2018; pp. 1104–1109. [Google Scholar] [CrossRef]
- Silva, C.M.; Meira, W., Jr. Managing Infrastructure-Based Vehicular Networks. In Proceedings of the 2015 16th IEEE International Conference on Mobile Data Management (MDM), Pittsburgh, PA, USA, 15–18 June 2015; Volume 2, pp. 19–22. [Google Scholar] [CrossRef]
- Eriksson, J.; Girod, L.; Hull, B.; Newton, R.; Madden, S.; Balakrishnan, H. The pothole patrol: Using a mobile sensor network for road surface monitoring. In Proceedings of the 6th International Conference on Mobile Systems, Applications, and Services, ACM MobiSys, Breckenridge, CO, USA, 17–20 June 2008. [Google Scholar]
- Mukhtar, A.; Xia, L.; Tang, T.B. Vehicle Detection Techniques for Collision Avoidance Systems: A Review. IEEE Trans. Intell. Transp. Syst. 2015, 16, 2318–2338. [Google Scholar] [CrossRef]
- Silva, C.M.; Aquino, A.L.L.; Meira, W., Jr. Smart Traffic Light for Low Traffic Conditions. Mob. Netw. Appl. 2015, 20, 285–293. [Google Scholar] [CrossRef]
- Johnson, D.A.; Trivedi, M.M. Driving style recognition using a smartphone as a sensor platform. In Proceedings of the 2011 14th International IEEE Conference on Intelligent Transportation Systems (ITSC), Washington, DC, USA, 5–7 October 2011; pp. 1609–1615. [Google Scholar]
- Oliveira, T.R.; Silva, C.M.; Macedo, D.F.; Nogueira, J.M.S. SNVC: Social networks for vehicular certification. Comput. Netw. 2016, 111, 129–140. [Google Scholar] [CrossRef]
- Silva, C.M.; Silva, F.A.; Sarubbi, J.F.; Oliveira, T.R.; Meira, W., Jr.; Nogueira, J.M.S. Designing mobile content delivery networks for the Internet of vehicles. Veh. Commun. 2017, 8, 45–55. [Google Scholar] [CrossRef]
- Khelifi, H.; Luo, S.; Nour, B.; Moungla, H.; Faheem, Y.; Hussain, R.; Ksentini, A. Named data networking in vehicular ad hoc networks: State-of-the-art and challenges. IEEE Commun. Surv. Tutor. 2019, 22, 320–351. [Google Scholar] [CrossRef] [Green Version]
- Sharma, A.; Awasthi, L.K. A Comparative Survey on Information Dissemination in Heterogeneous Vehicular Communication Networks. In Proceedings of the 2018 First International Conference on Secure Cyber Computing and Communication (ICSCCC), Jalandhar, India, 15–17 December 2018; pp. 556–560. [Google Scholar]
- Toor, Y.; Muhlethaler, P.; Laouiti, A. Vehicle ad hoc networks: Applications and related technical issues. IEEE Commun. Surv. Tutor. 2008, 10, 74–88. [Google Scholar] [CrossRef]
- Zeadally, S.; Hunt, R.; Chen, Y.S.; Irwin, A.; Hassan, A. Vehicular ad hoc networks (VANETS): Status, results, and challenges. Telecommun. Syst. 2012, 50, 217–241. [Google Scholar] [CrossRef]
- Silva, C.M.; Silva, L.D.; Santos, L.A.L.; Sarubbi, J.F.M.; Pitsillides, A. Broadening Understanding on Managing the Communication Infrastructure in Vehicular Networks: Customizing the Coverage Using the Delta Network. Future Internet 2018, 11, 1. [Google Scholar] [CrossRef] [Green Version]
- Silva, C.M.; Meira, W., Jr. Design of roadside communication infrastructure with QoS guarantees. In Proceedings of the 2015 IEEE Symposium on Computers and Communication (ISCC), Larnaca, Cyprus, 6–9 July 2015; pp. 439–444. [Google Scholar] [CrossRef]
- Silva, C.M.; Guidoni, D.L.; Souza, F.S.H.; Pitangui, C.G.; Sarubbi, J.F.M.; Pitsillides, A. Gamma Deployment: Designing the Communication Infrastructure in Vehicular Networks Assuring Guarantees on the V2I Inter-Contact Time. In Proceedings of the 2016 IEEE 13th International Conference on Mobile Ad Hoc and Sensor Systems (MASS), Brasilia, Brazil, 10–13 October 2016; pp. 263–271. [Google Scholar] [CrossRef]
- Villalba, A.; Konstantas, D. Towards hovering information. In Smart Sensing and Context; Springer: Berlin/Heidelberg, Germany, 2006; pp. 250–254. [Google Scholar]
- Castro, A.A.V.; Serugendo, G.D.M.; Konstantas, D. Hovering information–self-organizing information that finds its own storage. In Autonomic Communication; Springer: Berlin/Heidelberg, Germany, 2009; pp. 111–145. [Google Scholar]
- Di, G.; Serugendo, M. Dependable requirements for hovering information. In Supplemental Volume—The 37th Annual IEEE/IFIP International Conference on Dependable Systems and Networks (DSN’07); IEEE Computer Society Press: Edinburgh, UK, 2007. [Google Scholar]
- Shoaib, M.; Song, W.C. Hovering information based vanet applications. In International Conference on Networked Digital Technologies; Springer: Berlin/Heidelberg, Germany, 2012; pp. 551–564. [Google Scholar]
- Nikolovski, T. Design and Performance Evaluation of Data Dissemination and Hovering Information Protocols for Vehicular Ad Hoc Networks (VANETs). Master’s Thesis, University of Ontario Institute of Technology, Oshawa, ON, Canada, 2017. [Google Scholar]
- Ciocan, M.; Dobre, C.; Cristea, V.; Mavromoustakis, C.X.; Mastorakis, G. Analysis of vehicular storage and dissemination services based on floating content. In International Conference on Mobile Networks and Management; Springer: Berlin/Heidelberg, Germany, 2014; pp. 387–400. [Google Scholar]
- Nikolovski, T.; Pazzi, R.W. A Lightweight and Efficient Approach (LEA) for Hovering Information protocols. In Proceedings of the 6th ACM Symposium on Development and Analysis of Intelligent Vehicular Networks and Applications, Valletta, Malta, 13–17 November 2016; pp. 31–38. [Google Scholar]
- Xeros, A.; Lestas, M.; Andreou, M.; Pitsillides, A. Adaptive probabilistic flooding for Information Hovering in VANETs. In Proceedings of the Vehicular Networking Conference (VNC), Jersey City, NJ, USA, 13–15 December 2010; pp. 239–246. [Google Scholar]
- Ott, J.; Hyytiá, E.; Lassila, P.; Vaegs, T.; Kangasharju, J. Floating content: Information sharing in urban areas. In Proceedings of the 2011 IEEE International Conference on Pervasive Computing and Communications (PerCom), Kyoto, Japan, 11–15 March 2011; pp. 136–146. [Google Scholar]
- Konstantas, D.; Villalba, A. Hovering Information: A paradigm for sharing location-bound information. In Proceedings of the European Conference on Smart Sensing and Context; Springer: Berlin/Heidelberg, Germany, 2006. [Google Scholar]
- Liaskos, C.; Xeros, A.; Papadimitriou, G.I.; Lestas, M.; Pitsillides, A. Balancing wireless data broadcasting and information hovering for efficient information dissemination. IEEE Trans. Broadcast. 2012, 58, 66–76. [Google Scholar] [CrossRef]
- Hermann, S.D.; Michl, C.; Wolisz, A. Time-stable geocast in intermittently connected ieee 802.11 manets. In Proceedings of the 2007 IEEE 66th Vehicular Technology Conference, Baltimore, MD, USA, 30 September–3 October 2007; pp. 1922–1926. [Google Scholar]
- Bhaskar, K.; Stephen, B.W.; Ramon, B. Phase Transition Phenomena in Wireless Ad-Hoc Networks. In Proceedings of the GLOBECOM, San Antonio, TX, USA, 25–29 November 2001. [Google Scholar]
- Xeros, A.; Lestas, M.; Andreou, M.; Pitsillides, A.; Ioannou, P. Information hovering in vehicular ad-hoc networks. In Proceedings of the 2009 IEEE GLOBECOM Workshops, Honolulu, HI, USA, 30 November–4 December 2009; pp. 1–6. [Google Scholar]
- Tseng, Y.C.; Ni, S.Y.; Chen, Y.S.; Sheu, J.P. The broadcast storm problem in a mobile ad hoc network. Wirel. Netw. 2002, 8, 153–167. [Google Scholar] [CrossRef]
- Williams, B.; Camp, T. Comparison of broadcasting techniques for mobile ad hoc networks. In Proceedings of the 3rd ACM International Symposium on Mobile Ad Hoc Networking & Computing; ACM: New York, NY, USA, 2002; pp. 194–205. [Google Scholar]
- Silva, C.M.; Meira, W., Jr. An architecture integrating stationary and mobile roadside units for providing communication on Intelligent Transportation Systems. In Proceedings of the NOMS 2016—2016 IEEE/IFIP Network Operations and Management Symposium, Istanbul, Turkey, 25–29 April 2016; pp. 358–365. [Google Scholar] [CrossRef]
- Boussoufa-Lahlah, S.; Semchedine, F.; Bouallouche-Medjkoune, L. Geographic routing protocols for Vehicular Ad hoc NETworks (VANETs): A survey. Veh. Commun. 2018, 11, 20–31. [Google Scholar] [CrossRef]
- Tian, D.; Liu, C.; Duan, X.; Sheng, Z.; Ni, Q.; Chen, M.; Leung, V.C. A distributed position-based protocol for emergency messages broadcasting in vehicular ad hoc networks. IEEE Internet Things J. 2018, 5, 1218–1227. [Google Scholar] [CrossRef]
- Sung, Y.; Lee, M. A road layout based broadcast mechanism for urban vehicular ad hoc networks. Wirel. Commun. Mob. Comput. 2018, 2018, 1565363. [Google Scholar] [CrossRef] [Green Version]
- Maia, G.; Villas, L.A.; Viana, A.C.; Aquino, A.L.; Boukerche, A.; Loureiro, A.A. A rate control video dissemination solution for extremely dynamic vehicular ad hoc networks. Perform. Eval. 2015, 87, 3–18. [Google Scholar] [CrossRef]
- Oliveira, R.; Montez, C.; Boukerche, A.; Wangham, M.S. Reliable data dissemination protocol for VANET traffic safety applications. Ad Hoc Netw. 2017, 63, 30–44. [Google Scholar] [CrossRef]
- Rayeni, M.S.; Hafid, A.; Sahu, P.K. Dynamic spatial partition density-based emergency message dissemination in VANETs. Veh. Commun. 2015, 2, 208–222. [Google Scholar] [CrossRef]
- Woon, W.; Yeung, K.L. Self-pruning broadcasting for mobile ad hoc networks. In Proceedings of the Global Telecommunications Conference, GLOBECOM 2009, Honolulu, HI, USA, 30 November–4 December 2009; pp. 1–6. [Google Scholar]
- Peng, W.; Lu, X.C. On the reduction of broadcast redundancy in mobile ad hoc networks. In Proceedings of the 1st ACM International Symposium on Mobile ad Hoc Networking & Computing; IEEE Press: Piscataway, NJ, USA, 2000; pp. 129–130. [Google Scholar]
- Bakhouya, M.; Gaber, J.; Lorenz, P. An adaptive approach for information dissemination in vehicular ad hoc networks. J. Netw. Comput. Appl. 2011, 34, 1971–1978. [Google Scholar] [CrossRef]
- Yassein, M.B.; Nimer, S.F.; Al-Dubai, A.Y. A new dynamic counter-based broadcasting scheme for mobile ad hoc networks. Simul. Model. Pract. Theory 2011, 19, 553–563. [Google Scholar] [CrossRef]
- Reina, D.; Toral, S.; Johnson, P.; Barrero, F. A survey on probabilistic broadcast schemes for wireless ad hoc networks. Ad Hoc Netw. 2015, 25, 263–292. [Google Scholar] [CrossRef] [Green Version]
- Liu, W.; Nakauchi, K.; Shoji, Y. A neighbor-based probabilistic broadcast protocol for data dissemination in mobile iot networks. IEEE Access 2018, 6, 12260–12268. [Google Scholar] [CrossRef]
- Cunha, F.; Boukerche, A.; Villas, L.; Viana, A.; Loureiro, A. Data Communication in VANETs: A Survey, Challenges and Applications. Ad Hoc Netw. 2016, 44, 90–103. [Google Scholar] [CrossRef]
- Kaiwartya, O.; Kumar, S. Guaranteed geocast routing protocol for vehicular adhoc networks in highway traffic environment. Wirel. Pers. Commun. 2015, 83, 2657–2682. [Google Scholar] [CrossRef]
- Kaiwartya, O.; Kumar, S. Enhanced caching for geocast routing in vehicular Ad Hoc network. In Intelligent Computing, Networking, and Informatics; Springer: Berlin/Heidelberg, Germany, 2014; pp. 213–220. [Google Scholar]
- Allani, S.; Yeferny, T.; Chbeir, R. A scalable data dissemination protocol based on vehicles trajectories analysis. Ad Hoc Netw. 2018, 71, 31–44. [Google Scholar] [CrossRef]
- Ko, Y.B.; Vaidya, N.H. Geocasting in mobile ad hoc networks: Location-based multicast algorithms. In Proceedings of the WMCSA’99. Second IEEE Workshop on Mobile Computing Systems and Applications, New Orleans, LA, USA, 25–26 February 1999; pp. 101–110. [Google Scholar]
- Allal, S.; Boudjit, S. Geocast routing protocols for vanets: Survey and guidelines. In Proceedings of the 2012 Sixth International Conference on Innovative Mobile and Internet Services in Ubiquitous Computing (IMIS), Palermo, Italy, 4–6 July 2012; pp. 323–328. [Google Scholar]
- Maihöfer, C.; Leinmüller, T.; Schoch, E. Abiding geocast: Time–stable geocast for ad hoc networks. In Proceedings of the 2nd ACM International Workshop on Vehicular ad Hoc Networks, Cologne, Germany, 2 September 2005; pp. 20–29. [Google Scholar]
- Yu, Q.; Heijenk, G. Abiding geocast for warning message dissemination in vehicular ad hoc networks. In Proceedings of the IEEE International Conference on Communications Workshops, 2008. ICC Workshops’ 08, Beijing, China, 19–23 May 2008; pp. 400–404. [Google Scholar]
- Soares, V.N.; Rodrigues, J.J.; Farahmand, F. GeoSpray: A geographic routing protocol for vehicular delay-tolerant networks. Inf. Fusion 2014, 15, 102–113. [Google Scholar] [CrossRef]
- Pereira, P.R.; Casaca, A.; Rodrigues, J.J.; Soares, V.N.; Triay, J.; Cervelló-Pastor, C. From delay-tolerant networks to vehicular delay-tolerant networks. IEEE Commun. Surv. Tutor. 2012, 14, 1166–1182. [Google Scholar] [CrossRef]
- Kloiber, B.; Strang, T.; Spijker, H.; Heijenk, G. Improving information dissemination in sparse vehicular networks by adding satellite communication. In Proceedings of the 2012 IEEE Intelligent Vehicles Symposium (IV), Madrid, Spain, 3–7 June 2012; pp. 611–617. [Google Scholar]
- Mittag, J.; Thomas, F.; Härri, J.; Hartenstein, H. A comparison of single-and multi-hop beaconing in VANETs. In Proceedings of the Sixth ACM International Workshop on Vehicular Internetworking; ACM: New York, NY, USA, 2009; pp. 69–78. [Google Scholar]
- Shah, S.A.A.; Ahmed, E.; Xia, F.; Karim, A.; Shiraz, M.; Noor, R.M. Adaptive beaconing approaches for vehicular ad hoc networks: A survey. IEEE Syst. J. 2016, 12, 1263–1277. [Google Scholar] [CrossRef] [Green Version]
- Boukerche, A.; Rezende, C.; Pazzi, R.W. Improving neighbor localization in vehicular ad hoc networks to avoid overhead from periodic messages. In Proceedings of the Global Telecommunications Conference, GLOBECOM 2009, Honolulu, HI, USA, 30 November–4 December 2009; pp. 1–6. [Google Scholar]
- Schmidt, R.K.; Leinmuller, T.; Schoch, E.; Kargl, F.; Schafer, G. Exploration of adaptive beaconing for efficient intervehicle safety communication. IEEE Netw. 2010, 24, 14–19. [Google Scholar] [CrossRef] [Green Version]
- Tielert, T.; Jiang, D.; Chen, Q.; Delgrossi, L.; Hartenstein, H. Design methodology and evaluation of rate adaptation based congestion control for vehicle safety communications. In Proceedings of the 2011 IEEE Vehicular Networking Conference (VNC), Amsterdam, The Netherlands, 14–16 November 2011; pp. 116–123. [Google Scholar]
- Kloiber, B.; Harri, J.; Strang, T. Dice the TX power—Improving Awareness Quality in VANETs by random transmit power selection. In Proceedings of the 2012 IEEE Vehicular Networking Conference (VNC), Seoul, Korea, 14–16 November 2012; pp. 56–63. [Google Scholar]
- Torrent-Moreno, M.; Mittag, J.; Santi, P.; Hartenstein, H. Vehicle-to-vehicle communication: Fair transmit power control for safety-critical information. IEEE Trans. Veh. Technol. 2009, 58, 3684–3703. [Google Scholar] [CrossRef]
- Burleigh, S.; Hooke, A.; Torgerson, L.; Fall, K.; Cerf, V.; Durst, B.; Scott, K.; Weiss, H. Delay-tolerant networking: An approach to interplanetary internet. IEEE Commun. Mag. 2003, 41, 128–136. [Google Scholar] [CrossRef] [Green Version]
- Fall, K.; Scott, K.L.; Burleigh, S.C.; Torgerson, L.; Hooke, A.J.; Weiss, H.S.; Durst, R.C.; Cerf, V. Delay-Tolerant Networking Architecture RFC 4838. April 2007. Available online: https://tools.ietf.org/html/rfc4838 (accessed on 10 June 2020).
- Scott, K.; Burleigh, S. Bundle Protocol Specification, IETF RFC 5050, Experimental. November 2007. Available online: https://tools.ietf.org/html/rfc5050 (accessed on 10 June 2020).
- Soares, V.N.; Farahmand, F.; Rodrigues, J.J. A layered architecture for vehicular delay-tolerant networks. In Proceedings of the IEEE Symposium on Computers and Communications, ISCC 2009, Sousse, Tunisia, 5–8 July 2009; pp. 122–127. [Google Scholar]
- Benamar, N.; Singh, K.D.; Benamar, M.; El Ouadghiri, D.; Bonnin, J.M. Routing protocols in vehicular delay tolerant networks: A comprehensive survey. Comput. Commun. 2014, 48, 141–158. [Google Scholar] [CrossRef]
- Mangrulkar, R.; Atique, M. Routing protocol for delay tolerant network: A survey and comparison. In Proceedings of the 2010 IEEE International Conference on Communication Control and Computing Technologies (ICCCCT), Ramanathapuram, India, 7–9 October 2010; pp. 210–215. [Google Scholar]
- Spyropoulos, T.; Psounis, K.; Raghavendra, C.S. Spray and wait: An efficient routing scheme for intermittently connected mobile networks. In Proceedings of the 2005 ACM SIGCOMM Workshop on Delay-Tolerant Networking; ACM: New York, NY, USA, 2005; pp. 252–259. [Google Scholar]
- Jain, S.; Fall, K.; Patra, R. Routing in a delay tolerant network. In Proceedings of the 2004 Conference on Applications, Technologies, Architectures, and Protocols for Computer Communications, Portland, OR, USA, 30 August–3 September 2004; Volume 34. [Google Scholar]
- Leontiadis, I.; Mascolo, C. GeOpps: Geographical opportunistic routing for vehicular networks. In Proceedings of the 2007 IEEE International Symposium on a World of Wireless, Mobile and Multimedia Networks, Helsinki, Finland, 18–21 June 2007; pp. 1–6. [Google Scholar]
- Zhu, X.; Chen, C.; Pan, Z.; Guan, X. Fast and Reliable Warning Message Dissemination Mechanism in Urban Expressway VANETs. In Proceedings of the IEEE/CIC International Conference on Communications in China, Chengdu, China, 27–29 July 2016; pp. 1–6. [Google Scholar]
- Liu, Y.; Chen, C.; Guan, X. A hovering-based warning information dissemination approach in highway entrances. In Proceedings of the 2014 IEEE International Conference on Communications (ICC), Sydney, Australia, 16–20 June 2014; pp. 2719–2724. [Google Scholar]
- Shuai, X. Neighbor Trigger for Hovering Information. J. Phys. Conf. Ser. 2018, 1060, 012039. [Google Scholar] [CrossRef]
- Amjad, Z.; Song, W.C.; Ahn, K.J. Context-Aware Routing for hovering information in Vehicular Ad-Hoc Networks. In Proceedings of the 2016 18th Asia-Pacific Network Operations and Management Symposium (APNOMS), Kanazawa, Japan, 5–7 October 2016; pp. 1–6. [Google Scholar]
- Song, W.C.; Ur Rehman, S.; Awan, M.B. Road Aware Information Sharing in VANETs. KSII Trans. Internet Inf. Syst. 2015, 9. [Google Scholar] [CrossRef]
- PTV Traffic Mobility Logistics. Available online: http://www.ptvamerica.com/vissim.htm (accessed on 10 June 2020).
- Silva, C.M.; Meira, W.; Sarubbi, J.F.M. Non-Intrusive Planning the Roadside Infrastructure for Vehicular Networks. IEEE Trans. Intell. Transp. Syst. 2016, 17, 938–947. [Google Scholar] [CrossRef]
- Mylonas, Y.; Lestas, M.; Pitsillides, A.; Ioannou, P.; Papadopoulou, V. Speed Adaptive Probabilistic Flooding for Vehicular Ad Hoc Networks. IEEE Trans. Veh. Technol. 2015, 64, 1973–1990. [Google Scholar] [CrossRef]
Figure 1.
Schematic representation of the design procedure.

Figure 2.
Candidate non-increasing rebroadcast probability functions; the Gaussian, Exponential, Linear, and Step functions.
Figure 2.
Candidate non-increasing rebroadcast probability functions; the Gaussian, Exponential, Linear, and Step functions.

Figure 3.
A section of the road network in the cities of Bellevue and Redmond in Washington, used in the simulations reference model. Hovering areas are marked as green circles.
Figure 3.
A section of the road network in the cities of Bellevue and Redmond in Washington, used in the simulations reference model. Hovering areas are marked as green circles.

Figure 4.
Number of messages exchanged and the Reachability vs. the traffic density for each of the candidate probability functions; epidemic routing inside the area (dark blue), linear (red), step (yellow), exponential (purple), normal (green), and epidemic routing in the entire network (light blue).

Figure 5.
Number of messages exchanged and reachability in hovering area A for different values of when the vehicle density is set to 6.7 vehicles/Km2.
Figure 5.
Number of messages exchanged and reachability in hovering area A for different values of when the vehicle density is set to 6.7 vehicles/Km2.

Figure 6.
Reachability vs. the number of messages exchanged for different values of in areas B and C.
Figure 6.
Reachability vs. the number of messages exchanged for different values of in areas B and C.

Figure 7.
(a) Critical value of sigma vs. traffic density in different hovering areas together with their least squares curve. (b) Average number of neighbors in different hovering areas and average number of vehicles, and comparison with the predicted values using Equation (14).
Figure 7.
(a) Critical value of sigma vs. traffic density in different hovering areas together with their least squares curve. (b) Average number of neighbors in different hovering areas and average number of vehicles, and comparison with the predicted values using Equation (14).

Figure 8.
Road topology of the model used to relate analytically the vehicle density vs. the average number of neighbors.
Figure 8.
Road topology of the model used to relate analytically the vehicle density vs. the average number of neighbors.

Figure 9.
Road topology of the simulations reference model used for protocol evaluation.

Figure 10.
Comparison of the proposed adaptive probabilistic scheme with other hovering schemes in terms of the reachability achieved and the number of messages exchanged in area H for different average number of vehicles in the area.
Figure 10.
Comparison of the proposed adaptive probabilistic scheme with other hovering schemes in terms of the reachability achieved and the number of messages exchanged in area H for different average number of vehicles in the area.

Figure 11.
Comparison of the proposed adaptive probabilistic scheme with other hovering schemes in terms of the reachability achieved and the number of messages exchanged in area G for different average number of vehicles in the area.
Figure 11.
Comparison of the proposed adaptive probabilistic scheme with other hovering schemes in terms of the reachability achieved and the number of messages exchanged in area G for different average number of vehicles in the area.

Figure 12.
Comparison of the proposed hovering scheme with a protocol which assumes the vehicle density within the hovering area to be known. The comparison is made in terms of the reachability achieved and the number of messages exchanged in areas H and G for different average number of vehicles in the area.

Figure 13.
Percentage increase of the critical radius relative to the radius of the hovering area vs. traffic density graphs in different hovering areas, together with their least squares fit used in the adaptive version of Reference [28].
Figure 13.
Percentage increase of the critical radius relative to the radius of the hovering area vs. traffic density graphs in different hovering areas, together with their least squares fit used in the adaptive version of Reference [28].

Figure 14.
Comparison of the adaptive probabilistic flooding hovering scheme with the adaptive version of the hovering protocol proposed in Reference [28] in terms of the reachability achieved and the number of exchanged messages in areas H and G for different average number of vehicles in the area.


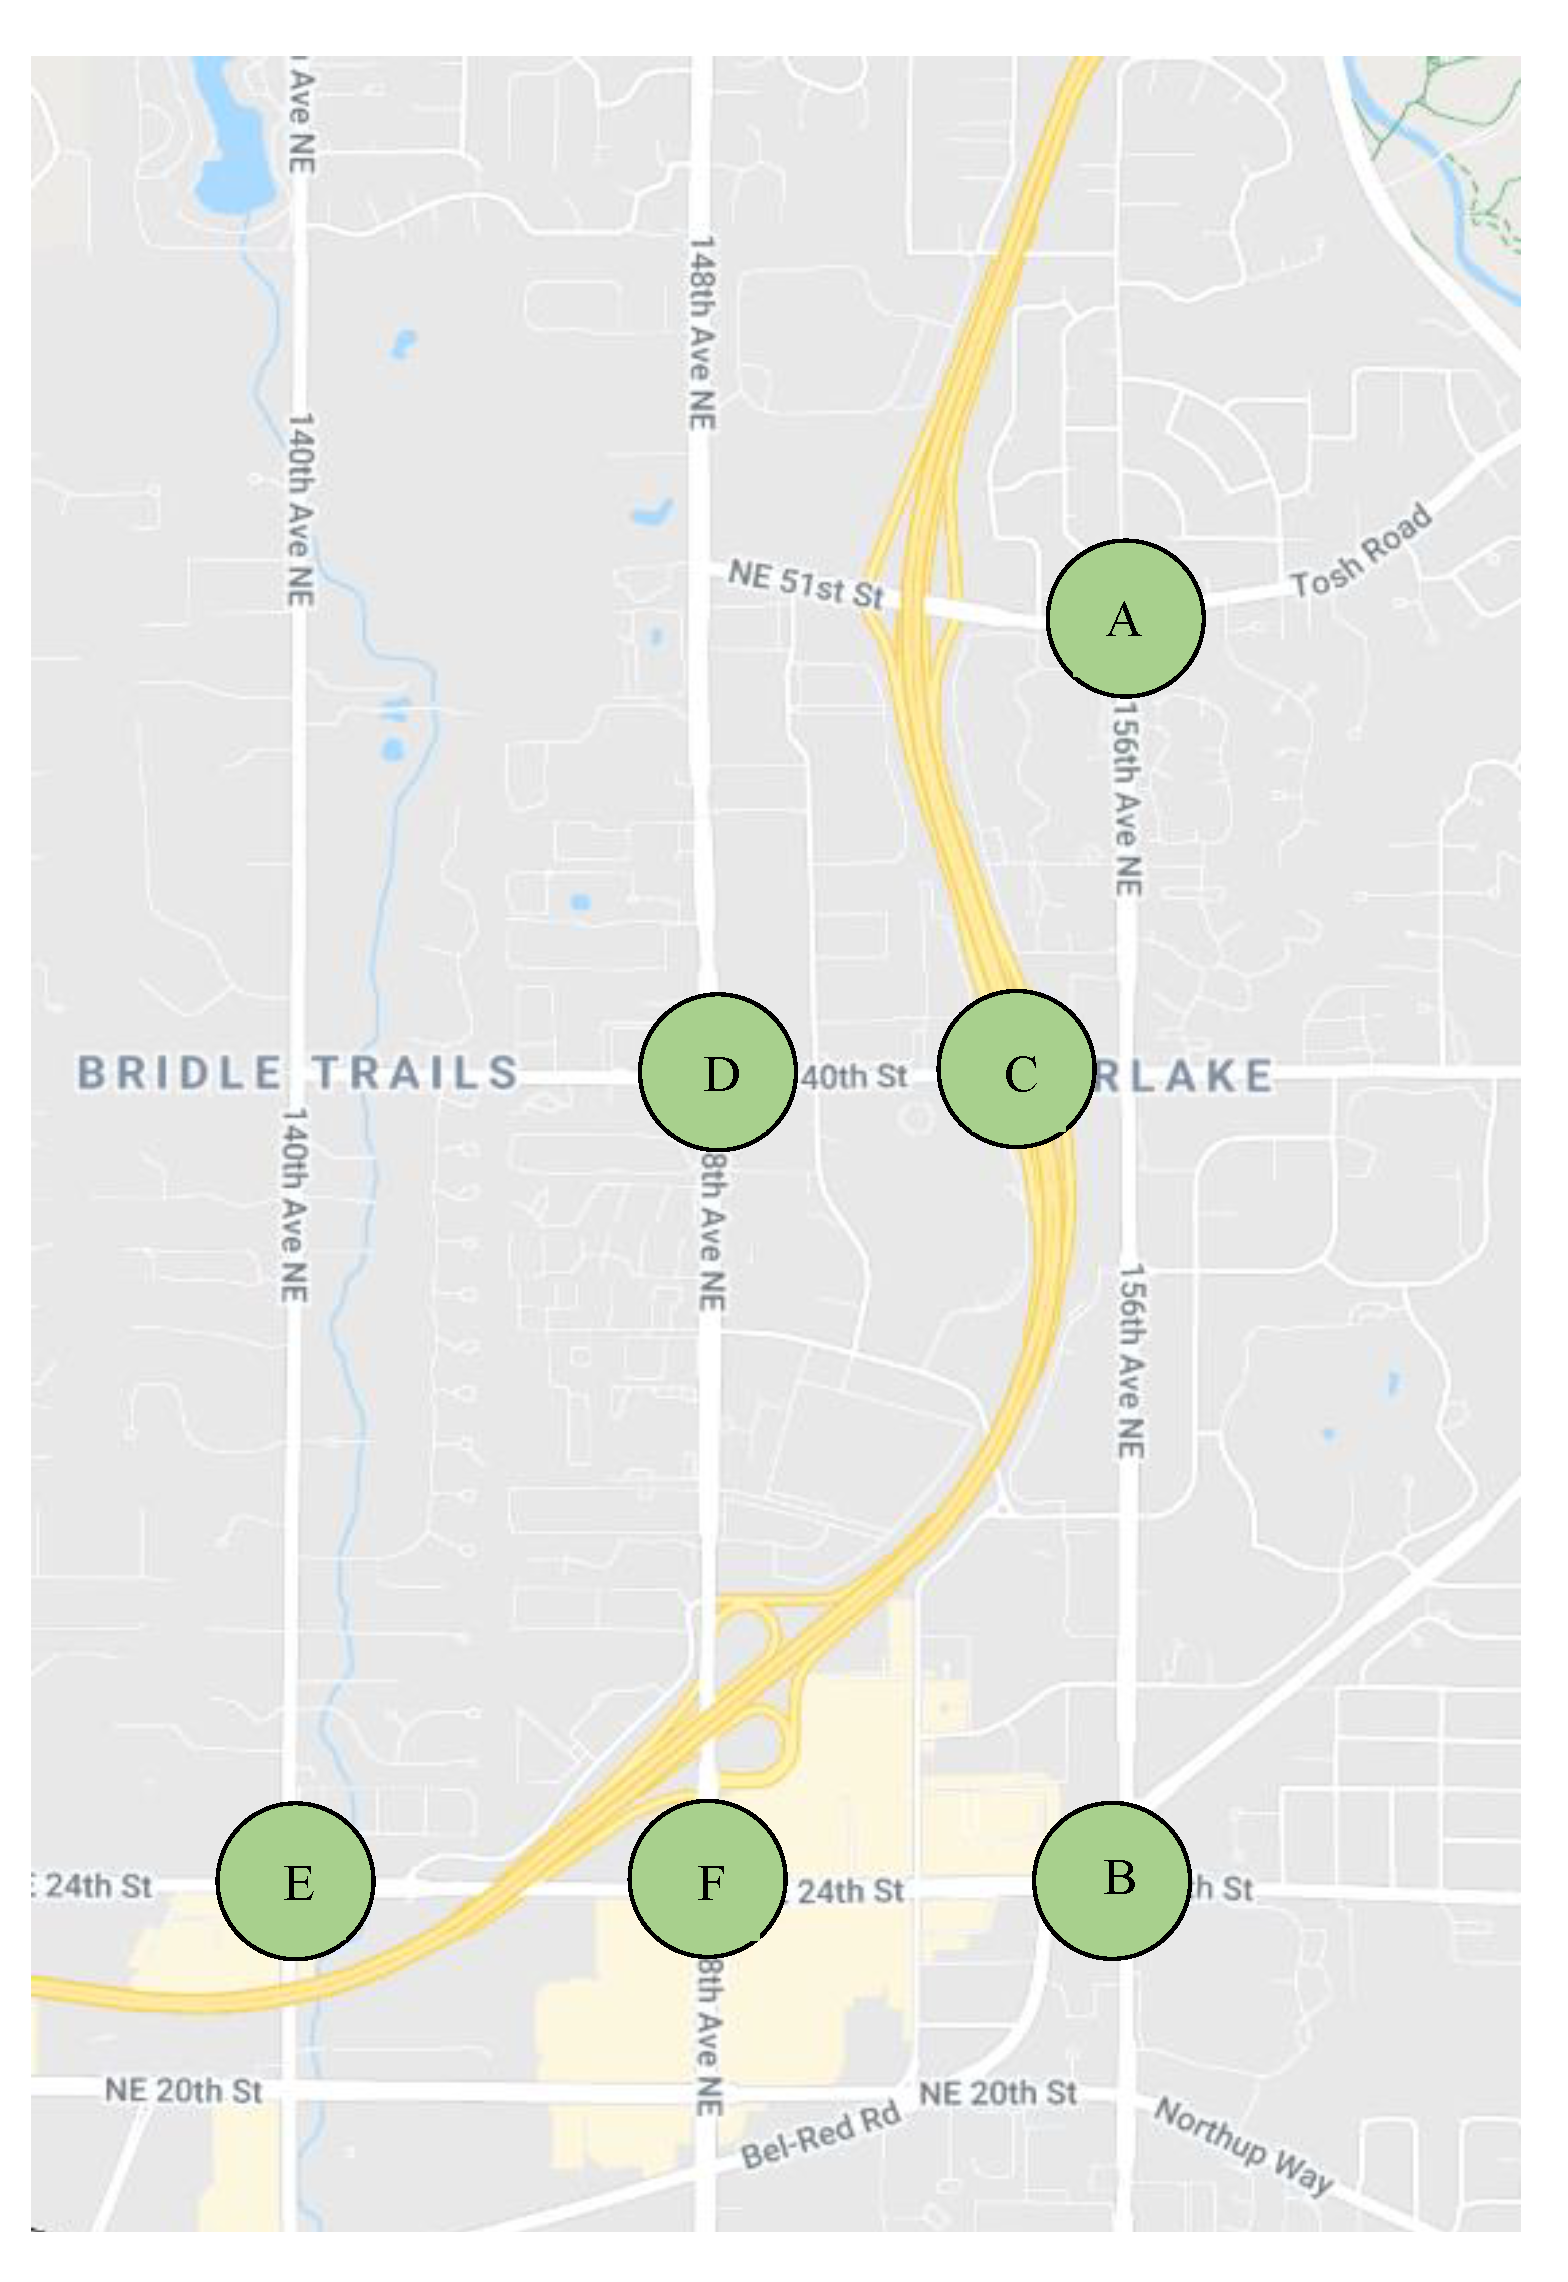
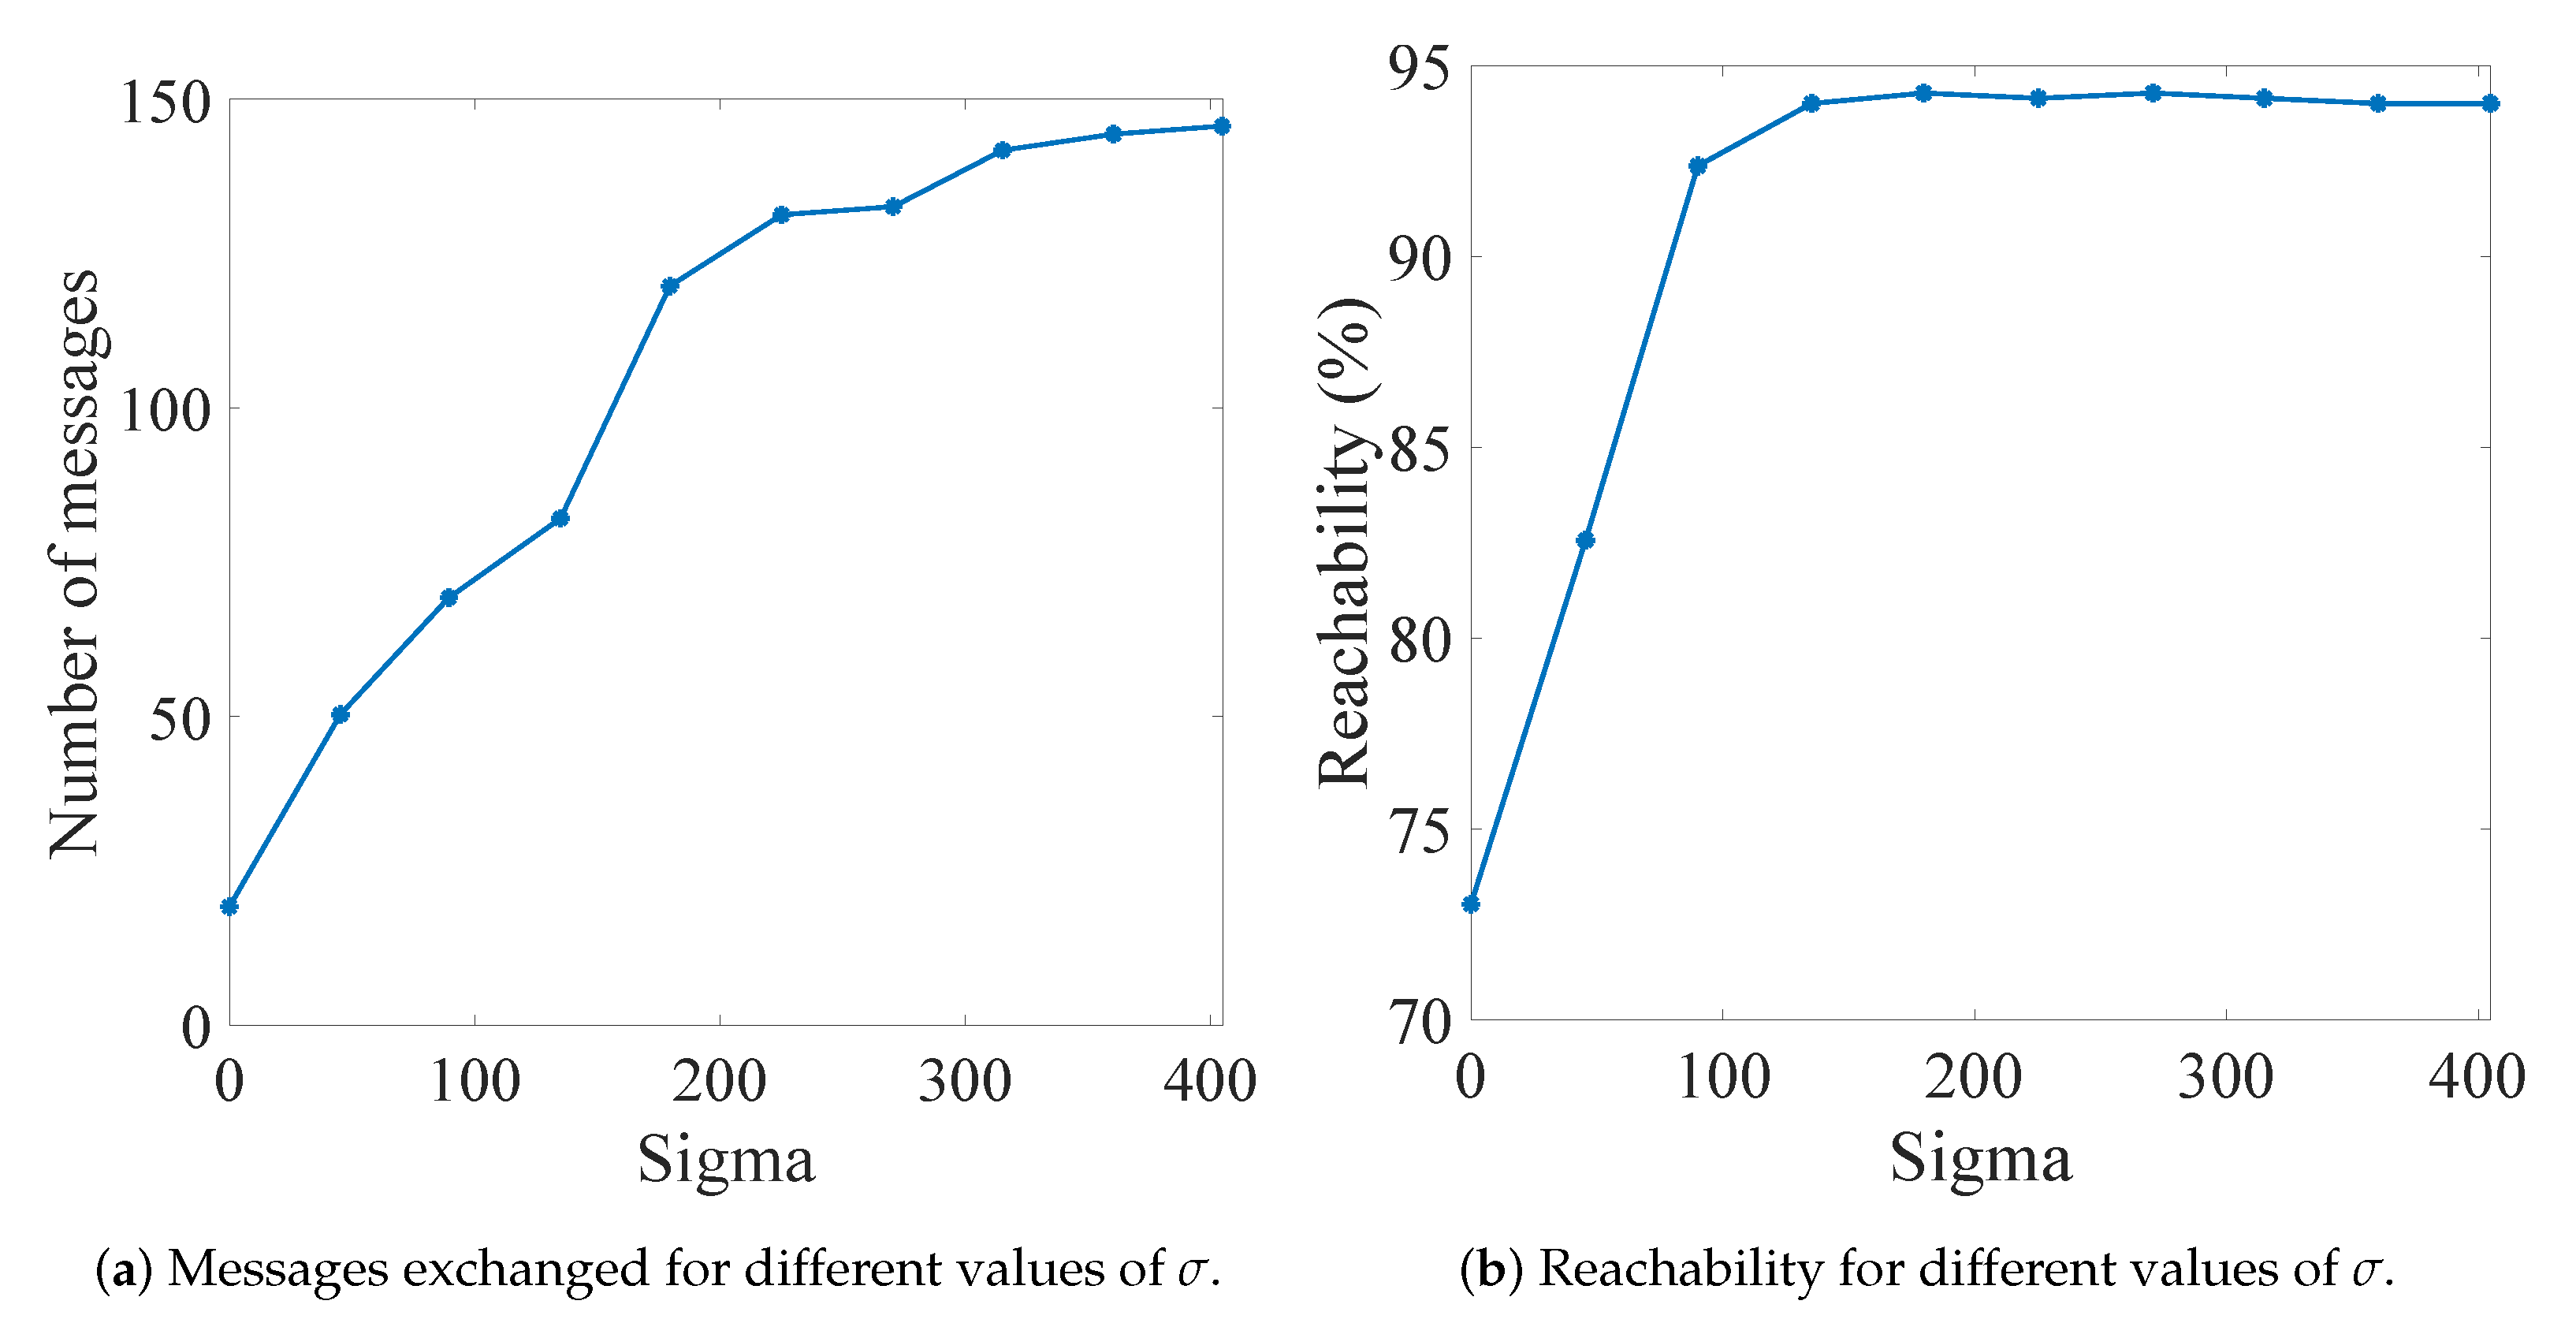
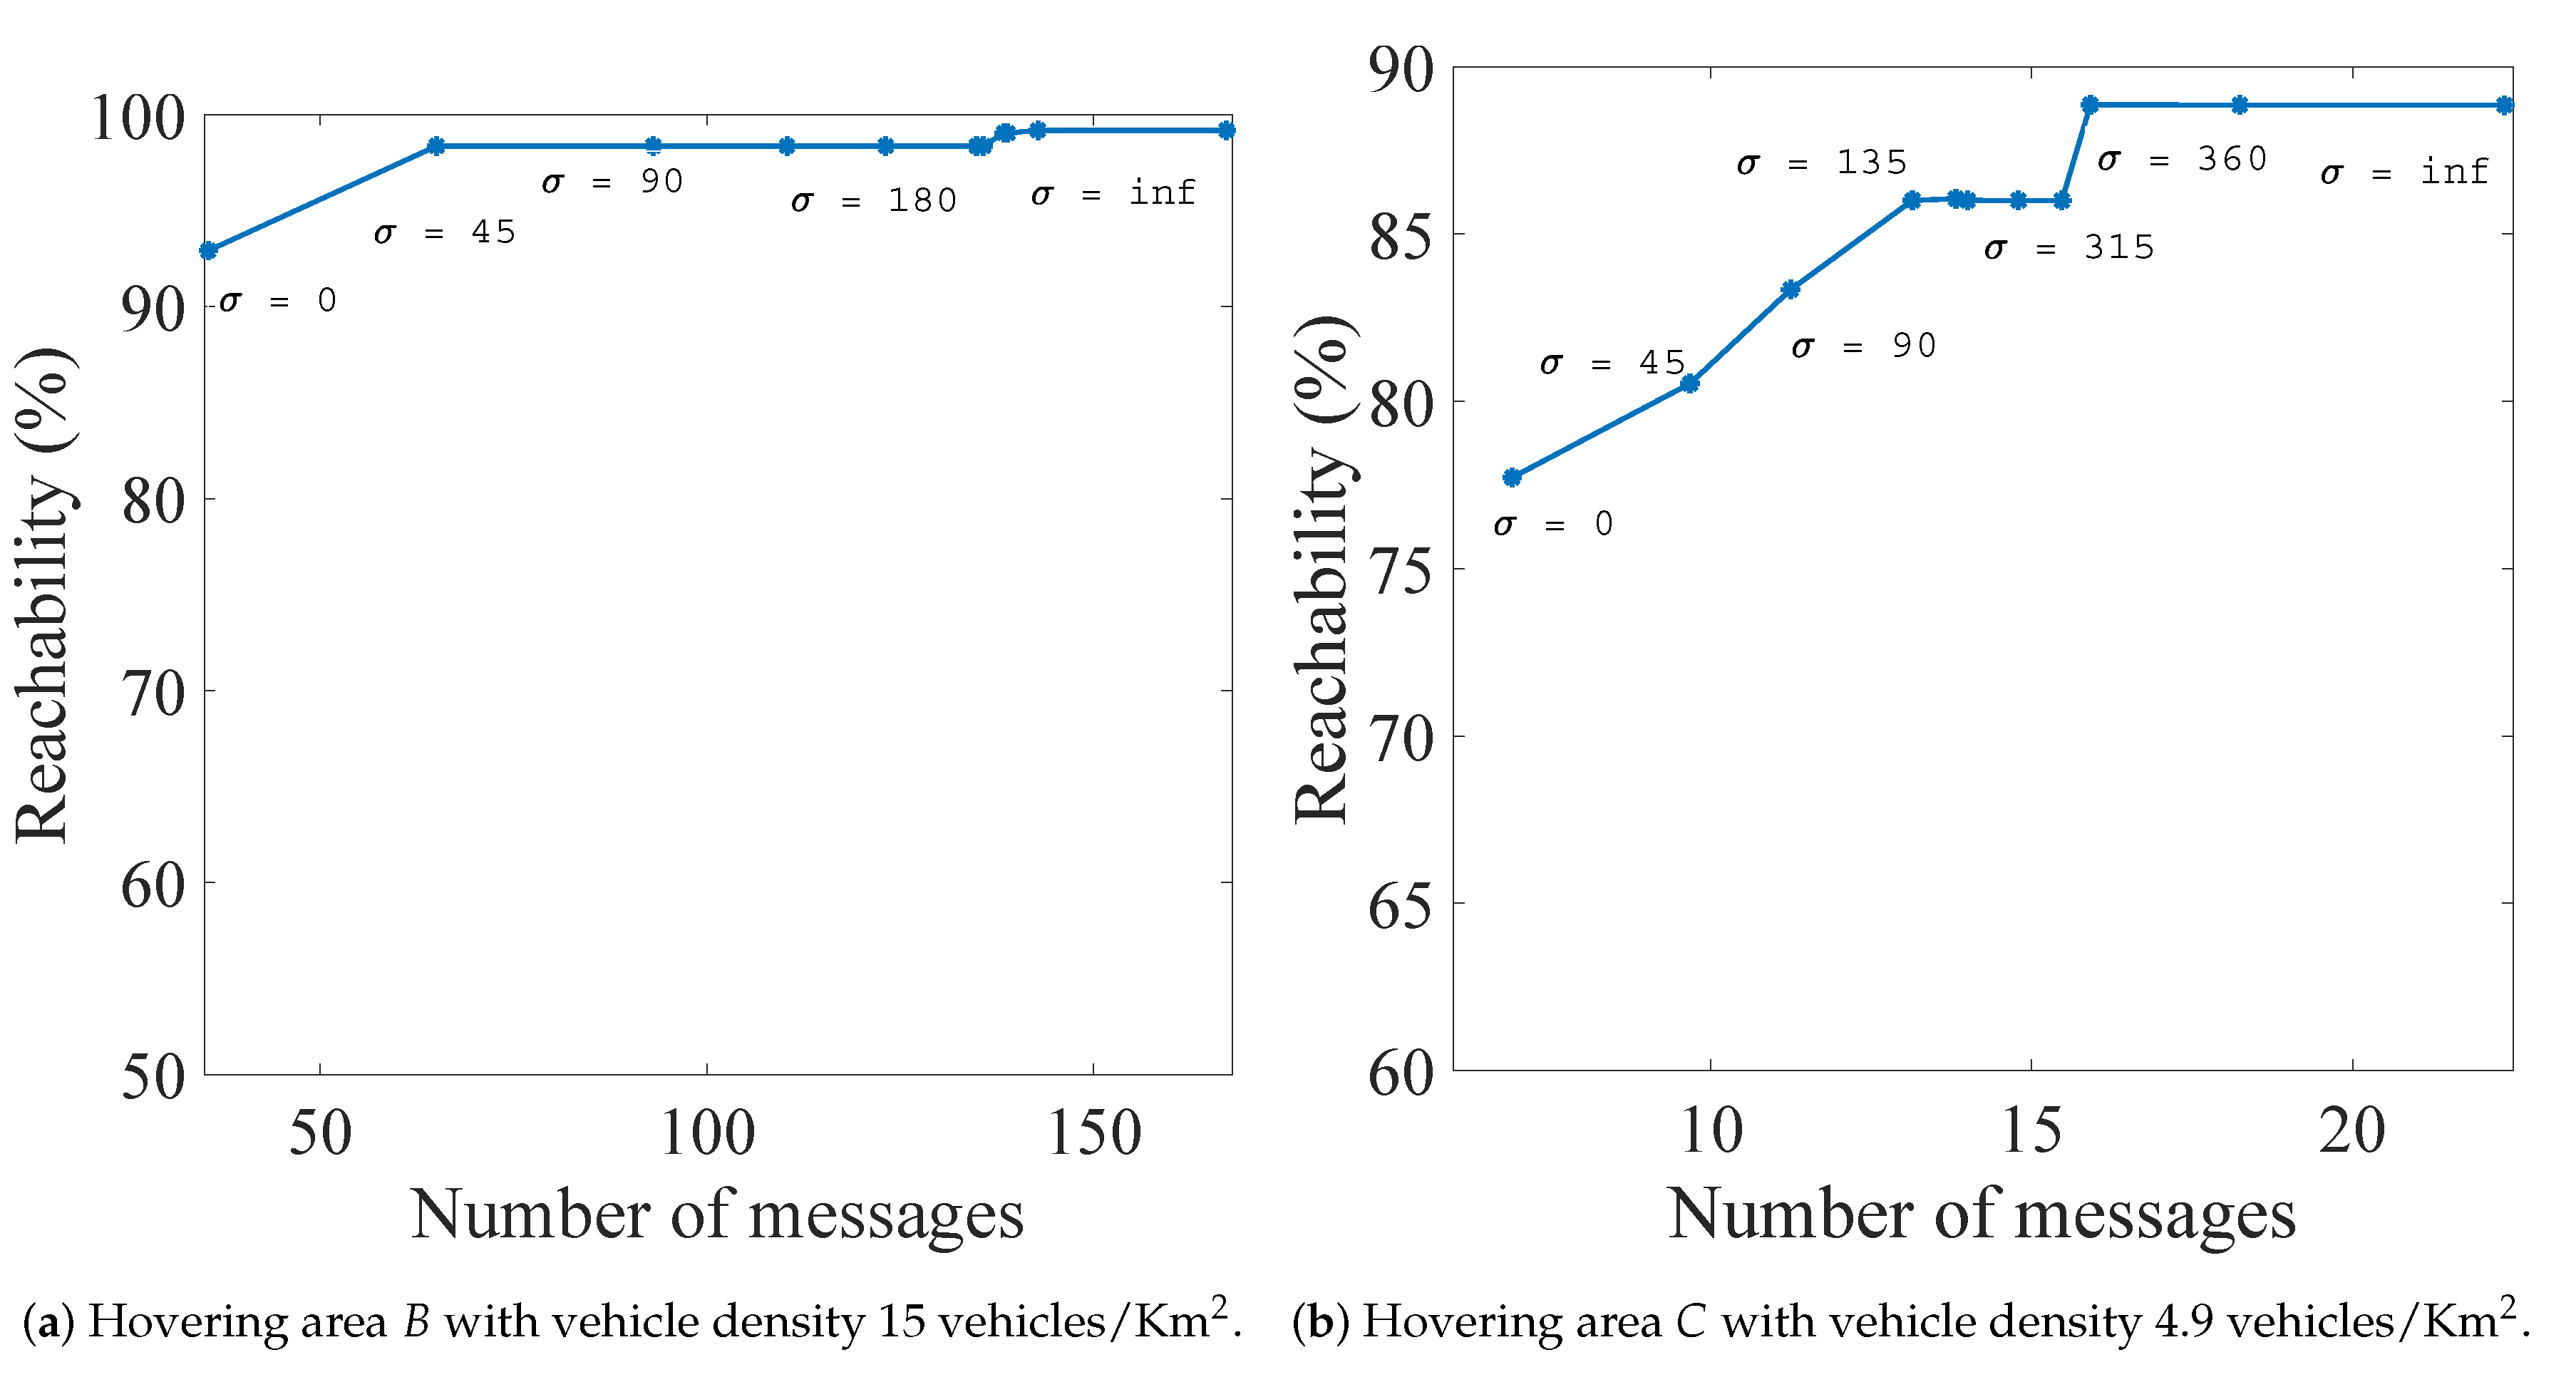
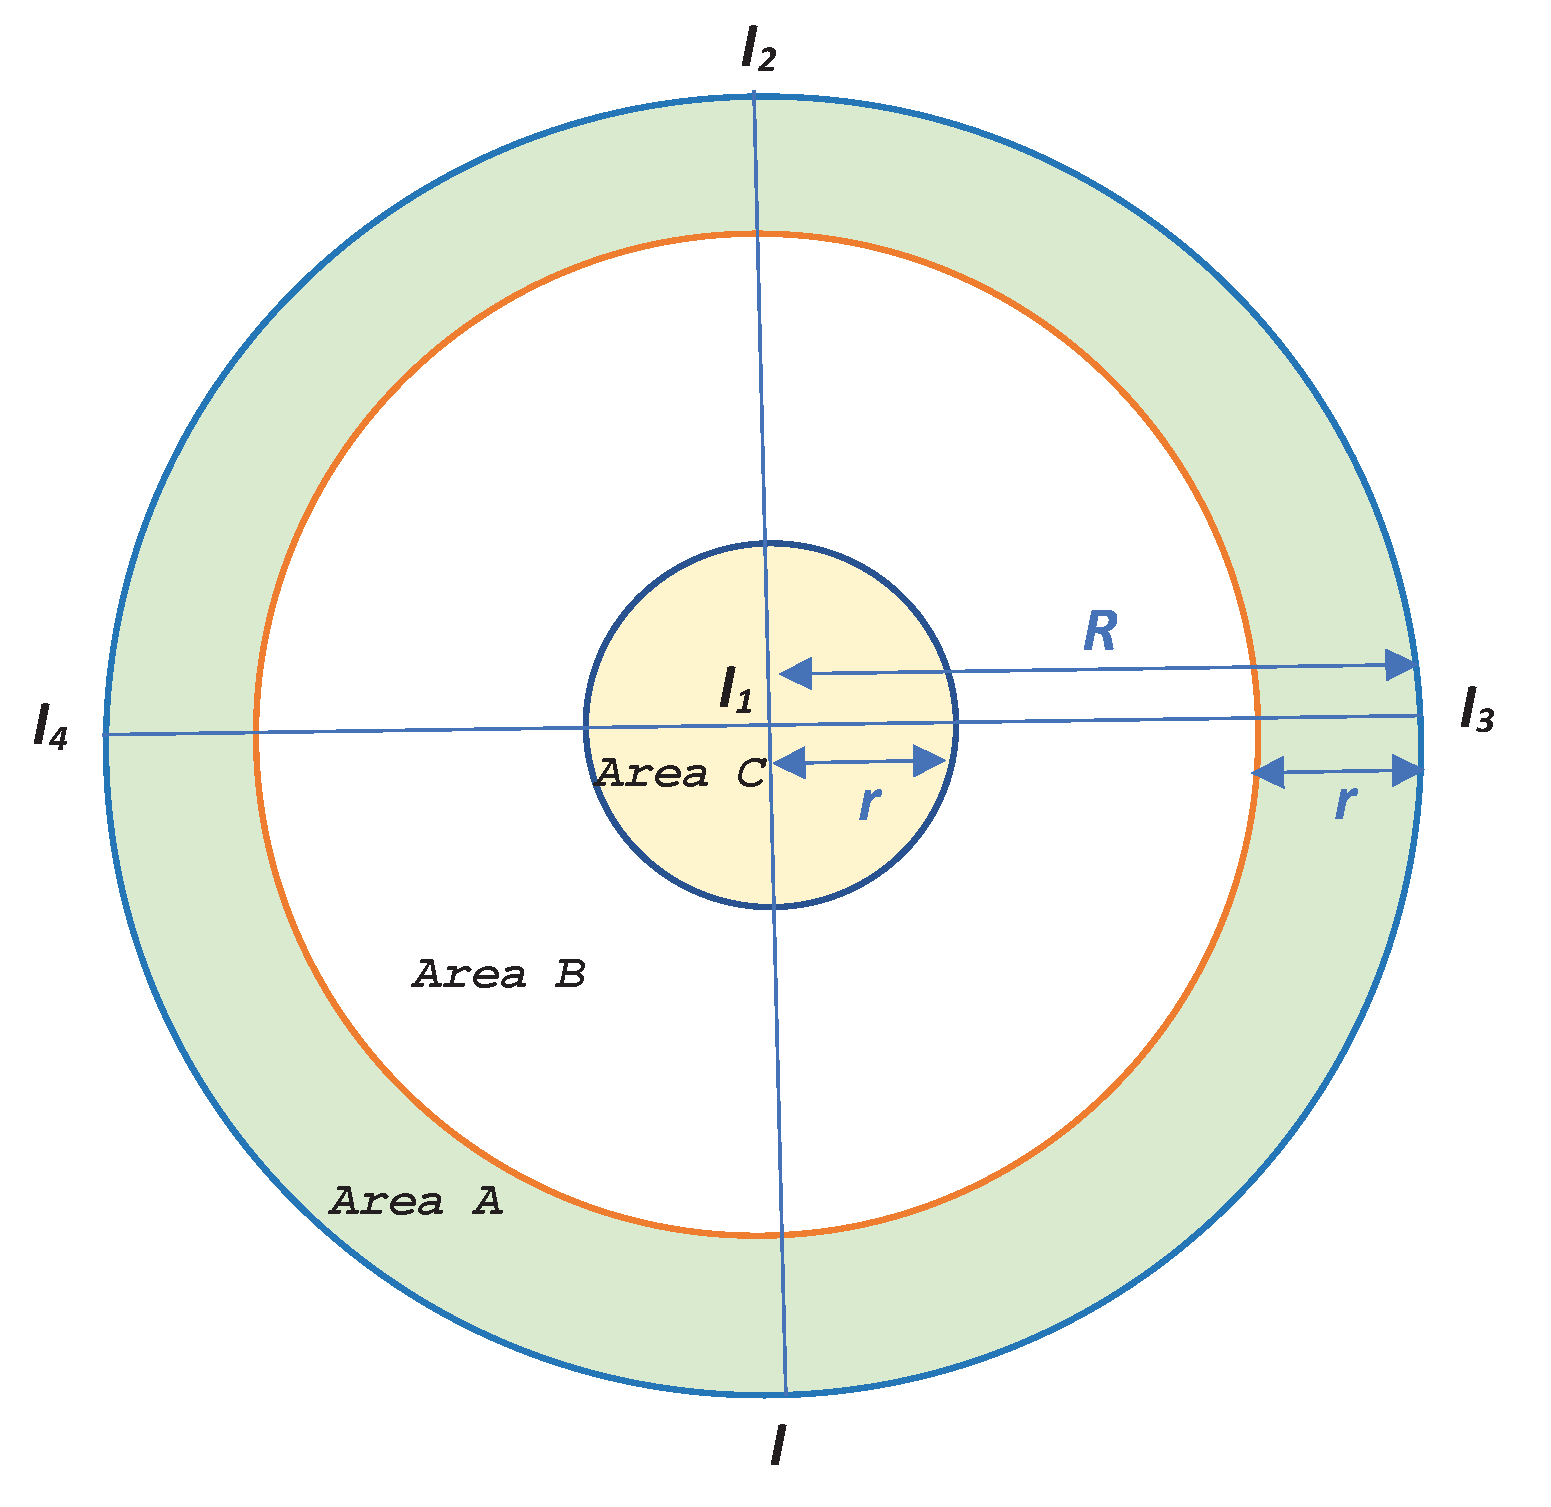
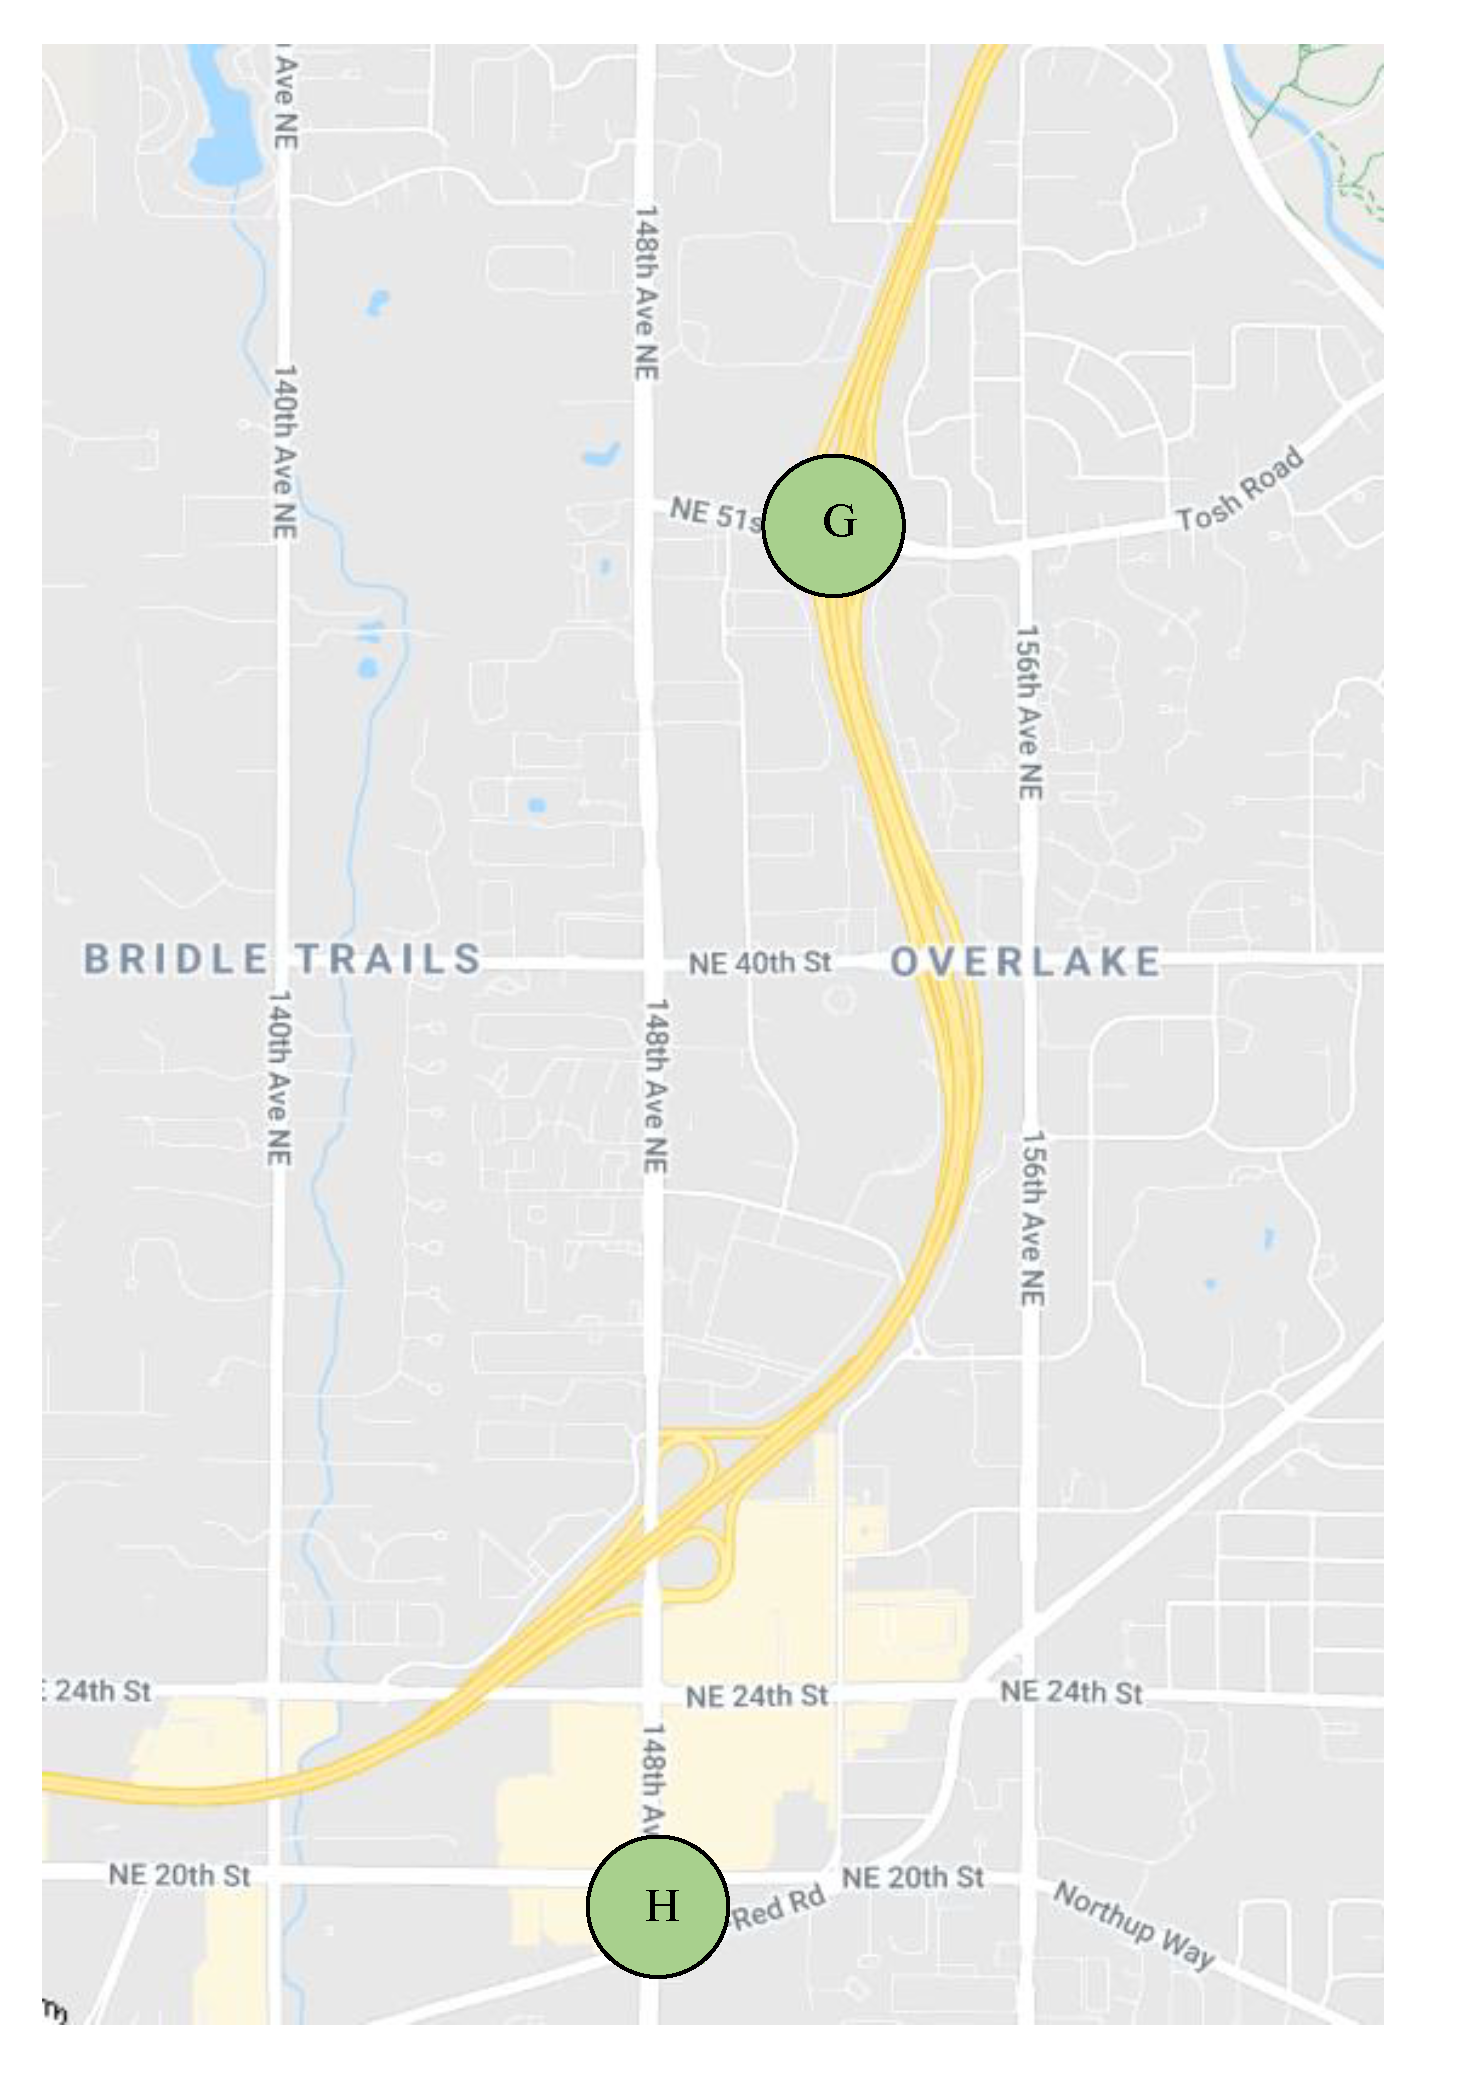
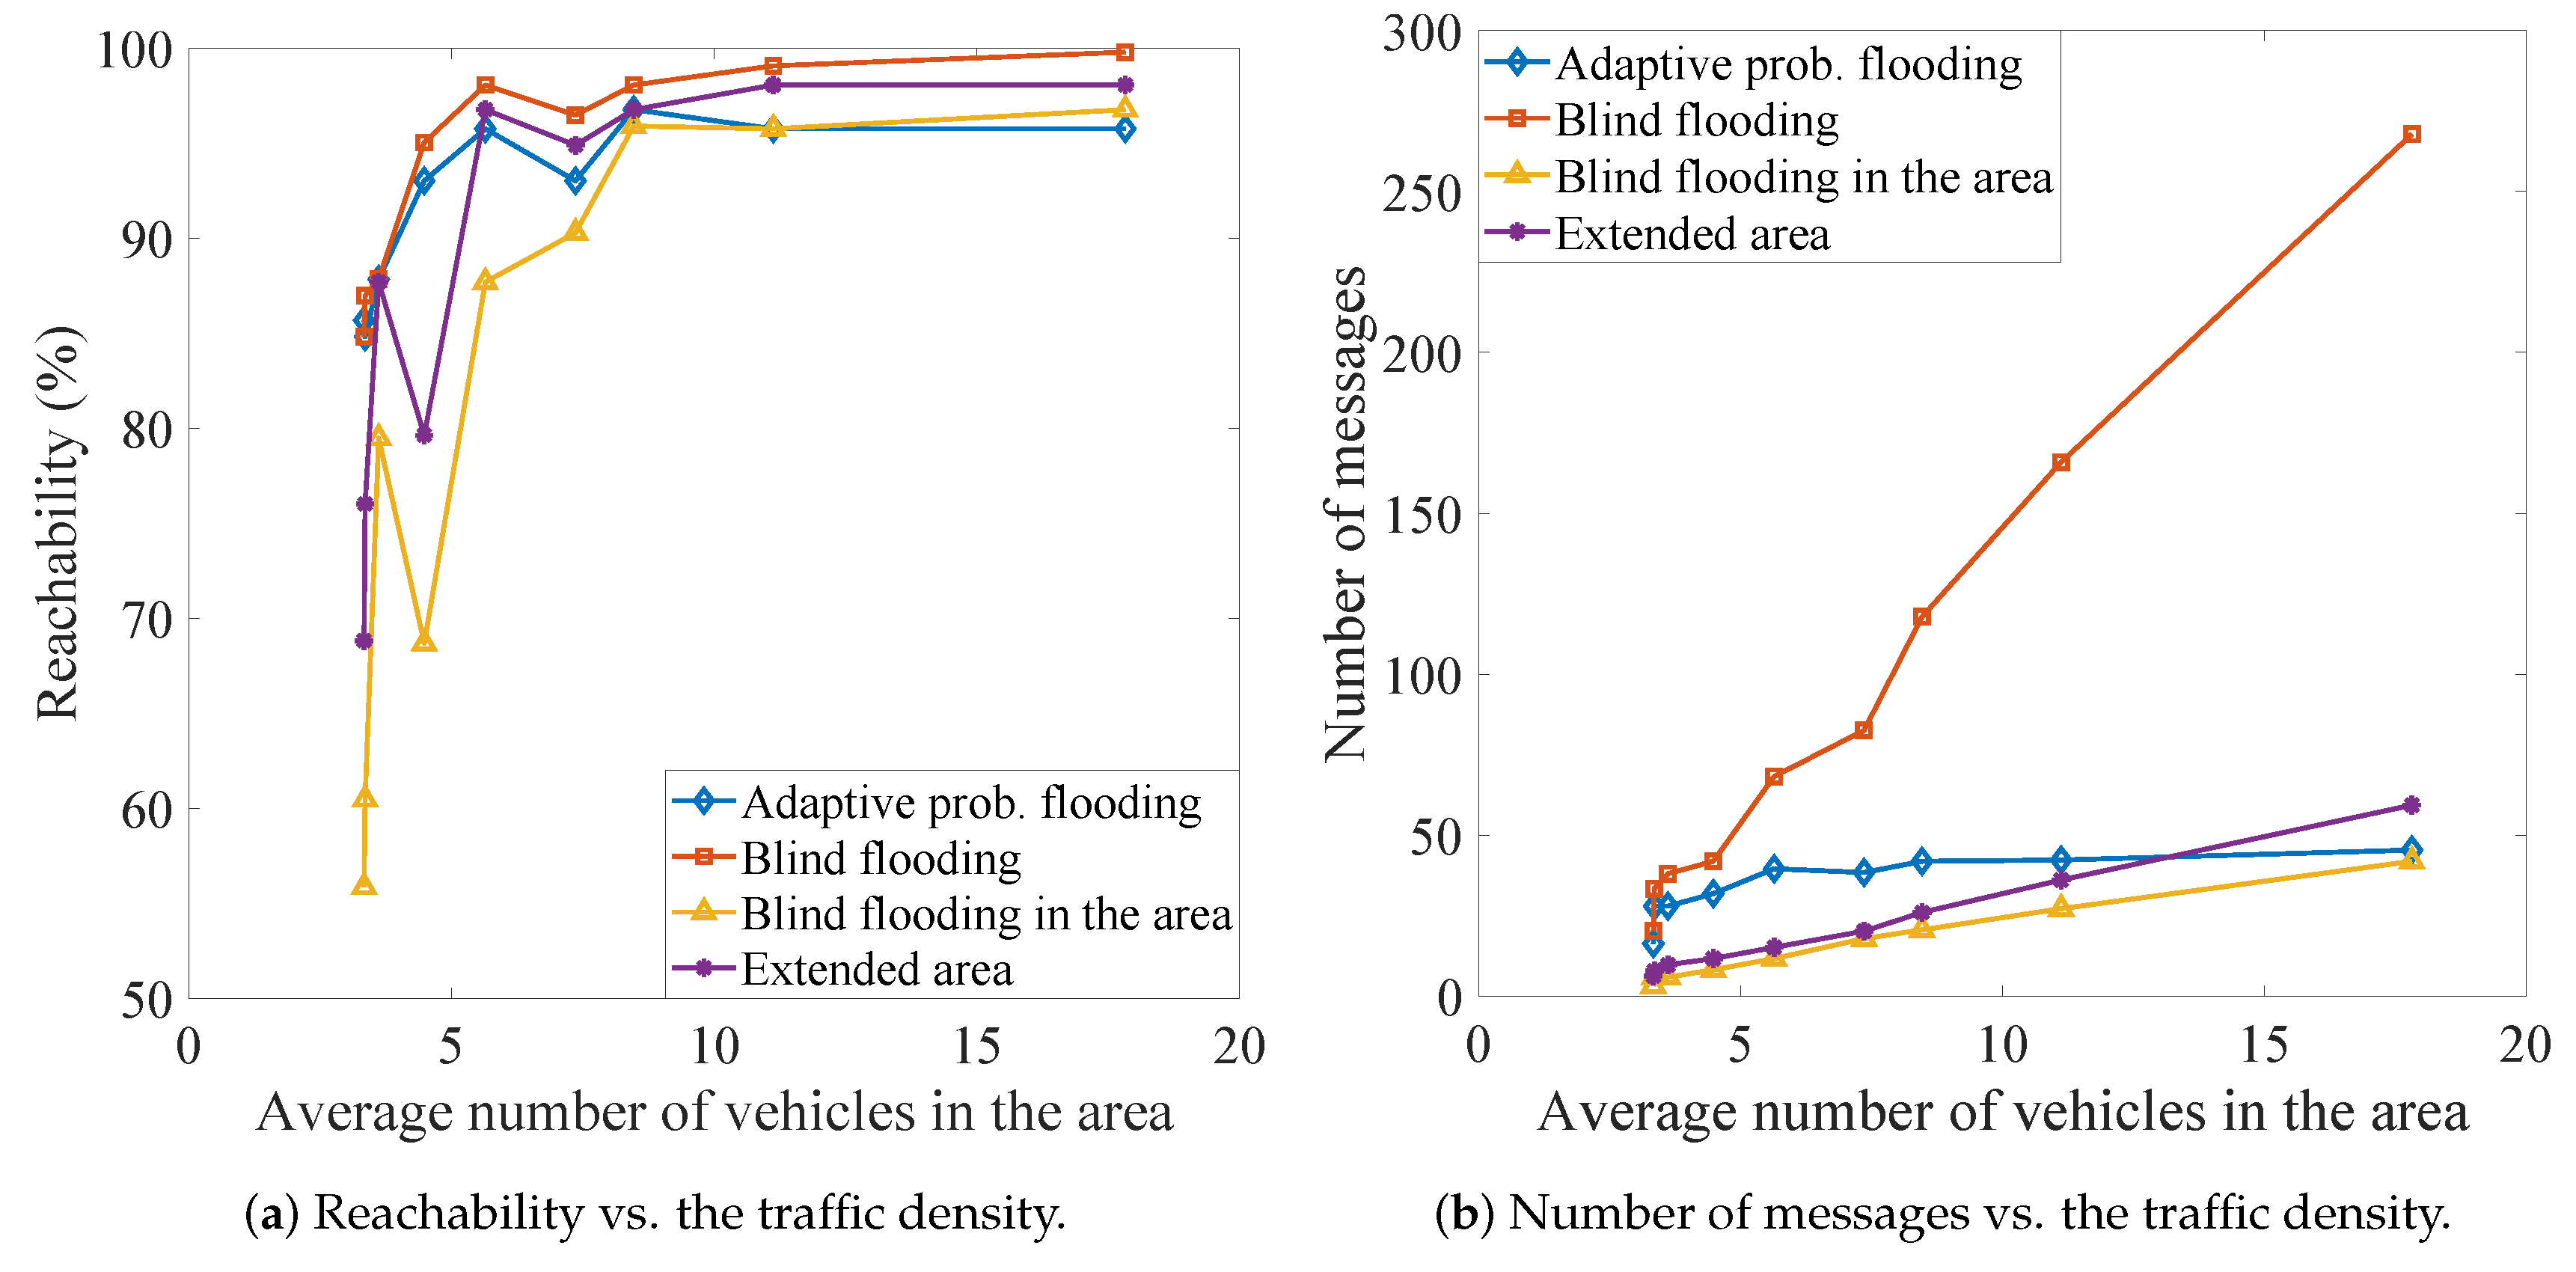
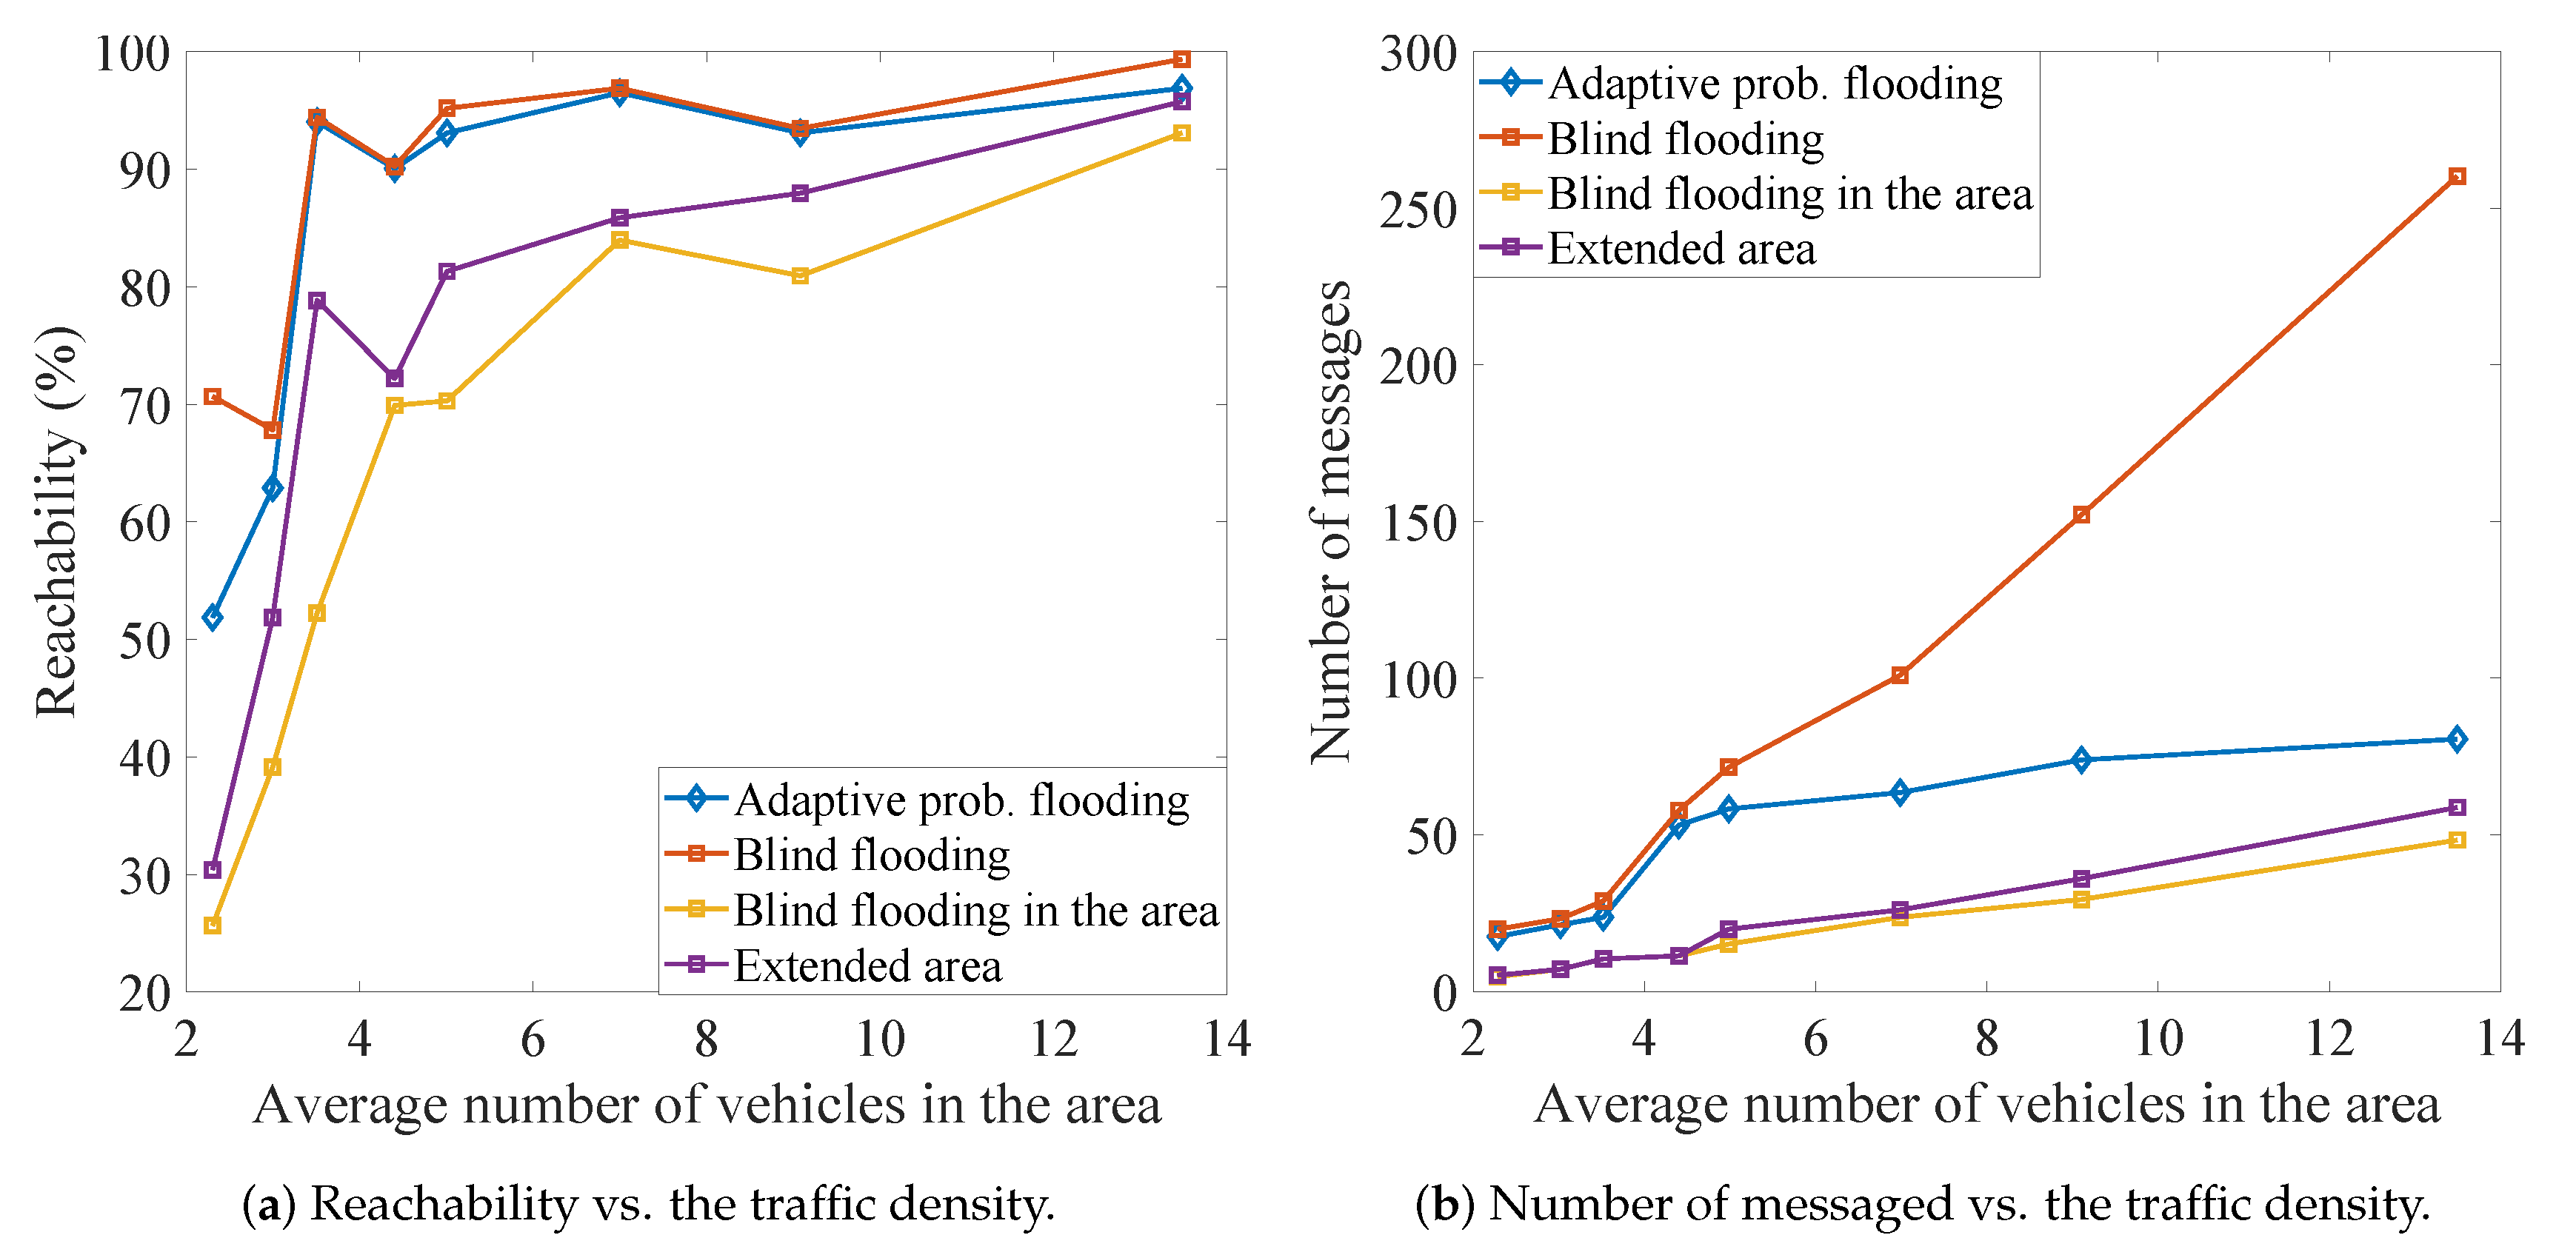
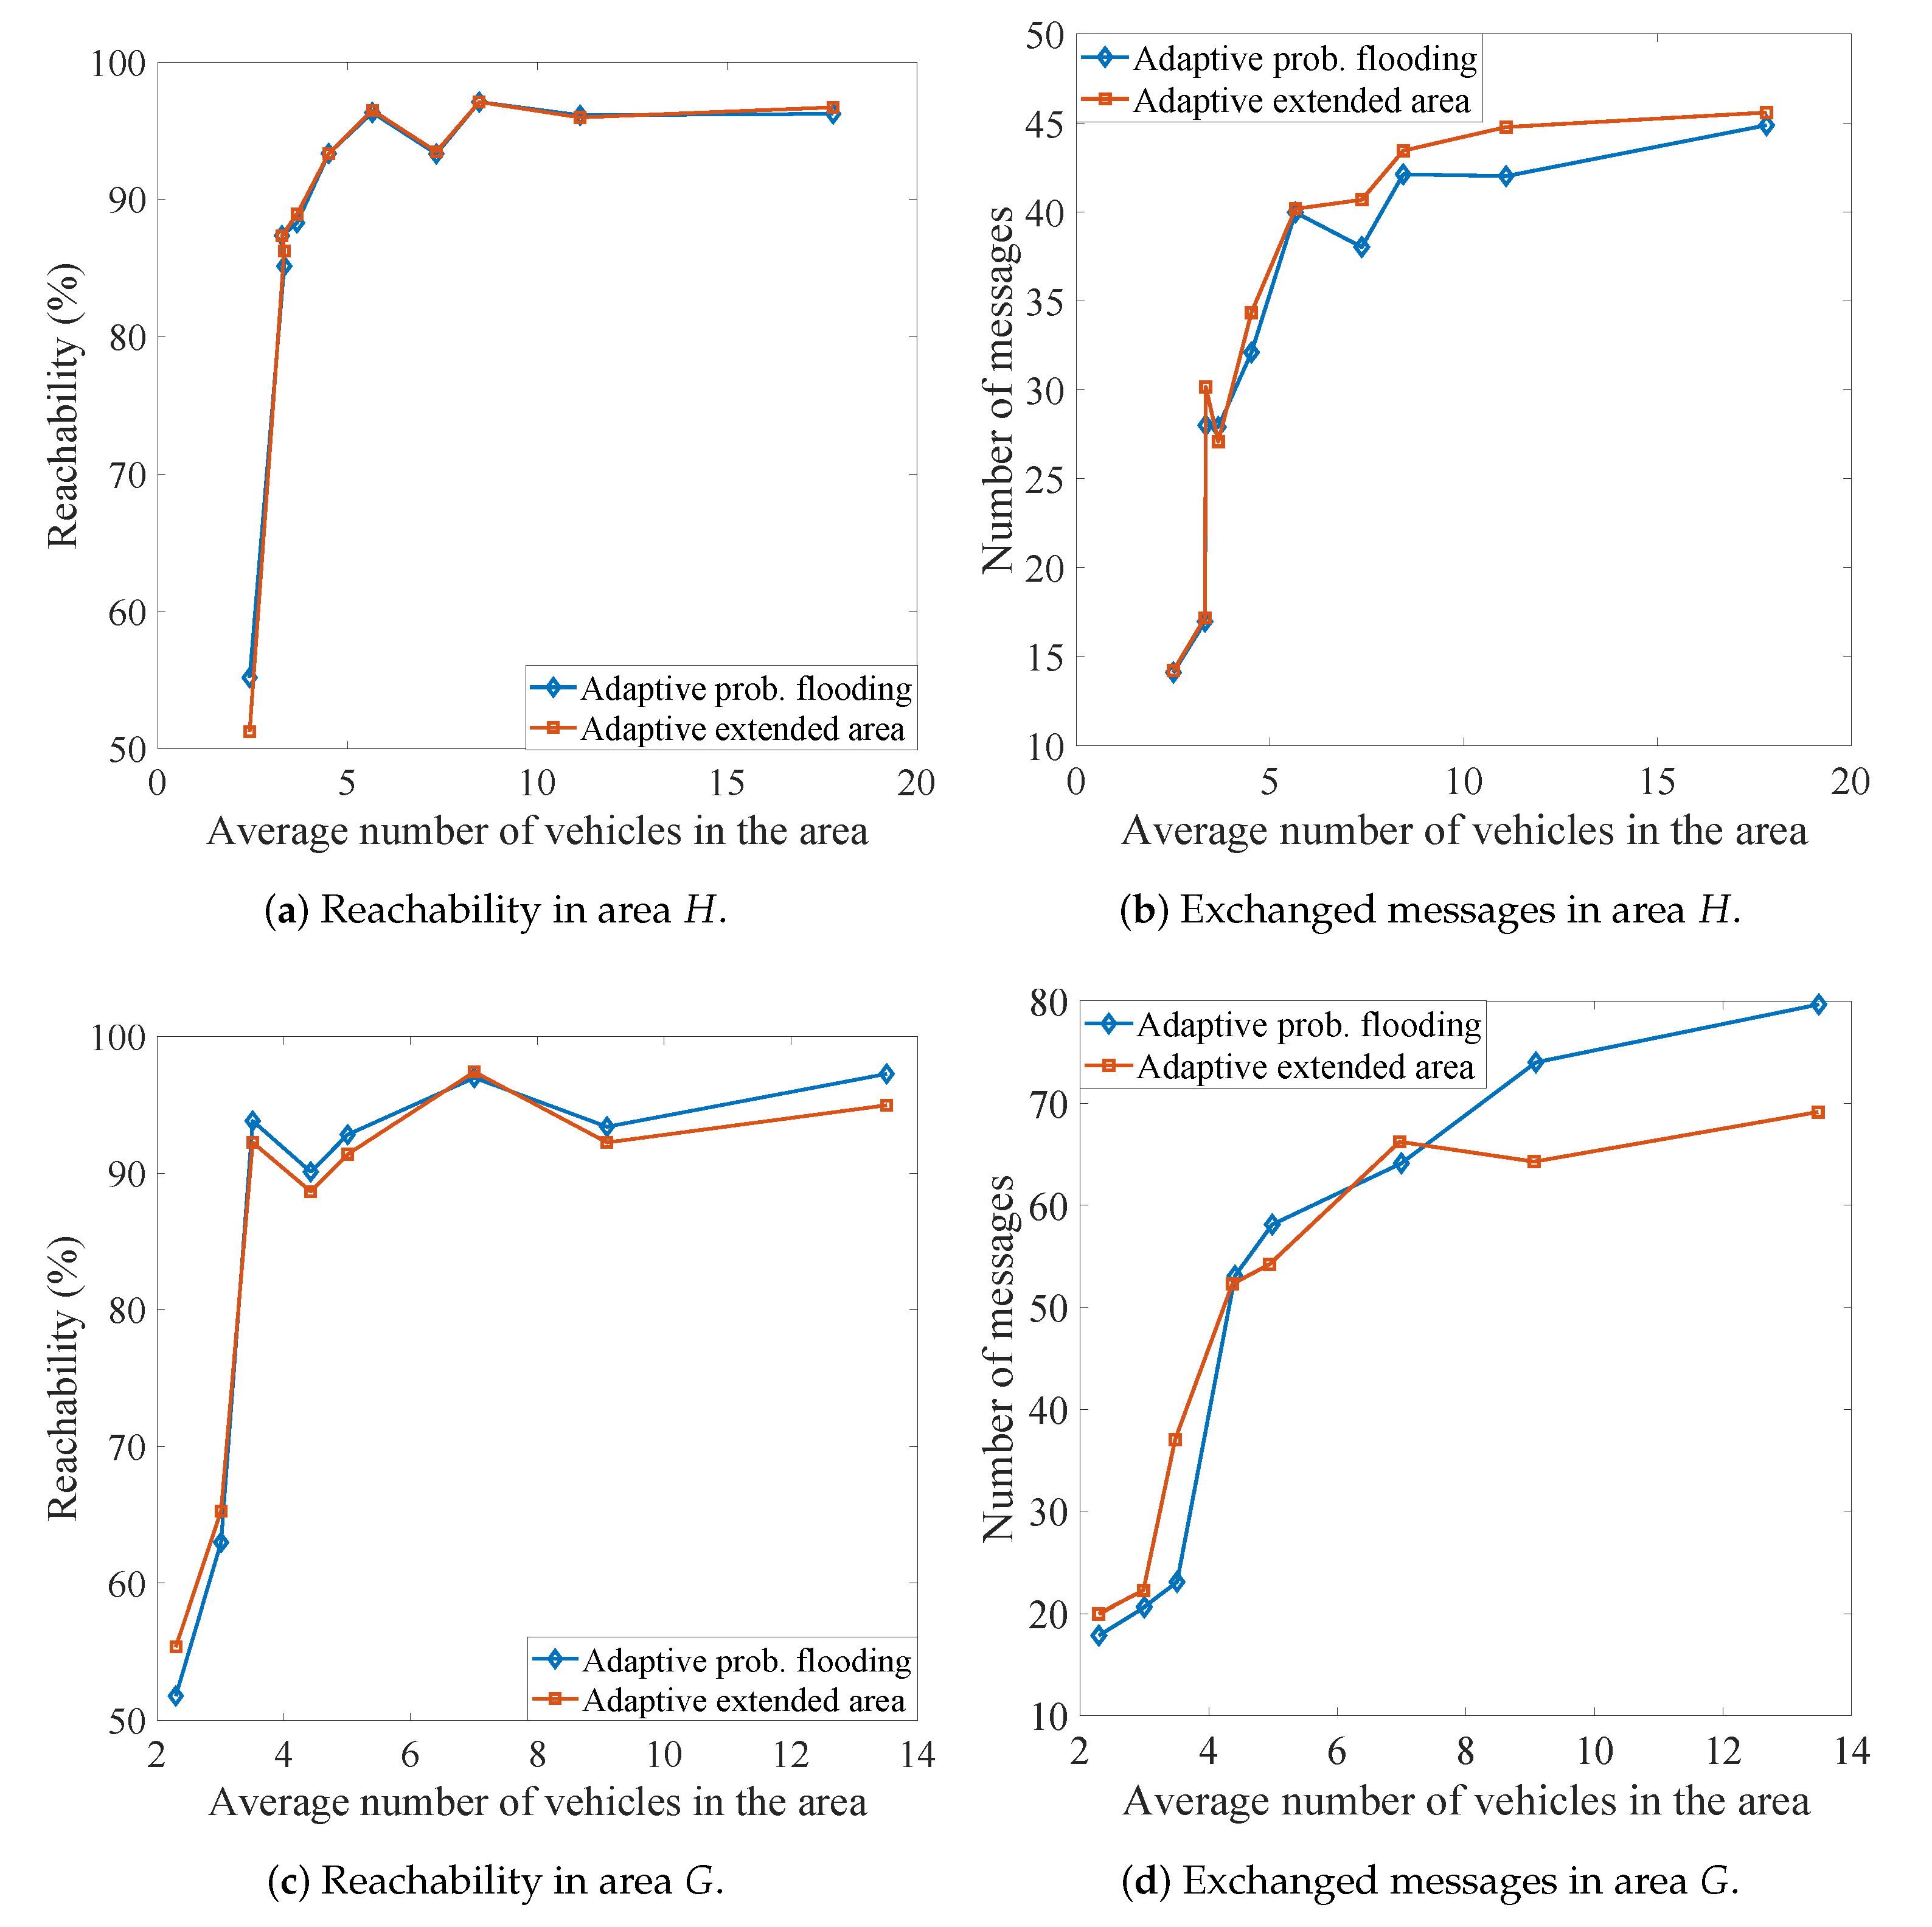
Table 1.
Notation used for Protocol Description.
| p | Rebroadcast Probability |
| : rebroadcast probability function | |
| d | distance from the hovering area |
| r | vehicle transmission range |
| R | radius of the hovering area |
Table 2.
Significant Notation for the Density Estimation Scheme.
| number of vehicles residing in the hovering area | |
| roadway edges | |
| directional roadway link between and | |
| vehicle i | |
| R | radius of the anchor area |
| probability that vehicle i resides in hovering area h | |
| probability that is neighbor of given that the latter is in hovering area h | |
| average number of neighbors | |
| number of neighbors of the jth neighbor |
© 2020 by the authors. Licensee MDPI, Basel, Switzerland. This article is an open access article distributed under the terms and conditions of the Creative Commons Attribution (CC BY) license (http://creativecommons.org/licenses/by/4.0/).
Share and Cite
MDPI and ACS Style
Xeros, A.; Saeed, T.; Lestas, M.; Andreou, M.; Silva, C.M.; Pitsillides, A. Adaptive Probabilistic Flooding for Information Hovering in VANETs. J. Sens. Actuator Netw. 2020, 9, 29. https://doi.org/10.3390/jsan9020029
AMA Style
Xeros A, Saeed T, Lestas M, Andreou M, Silva CM, Pitsillides A. Adaptive Probabilistic Flooding for Information Hovering in VANETs. Journal of Sensor and Actuator Networks. 2020; 9(2):29. https://doi.org/10.3390/jsan9020029
Chicago/Turabian StyleXeros, Andreas, Taqwa Saeed, Marios Lestas, Maria Andreou, Cristiano M. Silva, and Andreas Pitsillides. 2020. "Adaptive Probabilistic Flooding for Information Hovering in VANETs" Journal of Sensor and Actuator Networks 9, no. 2: 29. https://doi.org/10.3390/jsan9020029
Note that from the first issue of 2016, this journal uses article numbers instead of page numbers. See further details here.