
Linking Urban Tree Cover Change and Local History in a Post-Industrial City
by
 and
and
Lara A. Roman
1,*, 
Indigo J. Catton
2,
Eric J. Greenfield
3,
Hamil Pearsall
4,
Theodore S. Eisenman
5 and
Jason G. Henning
1,6 1
Philadelphia Field Station, Northern Research Station, USDA Forest Service 100 N. 20th St., Philadelphia, PA 19103, USA
2
Department of Earth & Environmental Sciences, University of Pennsylvania, 251 Hayden Hall, 240 S. 33rd St., Philadelphia, PA 19104, USA
3
Northern Research Station, USDA Forest Service, 5 Moon Library, SUNY-ESF, 1 Forestry Drive, Syracuse, NY 13210, USA
4
Geography and Urban Studies Department, Temple University, 308 Gladfelter Hall, 1115 W. Berks St., Philadelphia, PA 19122, USA
5
Department of Landscape Architecture and Regional Planning, University of Massachusetts–Amherst, 551 North Pleasant Street, Amherst, MA 01003, USA
6
The Davey Institute, 100 N. 20th St., Philadelphia, PA 19103, USA
*
Author to whom correspondence should be addressed.
Land 2021, 10(4), 403; https://doi.org/10.3390/land10040403
Submission received: 8 March 2021
/
Revised: 26 March 2021
/
Accepted: 29 March 2021
/
Published: 12 April 2021
(This article belongs to the Special Issue Human-Urban Green Space Interactions and Their Integration into Urban and Green Space Planning and Management)
Abstract
:Municipal leaders are pursuing ambitious goals to increase urban tree canopy (UTC), but there is little understanding of the pace and socioecological drivers of UTC change. We analyzed land cover change in Philadelphia, Pennsylvania (United States) from 1970–2010 to examine the impacts of post-industrial processes on UTC. We interpreted land cover classes using aerial imagery and assessed historical context using archival newspapers, agency reports, and local historical scholarship. There was a citywide UTC increase of +4.3 percentage points. Substantial UTC gains occurred in protected open spaces related to both purposeful planting and unintentional forest emergence due to lack of maintenance, with the latter phenomenon well-documented in other cities located in forested biomes. Compared to developed lands, UTC was more persistent in protected open spaces. Some neighborhoods experienced substantial UTC gains, including quasi-suburban areas and depopulated low-income communities; the latter also experienced decreasing building cover. We identified key processes that drove UTC increases, and which imposed legacies on current UTC patterns: urban renewal, urban greening initiatives, quasi-suburban developments, and (dis)investments in parks. Our study demonstrates the socioecological dynamism of intra-city land cover changes at multi-decadal time scales and the crucial role of local historical context in the interpretation of UTC change.
1. Introduction
1.1. Urban Tree Canopy Change
Long-term land cover change assessments are needed to understand the pace and process of urban tree canopy (UTC) gains and losses. UTC refers to the proportion of land covered by trees when viewed from above [1]. The spatial patterns of UTC within cities often correlate with income and race [2,3], population and building density [4,5], and topography [6], with important idiosyncrasies in these generalities related to local sociopolitical history [7]. Legacies of shifting urban form (e.g., change to suburban-style housing) and sociodemographic change (e.g., increasing concentrations of wealth, human population spikes or crashes) also shape UTC spatial patterns [8]. The biome in which a city resides is likewise highly relevant to UTC. For instance, cities in forested biomes can have emergent forests on abandoned lands [9,10], meaning that depopulation, disinvestment, and vacancy can lead to vegetative cover increases [11,12]. The spatiotemporal patterns of UTC within a given city are therefore reflective of complex interactions over time between biophysical and human drivers [8].
UTC goals have become entrenched in urban forest management and planning, particularly in the United States (US) and Canada. Many municipal leaders use UTC assessments to prioritize tree planting in support of their broader urban forestry and sustainability plans [13,14]. For instance, some tree planting and giveaway programs target low-canopy neighborhoods to address concerns around inequitable distribution [13]. Many large cities now have UTC goals [14], exemplified by the aspiration to increase UTC from 23% to 30% in Seattle and ~27% to 40% in Toronto [15,16]. These ambitious goals can only be met if tree planting, natural regeneration, and crown expansion of surviving trees outweigh deaths and removals to result in net UTC gains.
However, UTC declined in the early 2000s in cities and urban areas in the US and around the world, as impervious cover has simultaneously increased [17,18]. Analyses of recent UTC change in individual cities suggest potential reasons for tree loss, including pest outbreaks and development pressure [19,20]. UTC loss can also be more pronounced in low-income areas [21], and UTC gains can be greater in neighborhoods of increasing wealth [22], although relationships between wealth, race, and UTC change vary by context [11,12]. Recent vegetative cover gains have also been observed related to the creation of new neighborhood parks [23]. Yet, the aforementioned studies ([11,17,18,19,20,21,22,23]) spanned about decade or less, and it is critical to recognize that there is a temporal lag between tree planting and the realization of substantial canopy gains [8], because trees take several decades to reach mature size. In relatively short time frames of under a decade, unless there is a catastrophic event leading to massive tree mortality (e.g., fire, storm, pest outbreak, clearcutting for development), most UTC persists, with relatively tiny portions of loss and gain [21]. In other words, multi-decadal time scales are necessary to assess substantial UTC changes and associated drivers.
At temporal scales from several decades to nearly a century, some studies have shown net gains in UTC or tree density related to the conversion of agricultural and other non-forested landscapes to suburban land use [24,25,26]. When land use shifts from agricultural to suburban residential, there can be UTC increases as planted trees mature in subdevelopments [24,25]. However, other studies have shown little net change in tree or forest cover accompanying urbanization and suburbanization over many decades [27,28]. Long-term UTC increases have also occurred due to sustained institutional support for landscape beautification [29]. However, across many decades, there can be considerably different UTC trajectories among neighborhoods within a city [26] and low levels of persistence in forest cover [28]. This reinforces the need for long-term assessments of intra-city UTC to understand varying land cover change processes within cities and to uncover the time-lagged effects of past events.
Interdisciplinary, mixed-methods studies can shed light on the drivers of UTC change [23,29] and human-environment interactions in urban greenspaces more generally [30]. It is critical to incorporate historical information about past land uses and human communities, as human history leaves lasting landscape legacies—not only on urban systems, but also rural forests [31]. Ecologists, geographers, and landscape planners have called for a deeper engagement with history to improve understandings of space and place [8]. Yet, relatively few studies have attempted to link qualitative historical investigations with quantitative urban forest patterns [7,29], although interest in urban forests among historians is growing [32,33,34,35,36]. The wealth of historical data and scholarship in cities is ripe for mining to interpret urban land cover change.
In light of the aforementioned research needs and gaps, we investigated the spatiotemporal dynamics of UTC in Philadelphia, Pennsylvania (US) from 1970–2010, a post-industrial period marked by substantial human population loss. Our objectives were to: (1) assess net land cover change, stability of UTC, and transitions between land cover classes, and (2) interpret the local historical drivers of UTC change.
1.2. Urban Greening in Post-Industrial Cities
Many cities in North America and Western Europe experienced a systematic economic transformation beginning in the mid-20th century, characterized by the relocation of industries into low-wage areas, often beyond city boundaries or into other countries [37,38]. This post-industrialization process, with decentralization and suburbanization [39], led to a dramatic loss of population and deep disinvestment in cities. For instance, Philadelphia’s population peaked at 2 million in 1950, then lost one-quarter of its population by the turn of the 21st century [40]. This population loss, often described as urban shrinkage, had direct and indirect impacts on land use, including underutilization, vacancy, and dedensification [41]. Many other cities across the US and Europe experienced similar post-industrialization processes, including depopulation and urban decay. In the US, these cities include Detroit, Michigan; Cleveland, Ohio; Milwaukee, Wisconsin; Pittsburgh, Pennsylvania, and Holyoke, Massachusetts—generally considered part of America’s rust belt in the midwest and northeast [27,42,43,44]. In Europe, examples of post-industrial cities include Liverpool, England; Leipzig, Germany; and Turin, Italy [41,43].
In the US, urban shrinkage was accompanied by building demolition ushered in by federal, state, and local urban renewal policies and redevelopment programs in the mid-20th century. This included the US Housing Act of 1949, which provided federal funds for so-called “slum clearance”—tearing down buildings deemed blighted and substandard. As Rothstein [45] argued, “slums” and “blight” were euphemisms for black neighborhoods. The removal of dilapidated structures to make way for future redevelopment created extensive vacant land, with some neighborhoods redeveloping but many others never rebuilding [42]. Vacant lots resulting from these policies are today often concentrated in high-minority areas [46]. Furthermore, the shrinking municipal tax base in post-industrial cities reduced funding for public park maintenance, profoundly altering and reducing park use in some neighborhoods [47]. Meanwhile, post-industrial US cities also experienced white migration from urban centers to suburbs due to racial unrest and discriminatory housing policies [45], although some cities captured part of this exodus within their borders, such as Staten Island in New York City, New York [48]. The impacts of post-industrialization on spatiotemporal patterns of land use and land cover were therefore not uniform within a given city, as some neighborhoods experienced widespread demolition and enduring land vacancy, while other neighborhoods experienced development or redevelopment.
Some studies have documented the changes in tree and vegetative cover in post-industrial cities, pointing toward multiple pathways for vegetation growth resulting from shrinkage and land abandonment. For example, areas with more vacant lots in Toledo, Ohio were associated with a proliferation of overgrown vegetation [12]. On the other hand, vacant lots have become sites for community gardens and other intentional urban greening activities [49,50]. However, vegetative cover increase can occur in both shrinking and growing contexts [51]. Recent research has also pointed to legacies from past discriminatory housing practices on present-day UTC. For example, residents of redlined neighborhoods in the US, as determined by the Home Owners’ Loan Corporation (HOLC) in the mid-20th century, were unable to access mortgages, and today, such redlined areas tend to have relatively lower UTC in numerous cities [52]. While the aforementioned studies have examined the trends and correlation between UTC and population change, land vacancy, and redlining in post-industrial cities, there is little understanding of the specific historical policies or initiatives leading to UTC change over time to identify mechanistic drivers of UTC gains or losses. Given the sustainability imperative to green cities to meet environmental, economic, social, and health priorities [53,54], the complex social and ecological determinants of UTC spatiotemporal dynamics, and the dominance of UTC goals in contemporary municipal forestry planning, we examined how UTC changed in post-industrial Philadelphia, focusing on intra-city variation.
We explored four post-industrial processes common to shrinking cities in North America and Europe and their potential connections to UTC change across different urban neighborhoods: (1) urban renewal, (2) urban greening initiatives, (3) the construction of low-density residential developments, and (4) (dis)investments in parks. Urban renewal refers to a variety of policies and programs “that wrought a series of radical interventions on the urban built environment” [55] (p. 339). These interventions were responding to the social, political, and economic challenges of post-industrialization, and often included extensive building demolition in low-income black communities in the 1950s–1960s [42]. Urban renewal impacted UTC not only through the creation of vacant lots, thereby enabling the vegetation overgrowth previously described, but also through greenspace development and intentional tree plantings financed by renewal initiatives to attract people to redeveloped spaces [56,57]. Separately, urban greening initiatives led by community members and non-profit organizations installed community gardens and planted street trees to provide social, cultural, and environmental benefits to depopulated neighborhoods [49]. Urban greening refers to a social practice to conserve, introduce, or maintain vegetation in cities and urban areas [58], and we focus on initiatives led and supported by non-profits. Meanwhile, in low-density residential neighborhoods constructed in the mid-to-late-20th century, tree plantings by developers and homeowners cultivated a green aesthetic in suburban-style areas [8,59]. We call the low-density neighborhoods in Philadelphia quasi-suburban, following Smalarz [60]. While there is no single definition of suburb, and there are many different kinds of suburbs, suburban areas are broadly characterized as low-density residential landscapes located within metropolitan regions but outside the central city [61]. Philadelphia’s outer neighborhoods are quasi-suburban because they are, firstly, within the city’s political boundary and thus subject to city policies and planning, and secondly, because these outer neighborhoods have a mix of urban and suburban characteristics [48,60,62]. Finally, disinvestment in parks, and resulting lack of maintenance budgets, can lead to overgrown, unintentional forest emergence [8,47]. Periods of renewed investment in parks and open spaces can lead to new plantings and UTC gains, or alternatively, UTC declines from management activities such as trail clearance [63]. We use (dis)investment in parks to refer to the varying levels of public and private funding for park management. Our research compared how these different processes impacted UTC across the heterogenous urban landscape.
2. Materials and Methods
2.1. Study Area
Like other post-industrial US cities, Philadelphia experienced depopulation, white flight, and increased land vacancy in the second half of the 20th century [64,65]. Our study period starts in 1970, in the midst of Philadelphia’s post-industrial decline. Once a major manufacturing center, especially textiles, the city lost much of that business beginning in the 1920s, with dramatic loss of manufacturing jobs in the 1950s–1980s. Although some factories relocated within the city limits and service sector jobs rose in the late 20th century, the city still faced challenges from unemployment, poverty, and depopulation [62,64]. With depopulation came declining tax revenues as well as abandoned factories and homes. Through urban renewal policies, tens of thousands of structures were demolished in Philadelphia from the 1950s onwards, primarily in low-income black communities [64].
As of 2010, Philadelphia was the fifth largest city in the US, with 1.5 million people and a plurality black population [40,66]. Philadelphia is the poorest of America’s 10 largest cities (26% poverty rate) and has 40,000 vacant parcels [66,67]. Numerous municipal and non-profit programs exist today that support tree planting and stewardship on public and private lands [13,49,68].
Ecologically, Philadelphia has mesophytic forests [69] and marshes by the rivers. Like the rest of the forests of the northeastern and mid-Atlantic US, the state and the city were deforested during colonization and conversion to agriculture. Some UTC was restored during the late 19th and early 20th century from the urban parks movement and civic beautification efforts [70]. Philadelphia’s total area is 370 km2, of which 12.0% is currently protected open space. Specifically, 10.8% of the city’s area is municipal parks, and the remainder of the protected open space is federal, state, and non-profit parks [71]. A little over half of the municipal parkland is currently considered natural lands [72]. Based on a LiDAR-derived land cover assessment, Philadelphia’s UTC was 21% in 2008, of which one-third was on municipal parklands [73,74]. Municipal leaders set a goal to reach 30% UTC in every neighborhood by 2025 [75]. (Note that UTC in 2008 was previously reported to be 20% [73], but that figure was recently revised to 21% [74] based on a reassessment of the raw data. We used the revised UTC for comparison to aerial photointerpretation.)
2.2. Land Cover Interpretation from Aerial Imagery
2.2.1. Approach and Data Sets
To quantify land cover change, we visually interpreted aerial imagery, a common technique employed by urban forestry researchers [17,18,24,29,76] as well as by landscape ecologists and geographers [77,78]. Due to their long historical reach and widespread availability, aerial photographs represent a unique data source for assessing landscape change [79]. Although modern techniques, such as LiDAR, provide high resolution data with wall-to-wall coverage of a city, such datasets for UTC only emerged in the past ~15 years, and multi-decadal time scales are required to observe substantial UTC change. Additionally, although some authors have argued that aerial interpretation is too prone to errors and inconsistencies [21], for accuracy assessments of LiDAR and other remote sensing methods, visually inspected aerial or satellite imagery is commonly used as the reference information [80]. When using aerial interpretation of randomly distributed points, potential shortcomings include variability among interpreters and a relatively small number of points [21]. The former issue can be minimized by having a single interpreter [24], which was our approach. The latter issue limits inference to the entire city, and not subunits within the city (e.g., 1000 points per city in past studies [17,76]).
We used 10,000 random points. This high number enabled us to conduct discrete analyses of different geographic units within the city (Figure 1). In our analysis of land cover change, we first present citywide results, and then use two main types of geographic units: protected open spaces and developed areas. The protected open space consists of natural and manicured park spaces managed by municipal, state, federal, and non-profit institutions, as defined by a regional planning commission [71]. Separately analyzing these parks and open spaces is critical because, firstly, parks are expressly managed to include copious trees and other vegetation, and secondly, parks constitute a major portion of existing UTC. For the developed areas of the city (i.e., not parks and other open spaces), we further broke the analysis down into 18 districts used by city planners [40,81]. Although the city’s planning districts encompass parks within their borders, our district-level results are presented with the protected open space excluded (e.g., Lower Northwest district results do not include land cover changes for the parks located within that district).
Our analysis spanned 40 years, with imagery from 1970, 1980, 1990, 2000, and 2010 (Table 1). Earlier imagery was not used due to low resolution among older aerials, which made interpreting trees at specific points impractical. We adapted the land cover classification from Nowak and Greenfield [17], classifying each random point into one of the following five cover types: tree/shrub (hereafter, “tree” or UTC), herbaceous (includes grass/turf and agricultural fields), other pervious (includes water and bare soil), building, and other impervious (includes roads, walkways, and parking lots). We were most interested in UTC but included other classes because the changes in these classes and transitions between classes relate to the growth or loss of trees. We used a single interpreter who was trained using a separate set of points from a college campus in Philadelphia [29].
The interpreter followed Nowak and Greenfield [17] to account for parallax and misregistration error. Permanent water (defined as points classified as water in all five images) was excluded, so that our results reflect the proportions out of total land, not total area [17]. Points which were uninterpretable in any year were also discarded from further analysis. After excluding 532 points as permanent water and 777 points as uninterpretable in at least one year, 8691 points remained for land cover change analysis. The number of points within each geographic unit is provided in Table 2.
The percent of uninterpretable points in our study was higher for earlier years (2.7% in 1970, 6.0% in 1980, and 2.7% in 1990), and is comparable to a previous study in Philadelphia [29]. Our percent uninterpretable in 2000 (1.4%) and 2010 (0.1%)—the only years that were orthorectified—were similar to Nowak and Greenfield [17].
2.2.2. Detecting UTC Change
We tested for statistically significant change within each cover class over 40 years with McNemar tests [17], specifically the ‘exact2x2’ package in R [82,83]. However, statistically significant differences do not necessarily translate to meaningful difference [84,85], and uncertainty in landscape assessments should be considered in change analysis [86].
We carried out uncertainty assessments in two ways: (1) comparing 2010 UTC derived from visual interpretations of aerial imagery to 2008 LiDAR, and (2) comparing a subset of points to a second interpreter. Notably, when carrying out aerial image interpretation, trees and shrubs are generally not distinguishable, whereas for LiDAR-derived UTC, a height cut-off is used to distinguish trees from shrubs (an artificial distinction as there is no biological definition of “tree”, [87]). The height cut-off for LiDAR-derived UTC analyses in Philadelphia was 2.4 m. Comparing our 2010 interpretation to 2008 LiDAR [74], we found 93.4% agreement regarding whether a given point was a tree or not. Most of the disagreement (4.3%) was due to the interpreter classifying points as tree/shrub that were not categorized as tree by LiDAR. We suspect that most of these instances were large shrubs or small trees, due to inherent differences in the methodologies.
When we compared a random 5% subsample of points to a second, independent interpreter, we found 91.5% agreement regarding whether a given point was a tree across all years, with better agreement in 2000 and 2010 imagery, 92.9% and 94.9%, respectively, close to other studies of recent imagery [17,76]. The two interpreters’ UTC estimates were close: the average difference across all years was 1.3 percentage points. Considering inherent user variation, and to be cautious in our conclusions, we propose a detectable change threshold as follows:
where is the cover class percent reported by interpreter at time . For our study, and are 1970 and 2010, respectively. Following Equation (1), any 40-year UTC changes larger than 3.2 percentage points are considered detectable change. For other cover classes, 40-year detectable change thresholds are: 4.7 herbaceous, 7.4 other impervious, 1.2 building, and 9.1 other impervious.
2.2.3. Stability and Transitions
Persistence and transitions in land cover classes are critical components of explaining change over time [88]. We defined stable or persistent land cover as points which were classified as the same land cover class in all five images. Our results for a particular land cover class provide the percent stable out of the cover level in 1970. In other words, the “percent stable tree” is the percent of 1970 tree points which remained tree in all images through 2010.
We visualized land cover transitions using Sankey diagrams (created using sankeymatic.com), which illustrate flows among nodes in a network [89]. Our Sankey diagrams depict the proportion of points that changed from one class to another each decade.
2.3. Qualitative Historical Research
To connect UTC change to historical phenomena, we first consulted with city staff from Philadelphia Parks and Recreation (PPR) and non-profit urban greening professionals from the Pennsylvania Horticultural Society (PHS). We then used archival materials from local and regional agencies and newspaper articles. The local experts were broadly asked about potential drivers of UTC change in Philadelphia. They suggested that budget cuts for park management could lead to mowing cessation, and in turn, forest emergence. Suggestions were also given regarding specific tree planting initiatives led by PHS (e.g., Greene Countrie Towne, 10,000 Trees campaign, Tree Tenders) and specific municipal programs (e.g., Neighborhood Transformation Initiative). These issues were investigated further in newspapers. Specifically, we searched newspapers.com [90] with keywords “mowing”, “overgrown”, “Fairmount Park”, “tree planting”, “shade tree”, and the names of the aforementioned specific initiatives and programs. Newspapers were also searched for articles pertaining to the three most recently established large protected open spaces (Schuylkill Center for Environmental Education, John Heinz National Wildlife Refuge at Tinicum, and Benjamin Rush State Park). We also examined municipal park system annual reports during our study period, searching for mentions of major events which could have led to canopy loss or gain, such as invasive pests, restoration projects, and staffing cuts. Other grey literature included city planning reports. Lastly, we drew from a plethora of local historical scholarship on socioeconomic policies and city planning, and distilled information relevant to land cover change.
Our investigations into the historical context of land cover change were focused on the protected open spaces as well as districts that showed the largest changes in UTC over 40 years. Once planning districts with large UTC change were identified, we searched newspaper archives for neighborhood names within those districts, and paired neighborhood keywords with “tree planting”, “shade tree”, and “overgrown”.
3. Results
3.1. Land Cover Change
Across the entire city, UTC change was both statistically significant and beyond our detectable change threshold, increasing by 4.3 percentage points (Table 3). Of all points classified as tree citywide in 1970, 65.0% remained stable through 2010 (i.e., point was classified as tree in all images). Collectively, all developed areas of the city had statistically significant but not detectable change, and these developed areas had 51.9% stable tree. In contrast, for protected open spaces, there was a significant and detectable UTC increase of 12.1 percentage points. UTC was also considerably more persistent in protected open spaces, with 89.3% stable tree. Within protected open space, municipal parks and recreation centers (986 points) had a significant and detectable UTC increase (+10.2 percentage points, p < 0.01). Sankey diagrams for both developed lands and protected open space show that most UTC gains occurred through transitions from herbaceous to tree (Figure 2).
For the planning district analysis, seven districts had both statistically significant and detectable UTC increases over 40 years, and an additional two districts had detectable but not significant increases (Table 4). No district had detectable levels of UTC loss. The highest UTC increases occurred in Lower Far Northeast, Lower North, Lower Northwest, and Lower Southwest, so these districts were selected for historical investigation and further discussion. Lower Far Northeast, Lower Northwest, and Lower Southwest each experienced increased building cover and decreased herbaceous cover over 40 years, with Lower Southwest also having detectable levels of increase in other impervious surfaces. In contrast, the UTC gains in Lower North were accompanied by declining building cover (Table 4, Figure 3).
3.2. Historical Drivers of Land Cover Change
During Philadelphia’s urban renewal period, the redevelopment of older neighborhoods and the construction of new neighborhoods was guided by local agencies, including the Philadelphia City Planning Commission (PCPC), the city’s Redevelopment Authority (RDA), and the quasi-public Philadelphia Industrial Development Corporation (PIDC). Key players included Edmund Bacon, Executive Director of the PCPC from 1949–1970, and William Rafsy, Housing Coordinator and Development Coordinator at the RDA in the 1950s, and Director of the Old Philadelphia Development Corporation in the 1960s. Bacon and the PCPC played a more advisory role, lacking budget and authority to control development in the city, while Rafsky and the RDA more directly oversaw urban renewal policy and programs [91]. The PCPC’s 1960 Comprehensive Plan, along with development plans for specific neighborhoods, expanded the urbanization footprint into previously agricultural lands [60,92]. As major roads and highways were extended, the outlying neighborhoods of Northeast, Northwest, and Southwest Philadelphia were developed in the mid-to-late-20th century. Meanwhile, recognizing the need for job creation as older manufacturing businesses closed or moved, and taking advantage of the undeveloped lands in the outer neighborhoods, the PIDC oversaw the construction of large industrial parks in the Northeast and Southwest in the 1960s [62]. By the start of our study period in 1970, Philadelphia’s land was nearly all urbanized, with some small residential developments constructed in the outer edges of the Northeast and Northwest in the 1970s to early 1980s. The depopulation of some neighborhoods, population surges in others, and differing urban form across the city impacted the trajectory of land cover. Crucially, amid new developments in the city’s outer neighborhoods, several large tracts of land became private, state, and federal parks, with ramifications for UTC gains.
Meanwhile, the city’s post-industrial decline also brought about a period of disinvestment in municipal parks [47,93], which in turn spurred urban greening efforts by local non-profit organizations and foundations. Important urban greening leaders included Ernesta Drinker Ballard, Executive Director at PHS from 1963–1981 [49,94], and Mindy Maslin, founder of the PHS Tree Tenders program in 1993 [68,95]. PHS sponsored tree plantings in the parks and also planted street trees and installed gardens in neighborhoods facing post-industrial challenges. By the end of the study period, in the early 2000s, municipal park managers were reinvesting in long-deferred maintenance and ecological restoration [72].
In the subsections below, we provide brief histories of selected planning districts and parks, highlighting the ways that urban renewal, urban greening initiatives, quasi-suburban developments, and (dis)investment in parks impacted land cover changes, especially UTC.
3.2.1. Lower North: Urban Renewal, Depopulation, Demolition, and Urban Greening
The land cover changes in Lower North are rooted in urban renewal policies, with depopulation and demolished housing in neighborhoods designated as blighted, and subsequent urban greening responses to these challenges. This district’s social and physical landscape altered dramatically in the second half of the 20th century. European Jewish immigrants operated small businesses on neighborhood commercial corridors until the mid-20th century [96], and the black population expanded in this district after World War II [97]. Following the collapse of Philadelphia’s manufacturing economy, North Philadelphia experienced tremendous overall depopulation, especially the departure of white residents. While the city a whole lost approximately one-quarter of its population in the second half of the 20th century, the Lower North district lost over 60% [97,98]. A critical event in the white exodus from North Philadelphia was three nights of rioting in 1964, following conflict between a black resident and police officers [64,96]. Newspaper coverage of the riots reinforced white flight, which was already underway [64].
The depopulation occurred in tandem with a decline in building cover, and this district had the most severe 40-year loss in building cover that we observed (−12.8 percentage points). North Philadelphia had the “dubious distinction” of being the first site selected for “slum clearance” through the federal Housing Act of 1949 [64] (p. 107). The entirety of North Philadelphia was redlined in HOLC maps, and the city’s 1960 Comprehensive Plan called for a mix of “major” and “limited” reconstruction in North Philadelphia [99,100]. Approximately 35,000 housing units—one-third of all housing in the area—were demolished or abandoned between the 1950s–1980s [101]. Much of the demolition surrounded Temple University, whose 1966 master plan called for the campus to double in size [102]. The RDA had intended for the demolition in North Philadelphia to be followed by private investment in new construction, which did not materialize [64]. Despite criticism of urban renewal’s negative impacts, including residential displacement, building demolition in North Philadelphia began anew in the early 2000s, through a mayoral Neighborhood Transformation Initiative that tore down thousands of structures [46]. These population drops and demolitions produced a landscape that is now 13% vacant [97], with many vacant lots existing in between rowhomes, a form of attached housing which stretches for entire city blocks and is common in Philadelphia’s older neighborhoods.
The UTC gains in the Lower North district (+8.0 percentage points) are connected to these drastic neighborhood changes in several ways: non-profit urban greening programs that sought to support under-served communities, tree growth on abandoned land, and campus and RDA tree plantings. The PHS Philadelphia Green program began in 1978 as a consolidation of several initiatives, including street tree planting and converting vacant lots to gardens [49]. PHS targeted neighborhoods facing socioeconomic challenges and collaborated extensively with residents. Neighborhoods that received multiple greening interventions were designated “Greene Countrie Townes”, a phrase that harkens back to the original vision for Philadelphia from its founder, William Penn [49]. Such neighborhoods included Norris Square and Strawberry Mansion in the Lower North district [103,104]. In the ensuing years, PHS continued tree planting as program names and structures evolved, including the Tree Tenders program [68], and the LandCare program for vacant lot greening, with the latter being funded in the early 2000s by the Neighborhood Transformation Initiative [105].
However, not all vegetation growth on vacant lots was intentional, as newspapers reported overgrown and weedy lots throughout North Philadelphia [106]. Trees have even been observed growing through abandoned buildings themselves [107]. Those newspaper accounts, combined with our Sankey diagrams showing building-to-tree transitions (Figure 3), suggest that unintentional tree growth around deteriorating buildings and unmaintained vacant lots likely contributed to some of the canopy increases in North Philadelphia.
Lastly, tree planting on the Temple University campus also contributed to UTC increases in the Lower North district, as campus plans in the 1960s called for landscaped areas with lawns and trees [102]. Urban renewal programs were also directly responsible for tree plantings, as the RDA installed several hundred trees in the East Poplar and Strawberry Mansion neighborhoods of the Lower North district around 1970 [108].
3.2.2. Lower Southwest: Quasi-Suburban and Industrial Development from Urban Renewal
The Lower Southwest district transformed from farms and marshes in the mid-20th century, with sparse housing and few paved roads [109,110], to extensive residential, transportation, and industrial land uses. Today, this district encompasses the Philadelphia International Airport, industrial areas, and residential neighborhoods. The amount of land dedicated to transportation infrastructure has greatly expanded in the late 20th century: in 1977, new terminals and parking garages were added to the airport, and in 1985, train lines connected to the airport and the last part of Interstate 95 (I-95) opened. Facilitated by proximity to the international airport and I-95 [110], the industrial areas of the Lower Southwest were developed by the PIDC in the 1960s [62].
Similar to the Lower North district, the changes in Lower Southwest were set in motion by urban renewal policies. Specifically, the redevelopment of the Eastwick neighborhood has been described as the “largest urban renewal project anywhere in the United States” [109] (p. 570). The renewal plan, released in 1953, called for the relocation of residents from the existing semi-rural community. The new Eastwick was designed as a self-contained city-within-a-city, inspired by the garden city movement [109]. Meanwhile, the city’s 1960 Comprehensive Plan called for “major reconstruction” in Eastwick [99], and prior HOLC maps deemed most of the Lower Southwest district as hazardous [100], although a coalition of residents objected to the depiction of their community as blighted [109]. After almost a decade of public debate and resident uproar, new housing was constructed from the early 1960s through the 1970s [109]. Marsh and agricultural lands were replaced with residential and commercial areas, and trees and lawn were installed [111]. While the new residential community was largely white at first, the demographics shifted over time. Eastwick and the rest of the Lower Southwest planning district are now majority black [109,110].
The story of redevelopment and transportation expansion in this district aligns with our observations of land cover change: the herbaceous cover of a semi-rural area was replaced with quasi-suburban neighborhoods as well as major industrial and transportation areas. We observed increased building cover (+3.6 percentage points) and increased other impervious cover (+19.8 percentage points), with simultaneous decrease in herbaceous cover (−28.3 percentage points). Indeed, this district had the largest gains in other impervious cover (e.g., roads and parking lots) and the largest losses in herbaceous cover (Figure 4). Yet, this district also witnessed an increase in UTC (+7.8 percentage points), which can be explained by the growth of trees planted with new housing. For instance, the Penrose Park subdivision, which opened in 1970, was marketed as “suburban living for South Philadelphians” [112], with townhomes and tree-filled yards [113]. Similar to the Lower North district, the RDA also planted several hundred trees in Eastwick around 1970 [108]. However, unlike the Lower North district, we have not found evidence of tree planting or greening initiatives from non-profit organizations in the Lower Southwest district in the late 20th century, suggesting that canopy growth came primarily from trees planted by private developers and the RDA.
3.2.3. Lower Far Northeast: Constructing Quasi-Suburban Neighborhoods
Similar to the Lower Southwest, the Lower Far Northeast was transformed from a semi-rural to a quasi-suburban landscape in the second half of the 20th century. In the 1950s, the Far Northeast was largely agricultural and contained nearly one-fifth of the city’s land, but only 1.8% of its people [114]. The city’s 1955 Far Northeast Physical Development Plan enabled the population to grow tremendously in the late 20th century [115]. One of the goals of this plan was to retain, within the city limits, some of the white population that was leaving older neighborhoods like North Philadelphia. Residents resettled in the more spacious new housing, and “[in] effect, the northeast allowed Philadelphia to capture part of the suburbanization phenomenon within its boundaries” [101] (p. 217). City rules required municipal employees to reside within the city limits, and these were some of the residents who flocked to the Far Northeast [101,116]. While the overall population of the Far Northeast nearly doubled in the 1950s, there was still some population decline in the late 20th century, with a small uptick in population after 2000, fueled by increasing numbers of immigrants [115].
Neighborhoods of the Lower Far Northeast have curvilinear subdivision layouts guided by the PCPC [60,92]. Bacon’s vision for the Far Northeast was to have self-contained communities, laid out to accommodate existing topography, and preserving above-ground streams [92]. Housing was often still attached, but rather than the rowhouses of older neighborhoods, the new attached houses were typically twins with modest yards and driveways, as well as pockets of detached houses [115]. For example, the Morrell Park development in the 1950s–1960s was marketed as being “not row homes” and having “lawns with shade trees” [117]. The Far Northeast was, until recently, an almost exclusively white area, with white residents constituting 97% of the population in 1980 [118], leading civil rights activist Cecil B. Moore to refer to Northeast Philadelphia as a “white island” [60].
A commuter lifestyle for residents of the Far Northeast was facilitated by several major roads and highways, including the tree-lined Roosevelt Boulevard (US-1), intended as a grand parkway in the early 20th century [70], and Woodhaven Rd (US-63), built in the 1960s, which connects Roosevelt Boulevard to I-95. The Lower Far Northeast also contains several large tracts of transportation, industrial, and commercial land uses, including the Northeast Philadelphia Airport, which opened in 1945, and a large mall which replaced a horse racetrack in 1989 [115]. As with the 1960s-era industrial developments in the Lower Southwest, industrial development surrounding the airport was overseen by the PIDC [62].
The land cover changes we observed align with this history, with a large drop in herbaceous cover (−18.3 percentage points) and gains in building cover (+5.1 percentage points) reflecting the conversion of agricultural lands to residential and commercial land uses. The increase in UTC (+5.4 percentage points) is largely explained by aging, growing trees planted in new residential and commercial landscapes in the 1950s–1980s. Some unintentional forest emergence on vacant private properties was also possible. For instance, a public housing site called Woodhaven Gardens was built in 1971, then abandoned through the 1970s–1980s, when it was described as weedy and overgrown, and later redeveloped into new apartments in the 1990s [119,120]. Although an environmental stewardship organization devoted to tree planting in Northeast Philadelphia launched in 2007 [121], the UTC increases pre-2010 are largely attributable to trees planted by private developers and residents, as well as occasional weedy tree growth on abandoned properties from the slight population decline from 1980–2000 [115].
3.2.4. Lower Northwest: Quasi-Suburban Development, Gentrification, and Community Tree Planting
The Lower Northwest district spans neighborhoods with quite different histories and development patterns. Similar to the Far Northeast neighborhoods, Andorra and Roxborough—the outer portions of the Lower Northwest District—were agricultural until the mid-20th century and were marked for “future development” in the city’s 1960 comprehensive plan [99]. Additionally, like the Far Northeast and Lower Southwest, mid-20th century transportation projects enabled a car-dependent commuter lifestyle, including the 1959 expansion of Henry Avenue, a major thoroughfare, and the construction of a connector between I-76 and US-1 in 1961 [122]. Andorra was explicitly marketed as a suburban-style neighborhood in the 1950s: newspaper advertisements illustrated a detached single-family home with trees and shrubs [123]. The large drop in herbaceous cover (−17.6 percentage points) and increase in UTC (+9.3 percentage points) that we observed in this district aligns with the growth of trees in residential developments that replaced farmland.
Although there was a small net detectable 40-year gain in building cover in the Lower Northwest (+1.6 percentage points), with building cover fluctuating over the decades, the increase was more modest than either the Lower Far Northeast or the Lower Southwest. The temporal trajectory of building cover in the Lower Northwest relates to redevelopment in the neighborhoods that are closer to central Philadelphia: Manayunk and East Falls. Manayunk had been a major manufacturing center, including textile and paper mills. However, the mills started closing during the Great Depression, leading to economic decline in the neighborhood through the 1950s, and many vacant factories [124]. Similar to North Philadelphia, Manayunk was redlined in HOLC maps, but in the city’s 1960 Comprehensive Plan, Manayunk was marked for a mix of “limited reconstruction” and “conservation” [99,100]. In essence, Manayunk was “overlooked during the urban renewal mania of the 1950′s and 60′s that wiped out many other historic urban neighborhoods” [124] (p. 40). In the mid- to late 20th century, as a long period of stagnation gave way to gentrification, abandoned factories and storefronts were converted to art galleries, high-end restaurants, and condominiums. An influx of artists and retail stores in the 1970s kicked off a gradual gentrification that continued through the 1990s, spurred on by municipal and private investments, including tree planting on the major commercial corridor [124].
Meanwhile, the East Falls neighborhood next to Manayunk has a mix of large manors and low-income housing, including a contested public housing site [125,126]. As with North Philadelphia, part of the community response to disinvestment in East Falls has been urban greening, including tree planting with PHS Tree Tenders from the 1990s onwards [95].
Collectively, the UTC gains in the Lower Northwest district seem to reflect tree growth over time in quasi-suburban Andorra and Roxborough combined with commercial and non-profit tree planting in Manayunk and East Falls.
3.2.5. Protected Open Space: Unintentional Forest Emergence, Non-Profit Urban Greening, and Ecological Restoration
Philadelphia’s parks and other protected open spaces experienced larger gains in UTC (+12.1 percentage points) than any individual planning district. These UTC gains are attributable to purposeful tree planting combined with unintentional forest emergence. The relative stability of UTC in the protected open space was also critical for net 40-year gains: of the UTC present on protected open spaces in 1970, nearly 90% persisted through the decades to 2010, contrasted with only about half of the UTC in developed lands persisting (Table 3).
Municipal Parks: Much of the UTC gains occurred within municipal parks (+10.2 percentage points), as these lands constitute most of the city’s open space. Today, large natural area parks, small neighborhood manicured parks, and recreation centers are managed by Philadelphia Parks and Recreation (PPR), which formed from the merger of the Fairmount Park Commission (FPC) and the Bureau of Recreation following a public referendum in 2008 [93]. The FPC wielded tremendous political power in the late 19th and early 20th century through the development of new parks and parkways, with the elite commissioners acting as de facto city planners [70]. However, the semi-autonomous FPC was not directly governed by Philadelphia’s city council, as commissioners were separately appointed by the courts. This peculiar governance arrangement led to conflicts around differing priorities and budgetary expectations with city politicians [93]. The merger with the Bureau of Recreation was done, in part, to “give the city government a greater sense of ownership” of the park system [93] (p. 52), and the merger also ushered in a new era of public-private partnerships to fund long-delayed management activities [127].
This governance history, combined with Philadelphia’s depopulation in its post-industrial period, explains the declining fiscal and personnel support for municipal parks in the late 20th century, and attendant impacts on UTC. Municipal appropriations to the FPC declined from 2.26% of the city’s operating budget in 1960 to 0.71% in 1980 and 0.32% in 2009 [93]. The FPC lost 66% of its employees between 1970 and 2000 [128], and FPC staffing cuts were more severe than other agencies [129]. Budget and personnel cuts limited the FPC’s capacity to carry out routine maintenance. In 1986, a city councilman lamented that the parks were in “a deplorable state of repair” [130] (p. 6B), and in 1989, the FPC stated bluntly that “the fiscal austerity which we faced this year has made it very difficult to provide services and ongoing maintenance that are key to the survival of the Park’s amenities” [131] (p. 1). Grass mowing intervals lengthened to a three-week cycle, tree removal and pruning orders were delayed, and unmaintained buildings were subject to vandalism [130]. After decades of neglect, a few historic buildings in the park system burned down, and park planning efforts in the 1980s were not met with budgetary allocations to restore “the neglected treasure” [132] (p. 21A). Overgrown, unmaintained, weedy vegetation impacted public perceptions and use of the parks. For instance, the rampant overgrown areas, signaling lack of maintenance, combined with reports of crime, led neighbors of Cobbs Creek Park to stop visiting [47]. This history suggests that some of the late 20th century UTC gains in Philadelphia’s municipal parklands resulted from unintentional forest emergence as trees grew in unmaintained areas.
However, some UTC gains in the parks were also likely tied to specific planting initiatives, including thousands of trees and seedlings planted by the FPC before the precipitous personnel cuts began [133], and a “10,000 Trees” campaign, initiated by Ballard at PHS, which planted trees throughout the city’s parks in the 1970s [134]. Municipal landscaping funds in the 1970s and 1980s were few and far between, and planting tended to be funded by private foundations [131]. In 1987, the park executive director said that “we just haven’t planted any new trees in decades” [135] (p. 5D). Notably, there were also some storms which caused tree death, and presumably canopy loss [133,136], but these losses were outweighed by both intentional and unintentional new tree growth.
By the late 1990s and early 2000s, a period of reinvestment in the city’s parks began. There were ecological restoration projects to remove invasive species, connected to a natural lands plan in 1999 [72,127], and new and restored museums and trails opened within the park system [72,137]. These reinvestment activities align with the drop-off in UTC gains in protected open spaces after 2000 (Table 3), as ecological restoration and construction activities typically include some tree removal. Park managers generally expect restoration projects to produce long-term canopy gains after native trees establish, although some restoration sites were explicitly designed as meadow habitat [72].
Other Protected Open Space: Three large parks originated around the start of our study period, and all are within or adjacent to planning districts already discussed: in the Andorra neighborhood of the Lower Northwest district, the 135 ha non-profit Schuylkill Center for Environmental Education (formerly the Schuylkill Valley Nature Center) opened in 1965; in the Lower Southwest district, the 162 ha John Heinz National Wildlife Refuge at Tinicum (formerly the Tinicum National Environmental Center) was created in 1972; and in the Upper Far Northeast district, the 104 ha Benjamin Rush State Park was created in 1975. While each park is managed by a different entity and has a distinct history, the common thread in their origin stories was a concerted effort to protect natural resources in rapidly urbanizing neighborhoods, resulting in the preservation and growth of UTC.
The Schuylkill Center claimed in the 1970s to be the “only nature center located within a city in the United States” [138] (p. 20A). The center originated from donated agricultural fields from an old estate and an endowment from anonymous donors [138,139], and it was intended as a nature preserve and youth educational center. Various state, federal, and private grants contributed to restoration efforts from the 1980s through the early 2000s, including installing native plants in various tree groves and removing invasive species [140]. Figure 5 shows the dramatic increase in tree cover at the Schuylkill Center during our study period.
Meanwhile, the wildlife refuge at Tinicum represents the largest remaining freshwater tidal marsh in Pennsylvania. As “America’s First Urban Refuge,” the area was donated to the City of Philadelphia in 1955, and then protected by US law in 1972 as part of the National Wildlife Refuge System [141]. In the 1960s, local environmental activists, concerned about a proposal to route I-95 through the marsh, drew attention to the ecological value of this land and successfully pushed for the highway to be rerouted [141,142]. Yet, restoration work was not funded until several years later [138,143]. The refuge habitat today includes a woodland area [141].
Benjamin Rush State Park, the only state park in Philadelphia, languished for many years after its creation due to lack of state funding. The park was created on land once used by a state-run psychiatric hospital. In the late 1980s, city planners and neighborhood civic leaders lamented that the land had not actually been used for park purposes, as summarized by a reporter: “Never developed for recreation, its weedy fields are used primarily by summer gardeners and illegal dumpers” [144] (p. 18-NE). In the face of government disinvestment, neighborhood activists stewarded the park in the 1980s and 1990s, including a garden association and a watershed stewardship group [145]. Government funding materialized in the early 2000s to support park clean-up and trail development [146]. The park continues to support gardeners, especially from Northeast Philadelphia’s immigrant communities [147].
Collectively, the histories of these parks indicate tree growth from restoration and stewardship activities over many decades, with potentially some forest emergence from lack of maintenance at Benjamin Rush. The Schuylkill Center has been managed since its inception as a forested natural area, while the wildlife refuge at Tinicum is mainly marsh with some wooded areas, and the state park is a mix of forest habitat, gardens, and lawn recreation areas. These management uses are reflected in 2008 LiDAR-derived UTC levels: 74.7% in the Schuylkill Center, 27.1% in the wildlife refuge at Tinicum, and 34.3% at Benjamin Rush [74].
4. Discussion
Our study contributes to the literatures on UTC spatiotemporal patterns and vegetation change in post-industrial cities by uncovering the heterogeneous and interconnected processes of UTC change within a city. Broadly speaking, our findings concur with previous research indicating that UTC gains result from the conversion of agricultural lands to low-density residential developments [24], forest emergence on abandoned and/or unmaintained lands [8,10], and concerted efforts to plant trees and create new parks [23,29]. Our mixed-methods investigation yielded nuanced insights into the varied processes at play in different neighborhoods and parks, and the ways in which these processes intersect. Philadelphia’s UTC gains from 1970–2010 are related to the city’s post-industrial transition, yet each part of the city has its own story, with deeply entangled impacts of urban planning policies, land use shifts, sociodemographic changes, and greenspace governance. We conclude that UTC gains arose from civic, public, and private planting efforts, as well as unintentional forest emergence. Furthermore, UTC increases were driven by a complex interplay amongst urban renewal, burgeoning urban greening initiatives, construction of quasi-suburban developments, and (dis)investments in parks.
Our in-depth historical investigation sheds light on the different actors who were involved in each process, including the municipal redevelopment authority, the city planning agency, the public parks department, real estate developers, urban greening non-profits, and residents (Table 5). Just as the leaders of the urban parks and civic beautification movements of the late 19th and early 20th century left lasting legacies in terms of species composition and UTC spatial distribution [8], so too have the urban greening initiatives of the late 20th century produced legacy effects on UTC. Community tree planting initiatives emerged in other US cities from the 1970s onwards [35,36,148], suggesting that other places may have experienced similar UTC increases as legacies from late 20th century local environmentalism and civic stewardship. With dwindling funding and personnel, the FPC was unable to directly spearhead major planting efforts in the late 20th century, but this important actor did coordinate with non-profit partners and private foundation sponsors.
There were also inherent interactions between urban greening initiatives and urban renewal: building demolition from urban renewal policies produced ubiquitous vacant lots, which then became sites of tree planting and gardening from the 1970s onwards. Tree planting and greenspace creation was carried out not only by non-profit actors like PHS, but also by the municipal redevelopment authority and private real estate developers. Although there is growing appreciation for the role of private developers in structuring urban forests [20,149], and for the association between historical redlining and UTC patterns [52,150], the connection between urban renewal and UTC spatiotemporal trends is not well understood, although there was one past study on urban renewal and tree planting in Baltimore [56]. Other planning districts that we did not investigate in-depth share broad similarities to the Lower North: the North, River Wards, West, and University Southwest districts show declining building cover and/or increasing UTC (Table 4), which reflect the impacts of urban renewal and urban greening initiatives [29]. Furthermore, our findings reveal that the influence of redevelopment on the urban forest was not limited to urban renewal projects of the 1950s–1970s, as Philadelphia’s mayoral initiative to tear down abandoned buildings in the early 2000s also sponsored a vacant lot greening program. The construction associated with redevelopment may also explain the drop-off in UTC in some planning districts between 2000–2010, as Philadelphia’s population grew and some neighborhoods densified and/or gentrified [40,151]. Along similar lines, research from Toronto associated declining UTC with tree removals during housing renovation [20]. Further research is needed to understand the multifaceted roles of urban renewal, redevelopment, and housing construction on urban forest structure in this and other cities.
Crucially, the land cover transitions within each planning district did not occur in isolation, but rather, were linked to other parts of the city in terms of planning policies and demographic shifts. Indeed, urban historians have noted the linkages between suburbanization and urban renewal [55], and urban planning scholars have observed connections between intra-city sociodemographic trajectories and public greenspace provisioning [150]. In Philadelphia, the increasing building cover and UTC on quasi-suburban developments of the Lower Far Northeast and Lower Southwest were socially and politically connected to the depopulation, declining building cover, and overgrown vacant lots in districts like the Lower North. Importantly, Philadelphia planners sought to construct a suburban aesthetic within the city’s borders and required municipal staff to live in the city [101,116]. Real estate developers marketed the more spacious (though still often attached) housing of Far Northeast Philadelphia in contrast to rowhomes lacking lawns, and this distinction in urban form across neighborhoods has lasting legacies on existing and potential UTC [5,73]. The industrial lands in the Lower Far Northeast and Lower Southwest were also deeply tied to the older neighborhoods, in that 1960s industrial areas were developed to help compensate for manufacturing job loss [62]. Had different policy and planning decisions been made, such as reducing the geographic footprint of industrial lands, there may have been even larger UTC increases in those districts from more extensive residential or recreational land uses.
The fact that both white, middle class, quasi-suburban as well as black, working class, rowhome neighborhoods experienced increasing UTC during our study period may seem to contradict past research showing negative associations between UTC and low-income, high-minority, or high building density areas [8]. UTC more than tripled in the Lower North district, a greater relative increase than the doubling of UTC on an elite urban college campus in the same time period [29]. This indicates that substantial UTC gains are possible in areas of varying urban forms, land uses, and socioeconomic status. However, what may appear at first glance to be a contradiction is actually a distinction between patterns and process. Whereas past studies largely investigated sociodemographic correlations with UTC at a single point in time [2,3], our study elucidated the drivers of change over time. For instance, in each decade of our study, the Lower North district had lower UTC than the Lower Far Northeast, a pattern aligning with the correlations between wealth, race, and UTC reported in past research [2,3]. However, even though maximum UTC is limited in the Lower North district and other areas with high-density rowhomes due to limited plantable space [13,73], this district nonetheless had tremendous gains over 40 years (+8.0 percentage points, 335% relative increase), much larger increases than the Lower Far Northeast (+5.4 percentage points, 143% relative increase). This has important implications for UTC research, as the statistical analyses of UTC spatial patterns at one moment in time miss the processes that differentiate and connect UTC changes across neighborhoods.
The parks and other protected open spaces in Philadelphia played an outsized role in citywide UTC change because these open spaces constitute 12% of the city’s area. With most of that open space formerly managed by the FPC during decades of declining budgets, there was reduced capacity for basic maintenance such as mowing, and this led to unintentional forest emergence. Yet, intentional UTC gains were also evident, with plantings sponsored by foundations and non-profits to compensate for dwindling FPC resources. While the passage of time makes it impractical for us to quantify what portion of UTC gains were due to intentional plantings vs. unintentional forest emergence, it is apparent from newspaper coverage and internal park reports that not all UTC gains were intentional. The creation of new non-profit, state, and federal protected open spaces in the 1960s–1970s were also important for UTC gains in Philadelphia, aligning with findings from New York City that new park spaces explain vegetative cover increases [23]. Crucially, UTC was exceptionally stable in protected open spaces, with the vast majority of UTC present in 1970 enduring through 2010. Preserving and expanding UTC in parks and open spaces is therefore vital to achieving net UTC gains citywide, but any such efforts have to reconcile the range of uses, goals, and preferences for park design and planning [29,72].
Notably, Philadelphia’s new large parks established in the 1960s–1970s were in outer neighborhoods that were predominantly white at that time, even as the Lower Southwest and Lower Far Northeast have become more racially diverse today. These parks have a permanence that other forms of greenspace do not. For instance, tree planting and greenspace creation in the older, often non-white neighborhoods with dense attached housing relies on a myriad of interventions such as greening vacant lots, installing community gardens, and planting street trees. Each individual intervention has a relatively small spatial footprint, and such spaces lack the protections of formally preserved open space [50,152]. New policy approaches such as land banks and investments in street tree maintenance may help to stabilize these smaller greenspaces and the UTC that accompanies them in older, dense neighborhoods [152,153].
As renewed municipal park investments materialized after 2000, UTC in the protected open spaces stopped increasing, which we attribute to tree removals from activities such as ecological restoration projects and trail maintenance. In other words, a period of declining park budgets resulted in UTC increase whereas rising budgets appear to have halted that increase. While this may seem counterintuitive, it reflects the ecological realities of tree growth on unmaintained urban landscapes in forested regions [8,10]. Furthermore, municipal park managers working in the early 21st century were prioritizing forest health, wildlife habitat, and recreational opportunities [70], not UTC per se. While overgrown vegetation in unmowed areas produces UTC gains, such emergent forest patches tend to have more non-native species [10] and can be unattractive to park visitors by signaling lack of care and maintenance [47]. This suggests a need for nuanced UTC goals and tradeoffs assessments in light of other ecological and social priorities [13]. For instance, trail clearance and maintenance reduce UTC and contribute to habitat fragmentation [63] but increase recreational accessibility. Park management projects that address recreation or ecological restoration objectives can have substantial impacts on UTC, but are not necessarily initiated with the intent to maximize UTC levels.
While we have identified key processes explaining UTC increases in post-industrial Philadelphia, we must also note processes related to declining UTC that were largely absent during our study period. For example, invasive pests and pathogens can be responsible for major UTC losses, such as the loss of UTC from Ophistoma spp. (Dutch elm disease) in New England cities in the mid-20th century [32] or tree losses in the early 2000s following the Anoplophora grabripennis (Asian longhorned beetle) outbreak in central Massachusetts [19]. Philadelphia did experience Ulmus americana losses starting in the 1940s [154], before our study period, but likely not as severe as other cities where this species was more popular [8]. Additionally, Agrilus planipennis (emerald ash borer), which threatens Fraxinus spp. (ash) in Philadelphia’s parks, arrived in the city in 2016 [155], after our study period. In other words, the net UTC increases we observed were made possible, in part, by the absence of catastrophic tree mortality events from 1970–2010. There have also been major tree planting initiatives by PPR and PHS in the early 21st century [13,68] whose UTC impacts may be more substantially observed in the years ahead, as trees mature and crowns expand.
5. Conclusions
Our mixed-methods, interdisciplinary approach yielded insights into neighborhood-specific change processes that would not have been possible from more siloed studies that employed only quantitative or qualitative methods. We documented multiple pathways for UTC increases, with intertwined social, political, and ecological drivers. Furthermore, we showed that substantial UTC increases can and do occur in various kinds of neighborhoods and parks, and that land cover change dynamics are linked across areas within a city. We identified key actors impacting multi-decadal UTC change in a post-industrial city, and we suggest that similar actors may influence UTC temporal dynamics in other cities. More interdisciplinary and transdisciplinary studies are needed to understand land cover change processes in additional cities to determine whether there are other drivers of change in cities with different ecological, socioeconomic, or political contexts. Future UTC change research should take advantage of historical aerial imagery as well as the copious archival materials available in cities. As more recent, post-2000 high-spatial resolution UTC change data become available, it may also be possible to classify mechanisms of change for specific parcels and neighborhoods using recent program records or key informant interviews, which could enable differentiation of intentional vs. unintentional UTC gains.
Author Contributions
Conceptualization, L.A.R. and J.G.H.; methodology, L.A.R. and E.J.G.; land cover interpretation and analysis, I.J.C., E.J.G. and L.A.R.; land cover data curation, I.J.C. and L.A.R.; historical data collection and analysis, L.A.R.; writing—original draft preparation, L.A.R.; writing—review and editing, H.P., T.S.E., I.J.C., E.J.G. and J.G.H.; funding acquisition, L.A.R. All authors have read and agreed to the published version of the manuscript.
Funding
This research was supported by a cooperative agreement between the USDA Forest Service Philadelphia Field Station and the University of Pennsylvania, 14-JV-11242308. This work also benefited from support from the National Socio-Environmental Synthesis Center (SESYNC) under funding received from the National Science Foundation DBI-1052875, which hosted a workshop “Growing the Urban Forest: Revealing the Processes that Shape Urban Canopy” in February 2016.
Data Availability Statement
Land cover data generated for this study is available at the USDA Forest Service Research Data Archive at https://doi.org/10.2737/RDS-2021-0033 (accessed on 9 April 2021) (published April 2021).
Acknowledgments
We thank G McNichols from the Delaware Valley Regional Planning Commission for providing aerial imagery, J Fristensky for assistance with photo-interpretation training, K Heinlen for help with data processing, S Nix for assistance with park archival reports, and A Plante for supporting I Catton as a student researcher. We are deeply appreciative of local urban forestry colleagues for their insights into the processes of UTC change: L Hayes, T Witmer, C Helm, E Smith Fichman, M Maslin, G Abrams, and S Goin. We thank J Rogan, M Healy, and D Locke for comments on an earlier version of the manuscript. The findings and conclusions in this publication are those of the authors and should not be construed to represent any official USDA or US Government determination or policy.
Conflicts of Interest
Researchers from the funding agency (USDA Forest Service) co-designed and coauthored the study.
References
- Raciti, S. Urban Tree Canopy Goal Setting: A Guide for Chesapeake Bay Communities. Prepared for the USDA Forest Service Northeastern Area. Available online: https://www.chesapeakebay.net/documents/UTC_Guide_Final.pdf (accessed on 8 March 2021).
- Gerrish, E.; Watkins, S.L. The relationship between urban forests and income: A meta-analysis. Landsc. Urban Plan. 2018, 170, 293–308. [Google Scholar] [CrossRef]
- Watkins, S.L.; Gerrish, E. The relationship between urban forests and race: A meta-analysis. J. Environ. Manag. 2018, 209, 152–168. [Google Scholar] [CrossRef] [Green Version]
- Troy, A.R.; Grove, J.M.; O’Neil-Dunne, J.P.M.; Pickett, S.T.A.; Cadenasso, M.L. Predicting opportunities for greening and patterns of vegetation on private urban lands. Environ. Manag. 2007, 40, 394–412. [Google Scholar] [CrossRef] [PubMed]
- Pham, T.; Apparicio, P.; Landry, S.; Lewnard, J. Disentangling the effects of urban form and socio-demographic context on street tree cover: A multi-level analysis from Montréal. Landsc. Urban Plan. 2017, 157, 422–433. [Google Scholar] [CrossRef] [Green Version]
- Davies, R.G.; Barbosa, O.; Fuller, R.A.; Tratalos, J.; Burke, N.; Lewis, D.; Warren, P.H.; Gaston, K.J. City-wide relationships between green spaces, urban land use and topography. Urban Ecosyst. 2008, 11, 269–287. [Google Scholar] [CrossRef]
- Grove, J.M.; Ogden, L.A.; Pickett, S.T.A.; Boone, C.G.; Buckley, G.I.; Locke, D.H.; Lord, C.; Hall, B. The legacy effect: Understanding how segregation and environmental injustice unfold over time in Baltimore. Ann. Am. Assoc. Geogr. 2018, 108, 424–537. [Google Scholar] [CrossRef]
- Roman, L.A.; Pearsall, H.; Eisenman, T.S.; Conway, T.M.; Fahey, R.T.; Landry, S.; Vogt, J.; van Doorn, N.S.; Grove, J.M.; Locke, D.H.; et al. Human and biophysical legacies shape contemporary urban forests: A literature synthesis. Urban For. Urban Green 2018, 31, 157–168. [Google Scholar] [CrossRef]
- Zipperer, W.C.; Sisinni, S.M.; Pouyat, R.V.; Foresman, T.W. Urban tree cover: An ecological perspective. Urban Ecosyst. 1997, 1, 229–246. [Google Scholar] [CrossRef]
- Zipperer, W.C. Species composition and structure of regenerated and remnant forest patches within an urban landscape. Urban Ecosyst. 2002, 6, 271–290. [Google Scholar] [CrossRef]
- Lewis, J.A.; Zipperer, W.C.; Ernston, H.; Bernik, B.; Hazen, R.; Elmqvist, T.; Blum, M.J. Socioecological disparities in New Orleans following Hurricane Katrina. Ecosphere 2017, 8, e01922. [Google Scholar] [CrossRef] [Green Version]
- Berland, A.; Locke, D.H.; Herrmann, D.L.; Schwarz, K. Beauty or blight? Abundant vegetation in the presence of disinvestment across residential parcels and neighborhoods in Toledo, OH. Front. Ecol. Evol. 2020, 8, 566759. [Google Scholar] [CrossRef]
- Nguyen, V.D.; Roman, L.A.; Locke, D.H.; Mincey, S.K.; Sanders, J.R.; Fichman, E.S.; Duran-Mitchell, M.; Tobing, S.L. Branching out to residential lands: Missions and strategies of give tree distribution programs in the US. Urban For. Urban Green 2017, 22, 24–35. [Google Scholar] [CrossRef]
- Hauer, R.J.; Peterson, W.D. Municipal Tree Care and Management in the United States: A 2014 Urban and Community Forestry Census of Tree Activities, Special Publication 16-College of Natural Resources, University of Wisconsin—Stevens Point. Available online: https://www.uwsp.edu/cnr/Pages/Forestry---MTCUS.aspx (accessed on 8 March 2021).
- City of Seattle. Urban Forest Stewardship Plan. Seattle Urban Forestry Commission. Available online: https://www.seattle.gov/Documents/Departments/Trees/Mangement/2013_Urban_Forest_Stewardship_Plan.pdf (accessed on 8 March 2021).
- City of Toronto. Sustaining and Expanding the Urban Forest: Toronto’s Strategic Forest Management Plan. City of Toronto, Parks, Forestry and Recreation, Urban Forestry. Available online: https://www.toronto.ca/data/parks/pdf/trees/sustaining-expanding-urban-forest-management-plan.pdf (accessed on 8 March 2021).
- Nowak, D.J.; Greenfield, E.J. Tree and impervious cover change in U.S. cities. Urban For. Urban Green 2012, 11, 21–30. [Google Scholar] [CrossRef] [Green Version]
- Nowak, D.J.; Greenfield, E.J. The increase of impervious cover and decrease of tree cover within urban areas globally (2012–2017). Urban For. Urban Green 2020, 49, 126638. [Google Scholar] [CrossRef]
- Hostetler, A.E.; Rogan, J.; Martin, D.; Delauer, V.; O’Neil-Dunne, J. Characterizing tree canopy loss using multi-source GIS data in Central Massachusetts, USA. Remote Sens. Lett. 2013, 4, 1137–1146. [Google Scholar] [CrossRef]
- Steenberg, J.W.N.; Robinson, P.J.; Duiker, P.N. A spatio-temporal analysis of the relationship between housing renovation, socioeconomic status, and urban forest systems. Environ. Plan. B Urban Anal. City Sci. 2018, 46, 1115–1131. [Google Scholar] [CrossRef]
- Locke, D.H.; Romolini, M.; Galvin, M.; O’Neil-Dunne, J.P.M.; Strauss, E.G. Tree canopy change in coastal Los Angeles, 2009–2014. Cities Environ. 2017, 10, 3. [Google Scholar]
- Chuang, W.; Boone, C.G.; Locke, D.H.; Grove, J.M.; Whitmer, A.; Buckley, G.; Zhang, S. Tree canopy change and neighborhood stability: A comparative analysis of Washington, D.C. and Baltimore, MD. Urban For. Urban Green 2017, 27, 363–372. [Google Scholar] [CrossRef]
- Locke, D.H.; King, K.K.; Svendsen, E.S.; Campbell, L.K.; Small, C.; Sonti, N.F.; Fisher, D.R.; Lu, J.W. Urban environmental stewardship and changes in vegetative cover and building footprint in New York City neighborhoods (2000–2010). J. Environ. Stud. Sci. 2014, 4, 250–262. [Google Scholar] [CrossRef]
- Berland, A. Long-term urbanization effects on tree canopy cover along an urban-rural gradient. Urban Ecosyst. 2012, 15, 721–738. [Google Scholar] [CrossRef]
- Bonney, M.T.; He, Y. Attributing drivers to spatio-temporal changes in tree density across a suburbanizing landscape since. Landsc. Urban Plan. 2019, 192, 103652. [Google Scholar] [CrossRef]
- Gillespie, T.W.; Pincetl, S.; Brossard, S.; Smith, J.; Saatchi, S.; Pataki, D.; Saphores, J.D. A time series of urban forestry in Los Angeles. Urban Ecosyst. 2012, 15, 233–246. [Google Scholar] [CrossRef]
- Merry, K.; Siry, J.; Bettinger, P.; Bowker, J.M. Urban tree cover change in Detroit and Atlanta, USA, 1951–2010. Cities 2014, 41, 123–131. [Google Scholar] [CrossRef]
- Zhou, W.; Huang, G.; Pickett, S.T.A.; Cadenasso, M.L. 90 years of forest cover change in an urbanizing watershed: Spatial and temporal dynamics. Landsc. Ecol. 2011, 26, 645–659. [Google Scholar] [CrossRef]
- Roman, L.A.; Fristensky, J.P.; Eisenman, T.S.; Greenfield, E.J.; Lundgren, R.E.; Cerwinka, C.E.; Hewitt, D.A.; Welsh, C.C. Growing canopy on a college campus: Understanding urban forest change through archival records and aerial photography. Environ. Manag. 2017, 60, 1042–1061. [Google Scholar] [CrossRef]
- Kabish, N.; Qureshi, S.; Haase, D. Human-environment interactions in urban green spaces—A systematic review of contemporary issues and prospects for future research. Environ. Imp. Assess. Rev. 2015, 50, 25–34. [Google Scholar] [CrossRef]
- Bürgi, M.; Östlund, L.; Mladenoff, D.J. Legacy effects of human land use: Ecosystems as time-lagged systems. Ecosystems 2017, 20, 94–103. [Google Scholar] [CrossRef] [Green Version]
- Campanella, T.J. Republic of Shade: New England and the American Elm; Yale University Press: New Haven, CT, USA, 2003. [Google Scholar]
- Farmer, J. Trees in Paradise: A California History; Norton: New York, NY, USA, 2013. [Google Scholar]
- Lawrence, H.W. City Trees: A Historical Geography from the Renaissance through the Nineteenth Century; University of Virginia Press: Charlottesville, VA, USA, 2006. [Google Scholar]
- Jonnes, J. Urban Forests: A Natural History of Trees and People in the American Cityscape; Viking: New York, NY, USA, 2016. [Google Scholar]
- Dümplemann, S. Seeing Trees: A History of Street Trees in New York City and Berlin; Yale University Press: New Haven, CT, USA, 2019. [Google Scholar]
- Bluestone, B.; Harrison, B. The Deindustrialization of America: Plant Closings, Community Abandonment, and the Dismantling of Basic Industry; Basic Books: New York, NY, USA, 1982. [Google Scholar]
- Fainstein, S.S.; Fainstein, N. Economic change, national policy, and the system of cities. In Restructuring the City: The Political Economy of Urban Redevelopment; Fainstein, S.S., Fainstein, N., Eds.; Longman: New York, NY, USA, 1983. [Google Scholar]
- Noyelle, T.J.; Stanback, T. The Economic Transformation of American Cities; Rowman and Allanheld: Totowa, NJ, USA, 1984. [Google Scholar]
- PCPC. Philadelphia2035 Citywide Vision. City of Philadelphia. Available online: https://www.phila2035.org/citywide-vision (accessed on 8 March 2021).
- Haase, D.; Haase, A.; Rink, D. Conceptualizing the nexus between urban shrinkage and ecosystem services. Landsc. Urban Plan. 2014, 132, 159–169. [Google Scholar] [CrossRef]
- Hackworth, J. Demolition as urban policy in the American Rust Belt. Environ. Plan. A Econ. Space 2016, 48, 2201–2222. [Google Scholar] [CrossRef]
- Carter, D.K. (Ed.) Remaking Post-Industrial Cities: Lessons from North America and Europe; Routledge: New York, NY, USA, 2016. [Google Scholar]
- Breger, B.S.; Eisenman, T.S.; Kremer, M.E.; Roman, L.A.; Martin, D.G.; Rogan, J. Urban tree survival and stewardship in a state-managed planting initiative: A case study in Holyoke, Massachusetts. Urban For. Urban Green 2019, 43, 126382. [Google Scholar] [CrossRef]
- Rothstein, R. The Color of Law: A Forgotten History of How Our Government Segregated America; Liveright: New York, NY, USA, 2017. [Google Scholar]
- McGovern, S.J. Philadelphia’s Neighborhood Transformation Initiative: A case study of mayoral leadership, bold planning, and conflict. Hous. Policy Debate 2006, 17, 529–570. [Google Scholar] [CrossRef]
- Brownlow, A. An archaeology of fear and environmental change in Philadelphia. Geoforum 2006, 37, 227–245. [Google Scholar] [CrossRef]
- Kramer, D.C.; Flanagan, R.M. Staten Island: Conservative Bastion in a Liberal City; University Press of America: Lanham, MD, USA, 2012. [Google Scholar]
- Rosan, C.D.; Pearsall, H. Growing a Sustainable City? The Question of Urban Agriculture; University of Toronto Press: Toronto, ON, Canada, 2017. [Google Scholar]
- Kremer, P.; Hamstead, Z.A.; McPhearson, T. A socio-ecological assessment of vacant lots in New York City. Landsc. Urban Plan. 2013, 120, 218–233. [Google Scholar] [CrossRef]
- Wellmann, T.; Schug, F.; Haase, D.; Pflugmacher, D.; van der Linden, S. Green growth? On the relation between population density, land use and vegetation cover fractions in a city using a 30-years Landsat time series. Landsc. Urban Plan. 2020, 202, 103857. [Google Scholar] [CrossRef]
- Locke, D.H.; Hall, B.; Grove, J.M.; Pickett, S.T.A.; Ogden, L.A.; Aoki, C.; Boone, C.G.; O’Neil-Dunne, J.P.M. Residential housing segregation and urban tree canopy in 37 US cities. npj Urban Sustain. 2021, 1, 15. [Google Scholar] [CrossRef]
- Pearsall, H. Staying cool in the compact city: Vacant land and urban heating in Philadelphia, Pennsylvania. Appl. Geogr. 2017, 79, 84–92. [Google Scholar] [CrossRef]
- Wolff, M.; Haase, A.; Haase, D.; Kabisch, N. The impact of urban regrowth on the built environment. Urban Stud. 2017, 54, 2583–2700. [Google Scholar] [CrossRef]
- Avila, E.; Rose, M.H. Race, culture, politics, and urban renewal: An introduction. J. Urban Hist. 2009, 35, 335–347. [Google Scholar] [CrossRef]
- Merse, C.L.; Buckley, G.L.; Boone, C.G. Street trees and urban renewal: A Baltimore case study. Geogr. Bull. 2008, 50, 65–81. [Google Scholar]
- Bryson, J. Greening urban renewal: Expo’74, urban environmentalism and green space on the Spokane riverfront, 1965–1974. J. Urban Hist. 2013, 39, 495–512. [Google Scholar] [CrossRef]
- Eisenman, T.W.; Churkina, G.; Jariwala, S.P.; Kumar, P.; Lovasi, G.S.; Pataki, D.E.; Weinberger, K.R.; Whitlow, T.H. Urban trees, air quality, and asthma: An interdisciplinary review. Landsc. Urban Plan. 2019, 187, 47–59. [Google Scholar] [CrossRef]
- Daniel, C.; Morrison, T.H.; Phinn, S. The governance of private residential land in cities and spatial effects on tree cover. Environ. Sci. Policy 2016, 62, 79–89. [Google Scholar] [CrossRef]
- Smalarz, M. The “White Island”: Whiteness in the Making of Public and Private Space in Northeast Philadelphia, 1854–1990. Ph.D. Thesis, University of Rochester, Rochester, NY, USA, 2016. [Google Scholar]
- Forsyth, A. Defining suburbs. J. Plan. Lit. 2012, 27, 270–281. [Google Scholar] [CrossRef] [Green Version]
- McKee, C.A. The Problem of Jobs: Liberalism, Race, and Deindustrialization in Philadelphia; University of Chicago: Chicago, IL, USA, 2008. [Google Scholar]
- Ballantyne, M.; Gudes, O.; Pickering, C.M. Recreational trails are an important cause of fragmentation in endangered urban forests: A case-study from Australia. Landsc. Urban Plan. 2014, 130, 112–124. [Google Scholar] [CrossRef] [Green Version]
- Adams, C.; Bartelt, D.; Elesh, D.; Goldstein, I.; Kleniewski, N.; Yancey, W. Philadelphia: Neighborhoods, Division, and Conflict in a Postindustrial City; Temple University Press: Philadelphia, PA, USA, 1991. [Google Scholar]
- Pearsall, H.; Lucas, S.; Lenhardt, J. The contested nature of vacant land in Philadelphia and approaches for resolving competing objectives for redevelopment. Cities 2014, 40, 163–174. [Google Scholar] [CrossRef]
- Pew Charitable Trusts. Philadelphia 2019: The State of the City. Available online: https://www.pewtrusts.org/-/media/assets/2019/10/sotc_2019.pdf (accessed on 8 March 2021).
- Econsult Corporation, Vacant Land Management in Philadelphia: The Costs of the Current System and the Benefits of Reform. Submitted to Redevelopment Authority of the City of Philadelphia. Available online: https://econsultsolutions.com/wp-content/uploads/2010/09/Vacant-Land-Reform-Analysis-FINAL-REPORT_2010-09-23.pdf (accessed on 8 March 2021).
- Roman, L.A.; Smith, B.C.; Dentice, D.; Maslin, M.; Abrams, G. Monitoring young tree survival with citizen scientists: The evolving Tree Checkers program in Philadelphia, PA. Arboric. Urban For. 2018, 44, 255–265. [Google Scholar]
- Dyer, J.M. Revisiting the deciduous forests of eastern North America. BioScience 2006, 56, 341–352. [Google Scholar] [CrossRef] [Green Version]
- Armstrong, R.P. Green Space in the Gritty City: The Planning and Development of Philadelphia’s Park System, 1854. Ph.D. Thesis, Lehigh University, Bethlehem, PA, USA, 2012. [Google Scholar]
- DVRPC. 2016 DVRPC Open Space Inventory, Accessed from DVRPC Staff 1 May 2018, More Information. Available online: https://www.dvrpc.org/OpenSpace/Inventory (accessed on 1 May 2018).
- Philadelphia Parks & Recreation (PPR). Parkland Forest Management Framework. Prepared by Biohabitats. Available online: https://www.phila.gov/documents/parkland-forest-management-framework/ (accessed on 9 November 2020).
- O’Neil-Dunne, J. A Report on the City of Philadelphia’s Existing and Possible Tree Canopy. University of Vermont, Spatial Analysis Lab. Available online: https://www.fs.fed.us/nrs/utc/reports/UTC_Report_Philadelphia.pdf (accessed on 8 March 2021).
- O’Neil-Dunne, J. Tree Canopy Assessment: Philadelphia, PA. University of Vermont, Spatial Analysis Lab. Available online: http://treephilly.org/wp-content/uploads/2019/12/Tree-Canopy-Assessment-Report-Philadelphia-2018.pdf (accessed on 8 March 2021).
- City of Philadelphia. Greenworks Philadelphia. Mayor’s Office of Sustainability. Available online: https://www.phila.gov/documents/greenworks-progress-reports/ (accessed on 8 March 2021).
- Hilbert, D.R.; Koeser, A.K.; Roman, L.A.; Hamilton, K.; Landry, S.M.; Hauer, R.J.; Campanella, H.; McLean, D.; Andreu, M.; Perez, H. Development practices and ordinances predict inter-city variation in Florida urban tree canopy coverage. Landsc. Urban Plan. 2019, 190, 103603. [Google Scholar] [CrossRef]
- Morgan, J.L.; Gergel, S.E.; Coops, N.C. Aerial photography: A rapidly evolving tool for ecological management. BioScience 2010, 60, 47–59. [Google Scholar] [CrossRef]
- Carta, A.; Taboada, T.; Müller, J.V. Diachronic analysis using aerial photographs across fifty years reveals significant land use and vegetation changes on a Mediterranean island. Appl. Geogr. 2018, 98, 78–86. [Google Scholar] [CrossRef]
- Morgan, J.L.; Gergel, S.E.; Ankerson, C.; Tomscha, S.A.; Sutherland, I.J. Historical aerial photography for landscape analysis. In Learning Landscape Ecology; Gergel, S.E., Turner, M.G., Eds.; Springer-Verland: New York, NY, USA, 2017; pp. 21–39. [Google Scholar]
- O’Neil-Dunne, J.P.M.; MacFaden, S.W.; Royar, A.R.; Pelletier, K.C. An object-based system for LiDAR data fusion and feature extraction. Geocarto Int. 2013, 38, 227–242. [Google Scholar] [CrossRef]
- City of Philadelphia. Planning Districts Dataset. Available online: https://www.opendataphilly.org/dataset/planning-districts (accessed on 1 May 2018).
- Fay, M.P. exact2x2: Exact Confidence Tests and Matching Confidence Intervals for 2 by 2 Tables. Available online: https://cran.r-project.org/web/packages/exact2x2/vignettes/exact2x2.pdf (accessed on 1 June 2020).
- R Core Team. R: A Language and Environment for Statistical Computing; R Foundation for Statistical Computing: Vienna, Austria; Available online: https://www.r-project.org/ (accessed on 1 June 2020).
- Batterham, A.M.; Hopkins, W.G. Making meaningful inferences about magnitudes. Int. J. Sports Physiol. Perf. 2006, 1, 50–57. [Google Scholar] [CrossRef]
- Chan, L.S. Minimally clinically important difference (MCID)—Adding meaning to statistical inference. Am. J. Pub. Health 2013, 103, e24–e25. [Google Scholar] [CrossRef]
- Richardson, J.J.; Moskal, L.M. Uncertainty in urban forest canopy assessment: Lessons from Seattle, WA, USA. Urban For. Urban Green 2014, 13, 152–157. [Google Scholar] [CrossRef]
- Lund, H.G. A ‘forest’ by any other name…. Environ. Sci. Policy 1999, 2, 125–133. [Google Scholar] [CrossRef]
- Pontius, R.G.; Shasus, E.; McEachern, M. Detecting important categorical land changes while accounting for persistence. Agric. Ecosyst. Envir. 2004, 101, 251–268. [Google Scholar] [CrossRef]
- Cuba, N. Research note: Sankey diagrams for visualizing land cover dynamics. Landsc. Urban Plan. 2015, 139, 163–167. [Google Scholar] [CrossRef]
- Ancestry. Newspapers.com. Available online: https://www.newspapers.com (accessed on 16 September 2019).
- Knowles, S.G. Imagining Philadelphia: Edmund Bacon and the Future of the City; University of Pennsylvania Press: Philadelphia, PA, USA, 2009. [Google Scholar]
- Heller, G.L. Salesman of ideas: The life experiences that shaped Edmund Bacon. In Imagining Philadelphia: Edmund Bacon and the Future of the City; Knowles, S.G., Ed.; University of Pennsylvania Press: Philadelphia, PA, USA, 2009; pp. 19–51. [Google Scholar]
- Milroy, E. “Pro bono publico”: Ecology, history, and the creation of Philadelphia’s Fairmount Park system. In Nature’s Entrepôt: Philadelphia’s Urban Sphere and Its Environmental Thresholds; Black, B.C., Chiarappa, M.K., Eds.; University of Pittsburgh Press: Pittsburgh, PA, USA, 2012; pp. 35–54. [Google Scholar]
- Saxon, W. Ernesta Drinker Ballard, 85, Horticulturalist and Feminist, Dies. New York Times, 1 September 2005. [Google Scholar]
- Ung, E. In Phila., She Speaks for the Trees. The Philadelphia Inquirer, 20 November 2001. [Google Scholar]
- Merkowitz, D.J. The Segregated City: Philadelphia’s Jews and the Urban Crisis, 1964–1984. Ph.D. Thesis, University of Cincinnati, Cincinnati, OH, USA, 2010. [Google Scholar]
- PCPC. Lower North District Plan, 2014a. Adopted by the PCPC 20 May 2014. Available online: https://www.phila2035.org/plan (accessed on 1 June 2020).
- PCPC. Lower North District Plan Technical Memoranda: Existing Conditions, Issues, and Opportunities. Prepared by PCPC August 2013. Available online: https://www.phila2035.org/plan (accessed on 1 June 2020).
- PCPC. Comprehensive Plan for the City of Philadelphia. Available online: https://www.phila.gov/documents/the-1960-comprehensive-plan (accessed on 1 September 2020).
- Hillier, A.E. Residential security maps and neighborhood appraisals: The Homeowners’ Loan Corporation and the case of Philadelphia. Soc. Sci. Hist. 2005, 29, 207–222. [Google Scholar] [CrossRef]
- Beauregard, R.A. The spatial transformation of postwar Philadelphia. In Atop the Urban Hierarchy; Beauregard, R.A., Ed.; Rowan & Littlefield: Totowa, NJ, USA, 1989; pp. 195–238. [Google Scholar]
- Keefer, N.J. Politicization of Space: Urban Campus, Urban Renewal and Development in the Temple and University City Areas of Philadelphia from 1947–1972. Ph.D. Thesis, State University of New York, Binghamton University, Binghamton, NY, USA, 2013. [Google Scholar]
- Mills, M.M. Garden City. The Philadelphia Inquirer, 2 May 1993. [Google Scholar]
- Sitton, L. An Effort Blooms in N. Phila. The Philadelphia Inquirer, 19 September 1993. [Google Scholar]
- Bonham, J.B.; Smith, P.L. Transformation through greening. In Growing Greener Cities: Urban Sustainability in the Twenty-First Century; Birch, E.L., Wachter, S.M., Eds.; University of Pennsylvania Press: Philadelphia, PA, USA, 2008; pp. 227–243. [Google Scholar]
- May, P. Phila. Plan to Beautify Vacant Lots Gets Little Help from Neighborhoods. The Philadelphia Inquirer, 3 October 1989. [Google Scholar]
- Ubiñas, H. A Tree Grows inside a North Philly Home. The Philadelphia Inquirer, 23 July 2014. [Google Scholar]
- Bannister, C. You, too, Can be a Friend to New Trees. Philadelphia Daily News, 4 May 1970. [Google Scholar]
- McKee, G.A. Liberal ends through illiberal means. J. Urban Hist. 2001, 27, 547–583. [Google Scholar] [CrossRef]
- PCPC. Lower Southwest District Plan, 2016a. Adopted by the PCPC 14 June 2016. Available online: https://www.phila2035.org/plan (accessed on 1 June 2020).
- United States Department of Housing and Urban Development. Draft environmental impact statement, Eastwick Urban Renewal Area, Development Authority of the City of Philadelphia, 1234 Market St.; United States Department of Housing and Urban Development: Philadelphia, PA, USA, 1975.
- The Philadelphia Inquirer. Penrose Park: Suburban Living for South Philadelphians. The Philadelphia Inquirer, 17 May 1970. [Google Scholar]
- The Philadelphia Inquirer. Grand Opening: The federalist II at Penrose Park. The Philadelphia Inquirer, 24 October 1971. [Google Scholar]
- Heller, G.L. Ed Bacon: Planning, Politics, and the Building of Modern Philadelphia; University of Pennsylvania Press: Philadelphia, PA, USA, 2013. [Google Scholar]
- PCPC. Far Northeast District Plan, Adopted by the PCPC 18 April 2017. Available online: https://www.phila2035.org/plan (accessed on 1 June 2020).
- Eisinger, P.K. Municipal residency requirements and the local economy. Soc. Sci. Q. 1983, 64, 85–96. [Google Scholar]
- The Philadelphia Inquirer. Why Settle for an Ordinary Row Home? Morrell Park. The Philadelphia Inquirer, 22 November 1959. [Google Scholar]
- PCPC. Philadelphia2035: Far Northeast District Plan: Existing Conditions, Issues, and Opportunities, 2016b. Prepared by PCPC Aug 2016. Available online: https://www.phila2035.org/plan (accessed on 1 June 2020).
- Ellis, L. Shaky Ground: A Housing Experiment Proves an Aesthetic Disaster. The Philadelphia Inquirer, 11 January 1987. [Google Scholar]
- Heavens, A.J. Renovated Complex is Talk of the Neighborhood. The Philadelphia Inquirer, 25 February 1994. [Google Scholar]
- Smith, E. For Trees, they have Tender Feelings. Philadelphia Daily News, 14 September 2010. [Google Scholar]
- PCPC. Lower Northwest District Plan, 2014b. Adopted by the PCPC 9 Dec 2014. Available online: https://www.phila2035.org/plan (accessed on 1 June 2020).
- The Philadelphia Inquirer. $14,200 Suburban Beauty. The Philadelphia Inquirer, 12 October 1952. [Google Scholar]
- Fisher, G.A. The Gentrification of Manayunk. Master’s Thesis, University of Pennsylvania, Philadelphia, PA, USA, 2006. [Google Scholar]
- Eichel, L. Rising from the Ruins: Why Public Housing, once the Scourge of the City, now is a Vital Part of Its Life and Future. The Philadelphia Inquirer, 4 December 2005. [Google Scholar]
- Marder, D. Ripe for Revival: Entrepreneurs and Cash Give East Falls Another Chance. The Philadelphia Inquirer, 2 March 2008. [Google Scholar]
- Gabriel, N. “No place for wilderness”: Urban parks and the assembling of neoliberal urban environmental governance. Urban For. Urban Green 2016, 19, 278–284. [Google Scholar] [CrossRef]
- Philadelphia Daily News. The State of Our Parks. Philadelphia Daily News, 21 May 2001. [Google Scholar]
- Davies, D. Service Makes us Smile. Philadelphia Daily News, 19 April 1995. [Google Scholar]
- Loeb, V. Money Doesn’t Grow on Trees. The Philadelphia Inquirer, 30 January 1986. [Google Scholar]
- Fairmount Park Commission (FPC). 122nd annual report, July 1988–July1989; Philadelphia, PA. Obtained at the PPR Archive, 1515 Arch St.; Fairmount Park Commission (FPC): Philadelphia, PA, USA, 1989. [Google Scholar]
- Finkel, K. Fairmount Park: The Neglected Treasure. The Philadelphia Inquirer, 25 April 1986. [Google Scholar]
- FPC. 104th Annual Report, 1971–1972; Philadelphia, PA. Obtained at the PPR Archive, 1515 Arch St.; FPC: Philadelphia, PA, USA, 1972. [Google Scholar]
- FPC. 109th Annual Report, 1976–1977; Philadelphia, PA. Obtained at the PPR Archive, 1515 Arch St.; FPC: Philadelphia, PA, USA, 1977. [Google Scholar]
- Fleeson, L. The War for the Trees. The Philadelphia Inquirer, 24 March 1987. [Google Scholar]
- FPC. My Fairmount Park: Annual Report; Philadelphia, PA. Obtained at the PPR Archive, 1515 Arch St.; FPC: Philadelphia, PA, USA, 2020. [Google Scholar]
- Hill, M. Seeking a Park’s Spark. The Philadelphia Inquirer, 1 June 2004. [Google Scholar]
- Fowler, R. 360-Acre Area Keeps Nature in City. The Philadelphia Inquirer, 29 October 1970. [Google Scholar]
- Haas, A.H. Nature Center is Approved on 252 Acres in Roxborough. The Philadelphia Inquirer, 21 May 1967. [Google Scholar]
- Nase, M.; Kirkpatrick, A. Historical Summary of Land Management & Restoration Practice at the Schuylkill Center; Staff at the Schuylkill Center for Environmental Education: Philadelphia, PA, USA, 2019. [Google Scholar]
- US Fish & Wildlife Service. John Heinz National Wildlife Refuge at Tinicum. Available online: https://www.fws.gov/refuge/John_Heinz/ (accessed on 12 November 2020).
- Fowler, R. Tinicum Marsh Faces tough Fight for Survival. The Philadelphia Inquirer, 7 October 1973. [Google Scholar]
- Delaware County Daily Times. Tinicum Marsh Bill Passes. Delaware County Daily Times, 11 May 1977. [Google Scholar]
- Ellis, L. A Second Chance for B. Rush State Park. The Philadelphia Inquirer, 9 June 1988. [Google Scholar]
- Haney, K. A Green Island in an Urban Area. The Philadelphia Daily News, 11 March 1993. [Google Scholar]
- Pennsylvania Department of Conservation and Natural Resources. Officials Break Ground for Benjamin Rush State Park Improvements. Resource, Newsletter of the PADCNR. Available online: http://www.apps.dcnr.state.pa.us/news/resource/res2012/12–1121-benjaminrushsp.aspx (accessed on 12 November 2012).
- Ludwig, E. A World of Gardeners. The Philadelphia Inquirer, 28 August 2008. [Google Scholar]
- Svendsen, E.; Campbell, L. Urban ecological stewardship: Understanding the structure, function and network of community-based urban land management. Cities Environ. (CATE) 2008, 1, 1. [Google Scholar] [CrossRef]
- Avolio, M.K.; Pataki, D.E.; Trammell, T.L.E.; Endter-Wada, J. Biodiverse cities: The nursery industry, homeowners, and neighborhood differences drive urban tree composition. Ecol. Monogr. 2018, 88, 259–276. [Google Scholar] [CrossRef] [Green Version]
- Connolly, J.T.T.; Anguelovski, I. Three histories of greening and whiteness in American cities. Front. Ecol. Evol. 2021, 9, 621783. [Google Scholar] [CrossRef]
- Pearsall, H.; Eller, J.K. Locating the green space paradox: A study of gentrification and public green space accessibility in Philadelphia, Pennsylvania. Landsc. Urban Plan. 2020, 195, 103708. [Google Scholar] [CrossRef]
- Schilling, J.; Logan, J. Greening the rust belt: A green infrastructure model for right sizing America’s shrinking cities. J. Am. Plan. Assoc. 2008, 74, 451–466. [Google Scholar] [CrossRef]
- Roman, L.A.; Walker, L.A.; Martineau, C.M.; Muffly, D.J.; MacQueen, S.A.; Harris, W. Stewardship matters: Case studies in establishment success of urban trees. Urban For. Urban Green 2015, 1, 1174–1182. [Google Scholar] [CrossRef] [Green Version]
- FPC. Annual Report 1946; FPC: Philadelphia, PA, USA, 1947. [Google Scholar]
- Nowak, D.J.; Bodine, A.R.; Hoehn, R.E.; Ellis, A.; Low, S.C.; Roman, L.A.; Henning, J.G.; Stephan, E.; Taggert, T.; Endreny, T. The Urban Forests of Philadelphia; Resource Bulletin NRS-106; USDA Forest Service: Newtown Square, PA, USA, 2016.
Figure 1.
Geographic units used in our analysis of land cover change in Philadelphia.

Figure 2.
Sankey diagrams depicting transitions across land cover classes for (a) developed lands and (b) protected open space in Philadelphia. Total land cover in each year adds to 100%, and the thickness of the curves between decades indicates what portion of points transitioned from one land cover class to another over a given decade.

Figure 3.
Sankey diagrams depicting transitions across land cover classes for the four planning districts with the largest net tree cover increases: (a) Lower North, (b) Lower Southwest, (c) Lower Far Northeast, and (d) Lower Northwest.
Figure 3.
Sankey diagrams depicting transitions across land cover classes for the four planning districts with the largest net tree cover increases: (a) Lower North, (b) Lower Southwest, (c) Lower Far Northeast, and (d) Lower Northwest.


Figure 4.
Aerial imagery from 1970 (a) and 2010 (b) for the Lower Southwest district in the vicinity of the Philadelphia Wholesale Produce Market and Paschall Playground. These images illustrate an area where herbaceous cover was replaced with buildings and other impervious cover. Red dots are points that were interpreted for land cover.

Figure 5.
Aerial imagery from (a) 1970 and (b) 2010 for Schuylkill Center. These images illustrate an area where herbaceous cover in former agricultural fields was replaced with tree cover. Red dots are points that were interpreted for land cover.
Figure 5.
Aerial imagery from (a) 1970 and (b) 2010 for Schuylkill Center. These images illustrate an area where herbaceous cover in former agricultural fields was replaced with tree cover. Red dots are points that were interpreted for land cover.


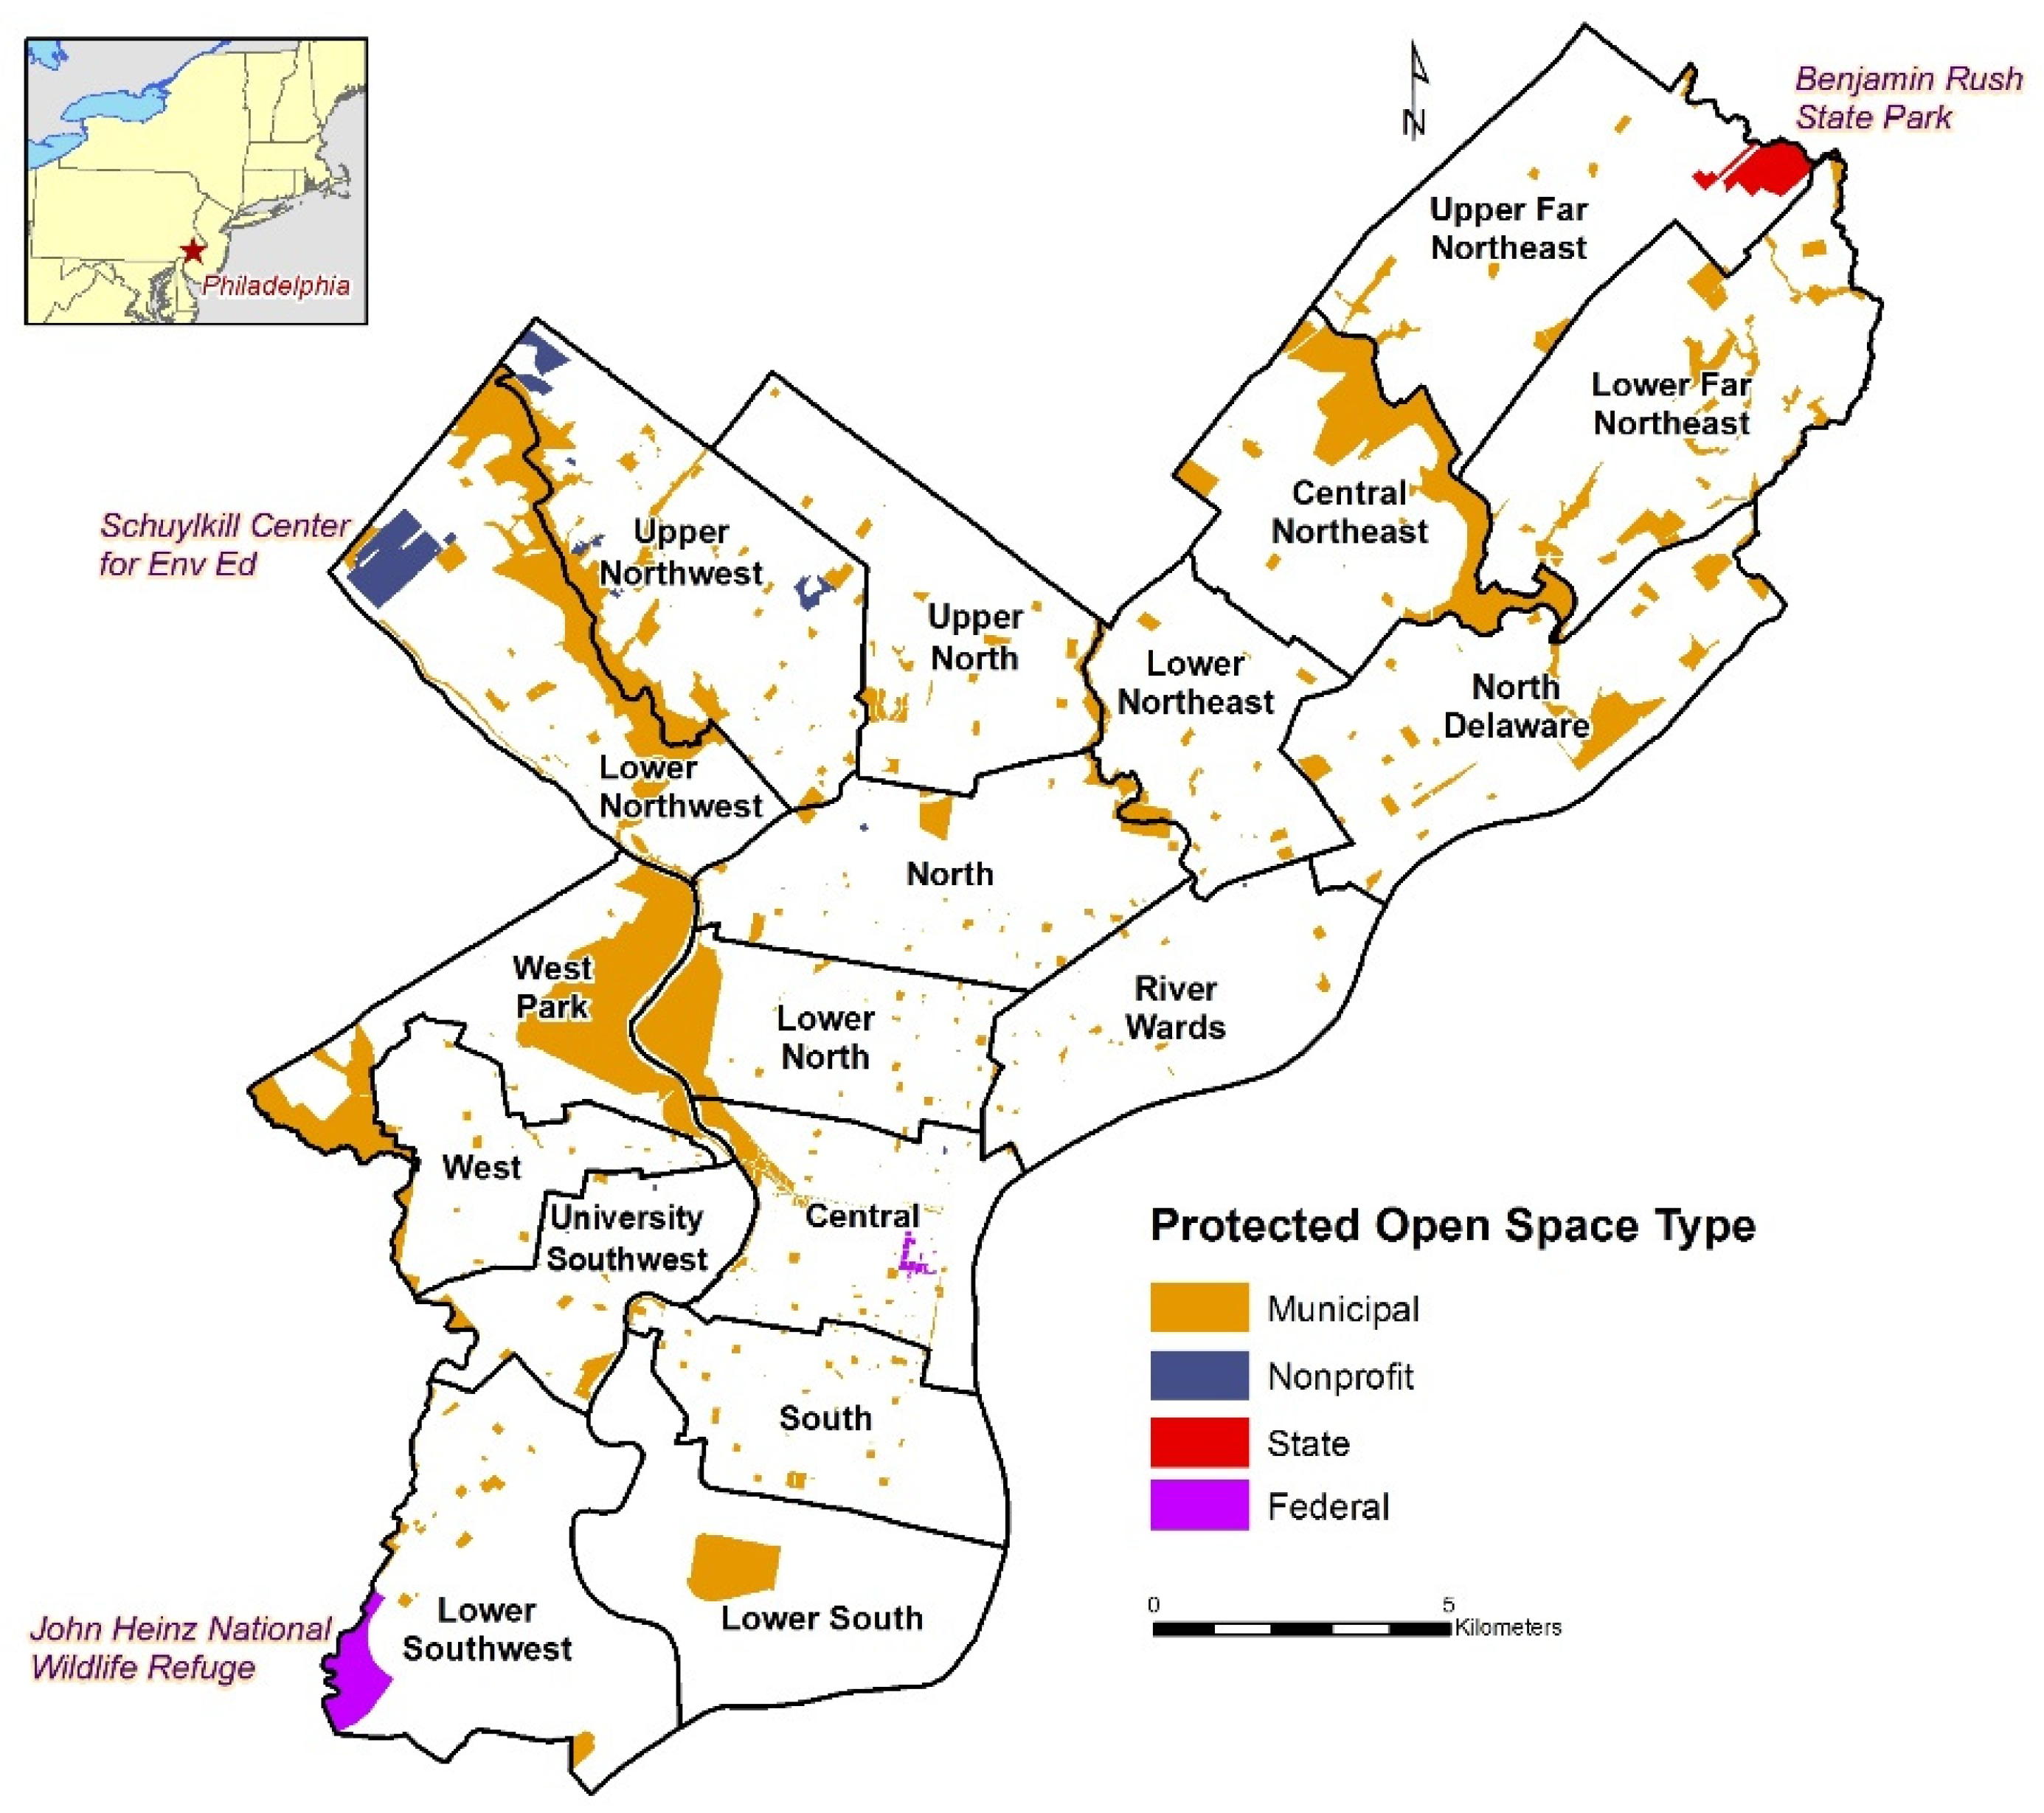
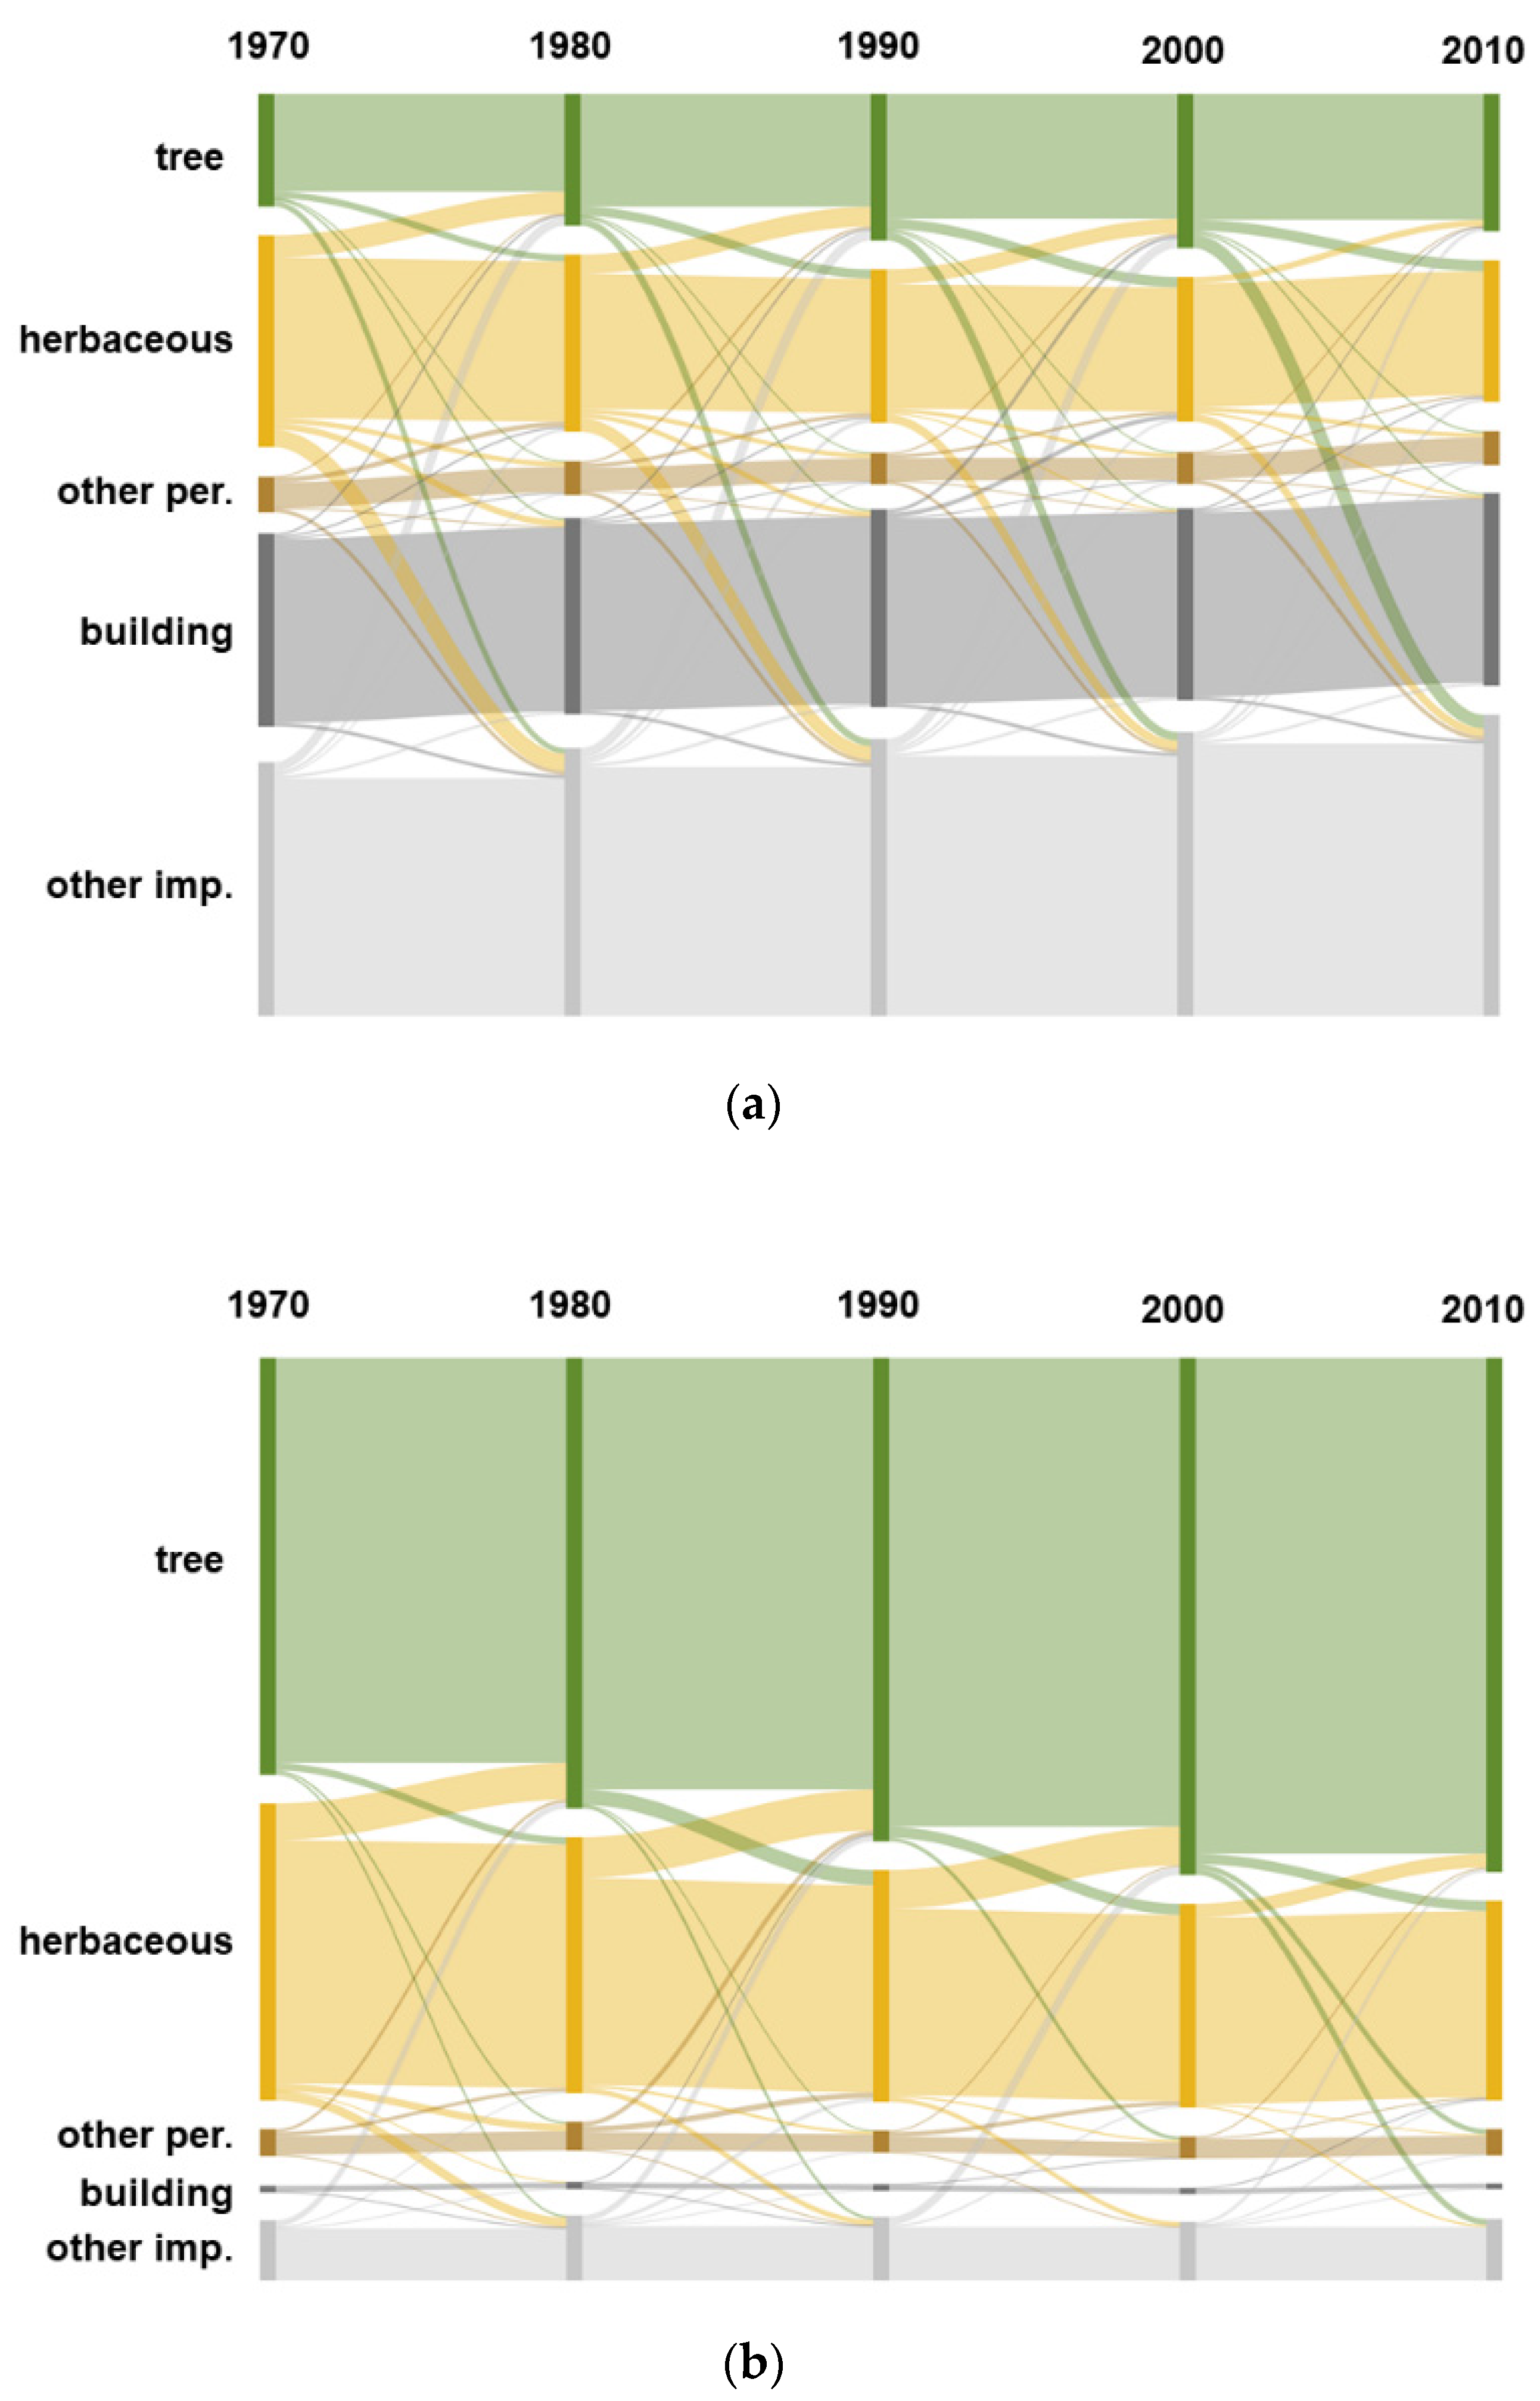
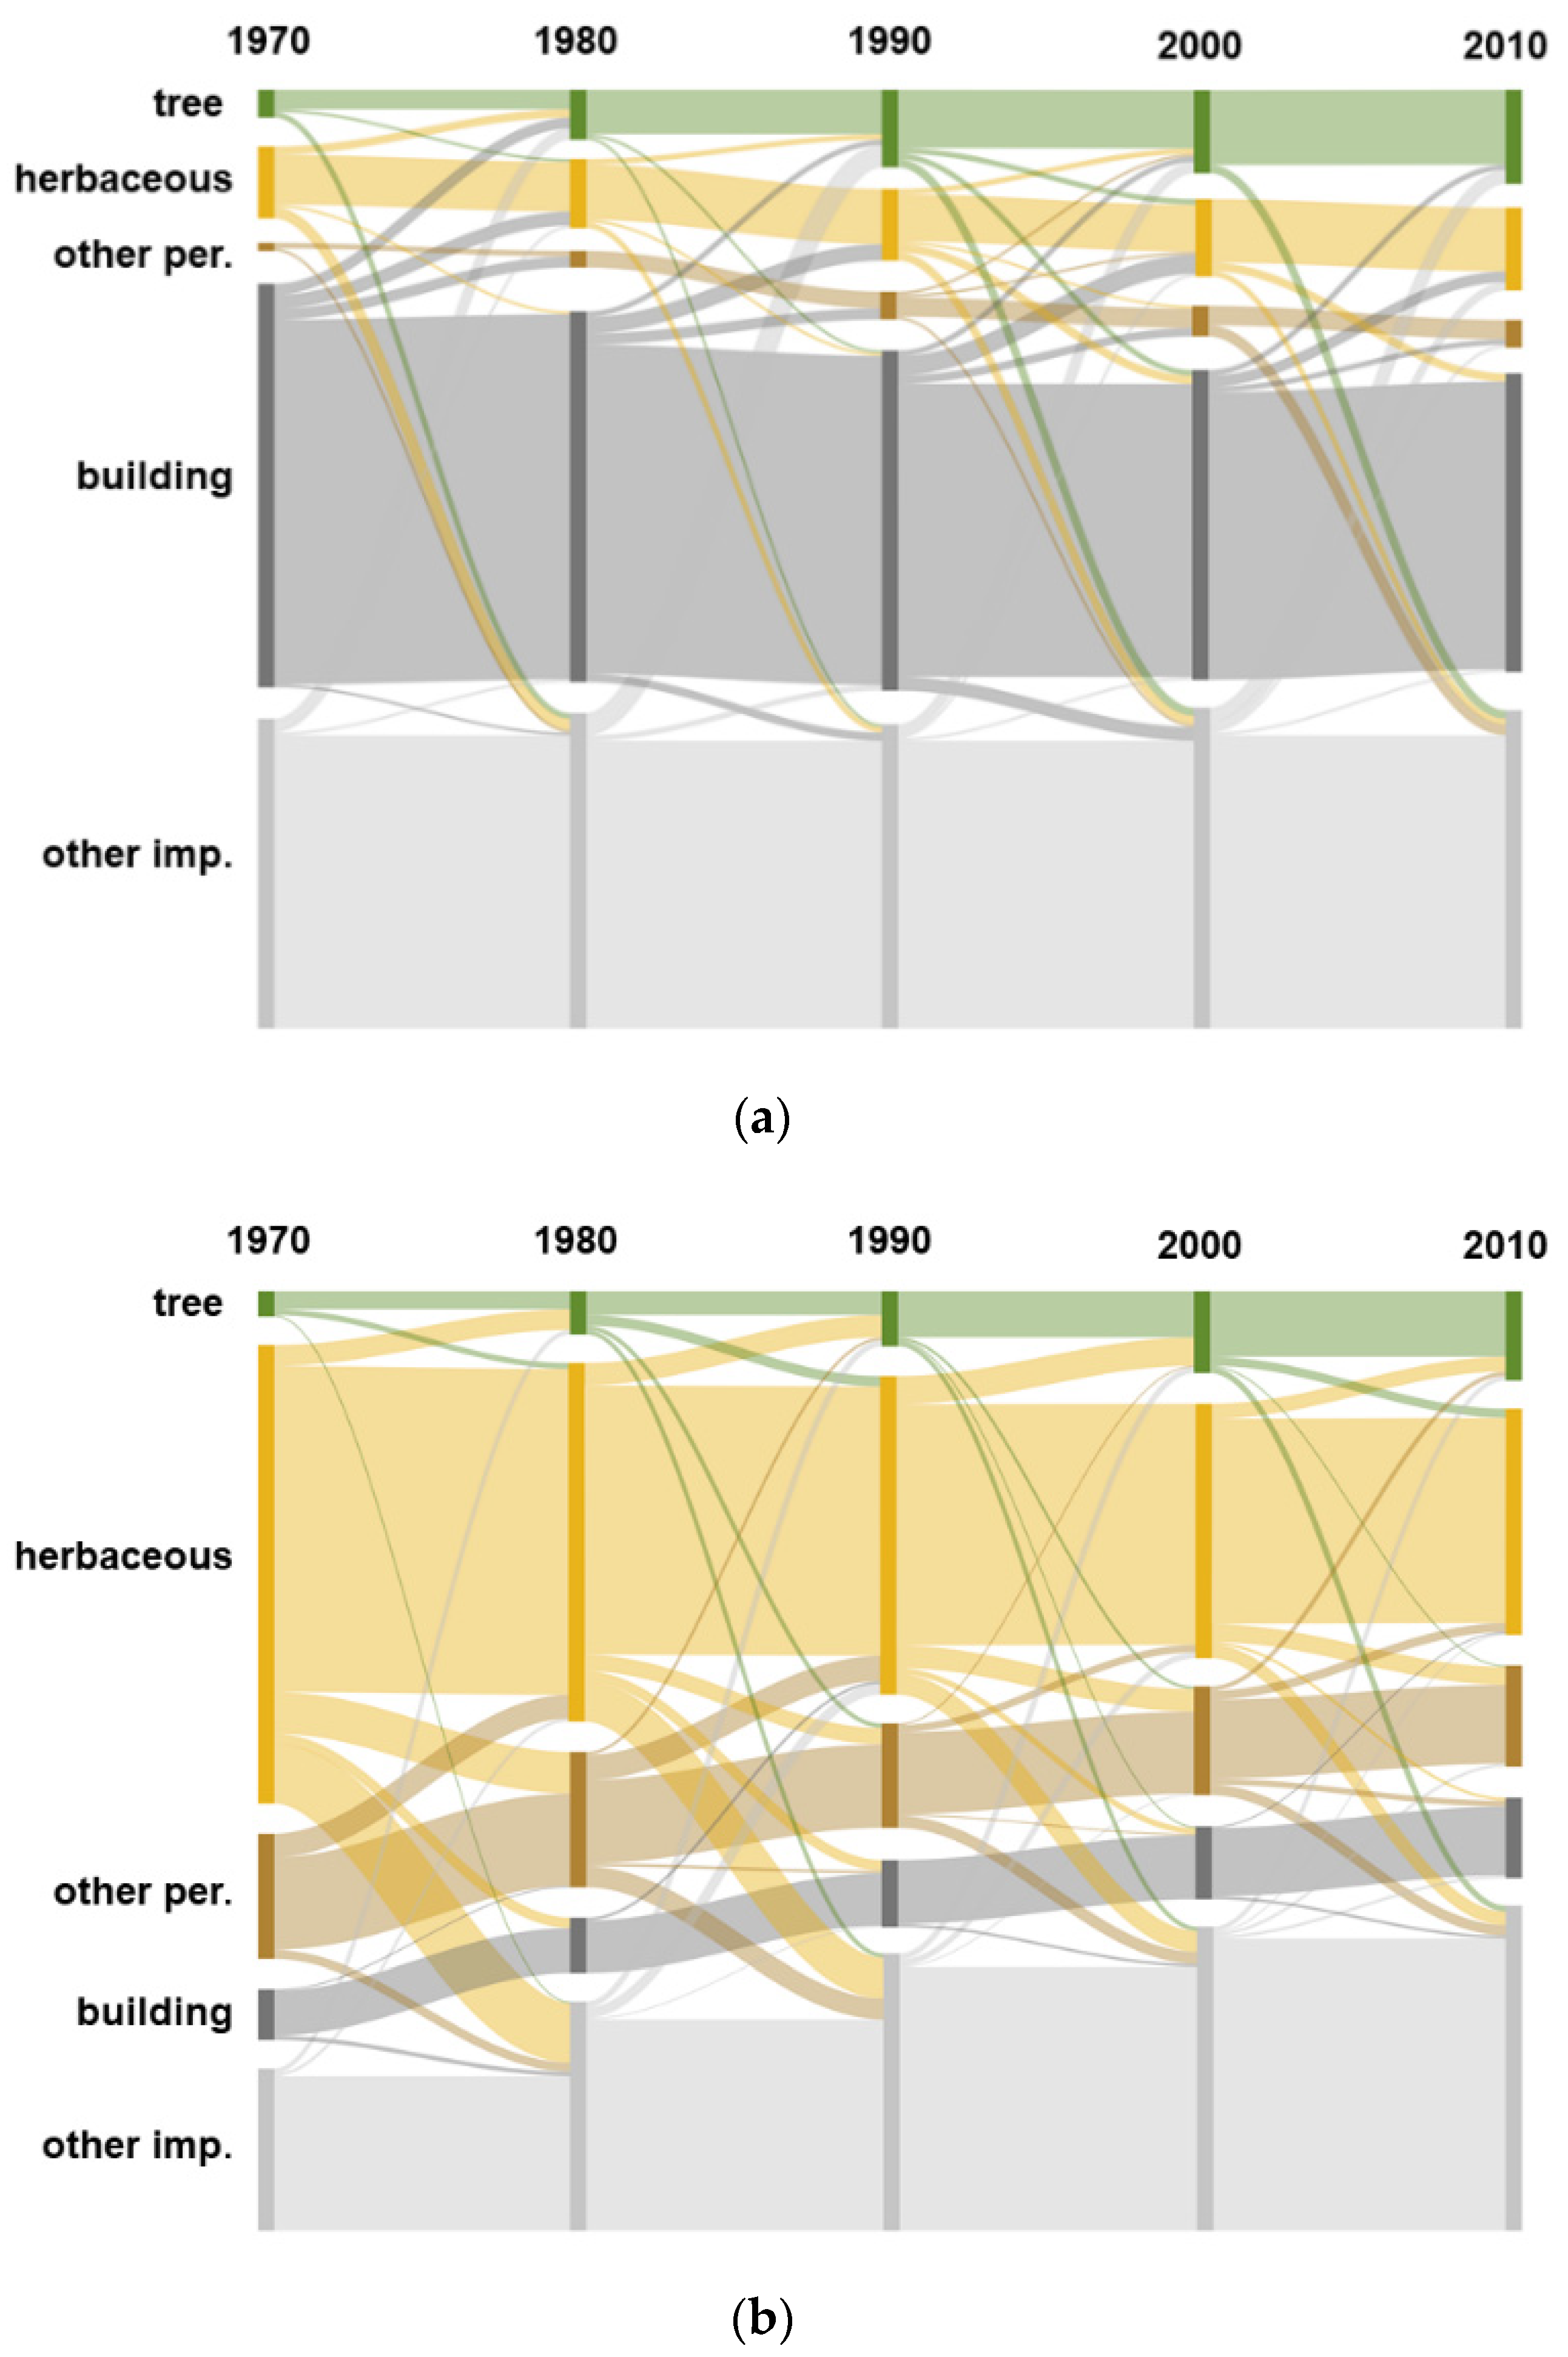
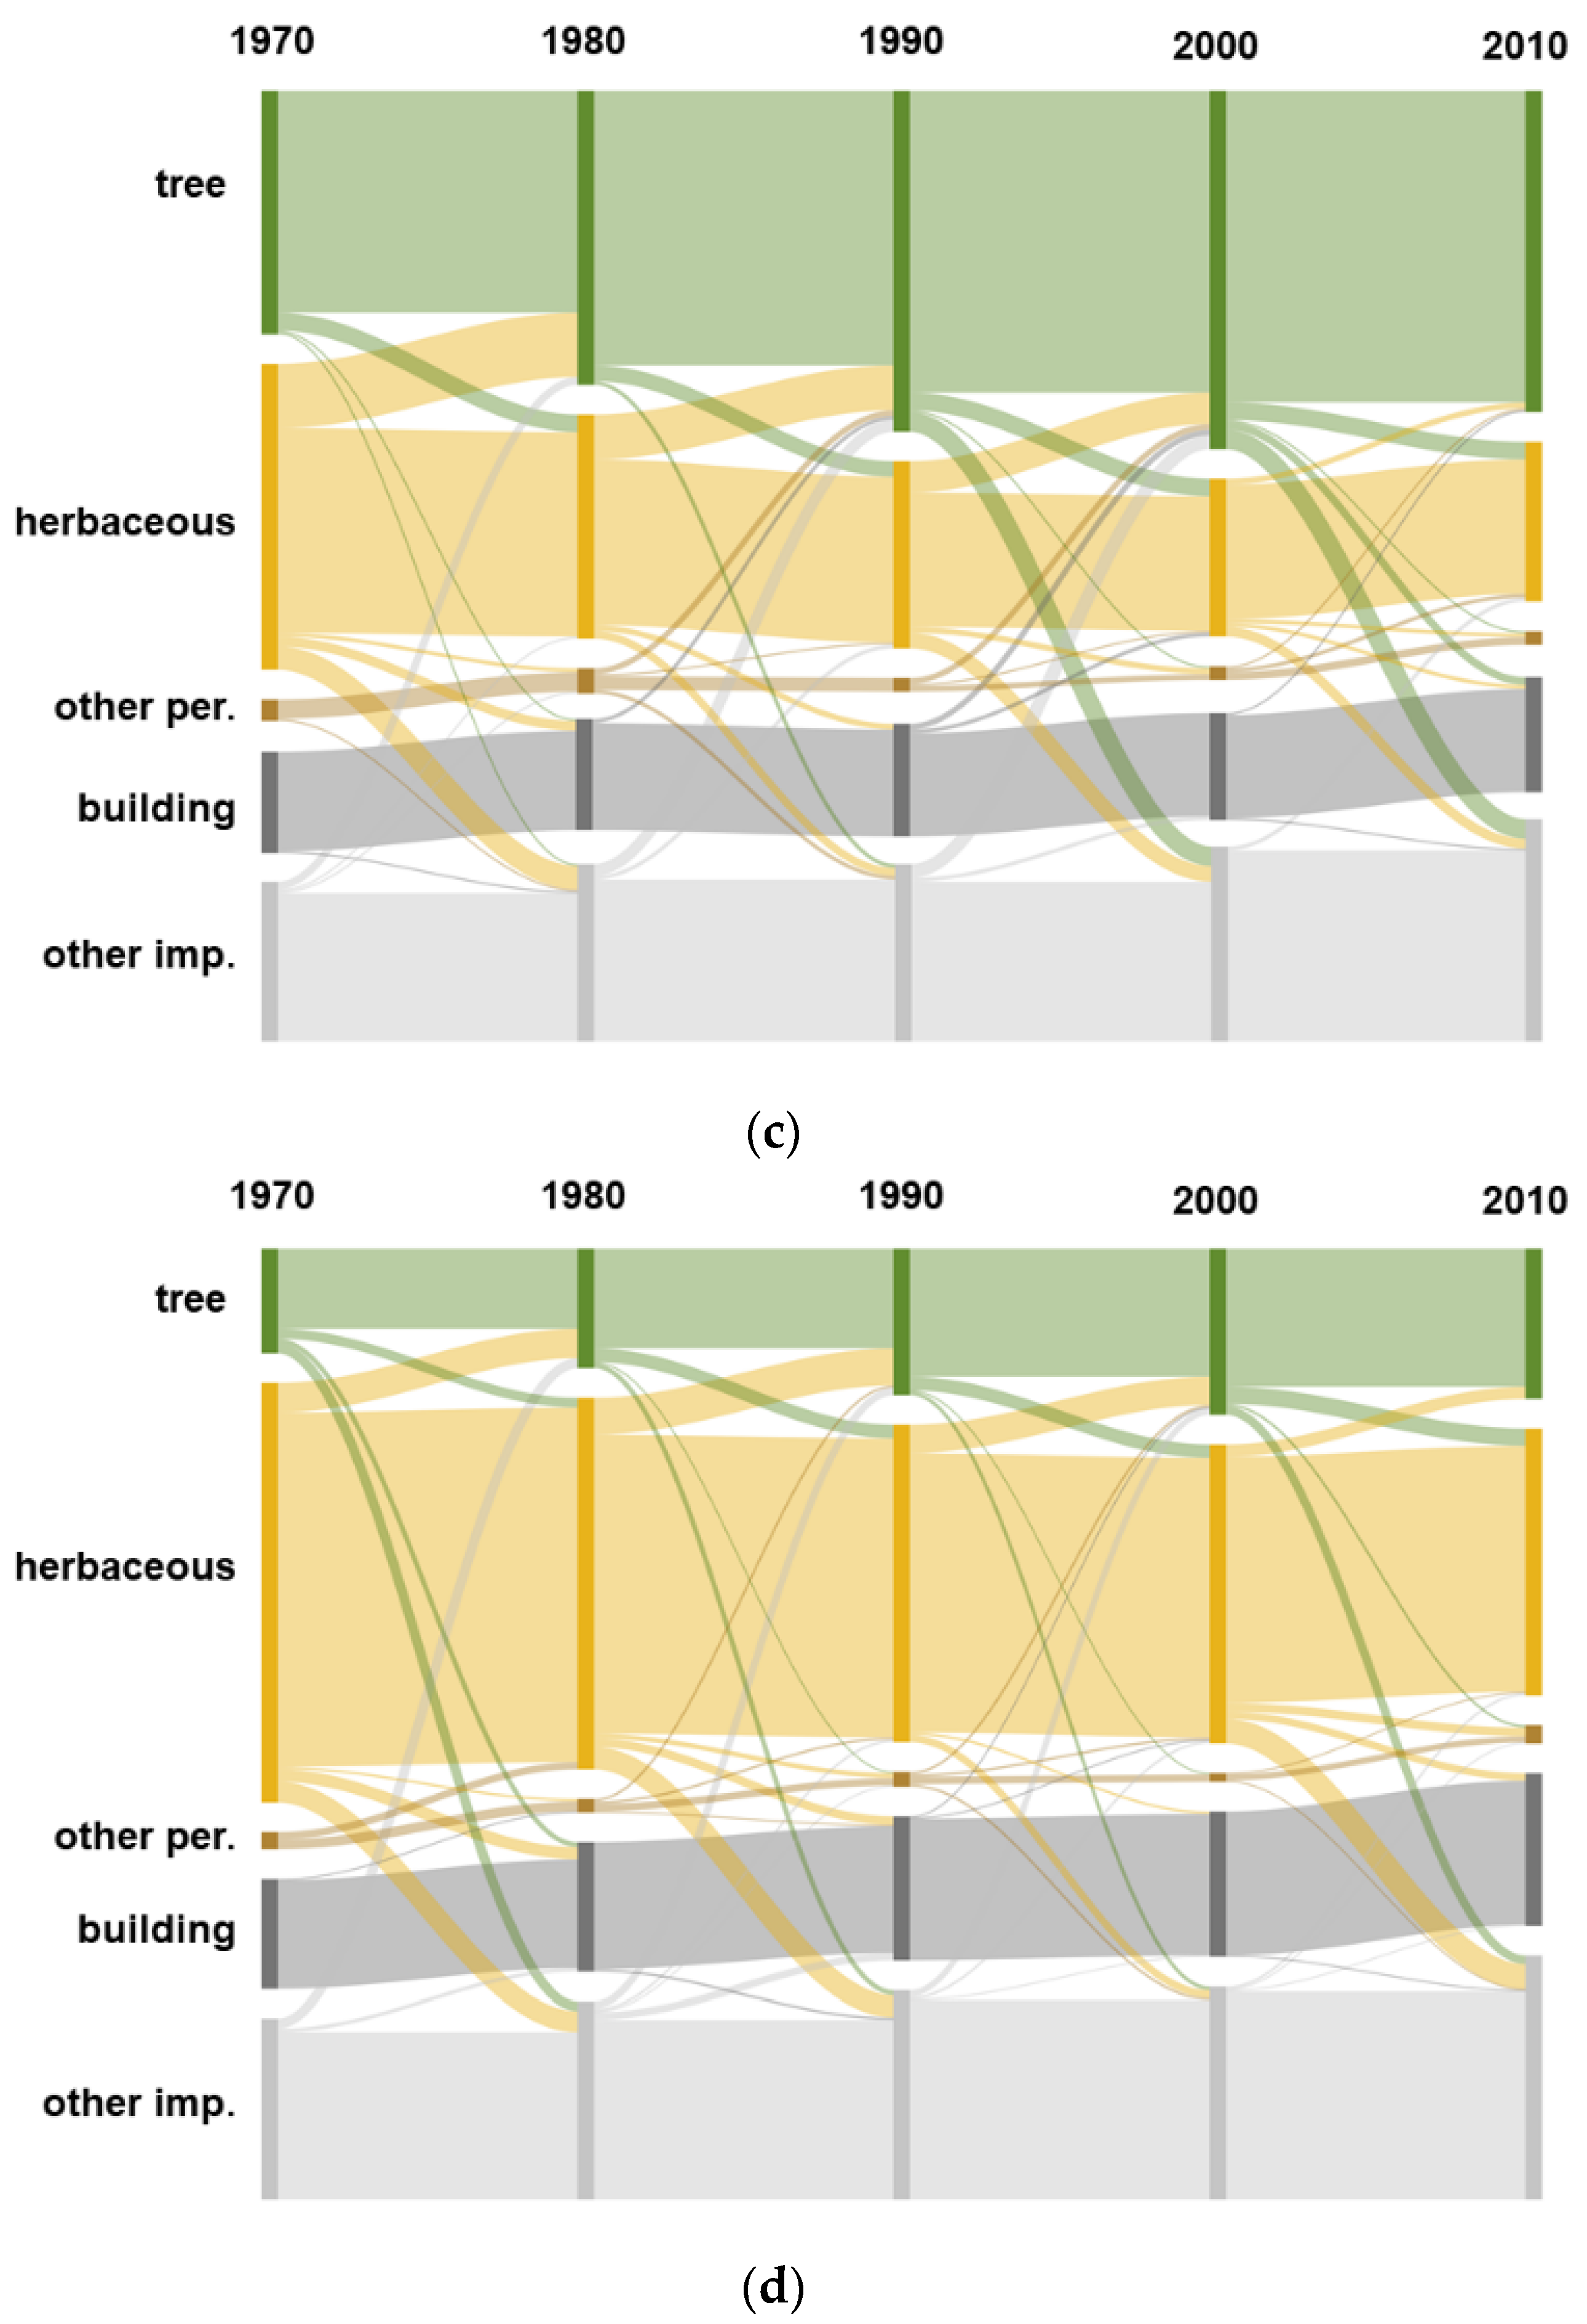
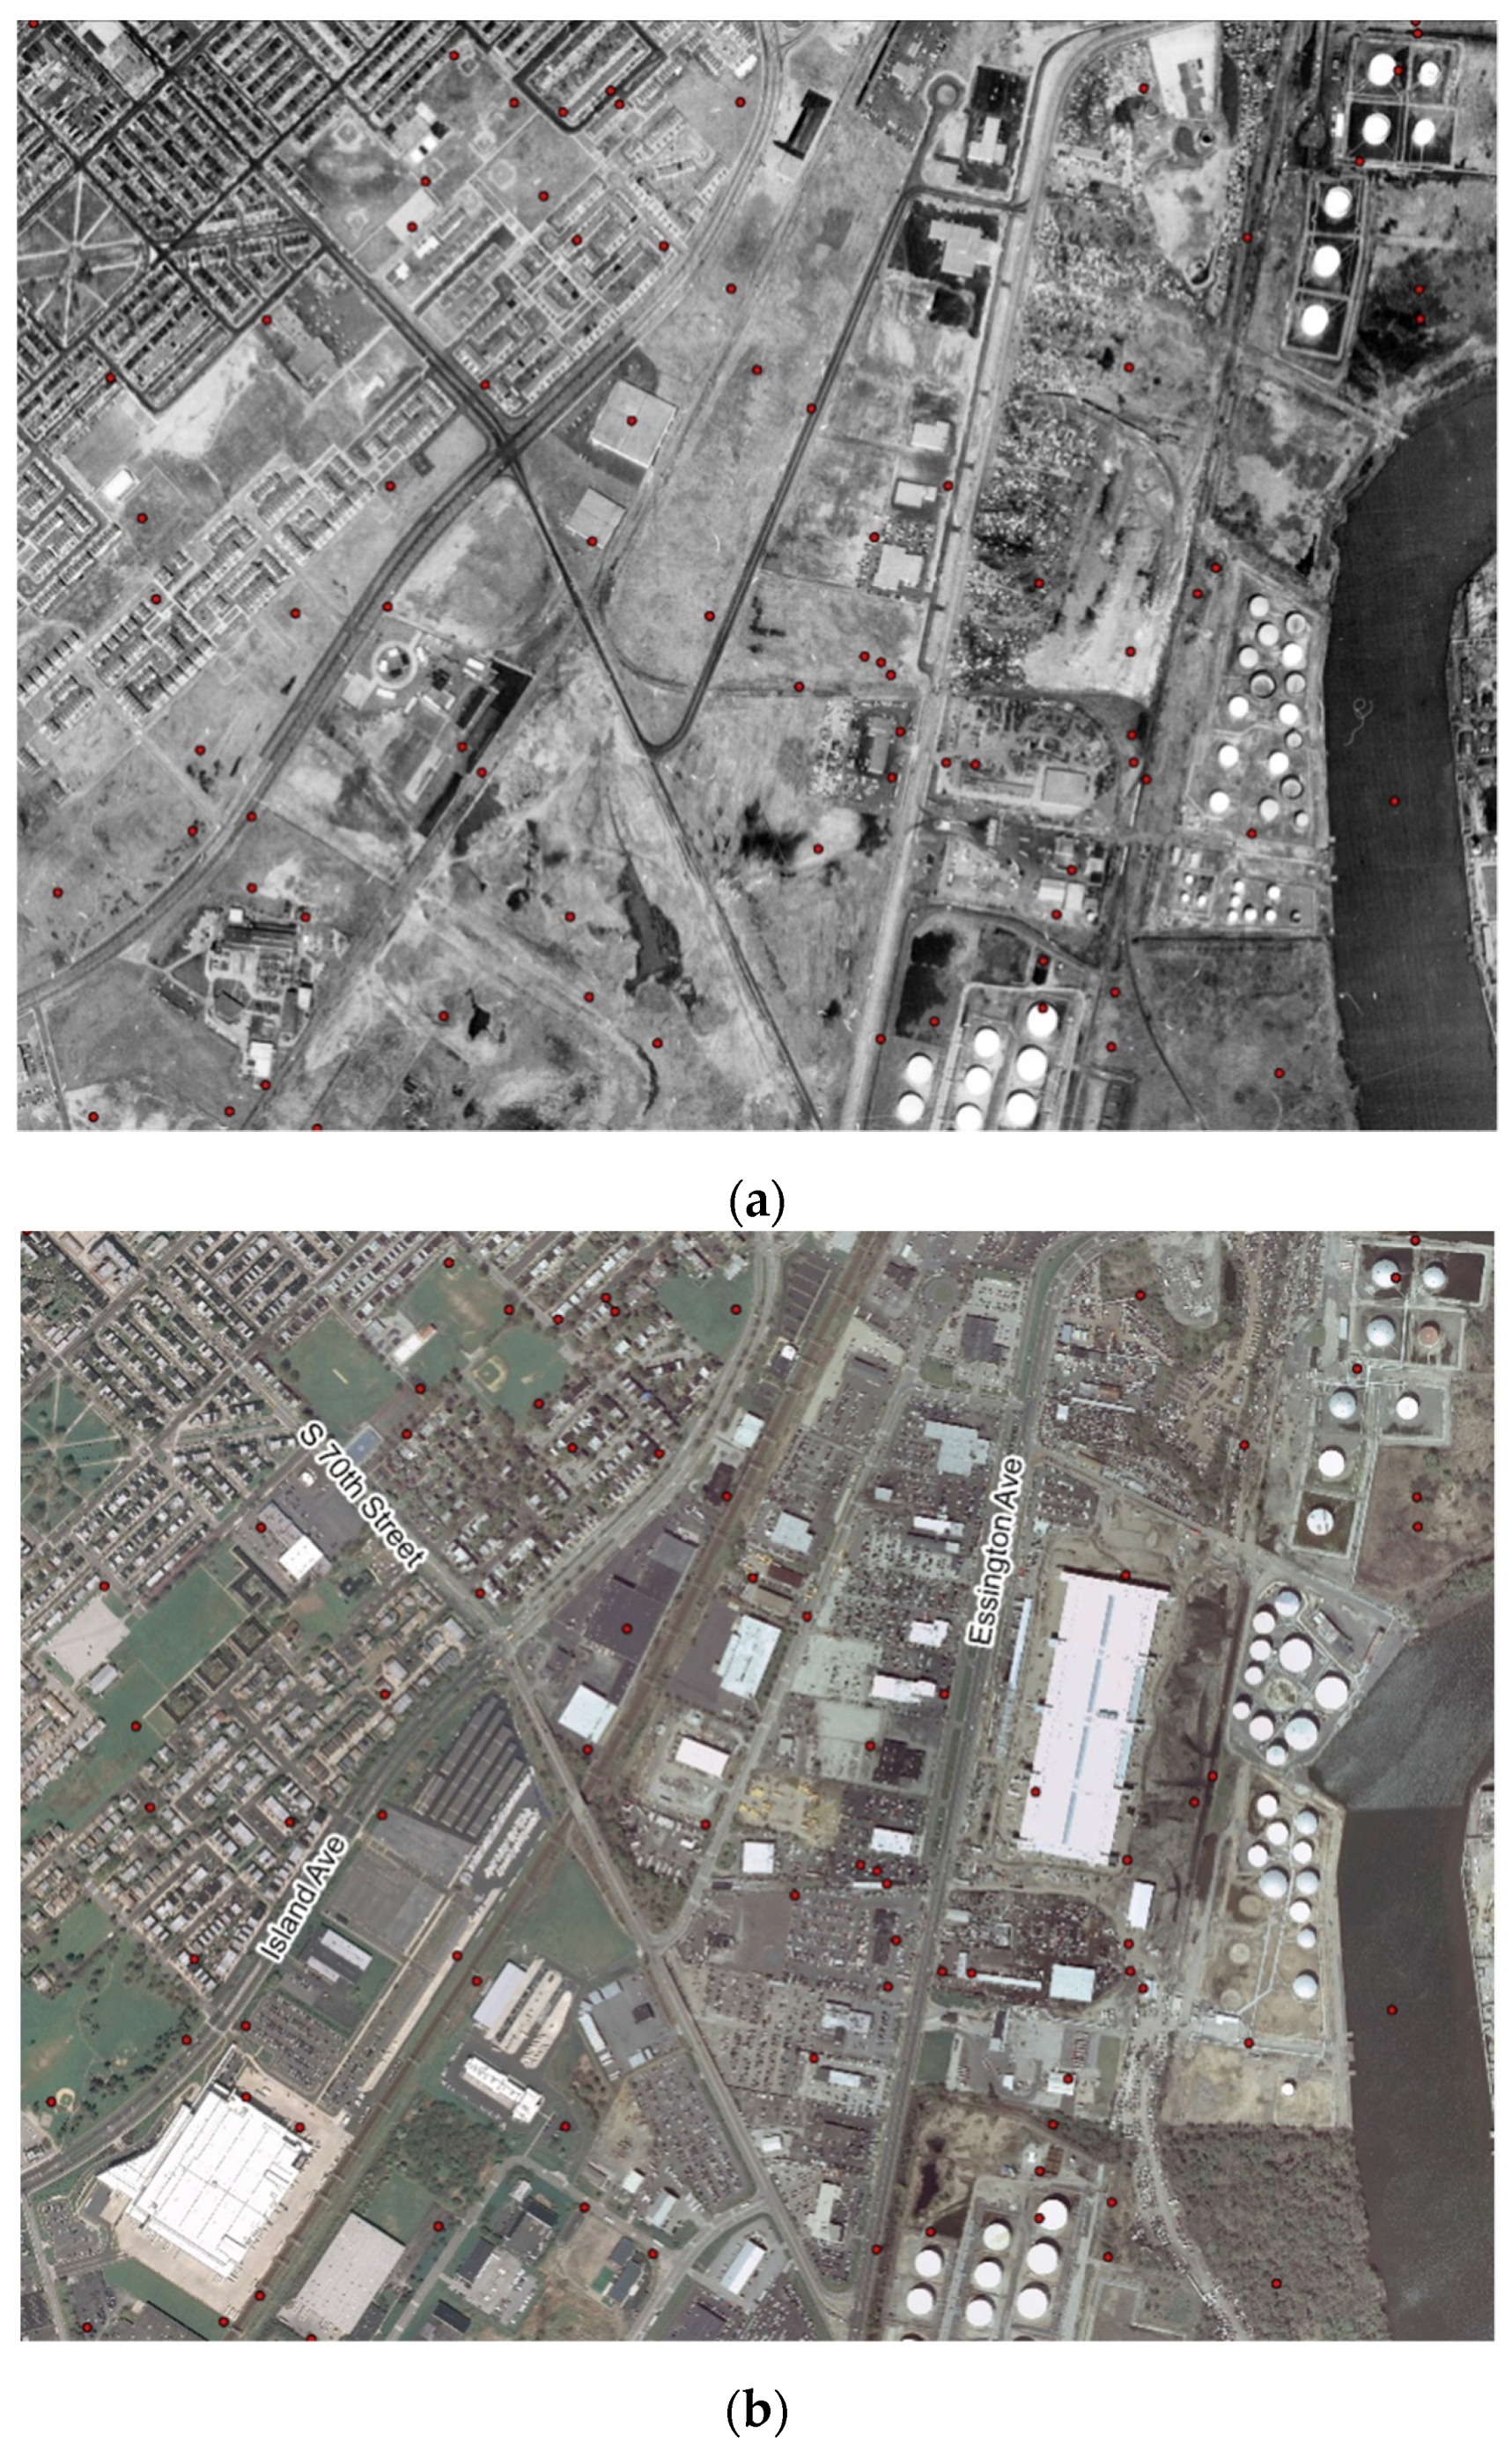
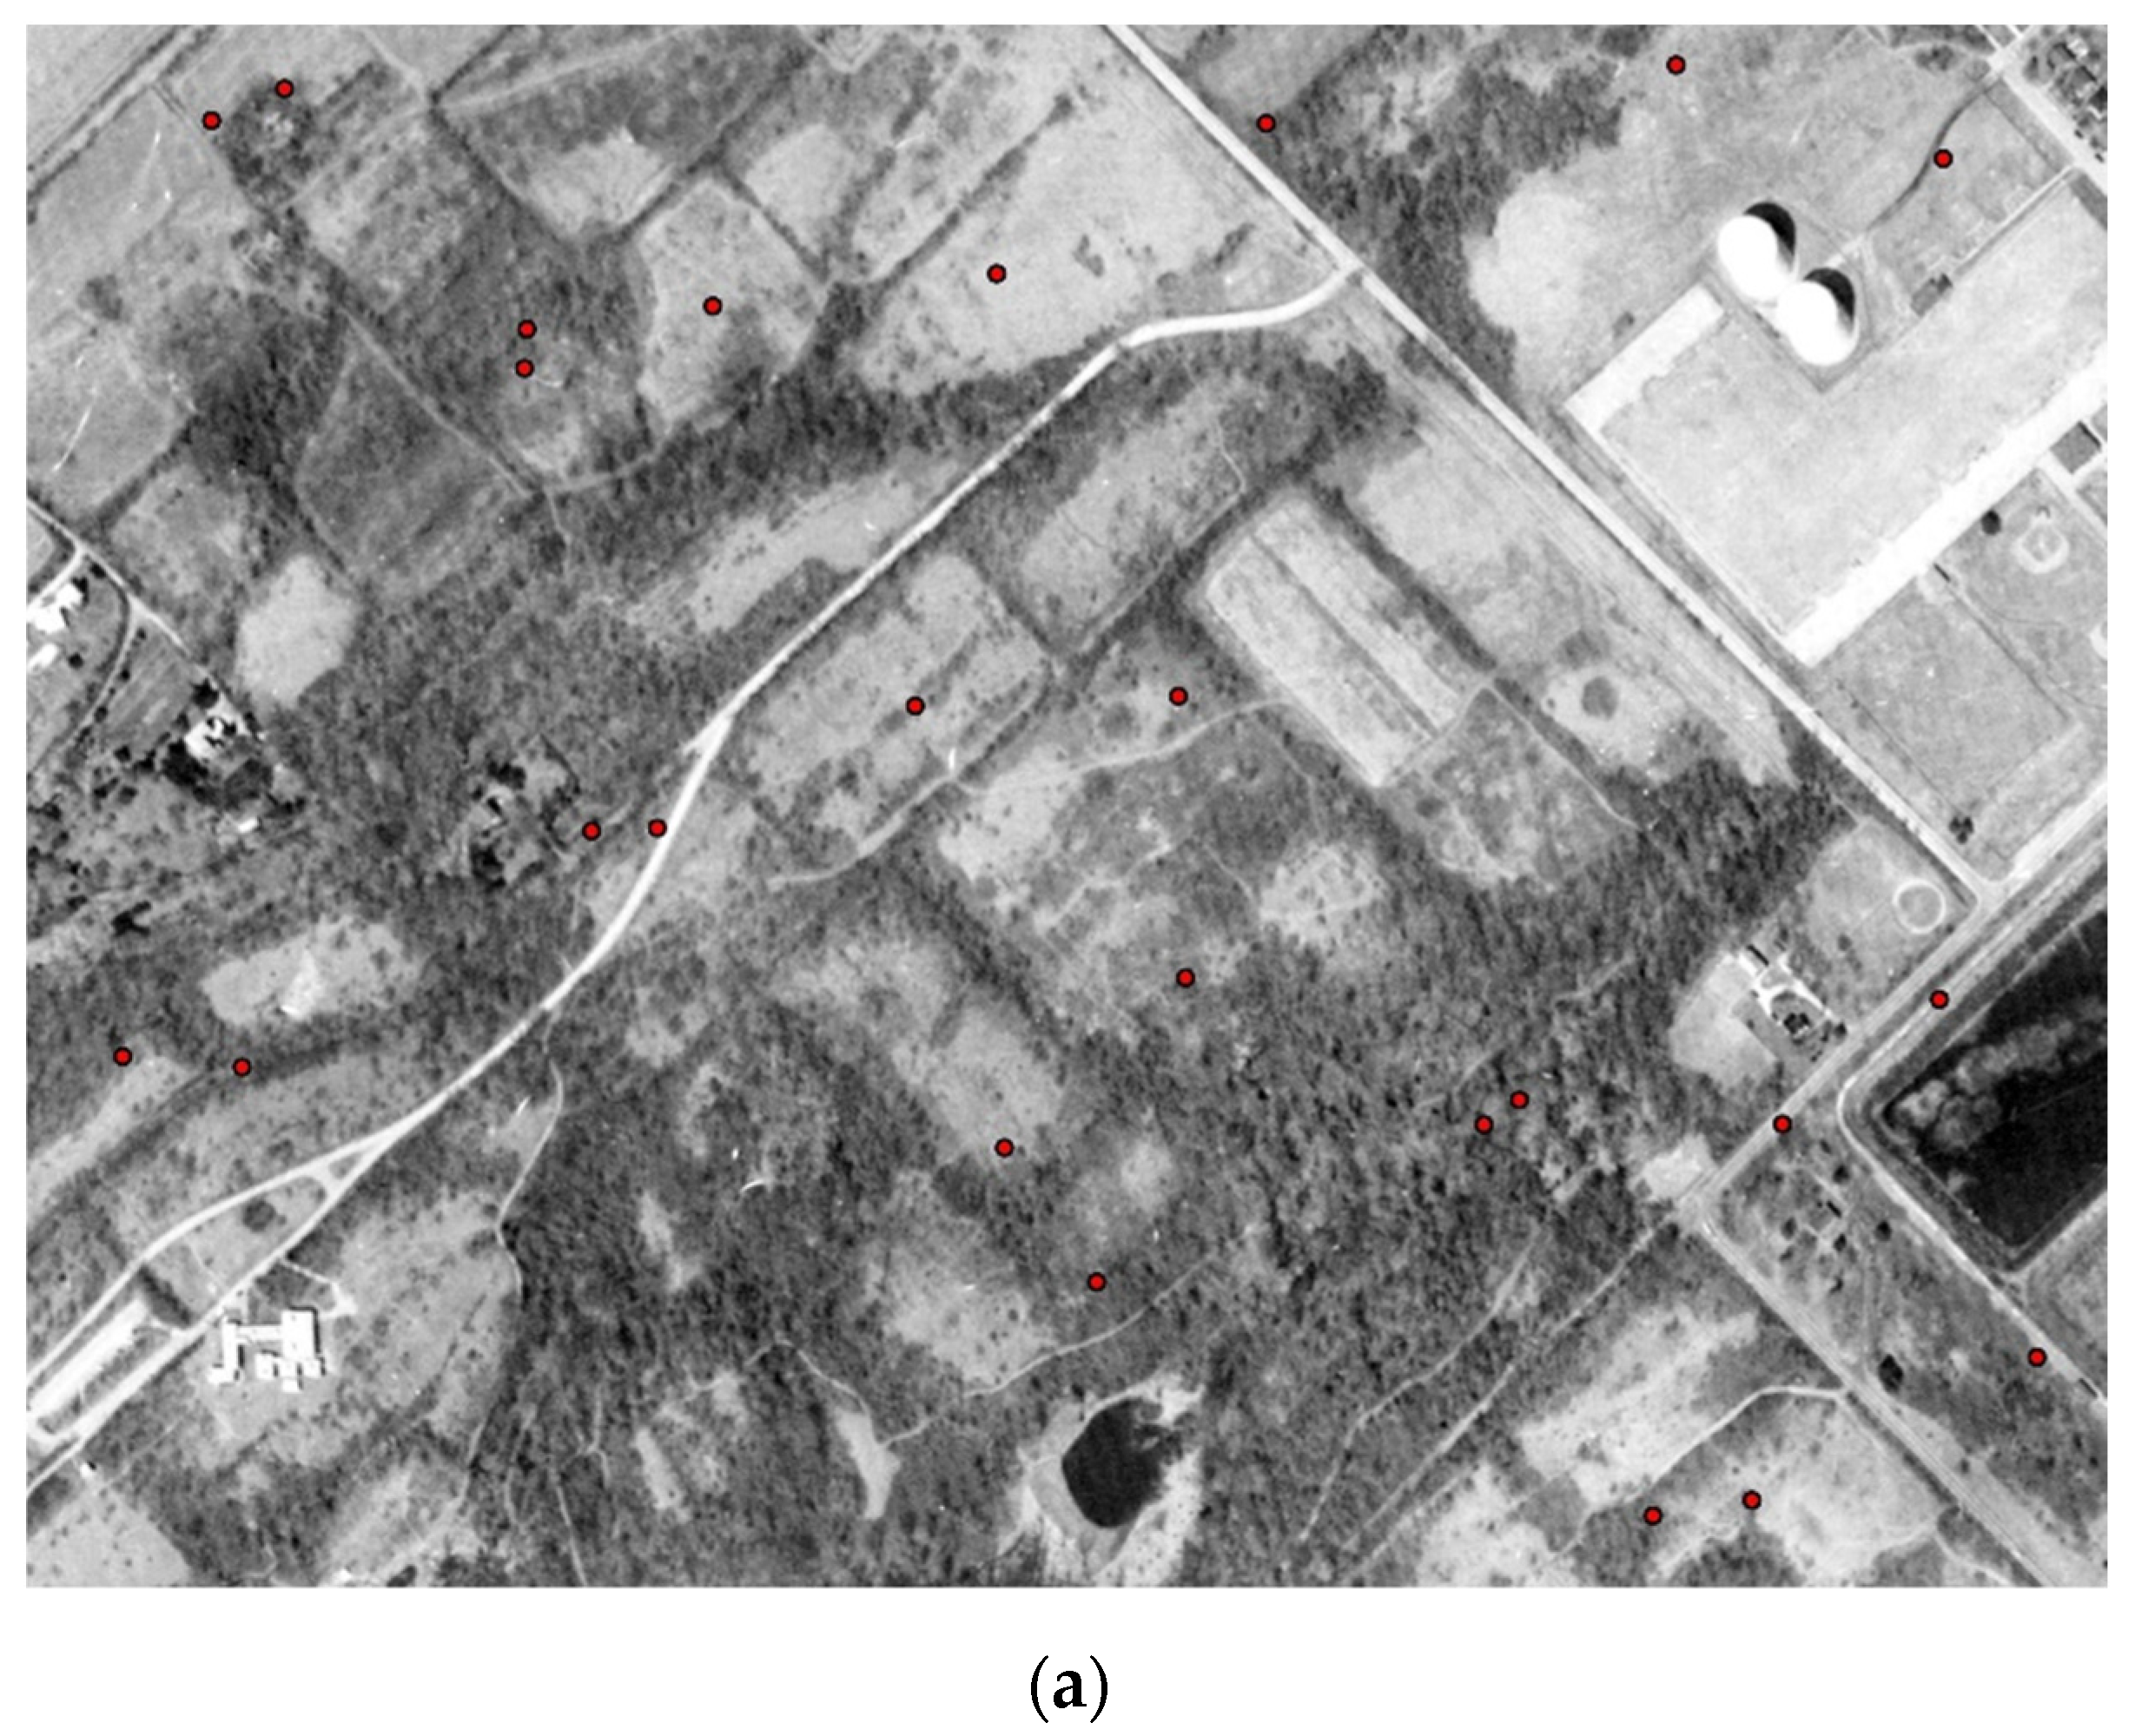
Table 1.
Aerial photos used to assess land cover. Images were obtained from the Pennsylvania Spatial Data Clearinghouse (PASDA) and the Delaware Valley Regional Planning Commission (DVRPC).
Table 1.
Aerial photos used to assess land cover. Images were obtained from the Pennsylvania Spatial Data Clearinghouse (PASDA) and the Delaware Valley Regional Planning Commission (DVRPC).
| Year | Leaf Status | Color | Pixel Size (cm) | Source |
|---|---|---|---|---|
| 1970 | Partially on | Grayscale | 61 1 | DVRPC |
| 1980 | Off | Grayscale | 61 1 | DVRPC |
| 1990 | Off | Grayscale | 61 1 | DVRPC |
| 2000 | Off | Grayscale | 46 | DVRPC |
| 2010 | Off | Color | 9.7 | PASDA |
1 Pixel sizes for older aerials are approximate.
Table 2.
Portion of city area and number of points for the geographic units used in this study. Analyses for planning districts include only developed land in each district.
Table 2.
Portion of city area and number of points for the geographic units used in this study. Analyses for planning districts include only developed land in each district.
| Geographic Unit | Portion of City Area (%) | No. Points |
|---|---|---|
| Citywide | 100.0 | 8691 |
| Protected open space | 12.0 | 1103 |
| Municipal parks | 10.8 | 986 |
| Developed land | 88.0 | 7588 |
| Planning districts 1 | ||
| Central | 4.1 | 270 |
| Central Northeast | 4.2 | 402 |
| Lower Far Northeast | 7.0 | 676 |
| Lower North | 3.5 | 297 |
| Lower Northeast | 3.9 | 371 |
| Lower Northwest | 4.5 | 427 |
| Lower South | 5.8 | 424 |
| Lower Southwest | 6.5 | 552 |
| North | 5.7 | 546 |
| North Delaware | 6.1 | 507 |
| River Wards | 5.2 | 424 |
| South | 4.3 | 344 |
| University Southwest | 3.1 | 212 |
| Upper Far Northeast | 6.8 | 666 |
| Upper North | 5.3 | 484 |
| Upper Northwest | 5.9 | 499 |
| West | 3.1 | 256 |
| West Park | 2.7 | 231 |
1 Values do not sum to 88.0% due to rounding.
Table 3.
Land cover change in Philadelphia, comparing protected open space and developed land. Statistically significant changes from 1970–2010 are noted with * (p < 0.05) and ** (p < 0.01). Detectable change over 40 years is noted in bold (±3.2 for tree cover, 4.7 herbaceous, 7.4 other pervious, 1.2 building, and 9.1 other impervious). Percent stable reflects points classified as the same cover class in all five images divided by 1970 cover. Some land cover values in a given year do not sum to 100 due to rounding. Grey shading serves only to enhance readability.
| Geographic Unit | Cover Class | Land Cover (%) | 1970–2010 Change | Stable (%) | ||||
|---|---|---|---|---|---|---|---|---|
| 1970 | 1980 | 1990 | 2000 | 2010 | ||||
| Citywide | Tree ** | 18.7 | 21.3 | 23.5 | 24.8 | 23.0 | +4.3 | 65.0 |
| Herbaceous ** | 27.6 | 23.2 | 20.3 | 18.9 | 18.5 | −9.1 | 43.2 | |
| Other pervious | 4.3 | 4.1 | 3.8 | 3.8 | 4.1 | −0.2 | 34.3 | |
| Building | 21.0 | 21.3 | 21.5 | 20.9 | 20.9 | −0.1 | 80.4 | |
| Other impervious ** | 28.4 | 30.0 | 31.0 | 31.6 | 33.6 | +5.2 | 79.0 | |
| Protected open space | Tree ** | 51.7 | 55.8 | 59.9 | 64.1 | 63.7 | +12.1 | 89.3 |
| Herbaceous ** | 36.7 | 31.6 | 28.6 | 25.2 | 24.7 | −12.0 | 50.4 | |
| Other pervious | 3.4 | 3.5 | 2.7 | 2.7 | 3.3 | −0.1 | 29.7 | |
| Building | 0.8 | 0.9 | 0.8 | 0.7 | 0.7 | −0.1 | 55.6 | |
| Other impervious | 7.4 | 8.1 | 7.9 | 7.3 | 7.6 | +0.2 | 56.1 | |
| Developed | Tree * | 14.0 | 16.3 | 18.2 | 19.1 | 17.0 | +3.0 | 51.9 |
| Herbaceous ** | 26.2 | 22.0 | 19.0 | 18.0 | 17.6 | −8.6 | 41.7 | |
| Other pervious | 4.4 | 4.2 | 3.9 | 3.9 | 4.2 | −0.2 | 34.8 | |
| Building | 23.9 | 24.3 | 24.6 | 23.8 | 23.9 | 0.0 | 80.6 | |
| Other impervious ** | 31.5 | 33.2 | 34.3 | 35.2 | 37.3 | +5.8 | 79.8 | |
Table 4.
Land cover change for planning districts in Philadelphia. Statistically significant changes from 1970–2010 are noted with * (p < 0.05) and ** (p < 0.01). Detectable change over 40 years is noted in bold (±3.2 for tree cover, 4.7 herbaceous, 7.4 other pervious, 1.2 building, and 9.1 other impervious). Some land cover values in a given year do not sum to 100 due to rounding. Grey shading serves only to enhance readability.
| District | Cover Class | Land Cover (%) | 1970–2010 Change | ||||
|---|---|---|---|---|---|---|---|
| 1970 | 1980 | 1990 | 2000 | 2010 | |||
| Central | Tree | 3.7 | 4.8 | 5.2 | 6.3 | 6.7 | +3.0 |
| Herbaceous | 7.8 | 7.8 | 5.2 | 5.9 | 4.4 | −3.4 | |
| Other pervious | 3.3 | 2.2 | 1.9 | 1.9 | 2.6 | −0.7 | |
| Building | 44.8 | 45.9 | 45.9 | 44.8 | 45.6 | +0.8 | |
| Other impervious | 40.4 | 39.3 | 41.9 | 41.1 | 40.7 | +0.3 | |
| Central Northeast | Tree | 19.2 | 21.6 | 28.4 | 25.6 | 21.1 | +1.9 |
| Herbaceous ** | 25.6 | 20.6 | 16.2 | 17.9 | 19.2 | −6.4 | |
| Other pervious | 1.0 | 1.0 | 0.0 | 0.0 | 0.0 | −1.0 | |
| Building * | 21.1 | 22.6 | 23.9 | 23.6 | 23.9 | +2.8 | |
| Other impervious * | 33.1 | 34.1 | 31.6 | 32.8 | 35.8 | +2.7 | |
| Lower Far Northeast | Tree ** | 12.6 | 14.3 | 17.6 | 20.0 | 18.0 | +5.4 |
| Herbaceous ** | 50.4 | 44.7 | 38.2 | 35.9 | 32.1 | −18.3 | |
| Other pervious | 2.1 | 1.6 | 1.8 | 1.0 | 2.2 | +0.1 | |
| Building ** | 13.2 | 15.5 | 17.3 | 17.5 | 18.3 | +5.1 | |
| Other impervious ** | 21.7 | 23.8 | 25.1 | 25.6 | 29.3 | +7.6 | |
| Lower North | Tree ** | 3.4 | 6.1 | 9.4 | 10.1 | 11.4 | +8.0 |
| Herbaceous | 8.8 | 8.4 | 8.8 | 9.4 | 10.1 | +1.3 | |
| Other pervious * | 1.0 | 2.0 | 3.4 | 3.7 | 3.4 | +2.4 | |
| Building | 49.2 | 45.1 | 41.4 | 37.7 | 36.4 | −12.8 | |
| Other impervious | 37.7 | 38.4 | 37.0 | 39.1 | 38.7 | +1.0 | |
| Lower Northeast | Tree | 12.7 | 14.8 | 16.7 | 16.2 | 12.7 | 0.0 |
| Herbaceous | 19.1 | 17.0 | 16.2 | 16.2 | 16.2 | −2.9 | |
| Other pervious | 2.7 | 1.9 | 1.3 | 1.9 | 3.0 | +0.3 | |
| Building | 28.0 | 28.3 | 27.5 | 26.4 | 27.2 | −0.8 | |
| Other impervious | 37.5 | 38.0 | 38.3 | 39.4 | 41.0 | +3.5 | |
| Lower Northwest | Tree ** | 29.3 | 35.4 | 41.0 | 43.1 | 38.6 | +9.3 |
| Herbaceous ** | 36.8 | 26.9 | 22.5 | 19.0 | 19.2 | −17.6 | |
| Other pervious | 2.6 | 3.0 | 1.6 | 1.6 | 1.6 | −1.0 | |
| Building | 12.2 | 13.3 | 13.6 | 12.9 | 13.8 | +1.6 | |
| Other impervious ** | 19.2 | 21.3 | 21.3 | 23.4 | 26.7 | +7.5 | |
| Lower South | Tree ** | 1.4 | 3.1 | 4.0 | 5.9 | 5.7 | +4.3 |
| Herbaceous ** | 25.7 | 23.6 | 21.0 | 19.6 | 19.3 | −6.4 | |
| Other pervious | 14.2 | 13.4 | 14.9 | 13.2 | 13.4 | −0.8 | |
| Building | 11.3 | 11.1 | 10.4 | 10.4 | 10.1 | −1.2 | |
| Other impervious | 47.4 | 48.8 | 49.8 | 50.9 | 51.4 | +4.0 | |
| Lower Southwest | Tree ** | 3.1 | 5.3 | 6.7 | 10.0 | 10.9 | +7.8 |
| Herbaceous ** | 55.8 | 43.7 | 38.8 | 31.0 | 27.5 | −28.3 | |
| Other pervious | 15.2 | 16.5 | 12.7 | 13.2 | 12.3 | −2.9 | |
| Building ** | 6.2 | 6.7 | 8.2 | 8.9 | 9.8 | +3.6 | |
| Other impervious ** | 19.7 | 27.9 | 33.7 | 37.0 | 39.5 | +19.8 | |
| North | Tree ** | 5.1 | 7.3 | 8.6 | 9.0 | 8.6 | +3.5 |
| Herbaceous * | 9.3 | 9.7 | 9.3 | 9.2 | 9.0 | −0.3 | |
| Other pervious | 4.6 | 3.3 | 3.8 | 3.7 | 4.8 | +0.2 | |
| Building ** | 36.8 | 36.4 | 35.5 | 34.4 | 33.2 | −3.6 | |
| Other impervious | 44.1 | 43.2 | 42.7 | 43.8 | 44.5 | +0.4 | |
| North Delaware | Tree | 14.8 | 15.0 | 15.6 | 15.2 | 12.4 | −2.4 |
| Herbaceous | 26.0 | 23.3 | 20.5 | 21.7 | 21.9 | −4.1 | |
| Other pervious | 4.1 | 4.3 | 4.7 | 4.1 | 4.5 | +0.4 | |
| Building | 20.7 | 20.9 | 22.3 | 23.1 | 22.9 | +2.2 | |
| Other impervious * | 34.3 | 36.5 | 36.9 | 35.9 | 38.3 | +4.0 | |
| River Wards | Tree ** | 1.7 | 1.4 | 2.8 | 5.4 | 5.7 | +4.0 |
| Herbaceous | 12.5 | 9.4 | 9.9 | 9.0 | 9.4 | −3.1 | |
| Other pervious | 11.1 | 9.0 | 8.5 | 9.2 | 8.3 | −2.8 | |
| Building * | 31.6 | 30.4 | 29.2 | 28.5 | 27.8 | −3.8 | |
| Other impervious * | 43.2 | 49.8 | 49.5 | 47.9 | 48.8 | +5.6 | |
| South | Tree | 2.3 | 3.2 | 4.4 | 4.4 | 2.3 | 0.0 |
| Herbaceous ** | 16.3 | 13.1 | 10.2 | 8.7 | 8.1 | −8.2 | |
| Other pervious | 2.0 | 3.5 | 2.6 | 4.1 | 3.2 | +1.2 | |
| Building | 41.0 | 40.4 | 41.0 | 36.0 | 37.5 | −3.5 | |
| Other impervious ** | 38.4 | 39.8 | 41.9 | 46.8 | 48.8 | +10.4 | |
| University Southwest | Tree | 10.8 | 14.2 | 16.0 | 17.5 | 14.2 | +3.4 |
| Herbaceous | 16.0 | 13.2 | 14.2 | 13.7 | 12.7 | −3.3 | |
| Other pervious | 4.7 | 4.7 | 4.2 | 5.2 | 5.7 | +1.0 | |
| Building | 32.1 | 29.7 | 30.7 | 30.2 | 29.2 | −2.9 | |
| Other impervious | 36.3 | 38.2 | 34.9 | 33.5 | 38.2 | +1.9 | |
| Upper Far Northeast | Tree | 21.6 | 23.9 | 25.1 | 26.6 | 22.5 | +0.9 |
| Herbaceous ** | 44.1 | 34.4 | 27.2 | 24.3 | 25.4 | −18.7 | |
| Other pervious | 2.3 | 1.5 | 1.5 | 1.5 | 1.8 | −0.5 | |
| Building ** | 12.2 | 16.1 | 17.7 | 18.0 | 18.5 | +6.3 | |
| Other impervious ** | 19.8 | 24.2 | 28.5 | 29.6 | 31.8 | +12.0 | |
| Upper North | Tree | 20.2 | 24.0 | 21.9 | 22.5 | 19.0 | −1.2 |
| Herbaceous | 15.9 | 15.1 | 14.9 | 15.5 | 14.9 | −1.0 | |
| Other pervious | 1.0 | 1.0 | 1.0 | 0.4 | 1.0 | 0.0 | |
| Building | 29.5 | 29.5 | 28.9 | 27.3 | 27.9 | −1.6 | |
| Other impervious * | 33.3 | 30.4 | 33.3 | 34.3 | 37.2 | +3.9 | |
| Upper Northwest | Tree | 41.3 | 45.9 | 47.5 | 48.3 | 45.1 | +3.8 |
| Herbaceous ** | 19.2 | 14.8 | 12.4 | 12.8 | 13.8 | −5.4 | |
| Other pervious | 1.0 | 0.4 | 0.4 | 0.4 | 1.0 | 0.0 | |
| Building | 21.0 | 21.0 | 20.8 | 19.6 | 19.0 | −2.0 | |
| Other impervious * | 17.4 | 17.8 | 18.8 | 18.8 | 21.0 | +3.6 | |
| West | Tree | 15.2 | 19.1 | 20.7 | 19.5 | 17.2 | +2.0 |
| Herbaceous | 6.6 | 5.9 | 5.5 | 6.6 | 6.3 | −0.3 | |
| Other pervious * | 0.4 | 0.8 | 1.2 | 2.0 | 2.7 | +2.3 | |
| Building ** | 42.2 | 40.2 | 39.1 | 38.7 | 36.7 | −5.5 | |
| Other impervious | 35.5 | 34.0 | 33.6 | 33.2 | 37.1 | +1.6 | |
| West Park | Tree | 23.4 | 26.0 | 26.8 | 26.8 | 23.4 | 0.0 |
| Herbaceous | 19.0 | 17.7 | 13.4 | 15.2 | 16.9 | −2.1 | |
| Other pervious | 2.2 | 1.7 | 2.6 | 3.9 | 3.5 | +1.3 | |
| Building | 22.1 | 22.1 | 23.8 | 22.1 | 22.1 | 0.0 | |
| Other impervious | 33.3 | 32.5 | 33.3 | 32.0 | 34.2 | +0.9 | |
Table 5.
Processes leading to increased tree cover in post-industrial Philadelphia.
| Process | Geographic Areas | Principle Actors | Specific Mechanisms Leading to Increased Tree Cover |
|---|---|---|---|
| Urban renewal | Lower North; Lower Southwest | Municipal redevelopment authority; City planning agency; Municipal industrial development corporation | Demolition resulting in persistent vacant lots; Overgrown vegetation and emergent forests in unmaintained vacant lands; Tree planting in redevelopment projects |
| Urban greening initiatives | Lower North; Lower Northwest; Protected Open Space | Urban greening non-profits; Residents | Street tree planting, vacant lot greening, and community gardens as civic environmental stewardship in distressed neighborhoods; Tree planting by non-profits in public parks |
| Quasi-suburban developments | Lower Far Northeast; Lower Southwest; Lower Northwest | City planning agency; Real estate developers; Residents | Street and yard planting by developers and residents in new housing developments; Relatively larger parcels with yard space allowed room for trees |
| (Dis)investment in parks | Protected Open Space | Urban park advocates; Urban greening non-profits; Municipal, state, and federal parks departments | During periods of declining municipal park budgets, reduced mowing resulted in emergent forests; New parks established and stewarded by non-profit, state, and federal actors with support from local advocates |
Publisher’s Note: MDPI stays neutral with regard to jurisdictional claims in published maps and institutional affiliations. |
© 2021 by the authors. Licensee MDPI, Basel, Switzerland. This article is an open access article distributed under the terms and conditions of the Creative Commons Attribution (CC BY) license (https://creativecommons.org/licenses/by/4.0/).
Share and Cite
MDPI and ACS Style
Roman, L.A.; Catton, I.J.; Greenfield, E.J.; Pearsall, H.; Eisenman, T.S.; Henning, J.G. Linking Urban Tree Cover Change and Local History in a Post-Industrial City. Land 2021, 10, 403. https://doi.org/10.3390/land10040403
AMA Style
Roman LA, Catton IJ, Greenfield EJ, Pearsall H, Eisenman TS, Henning JG. Linking Urban Tree Cover Change and Local History in a Post-Industrial City. Land. 2021; 10(4):403. https://doi.org/10.3390/land10040403
Chicago/Turabian StyleRoman, Lara A., Indigo J. Catton, Eric J. Greenfield, Hamil Pearsall, Theodore S. Eisenman, and Jason G. Henning. 2021. "Linking Urban Tree Cover Change and Local History in a Post-Industrial City" Land 10, no. 4: 403. https://doi.org/10.3390/land10040403
Note that from the first issue of 2016, this journal uses article numbers instead of page numbers. See further details here.