Flood Hazard Mapping of a Rapidly Urbanizing City in the Foothills (Birendranagar, Surkhet) of Nepal


1
Faculty of Humanities and Social Science, Mahendra Ratna Multiple Campus, Ilam 57300, Nepal
2
The State Key Laboratory of Remote Sensing Science, Institute of Remote Sensing and Digital Earth, Chinese Academy of Sciences (CAS), Beijing 100101, China
3
College of Applied Sciences (CAS)-Nepal, Thapathali, Tribhuvan University, Kathmandu 44613, Nepal
4
College of Science and Engineering, Center for Tropical Environmental and Sustainability Science, James Cook University, Cairns QLD 4870, Australia
*
Author to whom correspondence should be addressed.
Land 2018, 7(2), 60; https://doi.org/10.3390/land7020060
Submission received: 26 March 2018
/
Revised: 3 May 2018
/
Accepted: 3 May 2018
/
Published: 5 May 2018
(This article belongs to the Special Issue Land Use Planning for Natural Hazards)
Abstract
:Flooding in the rapidly urbanizing city of Birendranagar, Nepal has been intensifying, culminating in massive loss of life and property during July and August 2014. No previous studies have monitored underlying land-cover dynamics and flood hazards for the area. This study described spatiotemporal urbanization dynamics and associated land-use/land-cover (LULC) changes of the city using Landsat imagery classifications for five periods between 1989 and 2016 (1989–1996, 1996–2001, 2001–2011, 2011–2016). Areas with high flood-hazard risk were also identified on the basis of field surveys, literature, and the Landsat analysis. The major LULC changes observed were the rapid expansion of urban cover and the gradual decline of cultivated lands. The urban area expanded nearly by 700%, from 85 ha in 1989 to 656 ha in 2016, with an average annual growth rate of 23.99%. Cultivated land declined simultaneously by 12%, from 7005 ha to 6205 ha. The loss of forest cover also contributed significantly to increased flood hazard. Steep topography, excessive land utilization, fragile physiographic structure, and intense monsoonal precipitation aggravate hazards locally. As in Nepal generally, the sustainable development of the Birendranagar area has been jeopardized by a disregard for integrated flood-hazard mapping, accounting for historical land-cover changes. This study provides essential input information for improved urban-area planning in this regard.
1. Introduction
Hazards, defined as natural or human-induced activities that elevate the probability of material, social, or natural loss [1], are typified by the nexus of uncontrolled urbanization in contexts susceptible to natural flood, landslides, and earthquakes in Nepal. Here, urbanization is understood as processes leading toward increased population density, socioeconomic activities, and expanded built up areas and associated infrastructures [2]. Natural hazards and urbanization can interact to amplify land-use change, such as that negatively affecting agricultural areas [3,4]. In hazardous areas, including newly formed urban areas, land management and planning that would enhance resilience depend therefore on an understanding of those land-use/land-cover change (LULC) patterns that accentuate latent hazards [5].
Floods are the most common and devastating natural hazards [6] on a global scale and have been increasingly frequent and devastating since the mid-20th century [4]. Of all flood events recorded between 1950 and 2011, most have occurred during recent decades. Some 2% occurred during the 1950s, rising rapidly each decade thereafter to 3.9%, 6.6%, 13.2%, 21.9%, and 52.2% for the 1960s, 1970s, 1980s, 1990s, and 2000s, respectively [7]. Flood events also accounted more than two-third of all hydrological disasters during 2012–2014 [8] and 90.9% during 2015–2016 [9]. Flood hazards are global occurrences, yet associated economic damage and fatalities concentrate disproportionately among the continents [7]. Due to favorable geomorphological, metrological, and anthropogenic factors [10], more than 60% of the total economic and human losses during the period 1950 to 2011 were concentrated in Asia [7]. South Asia accounts for 33% of all Asian floods, 50% of associated fatalities, and 38% of the effected regions. As a proportion of South Asian totals, Nepal accounts for 7.2% of fatalities, 7.4% of the total victims, and 3.1% of economic losses, thereby ranking the country after India, Bangladesh, Pakistan, and Afghanistan [11]—8th globally in terms of flood fatalities [12] and 30th globally in terms of flood-hazard risk [13]. Of the five million Nepalese effected by natural hazards between 1971 and 2007, 68% were flood-related [14]. Between 1982 and 2014, nearly 9000 Nepalese lost their lives in flood and landslide events [15,16]. The Koshi flood event during 2008 affected 65,000 people and 700 ha of fertile land in the eastern lowland Tarai region [17]. In August 2017, floods affected 35 districts and destroyed 190,000 homes, fully or partially, with total economic losses estimated at $584.7 million [18]. While flooding in Nepal is triggered by monsoonal rainfall, steep and erosive topography, and wide catchments [4,19], its frequency and intensity increased largely due to increasing anthropogenic factors, namely, improper land-use, poorly-planned urbanization, deforestation, and settlements along river banks [20].
The study area, Birendranagar city of Nepal’s Surkhet district, is rapidly urbanizing due to high rates of migration. Locals have migrated to the city in the quest of better quality of life and opportunities in the formal and informal markets [21], resulting in a 720% urban population growth rate for the period 1982–2015 (Table 1). It is a major socioeconomic hub and administrative center and an important gateway to Karnali zone, as well as a migrant-receiving area, mainly from the Dailekh district and the Karnali zone. Urban development has been haphazard due to deficient urban plans/policies and weak implementation. New and expanding urban settlements are characterized as spatially dispersed or discontiguous, and frequently arise over prime farm lands surrounding historic Birendranagar city. These urban areas, collectively defining Birendranagar city, are frequently devastated by annual flood events affecting transportation networks, and other infrastructure (e.g., bridges, markets), livelihoods, fatalities (numbering 38 in 2014 [16]), and soil erosion and transport to neighboring districts (27,092.94 Mt) of soil annually [22]. Despite their frequency, or perhaps because of their frequency, such events struggle to sustain the attention of policymakers [4]. Resilience is a vital tool with which to reduce the vulnerability [23]; however, the integration of flood-hazard risk management in regional plans and policies is hindered due to the lack of routine-based researches. Urban planning and flood hazard management to address these issues is inadequate, in part due to the lack of reliable, updated spatial databases.
To this end, this study uses remote sensing and GIS techniques to observe LULC changes and identify flood-risk hazards underlying the urbanization of Birendranagar city. This research will remain as an important benchmark for Nepalese planners/policymakers and land-change researchers, since its insights and outputs may serve as essential inputs for sustainable land-use plans and strategies for flood-hazard mitigation.
2. Method
2.1. Study Area
Nepal, like the focal region of this study, is increasingly urban. Nationally, the urban population grew from 2.9% of the general population in 1952/54 to 17.1% in 2011 [24] to more than 50% by 2017 [25]. Urban centers similarly increased in number from 10 to 58 over this period, and to 292 following after the local level reconstruction in 2017. Urbanization has been driven largely by internal migration, in turn sustained by regionally unequal development and economic opportunities [21,26]. Nepal experienced decade long political armed conflict during 1996–2006 [27,28], which displaced or otherwise spurred the migration of rural dwellers to growing cities in search of security. As the conflict subsided by 2006, several development activities were advanced throughout the country [29], again concentrating largely in select urban areas. Coincidentally, a peri-urban land market boom resulted in rapid, disorganized settlement expansion at the expense of arable lands [21,29].
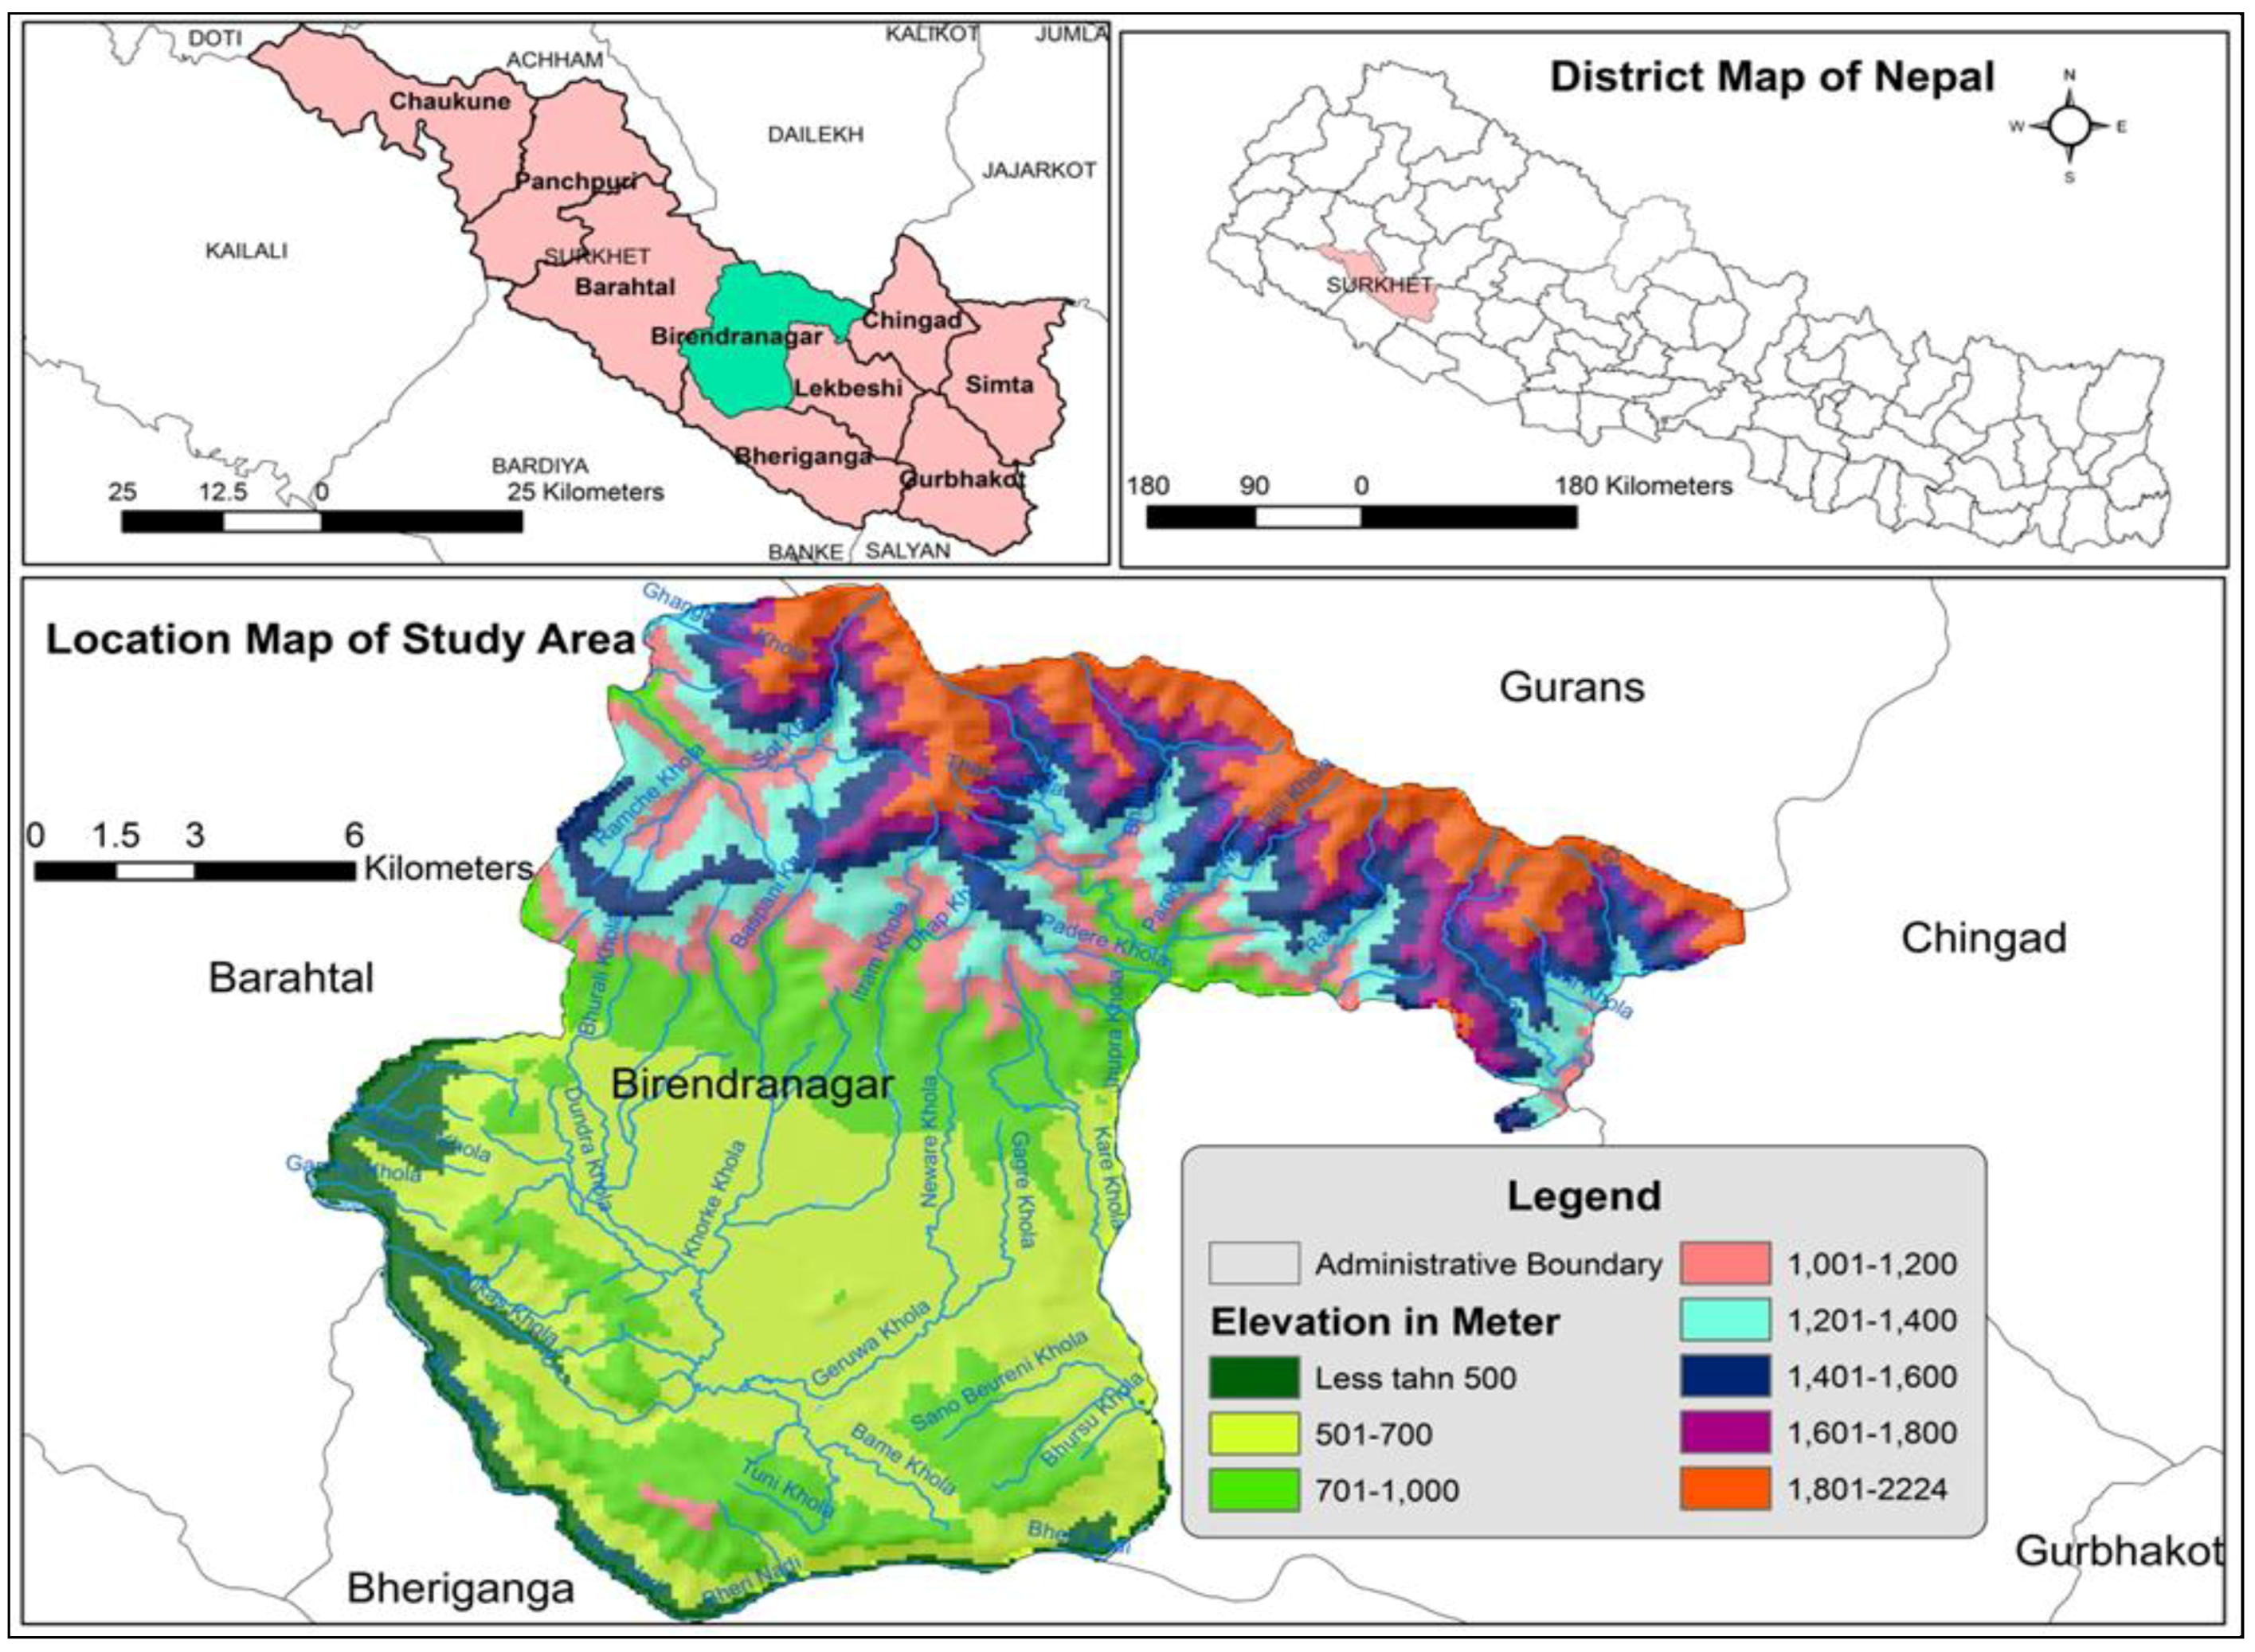
The study area, Birendranagar city is the capital city of Karnali Province (Figure 1). After the reclassification of local administrative units as mandated by the New Constitution of Nepal, 2015, the former Village Development Committees (VDCs) were consolidated as Birendranagar city. This city spans 24,582 ha area and is divided amongst 16 wards housing 100,458 residents as of 2015 (Table 1) [24].
The Birendranagar city spans Nepal’s sub-Himalayan and lesser-Himalayan zones, which are characterized by a warm-moist temperate, hot-dry sub-tropical, warm-dry sub-tropical, and cool-moist temperate climates, with annual temperatures ranging from 10 °C to 30 °C [22]. Elevation ranges from 380 to 2224 MASL. Birendranagar city receives intensive monsoonal precipitation, mainly between June and September, causing flooding and soil erosion, including along river banks. The study region is composed of fluvio-lacustrine sediments (sand, silt, clay, cobbles, and pebbles) deposited from the northern and southern parts of Siwalik Hills. Hard rocks in the region are comprised of sedimentary, meta-sedimentary, and metamorphic rock.
2.2. Extraction of LULC Change
Remote Sensing (RS) and Geographic information System (GIS) are successfully applied in various fields. They are effectively used for the LULC analyses [4,30,31,32,33,34], and flood area mapping. Multi-temporal time series of Landsat images [35] is capable of exploring accurate [36] LULC dynamics in specific time and space [21].
A city level land-use/land-cover (LULC) change analysis was realized by classifying time-series Landsat satellite imagery for 1989, 1996, 2001, 2006, 2011, and 2016. Atmospherically-corrected and maximal cloud-free Landsat images were sourced from United States Geological Survey (USGS) data portal (https://earthexplorer.usgs.gov). All scenes were verified for geometric accuracy, and data were projected on to UTM 44N (WGS 1984). For land-cover classification, six images with path/row 144/40 were selected for analysis. A “region of interest” (ROI) boundary representing municipality level study area was delineated for the classification. ENVI software was used to stack, subset, and classify the Landsat images via a maximum-likelihood (ML) algorithm [21,37,38]. A supervised approach with the ML-classifier algorithm was applied for the extraction of LULC. The land-cover classification system as recommended by Anderson et al. 1976 [39] was taken into consideration to classify the LULC and mainly seven LULC classes: urban/built-up, cultivated land, forest, shrub, sand, water, and others were identified (Table 2). Google Earth images (http://earth.google.com) and topographical maps from Survey Department, Government of Nepal (scale 1: 50,000) [40] were used to verify the LULC results. LULC transitions between each observation year were assessed using land change modeler (LCM) of TerrSet software developed by Clark Lab (www.clarklabs.org). Socioeconomic information on the drivers of urbanization were obtained from Central Bureau of Statistics [24] and use of Surkhet district profile [22].
2.3. Identification of Flood Hazards
Areas of relatively acute flood hazard were further identified through field verification and informal surveys of local people during a field visit in 2014. High-hazard areas were geo-located using a GPS, and post-hazard observations were realized using high-resolution images of Google Earth. Contextual information was derived from the disaster reports of the National Planning Commission (NPC) [41] and the Ministry of Home Affairs (MoHA) [13,18], with additional information were garnered from the District Development Committee (DDC) [22]. Precipitation data for Birendranagar station were sourced from Department of Hydrology and Meteorology [42].
2.4. Urban/Built-Up Area Expansion Rate
Total urban area was estimated each observation year to measure the rate of urban expansion [21,37]. The rate of urban expansion describes the average annual growth of urban area during a given period, thus
in which BER implies the urban expansion rate (ha/year), and B1, B2 refers to the urban area (ha) between times T1, T2 in years.
2.5. Classiifcation Accuracy Assessment
The verification of each Landsat classifications was realized with reference to high-resolution satellite imagery in Google Earth (http://earth.google.com), 1:50,000 scale topographical maps from the Nepalese Survey Department [40], and GPS points collected during the field visit, with the mixture of these reference data varying by classification year. Over the all-time periods of 1989–2016, some 350 sample points were interpreted across the city. Points were distributed via stratified random sampling method, with at least 50 points for each land-use/cover class. The overall accuracy, user’s accuracies, and producer’s accuracies were obtained for each observation year [21].
3. Result and Discussion
3.1. Land-Use Land-Cover Change between 1989 and 2016
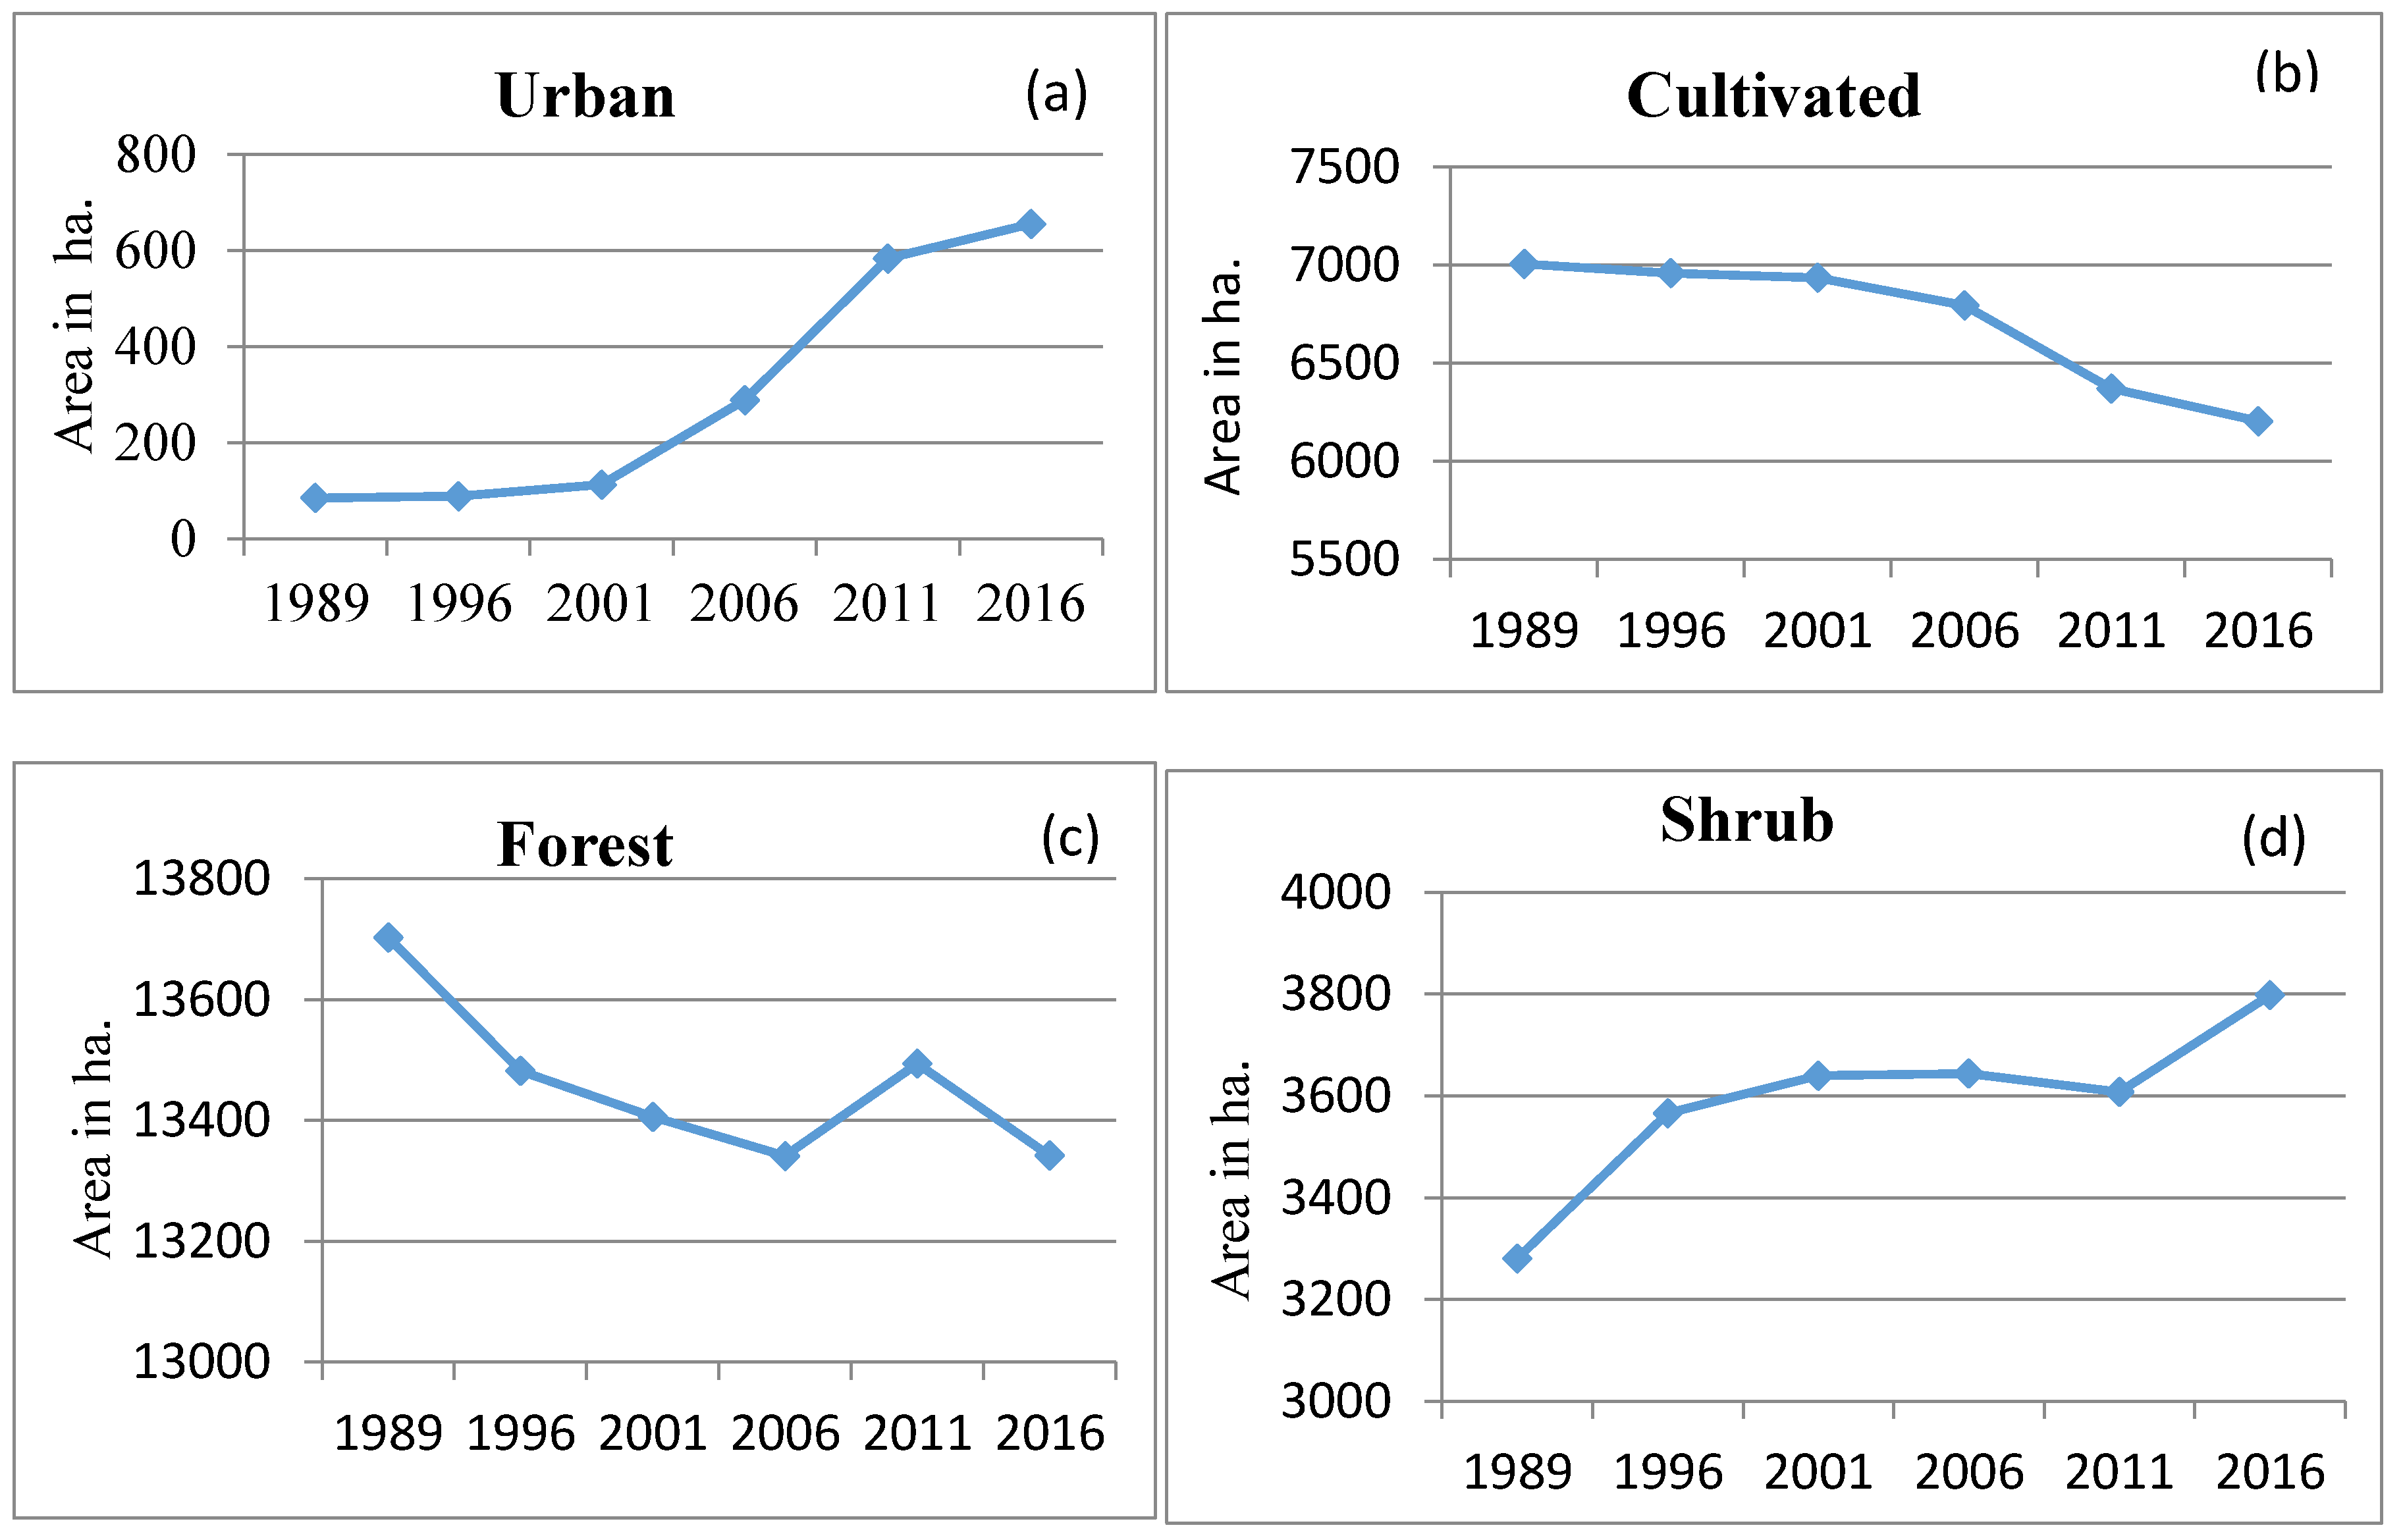
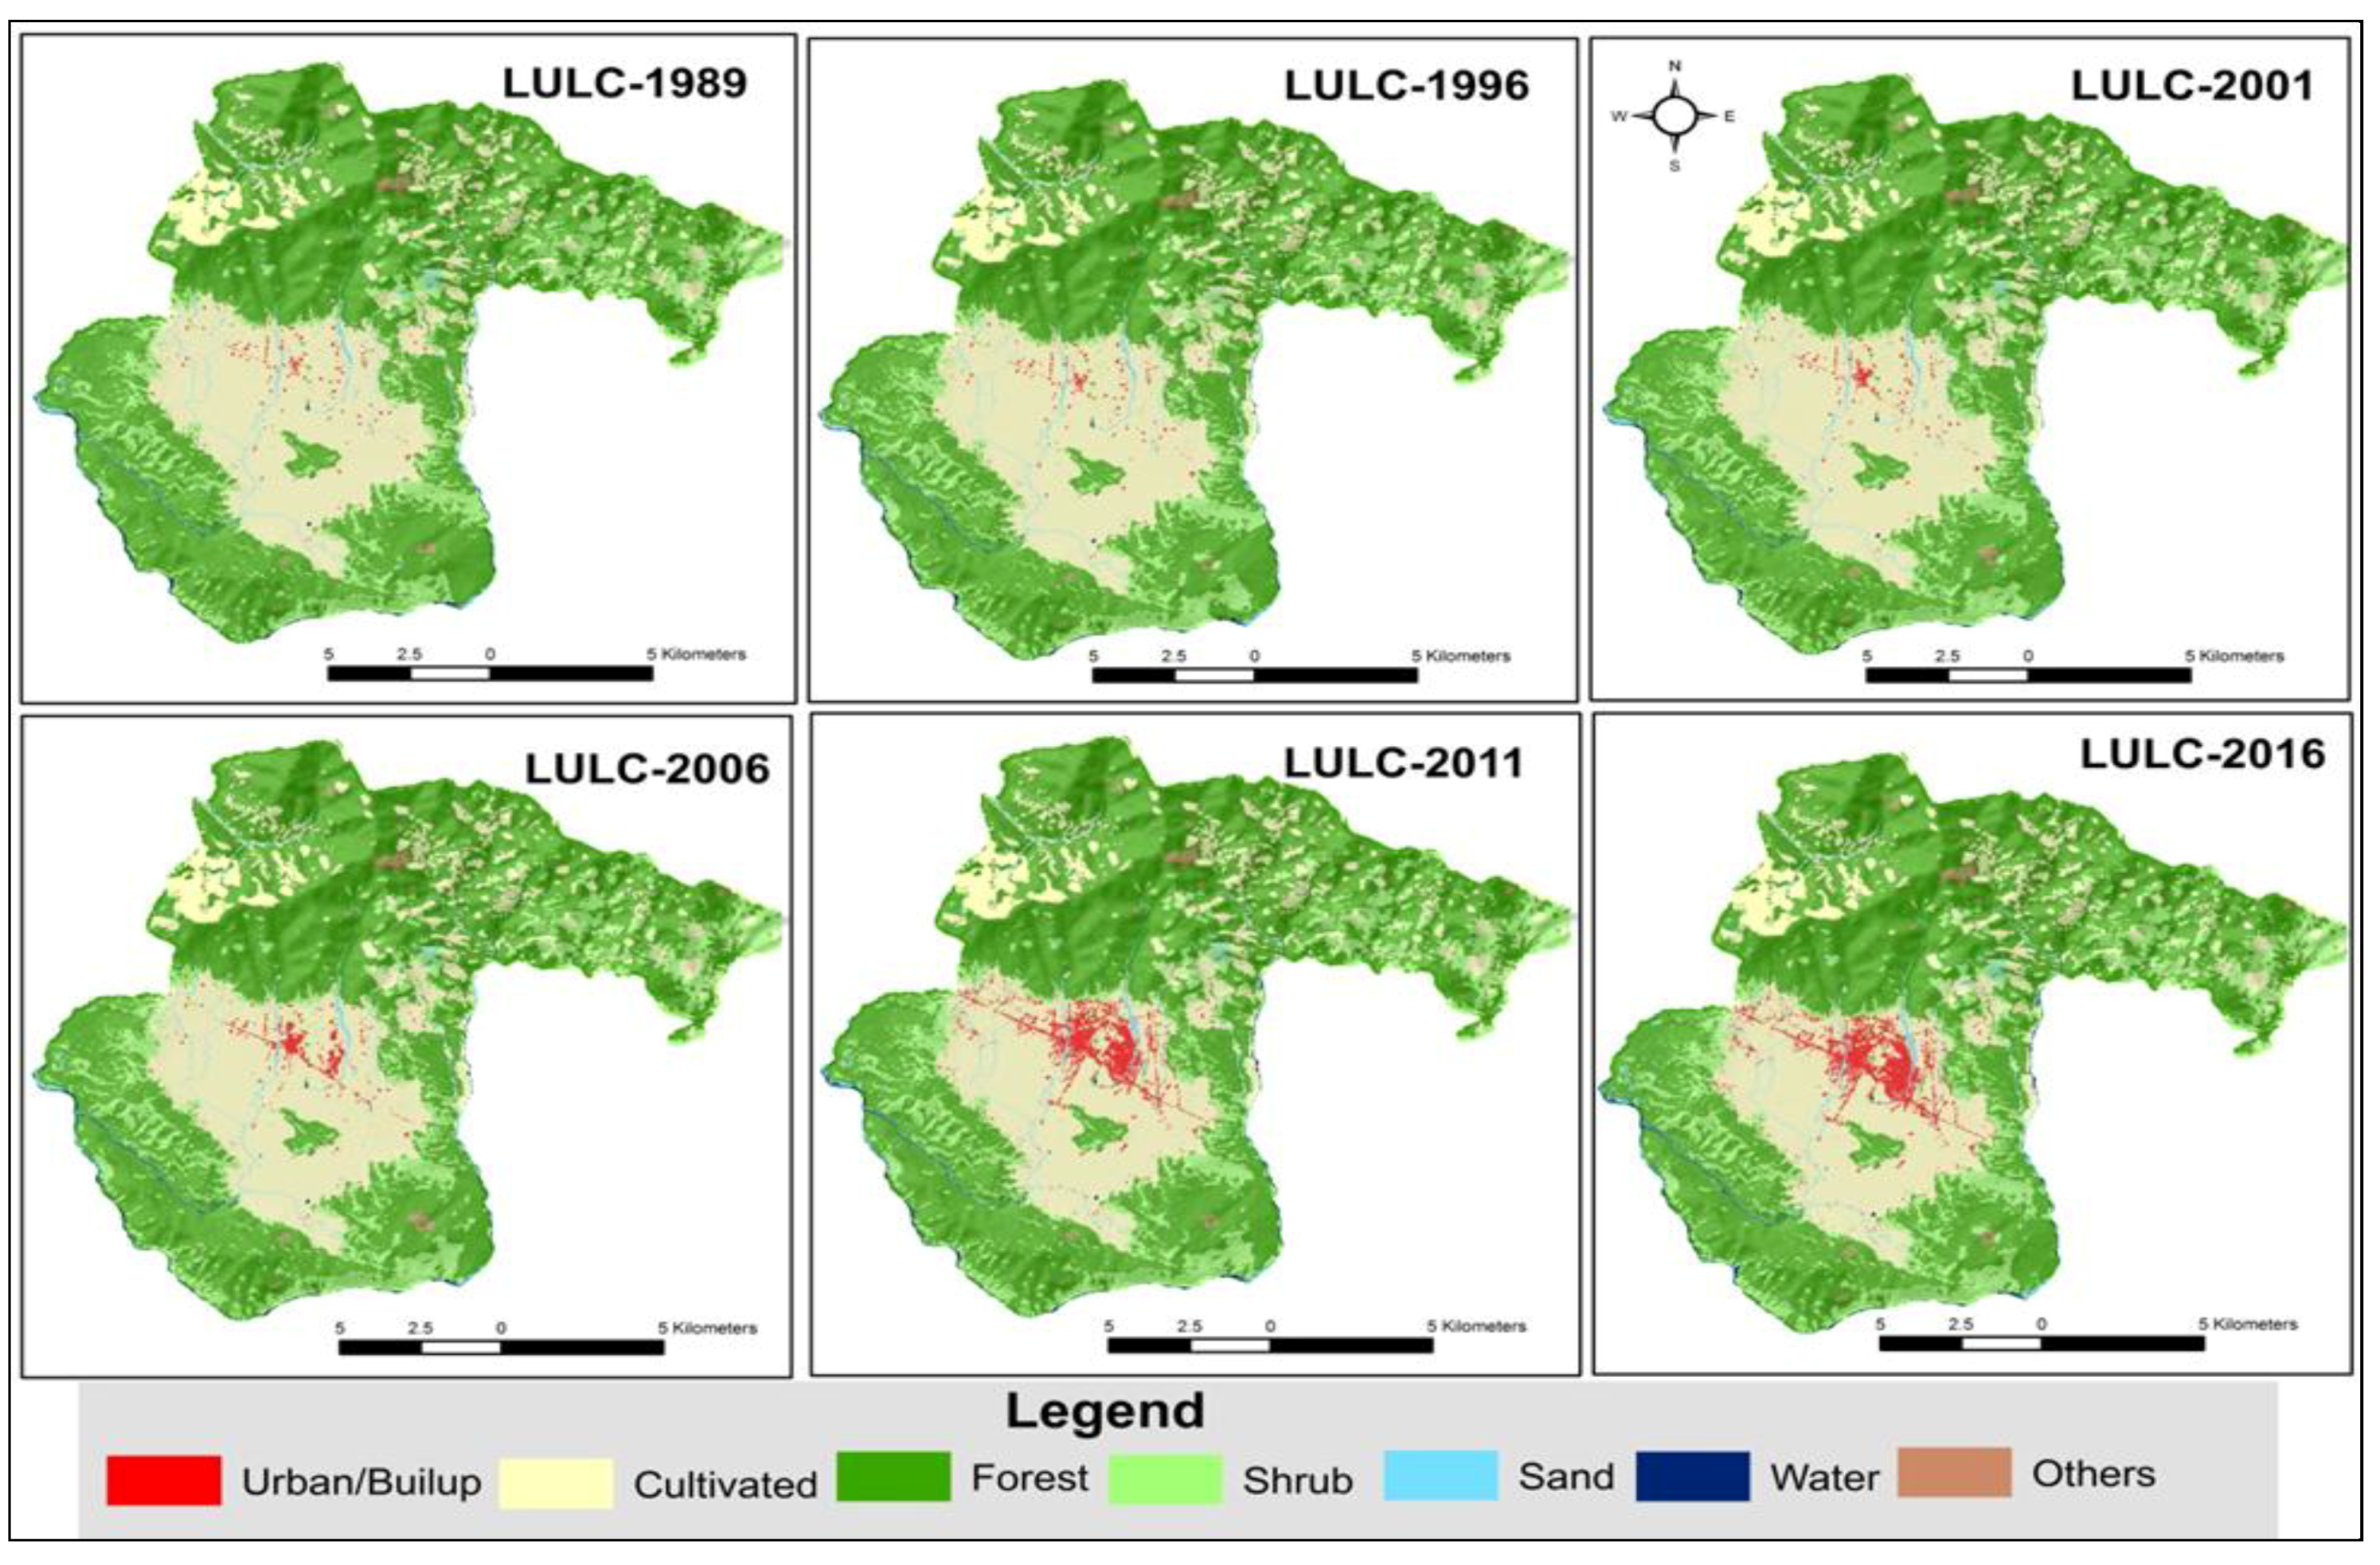
The overall accuracies obtained for respective years were 83%, 82%, 85%, 85%, 84%, and 86% in the city. Over the 27 years of observation, the predominant LULC changes were (a) the rapid increase in urban cover after 2001, and more gradual increase in shrub lands; (b) the simultaneous losses of cultivated lands, as well as the steady but lesser decline in forest cover (Table 3, Figure 2 and Figure 3).
During 1989–2016, urban area increased 571 ha, from 85 ha to 656 ha, with an average annual growth rate of 23.99% (Figure 2). Virtually all urban growth occurred after 2001; urban area was steady until 2001, but more than doubled between 2001 and 2006, from 113 ha to 289 ha. The decrease in cultivated lands paralleled this growth of urban areas in both timing and areas (Figure 2). Cultivated lands have declined 800 ha since 1989, from 7005 ha to 6205 ha. The increases in sandy areas and water after 2011 are mainly associated with the major flood events during 2013 and 2014.
Cultivated land was the major source of the newly expanded urban area. During 1989–1996, with the annual urban growth rate of 0.67%, urban area increased slightly by 4 ha, of which 75% (3 ha) was previously cultivated land. Subsequently, during the period 1996–2001, 24 ha new urban area was established (5.4% growth rate), 98% of which was cultivated previously (Figure 3). Between 2001 and 2006, all 176 ha of new urban cover occurred over cultivated lands (31% growth rate). The period 2006–2011 experienced unprecedented 295 ha of urban growth (20% growth rate, with 97% sourced from cultivated). This conversion rate continued for the last period, 2011–2016, despite its urban growth rate dropping to only 72 ha (2.5%).
Similar to the replacement of cultivated lands by expanding urban areas, forests have been steadily replaced by expanding shrub lands as economic development proceeded, aggravating flood hazard. The inflow of migrants to Birendranagar city and encroachments upon forest areas accelerated after the eradication program of malaria regionally in 1958. Forests were felled to supply resources for the development of Indian railway line, and subsequent development activities widely provoked deforestation and forest degeneration [43]. Also, devastating practices of deforestation under the Rana regime (1846–1951) were continued under the subsequent Panchayat system (1960–1990). More recently, the protection of forest cover to safeguard environmental integrity and ecological functions such as hydrological flow and flood protection has been prioritized in vulnerable regions like Birendranagar. The national government has launched various community-based forest management plans and President Chure-Tarai conservation program to maintain current forest cover. These efforts likely contributed to the cessation of forest loss after 2006 in Birendranagar following earlier losses (Figure 2).
Nepal’s New Constitution of 2015 mandated the reconstruction of all administrative areas and their reclassification within the federal administrative hierarchy. Birendranagar was declared the capital of Karnali Province. Hence, its recent history of urbanization is expected to continue as new governmental investments in economic and infrastructure development attract additional migrants. A ring road around the city, currently under construction, is expected to enhance the industrial, commercial, and development activities and thus to provoke urbanization and LULC change widely in the near future [44].
3.2. Flood Area Analysis
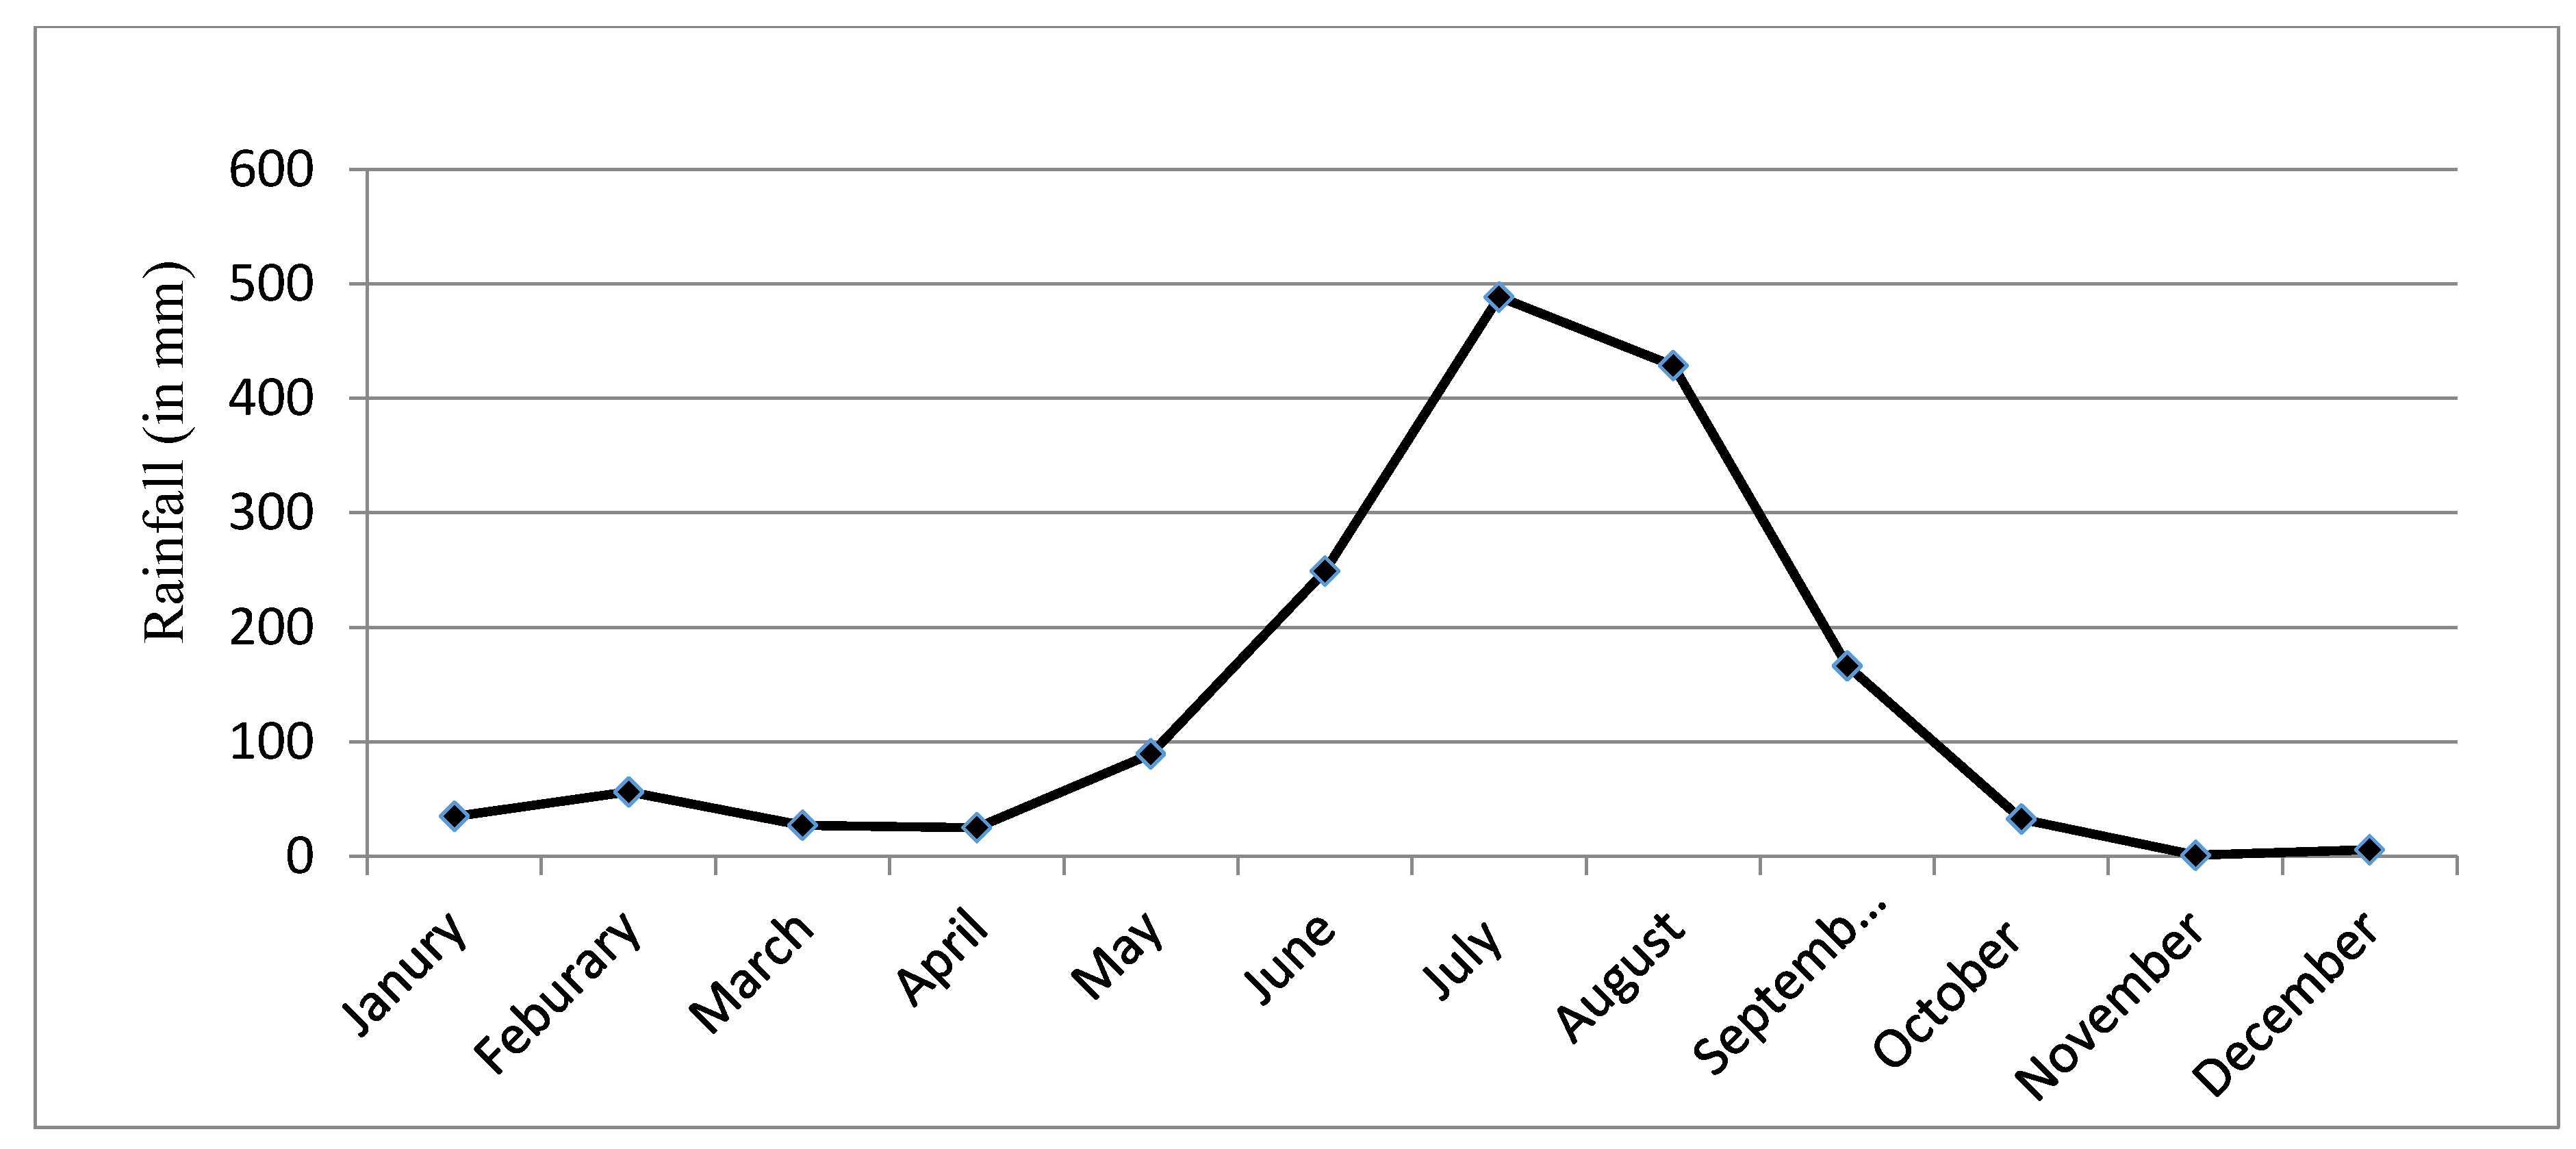
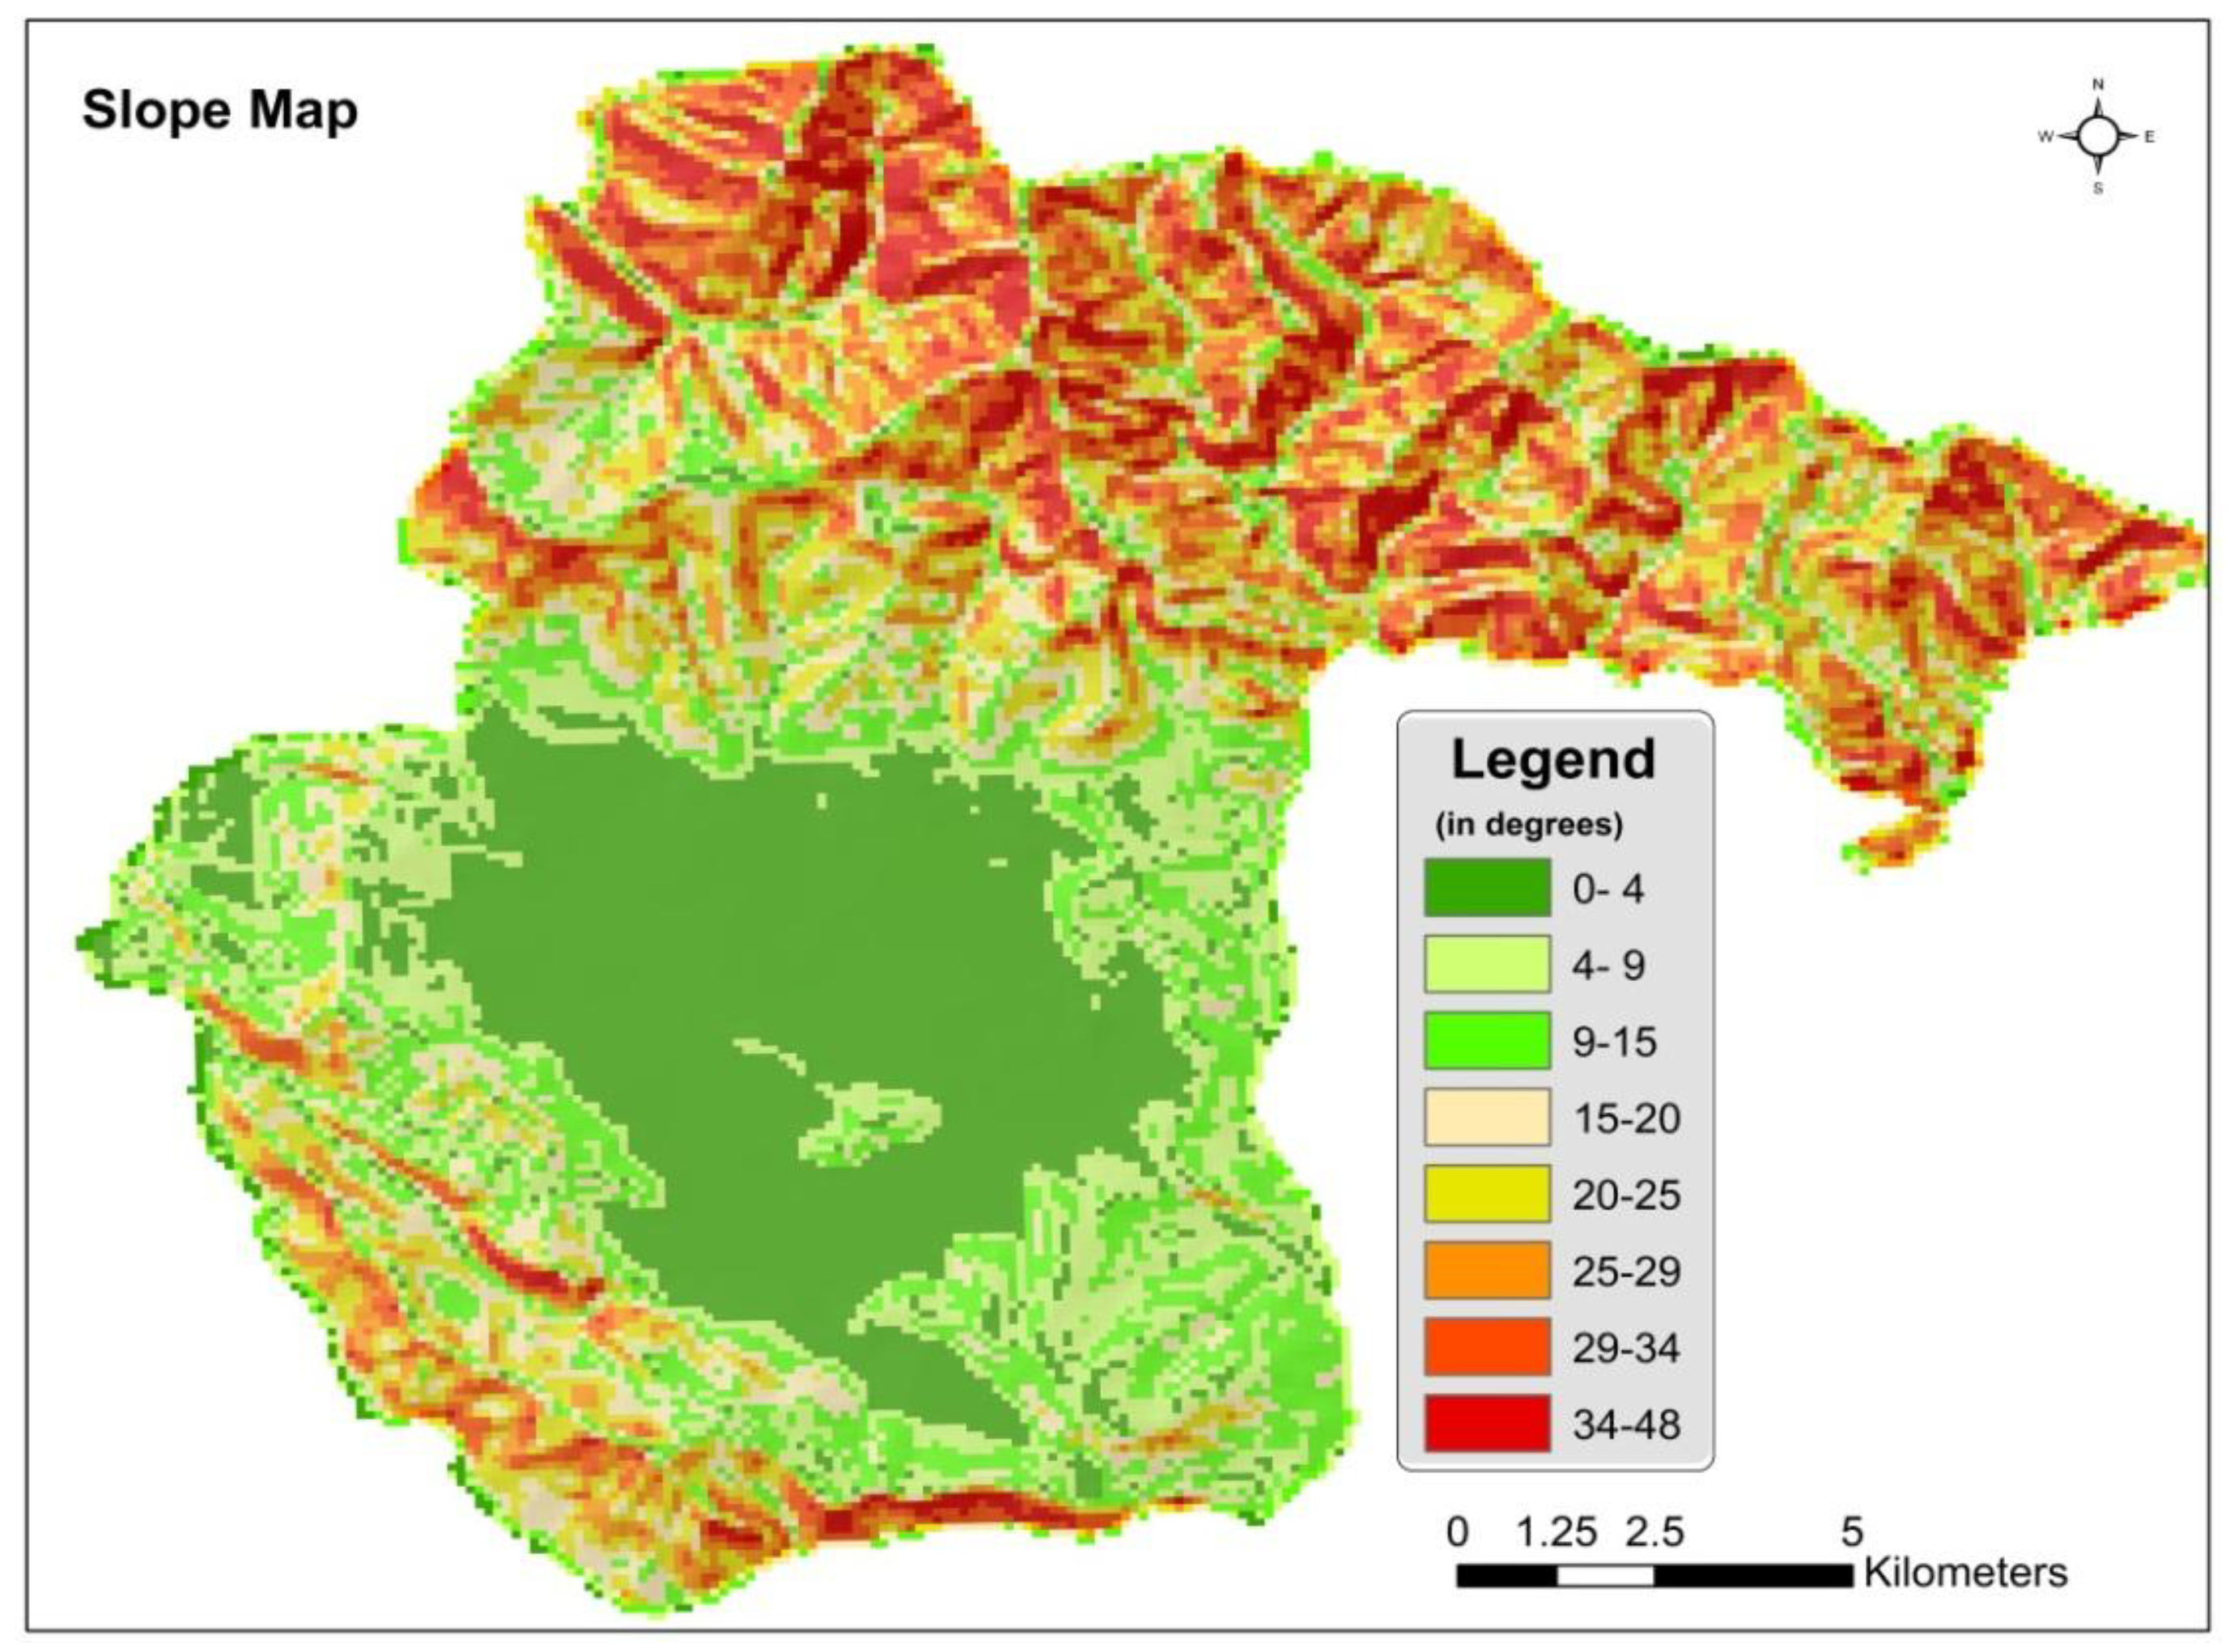
The Siwalik (Churiya) range and the southern slopes of the Mahabharat range are highly prone to geo-disasters [14,45] due to their fragile geology, steep slopes, and intense monsoonal precipitation during June through September (Figure 4), causing regular landslides and debris flow along creeks and steep slopes [20]. The highest average monthly rainfall was 488.77 mm and 428.64 mm for July and August, respectively, between 2000 and 2015 [42]. The southern belt of Churiya region and mid-hills are especially subject to intense rainfall from monsoonal low-pressure systems entering from the Bay of Bengal. The topographical slope of the study area ranges from below 4 degrees in the valley plain to 48 degrees in the Mahabharat range (Figure 5). The rocky soils cannot absorb intense rainfalls, resulting in major overland runs-off carrying soil and debris that have caused significant economic and human losses as urban expansion and deforestation have proceeded [41]. New settlements and urban expansion along river banks have disturbed river channels and drainage system. Deforestation and sand/gravel mining on the Siwalik range and upstream river beds have aggravated landslide hazards during the dry seasons. The major erosive and destructive forces of swollen rivers, which locals claim have increased in recent decades, dissipate only once steep riverine channels give way to gentler slopes, frustrating potential geo-engineering solutions to flood disasters.
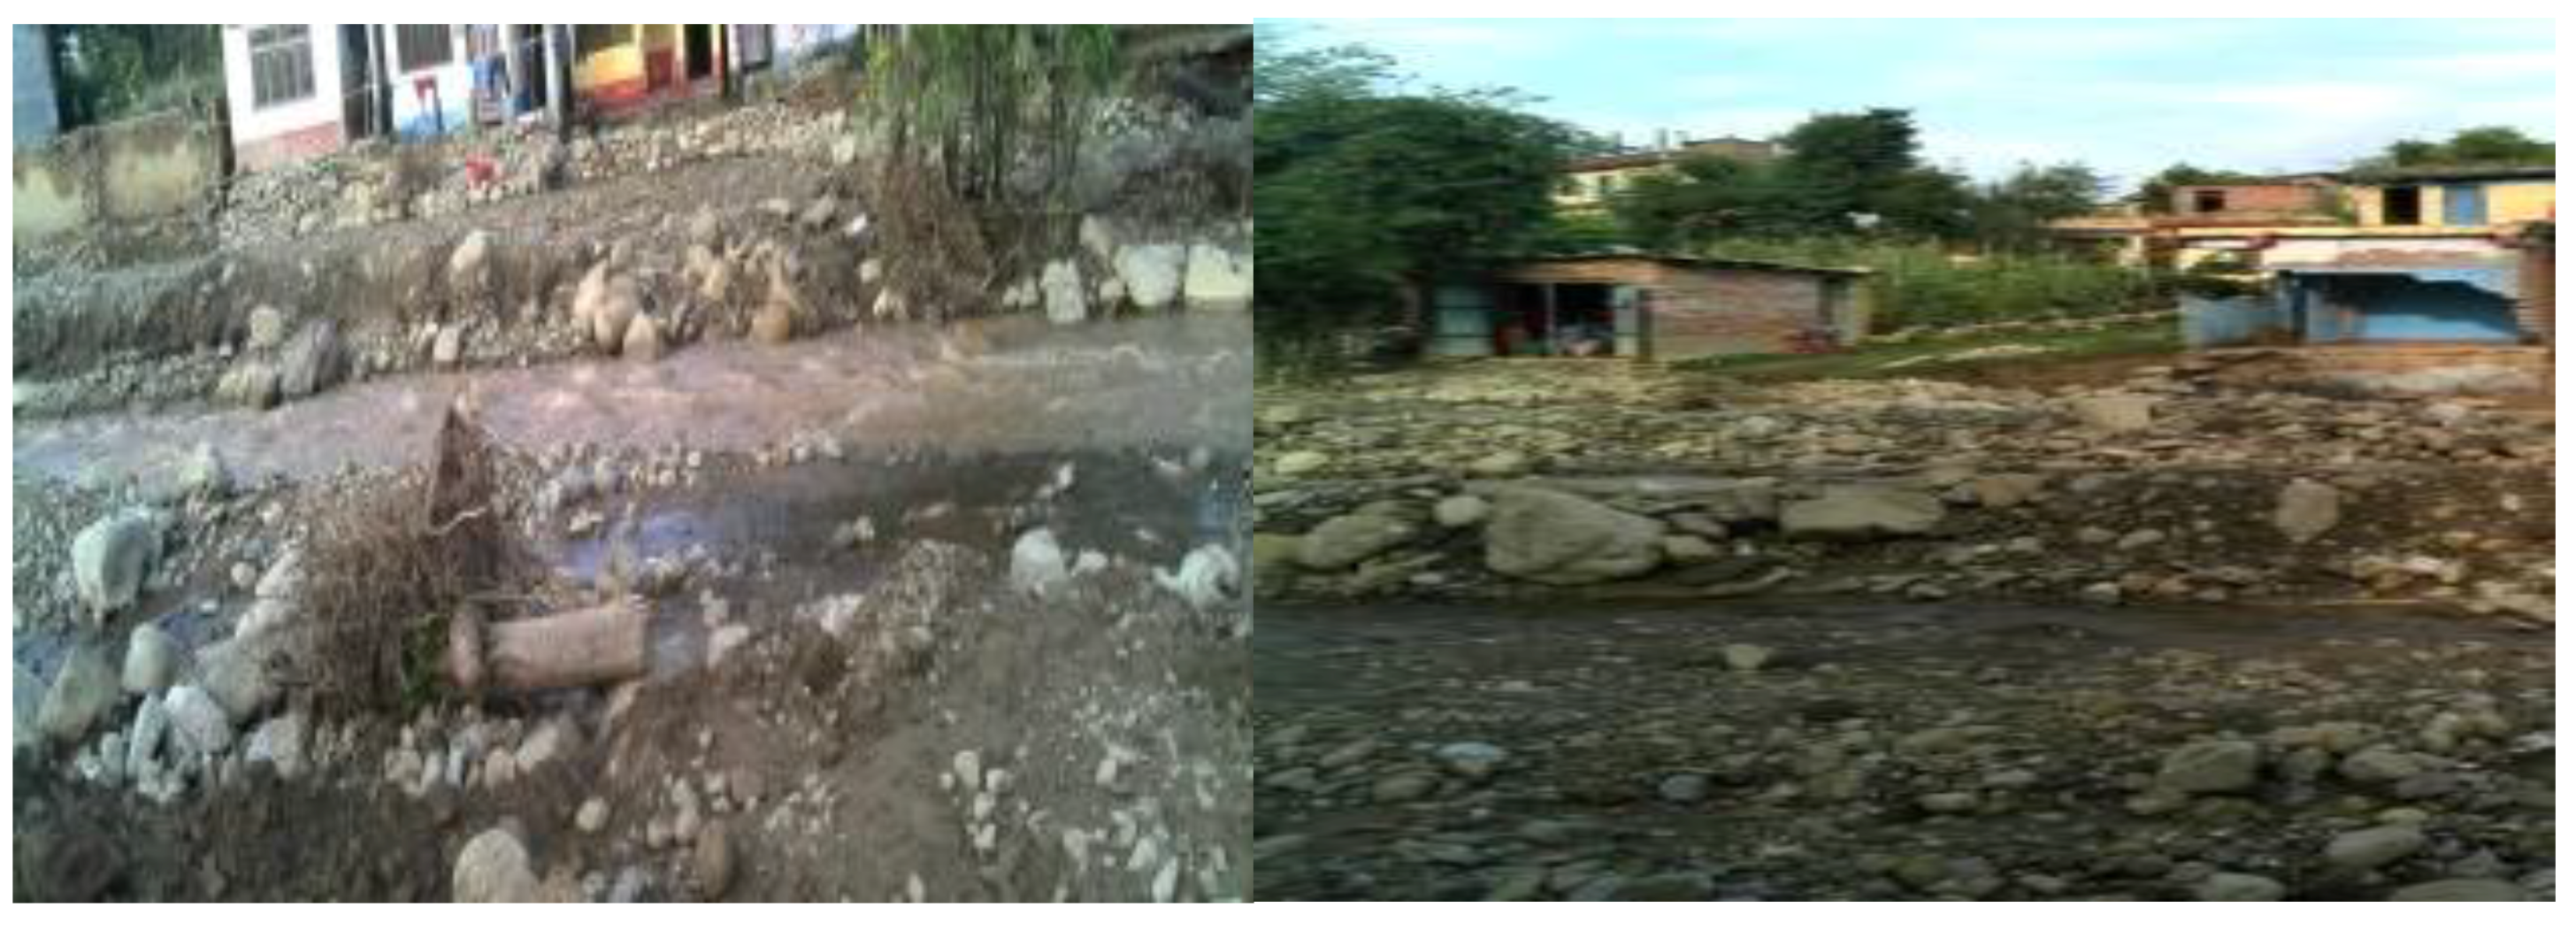
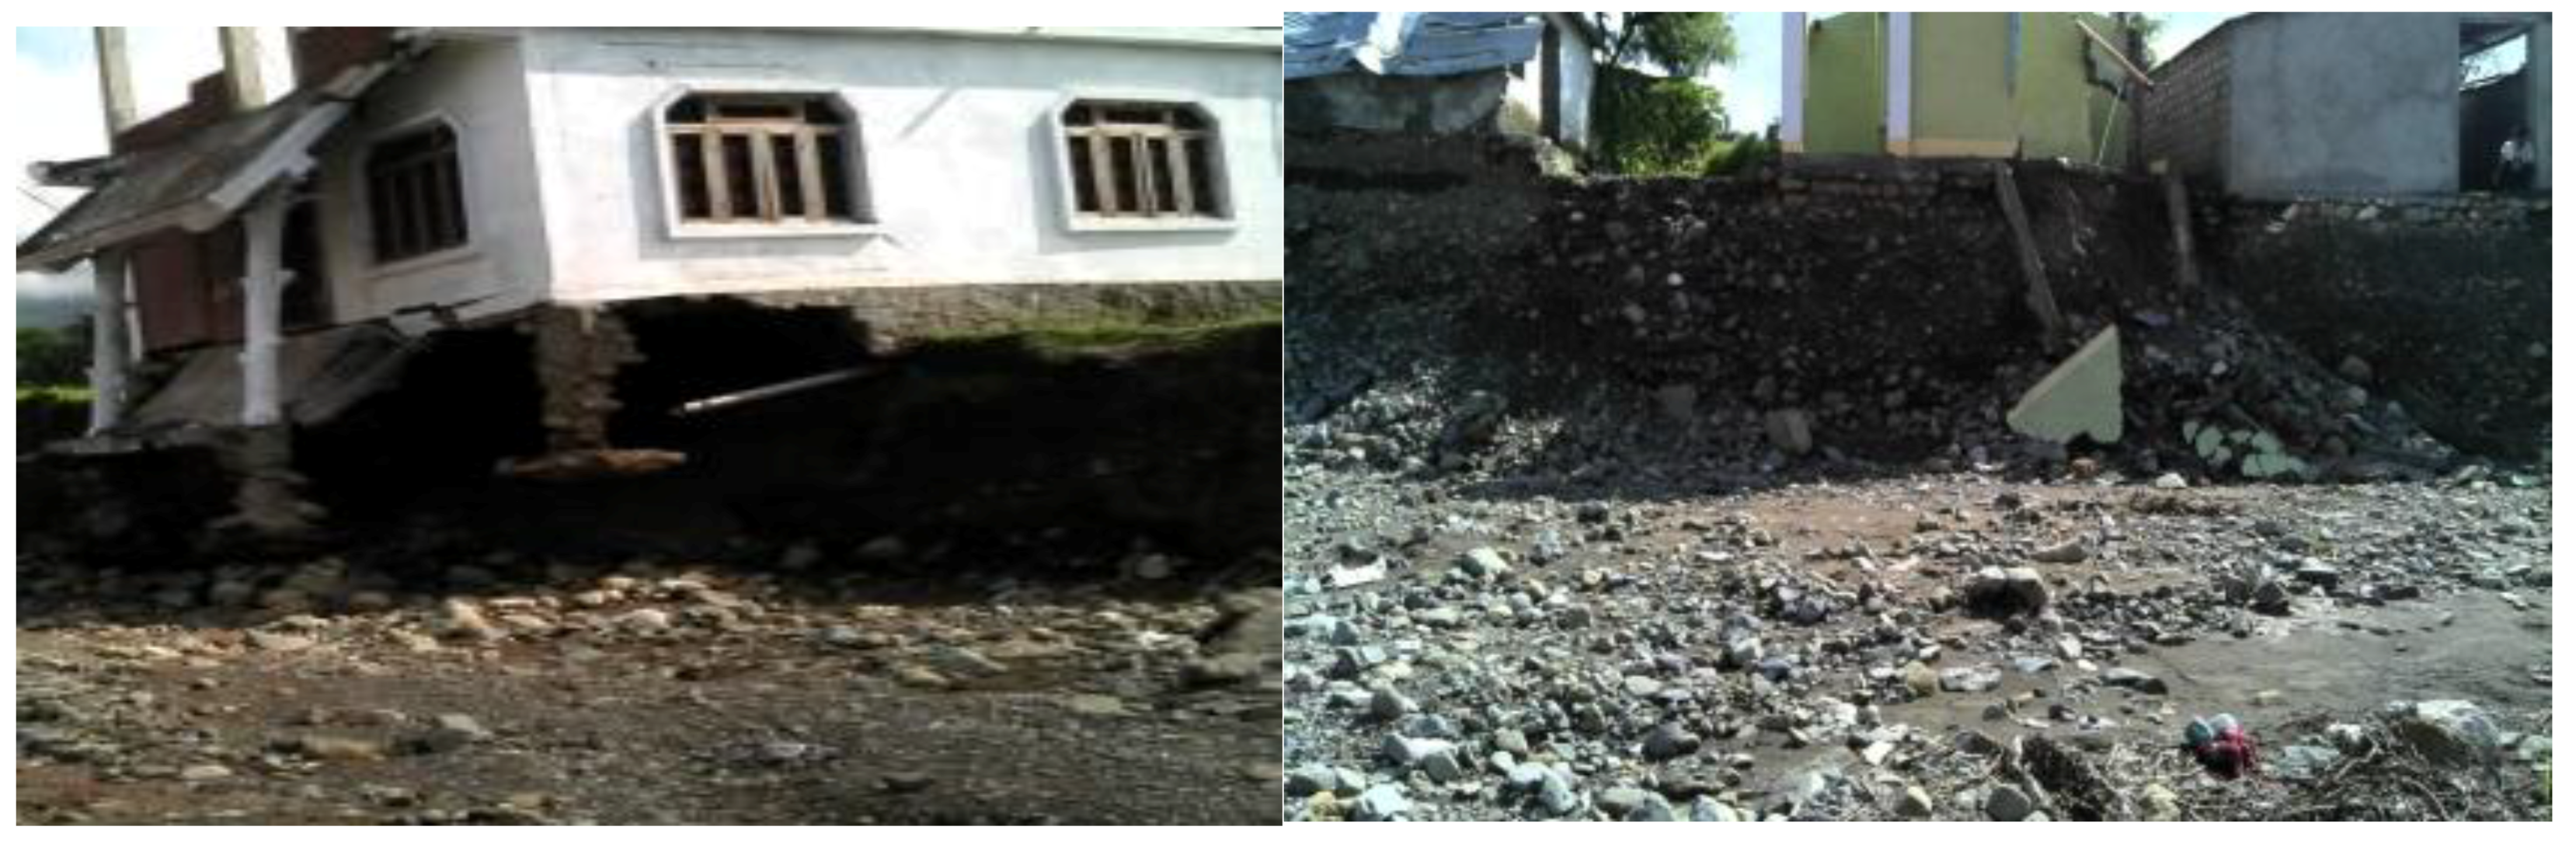
Surkhet district is affected annually by monsoonal flood events, the impacts of which have been increasingly devastating in recent decades. During August, 2014, more than 12,385 people from 2327 families were displaced [46], 1581 houses were washed away, 301 houses were damaged, 15 government schools were destroyed, and 31 more were damaged, resulting in the economic loss of NRs 6 billion. Additionally, 411 irrigation projects, 99 drinking water schemes, 11 child development centers, and 663 ha of forest were swept away [43]. Latikoili, Ghatgaun, Satakhani, Chinchhu, Lekhparajul, Hariharpur, Babiyachaur, Tatapani, Taranga, Dharapani, and Kunathari settlements were the most affected areas [46]. Birendranagar city was particularly highly affected by the flooding [44] on Khorke River (Figure 6) and Itram River (Figure 7). This 2014 flood not only impacted the settlements and cultivated area, but also claimed human lives.
Our survey of flooding events highlighted that the floods along the Neware river, Gagre river, Geruwa river, Tuni river, Dwari river, and Dundra river also effected the nearby settlements and farm lands. This study has identified several settlements and cultivated lands along these river banks that are at high risk of flood hazards, which are presented in Figure 8.
4. Conclusions
The study describes the LULC changes and urbanization process surrounding Birendranagar city during 1989–2016 using Landsat imagery and extensive consultations with local residents and officials. It highlights the rapid expansion of urban/built-up area from 2001. Urban areas have expanded most aggressively over fertile farm lands and become agglomerated within the flood-prone valley, particularly along Surkhet-Jumla-Karnali Highway and cross sectional roads. Forest conservation programs have helped slow deforestation during the last two decades. While wider reforestation measures are probably required to counter soil erosion and downstream transport during monsoons, this alone is probably insufficient to reduce flood hazard to reasonable levels. New settlements and cultivated lands established along river banks have especially high monsoonal flood hazards. Therefore, careful sustainable urban planning, migration control, and redirection measures, as well as flood hazard management and monitoring programs, are also required. Flood hazard management and monitoring strategies are not yet explicitly incorporated into local urban development plans, let alone regional land-use plans [47]. Indeed, much recent urban development has been informal or otherwise not subject to specific plans and zoning. Addressing the challenges of flood hazard mitigation in Nepal is thus fundamentally a challenge of instituting good governance practices based on solid empirical foundations, whereby development is subject to local zoning plans and laws.
Author Contributions
S.R. and B.R. designed the project and wrote the manuscript. B.R. contributed to remote sensing and GIS part including field data acquisition and verification. S.S. contributed to writing and English editing. All authors revised and edited the final manuscript.
Acknowledgments
The authors thank all the scientists and local participants who have participated in the establishment of database.
Conflicts of Interest
The authors declare no conflict of interest.
References
- UNISDR. Living with Risk: A global Review of Disasterreduction Initiatives; United Nation, Inter Agency Secretariat of the International Strategy for Disaster Reduction: Geneva, Switzerland, 2004; Volume 1. [Google Scholar]
- Zhao, M.; Cheng, W.; Zhou, C.; Li, M.; Huang, K.; Wang, N. Assessing Spatiotemporal Characteristics of Urbanization Dynamics in Southeast Asia Using Time Series of DMSP/OLS Nighttime Light Data. Remote Sens. 2018, 10, 47. [Google Scholar] [CrossRef]
- Eskandari, M.; Omidvar, B.; Modiri, M.; Nekooie, M.; Alesheikh, A. Geospatial Analysis of Earthquake Damage Probability of Water Pipelines Due to Multi-Hazard Failure. ISPRS Int. J. Geo-Inf. 2017, 6, 169. [Google Scholar] [CrossRef]
- Rimal, B.; Zhang, L.; Keshtkar, H.; Sun, X.; Rijal, S. Quantifying the Spatiotemporal Pattern of Urban Expansion and Hazard and Risk Area Identification in the Kaski District of Nepal. Land 2018, 7, 37. [Google Scholar] [CrossRef]
- Halimi, M.; Sedighifar, Z.; Mohammadi, C. Analyzing spatiotemporal land use/cover dynamic using remote sensing imagery and GIS techniques case: Kan basin of Iran. GeoJournal 2017, 1–11. [Google Scholar] [CrossRef]
- Sanyal, J.; Lu, X.X. Application of Remote Sensing in Flood Management with Special Reference to Monsoon Asia: A Review. Nat. Hazards 2004, 33, 283–301. [Google Scholar] [CrossRef]
- Dewan, A.M. Geospatial Techniques in Assessing Hazards, Risk and Vulnerability; Springer: Dordrecht, The Netherlands; Heidelberg, Germany; New York, NY, USA; London, UK, 2013. [Google Scholar]
- Guha-Sapir, D.; Hoyois, P.; Below, R. Annual Disaster Statistical Review 2014: The Numbers and Trends; Centre for Research on the Epidemiology of Disasters (CRED): Brussels, Belgium, 2015. [Google Scholar]
- Guha-Sapir, D.; Hoyois, P.; Below, R. Annual Disaster Statistical Review 2015: The Numbers and Trends; Centre for Research on the Epidemiology of Disasters (CRED): Brussels, Belgium, 2016. [Google Scholar]
- Karymbalis, E.; Katsafados, P.; Chalkias, C.; Gaki-Papanastassiou, K. An integrated study for the evaluation of natural and anthropogenic causes of flooding in small catchments based on geomorphological and meteorological data and modeling techniques: The case of the Xerias torrent (Corinth, Greece). Z. Geomorphol. 2012, 56, 45–67. [Google Scholar] [CrossRef]
- Shrestha, M. Impacts of Floods in South Asia. J. South Asia Disaster Stud. 2008, 1, 85–106. [Google Scholar]
- Upreti, B. Impact of natural disaster on development of Nepal. In Bhandary NP. Disasters and Development, Investing in Sustainable Development in Nepal; Subedi, J.K., Ed.; Ehime University, Japanand Bajra Publication: Kathmandu, Nepal, 2010. [Google Scholar]
- Ministry of Home Affairs (MoHA). Nepal Disaster Report 2011; Ministry of Home Affairs (MoHA) and Disaster Preparedance Network (DPNeT): Kathmandu, Nepal, 2011.
- United Nations Development Programme (UNDP). Global Assessment of Risk. In Nepal Countary Report; UNDP Pulchowk: Kathmandu, Nepal, 2009. [Google Scholar]
- Department of Water Induced Disaster Prevention (DWIDP). Annual Disaster Review 2012. Government of Nepal; Ministry of Irrigation Department of Water Induced Disater Management, Ed.; DWIDP: Kathmandu, Nepal, 2013.
- Ministry of Home Affairs (MoHA). Nepal Disaster Report 2015; Disaster Preparedance Network (DPNeT); Ministry of Home Affairs (MoHA): Kathmandu, Nepal, 2015.
- Kafle, K.R.; Khanal, S.N.; Dahal, R.K. Consequences of Koshi flood 2008 in terms of sedimentation characteristics and agricultural practices. Geoenviron. Disasters 2017, 4. [Google Scholar] [CrossRef]
- MoHA. Nepal Disaster Report. Available online: http;;//drrportal.gov.np (accessed on 19 November 2017).
- Dahal, R.K.; Bhandary, N.P. Geo-Disaster and Its Mitigation in Nepal. In Progress of Geo-Disaster Mitigation Technology in Asia; Springer: Berlin/Heidelberg, Germany, 2013; pp. 123–156. [Google Scholar]
- International Centre for Integrated Mountain Development/United Nation Educational Scientific and Cultural Organization (ICIMOD/UNESCO). Preparing for Flood Disaster Mapping and Assessing Hazard in the Ratu Watershed, Nepal; Nepal, K., United Nations Educational Scientific and Cultural Organization (UNESCO), Eds.; ICIMOD: New Delhi, India, 2007. [Google Scholar]
- Rimal, B.; Zhang, L.; Stork, N.; Sloan, S.; Rijal, S. Urban Expansion Occurred at the Expense of Agricultural Lands in the Tarai Region of Nepal from 1989 to 2016. Sustainability 2018, 10, 1341. [Google Scholar] [CrossRef]
- District Development Committee (DDC). District Profile, Surkhet; Government of Nepal, Ed.; DDC: Surkhet, Nepal, 2010. [Google Scholar]
- Morrison, A.; Westbrook, C.J.; Noble, B.F. A review of the flood risk management governance and resilience literature. J. Flood Risk Manag. 2017. [Google Scholar] [CrossRef]
- Central Bureau of Statistics (CBS). Population Monograph of Nepal; National Planning Commission Secretariat; CBS: Kathmandu, Nepal, 2014.
- Ministry of Federal Affairs and Local Development (MoFALD). Local Level Reconstruction Report; MoFALD: Kathmandu, Nepal, 2017.
- Thapa, R.B.; Murayama, Y. Drivers of urban growth in the Kathmandu valley, Nepal: Examining the efficacy of the analytic hierarchy process. Appl. Geogr. 2010, 30, 70–83. [Google Scholar] [CrossRef]
- Muzzini, E.; Aparicio, G. Urban Growth and Spatial Transition in Nepal; The World Bank: Washington, DC, USA, 2013. [Google Scholar]
- Do, Q.T.; Iyer, L. Geography, Poverty and Conflict in Nepal. In Working Paper -07-065; Harvard Business School: Boston, MA, USA, 2009. [Google Scholar]
- Rimal, B.; Zhang, L.; Fu, D.; Kunwar, R.; Zhai, Y. Monitoring Urban Growth and the Nepal Earthquake 2015 for Sustainability of Kathmandu Valley, Nepal. Land 2017, 6, 42. [Google Scholar] [CrossRef]
- Dewan, A.M.; Yamaguchi, Y. Using remote sensing and GIS to detect and monitor land use and land cover change in Dhaka Metropolitan of Bangladesh during 1960–2005. Environ. Monit. Assess. 2009, 150, 237–249. [Google Scholar] [CrossRef] [PubMed]
- Thapa, R.B.; Murayama, Y. Examining Spatiotemporal Urbanization Patterns in Kathmandu Valley, Nepal: Remote Sensing and Spatial Metrics Approaches. Remote Sens. 2009, 1, 534–556. [Google Scholar] [CrossRef]
- Rimal, B.; Zhang, L.; Keshtkar, H.; Haack, B.; Rijal, S.; Zhang, P. Land Use/Land Cover Dynamics and Modeling of Urban Land Expansion by the Integration of Cellular Automata and Markov Chain. ISPRS Int. J. Geo-Inf. 2018, 7, 154. [Google Scholar] [CrossRef]
- Keshtkar, H.; Voigt, W. Potential impacts of climate and landscape fragmentation changes on plant distributions: Coupling multi-temporal satellite imagery with GIS-based cellular automata model. Ecol. Inform. 2016, 32, 145–155. [Google Scholar] [CrossRef]
- Keshtkar, H.; Voigt, W. A spatiotemporal analysis of landscape change using an integrated Markov chain and cellular automata models. Model. Earth Syst. Environ. 2015, 2, 10. [Google Scholar] [CrossRef]
- Byun, Y.; Han, Y.; Chae, T. Image Fusion-Based Change Detection for Flood Extent Extraction Using Bi-Temporal Very High-Resolution Satellite Images. Remote Sens. 2015, 7, 10347–10363. [Google Scholar] [CrossRef]
- Sloan, S.; Pelletier, J. How accurately may we project tropical forest-cover change? A validation of a forward-looking baseline for REDD. Glob. Environ. Chang. 2012, 22, 440–453. [Google Scholar] [CrossRef]
- Rimal, B.; Zhang, L.; Keshtkar, H.; Wang, N.; Lin, Y. Monitoring and Modeling of Spatiotemporal Urban Expansion and Land-Use/Land-Cover Change Using Integrated Markov Chain Cellular Automata Model. ISPRS Int. J. Geo-Inf. 2017, 6, 288. [Google Scholar] [CrossRef]
- Rimal, B.; Baral, H.; Stork, N.; Paudyal, K.; Rijal, S. Growing City and Rapid Land Use Transition: Assessing Multiple Hazards and Risks in the Pokhara Valley, Nepal. Land 2015, 4, 957–978. [Google Scholar] [CrossRef]
- Anderson, J.R. A Land Use and Land Cover Classification System for Use with Remote Sensor Data; United States Government Printing Office: Washington, DC, USA, 1976.
- Government of Nepal (GN). Topographical Map; Ministry of Land Resources and Management Survey Department; Topographic Survey Branch: Kathmandu, Nepal, 1998.
- National Planning Commission (NPC). Post Flood Recovery Needs Assessment; NPC; Government of Nepal; Singha Durbar: Kathmandu, Nepal, 2017.
- The Department of Hydrology and Meteorology (DHM). Metrological Data of Birendranagar Station, Surkhet; Government of Nepal, Ed.; DHM: Kathmandu, Nepal, 2016.
- UN-Habitat. District Land Use Plan of Surkhet; Catalytic Support on Land Issues, Participatory Land Use Planning Project; UN-Habitat: Pulchowk, Nepal, 2015. [Google Scholar]
- UN-Habitat. Village Development Committee Land Use Plan of Latikoili; Catalytic Support on Land Issues, Participatory Land Use Planning Project; UN-Habitat: Pulchowk, Nepal, 2015. [Google Scholar]
- Ghimire, M. Historical Land Covers Change in the Chure-Tarai Landscape in the Last Six Decades: Drivers and Environmental Consequences. In Land Cover Change and Its Eco-Environmental Responses in Nepal; Li, A., Deng, W., Zhao, W., Eds.; Springer: Singapore, 2017; pp. 109–147. [Google Scholar]
- Informal Sector Service Center (INSEC). Flood Victims of Surkhet District Undergoing Pains due to State Apathy; INSEC: Kathmandu, Nepal, 2017. [Google Scholar]
- Baan, P.J.; Klijn, F. Flood risk perception and implications for flood risk management in the Netherlands. Int. J. River Basin Manag. 2004, 2, 113–122. [Google Scholar] [CrossRef]
Figure 1.
Location Map of the study area.

Figure 2.
LULC change trend during 1989–2016. (a) Urban/built-up, (b) cultivated Land, (c) forest, (d) shrub (e) sand and water body, and (f) others.
Figure 2.
LULC change trend during 1989–2016. (a) Urban/built-up, (b) cultivated Land, (c) forest, (d) shrub (e) sand and water body, and (f) others.


Figure 3.
LULC change Maps of 1989 to 2016.

Figure 4.
Trend of monthly mean rainfall of Birendranagar station during 2000–2015.

Figure 5.
Slope Map of the Study Area.

Figure 6.
River bank erosion and sediment transportation by Khokre River (photo taken by author, 2014).
Figure 6.
River bank erosion and sediment transportation by Khokre River (photo taken by author, 2014).

Figure 7.
Affected infrastructures from the floods in the Itram River (photo taken by author, 2014).
Figure 7.
Affected infrastructures from the floods in the Itram River (photo taken by author, 2014).

Figure 8.
Flood hazard map.


Table 1.
Population of Birendranagar city.
| Year | 1981 | 1991 | 2001 | 2011 | 2015 |
|---|---|---|---|---|---|
| Population | 13,859 | 22,973 | 31,381 | 93,718 | 100,458 |
Source: Central Bureau of Statistics (CBS), 2014.
Table 2.
Land-cover classification scheme.
| Land-Cover Types | Description |
|---|---|
| Urban (built up) | Urban and rural settlements, commercial areas, industrial areas, construction areas, traffic, airports, public service areas (e.g., schools, colleges, hospitals) |
| Cultivated land | Wet and dry crop lands, orchards |
| Forest | Evergreen broad leaf forest, deciduous forest, scattered forest, degraded forest |
| Shrub | Mix of trees (<5 m tall) and other natural covers |
| Sand | Sand area, other open field area, river bank |
| Water | River, lake/pond, canal, reservoir |
| Others | Cliffs/small landslide, bare rocks, |
Table 3.
LULC change of Birendranagar city during 1989–2016 (Area in ha).
| LULC | 1989 | 1996 | 2001 | 2006 | 2011 | 2016 | 1989–2016 |
|---|---|---|---|---|---|---|---|
| Urban/built up | 85 | 89 | 113 | 289 | 584 | 656 | 571 |
| Cultivated | 7005 | 6958 | 6935 | 6794 | 6371 | 6205 | −800 |
| Forest | 13,703 | 13,482 | 13,406 | 13,341 | 13,494 | 13,342 | −361 |
| Shrub | 3281 | 3566 | 3640 | 3644 | 3608 | 3798 | 517 |
| Sand | 276 | 258 | 253 | 272 | 274 | 324 | 48 |
| Water | 140 | 140 | 129 | 129 | 157 | 157 | 17 |
| Others | 91 | 89 | 105 | 111 | 95 | 99 | 8 |
| Total | 24,582 | 24,582 | 24,582 | 24,582 | 24,582 | 24,582 |
© 2018 by the authors. Licensee MDPI, Basel, Switzerland. This article is an open access article distributed under the terms and conditions of the Creative Commons Attribution (CC BY) license (http://creativecommons.org/licenses/by/4.0/).
Share and Cite
MDPI and ACS Style
Rijal, S.; Rimal, B.; Sloan, S. Flood Hazard Mapping of a Rapidly Urbanizing City in the Foothills (Birendranagar, Surkhet) of Nepal. Land 2018, 7, 60. https://doi.org/10.3390/land7020060
AMA Style
Rijal S, Rimal B, Sloan S. Flood Hazard Mapping of a Rapidly Urbanizing City in the Foothills (Birendranagar, Surkhet) of Nepal. Land. 2018; 7(2):60. https://doi.org/10.3390/land7020060
Chicago/Turabian StyleRijal, Sushila, Bhagawat Rimal, and Sean Sloan. 2018. "Flood Hazard Mapping of a Rapidly Urbanizing City in the Foothills (Birendranagar, Surkhet) of Nepal" Land 7, no. 2: 60. https://doi.org/10.3390/land7020060
Note that from the first issue of 2016, this journal uses article numbers instead of page numbers. See further details here.