Article

The Usage and Perception of Pedestrian and Cycling Streets on Residents’ Well-being in Kalamaria, Greece

by
Thomas Panagopoulos
1,*,
Stilianos Tampakis
2,
Paraskevi Karanikola
2,
Aikaterini Karipidou-Kanari
2 and
Apostolos Kantartzis
2
1
Research Centre of Tourism, Sustainability and Well-Being, Faculty of Science and Technology, University of Algarve, Gambelas Campus, 8000 Faro, Portugal
2
Department of Forestry and Management of the Environment and Natural Resources, Democritus University of Thrace, 193 Pantazidou Street, 68200 Orestiada, Greece
*
Author to whom correspondence should be addressed.
Land 2018, 7(3), 100; https://doi.org/10.3390/land7030100
Submission received: 18 July 2018 / Revised: 16 August 2018 / Accepted: 27 August 2018 / Published: 30 August 2018
(This article belongs to the Special Issue Landscape Urbanism and Green Infrastructure)

Abstract

:
Pedestrian zones are public spaces intended for the continued and safe mobility of pedestrians and people with disabilities, and they provide multiple benefits to urban areas. They counterbalance the densely built-up areas, decrease atmospheric pollution, increase available green or social space, increase walking and cycling rates, and facilitate active play for children. Done properly, pedestrianization may also increase local business sales. Greece boasts open public spaces and the pedestrianization of common roads. The economic crisis that Greece has been experiencing since 2008 has led people to give up their vehicles and use the pedestrian streets more frequently. The purpose of this paper was to investigate residents’ perceptions and satisfaction rates concerning the pedestrian streets of Kalamaria, Greece, and evaluate their importance for residents’ well-being. Following a random sampling method, 400 residents were interviewed. A two-step cluster analysis was conducted. The survey showed that the urban residents visited pedestrian zones in Kalamaria at least once a week, and the visits lasted 46–60 min. The improvement of urban landscape aesthetics and people’s health and well-being were evaluated as important functions of pedestrian zones. The results also indicate that residents were not satisfied with their quality of life and the existing green infrastructures of the pedestrian streets, even though they have a positive disposition toward the construction or transformation of pedestrian streets. The residents expressed their unwillingness to pay more public taxes for the construction and maintenance of pedestrian and cycling streets. The safety and convenience of the mobility of residents were the most important advantages of the pedestrian streets. Meanwhile, overspill parking and difficulties with finding parking spaces were the main disadvantages for the residents. Local authorities can use the results of the present survey to manage the city’s green infrastructure and use this information in the urban planning framework.

1. Introduction

Pedestrian zones are public areas of a city or a town reserved only for the use of pedestrians in which most or all automobile traffic is prohibited. Converting a street or a bigger area to pedestrian use only is called pedestrianization [1]. Until the end of the 19th century, the squares and central streets of cities and towns served to meet the needs of the residents. Urban public spaces were created to fulfill the everyday needs of the residents, such as communication and entertainment [2]. These places have also been used for social, civil, commercial, and political functions [3] since the middle of the 20th century, when the use of the car took a dominant role in peoples’ lives [4].
The cities of today have requirements that differ from those of the past [5,6]. Nowadays, there is a universal aim for urban “regeneration” focused on urban planning that gives importance to walkability, i.e., the easiness of freely moving within the urban context—a freedom that must be ensured to increasingly wider proportions of the population [7,8]—so it is necessary to reconsider how the pedestrian moves and how the pedestrian infrastructure characteristics affect such behavior [9].
Pedestrians include all people who walk through shopping and service areas, from home to a friend’s house, and take typically short trips. Every trip begins and ends as a pedestrian action, so everyone is a pedestrian at regular and various times and places in their lives [10]. Walkability is recognized as an important factor for both the quality of urban space and people’s quality of life [11]. It is a spatial requisite of the built environment that greatly contributes to its livability and enables people to more effectively and fully use—and benefit from—urban opportunities. The possibility for people of different ages, genders, residential locations, socio-economic status, and personal abilities to reach valuable destinations and places “on their own” and by foot is considered an important capability offered in a sustainable city [12].
From this point of view, pedestrian infrastructure quality is very important. In fact, the lack of quality and accessibility of pedestrian areas from home or work locations leads to the exclusion of the citizens from economic, social, and cultural progress [13]. Regardless of the type of pedestrian or purpose of the trip, all pedestrians have basic needs. Safety is the primary need for pedestrians, who are often the most exposed to the dangers of vehicle traffic. They require safe access to multiple services.
Meanwhile, pedestrian zones have different effects on urban areas. Their main uses are the free mobility of pedestrians and the development of local business activities in the specific areas [14]. However, pedestrian zones are also opportunities to increase the urban green infrastructure, reintroduce nature in urban areas, and compensate for the density of buildings. Biophilic urbanism aims to bring more nature into the city and utilize green infrastructure to improve people’s health and well-being [15].
There is wide interest in pedestrianization and pedestrian zones in different countries: in the United States (U.S.A.) [14], Turkey [10], India [16], and in several European countries such as Lithuania [2], the United Kingdom (U.K.) [17], and Germany [18]. The findings of these studies highlight that the pedestrian zones affect not only economic factors related to tourism development [19], job creation [20], and incentives for small and medium-sized business [21], they also have environmental impacts, including noise and atmospheric pollution reductions, and social impacts, including increasing the safety and enhancing the appearance of urban areas [22,23,24,25]. Therefore, it may be assumed that one of the ways to return quality of life to cities is to dedicate all open urban spaces to pedestrians and cyclists [2].
Besides walking, cycling is another form of active and sustainable mobility for short trips [26,27]. Although cycling was a common means of transport in Greece until the 1970s, more recently, the lack of safety standards has forced many people to use cars for their daily transportation needs. In recent years, we have witnessed an effort to reintroduce cycling in the life of people living in cities [28]. The first cycle networks in Greek cities have already been implemented, mirroring other European countries [29]. In Greece, there is confusion with regard to the open spaces where cycling is permitted. Pavements, parks, and pedestrian zones are areas that cyclists use, but pedestrians usually complain [30,31]. Previous studies in Greece have explored the intention of residents to cycle in three big cities [28,29,30], and some recorded the suitability for cycling in two small cities [27,32].
The aim of this study was to determine the perception of residents about the main functions of pedestrian zones that affect residents’ well-being in a Greek municipality. The frequency and duration of residents’ visits was also recorded, and the suitability of the municipality for cycling and the use of parks and pedestrian zones to cycling were evaluated.
This paper is organized into four sections: the literature review; information about the study area and methodology; description of the survey results; and finally, in the last section, the main conclusions are discussed and recommendations are provided for decision-makers about how to promote walking and cycling in municipalities with similar characteristics.

2. Materials and Methods
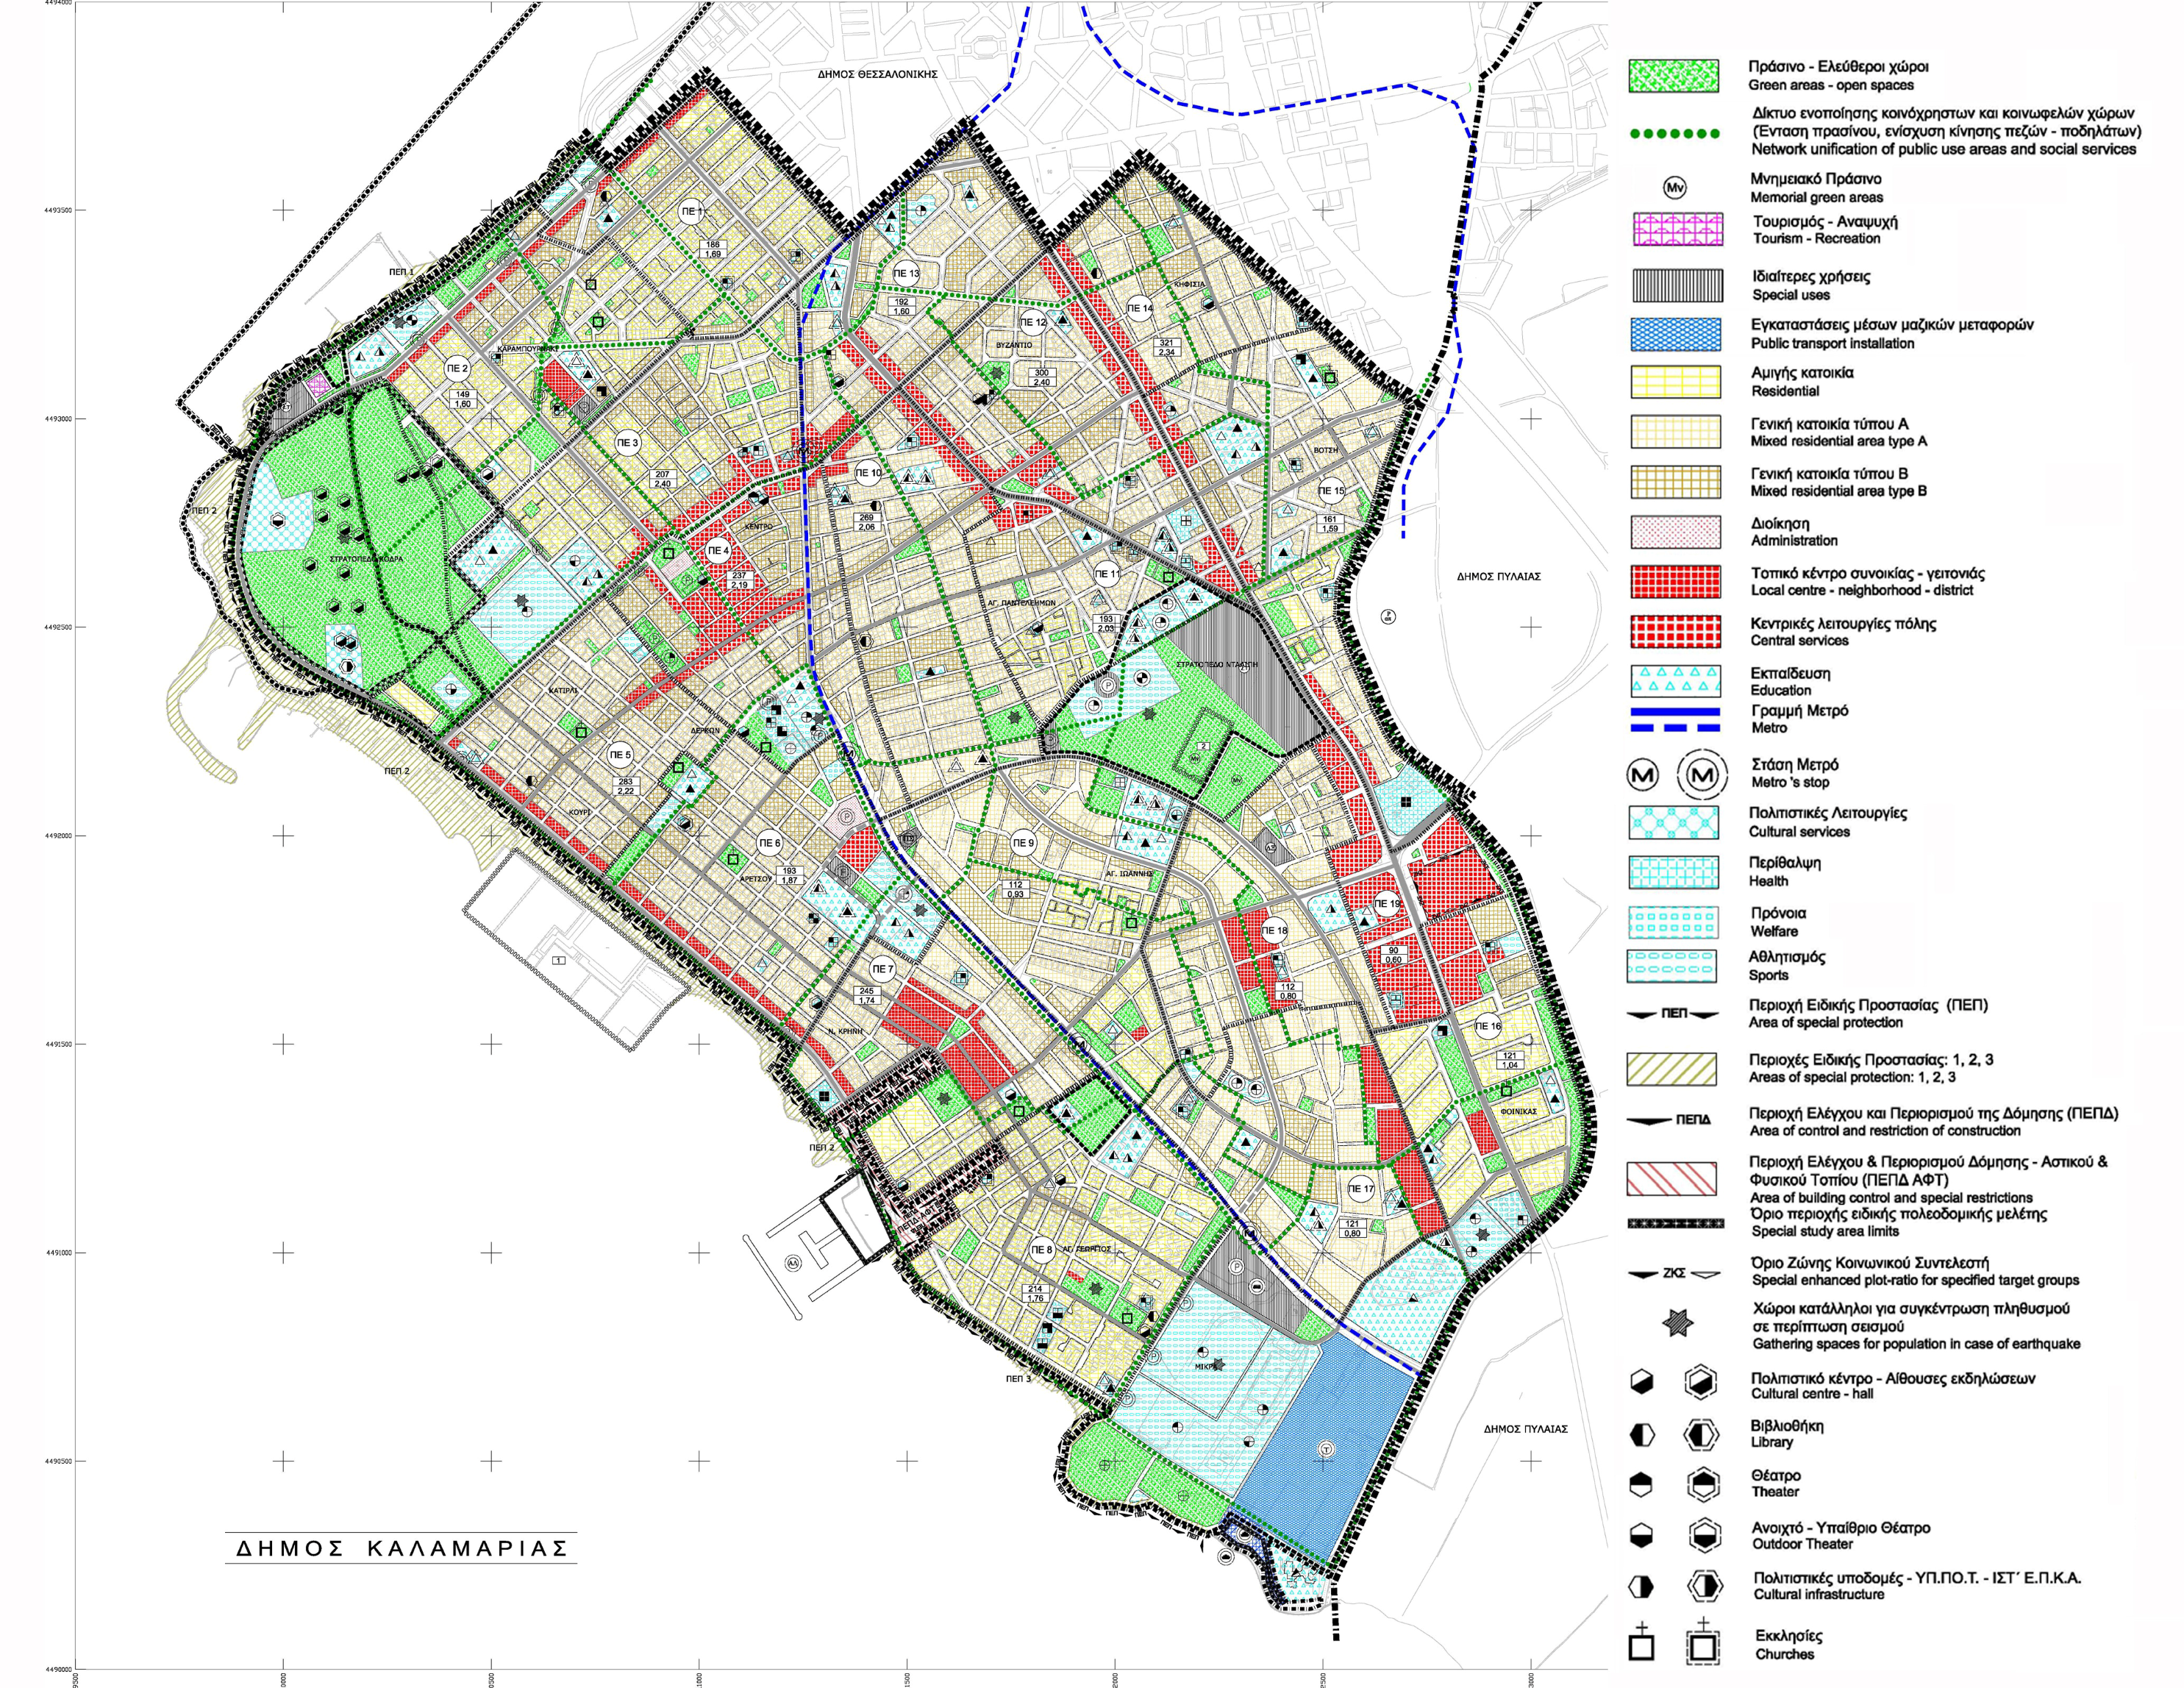
2.1. Study Area

The data used in this paper was gathered from the municipality of Kalamaria, covering 6.4 km2 and housing 91,279 residents. It is the second largest municipality in the metropolitan area of Thessaloniki, Northern Greece. Two-thirds of Kalamaria is surrounded by sea, with 6.5 km of attractive coastline. In the post-war period, it was separated from the main city of Thessaloniki; meanwhile, the border between the two municipalities exists purely for administrative purposes, as it constitutes a residential and recreational area for Thessaloniki. The population of Kalamaria has increased rapidly by 12.4% in the last decade, which has been mainly due to the relocation of families from Thessaloniki to suburban areas. The municipality is facing severe environmental pressure due to rapid urbanization. The green areas of the municipality of Kalamaria cover 635,800 m2, which account for 9.93% of the municipality’s total area.
According to Greek Law 4315/2014 (FEK 269/24-12-2014), the pedestrian zones are open public spaces intended for the continued and safe mobility of pedestrians and people with disabilities. Cars are allowed only for residents moving to the entrance and exit of private parking spaces. The pedestrian zones in Greece comprise pedestrian streets that are frequently derived from the pedestrianization of common roads and a green infrastructure network for the unification of public use areas and social services. Figure 1 presents this green densification network, as green dots, for the promotion of walking and cycling in Kalamaria, which constitutes a good opportunity for a sustainable and biophilic urban design.

2.2. The Survey

The population under study included all of the households in the municipality of Kalamaria. The applied sampling framework involved the lists of domestic electricity consumers. The use of households is a familiar case of using teams instead of sample units. It is easier and more affordable [33]. Structured face-to-face interviews were conducted, and simple random sampling was used [34,35]. The average duration of the interview was 20 min. The survey was divided into four different sections:
  • General demographics of respondent
  • Contribution of pedestrian streets to respondent’s quality of life
  • The suitability of the municipality for cycling
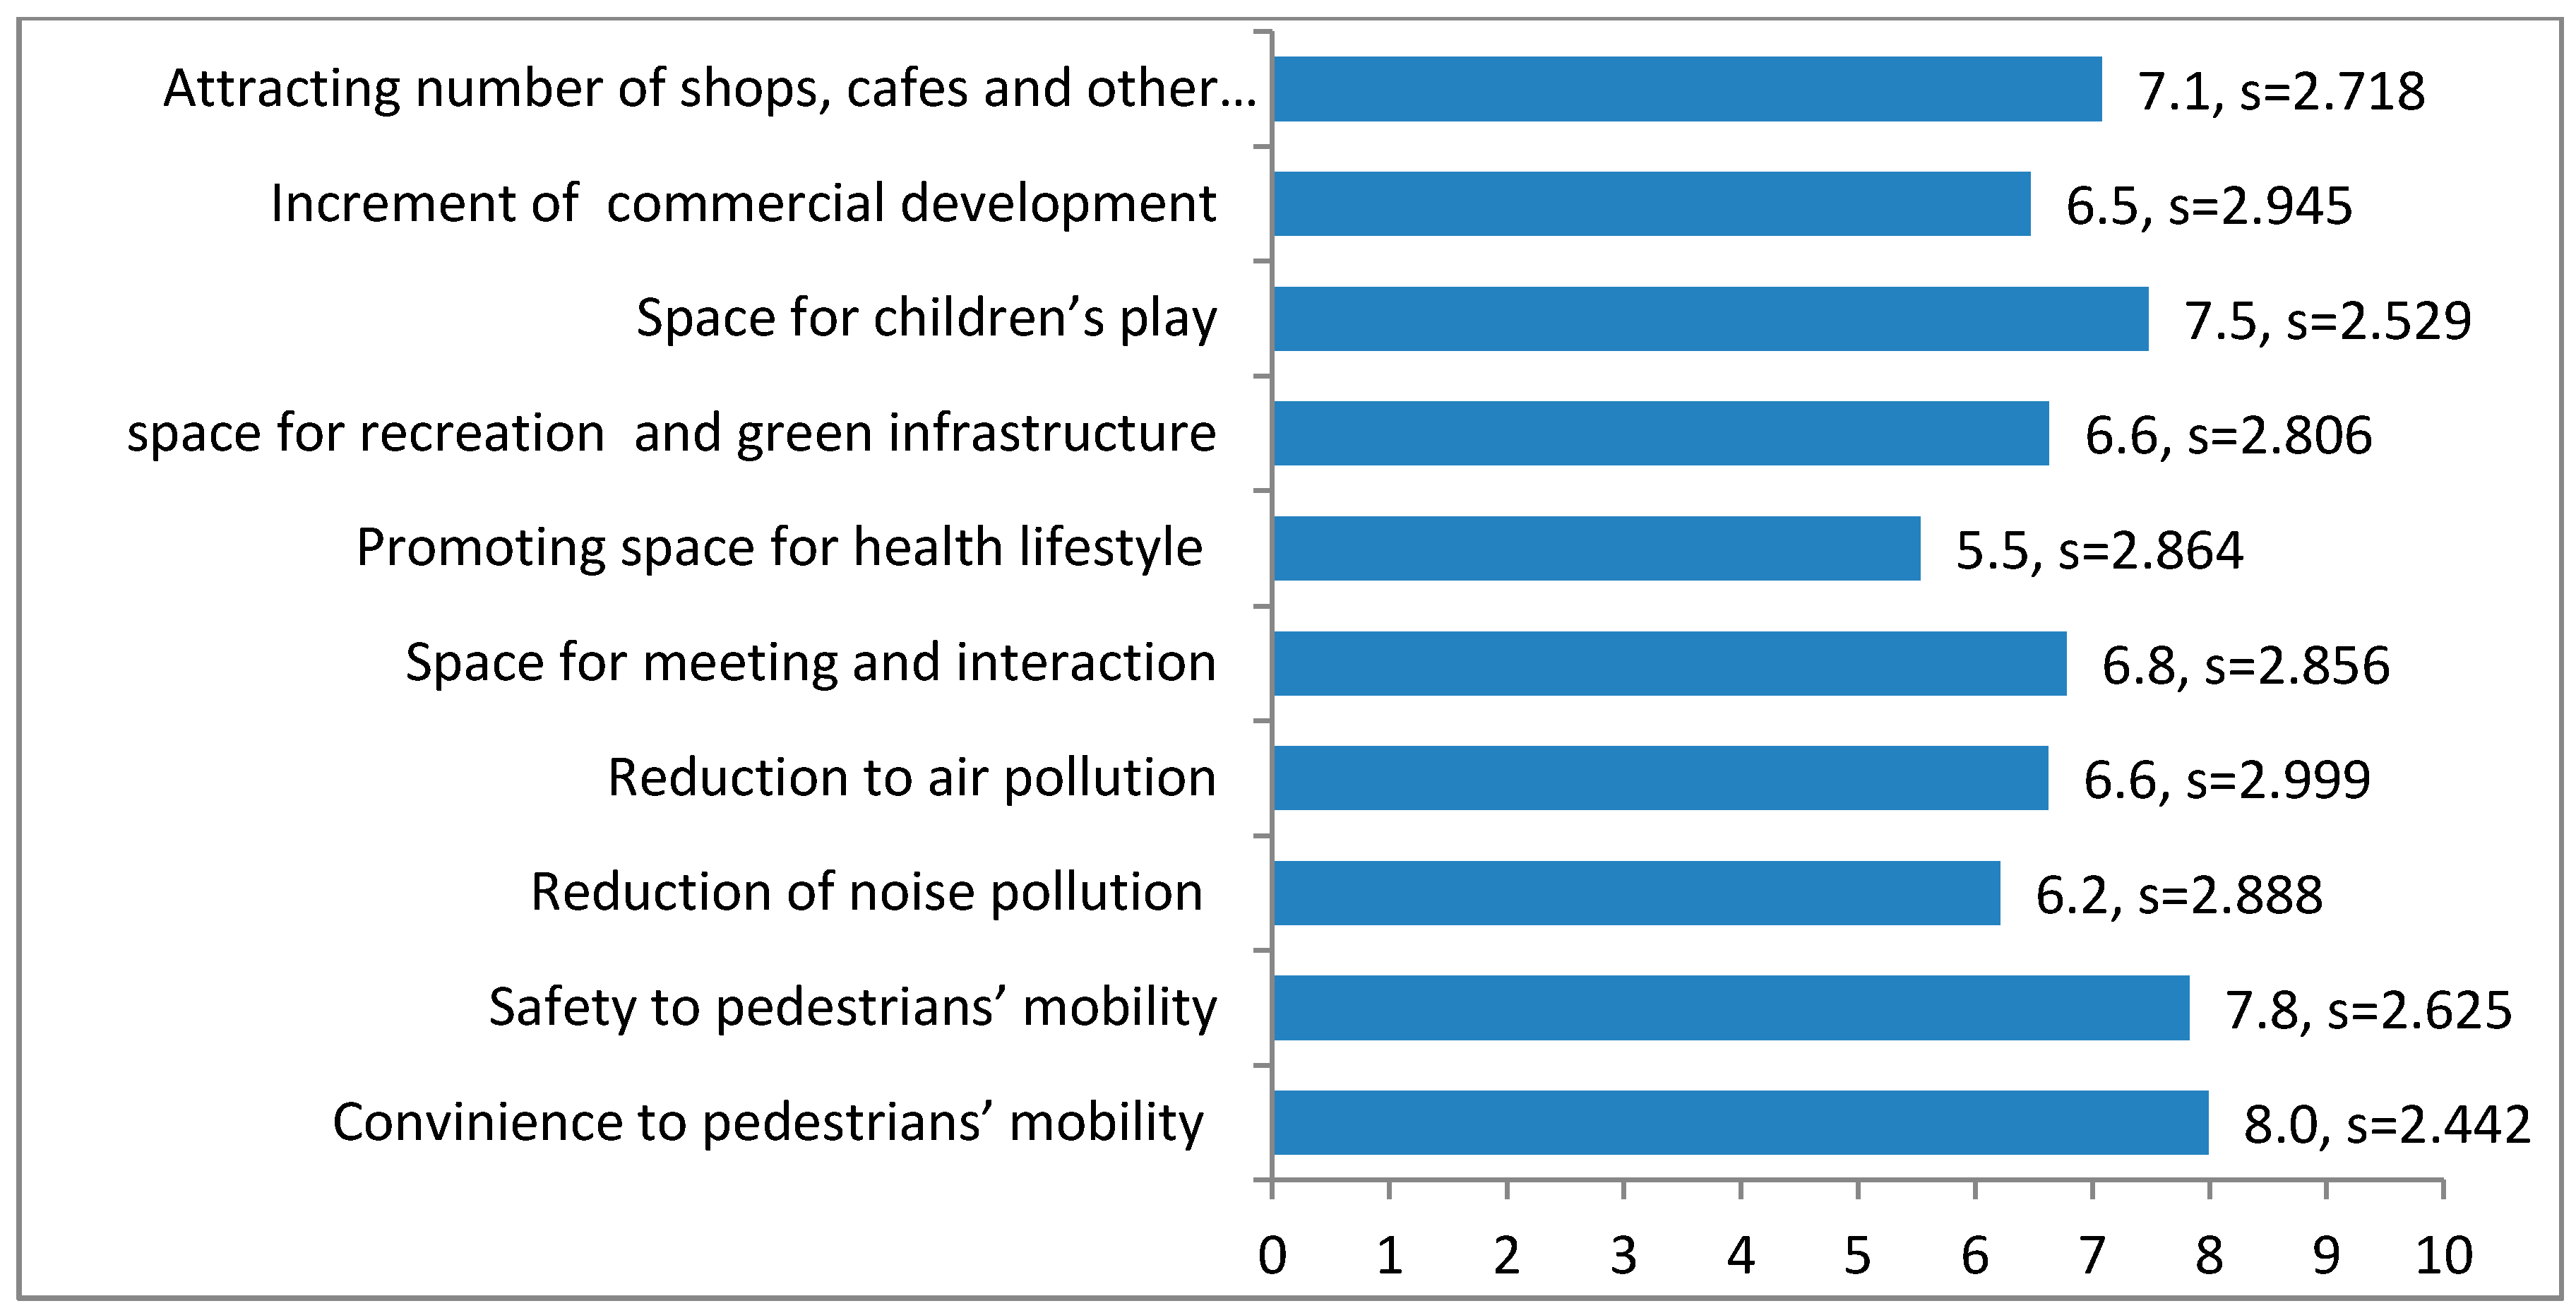
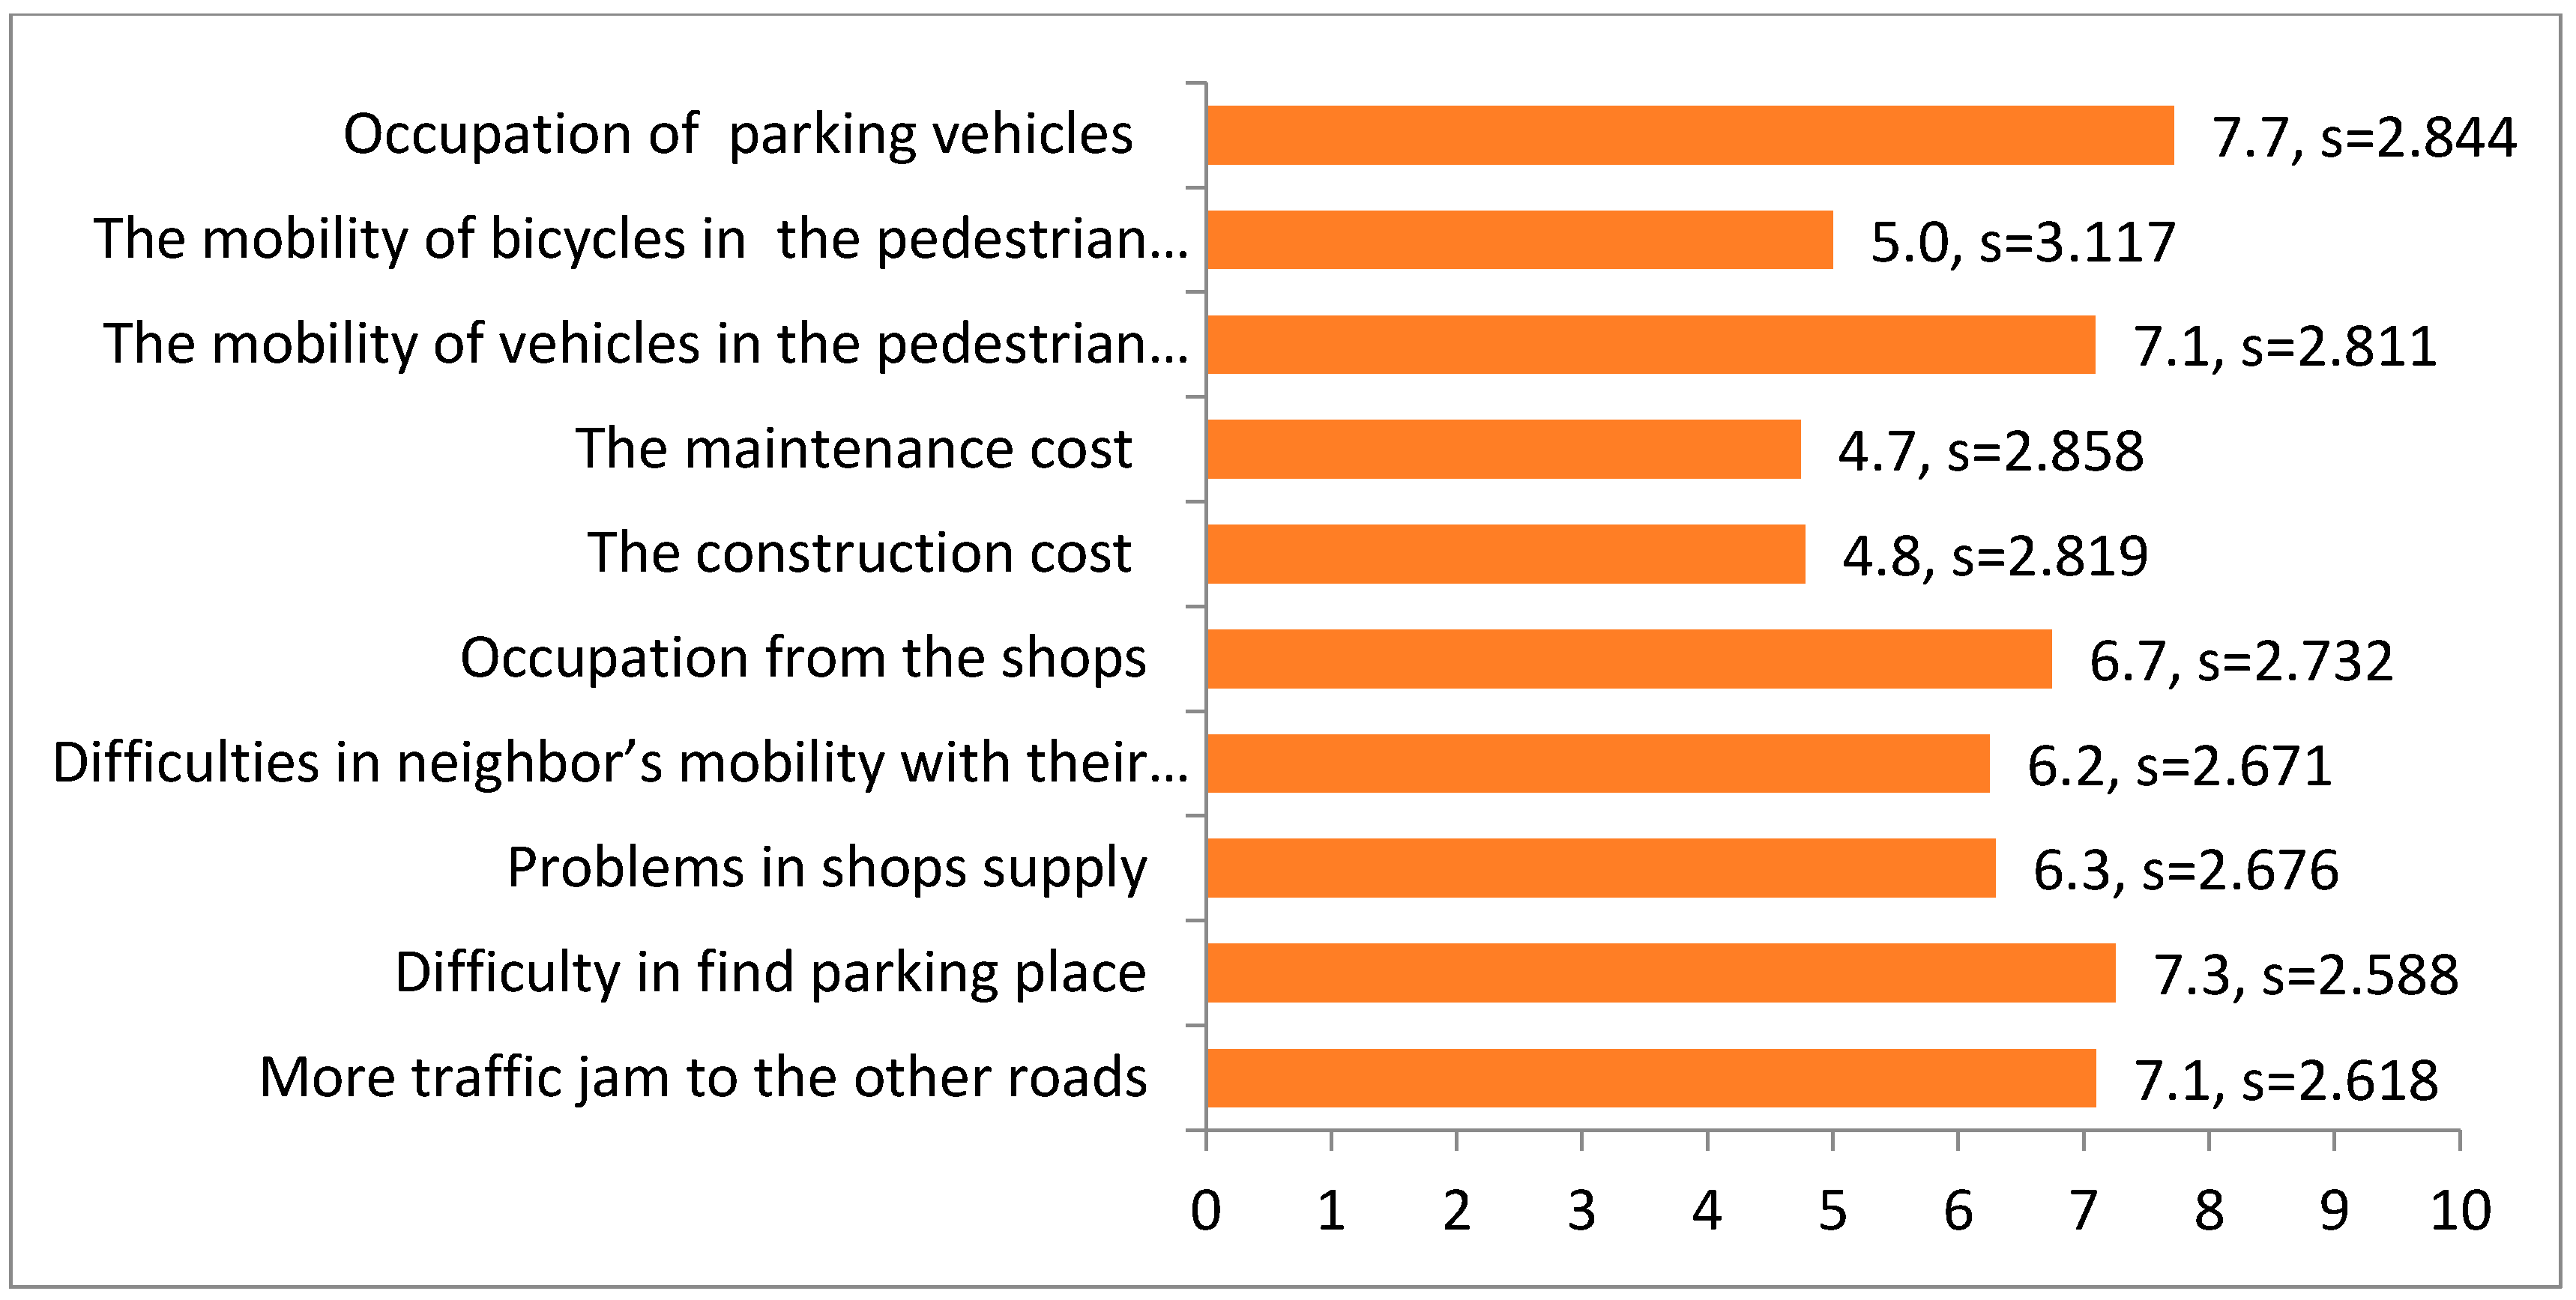
  • Advantages and disadvantages of pedestrian streets
Data were collected in 2014 between the months of April and June. The households were found randomly, using tables of random numbers. A personal interview was conducted for one family member per household. The response rate of the survey was very high (97.5%). Participants had to be at least 18 years old due to legal constraints in Greece. If a member of the specific household was not found or refused to complete the questionnaire, we proceeded to new sample units.
The population proportion p, as well as the estimation of the standard error of the population sp for qualitative data, questions, and the mean and standard deviation s for the quantitative data was carried out through the use of the simple random sampling formulas. To determine the sample size, pre-sampling was used, with a sample size of 50 individuals. The size of the sample was estimated according to the simple random sampling formulas where t = 1.96 and e = 5% (for qualitative data), and where t = 1.96 and e = 0.35 (for quantitative data) [36]. A total of 400 questionnaires were collected from the municipality of Kalamaria at the east of the city of Thessaloniki.
Reliability analysis was applied in the multi-theme variables concerning the advantages and disadvantages of pedestrian streets. In particular, to find out the internal reliability of a questionnaire [37], we used the α coefficient (or reliability coefficient, Cronbach’s α). A coefficient α that is equal to or higher than 0.70 is considered satisfactory [38], while higher than 0.80 is considered very satisfactory. In practice, the reliability coefficients with values lower than 0.60 have also been accepted many times [39]. The validity of the test was checked through factor analysis, aiming to discover the existence of common factors within a group of variables [40].
Regarding the significance of the principal components, we used the criterion suggested by Guttman and Kaiser [37]. The appropriate number of principal components was determined by the values of typical roots equal to or higher than one. Furthermore, we also used the matrix rotation of the main factors, applying Kaiser’s method of maximum variance rotation. Finally, we examined the components that could explain the correlations among the variables of the data, and also attempted to provide an interpretation [41]. The variables that “belong” to each factor were those whose loadings, in the table representing the loadings of the factors after rotation, were higher than 0.5 for that factor.
A statistical segmentation of the residents in three distinct groups (clusters) was undertaken according to the advantages and disadvantages of pedestrian streets from the factor analysis (continued variables) and the acceptance of the transformation of new pedestrian streets, and how frequently they were used (categorical variables) A two-step cluster analysis was chosen for this purpose. This method constitutes a research tool that helps determine clusters with variables of the same characteristics in a large number of data (questionnaires). Considering that the variables were independent of one another, categorical and continued variables were handled at the same time following the polynomial and the normal distribution, respectively [42]. Additionally, the correlation of the other variables (continued or categorical) in every cluster separately was identified with a check of Pearson’s X2. In this way, the identity of every cluster was determined with more accuracy. The statistical package SPSS 16 was used for the data analysis [43].

3. Results

3.1. Demographic Profile of the Respondents

During the interviews, the residents were initially asked about their demographic profile. As shown in Table 1, 45.7% (sp = 0.0254) of the respondents questioned were male, and 54.3% (sp = 0.0254) were female. Most of them (29.9%, sp = 0.0234) were middle-aged (31–40 years), married (57.4%, sp = 0.0252), and without children (43.9%, sp = 0.0253). Regarding their profession, they were mainly public servants (24.9%, sp = 0.0221) or private employees (31.4%, sp = 0.0237). Their educational level was quite high, since over 38.4% (sp = 0.0248) of the respondents had completed upper secondary school or technological education (21.8%, sp = 0.0211).

3.2. Appraising Residents’ Perception of Pedestrian Streets

There is an increasing demand for pedestrian-friendly communities to the detriment of car-oriented developments all over the world [44]. This trend is also followed by the residents of the municipality of Kalamaria, who perceive the transformation of traffic roads to pedestrian streets positively. Two-thirds of the study population 64.5% (sp = 0.0240) were positive to the formation of new pedestrian streets; 21% (sp = 0.0204) were either positive or negative. Only 8% (sp = 0.0136) were negative, and 6.5% (sp = 0.0123) did not answer the question.
The urban environment and landscape (urban scape) can cease to be synonymous with stress and compulsion. It is the right of every resident in a city to walk and observe without stress, and through this observation better know and love his or her city [7]. In the Greek language, the word “omorfo” (meaning beautiful) is something that has a good external shape. The human eye needs time to see the form (shape) of things. Walking and moving slowly, our eyes evaluate the space they are moving through much better. As shown in Figure 2, the improvement of an urban landscape was rated higher by the residents (53.3% as high and 19.8% very high) due to its contribution to pedestrian streets. The contribution to residents’ psychology (48.0% as high and 18.0% very high) was also rated highly. Additionally, economic development and the chance for recreation and sports were rated lower by the residents.
Two-thirds of the residents in the municipality perceived their own well-being as little satisfied (54.8%, sp = 0.0254) or not at all satisfied (11.2%, sp = 0.0161) with their quality of life in the city. Besides, the combination of the current economic downturn and the decrease of available money for recreational activities have highlighted open green spaces as cost-free alternatives [45].
Plantings in the pedestrian zones should create desirable microclimates and contribute to the psychological and visual comfort of users. Planting design and plant choices for areas surrounding pedestrian areas play a big role in the overall appearance and environmental impact of the pedestrian area installation or new development [10].
In previous research conducted by Karanikola et al. [46] in the municipality of Kalamaria, the residents were little satisfied with the existing green infrastructure. In our present research the residents have the same opinion for the existing green infrastructure in pedestrian zones. According to the results, 47.5% (sp = 0.0250) were little and 11.5% (sp = 0.0160) were not at all satisfied with the existing planted trees and plants; 35.5% (sp = 0.0240) were satisfied, 0.5% (sp = 0.0035) were absolutely satisfied; 4.5% (sp = 0.0104) were very satisfied; 0.5% (sp = 0.0035) did not answer the question. At this point, we must explain that the term green infrastructure includes trees that are not only in woodlands but also in streets and provide important ecosystem services in urban population [5,47]. On the contrary, residents were satisfied with the design of the existing pedestrian streets. Specifically, more than half of them were satisfied 50.5% (sp = 0.0250), very satisfied 9.5% (sp = 0.0147), or absolutely satisfied 1.5% (sp = 0.0061) with the design of new pedestrian streets. In total, 31.5% (sp = 0.0233) of the residents stated that they were less satisfied, and 6.3% (sp = 0.0121) were not at all satisfied. In total, 0.8% (sp = 0.0043) of the residents did not answer the question.
In the third part of the survey, the residents were asked about the frequency and the duration of their use of pedestrian streets. According to the results, the majority of residents 73% (sp = 0.0222) visited the pedestrian streets at least once a week, 15.5% (sp = 0.0181) a few times per month. In total, 1.3% (sp = 0.0056) used the pedestrian streets of their municipality for walking only a few times per year or rarely 9.3% (sp = 0.0145). In total, 1% (sp = 0.0050) did not answer the question. Regarding the duration of their visit in the pedestrian streets, 24% (sp = 0.0214) of the residents stated that their visits lasted less than 45 min, 31.75% (sp = 0.0233) walked on the pedestrian streets for 46–60 min, 25.75% (sp = 0.0219) spent less than 150 min, and 13.5% (sp = 0.0171) spent more than 150 min. In total, 5% (sp = 0.0109) of the respondents did not answer the question. Comparing the results of a similar study conducted in three cities of Lithuania [2], the frequency of their visits was lower; only 14% of the residents visited the pedestrian zones of their cities once or twice per week, while 44% of them visited them once or twice per month.
Pedestrianization schemes are often associated with increased retail turnover and increased property values locally [23]. The property value will be higher in a community where one can quickly and comfortably walk to and from local amenities (home to school, parks, and stores) [48]. Regarding the opinion that walkability raises property values, two-thirds 60.8% (sp = 0.0244) of the residents in Kalamaria stated that it has a positive association, and only 4.3% (sp = 0.0101) stated that it has a negative association. One-third 34.5% (sp = 0.0249) of them stated that walkability neither raises nor reduces the property values, and 0.5% (sp = 0.0035) did not answer the question. On the contrary, when they were asked to pay more public taxes for the construction and maintenance of the pedestrian zones (squares and streets), only one-third responded positively (34.3% sp = 0.0238). Due to the current economic crisis, the majority, 64% (sp = 0.0240) did not intend to pay more money. In total, 1.8% (sp = 0.0066) did not answer the question.
Walking is the most affordable and accessible mode of transport, but the second most sustainable form of mobility is cycling. The global trend for urban generation focuses on an urban landscape that benefits pedestrians and cyclists and places importance on urban mobility [7]. However, in Greece, the use of the bicycle is limited, and is quite popular only in small-sized cities [25].
According to the results in the municipality of Kalamaria, about two-thirds of the residents 63.5% (sp = 0.0241) are positive to the use of a bicycle; one-third 29% (sp = 0.0227) were indifferent; and only 7.3% (sp = 0.0130) were negative to the use of a bicycle. In total, 0.3% (sp = 0.0025) did not answer the question. However, they think that their municipality is not suitable for cycling. More specifically, only 4.5% (sp = 0.0104) of residents are of the opinion that the municipality of Kalamaria was absolutely suitable for cycling for their transportation, and 9% (sp = 0.0143) considered it to be very suitable. The remaining respondents characterized Kalamaria’s suitability for cycling as moderate 25.8% (sp = 0.0219), little 42.3% (sp = 0.0247), or not at all 18% (sp = 0.0192). Comparing these results with a similar study in Preveza, a smaller Greek city, the views are completely indifferent. The vast majority, 90.5% of the residents, were positive to the use of a bicycle, and only 1% were negative [25]. The economic crisis led the residents to refuse for pay more public taxes for the construction and maintenance of a cycling route (58.5%, sp = 0.0247 were negative and 38.8%, sp = 0.0244 expressed a positive view). In total, 2.8% (sp = 0.0072) did not answer the question. However, residents recognized the problems created by pedestrian sidewalks (85%, sp = 0.0179 expressed a negative view and only 13.2%, sp = 0.0170 were positive), and pedestrian zones (59%, sp = 0.0249 disagree and 40%, sp = 0.0245 agree). However, the majority accepted the use of cycling in parks (54.8%, sp = 0.0249 agree and 44.8%, sp = 0.0249 disagree).

3.3. Advantages and Disadvantages of Pedestrian Zones

Pedestrian zones enhance accessibility and mobility for pedestrians and improve the attractiveness of the local environment [49]. In order to determine how respondents perceived the existence of pedestrian streets, different variables were examined after completing the literature review. Some of these factors were positive (advantages), and some of them were negative (disadvantages). The evaluation of the advantages using a 10-point Likert scale (1 insignificant and 10 most important) is given in Figure 3.
According to this evaluation, the most important advantages were the ease of pedestrians’ mobility, the safety of pedestrians’ mobility, and space for children’s play. Also important were the variables “Attracting a number of shops”, “Space for meeting and interaction”, “Reduction of atmospheric pollution”, and “Green space and space for recreation”. The results in a similar study conducted by Dičiūnaitė-Rauktienė et al. [2] in three Lithuanian cities were similar. The most important variable was also comfortable and safe space for pedestrians.
We applied a reliability analysis to the above variables after completing all of the necessary checks. The value of the reliability coefficient alpha is 0.894. This constitutes a strong indication that our data has the tendency to measure the same thing. In fact, this is also supported by the significantly high partial reliability coefficient alpha after the deletion of any variable, since even then, no increase in the reliability coefficient is observed. Additionally, before proceeding with the application of the factor analysis, we conducted all of the necessary checks. The value of the Keiser–Meyer–Olkin indicator is 0.841. Furthermore, Bartlett’s test of sphericity rejects the null hypothesis that the correction table is unitary and that the partial correlation coefficients are low. That the measures of sampling adequacy have high to very high values also supports the view that the factor analysis model is acceptable. Two factors are extracted. Table 2 presents the loads that are the partial correlation factors of the 10 variables with each of the three factors resulting from the analysis. The higher the load of a variable in a factor, the more this factor is responsible for the total degree fluctuation of the considered variable.
The variables that “belong” to each factor are the ones for which the load (columns 1, 2) is higher than 0.5 in this factor. Factor 1: the variables “Space for meeting and interaction”, “Promoting space for a healthy lifestyle”, “Green space and space for recreation”, “Space for children’s play”, “Increment of commercial development”, and “Attracting a number of shops, cafes, and other service vendors)” were classed as promoting the quality of life. The second factor named “simulation of the natural environment” included the variables “Reduction of noise pollution” and “Reduction of air pollution”. The variables “Ease of pedestrians’ mobility” and “Safety of pedestrians’ mobility” belong to the first and the second factor. Therefore, the variable “Promoting space for health and lifestyle” had a value higher than 0.5, constituting a bridge between the first and the second factor.
In Greece, sometimes the residents who claim to facilitate pedestrianizations are the ones who negate the pedestrian zones with their actions. These actions may be the parking of vehicles or the mobility of vehicles in pedestrian streets. All of the disadvantages of the existing pedestrian streets in the municipality of Kalamaria were evaluated by the residents. The results are given in Figure 4. The most important factors, as evaluated by the residents, were the parking of vehicles on pedestrian streets, difficulties in finding a parking space for their car, the mobility of vehicles in pedestrian streets, and the increase in traffic of other roads. Although pedestrian streets are used only for pedestrians and allow the entrance and exit of vehicles to private parking spaces and mobility for emergency vehicles or vehicles with supplies, in Greece, these rules are encroached because of a lack of private parking spaces in Kalamaria.
We applied reliability analysis to the above variables after completing all of the necessary checks. The value of the reliability coefficient alpha is 0.841. This constitutes a strong indication that our data has the tendency to measure the same thing. In fact, this is also supported by the significantly high partial reliability coefficient alpha after the deletion of any variable, since even then, no increase of the reliability coefficient is observed. Additionally, before proceeding with the application of the factor analysis, we conducted all of the necessary checks. The value of the Keiser–Meyer–Olkin indicator is 0.762. Furthermore, Bartlett’s test of sphericity rejects the null hypothesis that the correction table is unitary and that the partial correlation coefficients are low. That the measures of sampling adequacy have high to very high values also supports the view that the factor analysis model is acceptable. Three factors are extracted. Table 3 presents the loads that are the partial correlation factors of the 10 variables, with each of the three factors resulting from the analysis.
The first factor includes the variables “More traffic on other roads”, “Difficulty of finding a parking space”, “Problems supplying shops”, and “Difficulties moving residents’ cars”, which we can class as “obstacles in the vehicle’s mobility”. We class the second factor as “occupation of their space”; this includes the variables “Occupation from the shops”, “The mobility of vehicles in pedestrian streets”, “The mobility of bicycles in pedestrian streets”, and “Parked vehicles”. The third factor is classed as “cost”, and it includes the variables “construction–transformation cost” and “maintenance cost”.

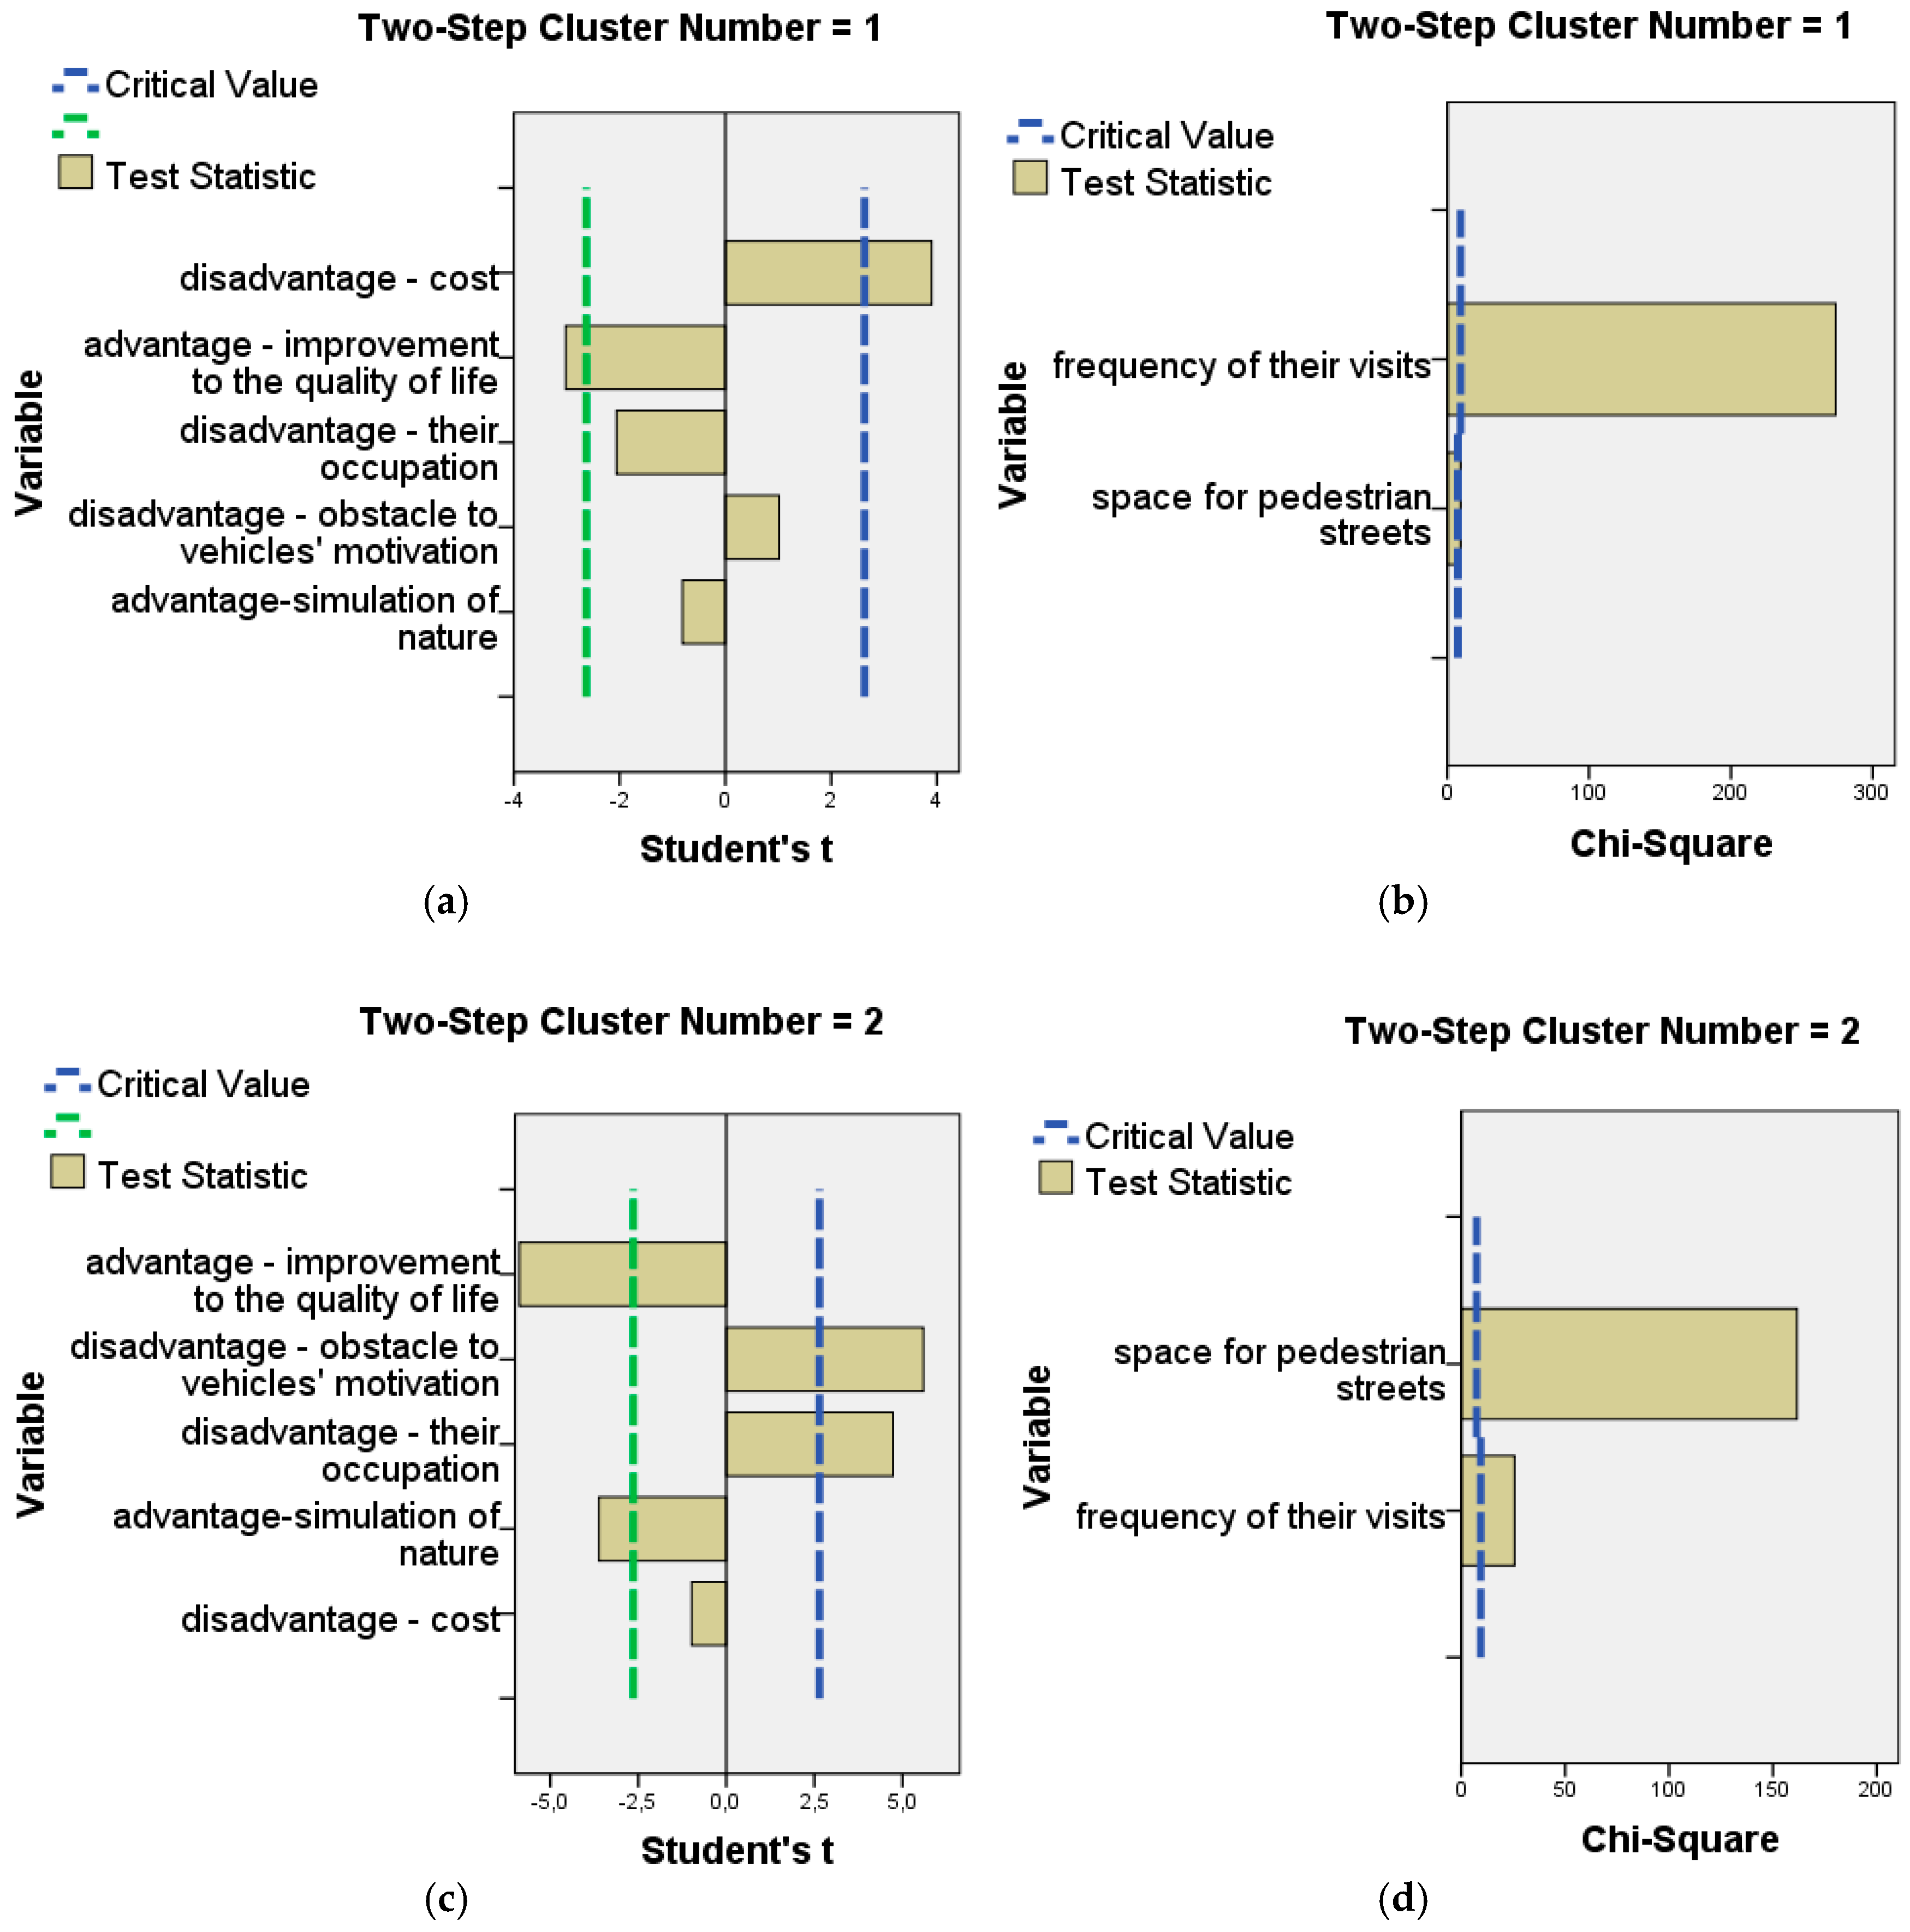
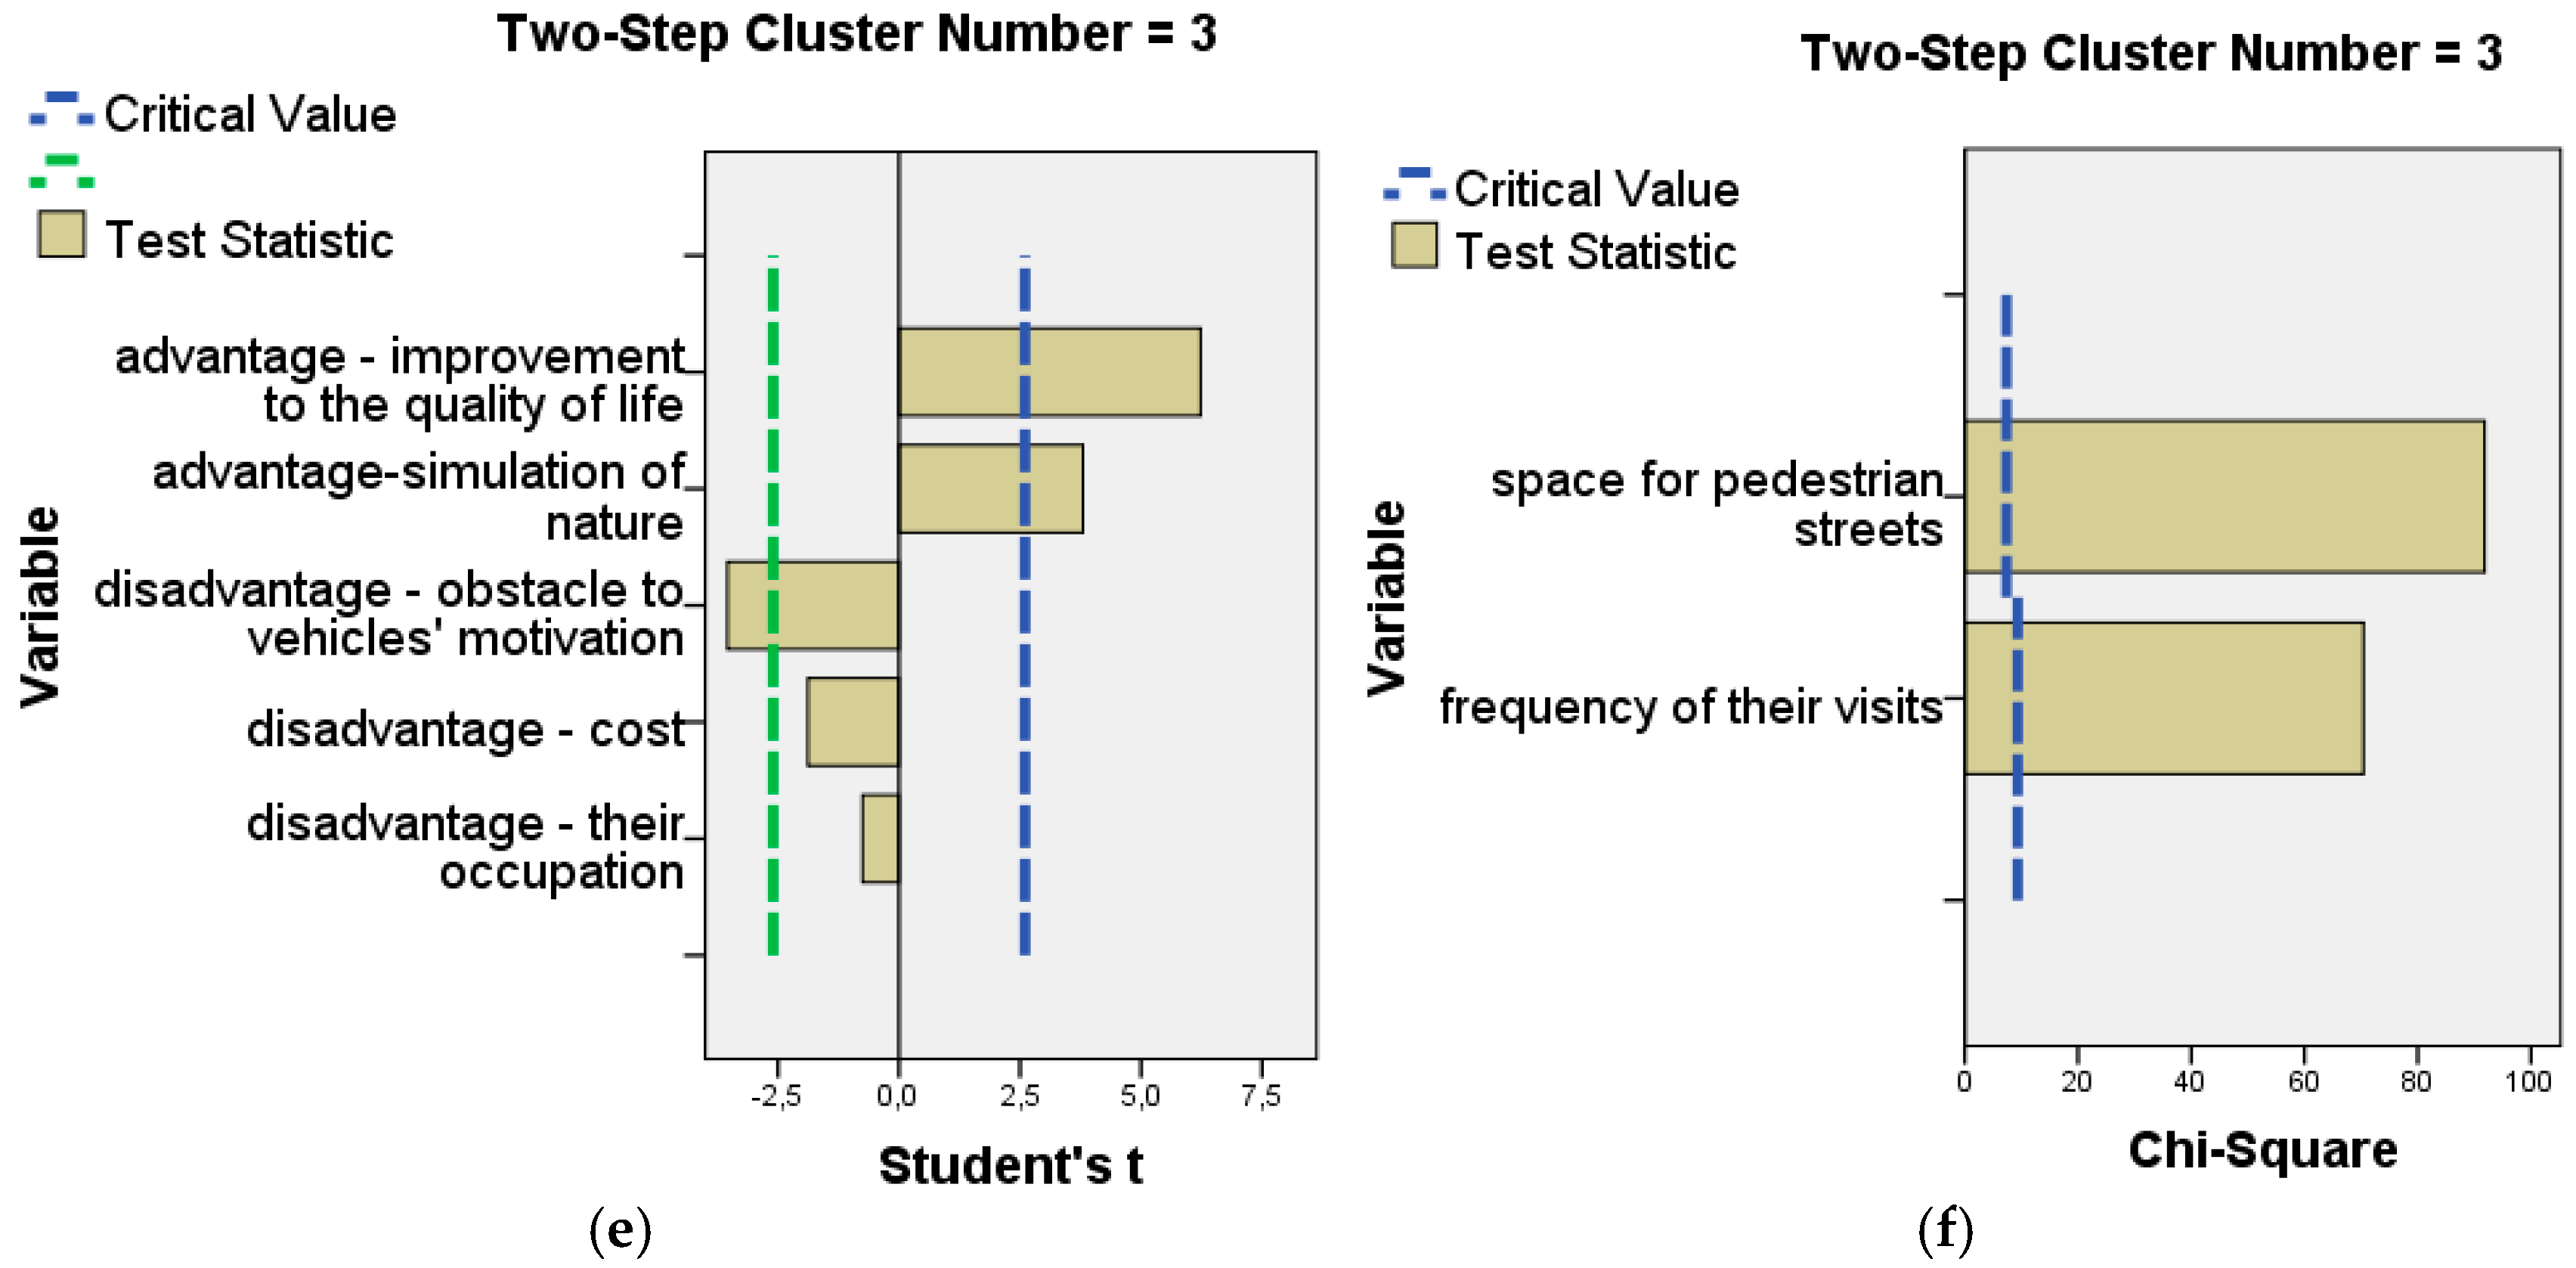
3.4. Correlation of Acceptance of Pedestrian Streets with Residents’ Different Attitudes

The number of clusters was determined from the specific program SPSS by applying the two-step cluster analysis. The observations were grouped into three clusters as the optimum solution. More specifically, of the total sample (400 respondents), 25.9% were placed in the first cluster, 19.7% were placed in the second cluster, and 54.3% were placed in the third cluster.
Regarding the relative significance of the variables (continuous and categorical) in the formation of the clusters, the diagrammatic representations of Figure 5 present the statistical significance tests. In the case of the continuous variables, it was observed that the variable “Maintenance cost” tended to play a significant role in the formation of the first cluster, while the variables “Difficulties in vehicles’ mobility” and “Occupation of pedestrian streets” were the reason for the formation of the second cluster. The variables “Improvement in quality of life” and “Simulation of nature” were the reason for the formation of the third cluster (Figure 5a,c,e).
Furthermore, regarding the categorical variables, the value of the statistical Χ2 exceeded the limits of the critical value, which led to the conclusion that all of the categorical variables used in the analysis were significant for the formation of the three clusters (Figure 5b,d,f).
From the application of the two-step cluster analysis, three clusters of residents were gathered with different characteristics among them. Table 4 presents the characteristics of the three clusters. The Pearson’s X2 test for a statistical significance of α <0.001 presented the relation of the three clusters with other quality variables.
In total, 26% of the residents belong to the first cluster; they had a mediocre or positive view of pedestrian streets, and visited them for less than 45 min just a few times per month or rarely. They were little or not at all satisfied with the design of pedestrian zones and the existing green infrastructure. They were of the opinion that cost was the main disadvantage of pedestrian streets and that their property value was not affected, either positively or negatively, by the nearby pedestrian zones. They refused to pay more public taxes for the construction and maintenance of pedestrian streets and cycling routes.
In total, 19.7% of the residents belong to the second cluster; they had a negative or mediocre attitude toward pedestrian streets and visited them about once a week. The residents of this cluster associated the pedestrian streets with the disadvantages to vehicle mobility, including a lack of parking spaces. Their opinion was that pedestrian streets made little or very little contribution to either the improvement of urban landscape, residents’ health, economic development, and chances for recreation and sports. Their visits to pedestrian zones last 46–150 min, and they claim to be little or not at all satisfied with the design of new pedestrian streets and the related green infrastructure. They were of the opinion that the pedestrian zones in their municipality neither increased nor reduced the property values, and the city was little or not at all suitable for cycling. The residents of that second cluster also did not accept cycling in pedestrian zones and parks, and they refused to pay more taxes for the construction and maintenance of pedestrian zones and cycling routes.
In total, 54.3% of the residents belong to the third cluster; they had a positive attitude toward pedestrian streets in their municipality and correlated them with a high quality of life and natural simulation. The residents of this cluster visited those zones at least once a week and for longer periods. They were of the opinion that pedestrian zones highly contributed to the improvement of urban landscape, human health, economic development, and increased chances for recreation and sport activities. They claimed to be completely satisfied with the design of the pedestrian streets and related green infrastructure. Additionally, they were of the opinion that the existence of the pedestrian zones increased the value of their property in the municipality. They had a positive view on the use of a bicycle, and they accepted cycling in pedestrian zones and parks. Additionally, they considered that their city was suitable for cycling, and they accepted paying more public taxes for the construction and maintenance of pedestrian and cycling zones.

4. Discussion and Conclusions

The economic crisis that Greece has been experiencing since 2008, the increasing ticket prices of public transport services, high car maintenance costs, and increased environmental consciousness have led to people using their vehicles less and less, and subsequently increasing their preference for other modes of transport (bicycles and walking) [50]. To facilitate the mobility of the residents, it is necessary to improve the existing infrastructures of the pedestrian streets and cycling routes. Low-budget strategies, as a deliberate means of creating valuable, attractive, well-used, sociable, public spaces, are sustainable solutions [45]. A number of unused and neglected spaces of often obscure property status, identity, and function can be added to those green public spaces. These urban “cracks”, as Loukaitou-Sideris [51] called them, can act as informal open spaces. Despite their current condition, some urban “cracks” may have a crucial location within the urban fabric, and with low-cost interventions from the local municipality, may be linked to the existing network of open spaces.
Even though Kalamaria is fully urbanized, some natural vegetation can be found mostly on steep slopes along the coastline, which is not fully connected with the green infrastructure network. Moreover, Kalamaria lacks a citywide park, and for this reason, the statutory General Urban Plan considered the reuse of all large empty spaces such as the derelict Kodra military camp and a large part of the Ntalipi military camp [52]. The connection of the existing pedestrian and cycling zones with the coastline pedestrian zone of Kalamaria and Thessaloniki and also with other existing public green areas will provide better quality of life to residents and constitutes a good opportunity for the sustainable and biophilic design of Thessaloniki as a whole.
For this reason, the majority of Kalamaria residents (64.5%) expressed positive views about the construction or transformation of new pedestrian streets in their municipality. Additionally, they were not satisfied with the design quality of the existing infrastructure. The survey also showed that the urban residents visited pedestrian zones at least once a week, and the visit lasted 46–60 min, which is much more time compared to the results of a similar study in Lithuania [2].
Urban landscape improvement and residents’ health were considered as the most important functions of pedestrian zones to residents’ well-being. On the contrary, the economic development of the local market and the chance for recreation and sports were evaluated as less important. This was also influenced by improvements in technology and tools that enable online shopping, which reduced the need for shopping in brick-and-mortar stores. Moreover, a new leisure culture created in shopping centers has resulted in the public space crisis in countries such as Greece, Portugal, and Lithuania [53,54].
The results of this study revealed that the existence of pedestrian zones may contribute to increased property values. Furthermore, the residents were unwilling to pay more public taxes for the pedestrian streets, and they were unwilling to pay for the construction and maintenance of a cycle route. The general perception of residents was that their municipality was not suitable for cycling. However, they viewed the use of a bicycle positively, and they were not disturbed by the existence of bicycles in parks and pedestrian zones, corroborating other similar studies in smaller towns of Greece [26].
Although there has been a significant policy shift in which local governments are taking up increasing responsibility to ensure a safe pedestrian environment, much remains to be implemented. Representations of safer and convenient city pedestrian streets may encourage more people to walk for shorter trips, which will certainly lead to a healthier and more pleasant city [54]. Confirming the above study, the residents of Kalamaria rated the convenience and safety of pedestrians’ mobility as the main advantages of pedestrian streets.
Meanwhile, the pedestrians’ unobstructed mobility may lead to the limitations of other activities [55] that will create a negative opinion about pedestrianization in a significant part of the community. Consequently, urban planners should make the pedestrian streets more accessible to residents, and should also be concerned with the improvement of infrastructure facilities for car parking and means of mass transportation and cycling.
The two-step cluster analysis revealed three clusters of residents with distinct characteristics. The majority of residents (54.3%) belonged to the cluster that had a positive view about pedestrian streets and cycling, agreed to pay more taxes for green infrastructure, and usually had frequent and long visits to pedestrian zones. The smallest cluster, with 19.7% of the residents, was characterized by frequent short visits to pedestrian areas, and these residents associated pedestrian streets with vehicle mobility problems. They had a negative opinion about the new and existing design of pedestrian streets and green infrastructure. They did not accept the idea of paying more taxes for the maintenance of pedestrian zones and cycling routes, and they were generally negative to the use of bicycles in their municipality. Finally, the cluster with 26% of the residents that rarely used pedestrian streets and had a moderate view of them, stating that the benefits derived from pedestrian streets were lower than the construction cost, and that they saw no value in improving the accessibility for all to an urban green infrastructure network.
Information and training programs will be essential to the community in striving for safe walking conditions. Local authorities can use the results of the present survey to manage the city’s green infrastructure and meet the needs of residents for more biophilic urbanism. Public open spaces such as pedestrian streets and other green spaces are key built environment elements within neighborhoods that encourage a variety of physical activity behaviors [56] and offer multiple benefits for human well-being [5]. Meanwhile, urban policy has failed to provide specific design guidance for the health and well-being of all of the residents [57]. This public perception survey enabled urban planners to identify preferred green infrastructure alternatives and use this information in the urban planning framework.
Analysis of the results leaves room for future work that will explore the effects of green infrastructure, such as the effects of pedestrian and cycling streets on local business, and study how to assess the feasibility of the chosen solutions and convert the results into effective policy decisions in the city governance. Based on the research results, the authors believe that urban planning should provide more inclusive green spaces that respond to the varying needs of people across all life-course stages. In future research, it will be essential to study the attitudes of vulnerable and excluded groups such as migrants, the elderly, or people with disabilities, and consider the problems that they experience in relation to accessibility in pedestrian zones.

Author Contributions

All authors contributed equally to this work.

Acknowledgments

This paper was financed by the FCT-Foundation for Science and Technology through project PTDC/GES-URB/31928/2017 “Improving life in a changing urban environment through Biophilic Design”.

Conflicts of Interest

The founding sponsors had no role in the design of the study; in the collection, analyses, or interpretation of data; in the writing of the manuscript, and in the decision to publish the results.

References

  1. Collins Dictionary. 2017. Available online: https://www.collinsdictionary.com/ (accessed on 31 July 2017).
  2. Dičiūnaitė-Rauktienė, R.; Gurskienė, V.; Burinskienė, M.; Maliene, V. The usage and perception of pedestrian zones in Lithuanian cities: Multiple criteria and comparative analysis. Sustainability 2018, 10, 818. [Google Scholar] [CrossRef]
  3. Mehta, V. Evaluating public space. J. Urban Des. 2014, 19, 53–88. [Google Scholar] [CrossRef]
  4. MacLachlan, A.; Biggs, E.; Roberts, G.; Boruff, B. Urban growth dynamics in Perth, Western Australia: Using applied remote sensing for sustainable future planning. Land 2017, 6, 9. [Google Scholar] [CrossRef]
  5. Panagopoulos, T.; Gonzalez Duque, J.A.; Bostenaru Dan, M. Urban planning with respect to environmental quality and human well-being. Environ. Pollut. 2016, 208, 137–144. [Google Scholar] [CrossRef] [PubMed]
  6. Kopecká, M.; Szatmári, D.; Rosina, K. Analysis of Urban Green Spaces Based on Sentinel-2A: Case Studies from Slovakia. Land 2017, 6, 25. [Google Scholar] [CrossRef]
  7. Knoflacher, H.; Rod, P.; Tiwary, G. How roads kill cities. In The Endless City; Burdett, R., Sudjic, D., Eds.; Phaidon: London, UK, 2010. [Google Scholar]
  8. Delso, J.; Martin, B.; Ortega, E.; Otero, I. A model for assessing pedestrian corridors. Application to Victoria- Gasteiz City (Spain). Sustainability 2017, 9, 434. [Google Scholar] [CrossRef]
  9. Willis, A.; Gjersoe, N.; Havard, C.; Kerridge, J.; Kukla, R. Human movement behavior in urban spaces: Implications for the design and modeling of effective pedestrian environments. Environ. Plan. B Plan. Des. 2004, 31, 805–818. [Google Scholar] [CrossRef]
  10. Sisman, E.E. Pedestrian zones. Adv. Lands. Archit. 2013, 16, 401–426. [Google Scholar]
  11. Talen, E. Pedestrian access as a measure of urban quality. Plan. Pract. Res. 2002, 17, 257–278. [Google Scholar] [CrossRef]
  12. Blecic, I.; Canu, D.; Cecchini, A.; Congiut, T.; Fancello, G. Walkability and street intersections in rural-urban fringes: A decision aiding evaluation procedure. Sustainability 2017, 9, 883. [Google Scholar] [CrossRef]
  13. Pinna, F.; Murrau, R. Isolated and single pedestrians and pedestrian groups on sidewalks. Infrastructures 2017, 2, 21. [Google Scholar] [CrossRef]
  14. Robertson, K.A. Pedestrianization strategies for downtown planners: Skywalks versus pedestrian malls. J. Am. Plan. Assoc. 1993, 59, 361–370. [Google Scholar] [CrossRef]
  15. Beatley, T.; Newman, P. Biophilic cities are sustainable, resilient cities. Sustainability 2013, 5, 3328–3345. [Google Scholar] [CrossRef]
  16. Soni, N.; Soni, N. Benefits of pedestrianization and warrants to pedestrianize an area. Land. Use Policy 2016, 57, 139–150. [Google Scholar] [CrossRef]
  17. Ward, S.V. What did the Germans ever do for us? A century of British learning about and imagining modern town planning. Plan. Perspect. 2010, 25, 117–140. [Google Scholar] [CrossRef]
  18. Hass Klau, C. Impact of pedestrianization and traffic calming on retailing a review of the evidence from Germany and the UK. Transp. Policy 1993, 1, 21–31. [Google Scholar] [CrossRef]
  19. Newman, L. The virtuous cycle: Incremental changes and a process-based sustainable development. Sustain. Dev. 2007, 15, 267–274. [Google Scholar] [CrossRef]
  20. Blaga, O.E. Pedestrian ones as important urban strategies in redeveloping the community-Case study: Alba Iulia Borough Park. Transylv. Rev. Admin. Sci. 2013, 38, 5–22. [Google Scholar]
  21. Carmona, M. London’s local high streets: The problems, potential and complexities of mixed street corridors. Prog. Plan. 2015, 100, 1–84. [Google Scholar] [CrossRef]
  22. Wicramasinghe, V.; Dissanayake, S. Evaluation of pedestrians’ sidewalk behavior in developing countries. Transp. Res. Procedia 2017, 25, 4068–4078. [Google Scholar] [CrossRef]
  23. Jakovlevas-Mateckis, K. Some aspects of the formation of pedestrian streets and zones in the new public spaces of urban centre. J. Arch. Urban 2012, 36, 252–263. [Google Scholar]
  24. Vlachokostas, C.; Nastis, S.; Achillas, C.; Kalogeropoulos, K.; Karmiris, I.; Moussiopoulos, N.; Chourdakis, E.; Banias, G.; Limperi, N. Economic damages of ozone air pollution to crops using combined air quality and GIS modelling. Atmos. Environ. 2010, 44, 3352–3361. [Google Scholar] [CrossRef]
  25. Castillo-Manzano, J.I.; Lopez-Valpuesta, L.; Asencio-Flores, J.P. Extending pedestrianization processes outside the old city center; conflict and benefits in the case of the city of Seville. Habitat Int. 2014, 44, 194–201. [Google Scholar] [CrossRef]
  26. Pooley, C.; Horton, D.; Schelderman, G.; Mullen, C.; Jones, T.; Tight, M.; Jopson, A.; Chisholm, A. Policies for promoting walking and cycling in England: A view from the street. Transp. Policy 2013, 27, 66–72. [Google Scholar] [CrossRef]
  27. Karanikola, P.; Panagopoulos, T.; Tampakis, S.; Tsantopoulos, G. Cycling as a smart and green mode of transport in small touristic cities. Sustainability 2018, 10, 268. [Google Scholar] [CrossRef]
  28. Winters, M.; Davidson, G.; Pearce, C.; Teschke, K. Cycling in cities-Understanding people, neighborhoods and infrastructure to guide urban design for active transportation. In Proceedings of the 45th International Making Cities Livable Conference, Portland, OR, USA, 10–14 June 2007. [Google Scholar]
  29. Vlastos, T.; Milakis, D. Planning of a cycling network in a Greek city according to geometrical criteria. The case of Moschato. Tech. Chron. Sci. J. 2003, 23, 35–46. [Google Scholar]
  30. Milakis, D. Will Greeks cycle? Exploring intention and attitudes in the case of the new bicycle network of Patras. Int. J. Sustain. Transp. 2015, 9, 321–334. [Google Scholar] [CrossRef]
  31. Papavasileiou, C.; Milakis, D.; Vlastos, T. Car dependence or appetence? Examination of attitudes towards sustainable mobility in the Greek case. In Proceedings of the 12th World Conference on Transport Research, Lisbon, Portugal, 11–15 July 2010. [Google Scholar]
  32. Tampakis, S.; Karanikola, P.; Tsantopoulos, G.; Andrea, V.; Antipa, N.M.; Paroni, D.V. Exploring the positive and negative impacts of bicycling in the city of Orestiada, Greece. In Proceedings of the Virtual International Conference on Advanced Research in Scientific Areas (ARSA-2013), Bratislava, Slovakia, 2–6 December 2013; pp. 346–350. [Google Scholar]
  33. Matis, K. Forest Sampling; Democritus University of Thrace: Xanthi, Greece, 2001. [Google Scholar]
  34. Hoyos, D. The state of the art of environmental valuation with discrete choice experiments. Ecol. Econ. 2010, 69, 1595–1603. [Google Scholar] [CrossRef]
  35. Pagano, M.; Gauvreau, K. Elements of Biostatistics; Ellin Publications: Athens, Greece, 2000. [Google Scholar]
  36. Karlis, D. Multivariate Statistical Analysis; Stamoulis Publications: Athens, Greece, 2005. [Google Scholar]
  37. Frangos, C.K. Methodology of Market Research and Data Analysis with the Use of the Statistical Package SPSS for Windows; Interbooks Publications: Athens, Greece, 2004. [Google Scholar]
  38. Howitt, D.; Gramer, D. Statistics with the SPSS 11 for Windows; Kleidarithmos Publications: Athens, Greece, 2003. [Google Scholar]
  39. Siardos, G.Κ. Multivariate Statistical Analysis Methods. Part I: Exploring the Relations between Variables; Zitis Publications: Thessaloniki, Greece, 1999. [Google Scholar]
  40. Sharma, S. Applied Multivariate Techniques; John Wiley & Sons: New York, NY, USA, 1996. [Google Scholar]
  41. Djoufras, I.; Karlis, D. Elements of Multivariate Data Analysis; University of the Aegean: Chios, Greece, 2001. [Google Scholar]
  42. Harman, H.H. Modern Factor Analysis; The University of Chicago Press: Chicago, IL, USA, 1976. [Google Scholar]
  43. SPSS Categories 16; A Software Package, Version 16.0; SPSS Inc.: Chicago, IL, USA, 2008.
  44. Speck, J. Walkable City: How Downtown Can Save America, One Step at a Time; Farrar, Straus and Giroux: New York, NY, USA, 2012. [Google Scholar]
  45. Herman, K.; Sbarcea, M.; Panagopoulos, T. Creating green sustainability through low-budget and upcycling strategies. Sustainability 2018, 10, 1857. [Google Scholar] [CrossRef]
  46. Karanikola, P.; Panagopoulos, T.; Tampakis, S.; Karipidou-Kanari, A. A perceptual study users’ expectations of urban green infrastructure in Kalamaia, municipality of Greece. Manag. Environ. Qual. 2016, 27, 568–584. [Google Scholar] [CrossRef]
  47. Obrien, L.; DeVreese, R.; Atmis, E.; Olafsson, A.S.; Sievanen, T.; Brennan, M.; Sanchez, M.; Panagopoulos, T.; DeVries, S.; Kern, M.; et al. Social and environmental justice: Diversity in access to and benefits from urban green infrastructure- examples from Europe. In The Urban Forest; Pearlmutter, D., Calfapietra, C., Samson, R., O’Brien, L., Ostoić, S.K., Sanesi, G., del Amo, R.A., Eds.; Springer: Berlin, Germany, 2017. [Google Scholar] [CrossRef]
  48. Cohen, S. Does Walkability Raise Property Values? 2010. Available online: http://www.houselogic.com/home-advice/green-living/does-walkability-raise-property-values/# (accessed on 12 May 2018).
  49. Chiquetto, S. The environmental impacts from the implementation of a pedestrianization scheme. Transp. Res. Part D Transp. Environ. 1997, 2, 133–146. [Google Scholar] [CrossRef]
  50. Efthymiou, D.; Antoniou, C. Understanding the effects of economic crisis on public transport users’ satisfaction and demand. Transp. Policy 2017, 53, 89–97. [Google Scholar] [CrossRef]
  51. Vartholomaios, A.; Papadopoulou, M.; Lafazani, P.; Paraschakis, I.; Arvanitis, A.; Sarafidis, D. Identifying ‘crisis-proof’ places. An assessment of public space accessibility using Space Syntax and GIS in the Municipality of Kalamaria, Greece. In Proceedings of the 10th International Congress of the Hellenic Geographical Society, Thessaloniki, Greece, 22–24 October 2014. [Google Scholar]
  52. Loukaitou-Sideris, A. Cracks in the city: Addressing the constraints snd potrentisl of urban design. J. Urban Des. 1996, 1, 91–106. [Google Scholar] [CrossRef]
  53. Rudokas, K. The shift of the public space paradigm in prosoviet Lithuania. Logos 2013, 77, 211–222. [Google Scholar]
  54. Rahaman, K.R.; Lourenço, J.; Viegas, J.M. Perceptions of pedestrians and shopkeepers in European medium-sized cities: Study of Guimarães, Portugal. J. Urban Plan. Dev. 2012, 138. [Google Scholar] [CrossRef]
  55. Ehrenfeucht, R.; Loukaitou-Sideris, E. Constructing the sidewalks: Municipal government and the production of public space in Los Angeles, California, 1880–1920. J. Hist. Geogr. 2007, 33, 104–124. [Google Scholar] [CrossRef]
  56. Koohsari, M.J.; Mavoa, S.; Villanueva, K.; Sugiyama, T.; Badland, H.; Kaczynski, A.T.; Owen, N.; Giles-Corti, B. Public open space, physical activity, urban design and public health: Concepts, methods and research agenda. Health Place 2015, 33, 75–82. [Google Scholar] [CrossRef] [PubMed]
  57. Douglas, O.; Lennon, M.; Scott, M. Green space benefits for health and well-being: A life-course approach for urban planning, design and management. Cities 2017, 66, 53–62. [Google Scholar] [CrossRef]
Figure 1. Masterplan of Kalamaria municipality showing the green areas and the green infrastructure network for the unification of public use areas and social services. Adapted from the revised Masterplan of Kalamaria municipality (FEK 3/AAP/15-1-2015).
Land 07 00100 g001
Figure 2. Contribution of pedestrian streets to residents’ quality of life.
Land 07 00100 g002
Figure 3. Evaluation of the advantages of pedestrian streets using a 10-point Likert scale (means and standard deviations).
Land 07 00100 g003
Figure 4. Evaluation of the disadvantages of pedestrian streets using a 10-point Likert scale (mean and standard deviations).
Land 07 00100 g004
Figure 5. Diagrammatic representations of the statistical tests of variables per cluster (a,c,e continuous and b,d,f categorical variables).
Land 07 00100 g005aLand 07 00100 g005b
Table 1. Socio-demographic profile of the sample (sp: Standard error of proportion).
p (%)sp
GenderMale45.70.0254
Female54.30.0254
Age18–3020.80.0207
31–4029.90.0234
41–5026.50.025
>5020.30.0205
No answer2.60.0081
Marital statusUnmarried28.80.0230
Married57.40.0252
Divorced/widowed11.70.0156
No answer2.30.0077
Number of childrenWithout children43.0.0253
One child17.10.0192
Two children30.90.0236
Three children5.20.0113
More than three2.90.0085
Educational levelPrimary School9.10.0147
Lower Secondary5.50.0116
Upper Secondary38.40.0248
Technical School6.80.0128
Technological educ.21.80.0211
University14.50.0180
No answer3.90.0099
ProfessionPrivate employee31.40.0237
Public servant24.90.0221
Self-employed23.60.0217
Farmer0.50.0037
Pensioner3.40.0092
Student7.80.0137
Homemaker3.60.0096
Unemployed2.90.0085
No answer1.80.0068
Annual income≤5,000 €8.30.0141
5,001–10,000 €14.30.0179
10,001–20,000 €26.00.0224
20,001–30,000 €15.30.0184
>30,000 €13.50.0174
No answer22.60.0213
Table 2. Factor burdens after rotation for the multivariable advantages of pedestrian streets.
VariableFactor Burdens after the Rotation
12
Convenience of pedestrians’ mobility0.5440.590
Safety of pedestrians’ mobility0.5200.621
Reduction of noise pollution0.2060.862
Reduction of air pollution0.0990.888
Space for meeting and interaction0.6830.350
Promoting space for a healthy lifestyle0.5430.540
Space for recreation and green infrastructure0.7970.228
Space for children’s play0.7900.042
Increment of commercial development0.7380.243
Attracting a number of shops, cafes, and other service vendors0.5490.260
Table 3. Table with factor burdens after rotation, for the multivariable disadvantages of the pedestrian streets.
VariableFactor Burdens after the Rotation
123
More traffic on other roads0.8720.0670.148
Difficulty of finding a parking space0.8930.1380.147
Problems in supplying shops0.5740.4170.198
Difficulties moving residents’ cars0.5840.2850.421
Occupation from the shops0.2240.5700.193
The construction cost0.2390.0830.931
The maintenance cost0.1820.1250.945
The mobility of vehicles in pedestrian streets0.1130.8400.084
The mobility of bicycles in pedestrian streets0.2600.5090.259
Parked vehicles0.0320.866−0.084
Table 4. Interpretation of the clusters’ observations.
VariablesCluster 1Cluster 2Cluster 3
space for pedestrian streetsmoderate or positivenegative or moderatepositive
frequency of their visitstimes per month or rarelytimes per weektimes perweek
advantage -improvement to the quality of lifeevaluated as insignificantevaluated as insignificantevaluated as significant
advantage-simulation of natureevaluated as insignificantevaluated as insignificantevaluated as significant
disadvantage- obstacle to vehicles motivationevaluated as limited significantevaluated as insignificantevaluated as insignificant
disadvantage-their occupationevaluated as insignificantevaluated as significantevaluated as insignificant
disadvantage-costevaluated as significantevaluated as insignificantevaluated as insignificant
With the check of Pearson’s X2
contribution of pedestrian streets-improvement to cityscapesignificant to very significantlittle significant to insignificantsignificant to very significant
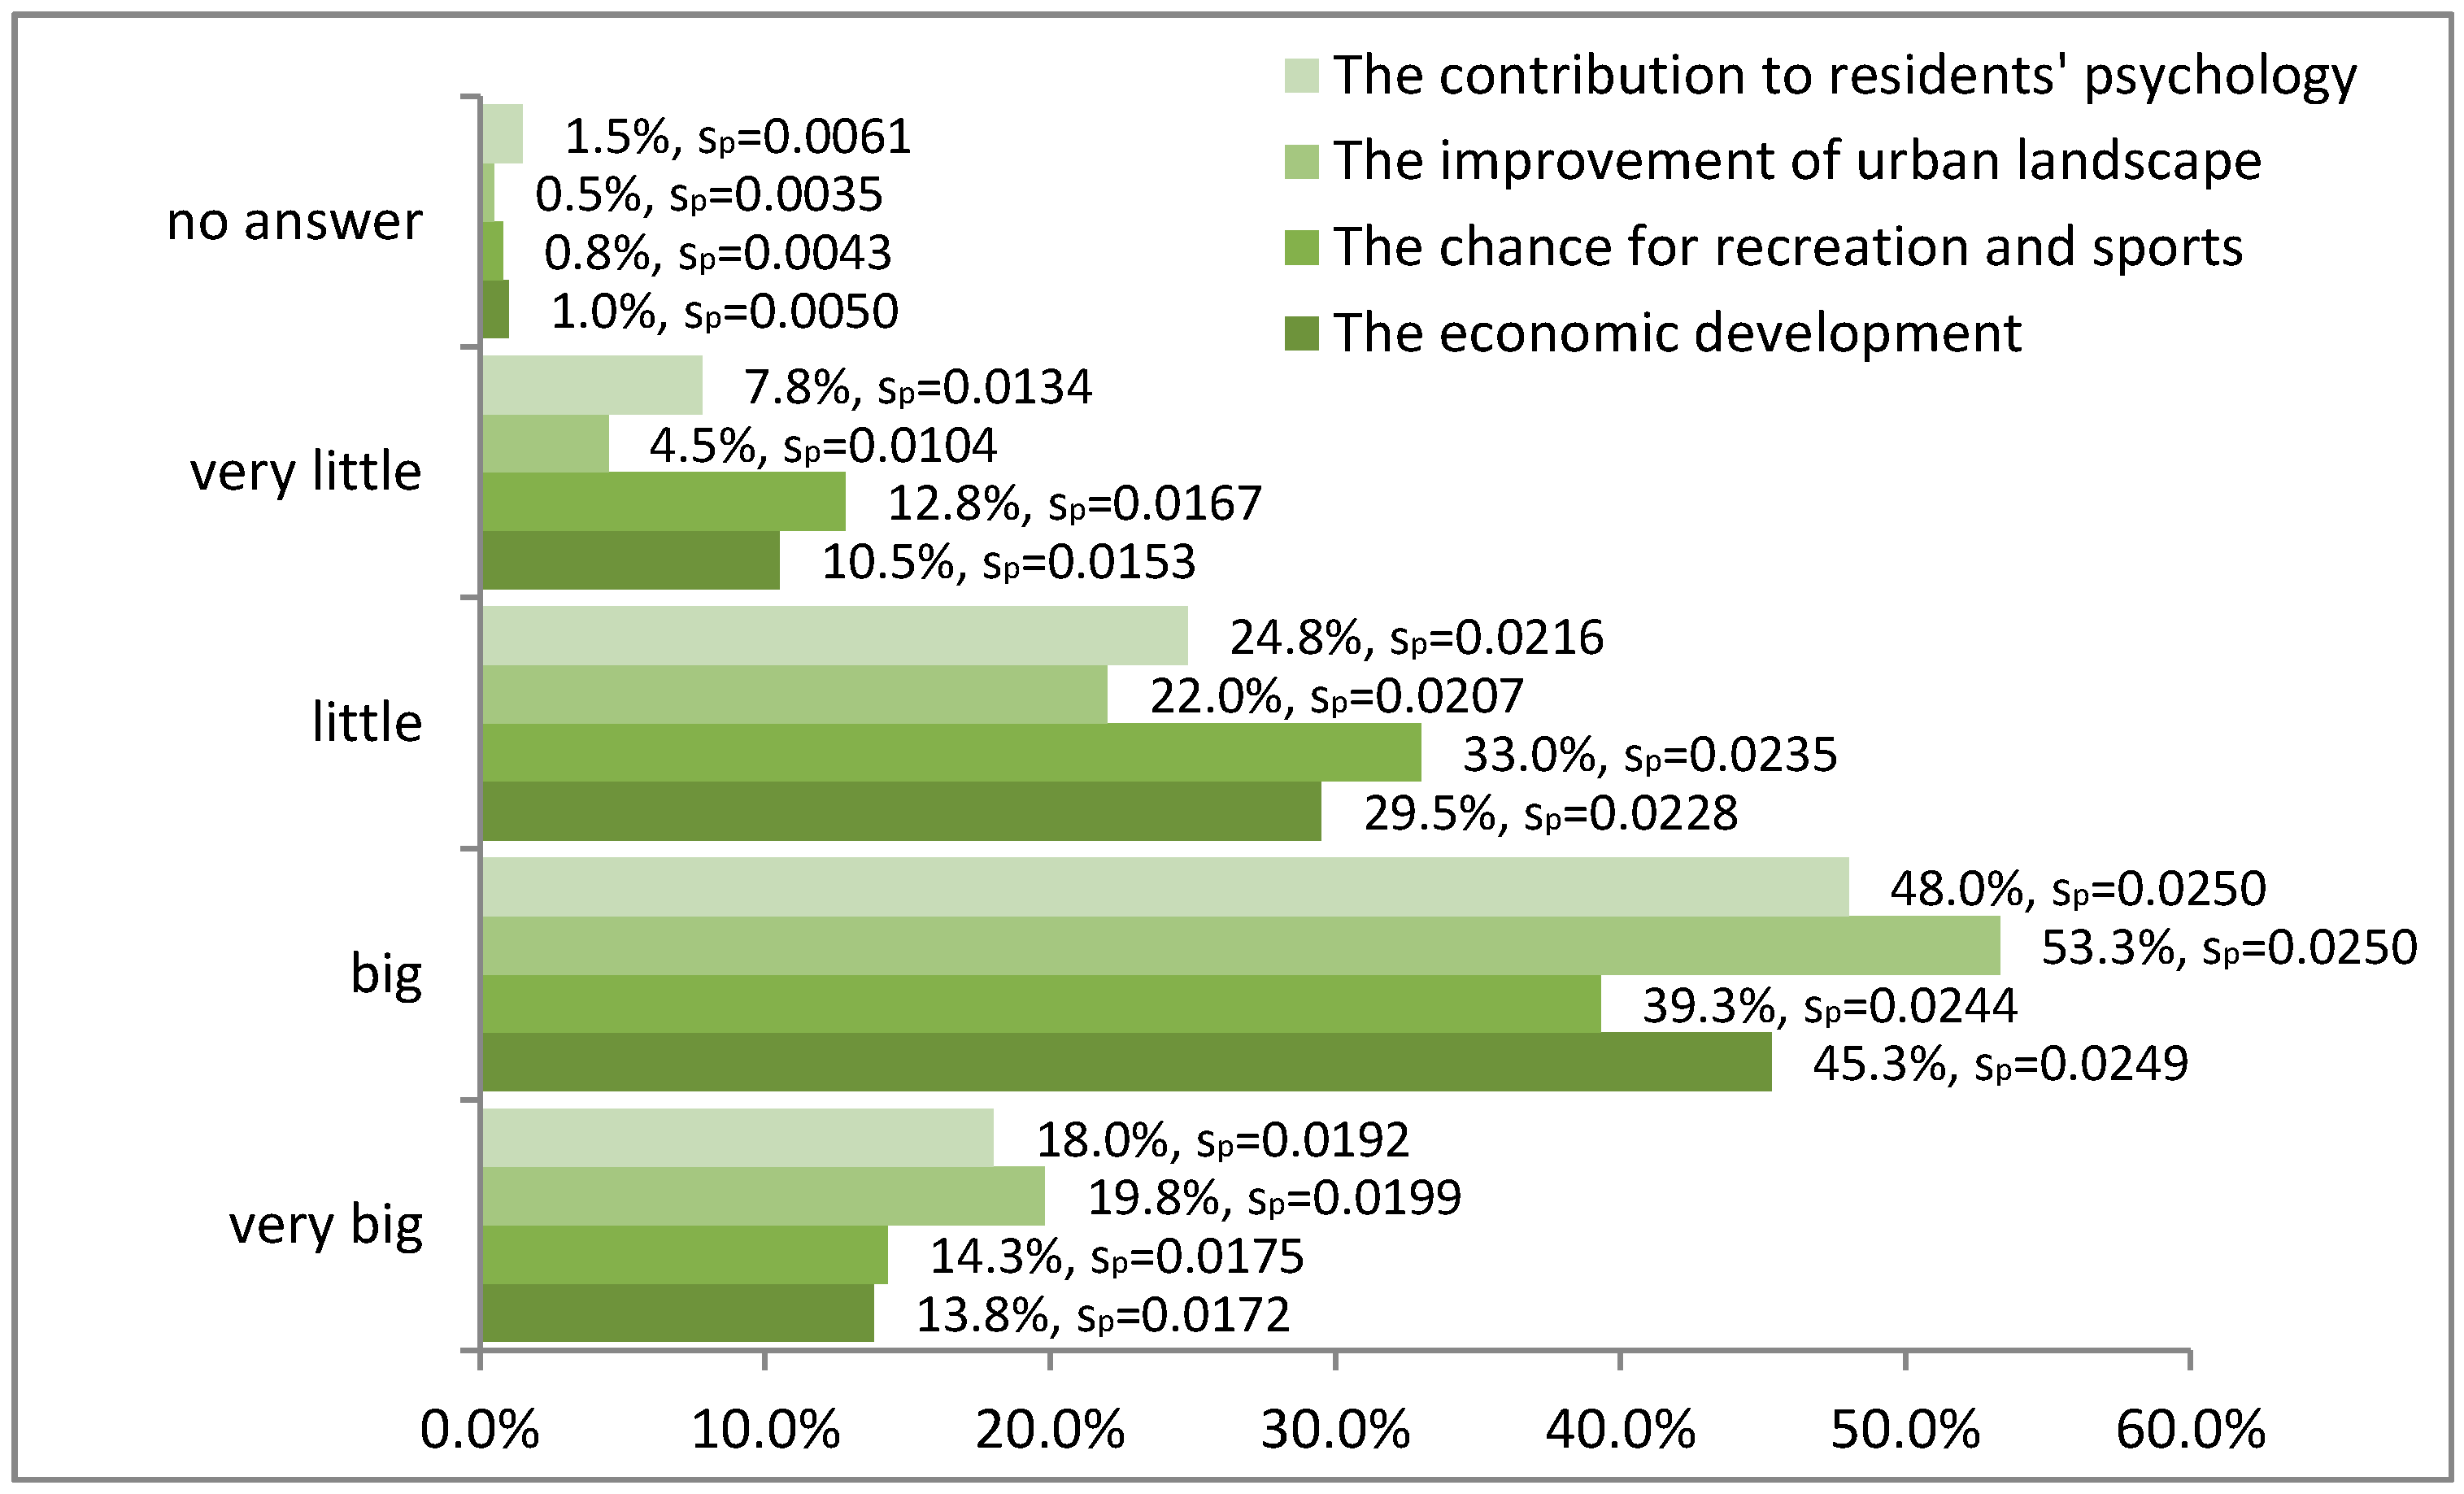
contribution of pedestrian street-residents’ phycologylittle to very littlelittle to very littlebig to very big
contribution of pedestrian streets-economic developmentlittle to very littlelittle to very littlebig to very big
contribution of pedestrian streets-chance for recreation and sportsbig or very biglittle or very littlebig or very big
duration of visitless than 45 min.46-150minmore than 60 min
design of pedestrian streetslittle or not at all satisfiedlittle or not at all satisfiedabsolutely satisfied or satisfied
green infrastructure of pedestrian streetsNot at all satisfiedlittle or not at all satisfiedvery satisfied or satisfied
effect to property valueneither increase nor reducereduce or neither increase nor reduceincrease them
space to the use of bicyclemoderatemoderate and negativepositive
suitability of the city for cyclingvery suitable, little or not at all suitablelittle or not at all suitableabsolutely or very suitable
to permit bicycles in pedestrian streetsyesnoyes
to permit bicycles in parksyesnoyes
more public taxes for the construction and maintenance of pedestrian streetsnonoyes
more public taxes for the construction and maintenance of cycling netnonoyes

