Article

Nanotribological Performance Factors for Aqueous Suspensions of Oxide Nanoparticles and Their Relation to Macroscale Lubricity

1
Department of Physics, North Carolina State University, Raleigh, NC 27695, USA
2
Department of Material Science & Engineering, North Carolina State University, Raleigh, NC 27695, USA
3
Department of Chemistry, North Carolina State University, Raleigh, NC 27695, USA
*
Authors to whom correspondence should be addressed.
Current address: Materials Department, University of California, Santa Barbara, CA 93106, USA.
Lubricants 2019, 7(6), 49; https://doi.org/10.3390/lubricants7060049
Submission received: 25 April 2019 / Revised: 25 May 2019 / Accepted: 3 June 2019 / Published: 7 June 2019
(This article belongs to the Special Issue Recent Research in Nanolubricants)

Abstract

:
Quartz crystal microbalance (QCM) measurements of nanotribological properties of statistically diverse materials combinations of nanoparticles and substrate electrodes in aqueous suspensions are reported and compared to macroscale measurements of the same materials combinations for a subset of the nanoparticle combinations. Four ceramic nanoparticles, TiO2, SiO2, Al2O3, and maghemite (γ-Fe2O3) and ten substrate materials (Au, Al, Cr, Cu, Mo, Ni, Pt, SiO2, Al2O3, and SS304) were studied. The QCM technique was employed to measure frequency and motional resistance changes upon introduction of nanoparticles into the water surrounding its liquid-facing electrode. This series of experiments expanded prior studies that were often limited to a single nanoparticle - solid liquid combination. The variations in QCM response from one nanoparticle to another are observed to be far greater than the variation from one substrate to another, indicating that the nanoparticles play a larger role than the substrates in determining the frictional drag force levels. The results were categorized according to the direction of the frequency and motional resistance changes and candidate statistical performance factors for the datasets were generated. The performance factors were employed to identify associations between the QCM atomic scale results and the macroscale friction coefficient measurements. Macroscale measurements of friction coefficients for selected systems document that reductions (increases) in motional resistance to shear, as measured by the QCM, are linked to decreases (increases) in macroscale friction coefficients. The performance factors identified in the initial study therefore appear applicable to a broader set of statistically diverse samples. The results facilitate full statistical analyses of the data for identification of candidate materials properties or materials genomes that underlie the performance of nanoparticle systems as lubricants.

Graphical Abstract

1. Introduction

Development of environmentally friendly additives is expanding rapidly [1]. Recent studies in nanostructured materials and surface coatings have revealed, for example, that water can be used as the working fluid in place of oil for lubrication purposes [2,3,4]. Unlike many conventional additives to oil-based lubricants, nanoparticles are suitable as additives in water-based lubricants. They are available as manufactured materials with a wide range of surface treatments and have great potential for reducing friction [5]. Reductions or increases in friction coefficients and wear associated with nanoparticles are, however, closely linked to nanoparticle concentration, size, morphology, electrical charge, and the surface treatment employed to prevent agglomeration [6,7]. Given that nanoparticles are also ubiquitous in nature in the form of wear particles resulting from frictional rubbing process [8], studies of their behavior are timely and compelling. We report here a study of statistically diverse materials combinations of aqueous suspensions of nanoparticles (NP) and substrate electrodes. Four oxide NPs dispersed in water have been chosen: Al2O3, SiO2, and TiO2, which develop a significant surface charge in aqueous suspensions at acidic, normal, and alkaline pH, respectively, and Fe2O3 NP with surface treatments to attach side-chain molecules for steric repulsion to prevent agglomeration.
Aqueous-based NP suspensions are candidate lubrication systems of particular interest from both energy efficiency and environmental sustainability standpoints. While some NPs provide lubrication for specific substrates, others have little effect or even give rise to additional friction and wear [9]. Given that some nanoparticle suspensions are lubricious in some applications while others are detrimental, the fundamental mechanisms associated with the presence of NP that give rise to macroscale tribological performance is now the major focus of current research [5,7,9]. The results of such studies also have impact on the broader field of ceramic nanoparticles applications in the fields of physics, materials, chemistry, biomedicine, and pharmaceuticals, where knowledge of the interactions of nanoparticles at solid–liquid interfaces is key to progress [10,11,12,13,14,15].
Fundamental understanding of physical and chemical processes that govern the role of nanoparticles in tribological applications has yet, however, to be established. Dai et al. performed an extensive literature-based statistical analysis to identify the key material properties and fundamental interactions responsible for friction and wear reductions for oil-based nanoparticle suspensions [6], but a lack of common conditions for data recording presented a significant challenge. Further, it is unclear at present whether cases of nanoparticle reductions in friction reported in literature actually outnumber those that increase friction, or if the latter are being underreported.
In order to identify key material properties and fundamental interactions responsible for friction reductions by nanoparticle-based additives in liquid suspensions using a statistical procedure, experimentally consistent performance parameters for statistically diverse combinations of materials are required. The present research therefore focuses on varying the properties of nanoparticles and substrate materials and examining the interfacial effects in an aqueous medium under standardized experimental conditions. The overarching goal is to then to identify experimental parameter(s) that correlate with the tribological properties of various nanoparticle–substrate combinations. Here we have employed a quartz crystal microbalance (QCM) to record data in a manner that has recently been linked directly to percent reduction in macroscale friction for materials lubricated by the same suspensions [9,16]. In particular, we examined the change in resonant frequency and resistance to a QCM’s oscillation and shear motion upon introduction of Al2O3, TiO2, SiO2, and Fe2O3 nanoparticles into an aqueous medium for ten different surface electrode materials, including 304 stainless steel (304SS), metallic Al, Au, Cu, Cr, Mo, Ni, and also oxides alumina and silica. The data are used to derive nanotribological performance factors associated with the lubricity of nanoparticles at the solid–liquid interface, and then compared to macroscale friction measurements for selected materials combinations. The performance factors identified indicate that the method may be applicable to a broad set of macroscale systems, for mixed or hydrodynamic regimes of lubrication [16]. The results therefore facilitate full statistical analyses of the data for identification of candidate materials properties and materials genomes that underlie the performance of nanoparticle systems as lubricants.

2. Materials

2.1. Nanoparticles

Aqueous suspension of anatase TiO2 (titania) and gamma Al2O3 (alumina) nanoparticles were purchased from US Research Nanomaterials (stock numbers: US7071 and US7030) (Houston, TX, USA). The stock suspensions of nanoparticles at concentrations of ~20 wt % were dispersed in deionized water to obtain the desired concentrations. At the ambient temperature of 23 °C, the density and viscosity of deionized water are 997.5 kg/m3 and 9.32 × 10⁻⁴ kg/ms, respectively, and pH = 6.7. Zeta potential of the NPs at typical concentration of 0.67 wt % in deionized water was measured using dynamic light scattering (DLS, Zetasizer, Malvern, Westborough, MA, USA). A VWR Symphony SB70P pH meter (VWR International, Radnor, PA, USA) was used to monitor the pH of the suspension.
SiO2 (silica) nanoparticles were purchased from Buehler (a division of Illinois Tool Works (ITW), Lake Bluff, IL, USA) as a MasterMet silica colloidal dispersion in water. Distribution of the particles’ hydrodynamic size, pH, and zeta potentials were determined upon dilution of the original stock suspension with deionized water. Two different silica nanoparticle systems were studied, with two levels of zeta potentials −21.1 mV and −27.2 mV having diameters 75 nm and 50 nm, respectively. The former is a dispersion without any surfactant, whereas the latter has polyethylene glycol as surfactant (referred to as SiO2–P). The experiments with these nanoparticles were carried out at concentration levels 0.5 to 1.75 wt % in water at 0.25 wt % increment.
Aqueous suspensions of 5 nm γ-Fe2O3 NPs (stock number: US3202W) were purchased from US Research Nanomaterials, Inc. (Houston, TX, USA). These NPs in solution were stabilized via steric repulsion using polyethylene oxide as the surface ligand. The zeta potential of these NPs is approximately zero. Fe2O3 NPs were received as 15 wt % dispersions in deionized (DI) water and were stored without light exposure. The suspensions were diluted to the desired concentrations and sonicated immediately prior to data recording. The types of NPs and their properties are listed in Table 1.

2.2. Substrates

All quartz crystal microbalance tests employed in these studies comprised of a sensing electrode, 0.5” in diameter, which was deposited onto 1” in diameter polished AT-cut (transverse shear mode, type A temperature compensated) quartz crystal with fundamental resonant frequency of 5 MHz. The quartz crystals with silica deposited onto a metal surface electrode were purchased from INFICON, Inc. (East Syracuse, NY, USA) [Part number: 149277-1] and those with the surfaces composed of 304SS, Al, Au, Cr, Cu, Mo, Ni, and Pt were purchased from Fil-tech, Inc. (Boston, MA, USA) [Part numbers: QM1022, QM1010, QM1001, QM1018, QM1012, QM1011, QM1007, and QM1004, respectively]. The Al samples were anodized by employing a standard method that grows an alumina layer at the rate of 2 μm/h [9]. The sensing Al electrode was used as an anode and immersed into a 4 wt % oxalic acid solution maintained at 0 °C. A cathode was placed in the bath and an electric potential of 40 V was applied between the anode and the cathode. Anodization was halted at 3 min yielding an approximately 100-nm-thick Al2O3 layer. After the anodization procedure, the samples were thoroughly rinsed with DI water before mounting the electrode on a QCM holder. The properties of the materials used for the QCM sensing electrode are given in Table 2. The roughness of the substrates was measured by atomic force microscope (AFM) before the QCM measurements. The saturated root mean squared (rms) roughness measured over the scanned area larger than the correlation length are listed in the Table 2 [19].

3. Experimental Method

The QCM measurement technique has been previously reported and described in detail for Fe2O3 and SiO2 nanoparticle suspensions on alumina and Au substrates, respectively [16,17]. The additional measurements presented here for Al2O3, TiO2, and SiO2-P, were performed in the same experimental setup and the measurement technique is described here in brief.
A schematic of the QCM apparatus is shown in Figure 1a. It consists of a QCM100 (Stanford Research Systems, Sunnyvale, CA, USA) system, which includes an oscillator driving circuitry, a controller, and a Teflon holder. The QCM resonant frequency and conductance voltage are measured by a frequency counter (HP 53181A, Keysight Technologies, Santa Rosa, CA, USA) and a multimeter (Keithley 2000 Series, Tektronix, Inc., Beaverton, OR), respectively, and recorded by a LabView (National Instruments, Austin, TX, USA) data acquisition system. The conductance voltage Vc is converted to the motional resistance [31] according to R = 10 ( 4 V c 5 ) 75 . Changes in frequency of oscillation are reflective of the mass of material dragged along with the QCM transverse shear motion while the changes in motional resistance are reflective of the frictional drag forces at the electrode–liquid interface. Addition of nanoparticles into the liquid commonly results in changes to both quantities.
The QCM crystals were first mounted into the Teflon holder under ambient conditions in air and then the system frequency was allowed to stabilize. The holder was then immersed into 60 mL of deionized (DI) water in a beaker and nanoparticles were next added to the desired concentration levels. The QCM frequency and motional resistance were continuously recorded during this process. Figure 1b–d displays a typical QCM data set, where a QCM with Au surface electrode immersed in water exhibits a change in its resonance characteristics upon addition of TiO2 NPs. The observed shifts in the resonance frequency (f) and motional resistance (R) are the combined effect of increases in density and viscosity of the fluid when nanoparticles are added, uptake of particles on the surface electrode, changes in the frictional energy losses of the materials deposited onto the surface electrodes and/or drag forces, and the interfacial slippage of a fluid in which the crystal is immersed. The ratio of the QCM’s resonance frequency to the motional resistance is proportional to its quality factor Q, therefore, the relative change in Q upon introduction of NPs can also be determined simultaneously, as depicted in Figure 1d.
For TiO2 NPs, the QCM experiments were first carried out at varying concentrations that ranged from 0.17 to 1.00 wt % in increments of 0.17% in DI water. The shifts in frequency (δf) and motional resistance (δR) and the relative change in Q-factor (δQ/Q) for the various concentrations of TiO2 nanoparticles are shown in Figure 2. The optimal concentration of NPs for lubrication, defined by the greatest reduction in R upon introduction of NPs, was observed at 0.67 wt %. The experiments were then performed at the optimal concentration of 0.67 wt % in triplicate for 10 different surface electrode materials.
SiO2 NP experiments were first carried out by varying the concentration from 0.5 to 1.75 wt % at an interval of 0.25 wt %, as previously reported in reference [17], and the optimal concentration was found to be 1.5%. For SiO2-P, the measurements were performed at 1.5 wt %. The measurements for Fe2O3 NPs involved an increase in NP concentration from 0.2 to 1 wt % in increments of 0.2 wt % [16]. Similarly, the experiments for Al2O3 NPs were performed at concentrations from 0.17 to 1.00 wt % in (DI water in 0.17 wt % increment.
The NP’s effect at the QCM’s solid–liquid interface was next parameterized by four candidate performance factors: δf, δR, δQ/Q, and δR/δf, which were calculated at, or close to, the optimal concentrations for the corresponding NPs. In total, 48 observations for four NPs and ten substrates are reported, for a variable number of observations for each NP–substrate combination.

3.1. Quartz Crystal Microbalance Data Analysis

For a QCM immersed in a fluid with bulk density ρ 3 and viscosity η 3 , the shifts in f and R associated with the liquid’s presence under no-slip boundary conditions are given by [31,32]
δ f = f 0 3 2 ρ 3 η 3 π ρ q μ q      and       δ R = 1 8 K 2 C 0 π ρ 3 η 3 f 0 ρ q μ q
where, f0 is the resonant frequency of unloaded QCM, ρ q = 2.648 g cm−3 is the density, and μ q = 2.947 × 10 11 g cm−1 s2 is the shear modulus of quartz, K 2 = 7.74 × 10 3 is the electromechanical coupling factor for AT-cut quartz and C 0 is the static capacitance of the QCM electrodes, which includes the parasitic capacitance associated with connections to the oscillator circuit. Employing Equation (1), immersion of a f0 = 5 MHz QCM at room temperature into water ( ρ 3 = 1 g cm−3, η 3 = 0.01 poise) under no-slip boundary conditions yields δ f = 714 Hz and δ R = 300 Ω. The increase in R is a manifestation of the fact that water is more viscous than air, with increased frictional drag forces. The energy dissipation of the QCM that can also be related to the quality factor Q of the QCM oscillator, therefore, increases. If the QCM quality factor was Q   50,000 in air, it would drop to Q   3280 after immersion in water [7]. Since, the ratio f/R is proportional to the quality factor Q of the QCM oscillator, the relative change in Q factor can be approximated as Q/Q = (f/R)/(f/R), as shown in Figure 1d [33].
Addition of NPs into the fluid surrounding an immersed QCM, as shown in Figure 1, virtually always change the resonance characteristics of the QCM. The most predictable changes are associated with NP-induced changes to the density and viscosity of the liquid [34]. These can be approximated by Einstein’s equation [35], η r = 1 + 2.5φ, or other statistical correlation equations established in literature, where η r and φ are the relative viscosity and volume fraction of NPs, respectively [36]. The contribution of increase in ρ3 and η 3 of the nanoparticle suspension to δf and δR, are then estimated by inserting the suspension values into Equation (1). The expected δf values for this visco-density effect for the nanosuspensions are approximately −5 to −10 Hz for 0.4 to 0.8 wt % Fe2O3, −4 Hz for 0.67 wt % TiO2, −3 Hz for 0.67 wt % Al2O3, and −8 Hz for 1.5 wt % SiO2. The δf values higher in magnitude than these estimates indicate adsorption of nanoparticles onto the surface or increases in the surface roughness. If the no-slip boundary condition is satisfied, an additional rigidly adhering film deposited onto one side of a QCM will decrease its resonant frequency according to the Sauerbrey equation [37]: δ f f i l m = 2.264 × 10 6 ( ρ 2 f o 2 ) , where ρ2 = (mf/A) is the mass per unit area of the film in g/cm2, with no additional change in R. Similarly, the expected δR values for the change in bulk density and viscosity of nanosuspensions are approximately: 2 to 4 Ω for 0.4 to 0.8 wt % Fe2O3, 1.5 Ω for 0.67 wt % TiO2, 1.3 Ω for 0.67 wt % Al2O3, and, 3.5 Ω for 1.6 wt % SiO2. Any deviation of the observed δR values indicate the nanoparticle’s role in the change in frictional energy dissipation processes, changes in surface roughness, and changes in location of the solid–liquid slip plane. Decreases in R correspond to increases in Q factor, and suggestlower energy dissipation and, hence, nanoscale lubrication effects by the nanoparticles. On the other hand, increases in R or decrease in Q factor suggests higher motional drag forces at the QCM solid–liquid interface.

3.2. Macroscale Friction Measurements

Macroscale friction measurements were performed with alumina balls and disks using an MTM2 Mini-Traction Machine (PCS Instruments, London, UK). The balls had a diameter of 19.05 mm and were loaded against a 46 mm diameter disk. They were driven independently, creating a mixed rolling and sliding contact at a desired proportion. Measurements were performed at 4 N normal load, and ball rolling speed of 200 mm/s, with a slide-to-roll ratio (SRR) of 90%. The sliding speed of the measurements was therefore 180 mm/s. A 20 min friction run with pure DI water was completed first to obtain the baseline and then further measurements were performed in nanoparticle suspensions of Fe2O3 or TiO2 nanoparticles at different concentrations. The NPs concentration was increased in regular increments from 0 to 1.0 wt % to determine where the greatest change in the friction coefficient occurs. The tests were performed for 4 min at each increment to allow for the kinetic coefficient of friction, μk, to stabilize. The average μk value from each concentration was then found and reported as a function of wt % concentration.

4. Results

The nanotribological effect of NPs at the QCM’s solid–liquid interface was studied with the observables f and R in QCM measurements. The four parameters δf, δR, δQ/Q, and δR/δf represent the extent of NPs adsorption on the QCM’s surface electrode, change in energy dissipation of the QCM, change in QCM’s quality factor, and the NP’s effect on improvement in lubrication at the interface, respectively, based on a prior study of a single combination of materials [16]. The effects of NPs at the interfaces characterized by these parameters are described in five subsections. In the first subsection, we present the overall impact of dispersing nanoparticles in water and categorize them based on their effects. The adsorption of NPs on the QCM’s surface electrode is described in the second section. The third section presents the NP’s role in change in energy dissipation of the QCM oscillator, characterized in terms of δR and δQ/Q. The interfacial effect of NP film on the surface electrode and/or their slip at the interface is presented, along with the friction measurements at the macro-scale in subsequent sections. The nanoscale parameter δR/δf is correlated with the NP lubrication effect in macro-scale [16].

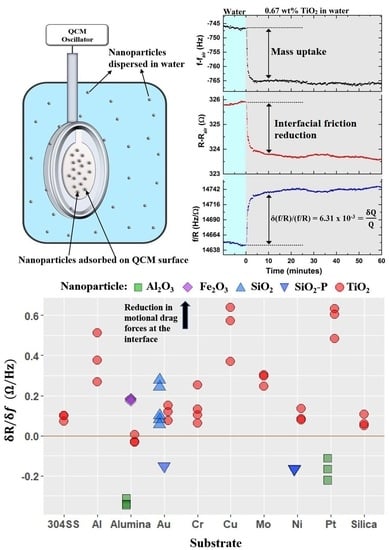
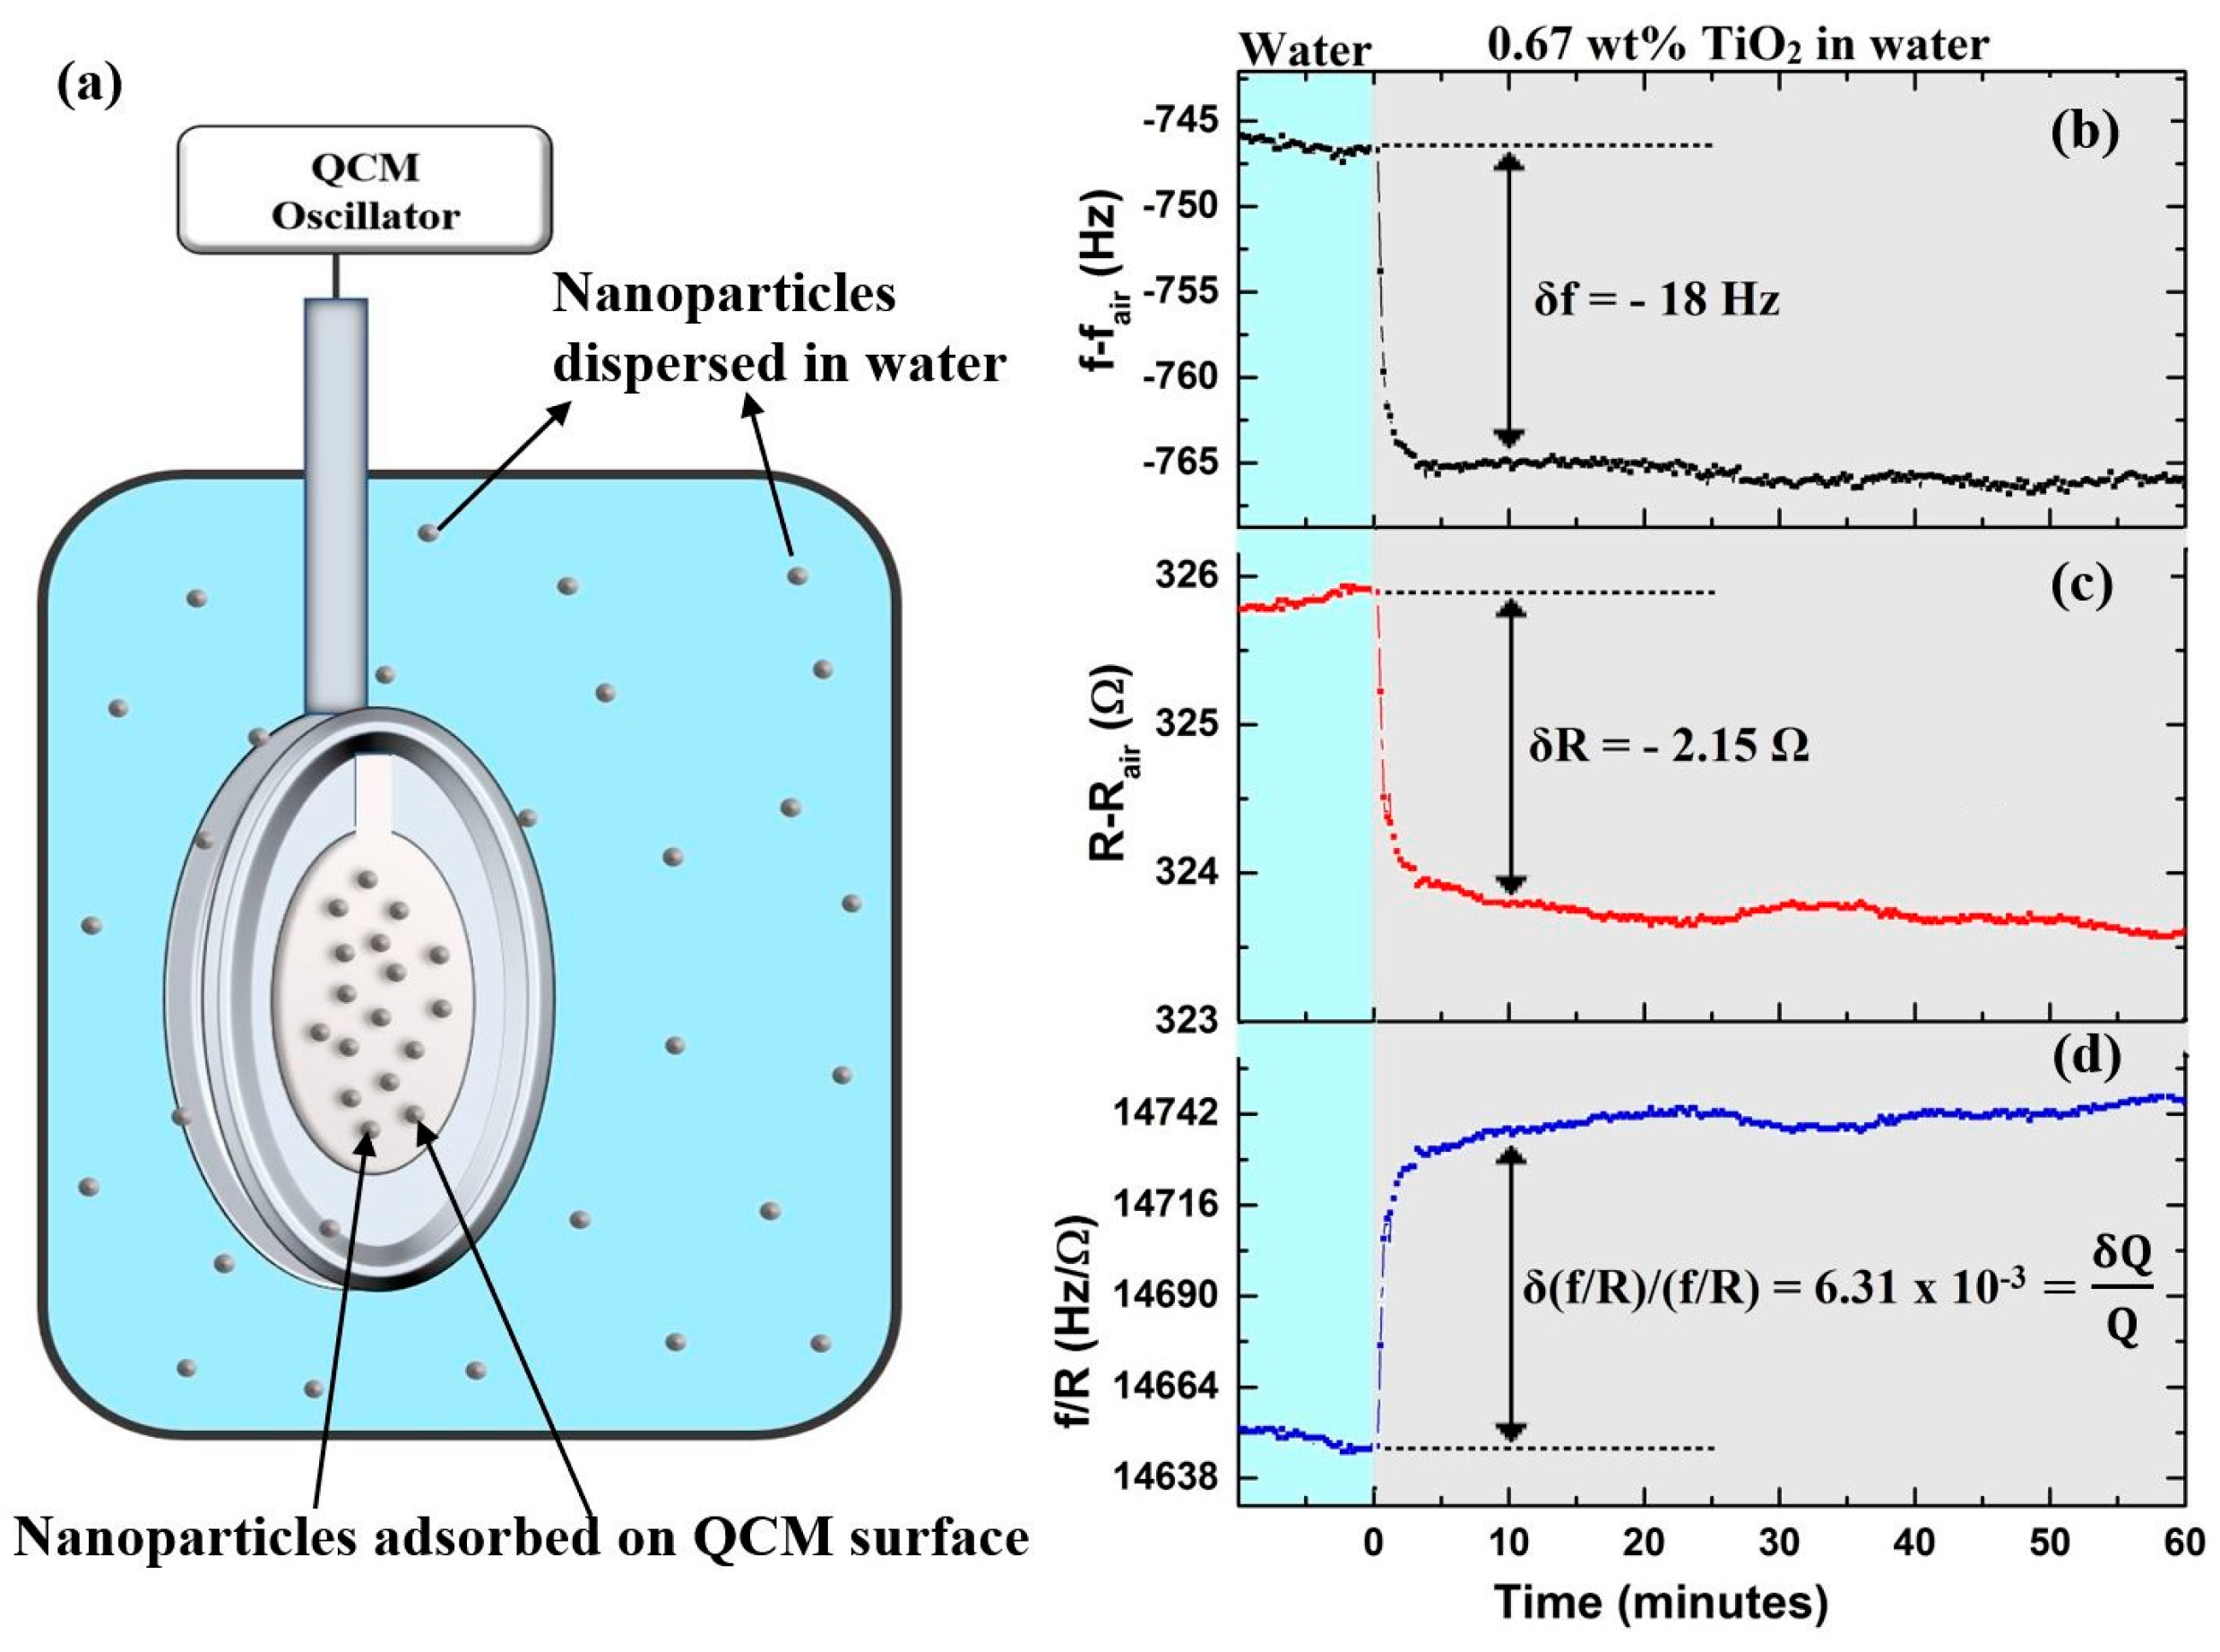
4.1. Examples of QCM Response Types Upon Introduction of NP’s

In this section we define categories for the type of response that QCM datasets exhibit when NP are introduced into the surrounding liquid. As mentioned earlier in Section 3.1, nanoparticles that improve macroscale lubricity are linked to decreases in R in the nanoscale QCM response. This trend indicates that the nanoparticles decrease the frictional energy dissipation at the solid–liquid interface, a phenomenon that would also reduce friction at the macroscale, particularly in the hydrodynamic regime of lubrication [38]. An opposite trend, increases in R upon introduction of NP would then be linked to increases in friction. Figure 3a–c demonstrates these trends and presents QCM responses for TiO2 nanoparticles on silica and alumina. The frequency shift of the QCM upon introduction of TiO2 nanoparticles is comparable for the two substrates; however, the change in resistance is in opposite directions. For the alumina surface, the resistance R increases, and the Q factor decreases while for silica and all other eight substrates (not shown) a decrease in R is observed, implying that the Q factor increases and the nanoscale drag forces are lower. These two scenarios are listed in Table 3 for all nanoparticle–substrate combinations studied, and respectively categorized as type I and III.
Other categories of QCM response to nanoparticles are cases where the resistance decreases in the absence of a frequency shift (type II) and cases where significant erosion of the substrate material occurs as time progresses. Examples of these are depicted in Figure 3d–f. For the case of TiO2 nanoparticles on anAl surface the frequency shift is small and entirely attributable to the effect of the increased viscosity and density of the nanosuspension. This implies no significant adsorption of nanoparticles on the surface, i.e., δffilm ≈ 0 and/or nanoparticles that are close to the surface but not coupled to the oscillation. These nanoparticles still produce a decrease in R and reduced interfacial drag, with a possibility of interfacial slip. The interfacial slip will be discussed in detail in later section. Other nanoparticle–substrate combinations falling into this category are listed in Table 3. Another effect observed for some nanoparticle–substrate systems is erosion of the material from the substrate. As shown the Figure 3d–f, although the Fe2O3 nanoparticles reduce the motional resistance for an alumina substrate, a gradual increase in frequency (c.f. Figure 3d) is also observed. This implies removal of material from the surface. The latter effect has been discussed previously in detail [16] by further analyzing the AFM images before and after the erosion. Similar behavior is also observed for TiO2 nanoparticles on alumina (Figure 3a) and Al (Figure 3d). These two systems also showed slight erosion, but as noted in Figure 3, the erosion for Fe2O3 on alumina is significantly higher. We listed the cases of erosion observed for the systems in Table 3, indicating whether the erosion is slight or significant, with a designation of “e” or “E”. The categories (I, II, and III) in the Table 3 are assigned after corrections for density and viscosity have been performed and before significant erosion occurred in cases where it was observed.

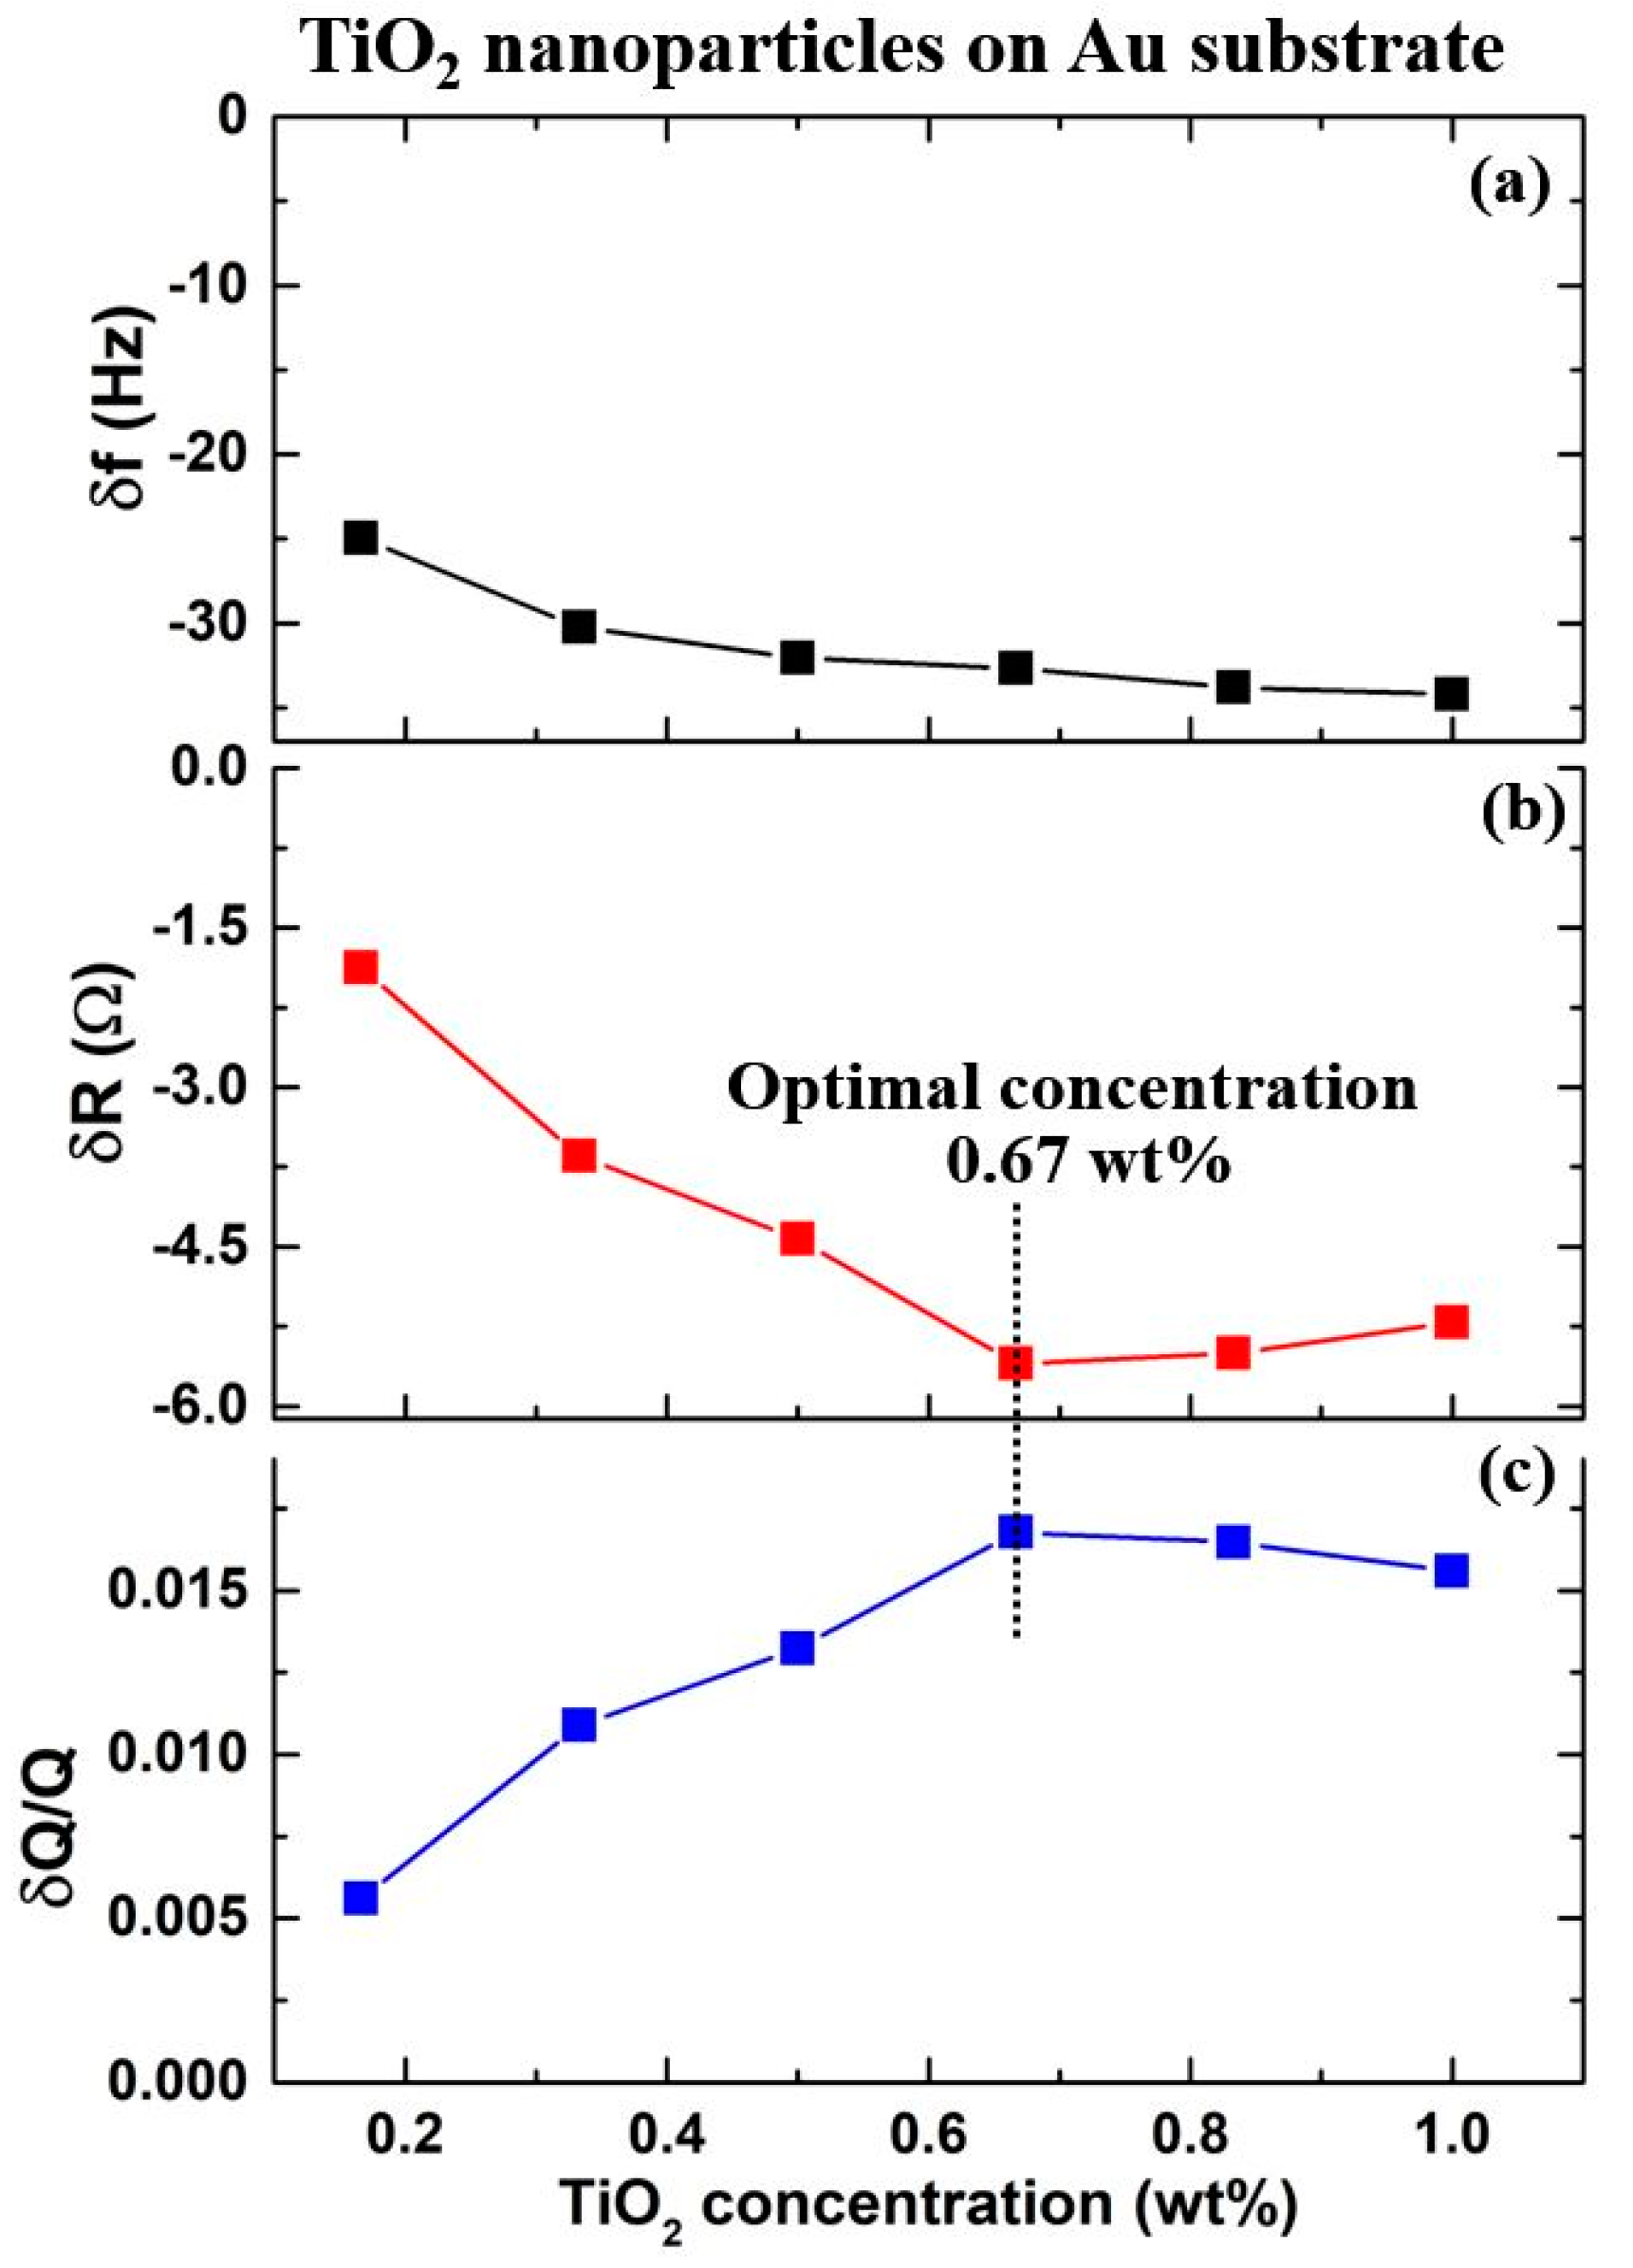
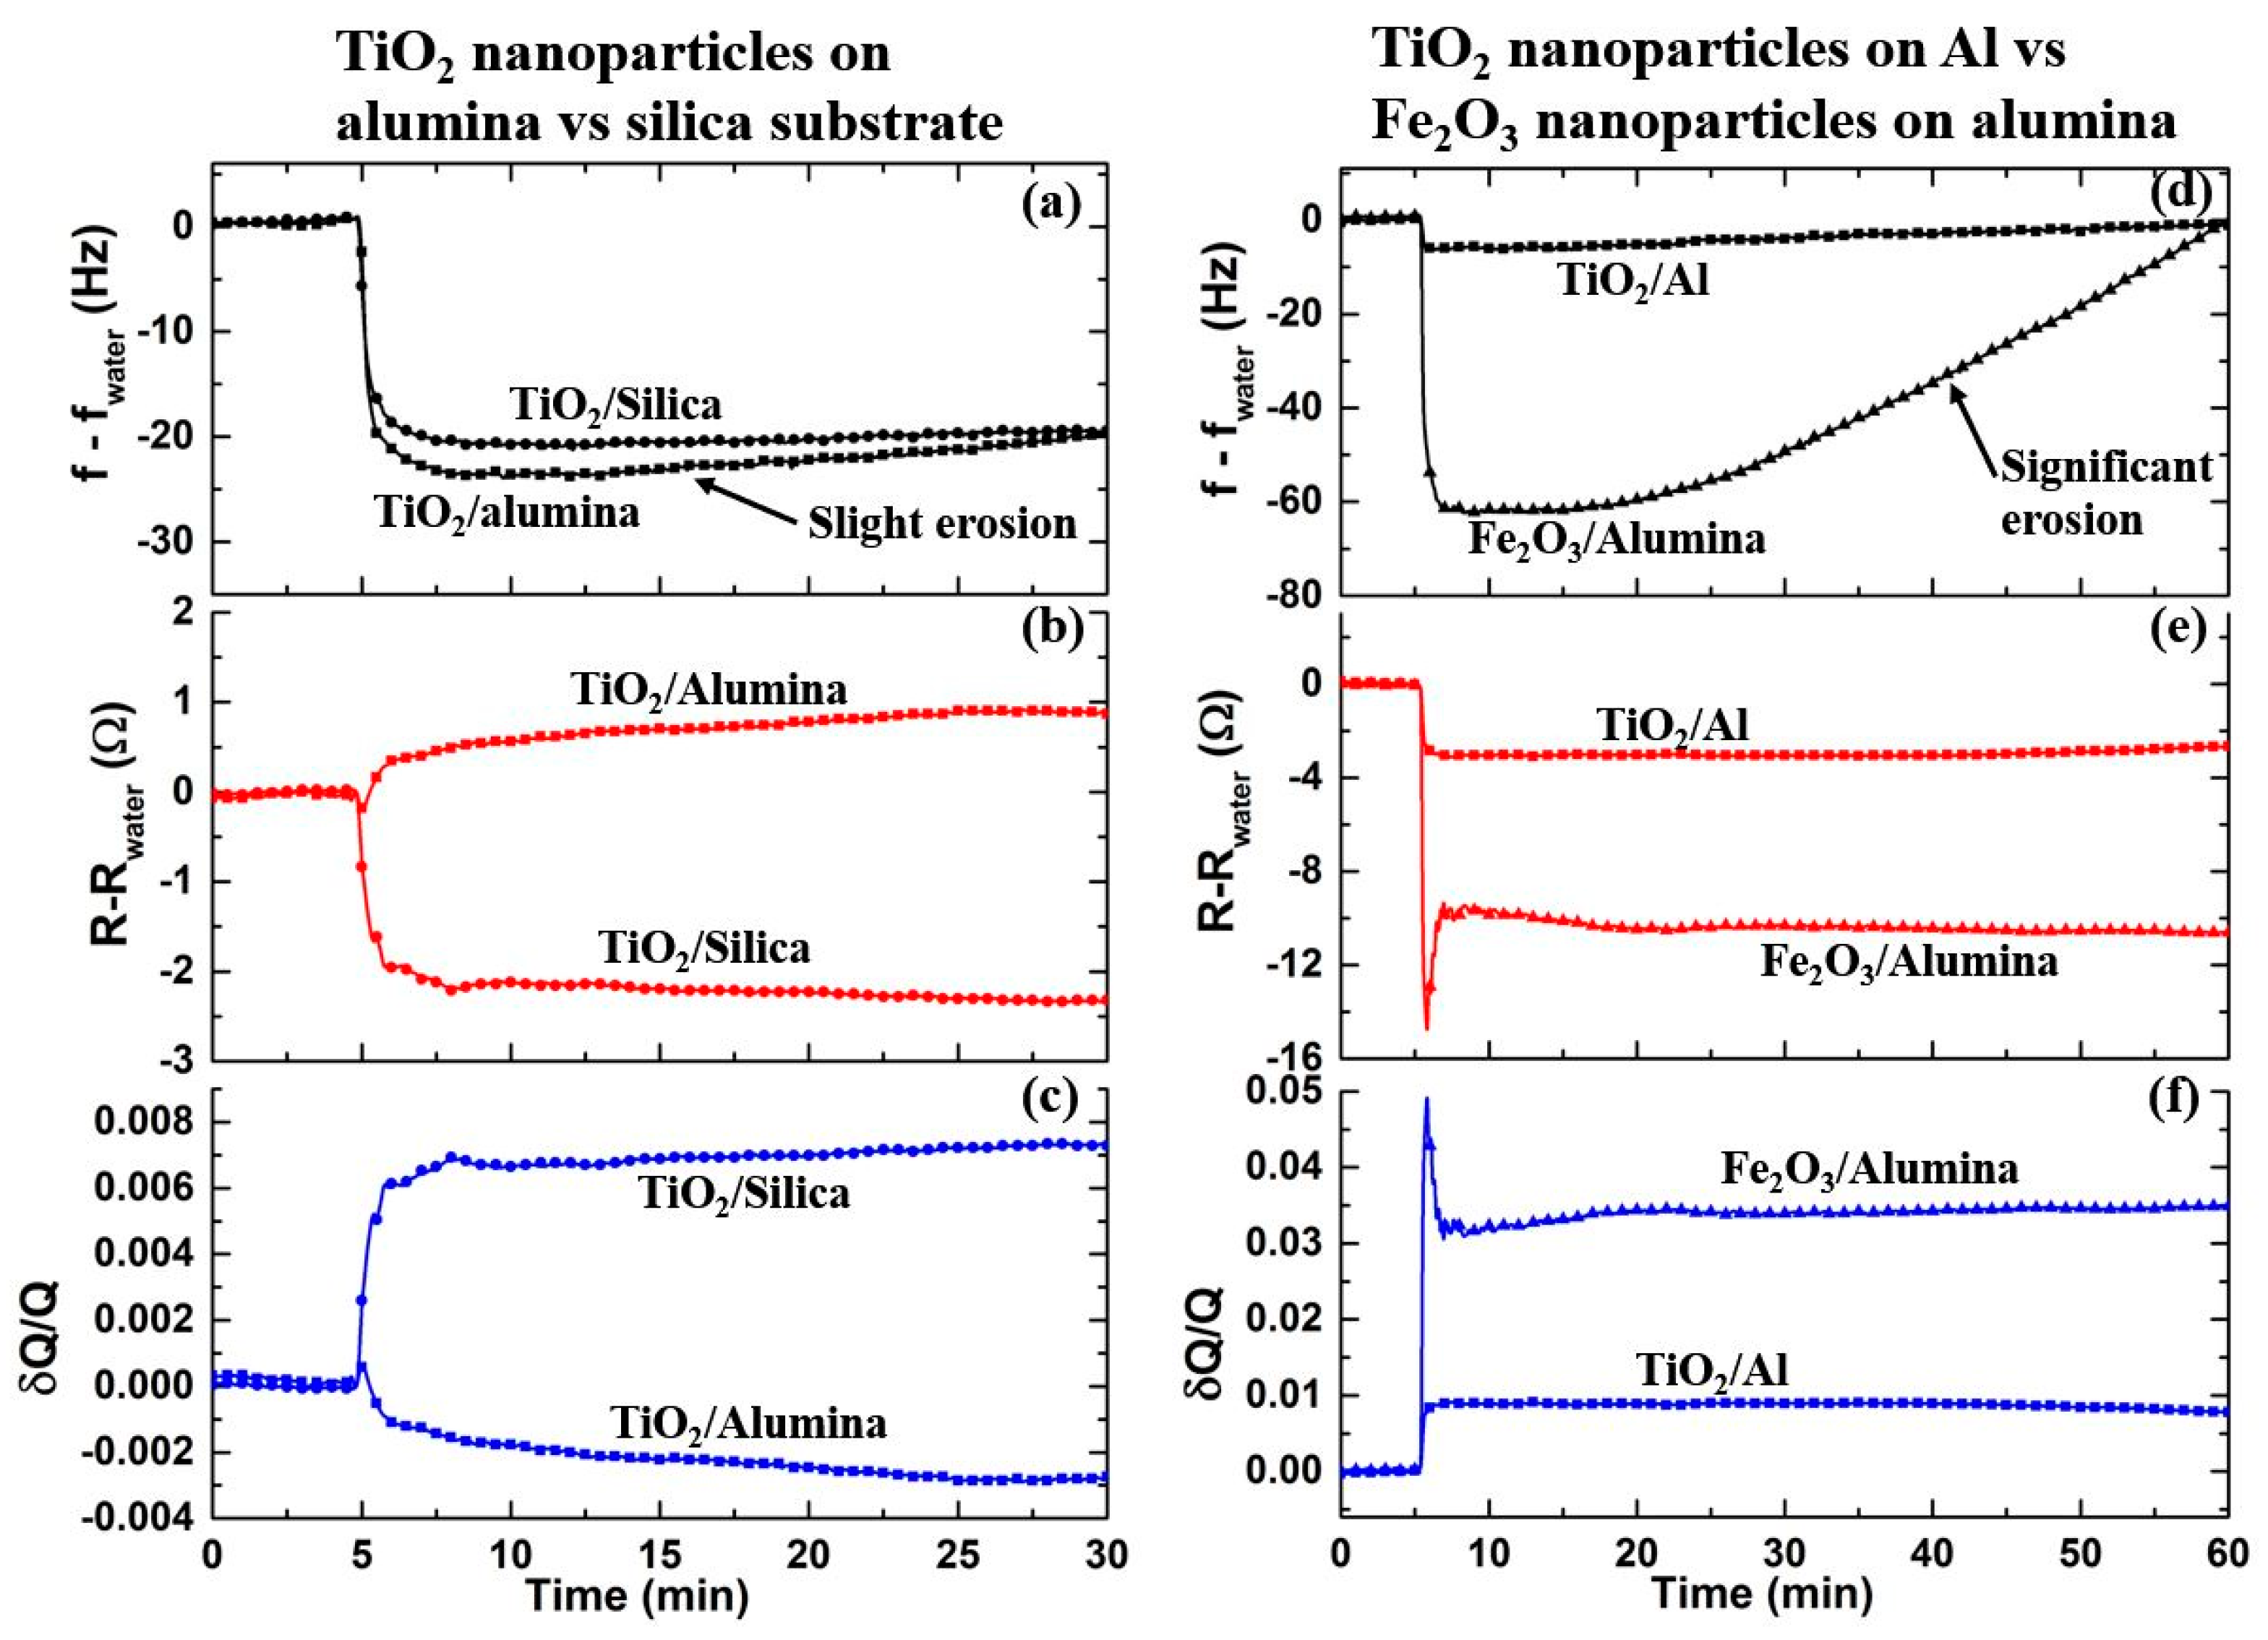
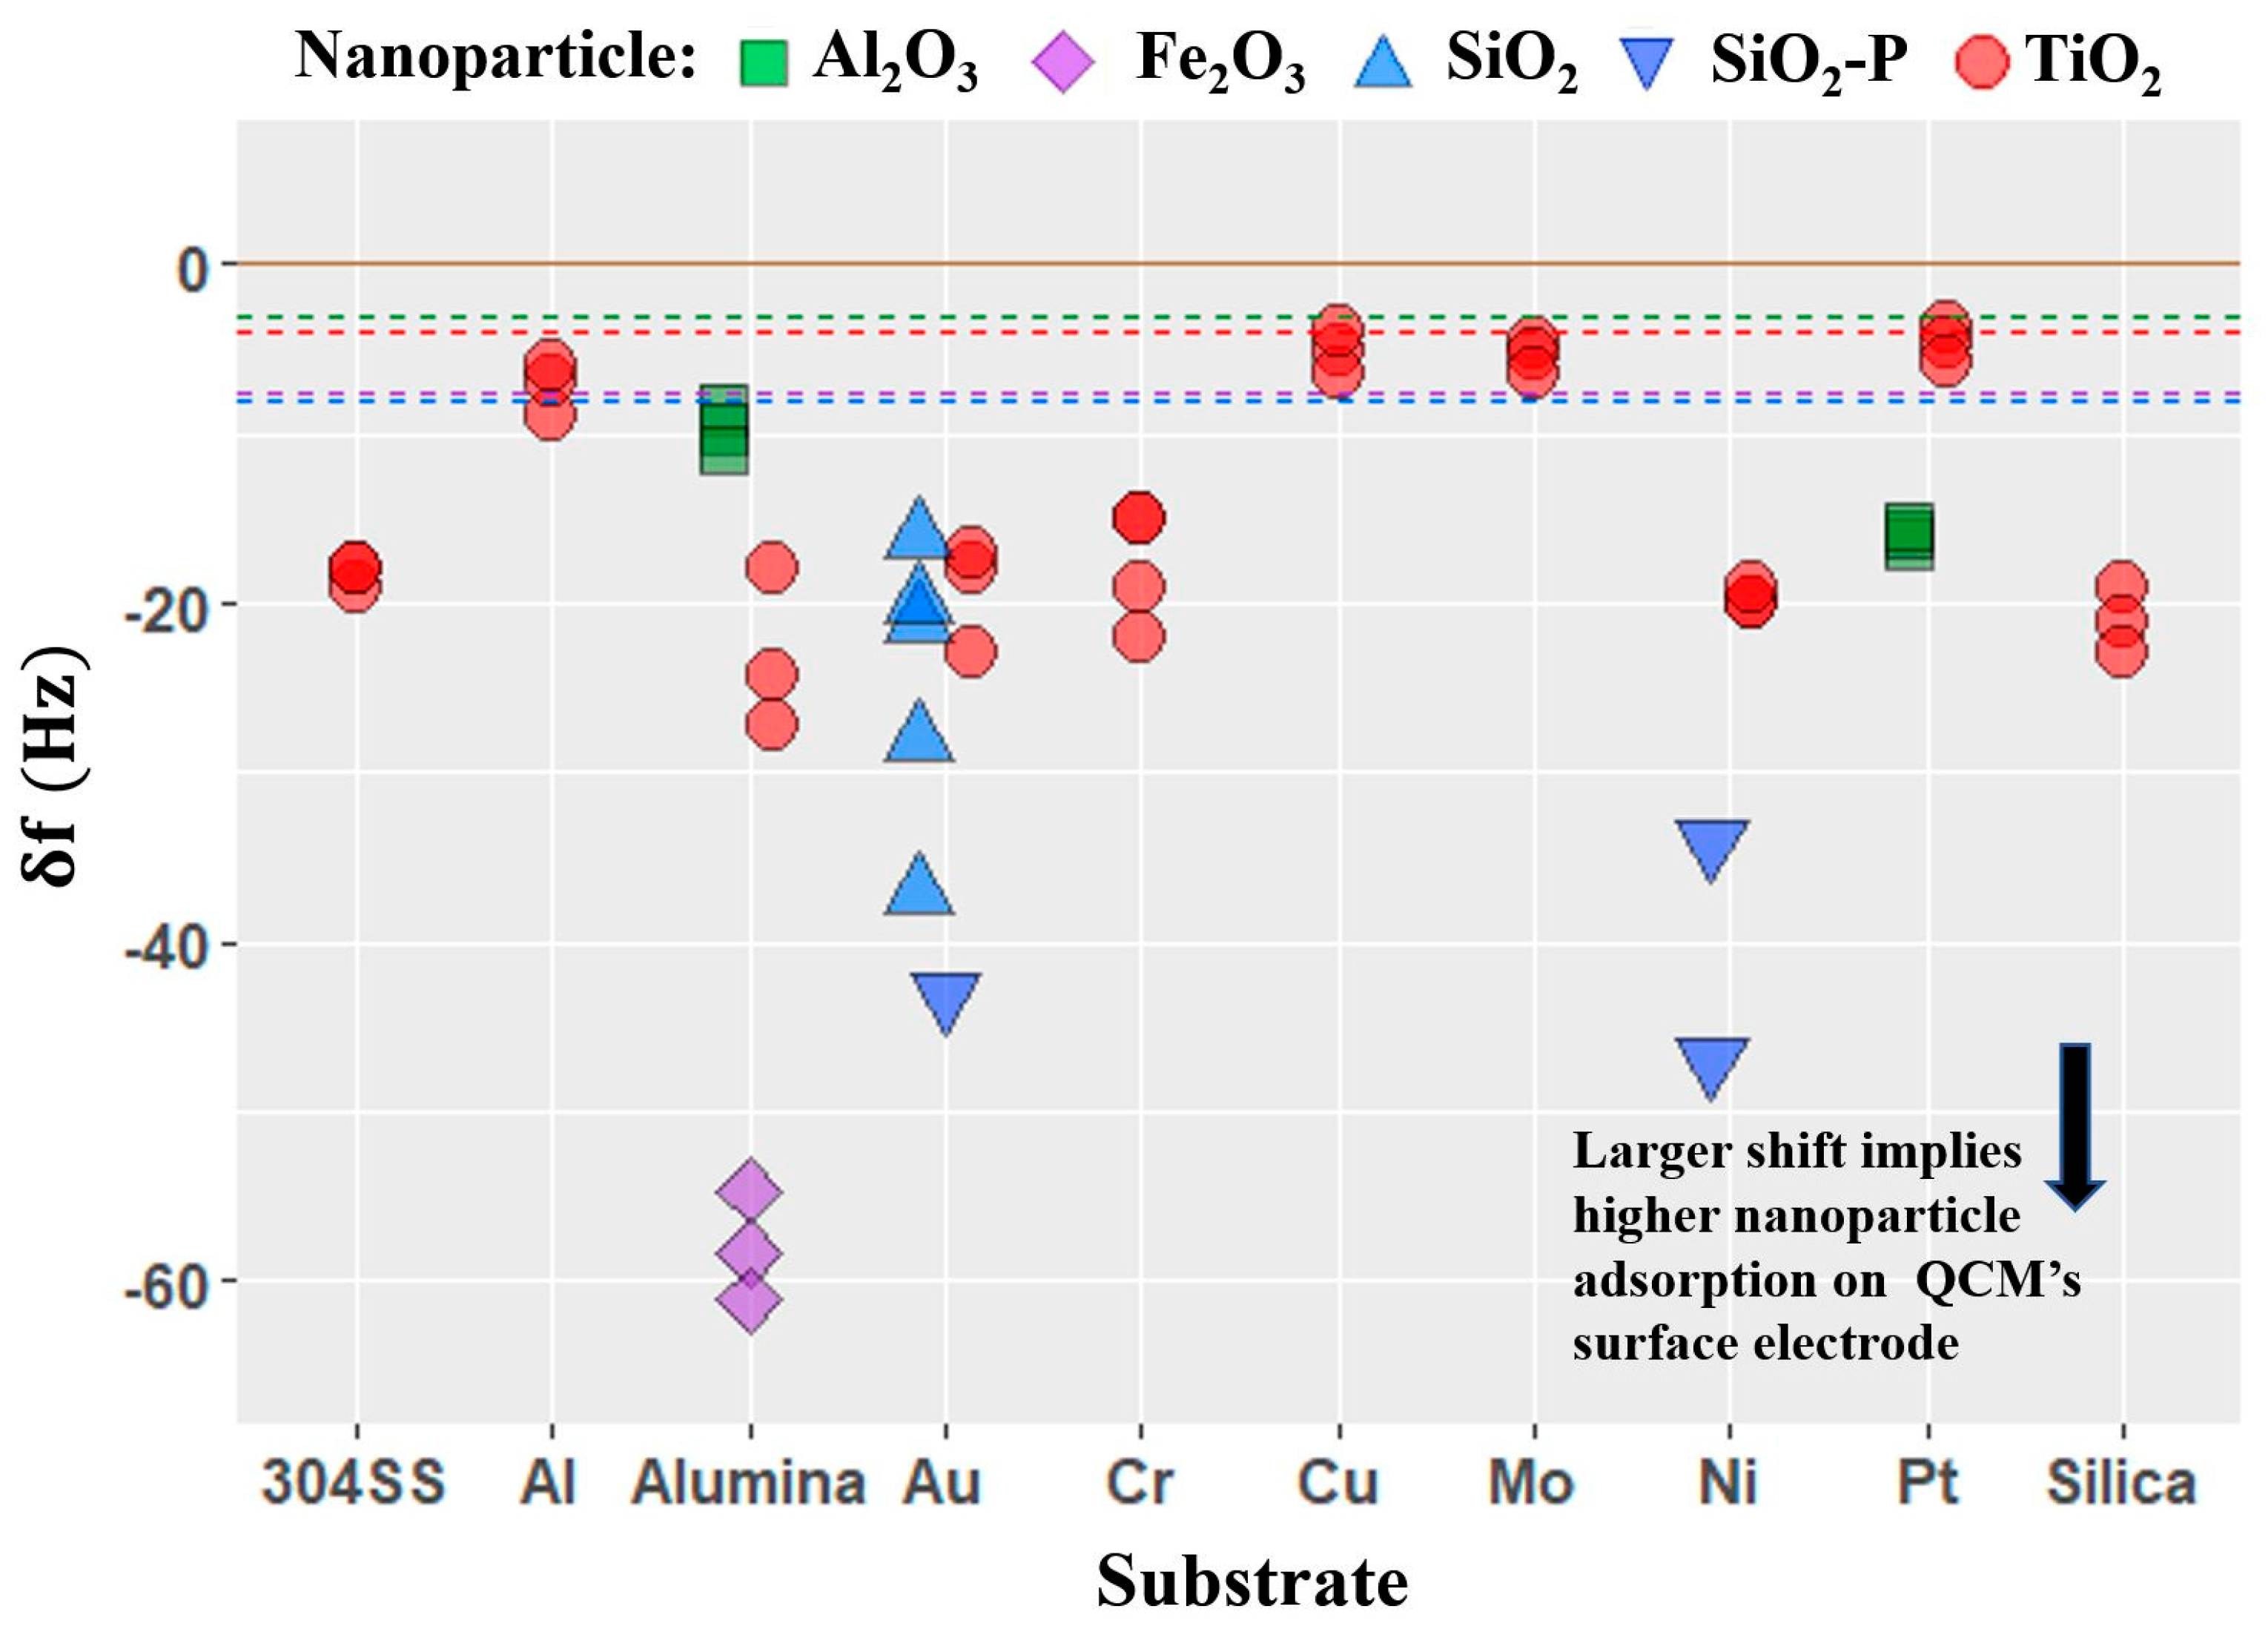
4.2. Frequency Response Upon Introduction of Nanoparticles

The observed δ f values measured for the various NP–substrate combinations are shown in Figure 4. All of the observed δ f values are negative, implying some additional mass loading on/at the QCM’s surface electrode. The expected δ f values for the visco-density effect for the nanosuspensions are represented by the dashed lines. Frequency shifts higher in magnitude than these values correspond to adsorption of NPs onto the surface. As originally reported by Sauerbrey [37], an additional rigidly adhering film deposited onto one side of a QCM will decrease its resonant frequency by δ f f i l m = 2.264 × 10 6 ( ρ 2 f o 2 ) , where ρ2 = (mf/A) is the mass per unit area of the film in g/cm2. Fe2O3 NPs showed the highest level of adsorption on alumina surface with δf ≈ −50 Hz beyond the visco-density effect. This is associated with a coverage level of ρ 2 = 0.9 × 10 6 g cm−2, which corresponds to a monolayer of NPs with approximate separation of 1.6 nm from each other. On the other hand, TiO2 NPs showed little adsorption on Cu, Mo, Pt, and Al, whereas a sub-monolayer film is formed on other six substrates. Similarly, Al2O3 NPs formed a sub-monolayer film on Pt surface, but showed little adsorption on alumina. SiO2 NPs (both types) also formed a sub-monolayer film on Au and Ni surface; however the particles with surface treatment (SiO2–P) showed higher adsorption.

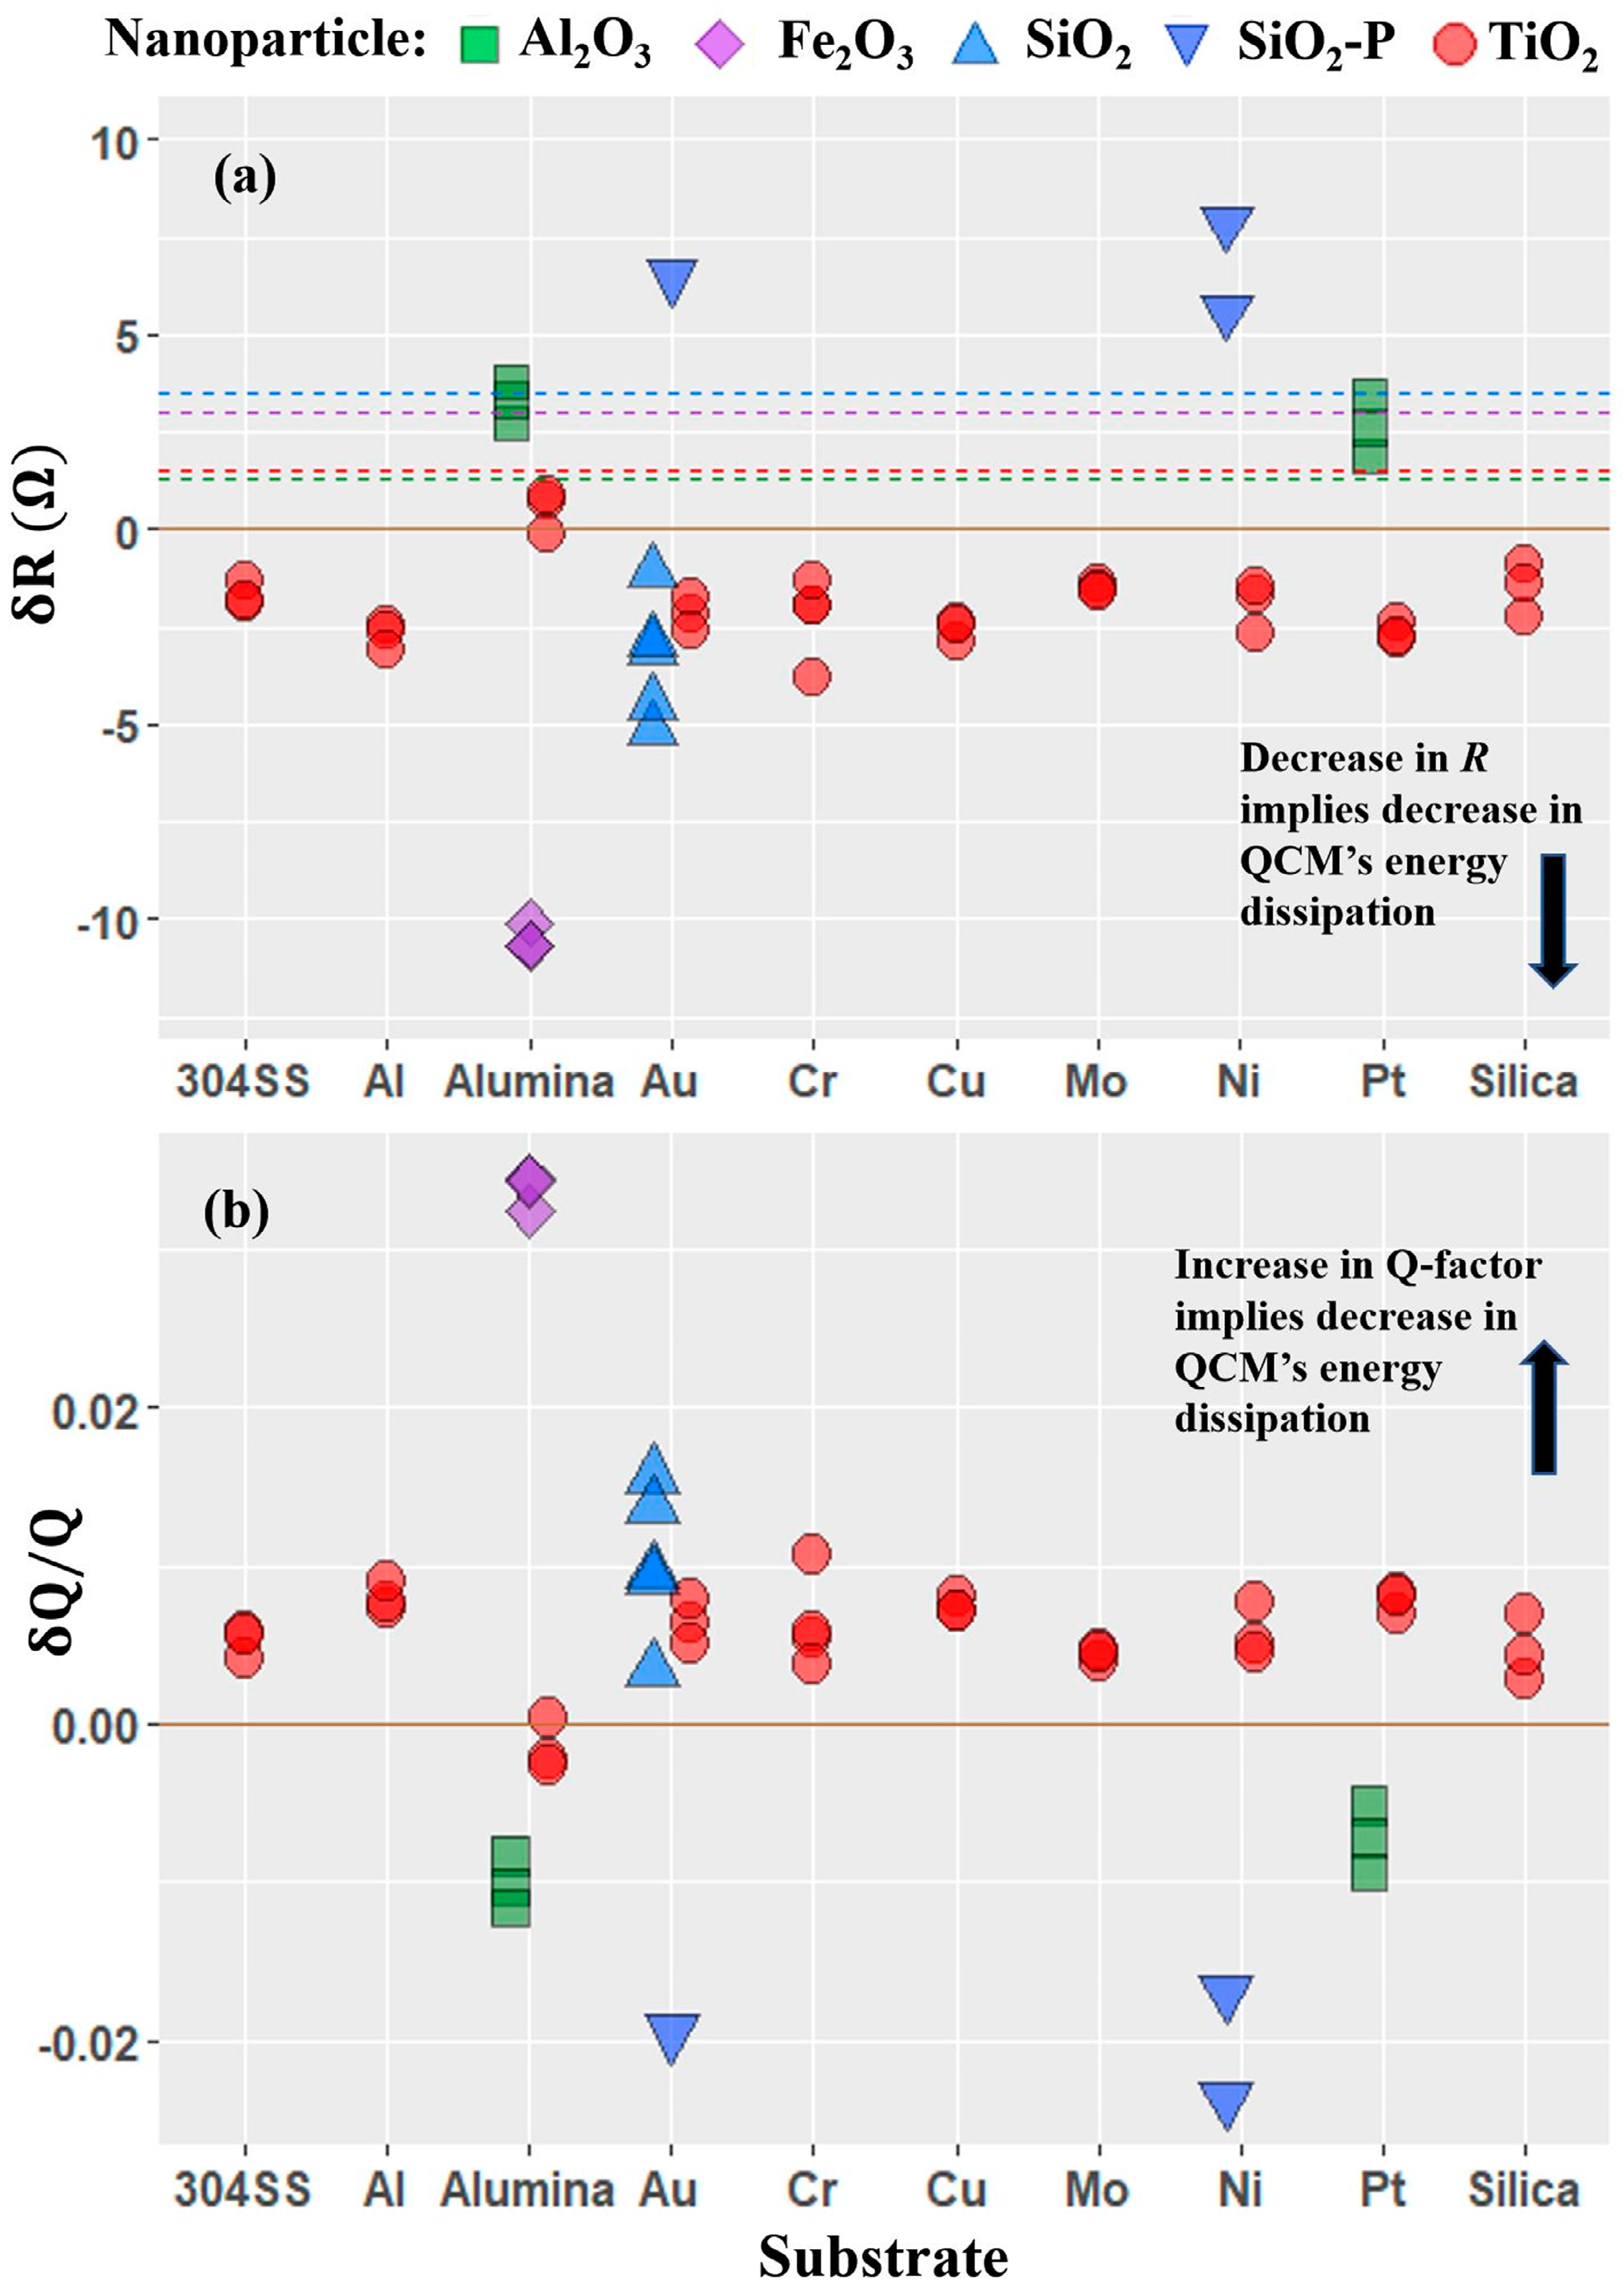
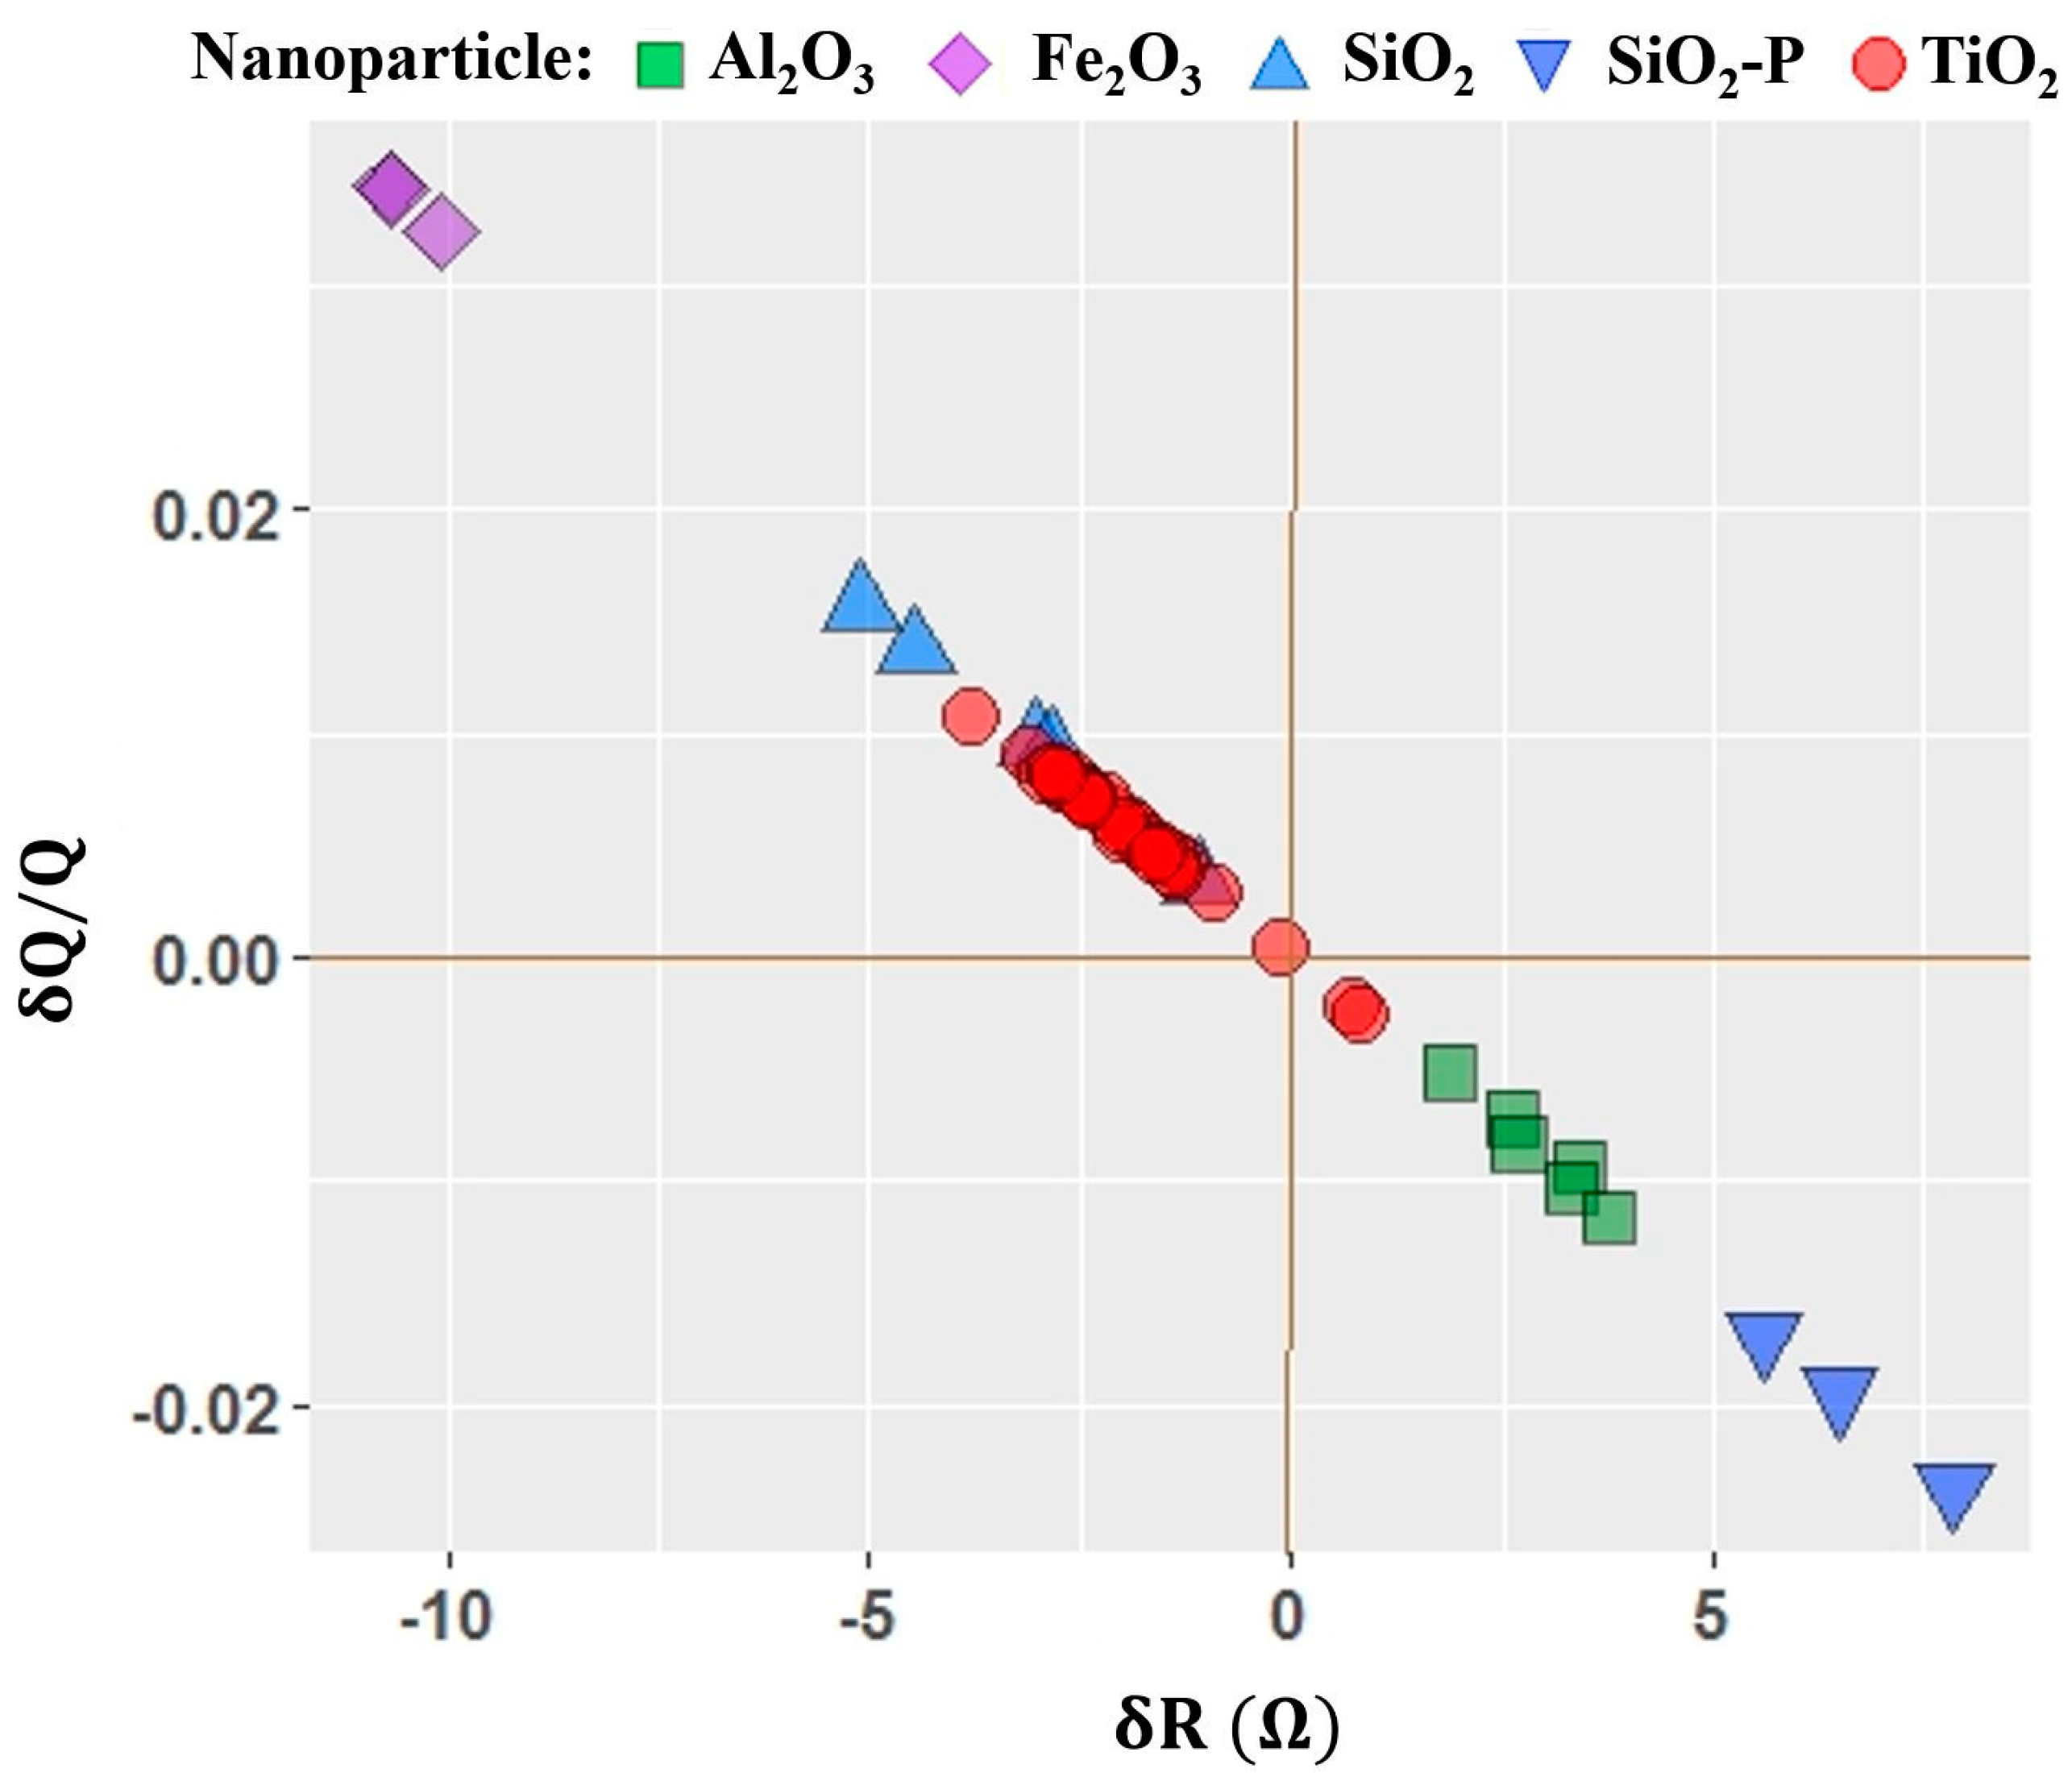
4.3. Motional Resistance and Oscillator Dissipation Response to Introduction of Nanoparticles

The visco-density effect of adding NPs into a liquid is expected to increase the dissipation of QCM and hence cause an increase in R and a decrease in Q. The quantities δR and δQ/Q technically have the same physical significance in that they characterize the interfacial effect in terms of energy dissipation of the QCM. An increase in quality factor is the manifestation of a decrease in energy dissipation of the QCM, which is why larger negative values of δR correspond to higher positive values of δQ/Q in Figure 5. The quantitative correlation between the two is depicted in Figure 6. The increase in viscosity and density of nanosuspension is expected to produce an increase in R, as represented by the dashed lines in the Figure 5a. The observed δR in opposite direction for some NP–substrate combinations (Figure 5) is however associated with a decrease in the energy dissipation of the QCM. This effect is intriguingly associated with an interfacial slip at the surface-liquid-nanoparticle boundary [17]. The interfacial slippage is enabled by the presence of the NPs and facilitates QCM oscillation with less energy dissipation than in the pure liquid alone. The interaction between the NPs adsorbed on the surface (or the surface itself) and those dispersed in the liquid give rise to an interfacial slip at the solid–liquid boundary. This interfacial slip considered as one of the nano-scale lubrication mechanism of the nanoparticles and has been reported to be correlated with a decrease in friction at the macro-scale contacts lubricated by them [16]. The SiO2 NPs with 75 nm diameter, as previously reported, were observed to adsorb on the QCM’s Au surface electrode and enable the interfacial slip thereby reducing the energy dissipation of the QCM. For Fe2O3 NPs, similar reduction in QCM energy dissipation was observed, and was correlated with the reduction in coefficient of friction at the macroscale contacts. TiO2 NPs also decrease the energy dissipation for all the substrates studied but alumina. The alumina surface develops a positive charge at the pH level of TiO2 NP suspension, while all other substrates are either neutral or develop negative charge. This give rise to an attractive coulomb interaction between TiO2 NPs and the alumina surface, which possibly explains the peculiar behavior of the alumina surface for TiO2 NPs. Al2O3 NPs give rise to an increase in energy dissipation at the interface for Pt and alumina surfaces, as evidenced by positive R and negative δQ/Q values. The effect of the Al2O3 NP is dependent on the substrate: the adsorption is higher on the Pt surface, while the increase in energy dissipation is higher on alumina. Similarly, SiO2 NP’s effects on Au and Ni substrates are different, depending on the size, surface treatment and zeta potential of these NPs. The 75 nm diameter SiO2 NPs with −21.1 mV zeta potential decrease the energy dissipation at Au surface whereas SiO2-P NPs with 50 nm diameter and −27.2 mV zeta potential increase the energy dissipation at both Au and Ni surfaces.
Figure 6 depicts the correlation between the two quantities δR and δQ/Q. A strong negative correlation is expected because these two quantities are associated with the same physical entity: the change in frictional energy dissipation of the QCM. Another feature of this graph is that the observation data points are clustered by the type of nanoparticles. This shows that the variations in δR and δQ/Q from one nanoparticle to another are larger than the variation from one substrate to another, indicating that the nanoparticles play a larger role than the substrates in determining the drag force levels at the interface.

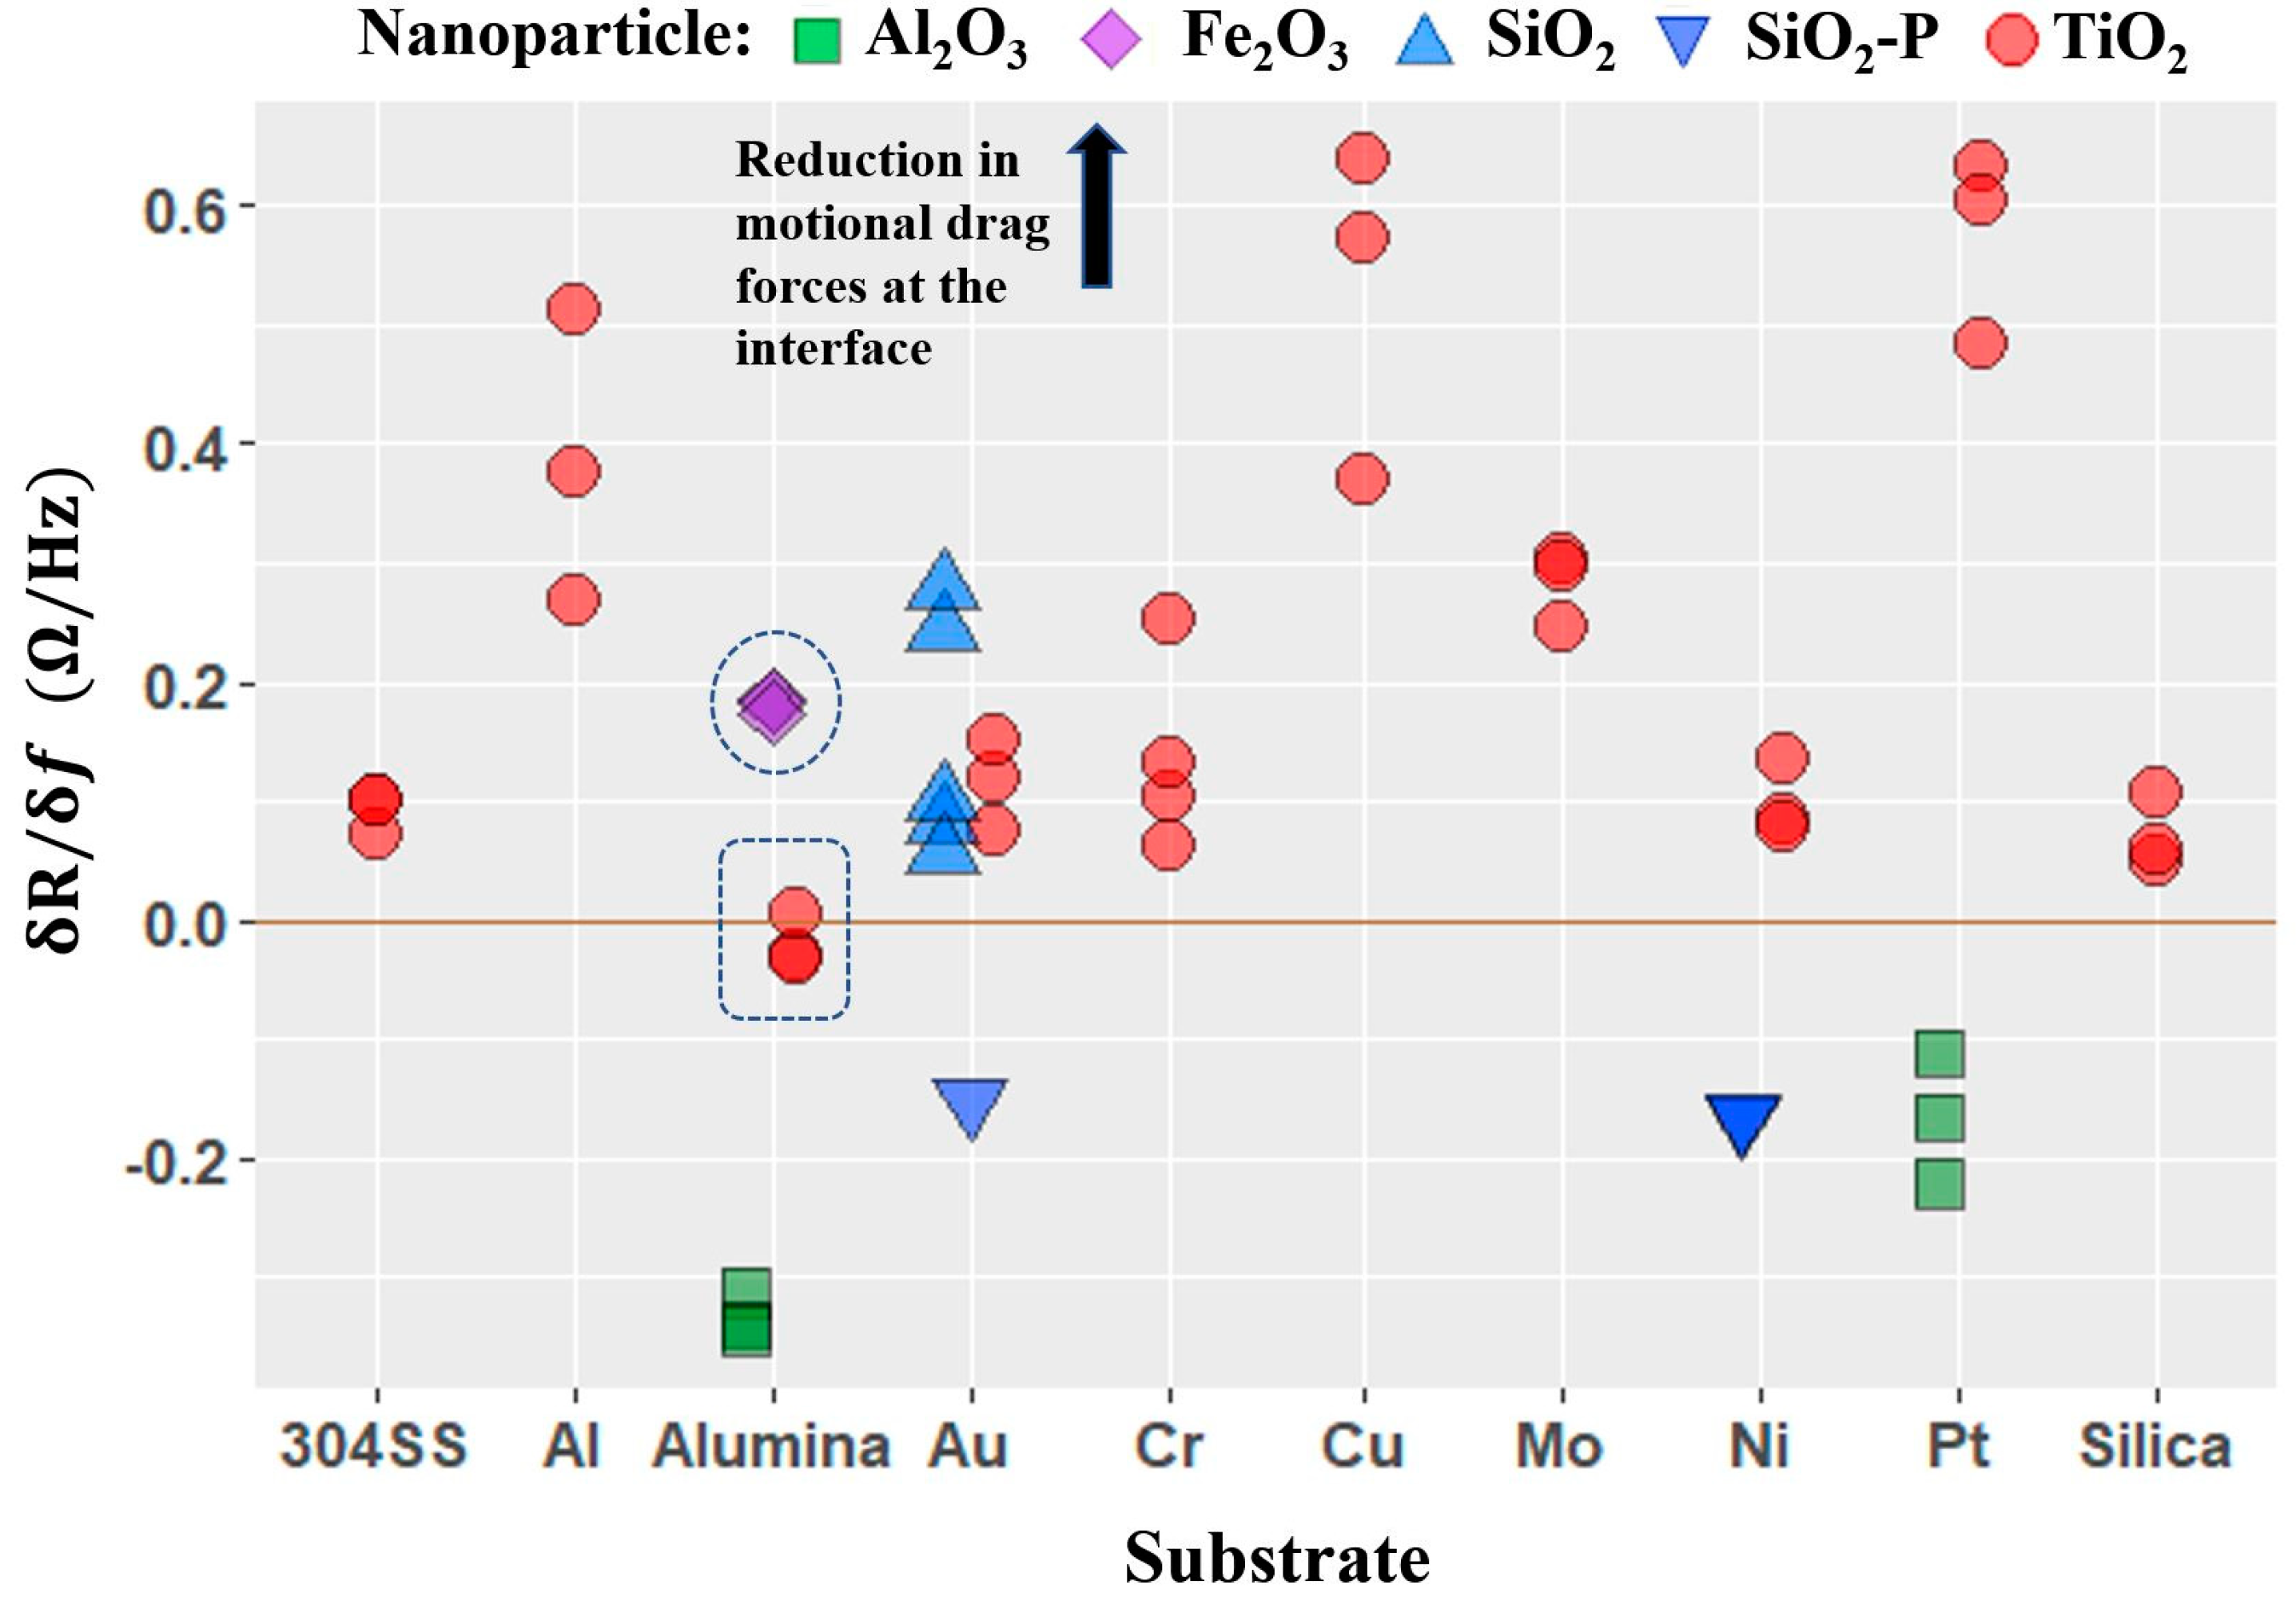
4.4. Nanotribological Performance Factor δR/δf

When the adsorbed NP film or NPs in the immediate neighborhood of surface slips on the QCM surface during its oscillatory motion, the magnitude of the frequency shift δf will be lower than that given by the Sauerbrey equation for the rigidly attached film or lower than the expected visco-density effect. There will be also a discrepancy in the QCM’s quality factor, Q, since the friction associated with the nanoparticle sliding results in a further change in the energy dissipation at the solid interface but potential decoupling from the viscous effects of the surrounding liquid. For a film characterized by a frictional force per unit area F/A = ηv, where v is the sliding speed, a characteristic “slip time”, τ = ρ2/η, parameterizes the strength of the friction coefficient η and can be inferred from the relation δ(Q−1) = 4πτ(δf) [39]. The change in the quality factor δ(Q−1) is directly correlated to the change in the motional resistance δR, as indicated by the negative correlation between δR and δQ/Q (Figure 6). The quantity δR/δf is, therefore, inversely proportional to the slip time of a two dimensional material atop the QCM, and, thus, is reflective of the frictional properties of the system. If the NPs at the interface are slipping, or if the fluid is slipping more readily after NP adsorption to the QCM surface, then the bulk liquid as a whole will be less coupled to the transverse oscillatory motion of the QCM. The distribution of δR/δf is shown in the Figure 7. The data points above the δR/δf = 0 line correspond to the negative δR (or positive δQ/Q values), and represent the cases where NPs decrease the energy dissipation of the QCM. The variations of δR/δf with the substrate and NPs are, however, different than that of δR or δQ/Q. This is because that the quantity δR/δf measures the surface effect of the NPs in the immediate neighborhood of the surface and/or NP film adsorbed on the surface. Higher δR/δf corresponds to a longer slip time, and a decrease in the drag forces at the interface provided by the NPs.

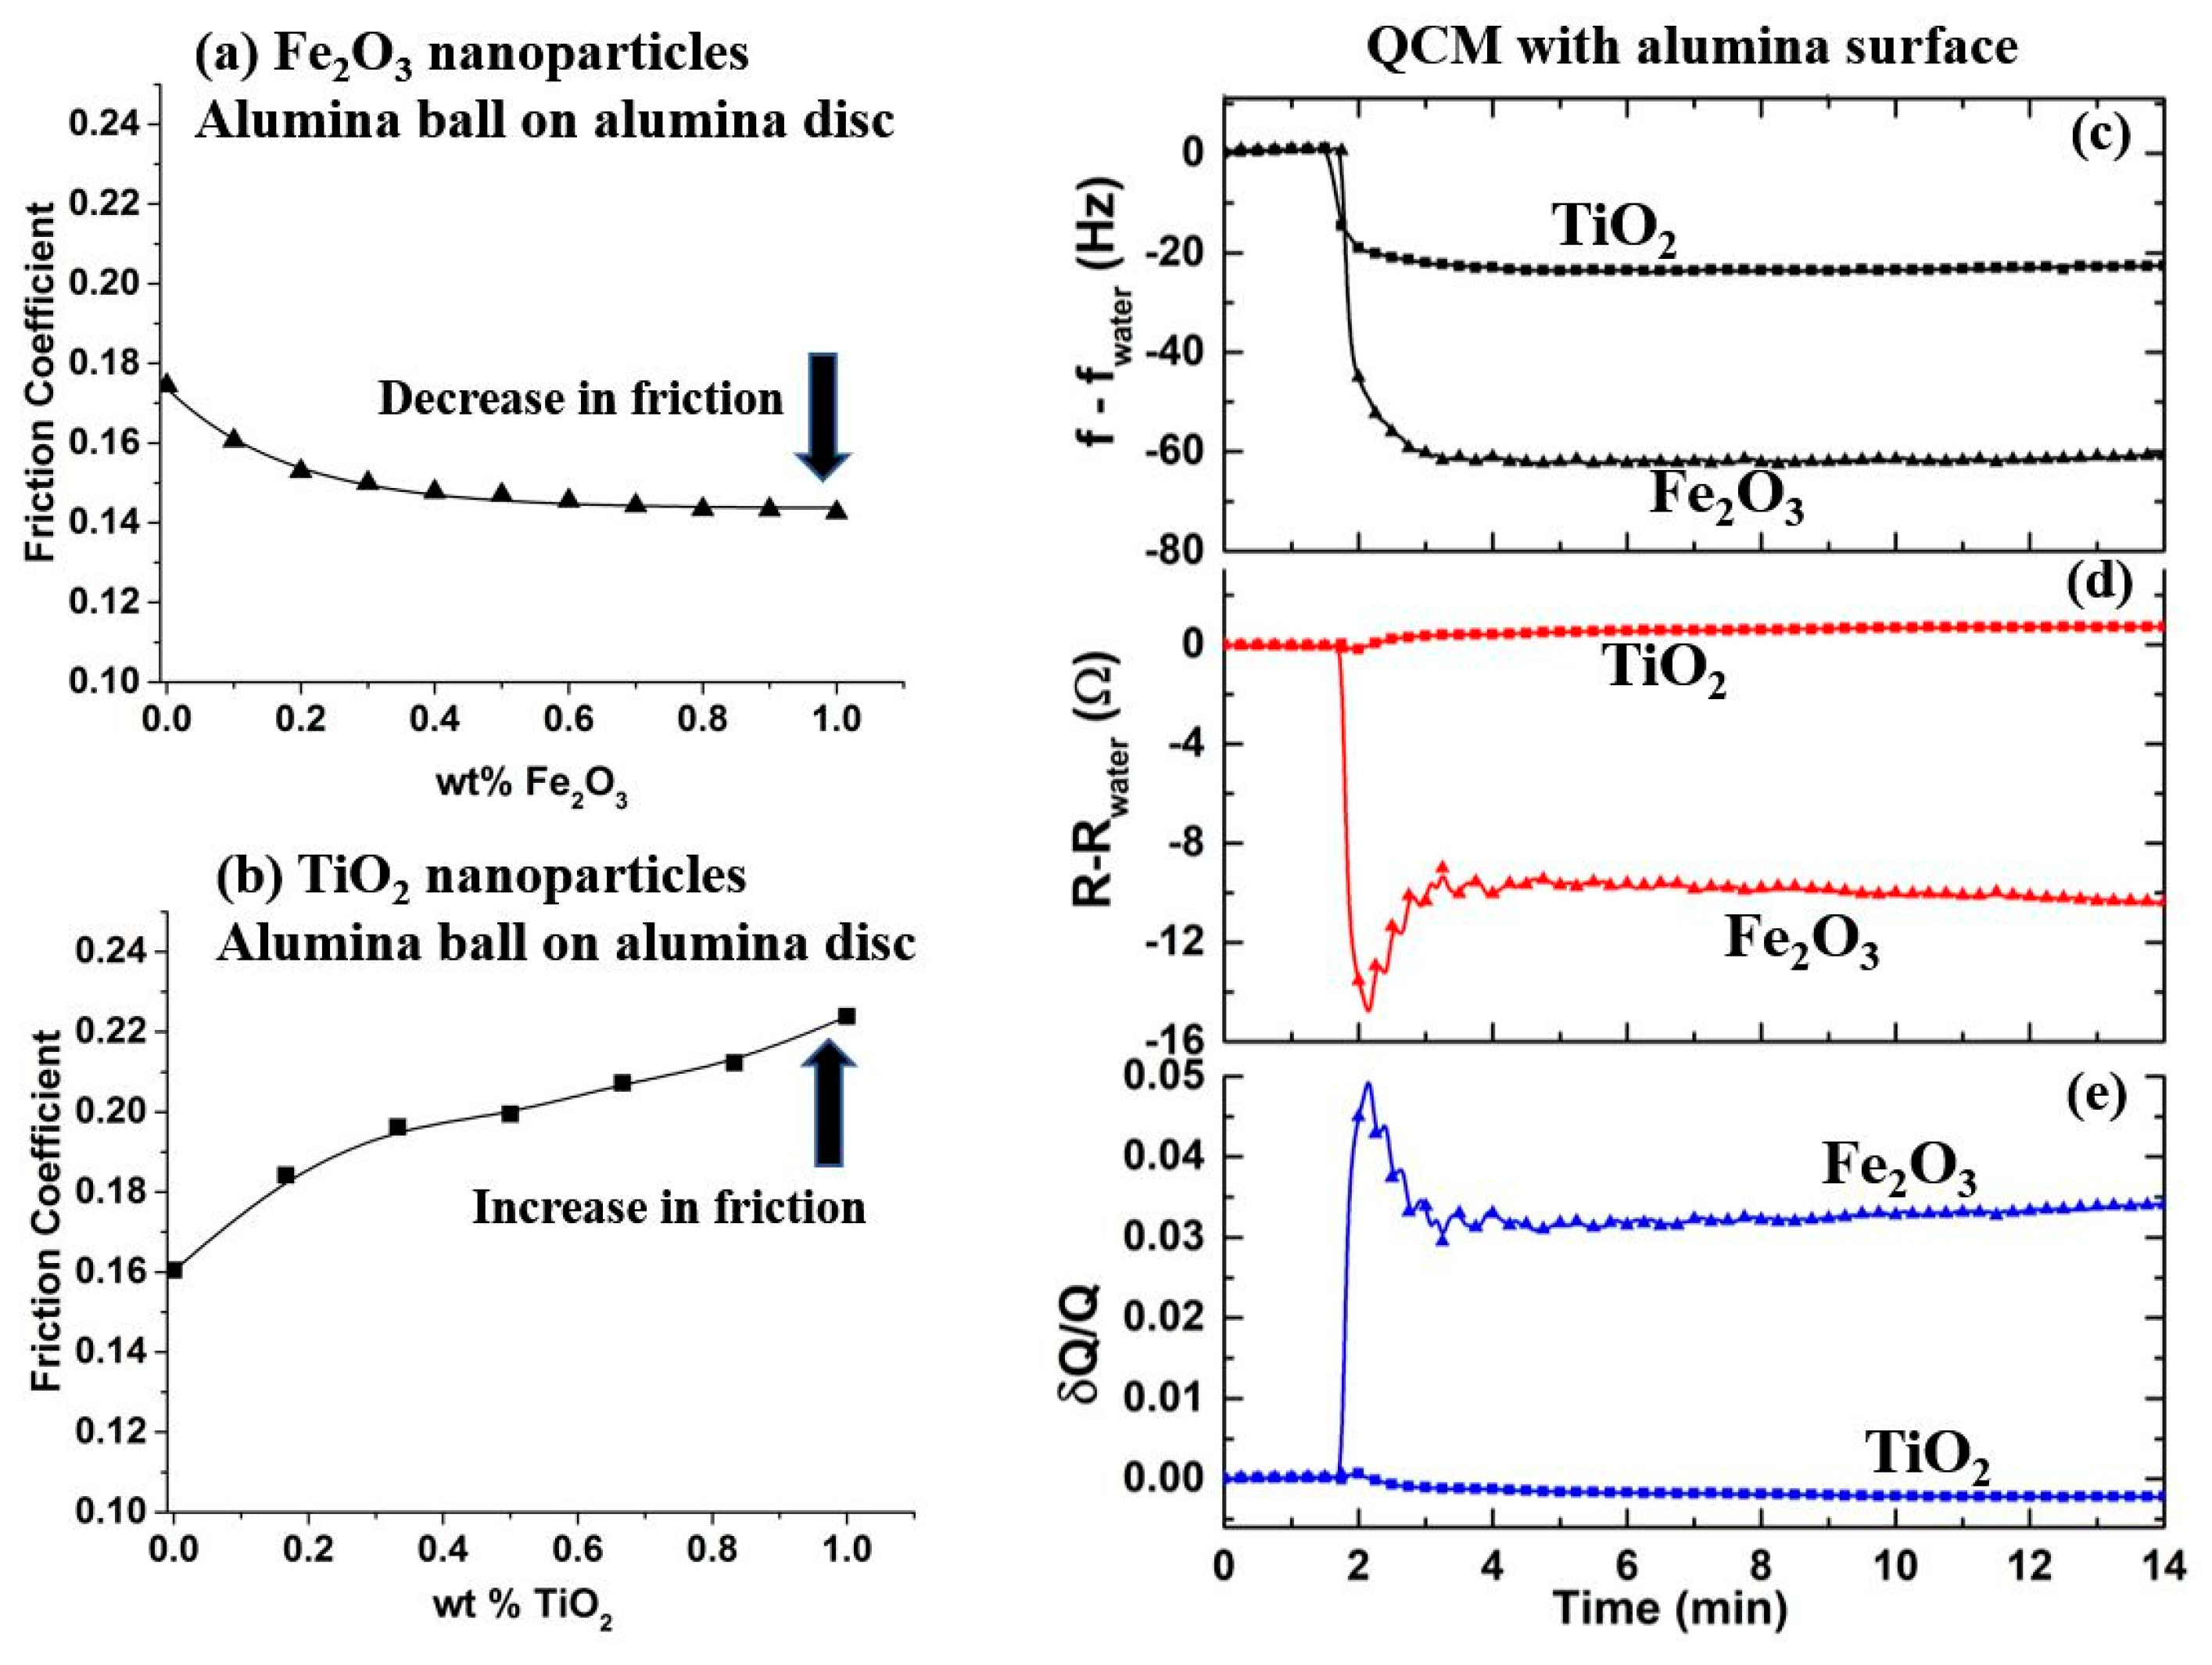
4.5. Macroscale Friction of Selected Systems and the Relation to QCM Measurements

The quantity δR/δf, observable in QCM experiments, has been reported as a nanotribological performance factor for the lubrication effect of nanoparticles at nano-scale [16], and has been previously correlated with the decrease in macro-scale friction coefficient at the contacts lubricated by aqueous suspension. The macro-scale friction between alumina ball and alumina disc lubricated by Fe2O3 and TiO2 nanosuspensions are shown in Figure 8a,b respectively. The Fe2O3 nanosuspension decreased while TiO2 nanosuspension increased the friction. This change in friction levels measured with a ball-on-disc tribometer is correlated to the QCM measurements as illustrated in Figure 8c–e. The friction between alumina ball sliding on alumina disc submerged in DI water decreases (increases) with the addition of Fe2O3 (TiO2) NP in the solution. An analogous trend has been observed in the QCM measurements discussed in the avbove sections. Addition of both Fe2O3 and TiO2 NPs in water result in a decrease in frequency of the QCM with the alumina surface electrode indicating that both NPs are adsorbed on the surface, Fe2O3 being adsorbed in a higher extent. But the motional resistance (Figure 8d) and Q-factor (Figure 8e) trend in the opposite direction for the two NPs. A decrease in resistance for Fe2O3 NPs implies a decrease in the QCM energy dissipation and, hence, reduced motional drag forces at the interface, whereas an increase in resistance for TiO2 implies an increase in the QCM energy dissipation and an increased friction at the interface. In Figure 7, these cases are respectively represented by the data points enclosed by an oval and a rectangle. The oval corresponds to positive δR/δf and reduced interfacial drag forces for Fe2O3 NPs, and the rectangle corresponds to negative δR/δf and increased interfacial drag forces for TiO2 NPs on alumina surface. Therefore, the parameter δR/δf, so-called performance factor, is linked to the relative performance of NPs for their nanotribological effect at the solid–liquid interfaces. The metallic surfaces Cu, Pt, and Al are among the highest performing substrates for the TiO2 NP suspension, as evidenced by the highest performance factor.

5. Discussion

Of the various candidate performance factors considered in this study based on available datasets, we observe that the quantity δf is not linked to nanoscale or macroscale lubricity in an obvious way. The performance factors associated with δR and δR/δf plotted in Figure 5; Figure 7 do, however, show trends with macroscale measurements of friction coefficient, as well as being clear representations of atomic scale lubricity. Of the 48 datasets recorded, 37 are reflective of enhanced lubrication while 11 may indicate increases in macroscale friction. For the systems selected for the macroscale friction measurements, this indeed was the case. We therefore find that the previous link identified for one particular materials combination may be applicable to far more diverse set of nanoparticle–substrate combinations. Since the QCM measures the frictional drag forces at a solid liquid boundary, the correlation is likely to be applicable for mixed and hydrodynamic lubrication regimes.
For the systems studied, the variation between the nanoparticles is found to be larger than the variation between the substrates (Figure 6), indicating that the nanoparticles play a bigger role than the substrates in determining the lubrication at the interface. Comparison of the performance factors with the materials properties listed in Table 2 for the substrate materials does not, however, reveal any direct links between the individual material properties and the interfacial drag forces. Identification of these influential properties is the key for designing new material systems for specific lubrication applications, and it is highly likely that the manner in which multiple properties collectively combine gives rise to the net tribological performance.
One of the overarching goals of the present research is to uncover intrinsic characteristics of materials, i.e., the “genes” [40,41], which govern the tribological behavior of given material systems. The data in Figure 7 shows a variation in the performance factor among substrates and nanoparticles. Statistical analysis is required to explore the relations to the candidate physical properties of the substrate materials and nanoparticles that could give rise to the observed behavior. In the present case, the relation between the materials genome and tribological performance is not obvious, and is likely to be related to a more subtle relationship between the materials. This is in fact expected to be the case: otherwise a direct and obvious relation would have already been determined. The diversity of materials combinations studied here begins a data base for statistical analysis of system properties that can in principle uncover genes that cannot be readily be solved with traditional tools such as, for example, thermodynamic and first principles databases. A statistical analysis of diverse measured properties may be necessary to uncover the relevant materials genes, and statistical methods can readily be employed to identify significant associations between the selected genes and the performance factors. The statistically significant relationships have the critical advantage of being able to make predictions for new substrates using only their physical properties and the methods can be expanded to design new materials for the optimization of the performance factors.

6. Conclusions

The nanotribological properties of four nanoparticles TiO2, SiO2, Al2O3, and Fe2O3 and ten substrate materials Au, Al, Cr, Cu, Mo, Ni, Pt, SiO2, Al2O3, and SS304 were studied for aqueous suspensions of the nanoparticles employing a QCM technique. The suspensions were characterized on the basis of extent of nanoparticle adsorption on surface, erosion of surface material and change in the frictional energy dissipation at the interface. The principle observations and conclusions are as follows.
  • Four QCM measurement parameters δf, δR, δQ/Q, and δR/δf were considered. Among these, the parameter δR/δf was identified to be the performance factor that characterized enhancement of lubricity upon introduction of nanoparticles the best.
  • The performance factor δR/δf that describes the nanotribological effect measured with QCM was found to be applicable to a wider and more diverse set of nanoparticle–substrate combinations than had previously been reported. The extent of the regime of lubrication over which the performance factor correlates with macroscale lubricity is yet to be fully established.
  • Variations in the performance factor from one nanoparticle to another are observed to be far greater than the variation from one substrate to another, consistent with nanoparticle properties playing a larger role than the substrate physical properties in determining the frictional drag force levels.
  • The performance factor was not found to have an obvious correlation with any of the material properties considered. A comprehensive statistical analysis of the data would be required to possibly identify candidate material intrinsic properties that determine the performance of a system as lubricant.
Overall, this study pioneers a promising methodology within the broader approach of the materials genome initiative by enabling statistical methods for identification of particularly important material intrinsic properties (genes) linked to both nano- and macro-scale lubricity.

Author Contributions

Conceptualization, J.K., A.I.S. and D.W.B.; Methodology, B.A., T.N.P. and J.K.; Validation, B.A., J.K., A.I.S. and D.W.B.; Formal Analysis, B.A., T.N.P. and J.K.; Investigation, J.K., A.I.S. and D.W.B.; Resources, L.S.; Data Curation, B.A. and T.N.P.; Writing-Original Draft Preparation, B.A.; Writing-Review & Editing, all authors; Visualization, B.A., T.N.P. and J.K.; Supervision, J.K., A.I.S. and D.W.B.; Project Administration, J.K., A.I.S. and D.W.B.; Funding Acquisition, D.W.B.

Funding

This work was supported by National Science Foundation Award Number DMR1535082.

Conflicts of Interest

The authors declare no conflict of interest.

References

  1. Singh, R.; Kukrety, A.; Chouhan, A.; Atray, N.; Ray, S. Recent Progress in the Preparation of Eco-friendly Lubricant and Fuel Additives through Organic Transformations of Biomaterials. Mini-Rev. Org. Chem. 2017, 14, 44–55. [Google Scholar] [CrossRef]
  2. Kim, H.-J.; Kim, D.-E. Water Lubrication of Stainless Steel using Reduced Graphene Oxide Coating. Sci. Rep. 2015, 5, 17034. [Google Scholar] [CrossRef] [PubMed]
  3. Fan, M.; Du, X.; Ma, L.; Wen, P.; Zhang, S.; Dong, R.; Sun, W.; Yang, D.; Zhou, F.; Liu, W. In situ preparation of multifunctional additives in water. Tribol. Int. 2019, 130, 317–323. [Google Scholar] [CrossRef]
  4. Yu, X.; Zhou, J.; Jiang, Z. Developments and Possibilities for Nanoparticles in Water-Based Lubrication During Metal Processing. Rev. Nanosci. Nanotechnol. 2016, 5, 136–163. [Google Scholar] [CrossRef]
  5. Chen, Y.; Renner, P.; Liang, H. Dispersion of Nanoparticles in Lubricating Oil: A Critical Review. Lubricants 2019, 7, 7. [Google Scholar] [CrossRef]
  6. Dai, W.; Kheireddin, B.; Gao, H.; Liang, H. Roles of nanoparticles in oil lubrication. Tribol. Int. 2016, 102, 88–98. [Google Scholar] [CrossRef]
  7. Liu, Z.; Leininger, D.; Koolivand, A.; Smirnov, A.I.; Shenderova, O.; Brenner, D.W.; Krim, J. Tribological properties of nanodiamonds in aqueous suspensions: Effect of the surface charge. RSC Adv. 2015, 5, 78933–78940. [Google Scholar] [CrossRef]
  8. Hase, A.; Mishina, H. Wear elements generated in the elementary process of wear. Tribol. Int. 2009, 42, 1684–1690. [Google Scholar] [CrossRef]
  9. Curtis, C.K.; Marek, A.; Smirnov, A.I.; Krim, J. A comparative study of the nanoscale and macroscale tribological attributes of alumina and stainless steel surfaces immersed in aqueous suspensions of positively or negatively charged nanodiamonds. Beilstein J. Nanotechnol. 2017, 8, 2045–2059. [Google Scholar] [CrossRef]
  10. Vollath, D.; Szabó, D.V.; Hauβelt, J. Synthesis and properties of ceramic nanoparticles and nanocomposites. J. Eur. Ceram. Soc. 1997, 17, 1317–1324. [Google Scholar] [CrossRef]
  11. Thomas, S.; Harshita, B.S.P.; Mishra, P.; Talegaonkar, S. Ceramic Nanoparticles: Fabrication Methods and Applications in Drug Delivery. Curr. Pharm. Des. 2015, 21, 6165–6188. [Google Scholar] [CrossRef] [PubMed]
  12. Moreno-Vega, A.-I.; Gómez-Quintero, T.; Nuñez-Anita, R.-E.; Acosta-Torres, L.-S.; Castaño, V. Polymeric and Ceramic Nanoparticles in Biomedical Applications. J. Nanotechnol. 2012, 2012, 936041. [Google Scholar] [CrossRef]
  13. Ma, Y.; Bao, J.; Zhang, Y.; Li, Z.; Zhou, X.; Wan, C.; Huang, L.; Zhao, Y.; Han, G.; Xue, T. Mammalian Near-Infrared Image Vision through Injectable and Self-Powered Retinal Nanoantennae. Cell 2019, 177, 243–255. [Google Scholar] [CrossRef] [PubMed]
  14. Cohen, A.E. Control of Nanoparticles with Arbitrary Two-Dimensional Force Fields. Phys. Rev. Lett. 2005, 94, 118102. [Google Scholar] [CrossRef] [PubMed] [Green Version]
  15. Acharya, B.; Avva, K.; Thapa, B.; Pardue, T.; Krim, J. Synergistic Effect of Nanodiamond and Phosphate Ester Anti-Wear Additive Blends. Lubricants 2018, 6, 56. [Google Scholar] [CrossRef]
  16. Pardue, T.N.; Acharya, B.; Curtis, C.K.; Krim, J. A Tribological Study of γ-Fe2O3 Nanoparticles in Aqueous Suspension. Tribol. Lett. 2018, 66, 130. [Google Scholar] [CrossRef]
  17. Acharya, B.; Chestnut, M.; Marek, A.; Smirnov, A.I.; Krim, J. A Combined QCM and AFM Study Exploring the Nanoscale Lubrication Mechanism of Silica Nanoparticles in Aqueous Suspension. Tribol. Lett. 2017, 65, 115. [Google Scholar] [CrossRef]
  18. Acharya, B.; Seed, C.M.; Brenner, D.W.; Smirnov, A.I.; Krim, J. Tuning friction at material-nanoparticle-liquid interfaces with an external electric field. arXiv 2019, arXiv:1901.10512 v1. [Google Scholar]
  19. Acharya, B.; Sidheswaran, M.A.; Yungk, R.; Krim, J. Quartz crystal microbalance apparatus for study of viscous liquids at high temperatures. Rev. Sci. Instrum. 2017, 88, 025112. [Google Scholar] [CrossRef] [PubMed]
  20. Mizele, J.; Dandurand, J.L.; Schott, J. Determination of the surface energy of amorphous silica from solubility measurements in micropores. Surf. Sci. 1985, 162, 830–837. [Google Scholar] [CrossRef]
  21. Pagonis, V.; Ankjærgaard, C.; Murray, A.S.; Chen, R. Optically stimulated exoelectron emission processes in quartz: Comparison of experiment and theory. J. Lumin. 2009, 129, 1003–1009. [Google Scholar] [CrossRef]
  22. Vitos, L.; Ruban, A.V.; Skriver, H.L.; Kollár, J. The surface energy of metals. Surf. Sci. 1998, 411, 186–202. [Google Scholar] [CrossRef]
  23. Yaws, C.L. Yaws’ Handbook of Properties of the Chemical Elements; Knovel: New York, NY, USA, 2011. [Google Scholar]
  24. Lide, D.R. CRC Handbook of Chemistry and Physics, 2015–2016, 96th ed.; CRC Press: Boca Raton, FL, USA, 2014. [Google Scholar]
  25. Skriver, H.L.; Rosengaard, N.M. Surface-Energy and Work Function of Elemental Metals. Phys. Rev. B 1992, 46, 7157–7168. [Google Scholar] [CrossRef]
  26. Brinkmann, N.R.; Tschumper, G.S.; Schaefer, H.F. Electron affinities of the oxides of aluminum, silicon, phosphorus, sulfur, and chlorine. J. Chem. Phys. 1999, 110, 6240–6245. [Google Scholar] [CrossRef]
  27. Bratsch, S.G. Standard Electrode Potentials and Temperature Coefficients in Water at 298.15 K. J. Phys. Chem. Ref. Data 1989, 18, 1–21. [Google Scholar] [CrossRef] [Green Version]
  28. Samsonov, G. Handbook of the Physicochemical Properties of the Elements. In Handbook of the Physicochemical Properties of the Elements; Springer: New York, NY, USA, 1968; pp. 387–446. [Google Scholar]
  29. Chase, M.W., Jr. NIST-JANAF Themochemical Tables, 4th ed.; American Institute of Physics: College Park, MD, USA, 1998. [Google Scholar]
  30. Knovel Critical Tables (2nd Edition)—Knovel. Available online: http://app.knovel.com/web/toc.v/cid:kpKCTE000X/viewerType:toc/root_slug:knovel-critical-tables/url_slug:knovel-critical-tables (accessed on 1 November 2017).
  31. Stanford Research Systems. QCM 100 Quartz Crystal Microbalance Analog Controller—QCM 25 Crystal Oscillator; Stanford Research Systems, Inc.: Sunnyvale, CA, USA, 2002. [Google Scholar]
  32. Kanazawa, K.K.; Gordon, J.G. Frequency of a quartz microbalance in contact with liquid. Anal. Chem. 1985, 57, 1770–1771. [Google Scholar] [CrossRef]
  33. Alassi, A.; Benammar, M.; Brett, D. Quartz Crystal Microbalance Electronic Interfacing Systems: A Review. Sensors 2017, 17, 2799. [Google Scholar] [CrossRef]
  34. Mishra, P.C.; Mukherjee, S.; Nayak, S.K.; Panda, A. A brief review on viscosity of nanofluids. Int. Nano Lett. 2014, 4, 109–120. [Google Scholar] [CrossRef] [Green Version]
  35. Breki, A.; Nosonovsky, M. Einstein’s Viscosity Equation for Nanolubricated Friction. Langmuir 2018, 34, 12968–12973. [Google Scholar] [CrossRef]
  36. Manikandan, S.; Karthikeyan, N.; Rajan, K.S. Viscosity of Fe2O3 nanoparticles dispersion in water and ethylene glycol-water mixture (nanofluids). Int. J. Nanopart. 2013, 6, 10–27. [Google Scholar] [CrossRef]
  37. Sauerbrey, G. Verwendung von Schwingquarzen zur Wägung dünner Schichten und zur Mikrowägung. Zeitschrift für Physik 1959, 155, 206–222. [Google Scholar] [CrossRef]
  38. Ghaednia, H.; Babaei, H.; Jackson, R.L.; Bozack, M.J.; Khodadadi, J.M. The effect of nanoparticles on thin film elasto-hydrodynamic lubrication. Appl. Phys. Lett. 2013, 103, 263111. [Google Scholar] [CrossRef]
  39. Krim, J.; Widom, A. Damping of a crystal oscillator by an adsorbed monolayer and its relation to interfacial viscosity. Phys. Rev. B 1988, 38, 12184. [Google Scholar] [CrossRef]
  40. Kalil, T.; Wadia, C. Materials Genome Initiative for Global Competitiveness. Available online: https://www.mgi.gov/sites/default/files/documents/materials_genome_initiative-final.pdf (accessed on 25 April 2019).
  41. White, A. The Materials Genome Initiative: One year on. MRS Bull. 2012, 37, 715–716. [Google Scholar] [CrossRef] [Green Version]
Figure 1. (a) A schematic for the QCM experiment: addition of NP into water surrounding an immersed QCM with Au electrodes. Some nanoparticles may adsorb on the QCM surface while the rest remain dispersed in the water. The frequency (b) and motional resistance (c) for a QCM with Au surface electrode immersed in deionized (DI) water followed by an addition of TiO2 NPs to final concentration of 0.67 wt %. (d) Change in the ratio of frequency to the motional resistance, f/R, of the QCM. The ratio f/R is proportional to the quality factor Q of the QCM oscillator.
Lubricants 07 00049 g001
Figure 2. The shifts in (a) frequency, (b) motional resistance, and (c) relative change in Q-factor for a QCM with Au surface electrode immersed in DI water followed by an addition of TiO2 NPs at regular intervals of 1/6 wt% to the final concentration of 1 wt %. The optimal concentration for the lubrication effect is defined as the highest decrease in R (or increase in Q), and is observed at 0.67 wt % concentration.
Lubricants 07 00049 g002
Figure 3. Example datasets for the various nanoparticle-substrate combinations studied. The shifts in (a) frequency, (b) motional resistance, and (c) relative change in Q-factor for a QCM with surface electrodes of alumina and silica immersed in DI water followed by an addition of TiO2 NPs. (df) The same parameters as above for QCMs with Al and alumina surface electrodes immersed in DI water followed by addition of TiO2 and Fe2O3 NPs, respectively.
Lubricants 07 00049 g003
Figure 4. Change in frequency (δf) for the QCMs with different surface electrodes immersed in water produced by the addition of NPs. The shift is measured with respect to the corresponding value in water. The dashed lines represent the visco-density effect of nanosuspension: 7.5 Hz for 0.6 wt % Fe2O3, −4 Hz for 0.67 wt % TiO2, −3 Hz for 0.67 wt % Al2O3, and −8 Hz for 1.5 wt % SiO2.
Lubricants 07 00049 g004
Figure 5. Change in motional resistance (δR) (a) and relative change in Q-factor (b) of QCMs with different surface electrodes immersed in DI water produced by the addition of NPs. The shift is measured with respect to the corresponding value in water. The dashed lines represent the δR values for visco-density effect of nanosuspensions: 3 Ω for 0.6 wt % Fe2O3, 1.5 Ω for 0.67 wt % TiO2, 1.3 Ω for 0.67 wt % Al2O3, and 3.5 Ω for 1.6 wt % SiO2.
Lubricants 07 00049 g005
Figure 6. Change in motional resistance (δR) versus relative change in Q-factor of QCMs with different surface electrodes immersed in water produced by the addition of NPs.
Lubricants 07 00049 g006
Figure 7. Nanotribological parameter δR/δf for four NPs on different substrates. Data points enclosed by oval and rectangular shapes represent the measurements for Fe2O3 and TiO2 NPs on alumina surfaces are also presented in Figure 8c–e.
Lubricants 07 00049 g007
Figure 8. Coefficient of friction between alumina ball sliding on alumina disc submerged in (a) Fe2O3 and (b) TiO2 NPs suspension in water at different concentrations. Change in (c) frequency, (d) motional resistance, and (e) relative change in Q-factor of QCM with alumina surface electrode immersed in DI water upon addition of Fe2O3 or TiO2 NPs to the concentration of 1 wt% and 0.67 wt% respectively. Decrease (increase) in resistance observed in (d) for Fe2O3 (TiO2) NPs is correlated to decrease (increase) in friction in (a) or (b).
Lubricants 07 00049 g008
Table 1. Properties of the nanoparticles (NP) studied [16,17,18]. The concentration range listed represents the values used in quartz crystal microbalance (QCM) measurements to determine the optimal concentration. The final measurements at or close to the optimal concentration are reported in Section 4.
NanoparticleAverage Diameter (nm)pHZeta Potential (mV)Concentrations Used in QCM Measurements (wt %)Density (g/cm3)
Al2O3304.560.90.17–1.003.95
Fe2O357.0 *0.0 *0.2–1.005.24
TiO2407.7−32.70.33–1.004.23
SiO2759.6−21.10.50–1.751.87
SiO2–P5010.2−27.21.502.65
* The Fe2O3 suspension is at neutral pH setting with steric stabilization and the zeta potential is approximately zero.
Table 2. Properties of the materials utilized for the QCM electrode surfaces. The values with * are calculated as the weighted averages of the properties based on chemical composition of the material [20,21,22,23,24,25,26,27,28,29,30].
PropertiesMaterials
304SSAlAl2O3AuCrCuMoNiPtSilica
Vickers Hardness (MPa)1700–210016720594188–216106035615306385496963
Bulk Modulus (GPa)134–1517622822016014023018023033.5–36.8
Density (g/cm3)8.02.7023.9919.327.198.9610.288.921.452.1977
Electrical resistivity (Ω m)6.5–7.7 × 1072.82 × 1082.0 × 10112.44 × 1081.25 × 1071.68 × 1085.0 × 1086.9 × 1081.05 × 1081.0 × 1016
Thermal Conductivity (W/m K)16.22373531793.940113990.771.61.38
Electron Affinity (eV)0.362 *0.432833.282.30860.675841.2350.7451.1562.1282.03
Work Function (eV)4.44.06–4.261.955.31–5.474.54.794.6555.04–5.355.531.20
Shear Modulus (GPa)74-8126152271154120766170
Surface Energy (mJ/m2)700–110012709001283412316502953.520112299396
Standard Electrode Potential (V)−0.490 *−1.677−2.331.5−0.740.339−0.13−0.2361.18−0.99
Roughness (nm)2.089.945.431.082.24-3.172.224.713.901.713.26
Table 3. Response of QCMs categorized by the direction of the frequency and motional resistance shifts upon introduction of NP’s. The numerals I, II, and III correspond to δffilm < 0 and δR < 0; δffilm ~ 0, δR < 0, and δffilm < 0, δR > 0. The letters ‘E’ and ‘e’ respectively indicate “significant” and “slight” erosion.
SubstrateNanoparticle
Al2O3Fe2O3SiO2SiO2-PTiO2
304SS I
Al II, e
AluminaIIII, E III, e
Au IIIII
Cr I
Cu II, E
Mo II, E
Ni IIII
PtIII II
Silica I

