Binary Phase Diagrams and Thermodynamic Properties of Silicon and Essential Doping Elements (Al, As, B, Bi, Ga, In, N, P, Sb and Tl)


1
Mechanical and Materials Engineering Department, Khalifa University of Science and Technology, Masdar Institute, Masdar City 54224, UAE
2
Mechanical Engineering Department, Concordia University, 1515 Rue Sainte Catherine west, Montreal, QC H3G 2W1, Canada
*
Author to whom correspondence should be addressed.
Materials 2017, 10(6), 676; https://doi.org/10.3390/ma10060676
Submission received: 15 May 2017
/
Revised: 13 June 2017
/
Accepted: 13 June 2017
/
Published: 20 June 2017
Abstract
:Fabrication of solar and electronic silicon wafers involves direct contact between solid, liquid and gas phases at near equilibrium conditions. Understanding of the phase diagrams and thermochemical properties of the Si-dopant binary systems is essential for providing processing conditions and for understanding the phase formation and transformation. In this work, ten Si-based binary phase diagrams, including Si with group IIIA elements (Al, B, Ga, In and Tl) and with group VA elements (As, Bi, N, P and Sb), have been reviewed. Each of these systems has been critically discussed on both aspects of phase diagram and thermodynamic properties. The available experimental data and thermodynamic parameters in the literature have been summarized and assessed thoroughly to provide consistent understanding of each system. Some systems were re-calculated to obtain a combination of the best evaluated phase diagram and a set of optimized thermodynamic parameters. As doping levels of solar and electronic silicon are of high technological importance, diffusion data has been presented to serve as a useful reference on the properties, behavior and quantities of metal impurities in silicon. This paper is meant to bridge the theoretical understanding of phase diagrams with the research and development of solar-grade silicon production, relying on the available information in the literature and our own analysis.
1. Introduction
The primary energy sources for electrical power generation are recognized as unsustainable. For instance, combustion of fossil fuels (coal, petroleum, and natural gas) emit massive quantities of CO2 in the atmosphere that leads to severe climate changes, such as global warming, sea level rise and change in the rain fall patterns [1,2,3]. Nuclear power plants are more environmentally friendly (emit zero CO2. However, these plants can be extremely dangerous, if unsafely operated as was the case in the Chernobyl disaster in 1986 [4], or if natural disasters take place in events such as the Fukushima nuclear accident [5]. Storage of the highly radioactive waste is another serious issue that must be taken into consideration [1]. It is expected that both safety and high-level nuclear waste issues will be more seriously examined in the next generation of nuclear power reactors. For the reasons mentioned above, more use of clean and renewable energy sources is crucial. Sources of renewable energy, solar in particular, can provide vital solutions to problems associated with fuel combustion and nuclear fission. The solar energy is transferred into direct current electrical power via the photovoltaic (PV) effect [6], which was discovered and demonstrated by the Nobel Laureate Becquerel [7,8].
Solar cells are traditionally divided into three different generations, these are: silicon-based solar cells, thin-films solar cells and solar cells based on nano-crystals and nano-porous materials [2,3,6,9]. Most of the available solar cell modules for contemporary market demands are made of crystalline silicon (c-Si). Thin film solar cells (TFSC) [10,11], including: amorphous silicon (a-Si), copper indium gallium diselenide Cu(In,Ga)Se2 (CIGS), cadmium telluride (CdTe) and others, represent 10% of the solar cells market [1]. The third generation of solar cells, include dye-sensitized solar cells (DSSC), hybrid organic solar cells and quantum dot solar cells, and are still under research and development [1,3,9].
The PV industry is currently undergoing significant development. It is difficult to predict which technical pattern has to be followed to achieve the desired outcomes from PV devices. It is important to know which materials will be utilized and what conditions are suitable to ensure maximum efficiency and long-term energy provision. Photovoltaic efficiency is highly influenced by temperature, dopant amount and density of imperfections [1,12]. These conditions might be optimized using heuristic approaches. However, it will be a very long journey to design a perfect PV system. The major goal in solar cell fabrication is to design a process that can minimize the negative effects of impurities or at least passivate them through a better understanding of their relationships with silicon. In this work, we use our knowledge of phase diagrams, obtained by investigating several alloying systems, to understand basic concepts for improvement in PV device performance while also providing thermodynamic properties of the Si-based binary systems. In the course of this work, we focus on crystalline silicon solar cells and binary phase diagrams of silicon with different doping elements, such as Al, As, B, Bi, Ga, In, N, P, Sb and Tl. This should serve as a useful reference for the properties, behavior and quantities of metal impurities in silicon. It is worth mentioning that this work will not provide a theoretical background on c-Si solar cell fabrication or discussion associated to energy levels of semiconductors, but rather serves as a guideline to control the processing parameters of solar and electronic Si through understanding the phase diagram, thermodynamic and diffusion data.
2. Crystalline Silicon Solar Cells
Although they have a theoretical efficiency limit of about 26% [12,13], due to the presence of surface recombination that depletes the minority carriers [14,15,16], crystalline silicon solar cells have dominated PV modules [17]. These cells constitute more than 85% of the worldwide PV market [1]. Dominance of c-Si in PV technology stems to a great extent from the development of Si for the microelectronic applications [18,19], besides its relatively low manufacturing cost, non-toxicity and availability [1,13,15,20]. Both laboratory and industrial-type crystalline silicon solar cells are divided into monocrystalline Si, block-cast polycrystalline Si, ribbon Si and thin-film polycrystalline Si according to the type of the starting silicon wafer [1,2,9,13,15].
Crystalline silicon is an indirect semiconductor and its electrical properties deteriorate largely by the level of defects (bulk and/or surface defects), because they form numerous clusters that capture charge carriers. These defects are classified as intrinsic and extrinsic [15]. Intrinsic defects in pure silicon can be vacancies or self-interstitials that play an important role in many defect processes, such as self or dopant diffusion, strain release in the lattice and radiation defects [17]. Extrinsic defects can be doping atoms, transition metals, interstitial oxygen atoms or carbon substitutional atoms [17,18,21]. The following will be an attempt to summarize a general understanding of impurities in silicon.
3. Impurity Atoms
The concentration space of impurity atoms in the solar and electronic Si ranges from particle per billion (ppb), which represents a challenge to measure for some impurities [22], to few percentages. However, a small change in the impurity level of a PV junction can result in an unacceptable drop in performance. Impurities exist in the Si lattice, as substitutional or interstitial point defects, in the form of precipitates or at the surfaces of the silicon wafers. Their distribution depends on the solubility limits and diffusivity as functions of atomic size and affinity to form bonds with silicon atoms [23].
Solubility limits can be directly determined from a well-established phase diagram as a function of temperature. Processing temperatures can be optimized with the help of a phase diagram to achieve the desired concentration level of impurity atoms.
Knowledge of diffusion mechanisms and diffusivity of impurity atoms is essential to understand the microstructural changes in solar and electronic silicon at any temperature, which can be supported by phase equilibrium studies. Three possible mechanisms of atomic diffusion were established [24,25]. These are: (1) the interstitial mechanism, where the small radius impurity can move from one interstitial position to another, such as group IA and group VIIIA elements; (2) the vacancy mechanism, where substitutional impurity moves via neighboring vacant sites through the host lattice; (3) interstitialcy mechanism (combined interstitial and vacancy mechanisms), where the diffusion occurs when a substitutional impurity resides at an interstitial site replacing a silicon atomand the replaced Si atom undergoes self-interstitial within the regular lattice site [26]. The three diffusion mechanisms are illustrated in Figure 1.
The diffusivity of impurity atoms depends exponentially on temperature according to Arrhenius Equation (1), as follows:
where, Qd is the activation energy and D0 is the temperature-independent pre-exponential factor. R and T are the universal gas constant and the absolute temperature. Impurity with high diffusivity tends to move toward nucleation sites and gives rise to structure relaxation [23].
The success of producing or refining Si materials to high purity levels depends heavily on the availability and reliability of phase diagrams, thermodynamic and diffusion data. This information act as an important tool in evaluating the effects of impurities on the phase equilibria in solar and electronic Si systems. Many impurity atoms may exist in Si wafers, such as oxygen, carbon, transition metals, alkali and alkali-earth impurities and groups IIIA and VA metals [27]. However, in this work, we focus on the impurity atoms of group IIIA (p-type) and group VA (n-type).
4. Impurity Atoms from Groups IIIA and VA
Atoms of these groups act as substitutional impurities in Si. When an atom from group IIIA replaces a Si atom, the remaining valence electrons are insufficient to satisfy the four covalent neighboring bonds. This gives rise to the formation of holes that are weakly tied to group IIIA atoms. Thus, group IIIA atoms are acceptors. On the other hand, group VA impurity atoms are called donors, because they replace a Si atom and one electron remains untied to group VA atom. This extra electron can be easily activated and sent to the conduction band [24]. Besides their suitability as donors and/or acceptors, the binary phase diagrams of Al, As, B, Bi, Ga, In, N, P, Sb and Tl with Si exhibit some similarities. The main similarity between some of these phase diagrams is that the maximum solubility of an impurity atom occurs above the eutectic temperature. This is due to the high entropy of the disordered state, which results in forming defects such as vacancies [28]. This behavior is called retrograde or inverse solubility [28,29]. The retrograde solubility phenomenon occurs during solidification and originates from a miscibility gap in the free energy of mixing [30]. Impurity concentration in the melt varies with the fraction of melt solidified and the value of the impurity distribution coefficient, Ko, which is also known as the segregation or partition coefficient [31]. Ko of group IIIA and group VA dopants in Si is less than one, as listed in Table 1 [28,32]. When Ko is less than one, impurities accumulate progressively at the liquid/solid interface during the continuous crystal pulling process. These impurities deplete when Ko is greater than one [28]. This provides insight on the technical challenges related to producing large volume Si substrates with uniform dopant distribution. From a refining point of view, impurities with a very low distribution coefficient can easily be removed since they accumulate at the bottom end of the crystal and contamination does not occur. For those having higher distribution coefficients (close to unity), they remain in the melt and accumulate in the upper end of the crystal. Thus, some separate chemical processes or multiple zone melting are required to clean them up [33].
The equilibrium distribution coefficient is the ratio of the impurity concentration in the solid, Cs, to that in the liquid, Co, at a given temperature, e.g., T1 in Figure 2. Ko can be obtained from a phase diagram as demonstrated in Figure 2.
From a practical point of view, Ko is used to find the maximum molar solid solubility (Xm) of impurities in silicon through the empirical relationship [34] given in Equation (2):
When the unit of atom/cm3 is used for the maximum solid solubility, CM, Equation (2) can be re-written as in Equation (3) [34]:
This relation was extracted from the maximum solid solubility vs. distribution coefficient plot of the following group of elements: Fe, Zn, S, Mn, Au, Cu, Al, Ga, Li, Sn, Sb, As and P. Although it is not exact for some elements, it may be useful to predict one quantity, either Cm or Ko, if the other one is known, or to evaluate some experimental data [34]. For the aforementioned similarities, phase diagrams of groups IIIA and V elements are evaluated giving special attention to the Si-rich terminal side, due to its practical relevance to production of solar and electronic Si.
5. Phase Diagrams
One of the major reasons to analyze Si binary phase diagrams is that doping elements have a steep temperature-dependent solid solubility limit that renders Si easily supersaturated with them upon cooling. Therefore, they tend to form crystal defects in form of complex precipitates at grain boundaries [1]. These defects are not preferable since they deteriorate solar cell efficiency.
Knowledge of the phase equilibrium and thermodynamic properties of the Si-impurity binary phase diagrams is important for understanding and improving the refining process of metallurgical Si grade feedstock to solar cell grade. For instance, the solvent refining process is one of the metallurgical approaches used for solar-grade silicon production, especially when impurity precipitates exhibit very limited solubility in silicon [35]. In this methodology, the silicon alloy is kept at a temperature above the liquidus, and then the temperature is reduced to a value near the eutectic temperature. As a result, purification solidification takes place and leaves impurities in the liquid phase. This means that purification occurs due to impurity rejection by the solidification front [36]. The success of the solvent refining process depends on the Si-terminal solubility which is decided by careful examination of the solvus line of the equilibrium phase diagram. The accuracy of the solvus lines in an equilibrium phase diagram is highly dependent on the solubility limit measurements. If the solubility values of specific impurities for a specific system are unknown and/or difficult to determine experimentally, or their behavior cannot be extrapolated, thermodynamic modeling is used [37].
Solidification process parameters such as the composition of the alloy, temperature and influence of cooling rate on the microstructure controls the impurity level of the crystallized silicon and can be determined from a well-established phase diagram. In this work, binary phase diagrams of Si with p-type elements (Si-{B, Al, Ga, In, Tl}) and Si with n-type elements (Si-{N, P, As, Sb, Bi}) have been assessed based on the available experimental data and thermodynamic descriptions. Throughout the paper, solid blue color lines are used in the figures to represent our best understanding of the phase diagram and thermodynamic data. All data points, obtained from the literature, are presented in phase diagram and thermodynamic properties figures in order to illustrate the error range. Error bars are provided whenever they are available in the literature. The phase diagrams and thermodynamic properties plots are in mole fraction; whereas, concentrations of impurity elements in the text are in atomic percentage. The crystallographic data for solid phases of all systems are summarized in Table 2. This table will be referred to during the discussion of each binary system.
5.1. The Al-Si System
The Al-Si phase diagram in Figure 3 was redrawn after Murray and McAlister [58] based on the available experimental and thermodynamic data in the literature. The dashed line represents the calculated system by Liang et al. [59]. The system exhibits a eutectic reaction and two terminal solid solutions. The eutectic occurs at 12.2 at % Al and 577 °C. Many researchers [60,61,62,63,64,65] studied the solvus line in the Al-rich side as shown in Figure 4. The maximum solid solubility of Si in Al terminal solid solution is about 1.5 at % Si. The liquidus curve and the thermodynamic activity of the melts have been extensively reviewed and recalculated by Safarian et al. [66,67]. The solvus curve of the Si terminal solid solution among the different studies was inconsistent, as can be seen in Figure 5. In addition to the experimental errors, the data scattering could be due to the presence of low concentration impurities, which reduce the accuracy of the measurements. Gudmundsen and Maserjian [29], using thermal gradient experiments and spectrophotometric analysis, measured the solubility of Al in Si as 2.9 × 10⁻⁴ and 2.4 × 10⁻⁴ at % at 715 °C and 720 ± 10 °C, respectively, as compared to Mondolfo [65] who reported the solubility of Al in Si to be ranging from 1 × 10⁻² at % at 1327 °C to 1.15 × 10⁻² at % at 997 °C. Navon and Chernyshov [68] measured the solubility of Al in Si in the 700–1200 °C temperature range using resistivity measurements. Their measurements showed fair agreement with the data of Miller and Savage [69] at 1200 °C but not at lower temperatures, due to the inaccuracy of diffusion measurements [69] at low temperatures. Navon and Chernyshov [68] further reported a retrograde behavior in the Si-rich side with a maximum of 1.7 × 10⁻² at % Al at around 1204 °C. In their review, Murray and McAlister [58] estimated the maximum solubility of Al in Si, based on the experimental results of [65,68], to be 1.61 × 10⁻² at % Al at about 1210 °C.
In a recent study, Yoshikawa and Morita [70] measured the solid solubility of Al-Si melts, prepared by true gradient zone melting (TGMZ) method, using electron probe microanalyzer (EPMA) and Hall measurements, and reported a similar retrograde solubility behavior to that of [68]. The solubility values obtained from the two measuring methods [70] were consistent with each other and gave maximum at 4.3 × 10⁻² at % Al and 1177 °C. The same level as the solubility of Al in Si [70] was obtained by Nishi et al. [71] using inductively coupled plasma (ICP spectrometry. Although these values are higher than those in the literature, yet they are accepted in the current work, because Yoshikawa and Morita [70] formed Si single crystal using TGMZ method, which makes the hole mobility measurements possible. The crystallographic data of the terminal solid solutions in Al-Si system are listed in Table 2.
It is worth mentioning that silicon films formed from Al-Si melt are not suitable as PV materials, because of the high solubility of Al in liquid Si. In other words, the number of aluminum acceptors would increase dramatically upon cooling due to Al supersaturation in Si lattice. The solubility of Al can be lowered by adding other elements to the melt such as P, which reacts with aluminum to form small insoluble particles of AlP intermetallic [72].
It is proven experimentally that the solubility of Si in Al can be increased using rapid quenching process of Al-Si melts under pressure [37]. Soma et al. [73], using first principle calculations, measured the solubility of Si in Al under pressure of 0, 3, 5 and 10 GPa. They concluded that the solid solubility of silicon in aluminum extends from 1.6 to ~30.0 at % under pressure and their results were in good agreement with the available experimental data [74,75]. No information about the Al solubility in Si at high pressure could be found in the literature.
Aluminum is considered the fastest diffusing acceptor dopant in silicon, thus it is used to fabricate deep n-p junctions with large thicknesses [90,91]. Despite their industrial importance, fabrication of aluminum n-p junctions requires high processing temperature of about 1250 °C, corresponding to the maximum Al solubility in Figure 5, and a long time of 40 h [91]. These severe conditions give rise to defect formation and to possible contamination. Furthermore, new processing techniques, such as ion implantation [92], focus on shortening the diffusion time and lowering the diffusion temperature. In order to achieve the optimum processing conditions, the diffusion behavior of Al in Si must be very well understood. The diffusivity of aluminum in silicon was measured by Krause and Ryssel [91] in the 850–1290 °C temperature range. They measured both intrinsic, , and extrinsic, , diffusion coefficients and the results are summarized in Table 3. The diffusivity of several elements in silicon, including those involved in the current work, has been reported in the literature. More details are available in the works of Fisher [93] and Tang et al. [94].
Chakraborti and Lukas [95] critically reviewed the available phase diagram and thermodynamic data of Al-Si system in the literature. Using computational thermodynamics, enormous number of Al-Si phase diagram calculations were performed [27,59,87,88,96,97,98,99,100,101]. The thermodynamic properties, enthalpy of mixing and activity, are calculated as shown in Figure 6a,b, respectively. The thermodynamic parameters of the Al-Si system are listed in Table 4.
In Figure 6a, the calculated enthalpy of mixing of the liquid phase by Murray and McAlister [58] at 1427 °C agree with the reaction calorimetric result of Bros et al. [102] within ±225 J·mol−1 only at mid-composition, but differ 900 J·mol−1 from the results of Korber et al. [58] and 500 J·mol−1 from Gizenko et al. [103]. In contrast, Tang et al. [99] gave higher weight to the experimental results of Rostovtsev and Khitrik at 1600 °C [104]. Other calculations performed by Safarian et al. [66] and Tang et al. [105] were lower than any of the reported values. The low values might be as a result of attempts made by authors [66,105] to be consistent with the phase diagram data only. On the other hand, experimental points given by Gizenko et al. [103] showed higher enthalpy of mixing than others. This might explain why these results were not considered in thermodynamic calculations of [66,99,105]. The calculated enthalpy of mixing in the present work, taking into account all the available data sets, agree with the experimental data of [102] in the 58–100 at % Al range and consistent with the calculations of [58] in the full composition range at 1427 °C. Thus, the calculations made in this work are more reliable for thermodynamic modelling purpose. The calculated activity in Figure 6b agrees very well with the experimental data of [103]. The other data points might be scattered due to the difference in the measurement temperatures. The negative deviation from Raoult’s law indicates that the liquid solution is exothermic.
5.2. The As-Si System
This phase diagram has been mainly studied under pressure, because the sublimation temperature of arsenic at atmospheric pressure is low (614 °C) [109]. The melting under pressure of As occurs at 940 °C and 59.2 atm [110]. Talc was used as a solid pressure-transmitting medium to generate pressure inside the test chamber [111]. The As-Si equilibrium phase diagram at a pressure of ~39.5 atm was evaluated by Olesinski and Abbaschian [112] based on the available experimental data [42,113,114,115,116,117,118,119] and thermodynamic descriptions [120,121,122,123], as shown in Figure 7. The liquid phase boundary of the As-Si system in the Si-rich side, up to the eutectic point at around 56 at % Si, was drawn as dotted line in the work of Olesinski and Abbaschian [112] due to the large disagreement among the available data [113,115]. However, the liquidus in the As-rich side and solidus lines agree very well with the results of Ugay et al. [115], who performed vapor pressure measurements using a static manometric method and provided results with higher accuracy than those obtained by Klemm and Prscher [113] and Ugay et al. [114]. The system includes two intermetallic compounds and two terminal solid solutions. The AsSi intermetallic compound melts congruently at 1113 °C; while As2Si undergoes peritectic transformation at 977 °C. The crystallographic data of the solid phases in the As-Si system are given in Table 2. The data of Beck [40] and Wadsten et al. [42] for the AsSi (monoclinic crystal system, AsSi prototype and C2/m space group) and As2Si (orthorhombic crystal system, As2Ge prototype and Pbam space group) phases, respectively, at room temperature are accepted in this work. It is worth mentioning that the stable high-pressure structure of As2Si is pyrite-type, which is not achievable under ambient conditions [119].
The solubility of Si in As is considered negligible, whereas solubility of As in Si shows a retrograde behavior in liquid silicon. It can reach to around 3.25 at % at the eutectic temperature. Several research works [118,125,126,127,128,129,130,131] focused on the Si-rich side to determine the solid solubility limits of arsenic in silicon. According to Olesinski and Abbaschian [112], the maximum solubility of As was reported as 3.5 at % As at ~1200 °C based on the work of Sandhu and Reuter [117], who determined the solvus line from the vapor pressure measurements using radiotracer and chemical methods. Other experimental points were excluded, because they were acquired by electrical conductivity methods that are known to give high error of measurements in this system. Tang et al. [105] assessed the As-Si system based on the experimental data of [113,114,117,118,125,126,131] and the thermodynamic activity data of [116,117]. They [105] re-evaluated the maximum solubility of As in Si to be around 3.4 at % As at 1300 °C, favoring the data of [118,130] over [117,126] without providing any justification. The Si terminal solid solution was described [105] based on a substitutional solution with random mixing assumption. Although Tang et al. [105] incorporated several experimental points in their optimization, the assessment of Olesinski and Abbaschian [112] is favorable in this work, because they are self-consistent. Figure 8 summarizes the solid solubility limits of As in Si and the acceptable solvus line in this work, which provides a maximum solubility of 3.52 at % As at 1200 °C.
It is worth mentioning that if As concentration is higher than the solubility limit, the electrical properties of the heavily As-doped Si deteriorates due to the occurrence of electrically inactive arsenic clusters [125,132,133]. The electrically inactive cluster contains two As atoms and one vacancy position [125,134]. Furthermore, these clusters result in obstructing the phase equilibrium between Si and the AsSi compound by blocking the nucleation of AsSi precipitates. Hence, it is of great importance to determine the maximum solubility of As in Si precisely. Nobili and Slomi [134] described the maximum As concentration, Csat, in Si lattice at equilibrium with AsSi by based on the best fit equation given in Nobili’s earlier work [128] in the 800–1050 °C temperature range.
Impurity atoms may occupy either substitutional or interstitial locations in Si lattice. However, arsenic shows mixed vacancy-interstitial (i.e., interstitialcy as illustrated in Figure 1c) diffusivity in Si [26,135]. It has almost similar tetrahedral radius as silicon (As = 1.24 Å and Si = 1.18 Å), thus it does not strain the silicon lattice. However, at high arsenic concentration, clusters form and retard the diffusivity of As in Si [136]. Intrinsic diffusivity of As in Si can be expressed as in the 900–1250 °C temperature range [137]. Arsenic diffusion in Si is quiet complex due to the change of diffusion mechanism depending on As concentration and temperature. Additional information about arsenic diffusion mechanisms can be found in Hull [138] and Fair [137].
The As-Si system was recalculated using FTlite thermodynamic database integrated in FactSage® software (version 7.0, Thermofact and GTT-Technologies, Montreal, Canada) [124]. In some regions, the calculated phase diagram showed reasonable agreement with the experimental results presented by Ugay et al. [115]. However, many discrepancies were detected. Figure 7 shows both versions of the As-Si phase diagram [112,124] and Table 5 summarizes the differences between these two versions. As can be seen from Figure 7 that the liquidus curve presented by [112] is more convincing than that of [124], because it matches better with the experimental points on both composition extremes. Furthermore, due to the retrograde behavior of the Si-rich solvus line, the shape of Si-rich liquidus in [112] is more appropriate when considering the limiting slopes theory [139].
The thermodynamic properties, enthalpy of mixing and activity of As-Si liquids, are calculated using FTlite database and presented in Figure 9. No experimental enthalpy of mixing or activity of the liquid As-Si alloys could be found in the literature to compare with. The calculated activity curve of liquid As and Si alloys at 1600 °C shows a negative deviation from the ideal behavior. The negative deviation from Raoult’s law could be due to the stronger molecular interaction between As/Si atoms than the interactions between Si/Si and As/As atoms.
The enthalpy of formation of the As-Si intermetallic compounds was determined by Fitzner and Kleppa [140] using direct synthesis drop calorimetry. The actual value of enthalpy of formation of the AsSi compound could be higher than that listed in Table 6, because the measurements were performed on an alloy containing a mixture of AsSi + As2Si rather than on a pure AsSi compound. These experimental results were compared with those predicted by Niessen et al. [141] using the semi-empirical theory of. The predicted results are significantly higher than those obtained experimentally by Fitzner and Kleppa [140], as indicated in Table 6. The large negative values of the calculated enthalpies of formation are because the liquid arsenic that should occur under atmospheric pressure was not considered. It is worth mentioning that the liquid arsenic was treated as a solvent in the work of Niessen et al. [141]. Based on our state of knowledge of this system we recommend further experimental efforts to measure the enthalpy of mixing of the liquid solution, the activities in the liquid phase and most importantly the maximum solubility of As in Si. After this is done, a new thermodynamic modeling considering all the new data should be carried out.
5.3. The B-Si System
Boron is a primary p-type doping element in silicon wafers, with the highest solid solubility in silicon as compared to all elements in group IIIA [90]. According to Zaitsev and Kodentsov [142], the solid solubility of B in Si can reach up to 3.5 at % B at 1362 °C. The B-Si phase diagram was assessed by Olesinski and Abbaschian [143] based on the previous experimental data [118,144,145,146,147] and thermodynamic calculations [148,149,150]. Three intermetallic compounds were reported. Two of them, BnSi (14 < n < 40) and B6Si, form peritectically at 2020 °C and 1850 °C, respectively. Whereas, the third intermetallic compound, B3Si, was found to form by a peritectoid reaction at 1270 °C. The crystallographic data of the intermetallic compounds in the B-Si system are listed in Table 2. B3Si and BnSi were represented as intermediate solid solutions with unknown solubility ranges [143] while B6Si was represented as stoichiometric compound. In the work of [151], B3Si was reported as B4Si Olesinski and Abbaschian [143] suggested that different formulae were due to difficulty in phase separation of B3Si from B6Si, which shows a molar ratio of B to Si of around 4. However, X-ray analysis [45,152] revealed the composition of this compound as B3Si. Hence, in the current work, this compound is considered as B3Si. The BnSi compound was given the formula B14Si after Dirkx and Spear [153], who provided thermodynamic formation data for the B-Si intermetallic compounds. According to these authors [153], the intermediate phases were treated as line compounds and their formation enthalpies and entropies were assumed to be independent of temperature, claiming that it is a good approach when compounds exhibit narrow homogeneity ranges, although BnSi seems to have significant homogeneity range.
Zaitsev and Kodentsov [142] modeled the B-Si phase diagram, based on their own thermodynamic measurements, shown as dashed lines in Figure 10. The modeled phase diagram [142] exhibits reasonable agreement with the assessment of Olesinski and Abbaschian [143] in the B-rich side up to 63.0 at % B. However, differences in other parts of the B-Si phase diagram could be observed. For instance, Zaitsev and Kodentsov [142] lowered the eutectic temperature from 1385 to 1362 °C with a shift in the eutectic composition from 86 to 92 at % Si, and therefore the liquid curve was suppressed in the 40–86 at % Si composition range. Moreover, Zaitsev and Kodentsov [142] treated BnSi as a stoichiometric compound, whereas Olesinski and Abbaschian [143] presented the compound with an appreciable homogeneity range. A comparison between the two phase diagrams [142,143] can be found in [154]. In this work, however, Figure 10 compares both recent calculated phase diagram versions by [155] and [142] with respect to the available experimental data [142,144,147].
The solid lines presented in Figure 10 are for the B-Si phase diagram calculated by Fries and Lukas [155] using the thermodynamic parameters presented in Table 7. These parameters are available in the FTlite database of FactSage® software [124] and generate similar B-Si phase diagram to that of [155]. Equally, Seifert and Aldinger [156] performed a comprehensive review on the experimental and thermodynamic data of the B-Si system and presented a similar phase diagram. The calculated phase diagram [155] is in good agreement with the liquidus experimental results of [147] in the B-rich side as shown in Figure 10 and with those of the solvus reportedby [146,148,157] in the Si-rich side shown in Figure 11. However, the calculated liquidus line in the 70–92 at % Si composition range does not agree with the experimental points of Zaitsev and Kodentsov [142] and Brosset and Magnusson [144]. According to the limiting slopes of phase boundaries theory [139], the Si-rich liquid phase cannot be as flat as given by the experimental points of Brosset and Magnusson [144] and the calculations of Zaitsev and Kodentsov [142], because the liquidus is expected to be pushed upward by the peritectic formation of B6Si at 1850 °C. Thus, the liquidus at the Si-rich side must show steeper slope due to the relatively low eutectic point at 92 at % Si and 1348 °C. The thermodynamic calculations of the B-Si phase diagram, given by [155], are accepted in this work, because they better describe the phase diagram along with other thermodynamic properties of the solution phases and available experimental results.
The B solubility in Si data is scattered and contradictory. The solid solubility of boron in silicon as a function of temperature was first presented by Vick and Whittle [153]. According to these authors, the solid solubility varies from 9.0 × 10⁻⁴ at % at 700 °C to 1.4 × 10⁻² at % at 1151 °C. Olesinski and Abbaschian [139], using different sources [114,141,142], estimated the B solubility in Si to be ~3.0 at %. Whereas, Zaitsev and Kodentsov [138] reported maximum solubility of 3.5 at % B at 1362 °C, favoring the results of Samsonov and Sleptsov [141] only. Although, the calculated solubility of B in Si by Fries and Lukas [151] is in good agreement with the data of [144,153] at 1.6 at %, further investigation of this region is highly recommended. Since the results of Armas et al. [143] and Vick and Whittle [152] support one another, a solvus line consistent with them is adopted in this work.
Boron is a fast diffuser in silicon. The intrinsic diffusivity of boron in silicon as function of temperature was represented by the equation [26]. Van-Hung et al. [158] calculated the diffusion coefficients of boron in silicon based on interstitial and vacancy mechanisms using statistical moment method. The temperature dependence activation energy and diffusion coefficients results [158] were compared with the available [26,159,160,161,162] literature data. They concluded that the dominant diffusion mechanism of B in Si is the interstitial mechanism [26,159,163]. It is worth mentioning that boron atom has 0.75 relative mismatch ratio with respect to, which is relatively large enough to produce high strain in silicon lattice. The induced lattice strain can reduce the level of other unwanted impurities by a trapping mechanism [26]. For example, high concentrations of boron are particularly good to combat iron impurities in Si [164].
The enthalpy of mixing of B-Si melts, presented by a solid line in Figure 12a, was calculated by Olesinski and Abbaschian [143], who tried to fit their calculations with the experimental points given by Esin et al. [150]. Another set of experimental points were presented by Beletskii et al. [165], whose results agreed well with that of Esin et al. [150]. Later, Kudin et al. [166] determined the mixing enthalpies of B-Si melts in the 0.6 < XSi < 1.0 composition range at 1600 °C using isoperibolic calorimetry. The enthalpy of mixing experimental data [166] were different from that of [143,150,165]. This could be attributed to the low purity of amorphous boron used by [166], which was about 98%. However, it is not logical to see a gradual increase and then decrease in the enthalpy of mixing curve [150,165] at the Si-rich side. Such behavior may result from the inaccurate measurements of the interaction energies in boron binary melts [166]. The recent thermodynamic assessments of the B-Si system [167] showed a positive enthalpy of mixing at 2127 °C as presented by a dashed line in Figure 12a. It seems that the liquid phase was treated as a random mixture, because the calculated enthalpy of mixing (4.4 kJ/mole) [167] was relatively small, which is not an accurate representation of the mixing in the B-Si melts. In this work, the enthalpy of mixing experimental results of Kudin et al. [166] are accepted for the B-Si system.
The activities of boron and silicon in the liquid phase were measured by Zaitsev and Kodentsov [142] using Knudsen effusion mass spectrometry in the 1249–1607 °C temperature range. The average activities of B-Si melts established by Zaitsev and Kodentsov [142] at 1577 °C show small deviation from Raoult’s low (negative for B and positive for Si), as shown in Figure 12b. The amount of deviation was found to increase with a decrease in temperature and increase in B concentration. It is important to note that the boron activity data points must obey Henry’s law in the Si side and not as reported by Zaitsev and Kodentsov [142]. Thus, we recommend further experimental efforts to measure the activity of B in the liquid phase. Due to the lack of reliable activity data, the boron and silicon activities at 2127 °C, reported by Franke and Neuschütz [167], are presented as dashed lines in Figure 12b. Both boron and silicon activities [167] show positive deviation from ideality, indicating that the solution is endothermic, which is contradictory to the enthalpy of mixing measurements of [166].
According to data assessment in the current study, the B-Si phase diagram presented by Fries and Lukas [155] is accepted, since it matches with the phase diagram experimental and thermodynamic data. However, the calculated phase diagram [155] showed the maximum solubility of B in Si as 1.6 at % B at 1385 °C (as opposed to 3.5 at % at 1362 °C [142]), trying to fit their calculations with the experimental points of [146,148]. The enthalpies and entropies of formation of the intermetallic compounds values from different authors are scattered as could be seen in Table 8 and Figure 13.
5.4. The Bi-Si System
Bismuth atom is one of the shallow donor impurities in silicon. Bismuth-doped-silicon (Si:Bi) gained increasing interest due to its superior properties over the phosphorus/arsenic-doped-silicon (Si:P/Si:As) junctions [172,173,174,175]. The importance of bismuth-doped-silicon stems from its technological application as an infrared photoconducting detector [176]. The Bi-Si phase diagram was constructed by Olesinski and Abbaschian [50] based on the available experimental results and thermodynamic calculations in the literature [120,177,178,179]. Figure 14 shows the calculated Bi-Si phase diagram obtained from FTlite database and FactSage® software [124], which is consistent with that of [50]. The system exhibits a monotectic transformation at 96.6 at % Si and 1402 °C; as well as a eutectic transformation at 1.7 × 10⁻⁷ at % Si and about 271.4 °C [66]. The solid solubility of Bi in Si showed a retrograde behavior and its maximum was estimated to be around 1.8 × 10⁻³ at % Bi at 1350 °C. Although the calculated [124] and assessed [50] maximum solubility of Bi in terminal Si side are consistent, the solvus line described by Olesinski and Abbaschian [50] is more representative, because it matches better with the experimental data of [118,179] as demonstrated in Figure 15.
The terminal solid solubility of Si in Bi is considered negligible [50,124]. The crystallographic data of the end-members of the Bi-Si system are given in Table 2.
Diffusion of Bi in silicon was investigated by several authors [179,180,181]. Fuller and Ditzenberger [179] expressed the diffusivity of bismuth in the 1220–1380 °C temperature range as with an estimated error of about ±40%. This large error value was attributed to the concentration measurements at the junction depth due to the possibility of a Kirkendall effect [182], which would shift the reference diffusion interface. Ghoshtagore [180] concluded that bismuth diffusion in silicon obeys the point-defect mechanism. He measured the diffusivity of Bi in the 1190–1394 °C temperature range and expressed the diffusion equation as . Ishikawa et al. [181] could describe the diffusivity of Bi in Si, in the 1050–1200 °C temperature range, as . The temperature dependent diffusion coefficient of Bi in Si from different sources are plotted in Figure 16.
The measured diffusion coefficients were found to vary within one order of magnitude in the overlapped temperature range. It is interesting to note that if these measurements are extrapolated, measurements of [179] appear to be consistent with [181] at high temperature (~1650 K) and with [180] at low temperature (~1460 K). The slopes of the three curves, representing the activation energy of bismuth, show reasonable agreement with each other. However, the activation energy of bismuth was found much smaller than that of P, As and B, although they show similar diffusion coefficient values. This was attributed to the Bi atom-vacancy pairing mechanism [181].
Recently, the Bi-Si binary phase diagram was calculated by Kaban et al. [183] using the parameters of liquid phase from the work of Olesinski and Abbaschian [50] given in Table 9. The enthalpy of mixing and activity of liquid silicon and bismuth are presented in Figure 17a,b, respectively. In Figure 17a, three enthalpy of mixing curves [50,120,124] are presented. Olesinski and Abbaschian [50] accepted the thermodynamic parameters of Thurmond [120] in their calculations. Differences in the enthalpy of mixing values are due to the use of different thermodynamic parameters for the liquid phase by [50,120] as shown in Table 9. Nevertheless, the calculated enthalpy of mixing of the Bi-Si liquid [50] is in good agreement with that of [124] at 2600 °C. The Bi and Si activities in the liquid phase are presented in Figure 17b based on the work of [67] at 1414 °C, which are identical to that of [124] at the same temperature. Additionally, the Bi and Si activities in the liquid phase were calculated at 2600 °C [124] to verify the findings in Figure 17a. The positive enthalpy implies that the mixing is endothermic and the attractive interaction between molecules of different species are weaker than those between molecules of the same species. This strong interaction between the pairs of similar atoms is reflective of the presence of immiscibility in the liquid phase. The shape of activity plot indicates the presence of a two-phase field at 1414 °C, which is liquid #1 and liquid #2 as inferred from the Bi-Si phase diagram in Figure 14.
5.5. The Ga-Si System
Gallium, as a p-type dopant in silicon, is attaining great interest for the PV industry, because silicon thin films can be grown in Ga melts by liquid phase epitaxy [85,184]. The Ga-Si binary phase diagram, shown in Figure 18, was redrawn after Franke and Neuscütz [185], who accepted the phase diagram data reported by Olesinski et al. [51]. The system is described as a simple eutectic that occurs at 99.994 at % Ga and 29.7 °C [185]. The solid solubility of gallium in silicon shows typical retrograde behavior, as demonstrated in Figure 19, and was estimated as ~0.08 at % at around 1200 °C [51]. The solubility of silicon in gallium is negligible, because the liquid phase almost degenerate on the Ga terminal side. The crystallographic data of the end members of the Ga-Si system are given in Table 2. The liquid phase was experimentally investigated through thermal analysis [186], and thermal analysis and metallography [187]. The liquid solubilities were determined by a weighing technique in the 300–800 °C temperature range [178,188]. The liquidus of Ga-Si phase diagram [185] shows a reasonable agreement with the experimental data of [178,186,188]. However, Savitskiy et al. [187] reported lower values due to impurities in the starting elements. It is worth mentioning that the retrograde solubility of Ga in Si is an indication of a large entropy of the Si-Ga solid solution with temperature [189].
Gallium was used at the beginning of the semiconductor industry for making alloy junctions, because of its high diffusion coefficient and low eutectic temperature [90]. However, the use of gallium is limited, because of its high diffusivity in SiO2, which is commonly used for layer masking [190]. The diffusion of gallium in silicon was first investigated by Fuller and Ditzenberger [179] who described the diffusion coefficient of gallium in the 1105–1360 °C temperature range as . In agreement with Fuller and Ditzenberger [179], Pichler [90] derived the diffusivity of gallium under intrinsic and inert conditions in silicon from several studies [179,191,192,193,194] as , in the 800–1380 °C temperature range.
Enthalpy of mixing of the liquid Ga-Si binary alloys were measured at 1487 ± 5 °C by Kanibolotsky et al. [195], using high-temperature isoperibolic calorimetry, up to 0.6% Ga. The enthalpy of mixing for the melt of these alloys was found positive, as shown in Figure 20a, which is an indication of an endothermic mixing. In a recent investigation, Sudavtsova et al. [196] reported mixing enthalpies of the Ga-Si melt in the full composition range, using isoperibolic calorimetry at 1477 °C, and their results were in good agreement with those of Kanibolotsky et al. [195]. Thus, the enthalpies of mixing determined by [195,196] using calorimetric measurements are recommended in this work as they are more reliable. The activities of gallium and silicon in the melts at 1477 °C are given in Figure 20b. Sudavtsova et al. [196] calculated the Si activity from the coordination of the liquidus line using Schröder’s equation, while the Ga activity was calculated using the analytical-numerical Gibbs-Duhem integration. The calculated activities of Ga-Si melts by Safarian et al. [67] were based on the work of Sudavtsova et al. [196]. The recently assessed activities of Ga and Si in the melts [185] deviate from the calculations of [67,196] and show nearly ideal behavior. This deviation could be due to that Sudavtsova et al. [196] treated the Ga-Si melt as quasi-regular solutions. Moreover, they correlated the positive deviation from ideality to the absence of compounds and/or solid solutions in the system and to the degenerate eutectic in the Ga-rich side. The optimized model parameters for the liquid phase, listed in Table 10, were adopted by Franke and Neuscütz [185] based on the work of Olesinski et al. [51].
5.6. The In-Si System
Indium is a p-type impurity in silicon from group IIIA of the periodic table. Indium has been used for the fabrication of infrared detectors, because of its high ionization energy [90]. The binary In-Si phase diagram was assessed by Olesinski et al. [52] using the experimental data of the liquid phase from [120,178,186,188] and the solubility data of In in Si from [198,199]. The In-Si binary phase diagram shown in Figure 21 was calculated using FTlite thermodynamic database [124]. The calculated phase diagram [124] is consistent with the assessment of Olesinski et al. [52]. The system shows a flat liquidus, which indicates the existence of a metastable miscibility gap in the liquid. A eutectic transformation, occurs at 4 × 10⁻³ at % Si and very close to the melting temperature of In. The crystallographic data of the end members of the In-Si system are listed in Table 2. The intrinsic diffusivity of indium in silicon as function of temperature, from experimental measurements of [179,200,201,202], was derived by Pichler [90] to be as follows: .
Different maximum solid solubility values of indium in silicon were reported by Backenstoss [198] as 8 × 10⁻⁴ at % using neutron activation analysis and by Jones et al. [199] as 5 × 10⁻³ at % at 1330 °C using a gradient transport solution growth process. Pichler [90] provided values for the solid solubility of indium in silicon from resistivity combined with Hall-effect measurements [200,201,202,203,204,205,206] or capacitance-voltage profiling [207] at different concentrations and temperatures. Later, the solid solubility of In in Si was calculated by Yoshikawa et al. [208], considering the results from the work of Scott and Hager [204], as shown in Figure 22. In their calculations [208], the liquidus was presented as a dashed line due to the lack of experimental data [204] at high temperatures. The maximum values of indium solubility in silicon, reported by Scott and Hager [204], was only up to 1300 °C, because of the furnace limitations and problems in quartz ampoules. This explains why the shape of In solubility curve did not decrease to zero at the Si melting temperature (i.e., retrograde solubility) as typically observed in other systems, such as Al-Si, As-Si, Ga-Si and Sb-Si. Later, Cerofolini et al. [200], using resistivity and Hall measurements, reported lower indium solubility in silicon due to the high diffusivity of In atoms in Si lattice, which allows the existence of a metastable state, observed by Cerofolini et al. [209], in the In-Si system. The solubility limits of indium in silicon [200] were measured using ion implantation followed by thermal annealing. Although this technique is operated at low temperatures, which means that doping can be performed without influencing previously diffused regions and produce uniform In-doped layers, the solvus line is considered inaccurate. This conclusion was drawn from Figure 22. The experimental data point at 1200 °C [200] indicate that the solubility of In did not start at the Si melting point. On the other hand, Scott and Hager [204] prepared indium-doped-silicon using a gradient-transport solution growth process in the 950 to 1300 °C temperature range and measured the In solubility using Hall measurements. Although this technique promotes structural defects with increasing temperature, the solubility measurements of indium in silicon proves to be accurate for the whole temperature range as can be seen in Figure 22. In agreement with [204], the accepted Si-rich solvus line in the current study is presented by a solid line in Figure 22.
The thermodynamic properties of the In-Si system were reviewed by Frank and Neuschütz [210] based on the work of Olesinski et al. [52] and Tmar et al. [197]. Enthalpy of mixing and activity are given in Figure 23a,b, respectively. The enthalpy of mixing values of In-Si melts found in the literature [52,66,120] support one another and thus are accepted in the current work. The results of Thurmond [121] were not considered in the current evaluation, because they show different enthalpy of mixing values of about 6000 J/mole at mid-composition from other results [52,66,120]. The Si-In liquid solution is endothermic as indicated by the positive enthalpy of mixing and positive deviation of activities from Raoult’s law. The optimized model parameters for the liquid phase [52] are listed in Table 11, which represent the most acceptable data for the In-Si phase diagram.
5.7. The N-Si System
Nitrogen gas is often used as inert atmosphere during post implantation annealing and as a carrier gas in semiconductor diffusion technology [211]. Therefore, the commercial silicon may contain nitrogen in dissolved form if no measures for cleaning are taken [32]. Kaiser and Thurmond [212] found that nitrogen in silicon have donor properties when it reacts with liquid silicon and forms silicon nitride (Si3N4). The thin film silicon nitrides are attractive for applications in microelectronic and optoelectronic devices, because they perform as gate dielectric layers, intermetal insulators, passivation films, diffusion barriers or optical matching layers [213,214]. The N-Si phase diagram, in Figure 24, was developed by Ma et al. [214], using Calphad method at 1 atmosphere, taking into consideration the available data [215,216,217,218,219,220,221,222]. At the same pressure, the system exhibits a eutectic reaction of L → Diamond Si + Si3N4 at around 1413.94 °C and 0.012 at % N as demonstrated in the N-Si partial phase diagram for extremely low N concentrations redrawn after Yatsurugi et al. [32] in Figure 25. Using zone-melting experiments, the maximum solubility of N in Si was found to be 9 × 10⁻⁶ at % at the eutectic temperature [32]. The extremely low solubility of N in Si was attributed to the high stability of Si3N4 besides the large difference in the atomic radii of N and Si [32]. At the same eutectic temperature, Kaiser and Thurmond [212] reported a much lower solubility of N in solid Si as 2 × 10⁻⁹ at % and a higher N concentration of 0.02 at % in liquid Si due to the detectability limit of the measurements.
Despite their low solubility, nitrogen impurities strongly interact with vacancies in Si lattice altering the size and kinetics of the voids causing gate oxide failure [224]. Using dislocation unlocking experiments, Alpass et al. [225] expressed the effective diffusivity of nitrogen in Si in the 500–750 °C temperature range as: . According to Fujita et al. [224], the di-interstitial nitrogen defect was found to be the dominant diffusion mechanism of nitrogen in Si. In this mechanism, two nitrogen interstitial atoms bind into Si lattice due to their rapid diffusion. The defects of this type are known to be stable up to 900 °C [224]. Nevertheless, they do not possess any deep donor or acceptor properties [226].
So far, the Si3N4 [227] is the only confirmed intermetallic compound in the N-Si system [228]. The presence of other silicon nitrides, such as SiN [229,230], Si3N2 [230], Si3N [231] and Si(N3)4 [232], was uncertain and not supported by other studies. The compound Si3N4 exists in three polymorphic forms, α, β and γ phases [233]. Analogous to cubic boron nitride, cubic γSi3N4 with a spinel-type structure exists but only at high pressure (above 15 GPa) and temperature (exceeding 2000 K) [234]. Therefore, it will only be mentioned briefly here and more importance will be given to α and β structures. According to Grün [54], βSi3N4 is the more stable phase at room temperature and αSi3N4 is a metastable phase. The crystallographic data of Si3N4 phases are presented in Table 2 and Table 12. In principle, both α and β silicon nitride phases exist as stoichiometric compositions with Si12N16 for α-phase and Si6N8 for β-phase [235], representing the 28 and 14 atoms in the unit cells, respectively. Whilst αSi3N4 has trigonal symmetry with space group P31c (No. 159) [235] and Pearson symbol hP28 [39], βSi3N4 has hexagonal symmetry with space group P63 (No. 173) [235] and Pearson symbol hP14 [39]. Figure 26 is drawn to describe the crystal structure of the three forms of Si3N4 based on the crystallographic data from Table 2 and site occupancies from [39] in Table 12. It can be depicted from the crystallographic data and the graphic presentation of silicon nitride phases that Si3N4 tetrahedra in the α structure appear as interconnected cavities as opposed to tunnels in β structure parallel to the c-axis of the unit cell. The length of c parameter in αSi3N4 is almost double that of βSi3N4. This is attributed to the occupancy of additional Si2 atoms on 6c sites of the unit cell.
The N-Si phase diagram in Figure 24 shows that Si3N4 has no true melting temperature at atmospheric pressure. It rather decomposes to liquid and N2 gas at 1877 °C [214,221], which is only 23 °C lower than the measurement reported by Forgeng and Decker [223] as 1900 °C. Although, in this work we consider the values reported by [214,221,223] are consistent, the variation between them could be due to the pressure difference between these measurements. For instance, Forgeng and Decker [223] did not specify the pressure in their work; while both [214,221] performed their calculations at the atmospheric pressure. Because of no other compounds in the N-Si system, it is expected that Si3N4 melts congruently at high enough nitrogen pressure as shown in the calculated condensed N-Si phase diagram [214] in Figure 27. The maximum calculated congruent melting temperature of Si3N4 is 5318 °C at about 7.5 × 10⁹ Pa.
Because of the very small solid solubility of N in Si , the Diamond Si terminal solid solution was treated as pure Si in the calculated N-Si phase diagram of Ma et al. [214]. However, the calculated composition of the L → Diamond Si + Si3N4 eutectic is in good agreement with that of Yatsurugi et al. [32] at 0.012 at % N. This consistency indicates that the eutectic composition is not affected by the pressure. Overall, the N-Si phase diagram optimized by Ma et al. [214] is acceptable in this work. The optimized model parameters and enthalpy and entropy of formation of Si3N4 are listed in Table 13 and Table 14, respectively. The Gibbs energy of the gas phase is taken from SGTE substance database [236] and that of the pure elements are from Dinsdale [237]. The enthalpies and entropies of formation for Si3N4 reported by Ma et al. [214] were mainly taken from the work of Pehlke and Elliott [216] and the heat capacity values were from Guzman et al. [217].
5.8. The P-Si System
Silicon-doped-phosphorus is very important for the power semiconductors [90] application. Phosphorus is the fastest diffusing donor impurity in silicon. However, the maximum required limit of phosphorus for solar-grade Si is almost 10−5 at %. At higher concentration, phosphorus introduces lattice strain due to the tetrahedral mismatch ratio between P and Si atoms of about 93%. The misfit lattice strain narrows the band gap, and reduces the (PV)− pair dissociation [26]. This infinitesimally small amount makes phosphorus refining process during recycling very difficult, because phosphorus has a relatively large segregation coefficient, Ko, in silicon of about 0.35 [238,239].
Diffusivity of phosphorus in silicon has been measured using several experimental and analytical techniques as reviewed by Christensen [240]. The intrinsic diffusivity of phosphorus in silicon was expressed, by Fair [137], as: Di = 3.85 × e(−3.66 eV/kT) cm2/s. Later, Van-Hung et al. [158] calculated the diffusion coefficients of phosphorus in silicon by interstitial and vacancy mechanisms using statistical moment method. They concluded, by comparing their own results with the available data [26,159,163], that the dominant diffusion mechanism of P in Si is the interstitial mechanism, similar to boron.
The phase diagram and thermodynamic properties of the P-Si system are still under investigation, because of the difficult experimental requirements due to the presence of liquid-vapor phase boundaries [55]. First version of the P-Si binary phase diagram was revealed by Giessen and Vogel [241]. According to these authors, the eutectic temperature and the liquidus were determined using thermal analysis in the 0 to 28.0 at % P composition range. No or very limited solubility of P in the Si terminal side was assumed and a stoichiometric intermetallic compound of SiP was proposed based on the lever rule calculations [241]. Additionally, they attempted to measure the equilibrium gas composition by quenching alloys from liquid-vapor region using the knowledge of the starting composition, liquid composition and mass change in P-Si alloys. Olesinski et al. [242] reproduced the P-Si phase diagram at ambient pressure based on the liquidus and eutectic data from Giessen and Vogel [241] and the solubility of P in Si from Kooi [243] data, as their solubility limits [243] were found more convincing by [242]. Whereas, the solubility of Si in P is considered negligible [242]. The solubility of P in the Si terminal side was investigated by many authors [118,243,244,245,246,247,248,249,250,251,252,253,254,255] but the reported data show large discrepancies among each other due to sample oxidation, the presence of impurities, or other experimental difficulties. According to Trumbore [118], the solid solubility of phosphorus in silicon shows a retrograde behavior with a maximum value of about 2.50 at % P at 1180 °C, which is close to 2.4 at % obtained by Kooi [243], who studied the diffusion behavior of P in Si in the 920 to 1310 °C temperature range using a neutron activation analysis. Abrikosov et al. [244] used the microhardness measurements to determine the solubility of P in Si with a maximum of about 1.0 at % at 900 °C. On the other hand, lower concentrations were obtained by Uda and Kamoshida [245] and Tamura [249] at 1100 °C as about 0.3 at % and 0.6 at % P, respectively, upon measuring the P concentration in the ion-implanted and annealed Si crystals. Solmi et al. [246] used secondary neutral mass spectrometry measurements to determine the solubility of P in Si from 800 to 1000 °C. Nobili et al. [253] used Hall effect and resistivity measurement to determine the solubility of P in an ion-implanted Si specimens. The high values reported by [118,243] were not reliable as Nobili et al. [253] pointed out. The problem in Trumbore’s [118] data was due to using unjustified error function when the surface concentration was calculated. Moreover, the data given by Kooi [243] were related to O-P-Si ternary and not for P-Si system, due to the presence of an oxide film on the substrate. Although these data were criticized by Nobili et al. [253], they were used by Olesinski et al. [242] and Jung and Zhang [256] for P-Si system evaluation and optimization. Safarian and Tangstad [255] reinvestigated the liquidus and solidus of the Si-rich side of the P-Si phase diagram, up to 5.47 at % P, using thermogravimetric and differential thermal analysis (TG/DTA) experiments. According to these authors, the solubility of P in Si shows a retrograde behavior with 0.06 at % P at the eutectic temperature 1129 ± 2 °C and 0.09 distribution coefficient of P in Si. Furthermore, they [255] estimated the solubility line below eutectic based on the data of Borisenko and Yudin [254], because they [255] considered the high P solubility values as coexisting P in SiP precipitates. More recently, Liang and Schmid-Fetzer [257] in their optimized P-Si phase diagram classified the experimental solubility data into lower and higher solid solubilities near the eutectic temperature and thus used two different sets of thermodynamic parameters for the diamond-Si phase optimization. Figure 28 compares different sets of experimental and calculated data in the Si-rich side of the P-Si binary phase diagram.
Thus far, the available experimental and calculated solubility limits data of P in Si are scattered and difficult to use to draw a common diamond-Si phase boundary. However, the experimental points provided by Safarian and Tangstad [255] are more convincing for the following reasons. The purity of the starting materials was 99.9999 wt % Si and 99.999 wt % P. Furthermore, authors used precise characterization techniques, such as wavelength dispersive spectroscopy (WDS) over many points for each measurement to determine the composition of the alloys and TG-DTA to determine the liquidus and solidus phase boundaries in the Si-rich side. The DTA results gave logical linear liquidus and solidus relationships below 5.5 at % P if the limiting slope theory is considered.
Only one intermetallic compound, SiP, exists in the P-Si system at ambient pressure as presented by Olesinski et al. [242]. However, Liang and Schmid-Fetzer [257] reported two intermetallic compounds, SiP2 and SiP, in their calculated phase diagram at 0.5, 1, and 200 bar. The compound Si2P was only reported by Fritz and Berkenhoff [258], using X-ray and infra-red (IR) spectra, to form at 450 °C and decompose into Si and SiP at 600 °C. Due to the limited information, the compound Si2P was not included in different versions [55,242,256,257] of the P-Si phase diagram. SiP single crystal was obtained by Beck and Stickler [40], who determined the structure of SiP as orthorhombic using X-ray diffraction (XRD) and transition electron microscopy (TEM). The crystal structure of SiP in Table 2 was reported based on Wadsten [259] investigations. The SiP2 phase was first reported by Wadsten [42], who investigated the phosphide alloys using XRD. Later, SpringThorpe [260] confirmed the existence of SiP2 by synthesizing a large crystal of orthorhombic structure using vapor transport technique [261]. The SiP2 crystal developed by SpringThorpe [260] was twice longer in b-direction (b = 2.006 nm) as that proposed by Wadsten [42] (b = 1.008 nm). It could be that the measurements of [42] and [260] were performed on a deformed crystal. In the current study, the accepted crystal structure of SiP2 was based on the work of Wadsten [42], since it was used and republished by [39]. A new silicon phosphide Si12P5, with rhombohedral symmetry and C5W12 structure, was reported by Carlsson et al. [262]. The phase Si12P5 was found to form in an amorphous P-Si alloy thin film after annealing at 1000 °C for 30 min and dissociates at above 1050 °C. Hence, only two intermetallic compounds, SiP and SiP2, are accepted in the current work for the equilibrium phase diagram of the P-Si system, because their formation, structure and properties have been well described and confirmed in the literature [40,42,259,260].
The vapor composition and thermodynamic properties of the P-Si melt, containing 0.09–26.5 at % P, were investigated by Zaitsev et al. [263] in the 1234–1558 °C temperature range. The chosen range covers almost the liquid phase field. The Gibbs energies of phase transitions of phosphorus and silicon were taken from [264,265]. The calculated phosphorus activities were in good agreement with their [263] own experiments. However, Zaitsev et al. [263] calculated the equilibrium of liquid, solid silicon and vapor phases at 1166 °C, which was higher than that reported by Giessen and Vogel [241] as 1131 °C. The variation could be due to the difficulty in differentiating between the eutectic and primary solidification in this system. Franke and Neuschütz [55] presented a calculated P-Si phase diagram based on the literature data [114,115,239,241,242,263]. Similar version was obtained using FTlite thermodynamic database in FactSage® software [124]. According to [55], the terminal solid solution in the Si-rich side was represented as a typical solid solution, with maximum solubility at the eutectic line, and not as a retrograde solution. Jung and Zhang [256] reassessed the P-Si phase diagram using the modified quasi-chemical model [266] for the liquid phase and compound energy formalism [267] for Si-rich phase assuming P substitutes Si. According to these authors, the thermodynamic properties of SiP were re-optimized using low-temperature heat capacity of Ugai et al. [268] and the modified high-temperature heat capacity parameter of Knacke et al. [269]. Whereas, the thermodynamic properties of SiP2 were based on the heat capacity measurements of Philipp and Schmidt [270]. The evaporation and gas composition data [241] were not taken into account in the thermodynamic modeling of Jung and Zhang [256], because they [256] could not reproduce the experimental results.
Recently, Liang and Schmid-Fetzer [257] remodeled the P-Si phase diagram considering no short-range-ordering in the liquid phase. In their work, the liquid phase and Si-rich terminal solution were described using the substitutional solution model, SiP and SiP2 were treated as stoichiometric compounds and the gas phase was described as an ideal gas mixture. Furthermore, new set of thermodynamic parameters were provided [257], because they discovered some errors in the published parameters by Jung and Zhang [256]. The optimized P-Si phase diagram at 200 bar [257] along with the experimental data [255,268] is shown in Figure 29. The optimized model parameters of the P-Si phase diagram are listed in Table 15.
In agreement with [256], the corresponding gas composition points [241] were not used by Liang and Schmid-Fetzer [257] in their optimization, because the data were considered inaccurate. At 200 bar, both SiP and SiP2 compounds melt congruently at 1161 °C and 1169 °C, respectively, which are slightly below the experimental data [268] as shown in Figure 29. In this work, modified phase boundaries are based on the experimental data of Ugai et al. [268], who measured the congruent melting of SiP and SiP2 to be 1170 °C and 1178 °C, respectively, and the SiP + SiP2 eutectic at 1125 °C. The enthalpy and entropy of formation of the P-Si compounds are given in Table 16. It is worth noting that the enthalpy and entropy of formation of SiP, used in the calculations of Liang and Schmid-Fetzer [257], were similar to those given by [256]. Whereas, the thermodynamic parameters of SiP2 were slightly modified by [257] to fit with the experimental congruent melting point as given by Ugai et al. [268].
Very limited experimental data on the activity of P-Si in the melts could be found in the literature. Zaitsev et al. [263] investigated the activity of the P-Si melts in the 0.09 < P < 26.5 at % composition range at different temperatures, ranging between 1423 and 1558 °C, using Knudsen effusion mass spectrometry [273]. However, both [256,257] considered the activity data of Zaitsev et al. [263] not reliable, because it predicts (Si-rich solid + Gas) two phase field in the 1125 to 1220 °C temperature range, which is not the case as could be proven by Safarian and Tangstad [255] using DTA measurements. The authors [256,257] gave higher weight to the experimental results of Miki et al. [239] in the thermodynamic modeling of P-Si system. The enthalpy of mixing of the P-Si liquid at 1427 °C [55] is shown in Figure 30a. The experimental results of activity measurements of P and Si in the P-Si liquid at 1427 °C [263] are given in Figure 30b. The activity calculations of Franke and Neuschütz [55] are consistent with these experimental results, therefore Franke and Neuschütz’ curves are adopted in this work.
5.9. The Sb-Si System
Antimony-silicon system seems to have no particular technological importance in its own right. However, understanding its thermodynamic properties is essential to model possible interactions between Si and Sb in electronic applications, such as in soldering processes [56]. The Sb-Si phase diagram was critically assessed by Olesinski and Abbaschian [274] based on the experimental results of [118,120,177,178,275,276]. Several authors calculated the Sb-Si phase diagram [101,120,274,277]. Wang et al. [277] reassessed the Sb-Si system, shown in Figure 31, to achieve compatibility among the binaries in the Au-Sb-Si system, using data from Dinsdale [237] for the pure elements and substitutional solution model to describe the liquid and solid solution phases. The optimized model parameters are listed in Table 17. The calculated liquid phase boundaries show very good agreement with most of the experimental data. Wang et al. [277] presented a modified Si-rich solvus line, different than that in [274], based on the experimental results of Nobili et al. [278]. The magnified part of the calculated Sb-Si phase diagram [277], near Si-rich side, associated with the experimental points is shown in Figure 32. Nobili et al. [278] measured the solid solubility of antimony in silicon by carrier density measurements on poly silicon films doped by ion implantation in the 850–1300 °C temperature range. Their measurements [278] proved to be accurate determination of the solubility values in this system. Therefore, the solvus line calculated by Wang et al. [277] is considered more accurate presentation of the Sb solubility in Si.
The calculated Sb-Si phase diagram [277] exhibits a eutectic transformation at 0.3 at % Si and 630 °C. The solid solution of Si in Sb is considered negligible. The solid solubility of antimony in silicon showed retrograde behavior with a maximum of about 0.1 at % Sb at 1300 °C. The shape of the liquidus line indicates a likelihood of metastable miscibility gap with positive enthalpy of mixing [56] as could be seen in Figure 33a. The crystallographic data of the end-members of the Sb-Si system are listed in Table 2.
Antimony has a low diffusivity in silicon, compared to arsenic, for example, and it is known to diffuse via a vacancy mechanism. The diffusivity data of antimony in silicon was reviewed by Pichler [90] who expressed the intrinsic diffusivity of antimony by the equation: .
Experimental thermodynamic properties of the Sb-Si system could not be found in the literature. The calculated thermodynamic properties, enthalpy of mixing and activity at 1477 °C, using different models are shown in Figure 33a,b, respectively. Thurmond [121] used the regular solution model and calculated the molar enthalpy of mixing based on the data of Williams [177]. However, the measured values by Williams [177] are considered not accurate, because low purity silicon was used. Olesinski and Abbaschian [274] modified the thermodynamic model parameters of [120,121] in order to be consistent with the experimental phase diagram data [118,120,177,178,275,276]. The liquid phase parameters were modified by Safarian et al. [66] in an attempt to keep the eutectic temperature and composition as that given by Olesinski and Abbaschian [274] at 629.7 °C and 0.3 at % Si. Yet, their calculated values were closer to those of [120]. The available activities of antimony and silicon [56,67], in Figure 33b, are inconsistent but show positive deviation from Raoult’s law, which is expected for such flat liquidus. Thus, experimental investigations of the enthalpy of mixing and activities are required to verify these thermodynamic properties.
5.10. The Tl-Si System
According to Zhao et al. [279], thallium could be the most suitable impurity atom in crystalline Si solar sell industry, because it provides deep level of impurity photovoltaic effect, which improves the solar cell efficiency. Silicon and thallium are virtually immiscible. The liquid miscibility gap in the Si-Tl system was described by Savitskiy et al. [187] and Thurmond and Kowalchik [120], with some variations. Savitskiy et al. [187] reported the monotectic transformation temperature at 1414 °C, while it was reported by Thurmond and Kowalchik [120] to be 1387 °C. Olesinski and Abbaschian [57] have constructed a tentative Si-Tl phase diagram, shown in Figure 34, based on the thermal analysis of Tamaru [280] and Savitskiy et al. [187]. Later on, the Si-Tl phase diagram assessed by Olesinski and Abbaschian [57] was accepted by Predel [281]. The Si-Tl phase diagram shows a eutectic transformation near the melting point of thallium and a monotectic transformation near the melting point of silicon. The solubilities of both silicon and thallium are very infinitesimal [282]. However, Schmit and Scott [282] developed a novel method, including adding of a second metal (tin) to thallium, to grow silicon-doped semiconductor for 3–5 μm infrared radiation detector, which can operate above 77 K.
The diffusion of thallium in silicon was reviewed by Hull [138], who described the diffusivity of thallium in the 1105–1360 °C temperature range by the equation D = 16.5 × e(−3.896 eV/kT) cm2/s, based on the work of Fuller and Ditzenberger [179]. However, Ghoshtagore [283] expressed the diffusion coefficient of thallium in silicon in the 1244–1338 °C temperature range as D = 1.37 × e(−3.896 eV/kT) cm2/s. The difference in these two sets of results could be due to oxidation/reduction reactions on the Si surface.
Very limited thermochemical data of the Si-Tl system could be found in the literature. Thurmond and Kowalchik [120] attempted to describe the Si-Tl liquid in terms of regular solution model. However, Olesinski and Abbaschian [57] considered the calculations of [120] speculative and inaccurate without providing enough justification. The enthalpy of mixing curve is shown in Figure 35 [120]. The positive enthalpy of mixing indicates the existence of a miscibility gap in the Si-Tl system, which agrees with the Si-Tl phase diagram shown in Figure 34. The model parameters of the liquid phase reported by [120] are listed in Table 18.
6. Discussion
It is concluded from the analyzed data in this paper that the melts of Si with Al, As, B and P (IIIA group) are exothermic and their activities deviate negatively from Raoult’s ideal solution, whereas the melts of Si with Bi, Ga, In, Sb and Tl (VA group) are endothermic in behavior and deviate positively from Raoult’s law. Furthermore, it can be said that the atoms of the VA group do not prefer to form homogenous mixtures with silicon upon melting. Positive enthalpy of mixing in this case is due to the de-mixing effect, by which Si and VA group atoms in Si-VA group mixtures favor to form bonds between similar atoms. This was observed in systems where the liquid curve tends to be flat indicating a metastable miscibility gap or when the liquid miscibility gap is stable.
In agreement with [105], Figure 36 shows a graphical summary of best representation of solid solubility of Al, As, B, Bi, Ga, In, N, P and Sb impurity atoms in silicon. No data regarding the solubility of thallium in silicon could be found in the literature. Boron, arsenic and phosphorus exhibit highest solid solubility in silicon than other impurity atoms included in this study, although they occupy substitutional positions in silicon lattice [26]. Here, the distribution coefficient, Ko in Table 1, is chosen to compare the relative tendencies of various impurities to dissolve in solid silicon. B, As and P possess higher distribution coefficient values compared to other impurity atoms. Furthermore, Burton et al. [284] suggested a rough correlation between the distribution coefficient of an impurity atom and its tetrahedral radius at the melting point of silicon as demonstrated in Figure 37. The trend goes toward higher solubility as the radius of impurity atom decreases.
The temperature-dependent diffusion coefficients of the studied doping elements in silicon are plotted in Figure 38. This plot is useful for comparing relative diffusivities of several impurities. The parameters used in calculating these coefficients, listed in the embedded table, were taken from the literature [26,138,180]. The inset shows the low nitrogen diffusivity in the 500–750 °C temperature range. The diffusivity of co-diffusing atoms is greatly influenced by the size mismatch between silicon and the diffusing species [26]. The presence of size mismatch, irrespective to its value, leads to lattice strain, which may influence the diffusivity of the impurity atom [26]. Table 19 presents the relative atomic size of studied elements to silicon. It is concluded that Al is the fastest diffusing acceptor impurity in Si followed by Ga. Moreover, the fastest diffusing donor impurity in Si is P.
7. Summary
The success of producing or refining Si materials to high purity levels depends heavily on the availability and reliability of phase diagram, thermodynamic and diffusion data that serve as important tools in evaluating the effect of impurities on the phase equilibria in solar and electronic Si systems. In this work, ten Si-based binary phase diagrams, including Si with group IIIA elements (B, Al, Ga, In and Tl) and with group VA elements (N, P, As, Sb and Bi), have been reviewed. Each of these systems has been critically discussed in both aspects of phase diagram and thermodynamic properties. The available experimental data and thermodynamic parameters in the literature have been summarized and assessed thoroughly to provide comprehensive understanding of each system. Some systems were re-calculated to obtain the best evaluated phase diagram. As doping levels of solar and electronic silicon are of high technological importance, diffusion data have also been presented to serve as useful references on the properties, behavior and quantities of metal impurities in silicon. This paper is meant to bridge the understanding of phase diagrams with the information needed by the industry and research for development of solar-grade and electronic silicon, relying on the available information in the literature as well as our own analysis.
Acknowledgments
Authors would like to thank Kayode Orilomoye and Benjamin Wallace from TMG group of Concordia University for their help in providing some of the necessary references. Raiyan Seede from Masdar Institute is also acknowledged for improving the English language of the paper.
Conflicts of Interest
The authors declare no conflict of interest.
Abbreviations
| Al | Aluminum |
| As | Arsenic |
| a-Si | Amorphous silicon |
| B | Boron |
| Bi | Bismuth |
| Calphad | Calculations of phase diagram |
| CdTe | Cadmium telluride |
| CIGS | Copper indium gallium diselenide |
| Cm | Maximum solid solubility |
| CO2 | Carbon dioxide |
| c-Si | Crystalline silicon |
| Csat | Saturation concentration |
| Cu(In,Ga)Se2 | Copper indium gallium diselenide |
| D | Diffusivity |
| D0 | Temperature-independent pre-exponential factor |
| Deff | Effective diffusivity |
| Dex | Extrinsic diffusivity |
| Di | Intrinsic diffusivity |
| DSSC | Dye-sensitized solar cells |
| DTA | Differential thermal analysis |
| EPMA | Electron probe microanalyzer |
| Ga | Gallium |
| GHSER | Gibbs free energy values at reference state (1 atm and 298.15 K) for a pure element |
| ICP | Inductively coupled plasma |
| In | Indium |
| IR | Infra-red |
| k | Boltzmann constant |
| Ko | Distribution coefficient |
| N | Nitrogen |
| P | Phosphorus |
| P | Pressure |
| ppb | Particle per billion |
| PV | Photovoltaic |
| Qd | Activation energy |
| R | Universal gas constant |
| Sb | Antimony |
| Si | Silicon |
| Si:As | Arsenic-doped-silicon |
| Si:Bi | Bismuth-doped-silicon |
| Si:P | Phosphorus-doped-silicon |
| T | Absolute temperature |
| TEM | Transition electron microscopy |
| TFSC | Thin film solar cells |
| TG | Thermogravimetric |
| TGMZ | True gradient melting zone |
| Tl | Thallium |
| WDS | Wavelength dispersive spectroscopy |
| Xm | Maximum molar solid solubility |
| XRD | X-ray diffraction |
References
- Luque, A.; Hegedus, S. Handbook of Photovoltaic Science and Engineering, 2nd ed.; Luque, A., Hegedus, S., Eds.; John Wiley & Sons: Chichester, UK, 2010. [Google Scholar]
- Anwar, S.; Efstathiadis, H.; Qazi, S. Handbook of Research on Solar Energy Systems and Technologies; Engineering Science Reference (IGI Global): Hershey, PA, USA, 2013. [Google Scholar]
- Singh, V.K.; Giribabu, L. Photovoltaic—A Review of the Solar Cell Generation. J. Innov. Electron. Commun. 2013, 3, 44–53. [Google Scholar]
- Sovacool, B.K. The Costs of Failure: A Preliminary Assessment of Major Energy Accidents, 1907–2007. Energy Policy 2008, 36, 1802–1820. [Google Scholar] [CrossRef]
- Hollangel, E.; Fujita, Y. The Fukushima Disaster—Systemic Failures as the Lack of Resilience. Nucl. Eng. Technol. 2013, 45, 13–20. [Google Scholar] [CrossRef]
- Parida, B.; Iniyan, S.; Goic, R. A Review of Solar Photovoltaic Technologies. Renew. Sustain. Energy Rev. 2011, 15, 1625–1636. [Google Scholar] [CrossRef]
- Becquerel, A.E. Mémoire Sur Les Effets Électriques Produits Sous L’influence Des Rayons Solaires. Ann. Phys. Chem. 1841, 54, 35–42. [Google Scholar] [CrossRef]
- Becquerel, A.E. Recherches Sur Les Effets de La Radiation Chimique de La Lumiere Solaire Au Moyen Des Courants Electriques. CR Acad. Sci. 1839, 9, 145–149. [Google Scholar]
- Badawy, W.A. A Review on Solar Cells from Si-Single Crystals to Porous Materials and Quantum Dots. J. Adv. Res. 2015, 6, 123–132. [Google Scholar] [CrossRef] [PubMed]
- Chopra, K.L.; Paulson, P.D.; Dutta, V. Thin-Film Solar Cells: An Overview. Prog. Photovolt. Res. Appl. 2004, 12, 69–92. [Google Scholar] [CrossRef]
- Green, M.A. Thin-Film Solar Cells: Review of Materials, Technologies and Commercial Status. J. Mater. Sci. Mater. Electron. 2007, 18, 15–19. [Google Scholar] [CrossRef]
- Kerr, M.J.; Cuevas, A.; Campbell, P. Limiting Efficiency of Crystalline Silicon Solar Cells due to Coulomb-Enhanced Auger Recombination. Prog. Photovolt. Res. Appl. 2003, 11, 97–104. [Google Scholar] [CrossRef]
- Tsuo, Y.S.; Wang, T.H.; Ciszek, T.F. Crystalline-Silicon Solar Cells for the 21st Century. National Renewable Energy Laboratory: Seattle, WA, USA, 1999. [Google Scholar]
- Green, M.A. Limiting Efficiency of Bulk and Thin-Film Silicon Solar Cells in the Presence of Surface Recombination. Prog. Photovolt. Res. Appl. 1999, 7, 327–330. [Google Scholar] [CrossRef]
- Aberle, A.G. Surface Passivation of Crystalline Silicon Solar Cells: A Review. Prog. Photovolt. Res. Appl. 2000, 8, 473–487. [Google Scholar] [CrossRef]
- Tiedje, T.; Yablonovitch, E.; Cody, G.D.; Brooks, B.G. Limiting Efficiency of Silicon Solar Cells. IEEE Trans. Electron. Devices 1984, 31, 711–716. [Google Scholar] [CrossRef]
- Chroneos, A.; Sgourou, E.N.; Londos, C.A.; Schwingenschlögl, U. Oxygen Defect Processes in Silicon and Silicon Germanium. Appl. Phys. Rev. 2015, 2, 21306. [Google Scholar] [CrossRef]
- Sgourou, E.N.; Timerkaeva, D.; Londos, C.A.; Aliprantis, D.; Chroneos, A.; Caliste, D.; Pochet, P. Impact of Isovalent Doping on the Trapping of Vacancy and Interstitial Related Defects in Si. J. Appl. Phys. 2013, 113, 113506. [Google Scholar] [CrossRef]
- Wang, H.; Chroneos, A.; Londos, C.A.; Sgourou, E.N.; Schwingenschlögl, U. A-Centers in Silicon Studied with Hybrid Density Functional Theory. Appl. Phys. Lett. 2013, 103, 52101. [Google Scholar] [CrossRef]
- Van der Zwaan, B.; Rabl, A. Prospects for PV: A Learning Curve Analysis. Sol. Energy 2003, 74, 19–31. [Google Scholar] [CrossRef]
- Jia, G. Characterization of Electrical and Optical Properties of Silicon Based Materials; Fakultät für Mathematik; Naturwissenschaften und Informatik: Cottbus, Germany, 2010. [Google Scholar]
- Graff, K. Metal Impurities in Silicon-Device Fabrication; Springer: Berlin/Heidelberg, Germany, 1995. [Google Scholar]
- Coletti, G. Impurities in Silicon and Their Impact on Solar Cell Performance; Utrecht University: Utrecht, The Netherlands, 2011. [Google Scholar]
- Fahey, P.M.; Griffin, P.B.; Plummer, J.D. Point Defects and Dopant Diffusion in Silicon. Rev. Mod. Phys. 1989, 61, 289–384. [Google Scholar] [CrossRef]
- Taylor, W.; Gosele, U.; Tan, T.Y. Present Understanding of Point Defect Parameters and Diffusion in Silicon: An Overview. In Proceedings of the Third International Symposium on Process Physics and Modeling in Semiconductor Technology, Pennington, NJ, USA, 19–21 May 1993; pp. 3–19. [Google Scholar]
- Scotten, W.J. Diffusion in Silicon; IC Knowledge: Georgetown, USA, 2000. [Google Scholar]
- Tang, K.; Øvrelid, E.J.; Tranell, G.; Tangstad, M. A Thermochemical Database for the Solar Cell Silicon Materials. Mater. Trans. 2009, 50, 1978–1984. [Google Scholar] [CrossRef]
- O’Mara, W.; Herring, R.B.; Hunt, L.P. Handbook of Semiconductor Silicon Technology; Noyes Publications: Park Ridge, IL, USA, 2007. [Google Scholar]
- Gudmundsen, R.A.; Maserjian, J. Semiconductor Properties of Recrystallized Silicon in Aluminum Alloy Junction Diodes. J. Appl. Phys. 1957, 28, 1308. [Google Scholar] [CrossRef]
- Mckelvey, A.L. Retrograde Solubility in Semiconductors. Metall. Mater. Trans. A 1996, 27, 2704–2707. [Google Scholar] [CrossRef]
- Khan, M.I.; Mostafa, A.O.; Aljarrah, M.; Essadiqi, E.; Medraj, M. Influence of Cooling Rate on Microsegregation Behavior of Magnesium Alloys. J. Mater. 2014, 2014, 657647. [Google Scholar] [CrossRef]
- Yatsurugi, Y.; Akiyama, N.; Endo, Y.; Nozaki, T. Concentration, Solubility, and Equilibrium Distribution Coefficient of Nitrogen and Oxygen in Semiconductor Silicon. J. Electrochem. Soc. 1973, 120, 975. [Google Scholar] [CrossRef]
- Hall, R.N.; Soltys, T.J. High Purity Germanium for Detector Fabrication. IEEE Trans. Nucl. Sci. 1971, 18, 160–165. [Google Scholar] [CrossRef]
- Fischler, S. Correlation between Maximum Solid Solubility and Distribution Coefficient for Impurities in Ge and Si. J. Appl. Phys. 1962, 33, 1615. [Google Scholar] [CrossRef]
- Gumaste, J.L.; Mohanty, B.C.; Galgali, R.K.; Syamaprasad, U.; Nayak, B.B.; Singh, S.K.; Jena, P.K. Solvent Refining of Metallurgical Grade Silicon. Sol. Energy Mater. 1987, 16, 289–296. [Google Scholar] [CrossRef]
- Tafaghodikhajavi, L. Thermodynamics of Impurity Removal in Solvent Refining of Silicon; University of Toronto: Toronto, ON, Canada, 2015. [Google Scholar]
- Pizzini, S. Physical Chemistry of Semiconductor Materials and Processes; John Wiley & Sons: West Sussex, UK, 2015. [Google Scholar]
- Predel, B. Al-Si. In Binary Systems. Part 1_Elements and Binary Systems from Ag-Al to Au-Tl; Landolt-Börnstein-Group IV Physical Chemistry; Springer: Berlin/Heidelberg, Germany, 2002; Volume 19B1, pp. 198–200. [Google Scholar]
- Villars, P.; Cenzual, K. Pearson’s Crystal Data—Crystal Structure Database for Inorganic Compounds (on CD-ROM); Release 2009/2010; ASM International: Materials Park, OH, USA, 2009/2010. [Google Scholar]
- Beck, C.G. Crystallography of SiP and SiAs Single Crystals and of SiP Precipitates in Si. J. Appl. Phys. 1966, 37, 4683. [Google Scholar] [CrossRef]
- Han, Q.; Schmid-Fetzer, R. Phase Equilibria in Ternary Ga-As-M Systems (M = W, Re, Si). J. Mater. Sci. Mater. Electron. 1993, 4. [Google Scholar] [CrossRef]
- Wadsten, T.; Vikan, M.; Krohn, C.; Nilsson, Å.; Theorell, H.; Blinc, R.; Paušak, S.; Ehrenberg, L.; Dumanović, J. The Crystal Structures of SiP2, SiAs2, and GeP. Acta Chem. Scand. 1967, 21, 593–594. [Google Scholar] [CrossRef]
- Massalski, T.B.; Okamoto, H.; Subramanian, P.R.; Kacprzak, L. Binary Alloy Phase Diagrams; ASM International: Materials Park, OH, USA, 1990. [Google Scholar]
- Wu, J.; Ma, W.; Tang, D.; Jia, B.; Yang, B.; Liu, D.; Dai, Y. Thermodynamic Description of Si-B Binary System. Procedia Eng. 2012, 31, 297–301. [Google Scholar] [CrossRef]
- Magnusson, B.; Brosset, C. The Crystal Structure of В2.8Si. Acta Chem. Scand. 1962, 16, 449–455. [Google Scholar] [CrossRef]
- Cline, C.F. An Investigation of the Compound Silicon Boride (SiB6]). J. Electrochem. Soc. 1959, 106, 322. [Google Scholar] [CrossRef]
- Giese, R.F.; Matkovich, V.I.; Economy, J. The Crystal Structure of YB 4. Z. Krist. 1965, 122, 423–432. [Google Scholar] [CrossRef]
- Korniyenko, K. Boron—Carbon—Silicon. In Landolt-Börnstein-Group IV Physical Chemistry 11E1 (Refractory Metal Systems); Springer: Stuttgart, Germany, 2009; pp. 499–534. [Google Scholar]
- Franke, P.; Neuschütz, D. Bi-Si. In Binary Systems. Part 2: Elements and Binary Systems from B—C to Cr—Zr; Springer: Berlin/Heidelberg, Germany, 2004; pp. 1–2. [Google Scholar] [CrossRef]
- Olesinski, R.W.; Abbaschian, G.J. The Bi-Si (Bismuth-Silicon) System. Bull. Alloy Phase Diagr. 1985, 6, 359–361. [Google Scholar] [CrossRef]
- Olesinski, R.W.; Kanani, N.; Abbaschian, G.J. The Ga-Si (Gallium-Silicon) System. Bull. Alloy Phase Diagr. 1985, 6, 362–364. [Google Scholar] [CrossRef]
- Olesinski, R.W.; Kanani, N.; Abbaschian, G.J. The In-Si (Indium-Silicon) System. Bull. Alloy Phase Diagr. 1985, 6, 128–130. [Google Scholar] [CrossRef]
- Kato, K.; Inoue, Z.; Kijima, K.; Kawada, I.; Tanaka, H.; Yamane, T. Structural Approach to the Problem of Oxygen Content in Alpha Silicon Nitride. J. Am. Ceram. Soc. 1975, 58, 90–91. [Google Scholar] [CrossRef]
- Grün, R. The Crystal Structure of β-Si3N4: Structural and Stability Considerations between α- and β-Si3N4. Acta Crystallogr. Sect. B Struct. Crystallogr. Cryst. Chem. 1979, 35, 800–804. [Google Scholar] [CrossRef]
- Franke, P.; Neuschütz, D. P-Si. In Binary Systems. Part 4: Binary Systems from Mn-Mo to Y-Zr; Springer: Berlin/Heidelberg, Germany, 2006; pp. 1–4. [Google Scholar]
- Franke, P.; Neuschütz, D. Sb-Si. In Binary Systems. Part 4: Binary Systems from Mn-Mo to Y-Zr; Springer: Berlin/Heidelberg, Germany, 2006; pp. 1–3. [Google Scholar]
- Olesinski, R.W.; Abbaschian, G.J. The Si-Tl (Silicon-Thallium) System. Bull. Alloy Phase Diagr. 1985, 6, 543–544. [Google Scholar] [CrossRef]
- Murray, J.L.; McAlister, A.J. The Al-Si (Aluminum-Silicon) System. Bull. Alloy Phase Diagr. 1984, 5, 74–84. [Google Scholar] [CrossRef]
- Liang, Y.; Guo, C.; Li, C.; Du, Z. A Thermodynamic Description of the Al-Cr-Si System. J. Phase Equilib. Diffus. 2009, 30, 462–479. [Google Scholar] [CrossRef]
- Dix, E.H.; Heath, A.C. Equilibrium Relations in Aluminum-Silicon and Aluminum-Iron-Silicon Alloys of High Purity. Trans. AIME 1928, 78, 164–194. [Google Scholar]
- Losana, L.; Stratta, R. Solid Solubility of Silicon in Aluminum in the Solid State, in Italian. Metall. Ital. 1931, 23, 193–197. [Google Scholar]
- Durer, A. Determination of Solvus Curves by Dilatometric Measurements. Z. Metallkd. 1940, 32, 280–281. [Google Scholar]
- Glazov, V. Plotting of the solidus lines by measuring microhardness. Izv. Akad. Nauk SSSR Otd. Teckhn. Nauk. Met. Topl. 1961, 3, 9–42. [Google Scholar]
- Drits, M.Y.; Kadaner, E.S.; Kuz’mina, V.I. Solubility of Silicon and Zirconium in Aluminium. Izv. Akad. Nauk SSR Met. 1968, 1, 170–175. [Google Scholar]
- Mondolfo, L.F. Aluminum Alloys: Structure and Properties; Butterworth & Co. Ltd.: London, UK, 1976. [Google Scholar]
- Safarian, J.; Kolbeinsen, L.; Tangstad, M. Liquidus of Silicon Binary Systems. Metall. Mater. Trans. B 2011, 42, 852–874. [Google Scholar] [CrossRef]
- Safarian, J.; Kolbeinsen, L.; Tangstad, M. Thermodynamic Activities in Silicon Binary Melts. J. Mater. Sci. 2012, 47, 5561–5580. [Google Scholar] [CrossRef]
- Navon, D.; Chernyshov, V. Retrograde Solubility of Aluminum in Silicon. J. Appl. Phys. 1957, 28, 823. [Google Scholar] [CrossRef]
- Miller, R.C.; Savage, A. Diffusion of Aluminum in Single Crystal Silicon. J. Appl. Phys. 1956, 27, 1430. [Google Scholar] [CrossRef]
- Yoshikawa, T.; Morita, K. Solid Solubilities and Thermodynamic Properties of Aluminum in Solid Silicon. J. Electrochem. Soc. 2003, 150, G465. [Google Scholar] [CrossRef]
- Nishi, Y.; Kang, Y.; Morita, K. Control of Si Crystal Growth during Solidification of Si-Al Melt. Mater. Trans. 2010, 51, 1227–1230. [Google Scholar] [CrossRef]
- Martin, J.W. Concise Encyclopedia of the Structure of Materials, 1st ed.; Elsevier Science: Amsterdam, The Netherlands, 2007. [Google Scholar]
- Soma, T.; Funayama, Y.; Kagaya, H.-M. Solid Solubility of Silicon and Germanium in Aluminium under Pressure. J. Mater. Sci. 1990, 25, 3917–3921. [Google Scholar] [CrossRef]
- Fujishiro, I.; Mii, H.; Senoo, M.; Akao, M. High-Pressure Phase Diagram of Al-Si System. J. Soc. Mater. Eng. Jpn. 1971, 215, 952–955. [Google Scholar] [CrossRef]
- Senoo, M.; Mii, H.; Fujishiro, I.; Fujikawa, T. Precise Measurements of Lattice Compression of Al, Si and Al-Si Alloys by High Pressure X-Ray Diffractometry. Jpn. J. Appl. Phys. 1976, 15, 871. [Google Scholar] [CrossRef]
- Fraenkel, W. Silicon–aluminum alloys. Z. Anorg. Chem. 1908, 58, 154–158. [Google Scholar] [CrossRef]
- Roberts, C.E. CXXIX.—The Alloys of Aluminium and Silicon. J. Chem. Soc. Trans. 1914, 105, 1383. [Google Scholar] [CrossRef]
- Gwyer, A.G.C.; Phillips, H.W.L. Alloys of Aluminium with Silicon and Iron. J. Inst. Met. 1927, 38, 311–335. [Google Scholar]
- Broniewski, W.; Smialowski, M. On the Al-Si Alloys. Rev. Met. 1932, 29, 542–552. [Google Scholar] [CrossRef]
- Matsuyama, K. Ternary Diagram of the Al-Cu-Si System. Kinzoku No Kenkyu 1934, 11, 461–490. [Google Scholar]
- Craighead, C.M.; Cawthorne, E.W.; Jaffee, R.I. Solution Rate of Solid Aluminum in Molten Al-Si Alloy. Trans. AIME 1955, 203, 81–87. [Google Scholar] [CrossRef]
- Berthon, O.; Petot-Ervas, G.; Petot, C.; Desres, P. Thermodynamics of Aluminium-Silicon Alloys Containing 3–5 at% of Silicon. CR Acad. Sci. Paris 1969, 268C, C1939–C1942. [Google Scholar]
- Kobayashi, K.; Shingu, P.H.; Kanbara, H.; Ozaki, R. The Role of the Primary Phase on Eutectic Solidification of Al-Si Alloys. Trans. Jpn. Inst. Met. 1976, 17, 545–550. [Google Scholar] [CrossRef]
- Kobayashi, K.; Shingu, R.H.; Ozaki, R. The Role of the Primary Phase on Eutectic Solidification of Al-Si Alloys. Scr. Met. 1976, 10, 525–527. [Google Scholar] [CrossRef]
- Girault, B.; Chevrier, F.; Joullie, A.; Bougnot, G. Liquid Phase Epitaxy of Silicon at Very Low Temperatures. J. Cryst. Growth 1977, 37, 169–177. [Google Scholar] [CrossRef]
- Singer, A.R.E.; Jennings, P.H. Hot-Shortness of the Aluminium-Silicon Alloys of Commercial Purity. J. Inst. Met. 1947, 73, 33–55. [Google Scholar]
- Mey, S.; Hack, K. A Thermodynamic Evaluation of the Si-Zn, Al-Si and Al-Si-Zn Systems. Z. Met. 1986, 77, 454–459. [Google Scholar]
- Dörner, P.; Henig, E.-T.; Krieg, H.; Lukas, H.L.; Petzow, G. Optimization and Calculation of the Binary System Al-Si. Calphad 1980, 4, 241–254. [Google Scholar] [CrossRef]
- Lozovskii, V.N.; Udyanskaya, A.I. Solubility of Aluminum in Silicon Single Crystals. Inorg. Mater. 1968, 4, 1030–1031. [Google Scholar]
- Pichler, P. Intrinsic Point Defects, Impurities, and Their Diffusion in Silicon; Computational Microelectronics; Springer: Vienna, Austria, 2004. [Google Scholar]
- Krause, O.; Ryssel, H.; Pichler, P. Determination of Aluminum Diffusion Parameters in Silicon. J. Appl. Phys. 2002, 91, 5645. [Google Scholar] [CrossRef]
- Galvagno, G.; Scandurra, A.; Raineri, V.; Rimini, E.; La Ferla, A.; Sciascia, V.; Frisina, F.; Raspagliesi, M.; Ferla, G. Implants of Aluminum into Silicon. Nucl. Instrum. Methods Phys. Res. Sect. B Beam Interact. Mater. Atoms 1993, 74, 105–108. [Google Scholar] [CrossRef]
- Fisher, D.J. Diffusivity in Silicon 1953 to 2009. Defect Diffus. Forum 2010, 302, 230. [Google Scholar] [CrossRef]
- Tang, K.; Øvrelid, E.J.; Tranell, G.; Tangstad, M. Critical Assessment of the Impurity Diffusivities in Solid and Liquid Silicon. JOM 2009, 61, 49–55. [Google Scholar] [CrossRef]
- Chakraborti, N.; Lukas, H.L. Thermodynamic Optimization of the Mg-Al-Si Phase Diagram. Calphad 1992, 16, 79–86. [Google Scholar] [CrossRef]
- Feufel, H.; Gödecke, T.; Lukas, H.L.; Sommer, F. Investigation of the Al-Mg-Si System by Experiments and Thermodynamic Calculations. J. Alloy. Compd. 1997, 247, 31–42. [Google Scholar] [CrossRef]
- Du, Y.; Schuster, J.C.; Liu, Z.-K.; Hu, R.; Nash, P.; Sun, W.; Zhang, W.; Wang, J.; Zhang, L.; Tang, C.; et al. A Thermodynamic Description of the Al-Fe-Si System over the Whole Composition and Temperature Ranges via a Hybrid Approach of CALPHAD and Key Experiments. Intermetallics 2008, 16, 554–570. [Google Scholar] [CrossRef]
- Gröbner, J.; Lukas, H.L.; Aldinger, F. Thermodynamic Calculation of the Ternary System Al-Si-C. Calphad 1996, 20, 247–254. [Google Scholar] [CrossRef]
- Tang, Y.; Du, Y.; Zhang, L.; Yuan, X.; Kaptay, G. Thermodynamic Description of the Al-Mg-Si System Using a New Formulation for the Temperature Dependence of the Excess Gibbs Energy. Thermochim. Acta 2012, 527, 131–142. [Google Scholar] [CrossRef]
- Desai, P.D. Thermodynamic Properties of Selected Binary Aluminum Alloy Systems. J. Phys. Chem. Ref. Data 1987, 16, 109. [Google Scholar] [CrossRef]
- Hansen, S.C.; Loper, C.R. Effect of Antimony on the Phase Equilibrium of Binary Al-Si Alloys. Calphad 2000, 24, 339–352. [Google Scholar] [CrossRef]
- Bros, J.P.; Eslami, H.; Gaune, P. Thermodynamics of Al-Si and Al-Ge-Si Liquid Alloys: Enthalpies of Formation by High Temperature Calorimetry. Ber. Bunsenges. Phys. Chem. 1981, 85, 333–336. [Google Scholar] [CrossRef]
- Gizenko, N.V.; Emlin, B.I.; Kilesso, S.N.; Zav’yalov, A.L. Heats of Formation of Molten Aluminum-silicon Alloys. Izv. Akad. Nauk SSR Met. 1983, 3, 3–35. [Google Scholar]
- Rostovtsev, S.T.; Khitrik, S.I. Activity of Components in Silicon-aluminum, Silicon-manganese, and Silicon-chromium Alloys. Izv. Vyssh. Ucheb. Zaved. Met. 1971, 14, 61–63. [Google Scholar]
- Tang, K.; Øvrelid, E.J.; Tranell, G.; Tangstad, M. Thermochemical and Kinetic Databases for the Solar Cell Silicon Materials. Adv. Mate. Res. 2009, 14, 219–251. [Google Scholar]
- Batalin, G.I.; Beloborodova, E.A. An Investigation of the Thermodynamic Properties of Al-Si Melts. Izv. Akad. Nauk SSSR Met. 1971, 6, 9–74. [Google Scholar]
- Chatillon, C.; Allibert, M.; Pattoret, A. Thermodynamic Study by Mass Spectrometry of Aluminum-Silicon Alloys From 1000 to 1700 K. High Temp. High Press. 1975, 5, 583–594. [Google Scholar]
- Loseva, A.; Al’mukhamedov, A.; Tyumentsev, V.; Luzhnova, M. Thermodynamic Properties of Liquid Al-Si Alloys. Russ. J. Phys. Chem. 1977, 51, 495. [Google Scholar]
- Gokcen, N.A. The As (Arsenic) System. Bull. Alloy Phase Diagr. 1989, 10, 11–22. [Google Scholar] [CrossRef]
- Klement, W.; Jayaraman, A.; Kennedy, G.C. Phase Diagrams of Arsenic, Antimony, and Bismuth at Pressures up to 70 Kbars. Phys. Rev. 1963, 131, 632–637. [Google Scholar] [CrossRef]
- Jayaraman, A.; Klement, W.J.; Newton, R.C.; Kennedy, G.C. High-Pressure Investigations of Group III Elements. Part I. Fusion Curves and Polymorphic Transitions of Aluminum, Gallium, Indium, and Thallium at High Pressures. Part II. Phase Transformations in Uranium at High Pressures; Institute of Geophysics, University of California: Livermore, CA, USA, 1962. [Google Scholar]
- Olesinski, R.W.; Abbaschian, G.J. The As-Si (Arsenic-Silicon) System. Bull. Alloy Phase Diagrams 1985, 6, 254–258. [Google Scholar] [CrossRef]
- Klemm, W.; Pirscher, P. Uber Siliciumarsenide. Z. Anorg. Allg. Chem. 1941, 247, 211–220. [Google Scholar] [CrossRef]
- Ugay, Y.A.; Miroshnichenko, S.N.; Goncharov, E.G. Investigation of the pTx Diagram of the Si-As System. Izv. Akad. Nauk SSSR Neorg. Mat. 1974, 10, 1774–1777. [Google Scholar]
- Ugay, Y.A.; Goncharov, E.G.; Gladyshev, N.F.; Popov, A.E.; Inozemtseva, N.Y. Tensimetric Study of the Si-As System. Fiz. Khim. Prots. Polyprovod. Poverkh 1981, 138–144. [Google Scholar]
- Belousov, V.I. Calculation of the Activity Coefficient of Arsenic in Single Crystal Silicon. Russ. J. Phys. Chem. 1979, 53, 1266–1267. [Google Scholar]
- Sandhu, J.S.; Reuter, J.L. Arsenic Source Vapor Pressure Kinetics and Capsule Diffusion. IBM J. Res. Dev. 1971, 15, 464–471. [Google Scholar] [CrossRef]
- Trumbore, F.A. Solid Solubilities of Impurity Elements in Germanium and Silicon. Bell Syst. Tech. J. 1960, 39, 205–233. [Google Scholar] [CrossRef]
- Donohue, P.C.; Siemons, W.J.; Gillson, J.L. Preparation and Properties of Pyrite-Type SiP2 and SiAs2. J. Phys. Chem. Solids 1968, 29, 807–813. [Google Scholar] [CrossRef]
- Thurmond, C.D.; Kowalchik, M. Germanium and Silicon Liquidus Curves. Bell Syst. Tech. J. 1960, 39, 169–204. [Google Scholar] [CrossRef]
- Thurmond, C.D. Equilibrium Thermochemistry of Solid and Liquid Alloys of Germanium and of Silicon. I. The Solubility of Ge and Si in Elements of Groups III, IV and V. J. Phys. Chem. 1953, 57, 827–830. [Google Scholar] [CrossRef]
- Jordan, A.S.; Weiner, M.E. Calculation of the Liquidus Isotherms and Component Activities in the Ga-As-Si and Ga-P-Si Ternary Systems. J. Electrochem. Soc. 1974, 121, 1634. [Google Scholar] [CrossRef]
- Sudavtsova, V.S.; Batalin, G.I. Calculation of the Activities of the Components of Molten Metal-Si Alloys from the Phase Diagrams. Ukr. Khim. Zh. 1977, 43, 235–240. [Google Scholar]
- FACTSAGE. Integrated Thermodynamic Databank System; University Montreal: Montreal, QC, Canada, 2001. [Google Scholar]
- Fair, R.B.; Weber, G.R. Effect of Complex Formation on Diffusion of Arsenic in Silicon. J. Appl. Phys. 1973, 44, 273. [Google Scholar] [CrossRef]
- Ohkawa, S.; Nakajima, Y.; Fukukawa, Y. Arsenic Diffusion into Silicon from Elemental Source. Jpn. J. Appl. Phys. 1975, 14, 458. [Google Scholar] [CrossRef]
- Angelucci, R.; Armigliato, A.; Landi, E.; Nobili, D.; Solmi, S. Equilibrium Solubility of Arsenic and Antimony in Silicon. In Proceedings of the 17th European Solid State Device Research Conference (ESSDERC), Bologna, Italy, 14–17 September 1987; pp. 461–464. [Google Scholar]
- Nobili, D.; Solmi, S.; Parisini, A.; Derdour, M.; Armigliato, A.; Moro, L. Precipitation, Aggregation, and Diffusion in Heavily Arsenic-Doped Silicon. Phys. Rev. B 1994, 49, 2477–2483. [Google Scholar] [CrossRef]
- Nobili, D.; de Cogan, D. Solubility of B, Al, Ga, In, Tl, P, As an Sb in c-Si. Prop. Cryst. Silicon INSPEC Inst. Electr. Eng. Lond. 1999, 620–635. [Google Scholar]
- Fair, R.B.; Tsai, J.C.C. The Diffusion of Ion-Implanted Arsenic in Silicon. J. Electrochem. Soc. 1975, 122, 1689. [Google Scholar] [CrossRef]
- Miyamoto, N.; Kuroda, E.; Yoshida, S. The Behavior of Arsenic in Silicon During Heat Treatment. J. Jpn. Soc. Appl. Phys. Suppl. 1974, 43, 408–414. [Google Scholar]
- Pandey, K.C.; Erbil, A.; Cargill, G.S.; Boehme, R.F.; Vanderbilt, D. Annealing of Heavily Arsenic-Doped Silicon: Electrical Deactivation and a New Defect Complex. Phys. Rev. Lett. 1988, 61, 1282–1285. [Google Scholar] [CrossRef] [PubMed]
- Ventzek, P.L.G.; Kweon, K.E.; Ueda, H.; Oka, M.; Sugimoto, Y.; Hwang, G.S. Formation, Nature, and Stability of the Arsenic-Silicon-Oxygen Alloy for Plasma Doping of Non-Planar Silicon Structures. Appl. Phys. Lett. 2014, 105, 262102. [Google Scholar] [CrossRef]
- Nobili, D.; Solmi, S. Features of Arsenic Clusters in Silicon. Phys. Status Solidi 2005, 2, 3681–3685. [Google Scholar] [CrossRef]
- Moynagh, P.B.; Rosser, P.J. Quantification of Diffusion Mechanisms of Boron, Phosphorus, Arsenic, and Antimony in Silicon. In ESSDERC 1989; Springer: Berlin/Heidelberg, Germany, 1989; pp. 291–296. [Google Scholar]
- Kim, Y.; Massoud, H.Z.; Fair, R.B. The Effect of Ion-Implantation Damage on Dopant Diffusion in Silicon during Shallow-Junction Formation. J. Electron. Mater. 1989, 18, 143–150. [Google Scholar] [CrossRef]
- Fair, R. Concentration Profiles of Diffusion Dopants in Silicon. In Impurity Doping Processes in Silicon; Wang, F.F.Y., Ed.; Noth-Holland Publishing Company: New York, NY, USA, 1981; pp. 315–442. [Google Scholar]
- Hull, R. Properties of Crystalline Silicon; Institution of Engineering and Technology (IET): London, UK, 1999. [Google Scholar]
- Pelton, A.D. On the Slopes of Phase Boundaries. Metall. Trans. A 1988, 19, 1819–1825. [Google Scholar] [CrossRef]
- Fitzner, K.; Kleppa, O.J. Direct Synthesis Calorimetry of Some Binary Alloys in the Systems Si-As, Ge-As and Sn-As. J. Alloy. Compd. 1996, 238, 187–192. [Google Scholar] [CrossRef]
- Niessen, A.K.; de Boer, F.R.; Boom, R.; de Châtel, P.F.; Mattens, W.C.M.; Miedema, A.R. Model Predictions for the Enthalpy of Formation of Transition Metal Alloys II. Calphad 1983, 7, 51–70. [Google Scholar] [CrossRef]
- Zaitsev, A.I.; Kodentsov, A.A. Thermodynamic Properties and Phase Equilibria in the Si-B System. J. Phase Equilib. 2001, 22, 126–135. [Google Scholar] [CrossRef]
- Olesinski, R.W.; Abbaschian, G.J. The B-Si (Boron-Silicon) System. Bull. Alloy Phase Diagr. 1984, 5, 478–484. [Google Scholar] [CrossRef]
- Brosset, C.; Magnusson, B. The Silicon-Boron System. Nature 1960, 187, 54–55. [Google Scholar] [CrossRef]
- Samsonov, G.V.; Sleptsov, V.M. Forefront Version of the Phase Diagram in the Boron-Silicon System. Acad. Sci. UK SSR 1962, 8, 1066–1068. [Google Scholar]
- Hesse, J. Loeslichkeit Und Ausscheidungskinetik von Bor in Polykristallinem Silizium. Z. Met. 1968, 59, 499–503. [Google Scholar]
- Male, G.; Salanoubat, D. The Existence of a Rich Boron Phase in the Boron-Silicon System. Rev. Int. Ht. Temp. Refract. 1981, 18, 109–120. [Google Scholar]
- Armas, B.; Chatillon, C.; Allibert, M. Determination by Differential Mass Spectrometry of Activities in the Solid Silicon-Boron System. Rev. Int. Ht. Temp. Refract. 1981, 18, 153–165. [Google Scholar]
- Barin, I.; Knacke, O.; Kubaschewski, O. Thermochemical Properties of Inorganic Substances; Springer: Berlin/Heidelberg, Germany, 1977. [Google Scholar]
- Esin, Y.O.; Kolesnikov, S.P.; Baev, B.M.; Ermakov, A.F. Entalpij Obrazovanya Zhidkikh Splavov Kremnya S Borom (Ethalpies Formation of Liquid Alloys of Silicon with Boron), Tezisy Nauchn. Soobshch. Vses. Konf. Str. Svoistvam Met. Shlakovykh Rasplav. 1978, 2, 182–183. [Google Scholar]
- Li, J.; Goto, T.; Hirai, T. Thermoelectric Properties of SiB14-SiB6 Composites Prepared by Arc Melting and Annealing. J. Jpn. Soc. Powder Powder Metall. 1998, 45, 581–585. [Google Scholar] [CrossRef]
- Ettmayer, P.; Horn, H.C.; Schwetz, K.A. Untersuchungen Im System Silicium-Bor Mit Hilfe Der Elektronenstarhl-Mikroanalyse. Mikrochim. Acta 1970, 4, 87–95. [Google Scholar]
- Dirkx, R.R.; Spear, K.E. Optimization of Thermodynamic Data for Silicon Borides. Calphad 1987, 11, 167–175. [Google Scholar] [CrossRef]
- Okamoto, H. B-Si (Boron-Silicon). J. Phase Equilib. Diffus. 2005, 26, 396. [Google Scholar] [CrossRef]
- Fries, S.; Lukas, H.L. System B-Si. In COST 507. Thermochemical Database for Light Metal Alloys; Ansara, I., Dinsdale, A.T., Rand, M.H., Eds.; Office for Official Publications of the European Communities: Brussels, Belgium, 1998; Volume 2, pp. 126–128. [Google Scholar]
- Seifert, H.J.; Aldinger, F. Phase Equilibria in the Si-B-C-N System. In High Performance Non-Oxide Ceramics I; Springer: Berlin/Heidelberg, Germany, 2002; pp. 1–58. [Google Scholar]
- Vick, G.L.; Whittle, K.M. Solid Solubility and Diffusion Coefficients of Boron in Silicon. J. Electrochem. Soc. 1969, 116, 1142. [Google Scholar] [CrossRef]
- Van Hung, V.; Hong, P.T.T.; Van Khue, B. Boron and Phosphorus Diffusion In Silicon: Interstitial, Vacancy and Combination Mechanisms. Proc. Natl. Conf. Theor. Phys. 2010, 35, 73–79. [Google Scholar]
- Nichols, C.S.; Van de Walle, C.G.; Pantelides, S.T. Mechanisms of Dopant Impurity Diffusion in Silicon. Phys. Rev. B 1989, 40, 5484–5496. [Google Scholar] [CrossRef]
- Windl, W.; Bunea, M.M.; Stumpf, R.; Dunham, S.T.; Masquelier, M.P. First-Principles Study of Boron Diffusion in Silicon. Phys. Rev. Lett. 1999, 83, 4345–4348. [Google Scholar] [CrossRef]
- Haddara, Y.M.; Folmer, B.T.; Law, M.E.; Buyuklimanli, T. Accurate Measurements of the Intrinsic Diffusivities of Boron and Phosphorus in Silicon. Appl. Phys. Lett. 2000, 77, 1976. [Google Scholar] [CrossRef]
- Lide, D.R. Handbook of Chemistry and Physics, 85th edition; CRC Press: Boca Raton, USA, 2004. [Google Scholar]
- Sugino, O.; Oshiyama, A. Microscopic Mechanism of Atomic Diffusion in Si under Pressure. Phys. Rev. B 1992, 46, 12335–12341. [Google Scholar] [CrossRef]
- Khajavi, L.T.; Morita, K.; Yoshikawa, T.; Barati, M. Thermodynamics of Boron Distribution in Solvent Refining of Silicon Using Ferrosilicon Alloys. J. Alloy. Compd. 2015, 619, 634–638. [Google Scholar] [CrossRef]
- Beletskii, A.K.; Shcheretskii, A.K.; Vitusevich, V.T.; Shumikhin, V.S. Enthalpies of Formation of Melts in the Si-B System. Izv. AN SSSR Met. 1988, 3, 66–68. [Google Scholar]
- Kudin, V.G.; Makara, V.A.; Sudavtsova, V.S. Interactions in Molten Aluminum (Silicon)-Boron Alloys. Powder Metall. Met. Ceram. 2001, 40, 61–64. [Google Scholar] [CrossRef]
- Franke, P.; Neuschütz, D. B-Si. In Binary systems. Part 2: Elements and Binary Systems from B-C to Cr-Zr; Springer: Berlin/Heidelberg, Germany, 2004; pp. 1–4. [Google Scholar]
- Kudin, V.G.; Makara, V.A. Thermodynamic Properties of Metal-Boron Alloys. Inorg. Mater. 2002, 38, 216–219. [Google Scholar] [CrossRef]
- Kaufman, L.; Uhrenius, B.; Birnie, D.; Taylor, K. Coupled Pair Potential, Thermochemical and Phase Diagram Data for Transition Metal Binary Systems-VII. Calphad 1984, 8, 25–66. [Google Scholar] [CrossRef]
- Zaitseva, N.; Tsaplin, A.; Kodentsov, A. Thermodynamic Properties and Phase Equilibria in the Si-B System. In High Temperature Corrosion and Materials Chemistry III; Opila, E.J., McNallan, M.D., Eds.; The Electrochemistry Society: Washington, DC, USA, 2001. [Google Scholar]
- Gordienko, S.P. Enthalpies of Formation for Boron Silicides. Powder Metall. Met. Ceram. 1996, 34, 660–662. [Google Scholar] [CrossRef]
- George, R.E.; Witzel, W.; Riemann, H.; Abrosimov, N.V.; Nötzel, N.; Thewalt, M.L.W.; Morton, J.J.L. Electron Spin Coherence and Electron Nuclear Double Resonance of Bi Donors in Natural Si. Phys. Rev. Lett. 2010, 105, 67601. [Google Scholar] [CrossRef] [PubMed]
- Sekiguchi, T.; Steger, M.; Saeedi, K.; Thewalt, M.L.W.; Riemann, H.; Abrosimov, N.V.; Nötzel, N. Hyperfine Structure and Nuclear Hyperpolarization Observed in the Bound Exciton Luminescence of Bi Donors in Natural Si. Phys. Rev. Lett. 2010, 104, 137402. [Google Scholar] [CrossRef] [PubMed]
- Belli, M.; Fanciulli, M.; Abrosimov, N.V. Pulse Electron Spin Resonance Investigation of Bismuth-Doped Silicon: Relaxation and Electron Spin Echo Envelope Modulation. Phys. Rev. B 2011, 83, 235204. [Google Scholar] [CrossRef]
- Mohammady, M.H.; Morley, G.W.; Nazir, A.; Monteiro, T.S. Analysis of Quantum Coherence in Bismuth-Doped Silicon: A System of Strongly Coupled Spin Qubits. Phys. Rev. B 2012, 85, 94404. [Google Scholar] [CrossRef]
- Parry, C.M. Bismuth-Doped Silicon: An Extrinsic Detector For Long-Wavelength Infrared (LWIR) Applications. Proceedings of SPIE 0244, Mosaic Focal Plane Methodologies, San Diego, CA, USA, 18 February 1981. [Google Scholar]
- Williams, R.S. On the Alloys of Antimony with Manganese, Chromium, Silicon and Tin; of Bismuth with Chromium and Silicon; and of Manganese with Tin and Lead. Z. Anorg. Chem. 1907, 55, 1–33. [Google Scholar] [CrossRef]
- Girault, B. Liquidus Curves of Some Metal-Silicon Systems. CR Hebd Sci. L Acad. 1977, 1, 1–4. [Google Scholar]
- Fuller, C.S.; Ditzenberger, J.A. Diffusion of Donor and Acceptor Elements in Silicon. J. Appl. Phys. 1956, 27, 544. [Google Scholar] [CrossRef]
- Ghoshtagore, R.N. Donor Diffusion Dynamics in Silicon. Phys. Rev. B 1971, 3, 397–403. [Google Scholar] [CrossRef]
- Ishikawa, Y.; Yazaki, K.; Nakamichi, I. The Diffusion of Bismuth in Silicon. Jpn. J. Appl. Phys. 1989, 28, 1272–1273. [Google Scholar] [CrossRef]
- Smigelskas, A.D.; Kirkendall, E.O. Zinc Diffusion in Alpha Brass. Trans. Aime 1947, 171, 130–142. [Google Scholar]
- Kaban, I.; Gröbner, J.; Hoyer, W.; Schmid-Fetzer, R. Liquid-liquid Phase Equilibria, Density Difference, and Interfacial Tension in the Al-Bi-Si Monotectic System. J. Mater. Sci. 2010, 45, 2030–2034. [Google Scholar] [CrossRef]
- Scheel, H.J. Introduction to Liquid Phase Epitaxy. In Liquid Phase Epitaxy of Electronic, Optical and Optoelectronic Materials; John Wiley & Sons, Ltd.: Chichester, UK, 2007; pp. 1–19. [Google Scholar]
- Franke, P.; Neuschütz, D. Ga-Si (Gallium-Silicon). In Binary Systems. Part 5: Binary Systems Supplement 1; Springer: Berlin/Heidelberg, Germany, 2007; pp. 1–3. [Google Scholar]
- Klemm, W.; Klemm, L.; Hohmann, E.; Volk, H.; Orlamünder, E.; Klein, H.A. Das Verhalten Der Elemente Der III. Gruppe Zueinander Und Zu Den Elementen Der IV. Gruppe. Z. Anorg. Chem. 1948, 256, 239–252. [Google Scholar] [CrossRef]
- Savitskiy, Y.M.; Baron, V.V.; Tylkina, M.A. Phase Diagrams on Properties of Alloys of Gallium and Thallium. Russ. J. Inorg. Chem. 1958, 3, 310–327. [Google Scholar]
- Keck, P.H.; Broder, J. The Solubility of Silicon and Germanium in Gallium and Indium. Phys. Rev. 1953, 90, 521–522. [Google Scholar] [CrossRef]
- Banerjee, A. Advances in Physical Metallurgy; CRC Press: Amsterdam, The Netherlands, 1996. [Google Scholar]
- Haridoss, S.; Bénière, F.; Gauneau, M.; Rupert, A. Diffusion of Gallium in Silicon. J. Appl. Phys. 1980, 51, 5833. [Google Scholar] [CrossRef]
- Kurtz, A.D.; Gravel, C.L. Diffusion of Gallium in Silicon. J. Appl. Phys. 1958, 29, 1456. [Google Scholar] [CrossRef]
- Boltaks, B.I.; Dzhafarov, T.D. Diffusion of Gallium in Inhomogeneous Silicon. Sov. Phys. Solid State 1964, 5, 2649–2651. [Google Scholar]
- Kren, J.G.; Masters, B.J.; Wajda, E.S. Effect of Surface Imperfections on Gallium Diffusion in Silicon. Appl. Phys. Lett. 1964, 5, 49. [Google Scholar] [CrossRef]
- Makris, J.S. Gallium Diffusions into Silicon and Boron-Doped Silicon. J. Appl. Phys. 1971, 42, 3750. [Google Scholar] [CrossRef]
- Kanibolotsky, D.S.; Golovata, N.V.; Bieloborodova, O.A.; Lisnyak, V.V. Calorimetric Investigation of Liquid Gallium-Based Alloys. Z. Naturforsch. A 2003, 58, 473–474. [Google Scholar] [CrossRef]
- Sudavtsova, V.S.; Zinevich, T.N.; Kotova, N.V.; Beloborodova, E.A. Thermodynamic Properties of Ga-Si (Ge, Sn, Pb) Melts. Russ. J. Phys. Chem. 78, 829–831.
- Tmar, M.; Pasturel, A.; Colinet, C. Thermodynamics of (Silicon + Indium) and (Silicon + Gallium) Calorimetric Determination of the Partial Molar Enthalpy at Infinite Dilution of Si in Indium and Gallium. J. Chem. Thermodyn. 1983, 15, 1037–1040. [Google Scholar] [CrossRef]
- Backenstoss, G. Conductivity Mobilities of Electrons and Holes in Heavily Doped Silicon. Phys. Rev. 1957, 108, 1416–1419. [Google Scholar] [CrossRef]
- Jones, C.E.; Schafer, D.E.; Scott, M.W.; Hager, R.J. Studies of Indium-Doped Silicon; Honeywell Inc.: Minneapolis, MN, USA, 1980. [Google Scholar]
- Cerofolini, G.F.; Ferla, G.; Pignatel, G.U.; Riva, F. Thermodynamic and Kinetic Properties of Indium-Implanted Silicon II: High Temperature Diffusion in an Inert Atmosphere. Thin Solid Films 1983, 101, 275–283. [Google Scholar] [CrossRef]
- Millea, M.F. The Effect of Heavy Doping on the Diffusion of Impurities in Silicon. J. Phys. Chem. Solids 1966, 27, 315–325. [Google Scholar] [CrossRef]
- Antoniadis, D.A.; Moskowitz, I. Diffusion of Indium in Silicon Inert and Oxidizing Ambients. J. Appl. Phys. 1982, 53, 9214. [Google Scholar] [CrossRef]
- Noël, J.-P.; Hirashita, N.; Markert, L.C.; Kim, Y.-W.; Greene, J.E.; Knall, J.; Ni, W.-X.; Hasan, M.A.; Sundgren, J.-E. Electrical Properties of Si Films Doped with 200-eV In+ Ions during Growth by Molecular-Beam Epitaxy. J. Appl. Phys. 1989, 65, 1189. [Google Scholar] [CrossRef]
- Scott, W.; Hager, R.J. Solution Growth of Indium-Doped Silicon. J. Electron. Mater. 1979, 8, 581–602. [Google Scholar] [CrossRef]
- Sato, A.; Suzuki, K.; Horie, H.; Sugii, T. Determination of Solid Solubility Limit of In and Sb in Si Using Bonded Silicon-on-Insulator (SOI) Substrate. In Proceedings of the IEEE International Conference on Microelectronic Test Structures (ICMTS), Nara, Japan, 22–25 March 1995; pp. 259–263. [Google Scholar]
- Solmi, S.; Parisini, A.; Bersani, M.; Giubertoni, D.; Soncini, V.; Carnevale, G.; Benvenuti, A.; Marmiroli, A. Investigation on Indium Diffusion in Silicon. J. Appl. Phys. 2002, 92, 1361. [Google Scholar] [CrossRef]
- Liu, J.; Jeong, U.; Mehta, S.; Sherbondy, J.; Lo, A.; Shim, K.H.; Lim, J.E. Investigation of Indium Activation by C-V Measurement, in: Ion Implantation Technology; Ryssel, H., Frey, L., Gyulai, J., Glawischnig, H., Eds.; IEEE: Piscataway, NJ, USA, 2000. [Google Scholar]
- Yoshikawa, T.; Morita, K.; Kawanishi, S.; Tanaka, T. Thermodynamics of Impurity Elements in Solid Silicon. J. Alloy. Compd. 2010, 490, 31–41. [Google Scholar] [CrossRef]
- Cerofolini, G.F.; Ferla, G.; Pignatel, G.U.; Riva, F.; Ottaviani, G. Thermodynamic and Kinetic Properties of Indium-Implanted Silicon I: Moderate Temperature Recovery of the Implant Damage and Metastability Effects. Thin Solid Films 1983, 101, 263–273. [Google Scholar] [CrossRef]
- Franke, P.; Neuschütz, D. In-Si. In Binary Systems. Part 3: Binary Systems from Cs-K to Mg-Zr; Springer: Berlin/Heidelberg, Germany, 2006; pp. 1–3. [Google Scholar]
- Pavlov, P.V.; Zorin, E.I.; Tetelbaum, D.I.; Khokhlov, A.F. Nitrogen as Dopant in Silicon and Germanium. Phys. Status Solidi 1976, 35, 11–36. [Google Scholar] [CrossRef]
- Kaiser, W.; Thurmond, C.D. Nitrogen in Silicon. J. Appl. Phys. 1959, 30, 427–431. [Google Scholar] [CrossRef]
- Wu, J.; Sun, J.; Zhong, X.; Zhou, Z.; Wu, C.; Li, F. Silicon Nitride Films Synthesized by Reactive Pulsed Laser Deposition in an Electron Cyclotron Resonance Nitrogen Plasma. Thin Solid Films 1999, 350, 101–105. [Google Scholar] [CrossRef]
- Ma, X.; Li, C.; Wang, F.; Zhang, W. Thermodynamic Assessment of the Si-N System. Calphad 2003, 27, 383–388. [Google Scholar] [CrossRef]
- Blegen, K. Equilibria and Kinetics in Systems Si-N, Si-O-N and Si-C-O-N. Ph.D. Thesis, Department of Silicate and High Temperature Chemistry, University of Trondheim, Trondheim, Norway, 1976. [Google Scholar]
- Pehlke, R.D.; Elliott, J.F. High-Temperature Thermodynamics of the Silicon, Nitrogen, Silicon-Nitride System. Trans. Am. Inst. Min. Metall. Eng. 1959, 215, 781–785. [Google Scholar]
- Guzman, I.Y.; Demidenko, A.F.; Koshchenko, V.I.; Fraifel’d, M.S.; Egner, Y.V. Specific-Heats and Thermodynamic Functions of Si3N4 and Si2ON2. Izv. Akad. Nauk SSSR Neorg. Mater. 1976, 12, 1879–1881. [Google Scholar]
- Koshchenko, V.I.; Grinburg, Y. Thermodynamic Functions of B6As (5–600 K), Beta-SiC (5–2500 K) and Si3N4 (5–4000 K). Izv. Akad. Nauk SSSR Neorg. Mater. 1985, 21, 244–248. [Google Scholar]
- Hillert, M.; Jonsson, S.; Sundman, B. Thermodynamic Calculation of the Si-N-O System. Z. Met. 1992, 83, 648–654. [Google Scholar]
- Kaufman, L. Calculation of Quasi Binary and Quasiternary Oxynitride Systems—III. Calphad 1979, 3, 275–291. [Google Scholar] [CrossRef]
- Dorner, P.; Gauckler, L.J.; Krieg, H.; Lukas, H.L.; Petzow, G.; Weiss, J. Calculation of Heterogeneous Phase Equilibria in the SiAlON System. J. Mater. Sci. 1981, 16, 935–943. [Google Scholar] [CrossRef]
- Hincke, W.B.; Brantley, L.R. The High-Temperature Equilibrium Between Silicon Nitride, Silicon and Nitrogen. J. Am. Chem. Soc. 1930, 52, 48–52. [Google Scholar] [CrossRef]
- Forgeng, W.D.; Decker, B.F. Nitrides of Silicon. Min. Metall. Eng. 1958, 212, 343–348. [Google Scholar]
- Fujita, N.; Jones, R.; Goss, J.P.; Briddon, P.R.; Frauenheim, T.; Öberg, S. Diffusion of Nitrogen in Silicon. Appl. Phys. Lett. 2005, 87, 21902. [Google Scholar] [CrossRef]
- Alpass, C.R.; Murphy, J.D.; Falster, R.J.; Wilshaw, P.R. Nitrogen in Silicon: Diffusion at 500–750 °C and Interaction with Dislocations. Mater. Sci. Eng. B 2009, 159–160, 95–98. [Google Scholar] [CrossRef]
- Jones, R.; Hahn, I.; Goss, J.P.; Briddon, P.R.; Öberg, S. Structure and Electronic Properties of Nitrogen Defects in Silicon. Solid State Phenom. 2004, 95–96, 93–98. [Google Scholar] [CrossRef]
- Leslie, W.C.; Carroll, K.; Fishe, R.M. Diffraction Patterns and Crystal Structures of Si3N4 and Ge3N4. Trans. Met. Soc. AIME 1952, 194, 204–206. [Google Scholar]
- Carlson, O.N. The N-Si (Nitrogen-Silicon) System. Bull. Alloy Phase Diagr. 1990, 11, 569–573. [Google Scholar] [CrossRef]
- Arrowsmith, J.M. A New Silicon Nitride Phase in Commercial Silicon Killed Steels. J. Iron Steel Inst. 1963, 201, 699. [Google Scholar]
- Mellor, J.W. A Comprehensive Treatise on Inorganic and Theoretical Chemistry; Longmans, Green and Co. Ltd.: London, UK, 1928. [Google Scholar]
- Hengge, E. Uber Die Darstellung Eines Neuen Siliciumsubnitrides (Si6N2)n. Z. Anorg. Allg. Chem. 1962, 315, 298–304. [Google Scholar] [CrossRef]
- Wiberg, E.; Michaud, H. Zur Kenntnis Eines Siliciumtetrazids Si(N3)4. Z. Naturforsch. Sect. B J. Chem. Sci. 1954, 9, 500. [Google Scholar] [CrossRef]
- Peng, H. Spark Plasma Sintering of Si3N4-Based Ceramics-Sintering Mechanism-Tailoring Microstructure-Evaluating Properties; Stockholm University: Stockholm, Sweden, 2004. [Google Scholar]
- Riedel, R.; Zerr, A.; Miehe, G.; Serghiou, G.; Schwarz, M.; Kroke, E.; Fueß, H.; Kroll, P.; Boehler, R. Synthesis of Cubic Silicon Nitride. Nature 1999, 400, 340–342. [Google Scholar] [CrossRef]
- Wang, C.-M.; Pan, X.; Ruhle, M.; Riley, F.L.; Mitomo, M. Silicon Nitride Crystal Structure and Observations of Lattice Defects. J. Mater. Sci. 1996, 31, 5281–5298. [Google Scholar] [CrossRef]
- Scientific Group Thermodata Europe. SGTE Substance Database; Royal Institute of Technology: Stockholm, Sweden, 1994. [Google Scholar]
- Dinsdale, A.T. SGTE Data for Pure Elements. Calphad 1991, 15, 317–425. [Google Scholar] [CrossRef]
- Favre, S.; Nuta, I.; Chichignoud, G.; Zaïdat, K.; Chatillon, C. Removing Phosphorus from Molten Silicon: A Thermodynamic Evaluation of Distillation. ECS J. Solid State Sci. Technol. 2016, 5, P129–P137. [Google Scholar] [CrossRef]
- Miki, T.; Morita, K.; Sano, N. Thermodynamics of Phosphorus in Molten Silicon. Metall. Mater. Trans. B 1996, 27, 937–941. [Google Scholar] [CrossRef]
- Christensen, J.S. Dopant Diffusion in Si and SiGe; Mikroelektronik och Informationsteknik: Stockholm, Sweden, 2004. [Google Scholar]
- Giessen, V.B.; Vogel, R. About the Silicon-Phosphorus System. Z. Met. 1959, 50, 274. [Google Scholar]
- Olesinski, R.W.; Kanani, N.; Abbaschian, G.J. The P-Si (Phosphorus-Silicon) System. Bull. Alloy Phase Diagr. 1985, 6, 130–133. [Google Scholar] [CrossRef]
- Kooi, E. Formation and Composition of Surface Layers and Solubility Limits of Phosphorus During Diffusion in Silicon. J. Electrochem. Soc. 1964, 111, 1383. [Google Scholar] [CrossRef]
- Abrikosov, N.K.; Glazov, V.M.; Chen-Yuan, L. Individual and Joint Solubilities of Aluminum and Phosphorus in Germanium and Silicon. Russ. J. Lnorg. Chem. 1962, 7, 429–431. [Google Scholar]
- Uda, K.; Kamoshida, M. Annealing Characteristics of Highly P+-Ion-Implanted Silicon Crystal—Two-Step Anneal. J. Appl. Phys. 1977, 48, 18. [Google Scholar] [CrossRef]
- Solmi, S.; Parisini, A.; Angelucci, R.; Armigliato, A.; Nobili, D.; Moro, L. Dopant and Carrier Concentration in Si in Equilibrium with Monoclinic SiP Precipitates. Phys. Rev. B 1996, 53, 7836–7841. [Google Scholar] [CrossRef]
- Yoshida, M.; Arai, E.; Nakamura, H.; Terunuma, Y. Excess Vacancy Generation Mechanism at Phosphorous Diffusion into Silicon. J. Appl. Phys. 1974, 45, 1498–1501. [Google Scholar] [CrossRef]
- Tsai, J.C.C. Shallow Phosphorus Diffusion Profiles. IEEE 1969, 57, 1499–1506. [Google Scholar] [CrossRef]
- Tamura, M. Dislocation Networks in Phosphorus-Implanted Silicon. Philos. Mag. 1977, 35, 663–691. [Google Scholar] [CrossRef]
- Fogarassy, E.; Stuck, R.; Muller, J.C.; Grob, A.; Grob, J.J.; Siffert, P. Effects of Laser Irradiation on Phosphorus Diffused Layers in Silicon. J. Electron. Mater. 1980, 9, 197–209. [Google Scholar] [CrossRef]
- Mackintosh, I.M. The Diffusion of Phosphorus in Silicon. J. Electrochem. Soc. 1962, 109, 392. [Google Scholar] [CrossRef]
- Itoh, K.; Sasaki, Y.; Mitsuishi, T.; Miyao, M.; Tamura, M. Thermal Behavior of B, P and As Atoms in Supersaturated Si Produced by Ion Implantation and Pulsed-Laser Annealing. Jpn. J. Appl. Phys. 1982, 21, L245–L247. [Google Scholar] [CrossRef]
- Nobili, D.; Armigliato, A.; Finnetti, M.; Solmi, S. Precipitation as the Phenomenon Responsible for the Electrically Inactive Phosphorus in Silicon. J. Appl. Phys. 1982, 53, 1484. [Google Scholar] [CrossRef]
- Boeisenko, V.E.; Yudin, S.G. Steady-State Solubility of Substitutional Impurities in Silicon. Phys. Status Solidi 1987, 101, 123–127. [Google Scholar] [CrossRef]
- Safarian, J.; Tangstad, M. Phase Diagram Study of the Si-P System in Si-Rich Region. J. Mater. Res. 2011, 26, 1494–1503. [Google Scholar] [CrossRef]
- Jung, I.-H.; Zhang, Y. Thermodynamic Calculations for the Dephosphorization of Silicon Using Molten Slag. JOM 2012, 64, 973–981. [Google Scholar] [CrossRef]
- Liang, S.-M.; Schmid-Fetzer, R. Modeling of Thermodynamic Properties and Phase Equilibria of the Si-P System. J. Phase Equilib. Diffus. 2014, 35, 24–35. [Google Scholar] [CrossRef]
- Fritz, G.; Berkenhoff, H.O. Uber Ein Siliciumphosphid Si2P. Z. Anorg. Allg. Chem. 1959, 300, 205–209. [Google Scholar] [CrossRef]
- Wadsten, T. Preparative and Crystal-Structure Studies on Orthorhombic Silicon Monophosphide. Chem. Scr. 1975, 8, 63–69. [Google Scholar]
- SpringThorpe, A.J. The Preparation of Single Crystal Orthorhombic SiP2. Mater. Res. Bull. 1969, 4, 125–128. [Google Scholar] [CrossRef]
- Ntep, J.-M.; Said Hassani, S.; Lusson, A.; Tromson-Carli, A.; Ballutaud, D.; Didier, G.; Triboulet, R. ZnO Growth by Chemical Vapour Transport. J. Cryst. Growth 1999, 207, 30–34. [Google Scholar] [CrossRef]
- Carlsson, J.R.A. A New Silicon Phosphide, Si12P5: Formation Conditions, Structure, and Properties. J. Vac. Sci. Technol. A Vac. Surf. Films 1997, 15, 394. [Google Scholar] [CrossRef]
- Zaitsev, A.I.; Shelkova, N.E.; Kodentsov, A.A. Thermodynamic Properties and Phase Equilibria in the Silicon-Phosphorous System. J. Phase Equilib. 2000, 21, 528–533. [Google Scholar] [CrossRef]
- Gurvich, L.V. Ivtantermo-Automatic Data System on Thermodynamic Properties of Substances. Vestn. Akad. Nauk SSSR 1983, 3, 54–65. [Google Scholar]
- The Japan Society for Promotion of Science. The 19th Committee in Steelmaking: Steelmaking Data Sourcebook; Gordon and Beach Science Publishers: New York, NY, USA, 1988. [Google Scholar]
- Pelton, A.D.; Degterov, S.A.; Eriksson, G.; Robelin, C.; Dessureault, Y. The Modified Quasichemical Model I—Binary Solutions. Metall. Mater. Trans. B 2000, 31, 651–659. [Google Scholar] [CrossRef]
- Hillert, M. The Compound Energy Formalism. J. Alloy. Compd. 2001, 320, 161–176. [Google Scholar] [CrossRef]
- Ugai, Y.A.; Sokolov, L.I.; Goncharov, E.G.; Makarov, V.S. PTx Composition Diagram and Thermodynamics of Phase Equilibrium in the Silicon-Phosphorus System. Russ. J. Inorg. Chem. 1987, 32, 727–729. [Google Scholar]
- Knacke, O.; Kubaschewski, O.; Hesselmann, K. Thermochemical Properties of Inorganic Substances, 2nd ed.; Springer: Berlin, Germany, 1991. [Google Scholar]
- Philipp, F.; Schmidt, P. The Cationic Clathrate Si46−2xP2xTex Crystal Growth by Chemical Vapour Transport. J. Cryst. Growth 2008, 310, 5402–5408. [Google Scholar] [CrossRef]
- Wilmsen, C.W. Physics and Chemistry of III-V Compound Semiconductor Interfaces; Wilmsen, C.W., Ed.; Springer: Boston, MA, USA, 1985. [Google Scholar]
- Arutyunyan, N.A.; Zaitsev, A.I.; Shaposhnikov, N.G. Analysis of Thermodynamic Properties and Phase Equilibria in the Si-P System. Russ. J. Phys. Chem. A 2011, 85, 911–915. [Google Scholar] [CrossRef]
- Knudsen, M. Die Gesetze Der Molekularströmung Und Der Inneren Reibungsströmung Der Gase Durch Röhren. Ann. Phys. 1909, 333, 75–130. [Google Scholar] [CrossRef]
- Olesinski, R.W.; Abbaschian, G.J. The Sb-Si (Antimony-Silicon) System. Bull. Alloy Phase Diagr. 1985, 6, 445–448. [Google Scholar] [CrossRef]
- Malmeja, Y.; Desré, P.; Bonnier, E. Contribution to the Ternary Phase Diagram of Ge-Si-Sb. Mém. Sci. Rev. Métall. Fr. 1972, 69, 565–577. [Google Scholar]
- Rohan, J.J.; Pickering, N.E.; Kennedy, J. Diffusion of Radioactive Antimony in Silicon. J. Electrochem. Soc. 1959, 106, 705. [Google Scholar] [CrossRef]
- Wang, J.; Liu, Y.J.; Liu, L.B.; Zhou, H.Y.; Jin, Z.P. Thermodynamic Modeling of the Au-Sb-Si Ternary System. J. Alloy. Compd. 2011, 509, 3057–3064. [Google Scholar] [CrossRef]
- Nobili, D. Equilibrium Carrier Density and Solubility of Antimony in Silicon. J. Electrochem. Soc. 1989, 136, 1142. [Google Scholar] [CrossRef]
- Zhao, B.; Zhou, J.; Chen, Y. Numerical Simulation of the Impurity Photovoltaic Effect in Silicon Solar Cells Doped with Thallium. Phys. B Condens. Matter 2010, 405, 3834–3837. [Google Scholar] [CrossRef]
- Tamaru, S. Metallographische Mitteilungen Aus Dem Institut Für Physikalische Chemie Der Universität Göttingen. LXIX. Über Die Legierungen Des Siliciums Mit Zinn, Blei Und Thallium. Z. Anorg. Chem. 1909, 61, 40–45. [Google Scholar] [CrossRef]
- Predel, B. Si-Tl (Silicon-Thallium). In Pu-Re—Zn-Zr; Madelung, O., Ed.; Springer: Berlin/Heidelberg, Germany, 1985; p. 1. [Google Scholar]
- Schmit, J.L.; Scott, M.W. Growth of Thallium-Doped Silicon from a Tin-Thallium Solution. U.S. Patent Application No. 4,270,973, 2 June 1981. [Google Scholar]
- Ghoshtagore, R.N. Dopant Diffusion in Silicon. III. Acceptors. Phys. Rev. B 1971, 3, 2507–2514. [Google Scholar] [CrossRef]
- Burton, J.A.; Kolb, E.D.; Slichter, W.P.; Struthers, J.D. Distribution of Solute in Crystals Grown from the Melt. Part II. Experimental. J. Chem. Phys. 1953, 21, 1991. [Google Scholar] [CrossRef]
- Cordero, B.; Gómez, V.; Platero-Prats, A.E.; Revés, M.; Echeverría, J.; Cremades, E.; Barragán, F.; Alvarez, S. Covalent Radii Revisited. Dalton Trans. 2008, 21, 2832. [Google Scholar] [CrossRef] [PubMed]
Figure 1.
(a) Interstitial, (b) Vacancy and (c) interstitialcy diffusion mechanisms.

Figure 2.
Determination of the distribution coefficient using a phase diagram.

Figure 3.
The Al-Si phase diagram redrawn after [58]; -----: [59]; +: [65]; ○: [76]; □: [77]; Δ: [78]; ▽: [79]; ⃟: [80]; ●: [81]; ■: [82]; ▲: [83,84]; ▼: [85]; ♦: [86].

Figure 4.
Al-rich side of the Al-Si phase diagram [58]; ----: [59]; ×: [60]; *: [61]; ○: [62]; □: [63]; Δ: [64]; +: [65].

Figure 5.
Magnified part of the Si-rich side of the Al-Si phase diagram; ―: [58]; -----: [59]; -·-·-: [87]; ····: [88]; ■: [29]; ●: [65]; □: [68]; ○: [69]; Δ (EPMA): [70], ▼ (Hall measurements): [70]; ⃟: [89].

Figure 6.
(a) Calculated enthalpy of mixing of the Al-Si liquid; ―: [99] at 1600 °C; ○: [104] at 1600 °C; □: [103] at 1547 °C; Δ: [102] at 1427 °C; -·-·-: [58]; -----: [66]; ····· : [105] at 1427 °C and (b) Calculated activity of Al and Si in the Al-Si liquid at 1427 °C; -----: [99] at 1600 °C; ○: [106]; □: [107] and Δ: [100] at 1427 °C; ■: [103] at 1547 °C; ▲: [108] at 1700 °C.


Figure 8.
Magnified part of the As-Si phase diagram; —: [105]; ----: [112]; □: [117]; ▽: [118]; ⃟: [126]; ○: [130]; Δ: [131].

Figure 9.
(a) Enthalpy of mixing of the As-Si liquid and (b) activity of As and Si in the As-Si liquid calculated in this work at 1600 °C using FactSage® software [124].
Figure 9.
(a) Enthalpy of mixing of the As-Si liquid and (b) activity of As and Si in the As-Si liquid calculated in this work at 1600 °C using FactSage® software [124].


Figure 11.
Magnified part of the B-Si system near the Si-rich side [155]; ----: [142]; Δ: [118]; ■: [157]; □: [144]; ▽: [145]; ⃟: [146]; ○: [148].

Figure 12.
(a) Enthalpy of mixing of the B-Si liquid; —: [143]; □: [166,168] and ○: [150,165] at 1600 °C; -----: [167] at 2127 °C; (b) Average activity values of B and Si in the B-Si liquid; boron (□) and silicon (○) [142] at 1577 °C; ----: [167] at 2127 °C.

Figure 13.
Enthalpy of formation of intermetallic compounds of the B-Si phase diagram; □: [155]; ○: [153]; Δ: [169]; ▽: [170]; ⃟: [171]; ✰: [142]; ◁: [148].


Figure 15.
Magnified part of the Bi-Si system in the Si-rich side [50]; ----: [124]; ○: [179]; □: [118].

Figure 16.
The temperature dependence of the diffusion coefficients, DBi, in silicon; □: [179]; ○: [180]; Δ: [181].

Figure 17.
(a) Calculated enthalpy of mixing of the Bi-Si liquid [124] at 2600 °C; ―: [50]; ----: [120] and (b) calculated activity of Bi and Si in the Bi-Si liquid at 1414 °C and 2600 °C [124].


Figure 20.
(a) Enthalpy of mixing of the Ga-Si liquid at 1477 °C; ―: [185]; □: [195] and [196] at 1487 ± 5 °C; -·-·- : [121]; -··-··-: [120]; -----: [122]; ▽: [197]; ···· : [51] at >1414 °C and (b) Activity of gallium and silicon in the Ga-Si liquid; ―: [185]; -·-·-: [196] and ------ : [67] at 1477 °C.

Figure 21.
The calculated In-Si phase diagram ―: [124] based on the assessment of [52]; ○: [186]; □: [120]; Δ: [188]; ▽: [178].


Figure 23.
(a) Enthalpy of mixing of In-Si melts at 1427 °C [52]; -·-·-: [121]; ····: [120]; -----: [66] at 1427 °C and (b) Activity of In and Si in the liquid In-Si phase [124,210]; -----: [67] at 1427 °C.

Figure 24.
The N-Si binary phase diagram calculated by Ma et al. [214] at 1 atm; ○: [221]; □: [223].

Figure 25.
The N-Si partial phase diagram for the extremely low N concentration after Yatsurugi et al. [32].
Figure 25.
The N-Si partial phase diagram for the extremely low N concentration after Yatsurugi et al. [32].

Figure 26.
Crystal structure and unit cell of (a) αSi3N4, (b) βSi3N4, showing the hexagonal symmetry, and (c) γSi3N4.
Figure 26.
Crystal structure and unit cell of (a) αSi3N4, (b) βSi3N4, showing the hexagonal symmetry, and (c) γSi3N4.

Figure 27.
The calculated condensed N-Si phase diagram at 7.5 × 10⁹ Pa [214].
Figure 27.
The calculated condensed N-Si phase diagram at 7.5 × 10⁹ Pa [214].

Figure 28.
Assessed Si-terminal solid solution in relation to the available data; -·-·-·-: [242]; □: [118]; ■: [241]; Δ: [243]; ⃟: [244]; ▽: [245]; ×: [246]; +: [247]; ▲: [248]; *: [250]; ▼: [252]; ○: [249]; ♦: [253]; ◄: [254]; ●: [255].


Figure 30.
(a) Calculated enthalpy of mixing of the P-Si liquid at 1427 °C; ----: [55]; (b) activity of Si and P in the P-Si liquid at 1427 °C; ----: [55]; □ and Δ: [263].

Figure 31.
The calculated Sb-Si binary phase diagram by Wang et al. [277]; ○: [177]; □: [275]; Δ: [120]; ⃟: [178].

Figure 32.
Magnified portion of the calculated Sb-Si phase diagram [277]; ----: [274]; Δ: [179]; ○: [276]; □: [118]; ⃟: [278].

Figure 33.
(a) Enthalpy of mixing of the Sb-Si liquid at 1427 °C; -----: [121]; ···· : [120]; ˗·˗·˗: [274]; ˗··˗··˗: [66] and (b) activity of Sb and Si in the Sb-Si liquid at 1477 °C [277]; ----: [56]; ····: [67].


Figure 35.
Calculated enthalpy of mixing of the Si-Tl liquid using thermodynamic coefficients from [120].
Figure 35.
Calculated enthalpy of mixing of the Si-Tl liquid using thermodynamic coefficients from [120].

Figure 36.
Summary of solid solubility of impurity atoms in silicon.

Figure 37.
Distribution coefficients vs. tetrahedral radii of impurity atoms (except N) at the melting point of silicon.
Figure 37.
Distribution coefficients vs. tetrahedral radii of impurity atoms (except N) at the melting point of silicon.

Figure 38.
Summary of diffusivity of the studied elements in silicon. The parameters used in the diffusion equation are listed in the embedded table.
Figure 38.
Summary of diffusivity of the studied elements in silicon. The parameters used in the diffusion equation are listed in the embedded table.


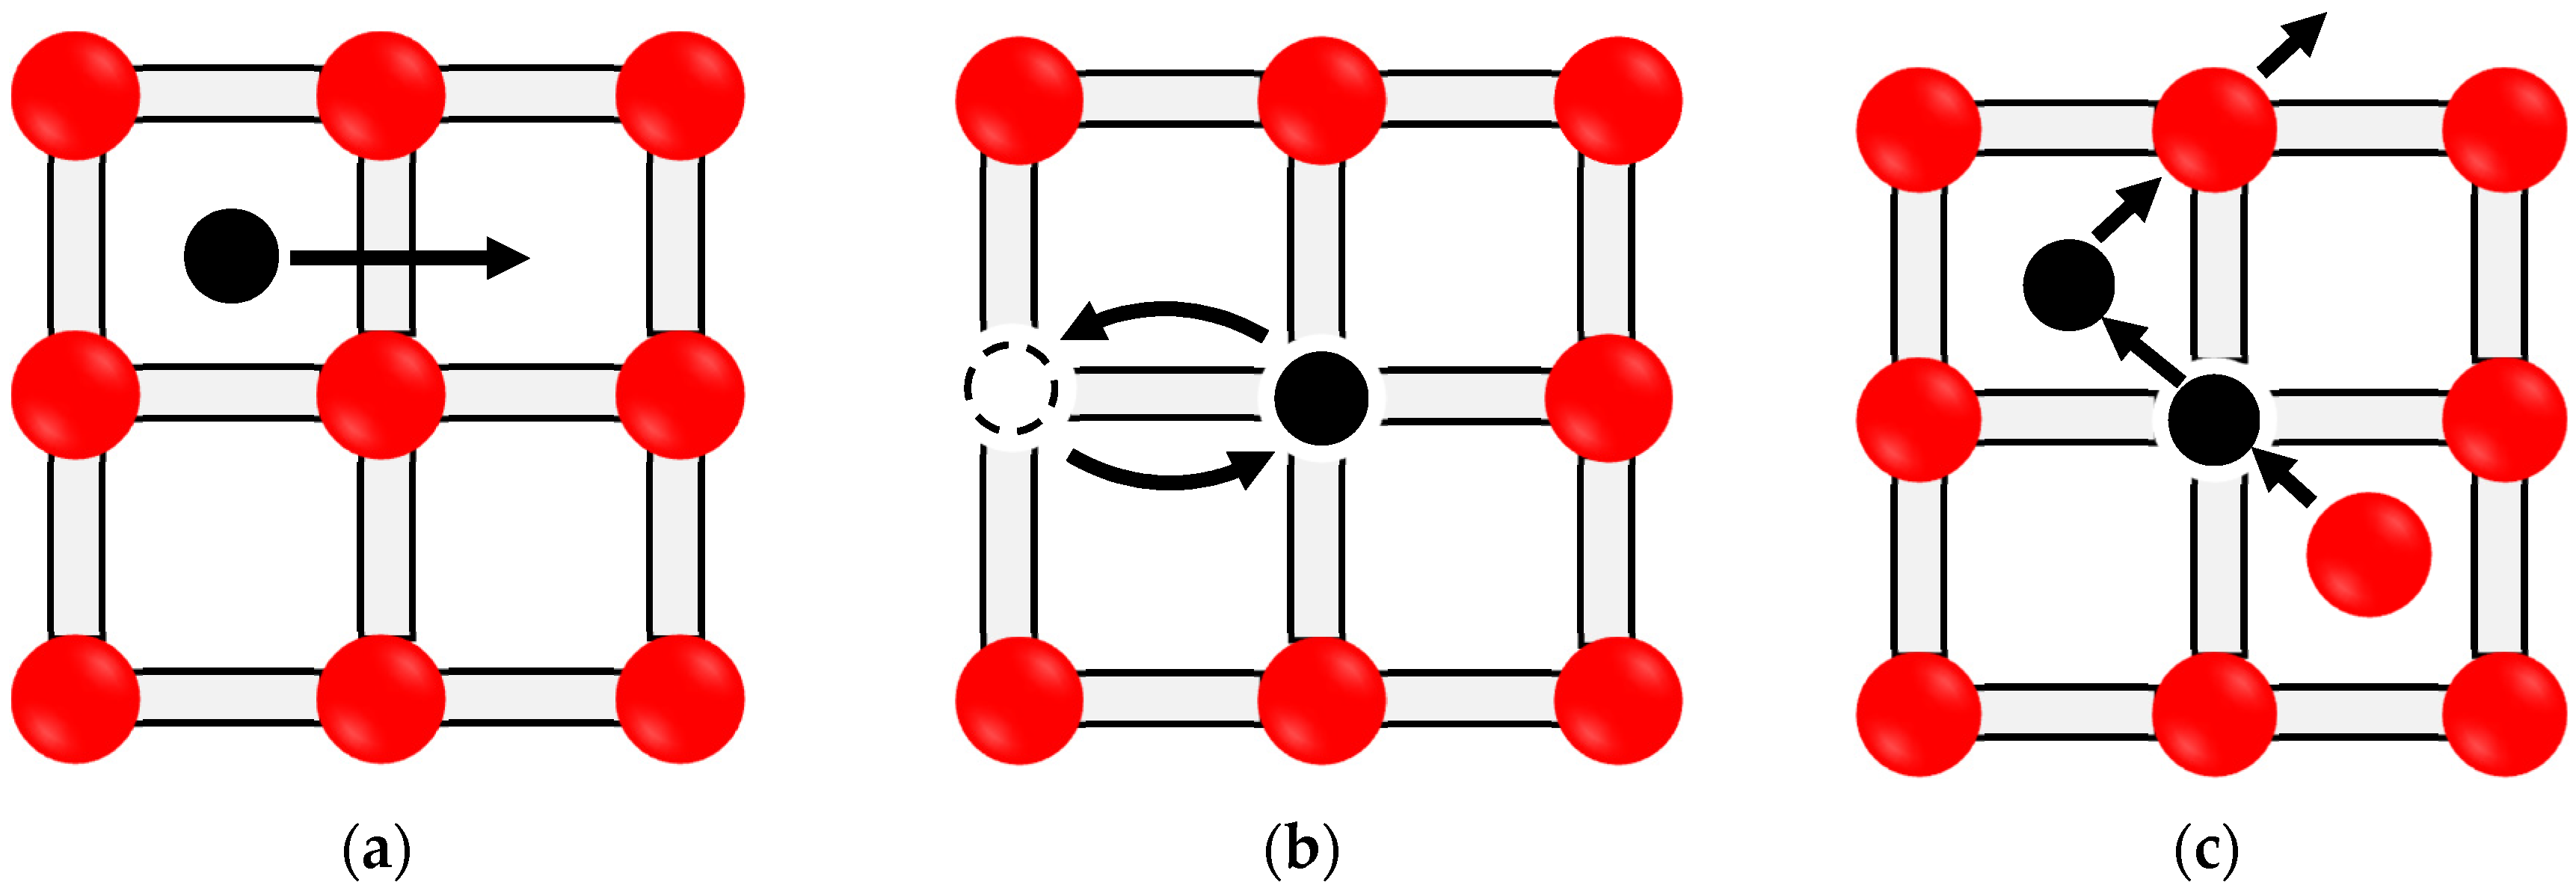
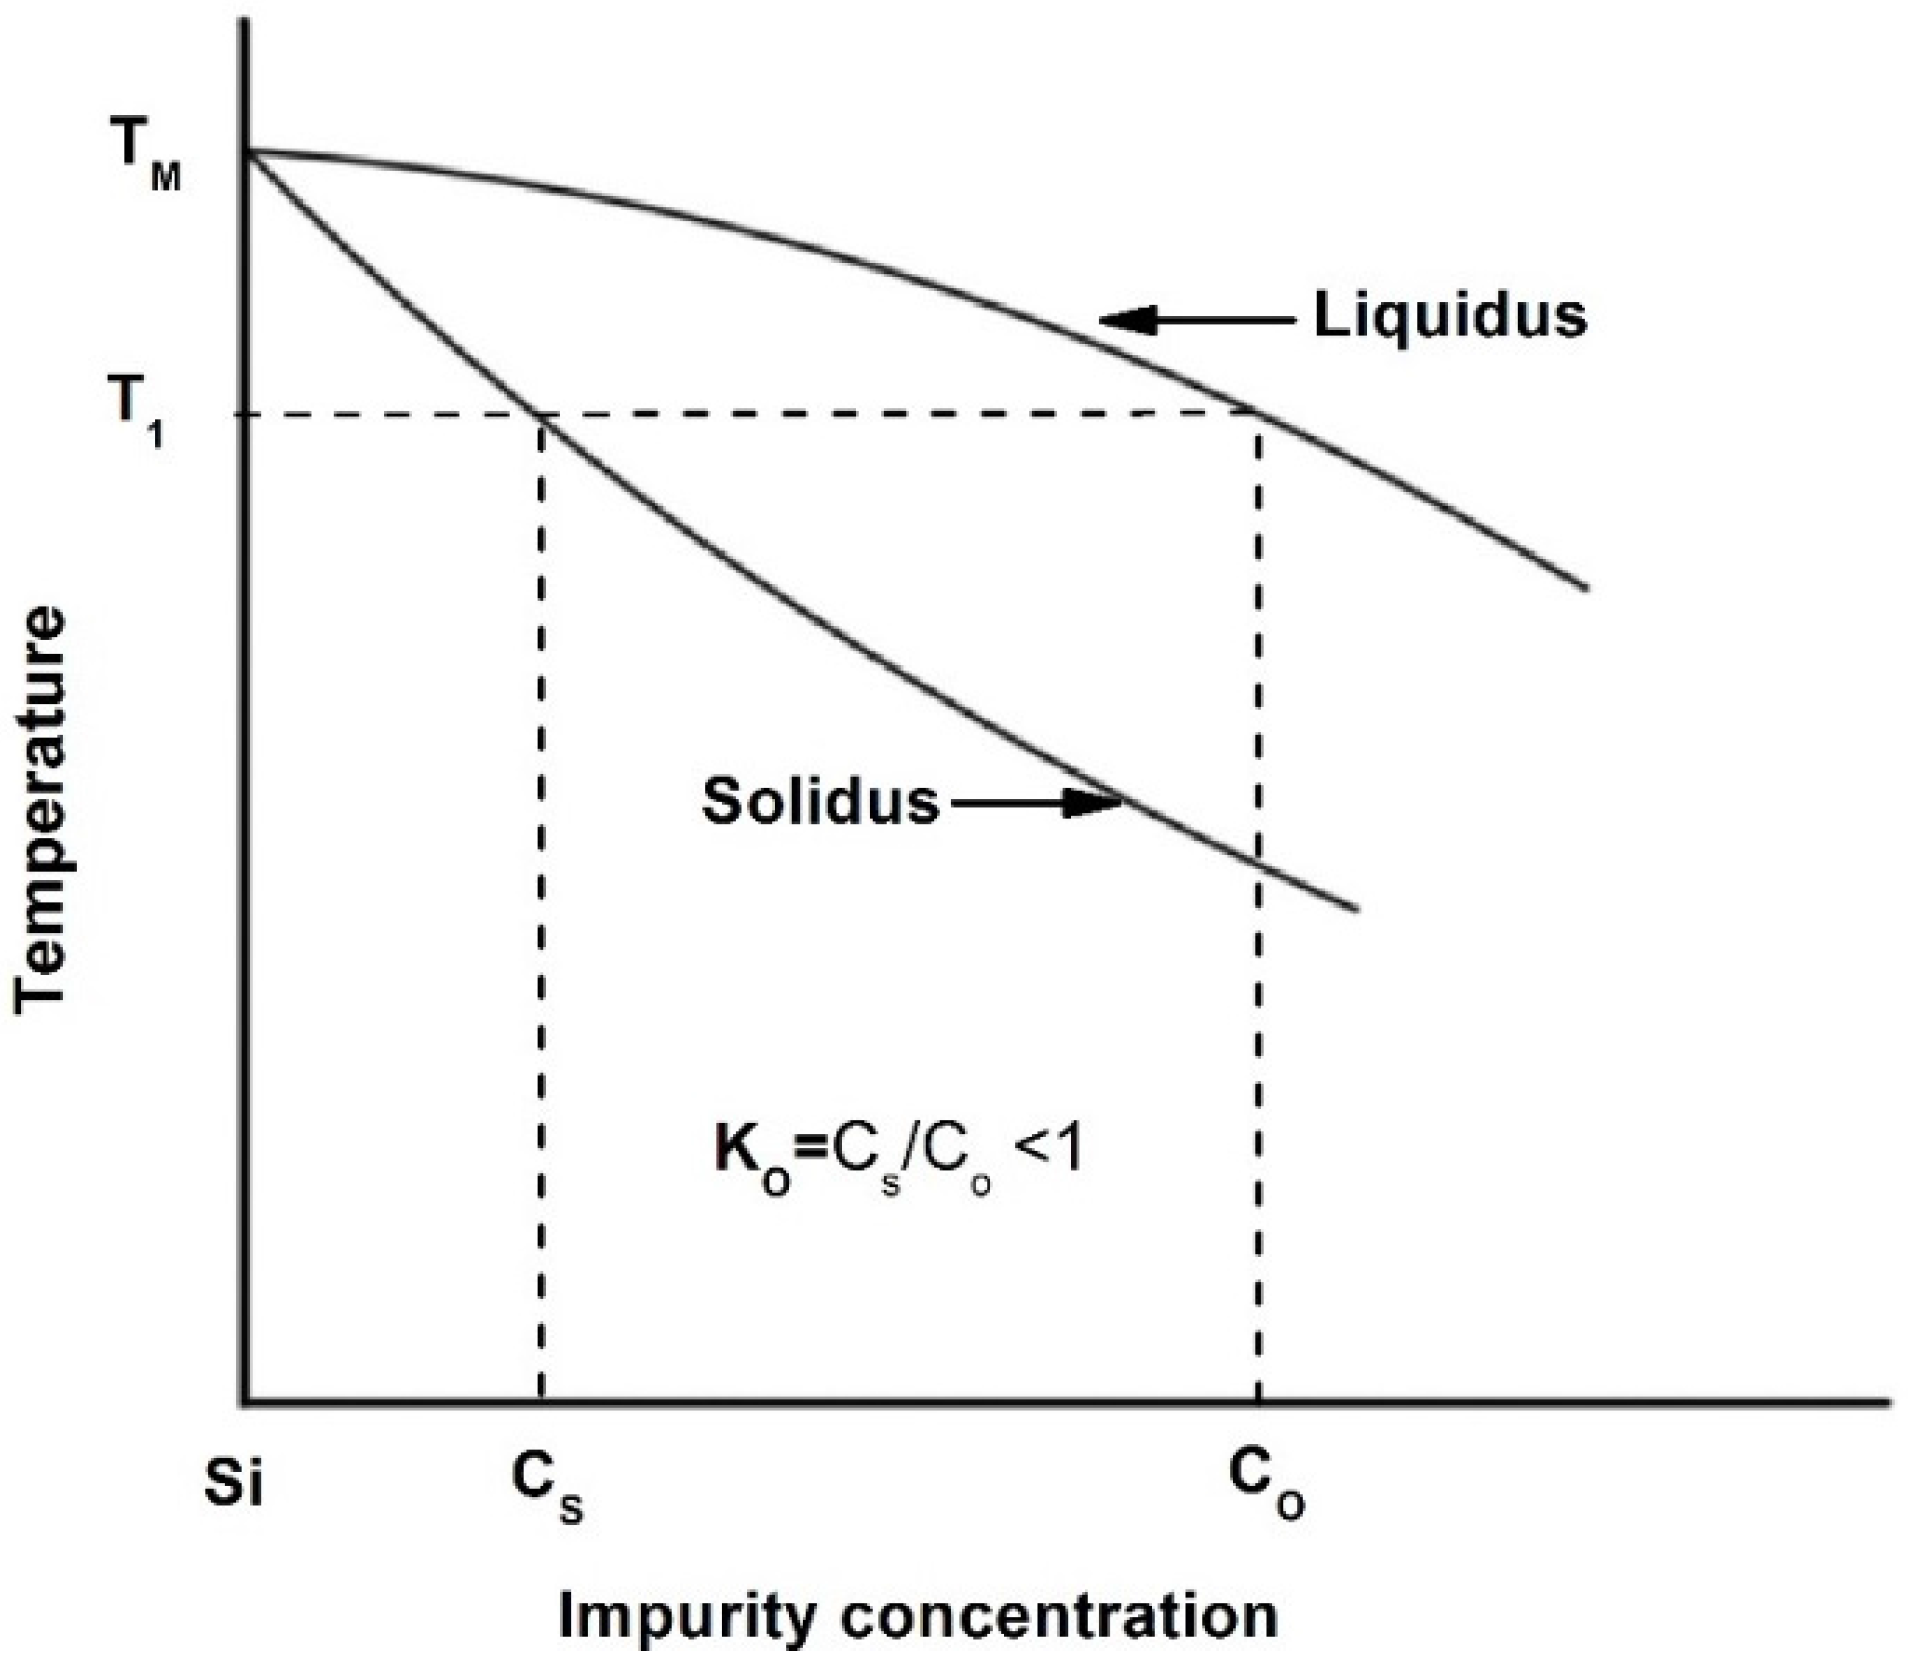
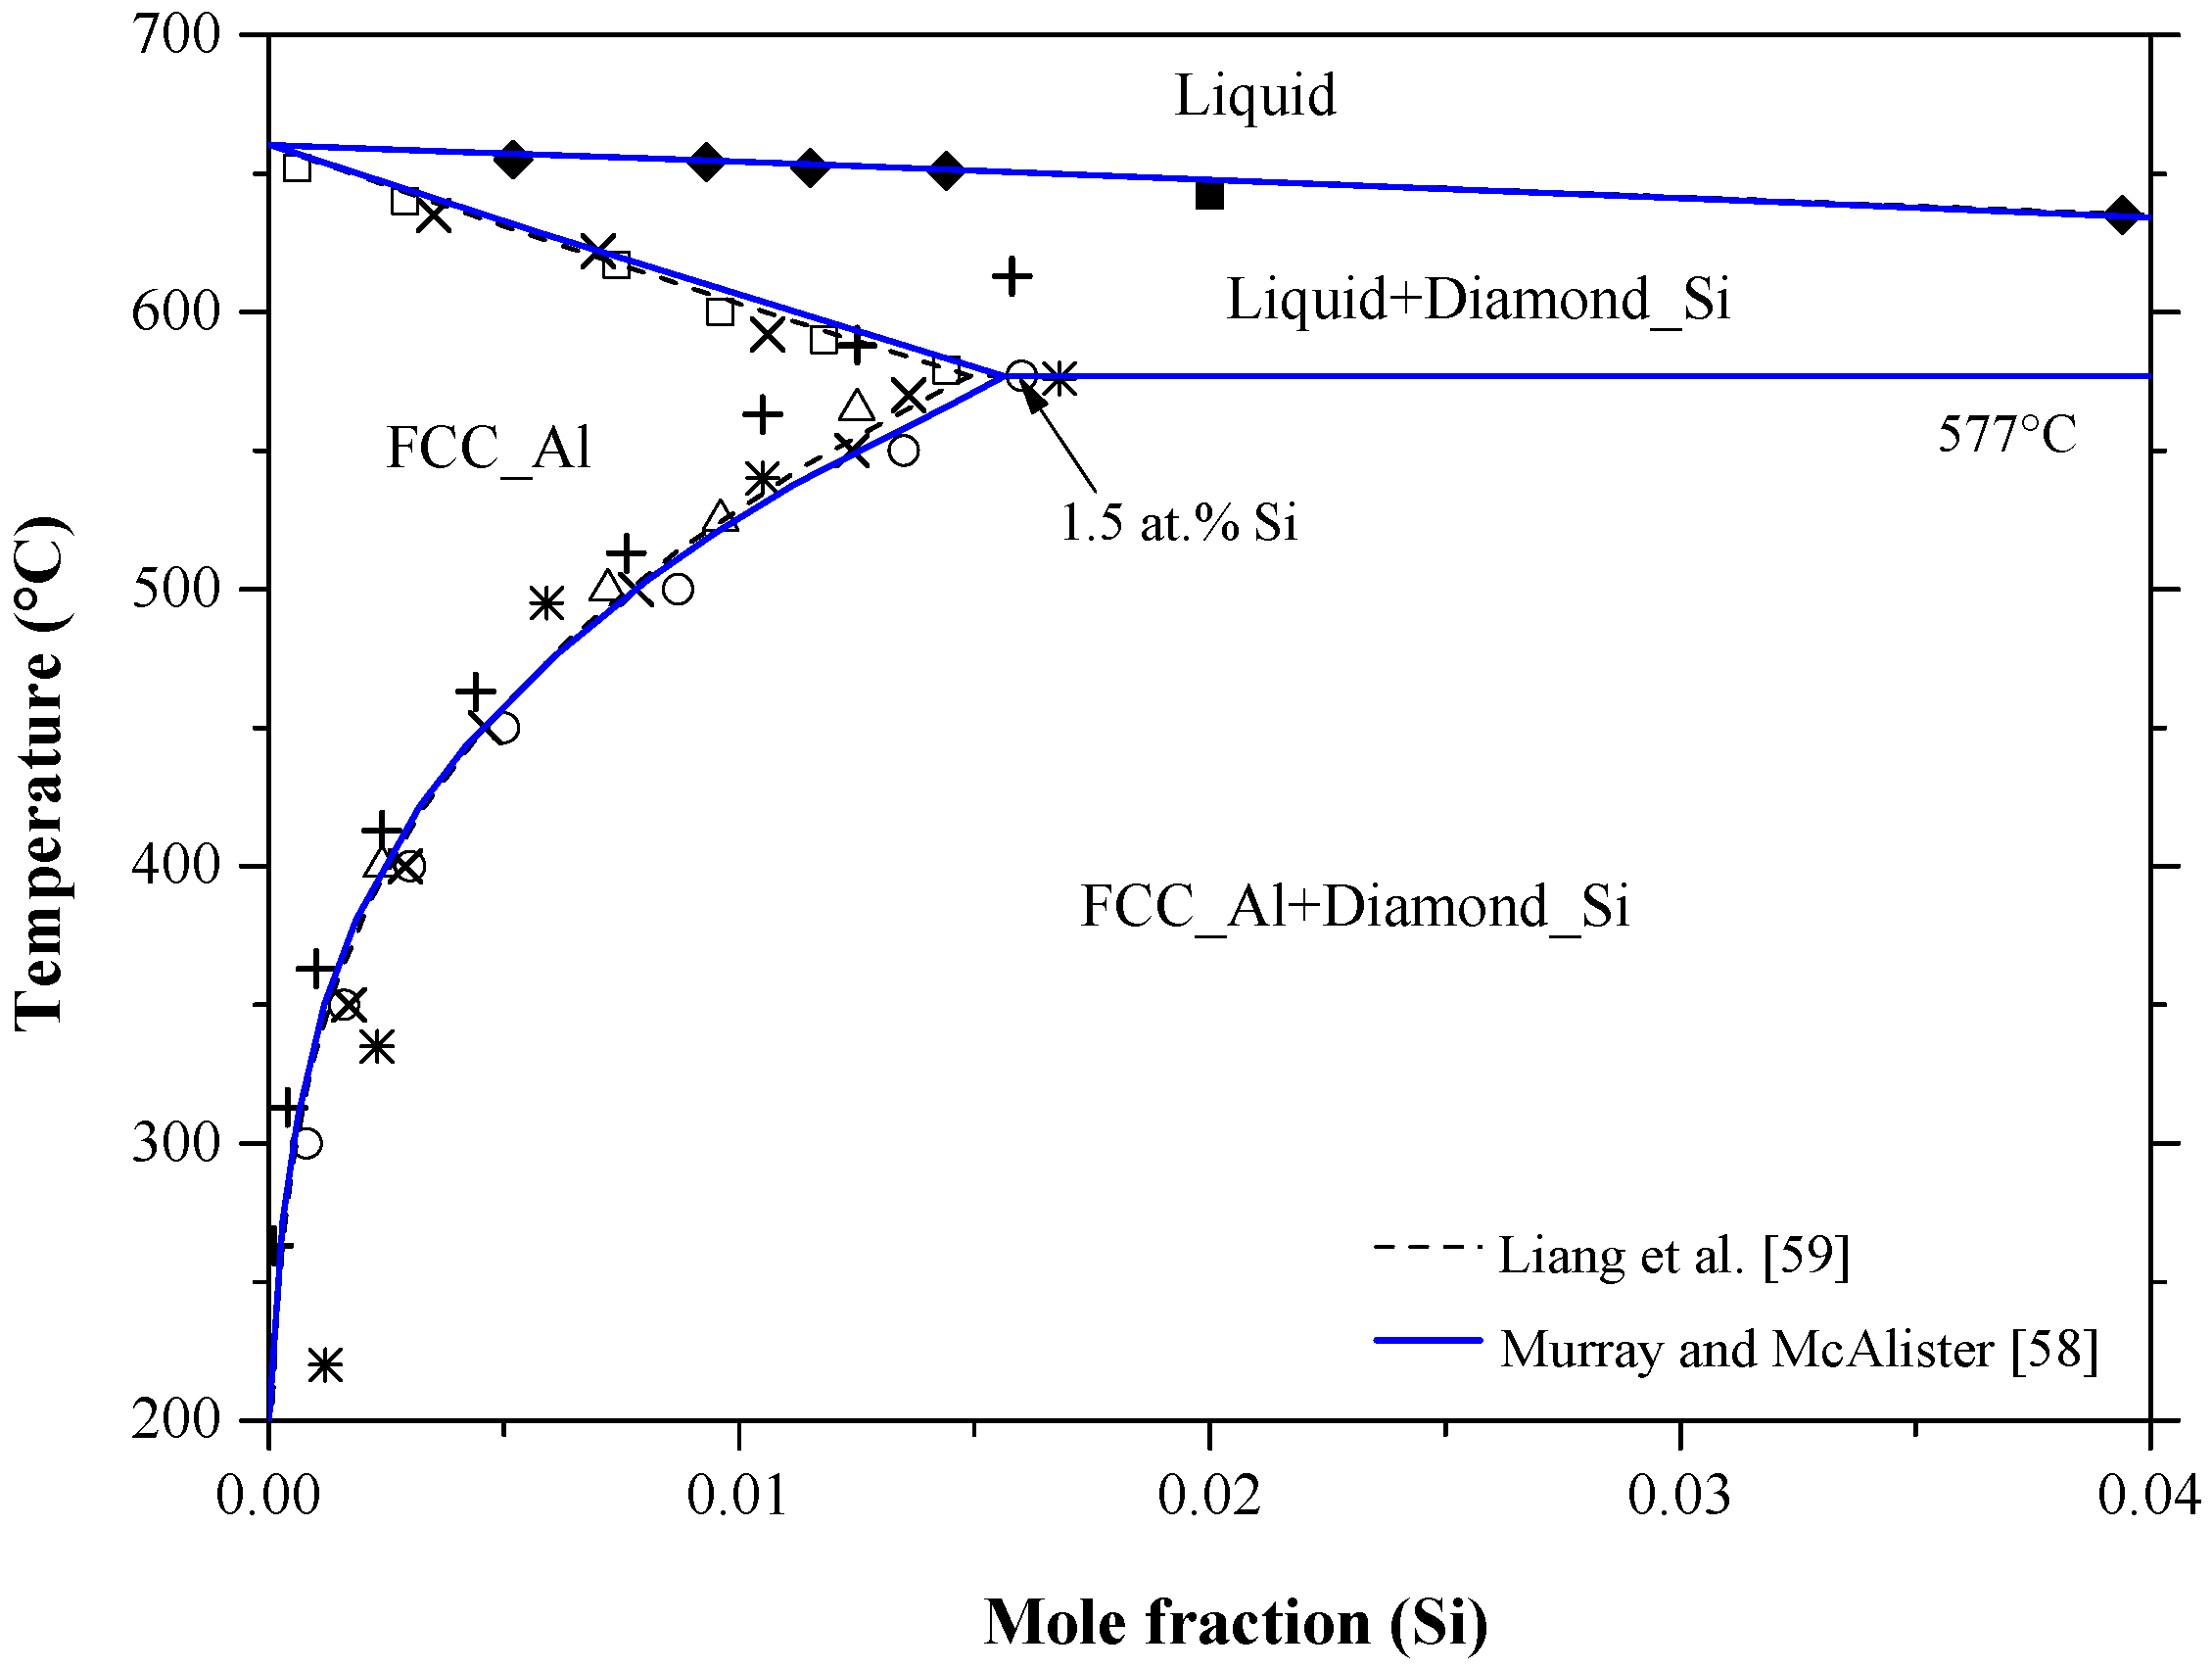
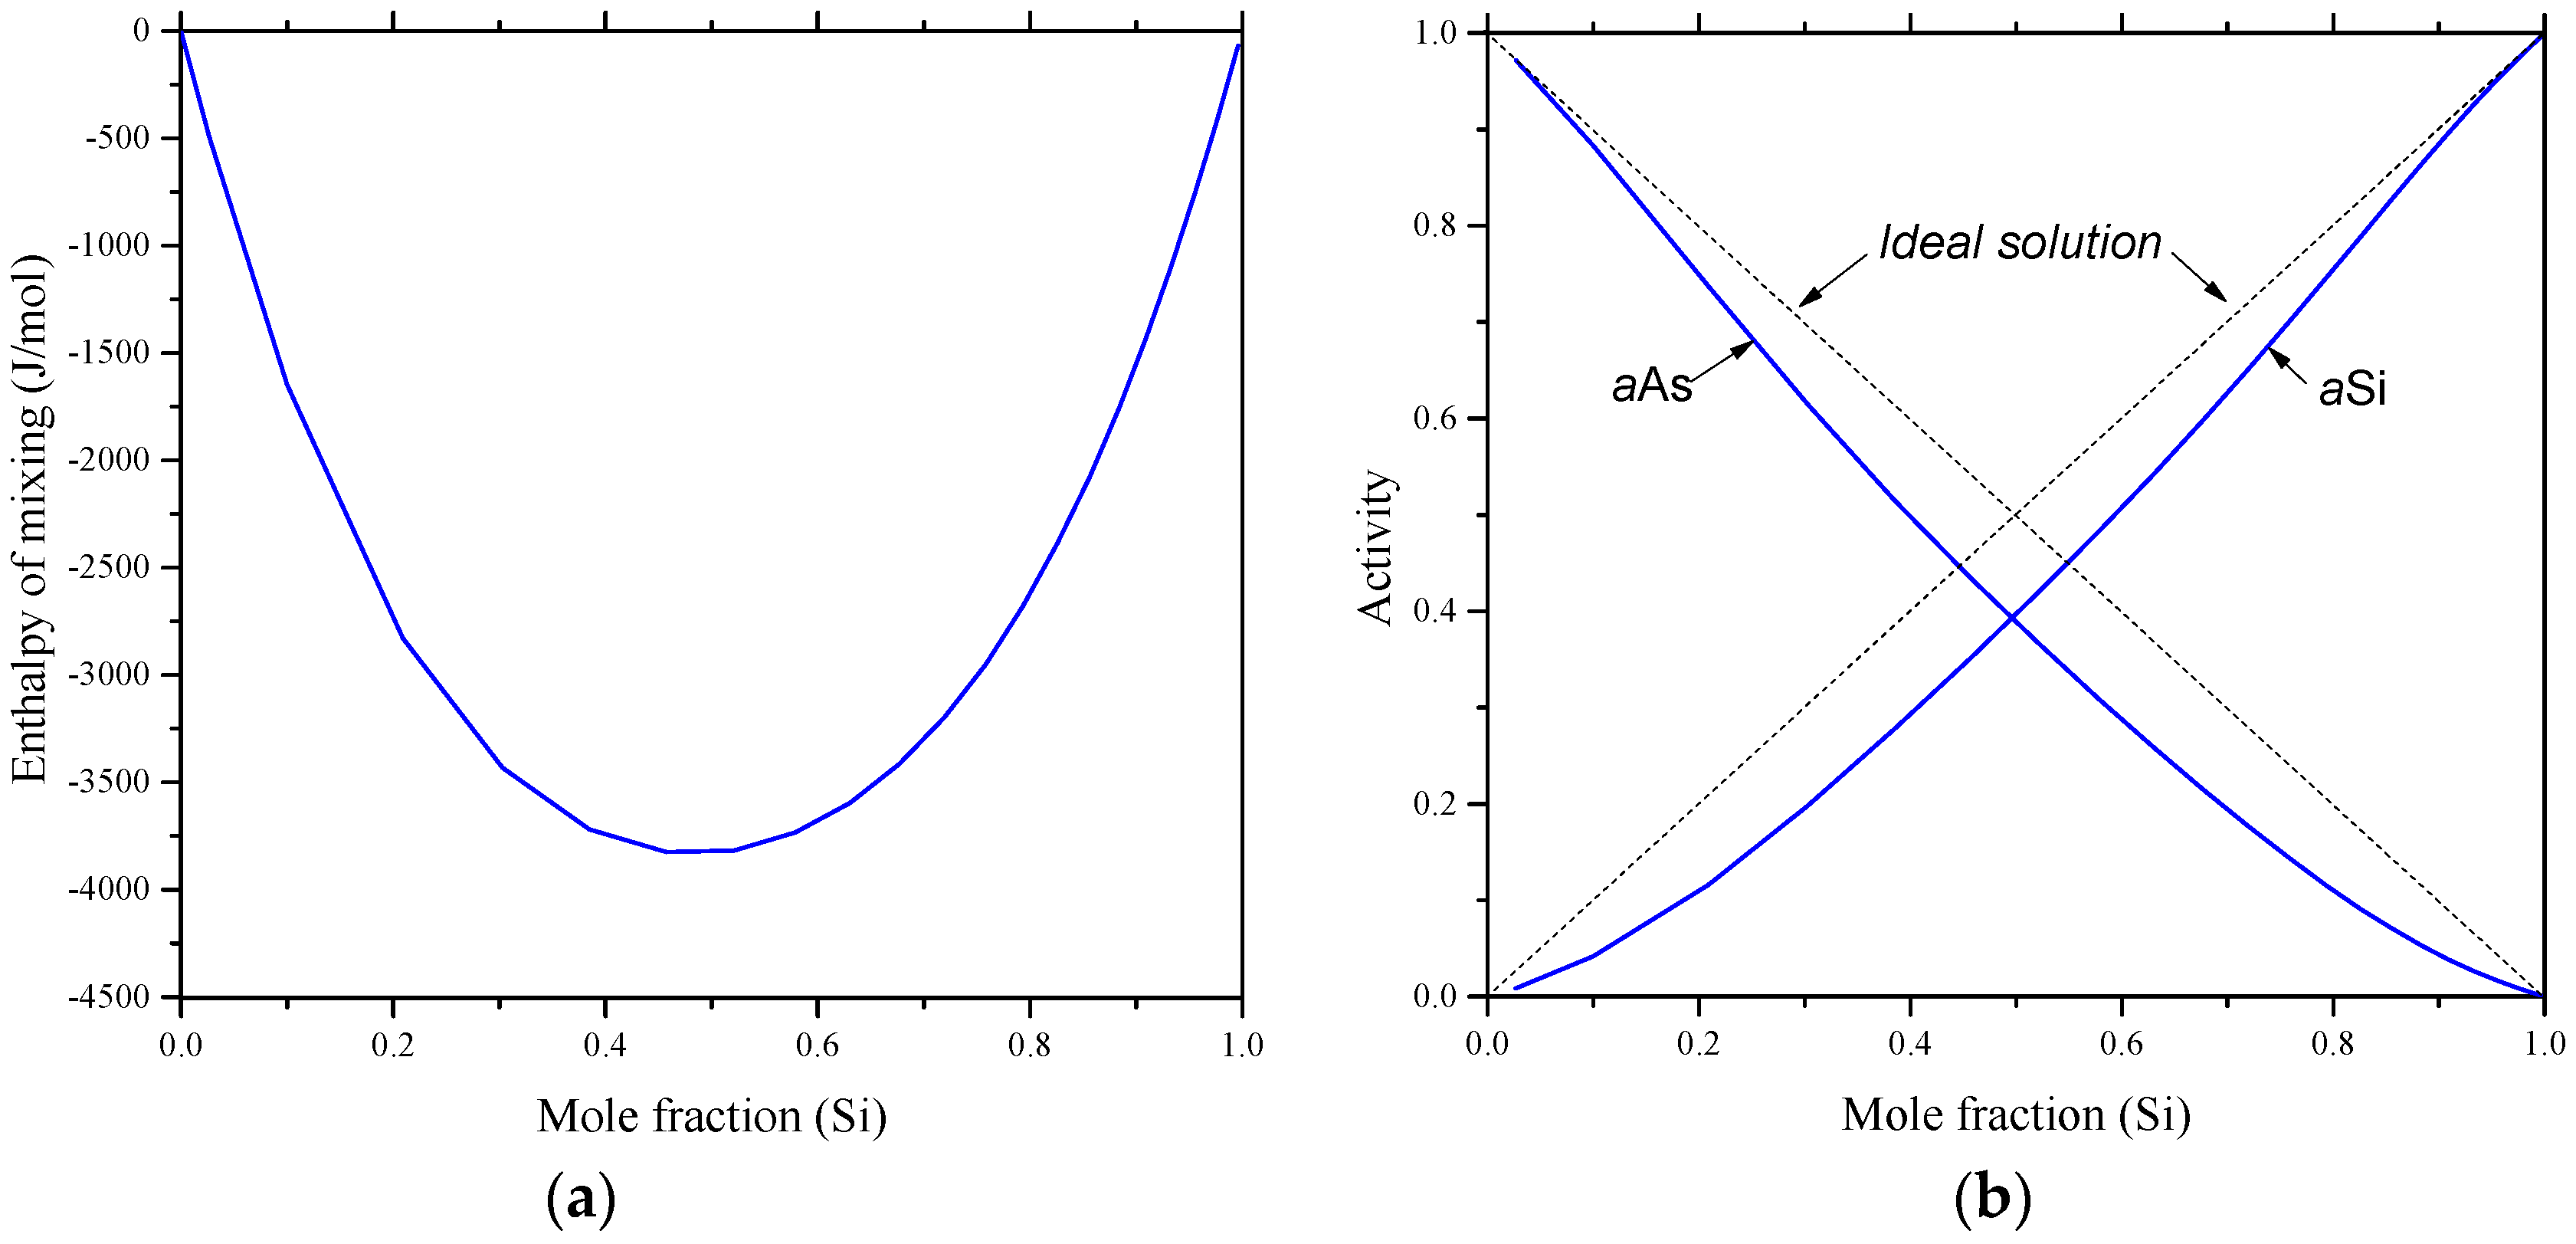
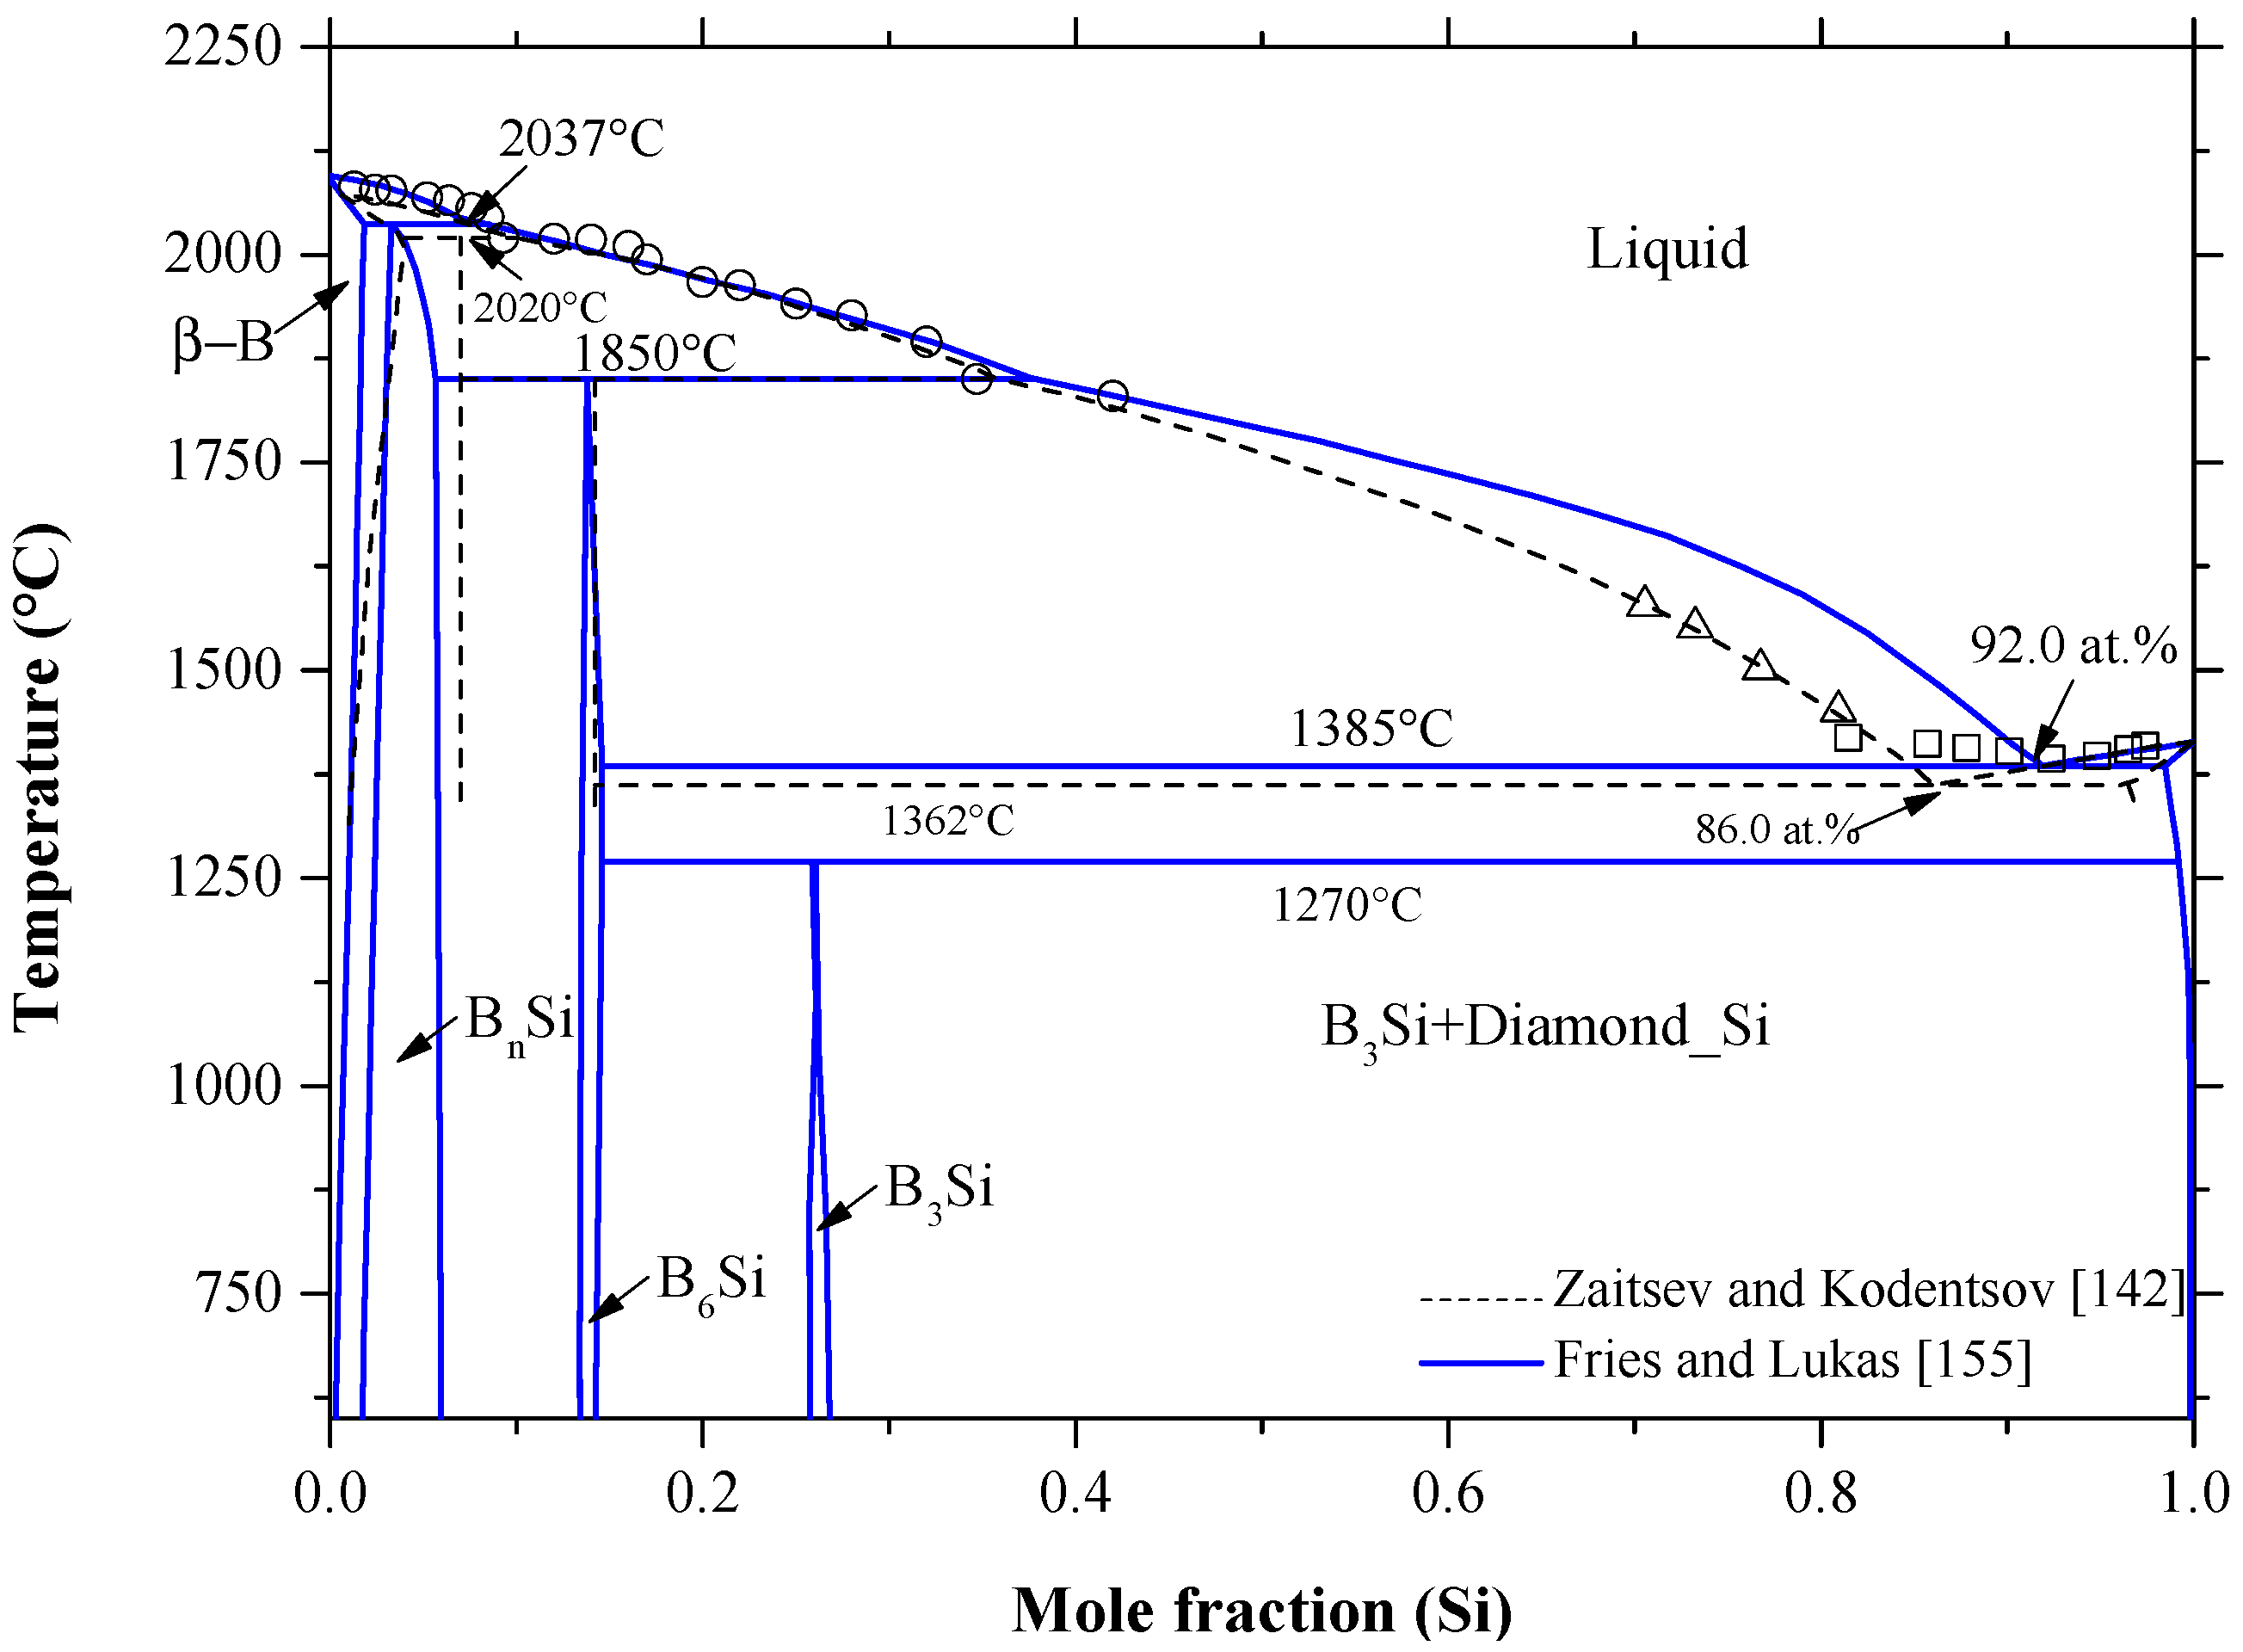
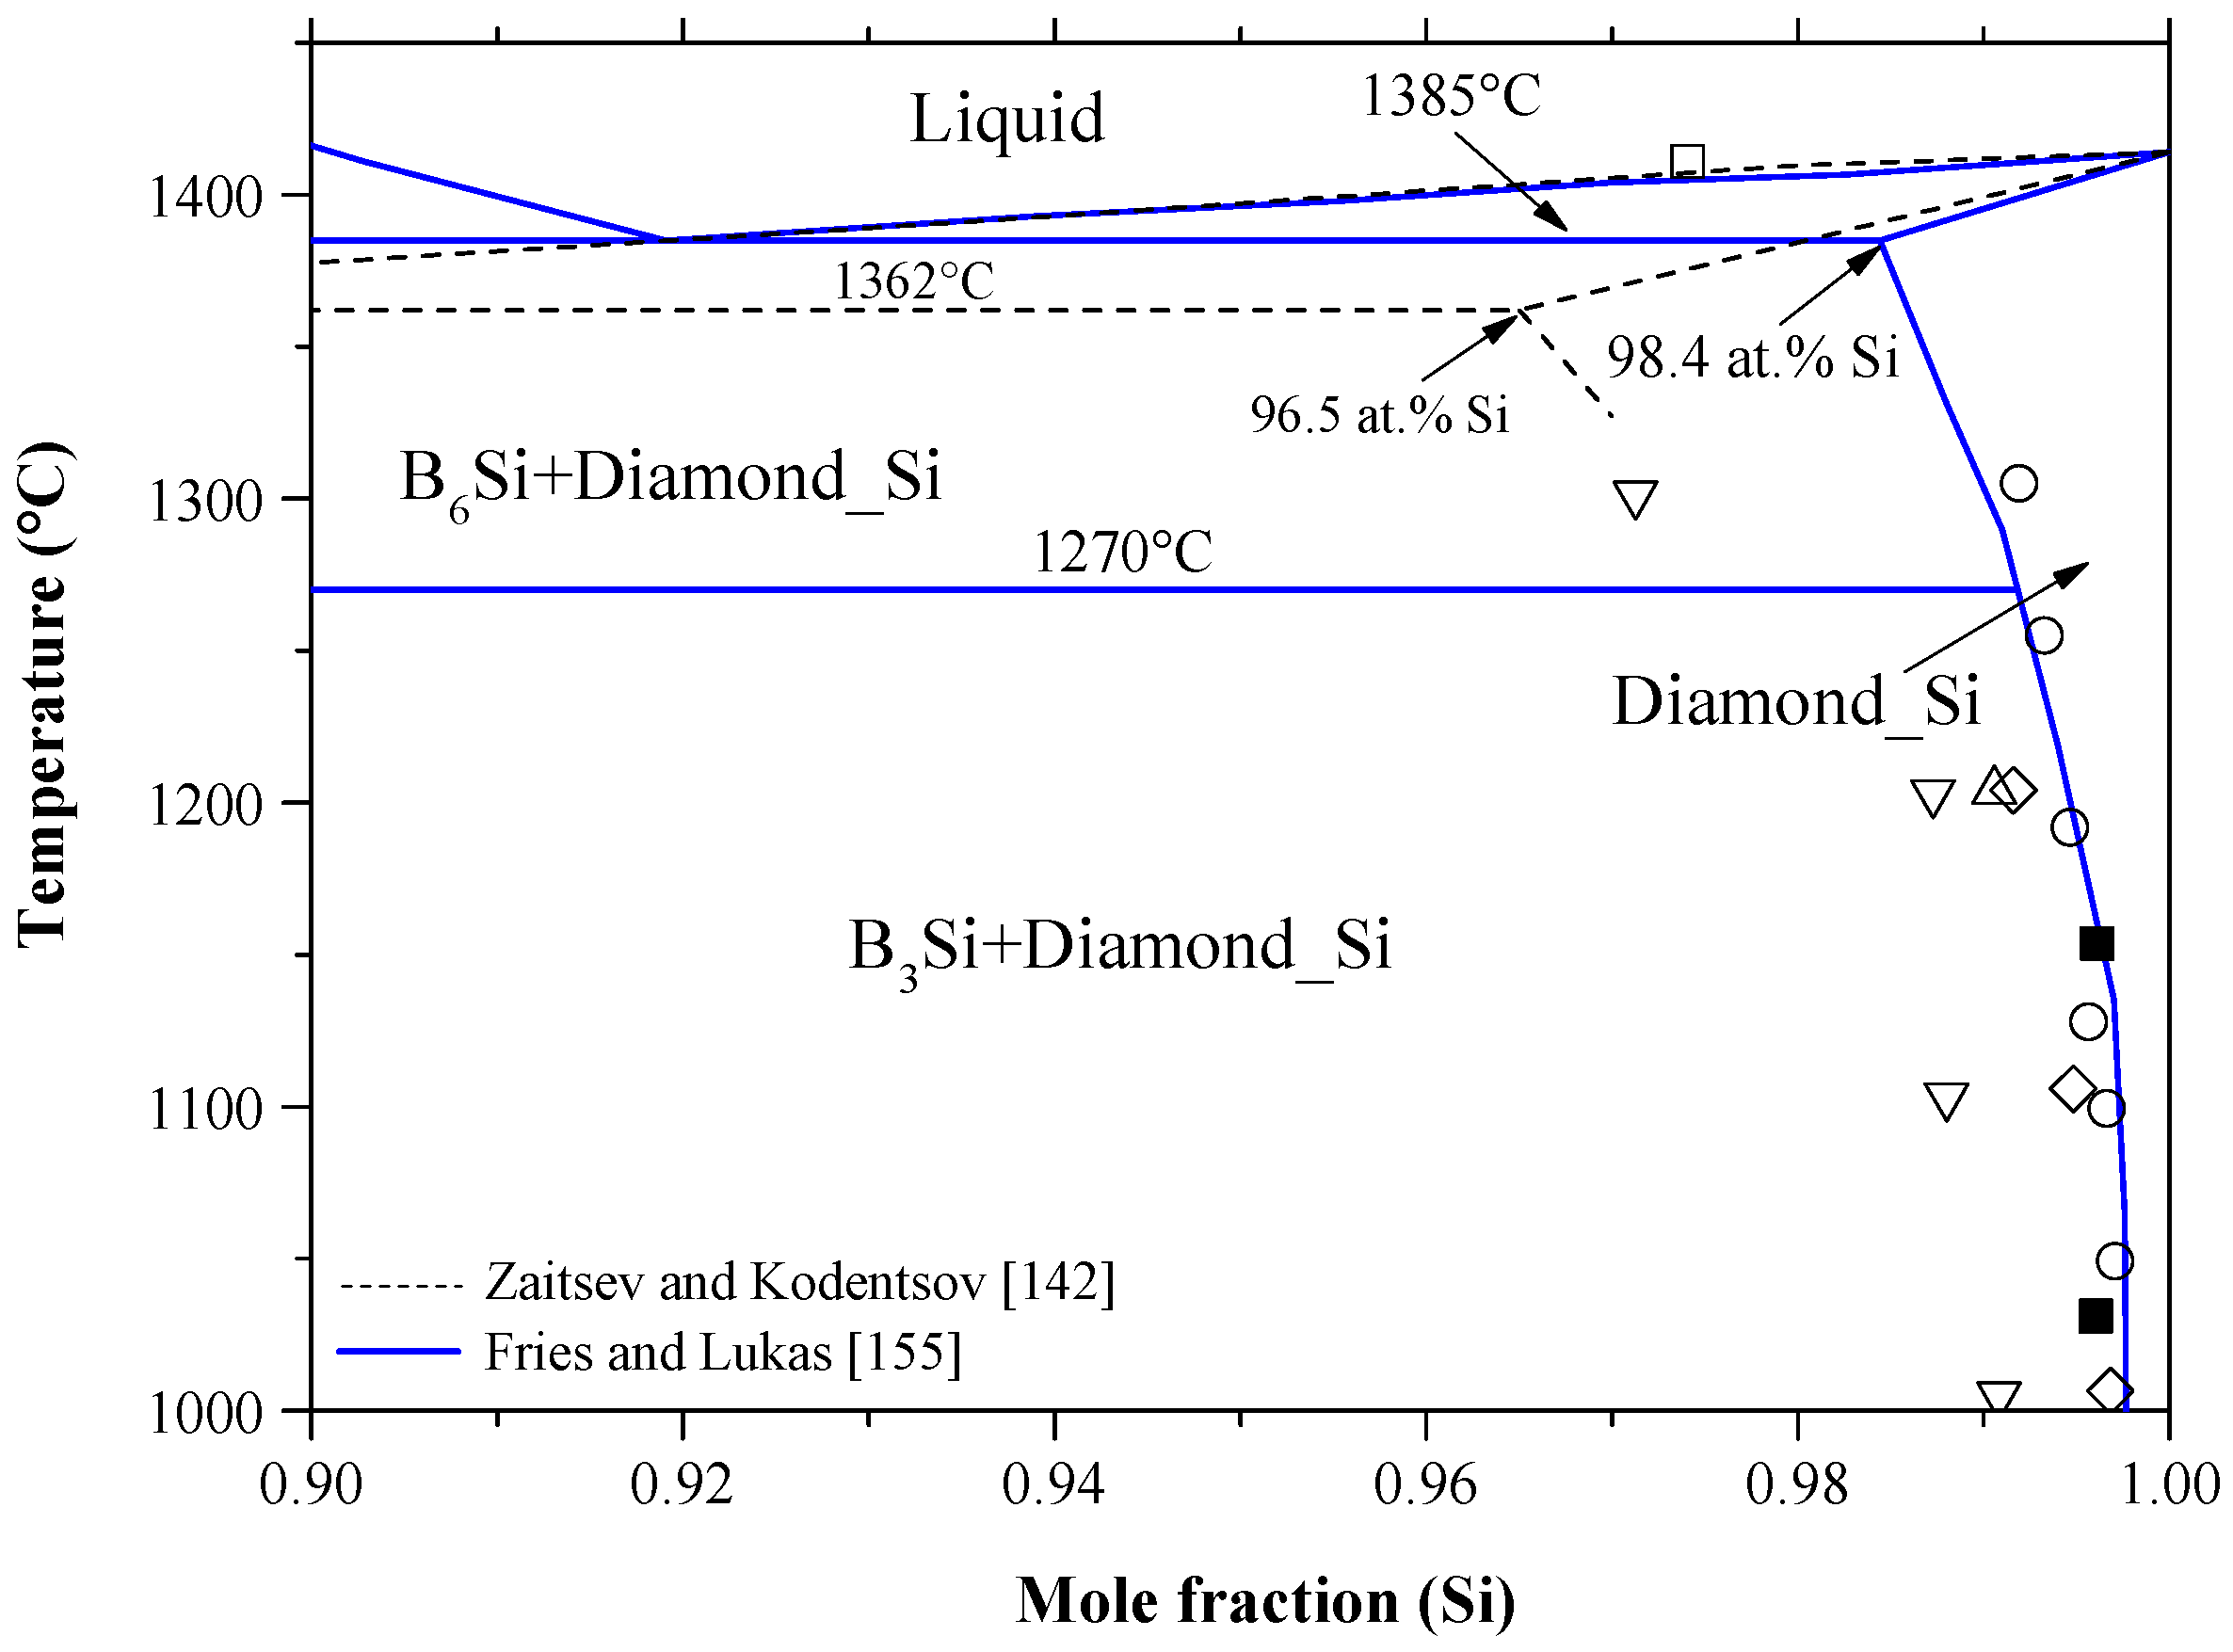
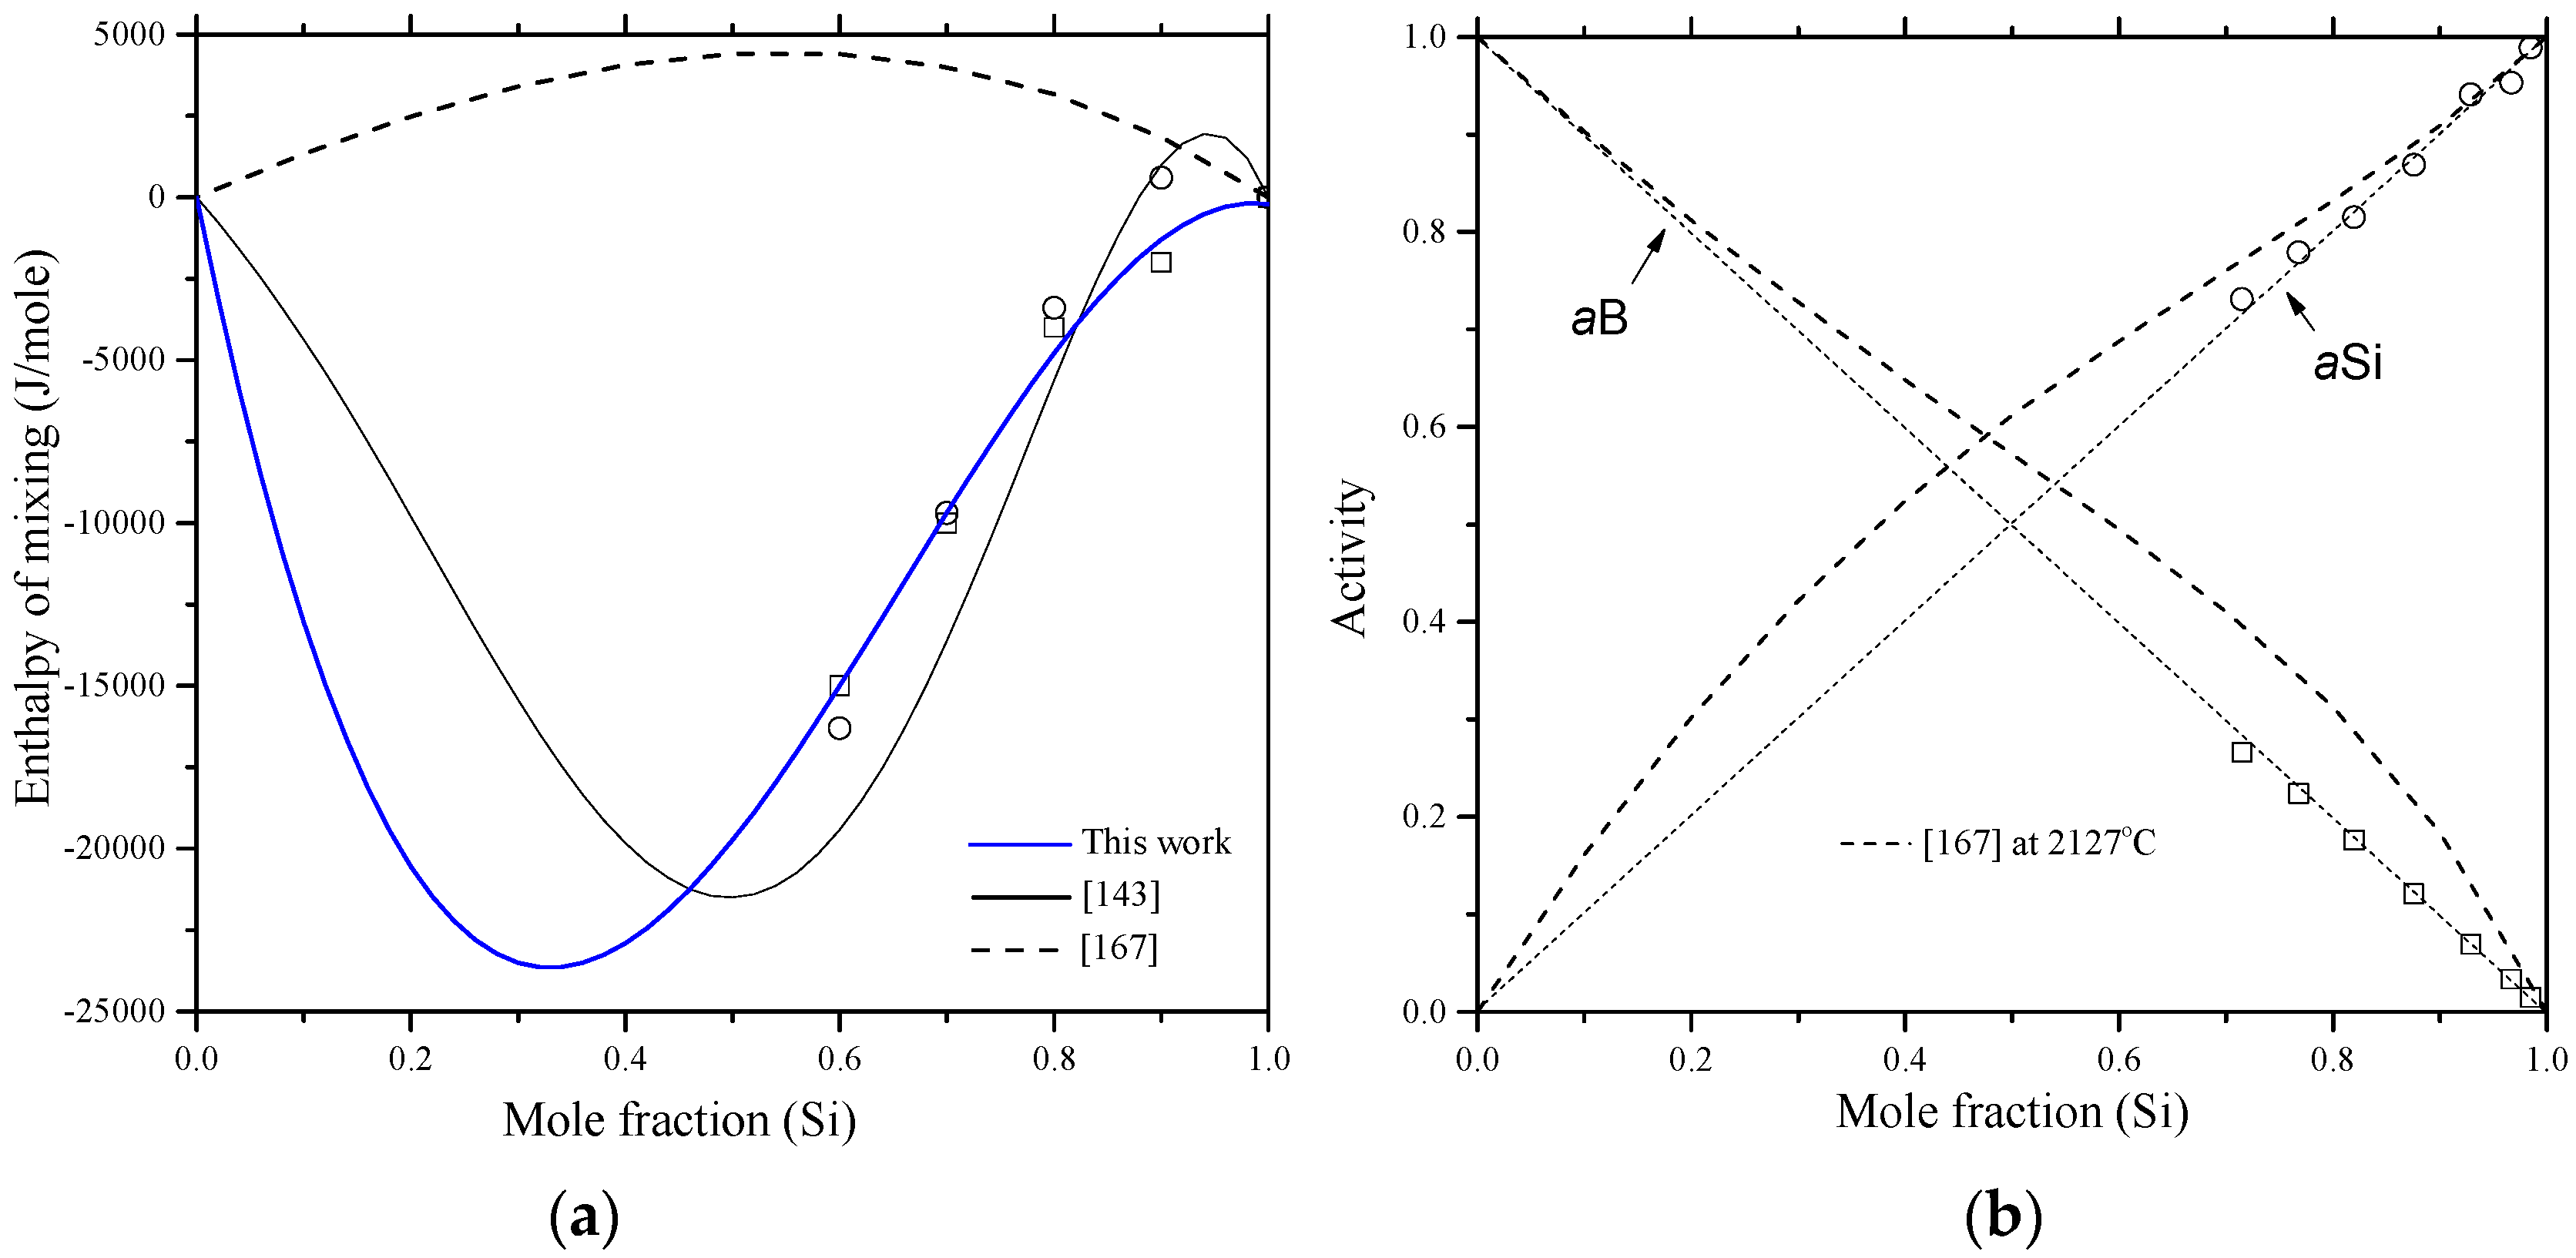
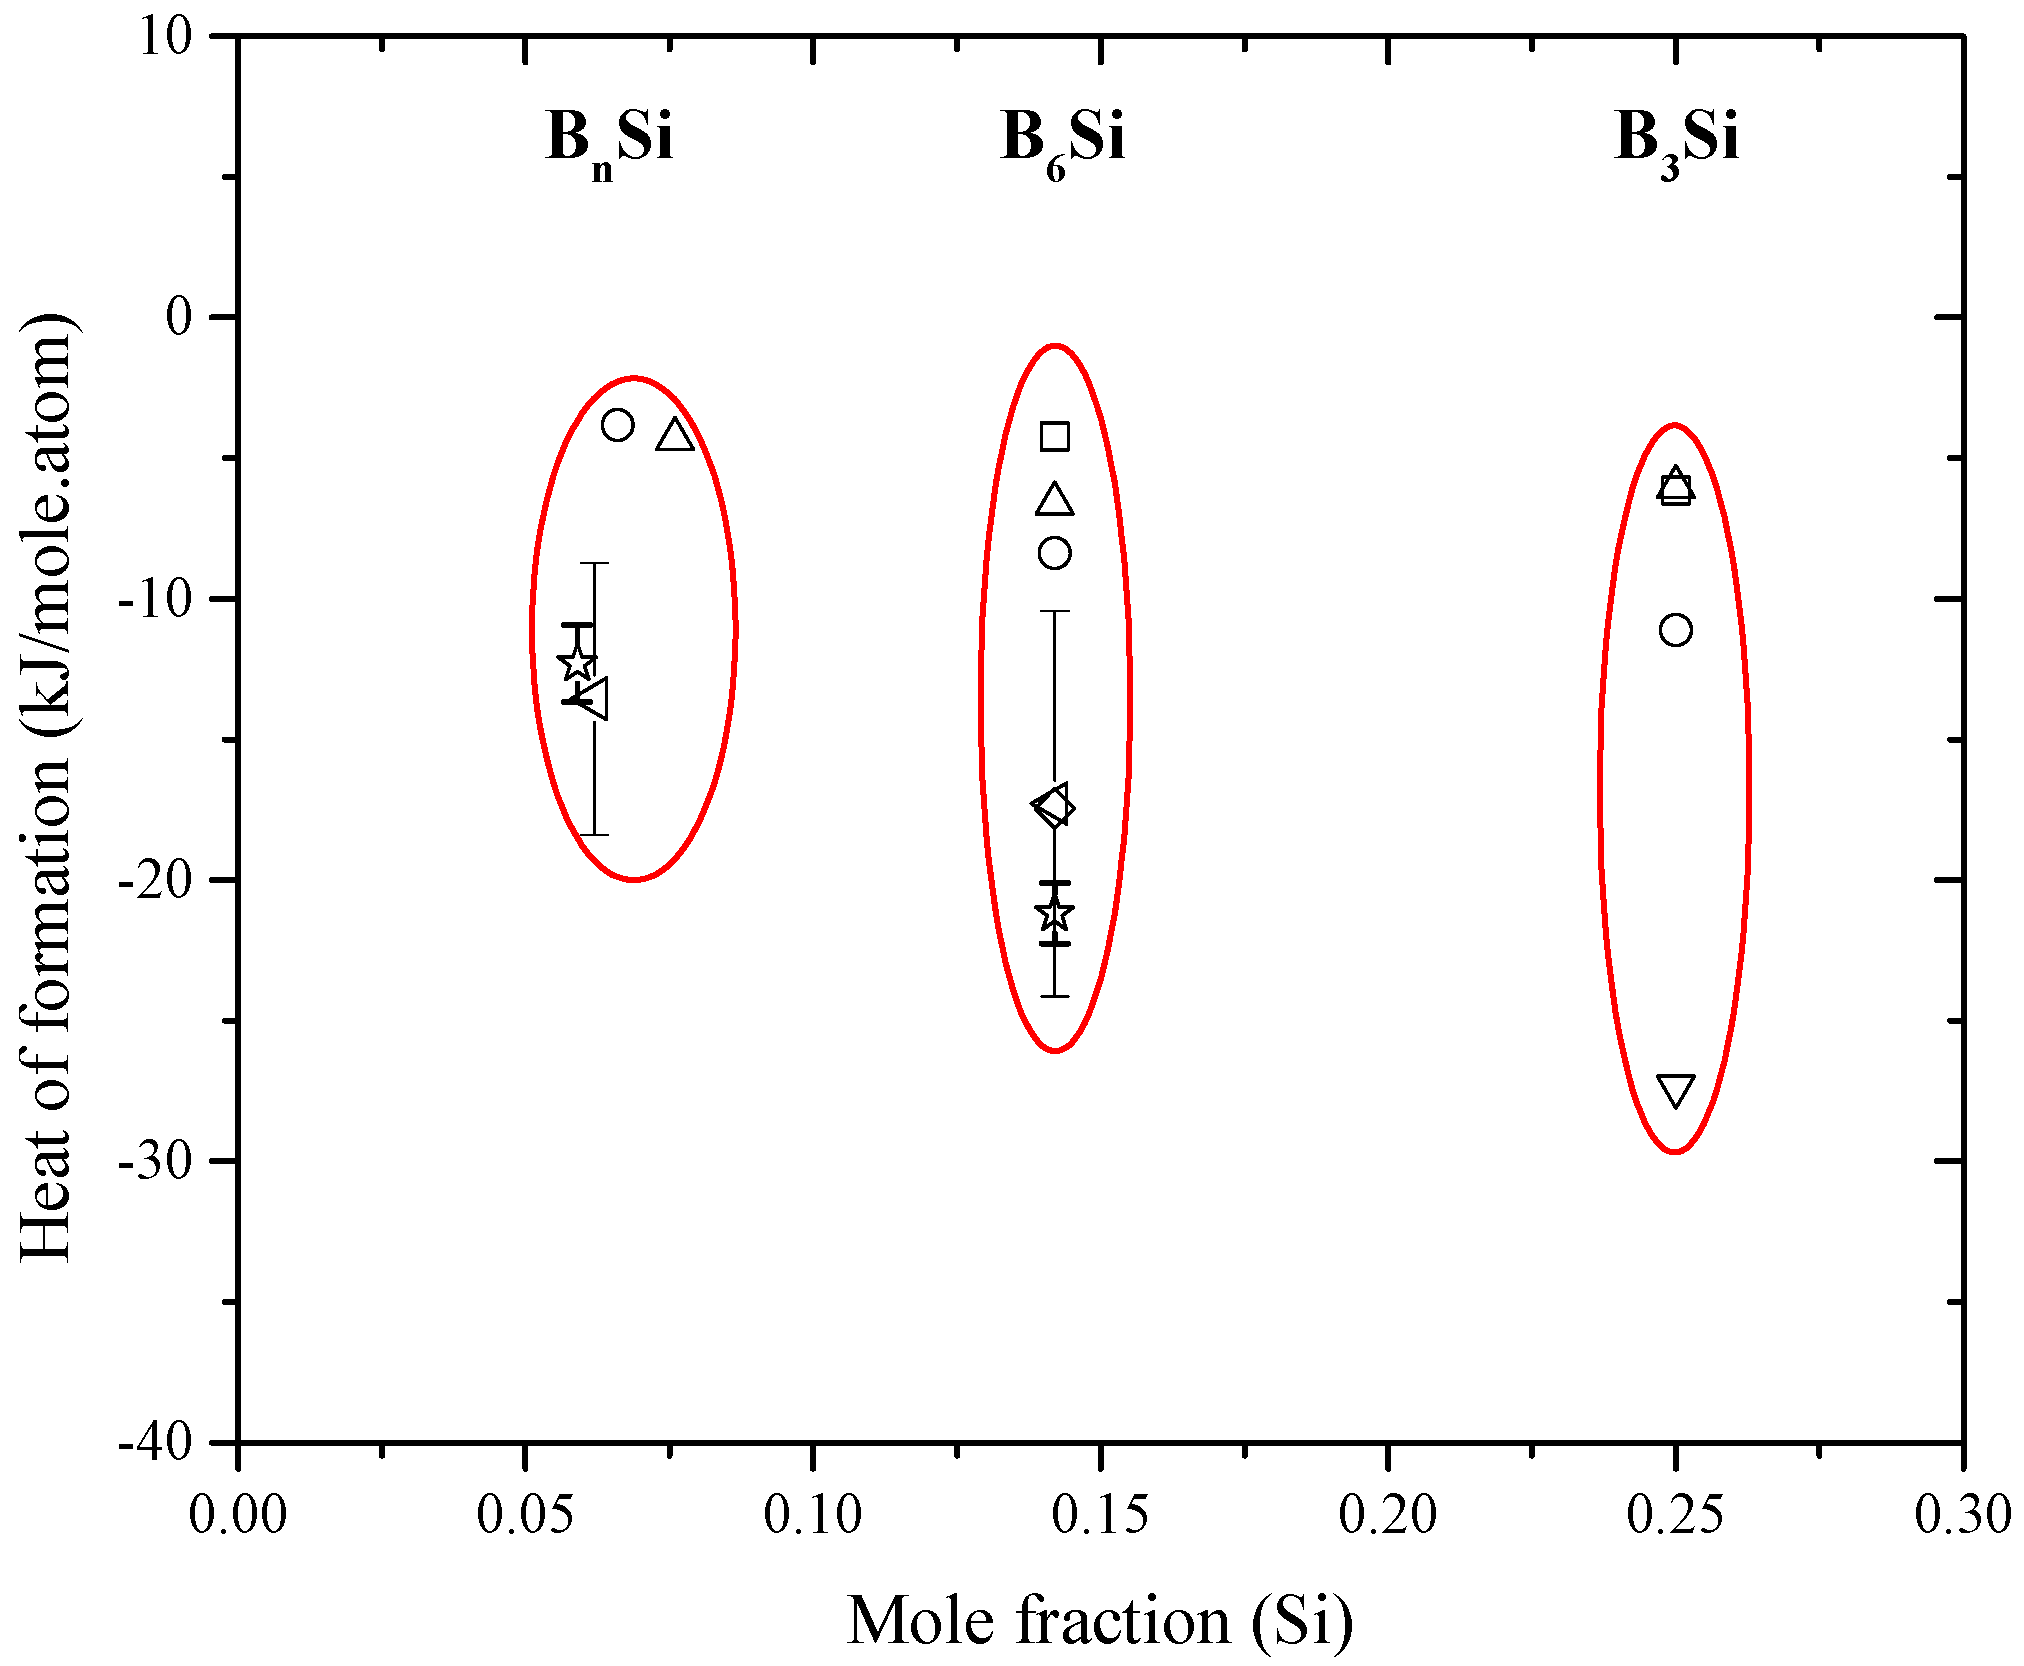
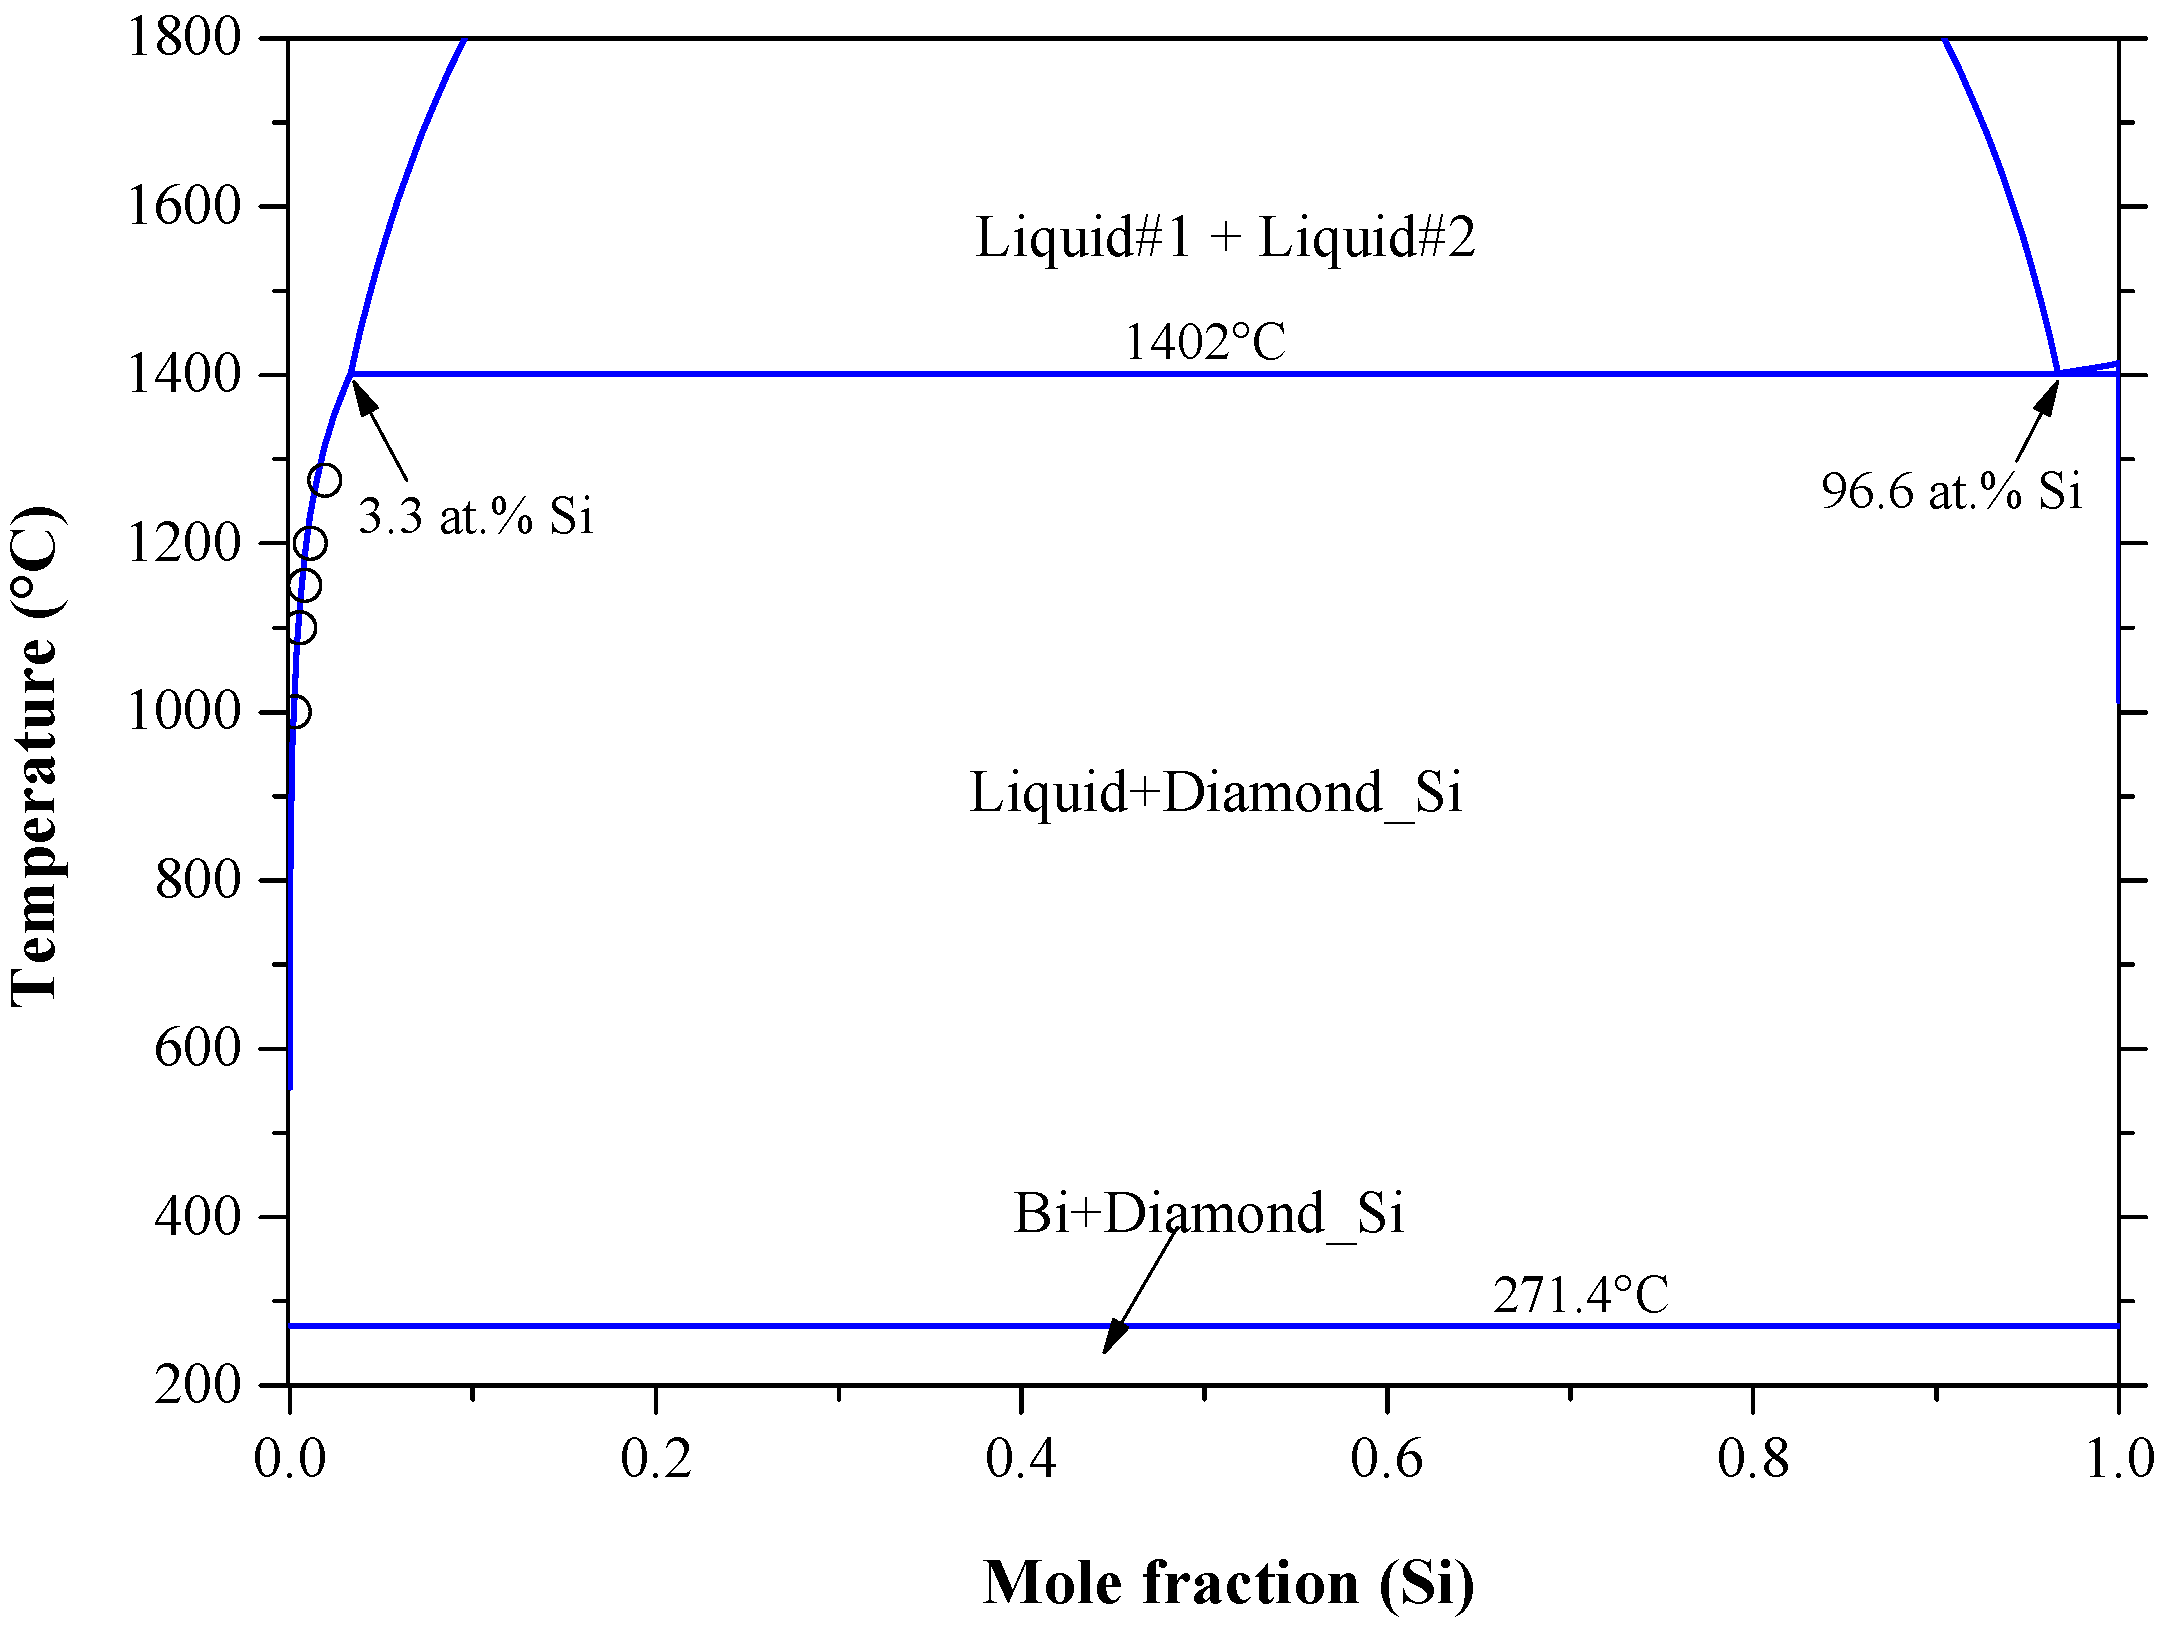
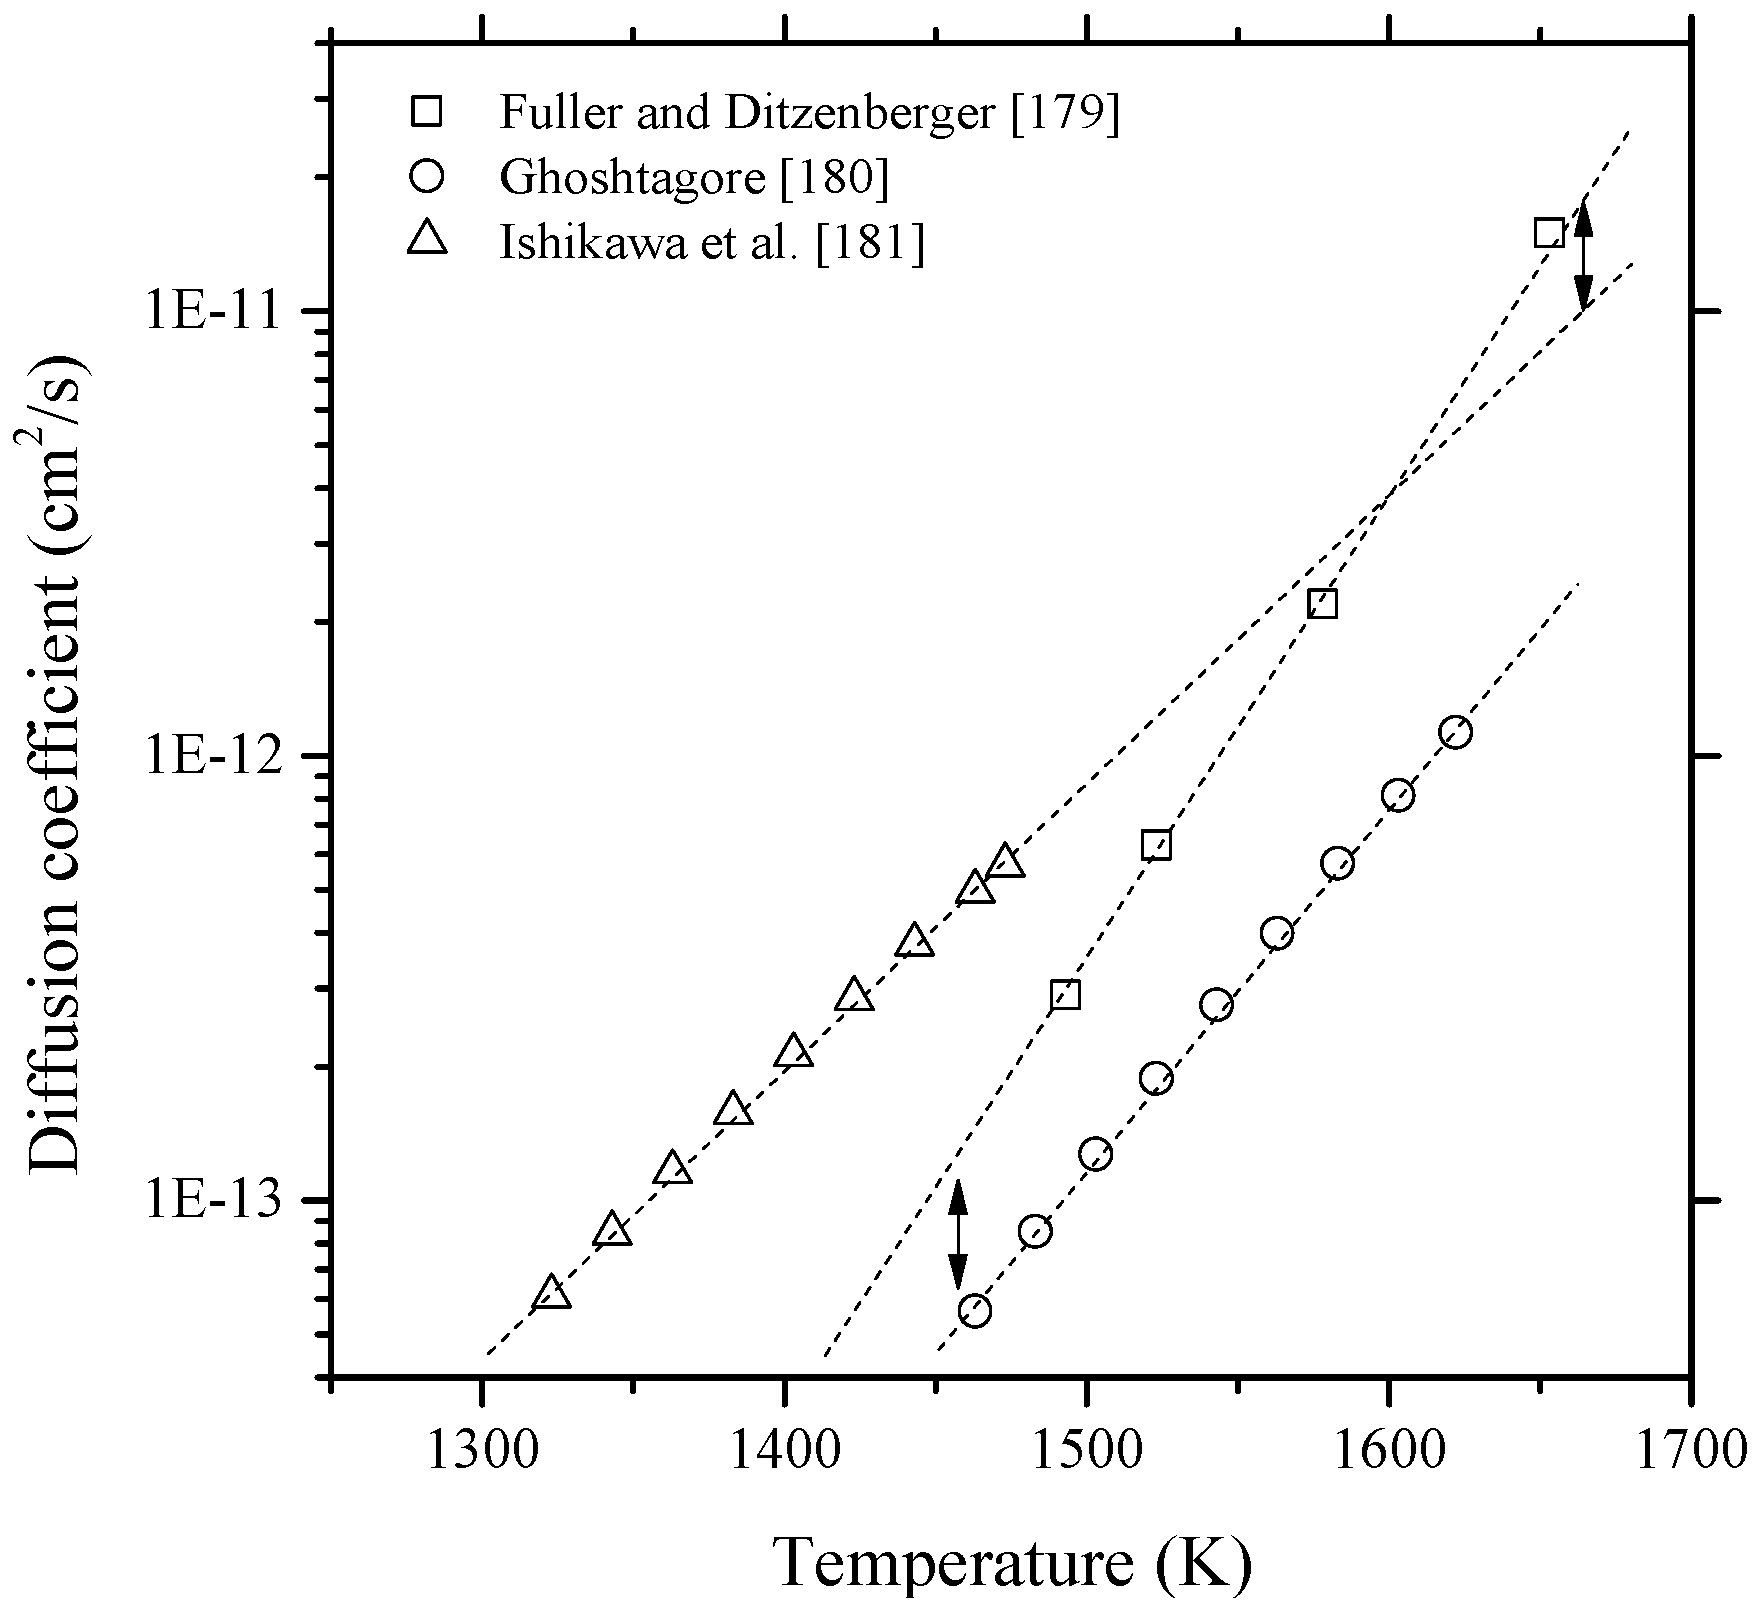
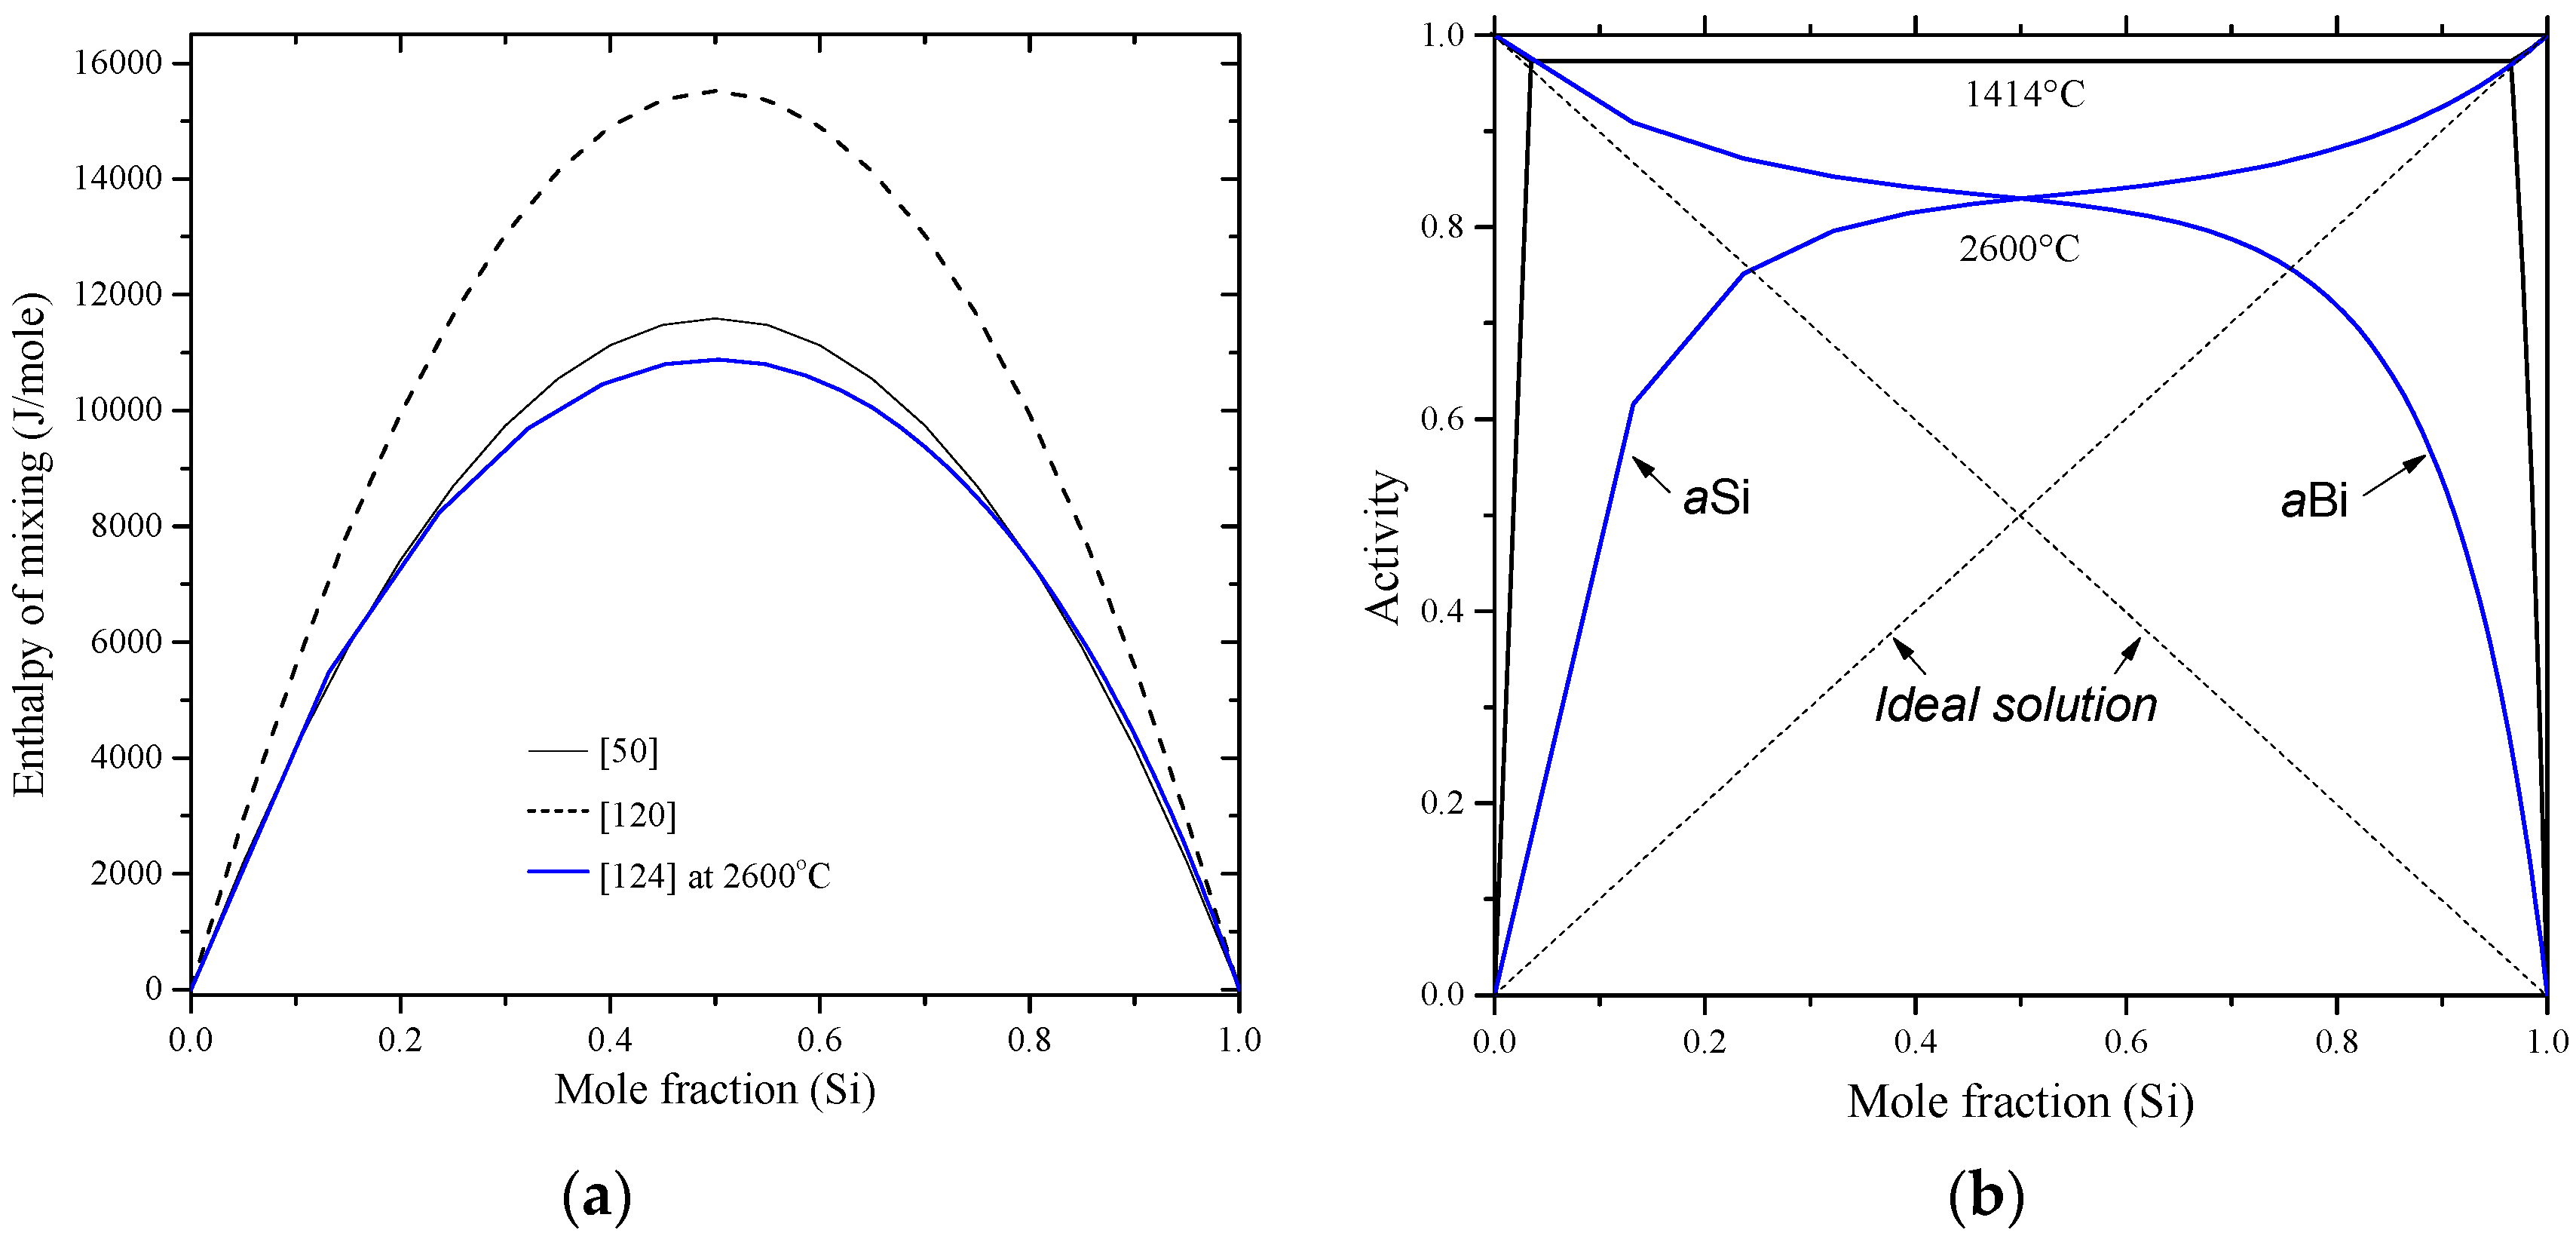
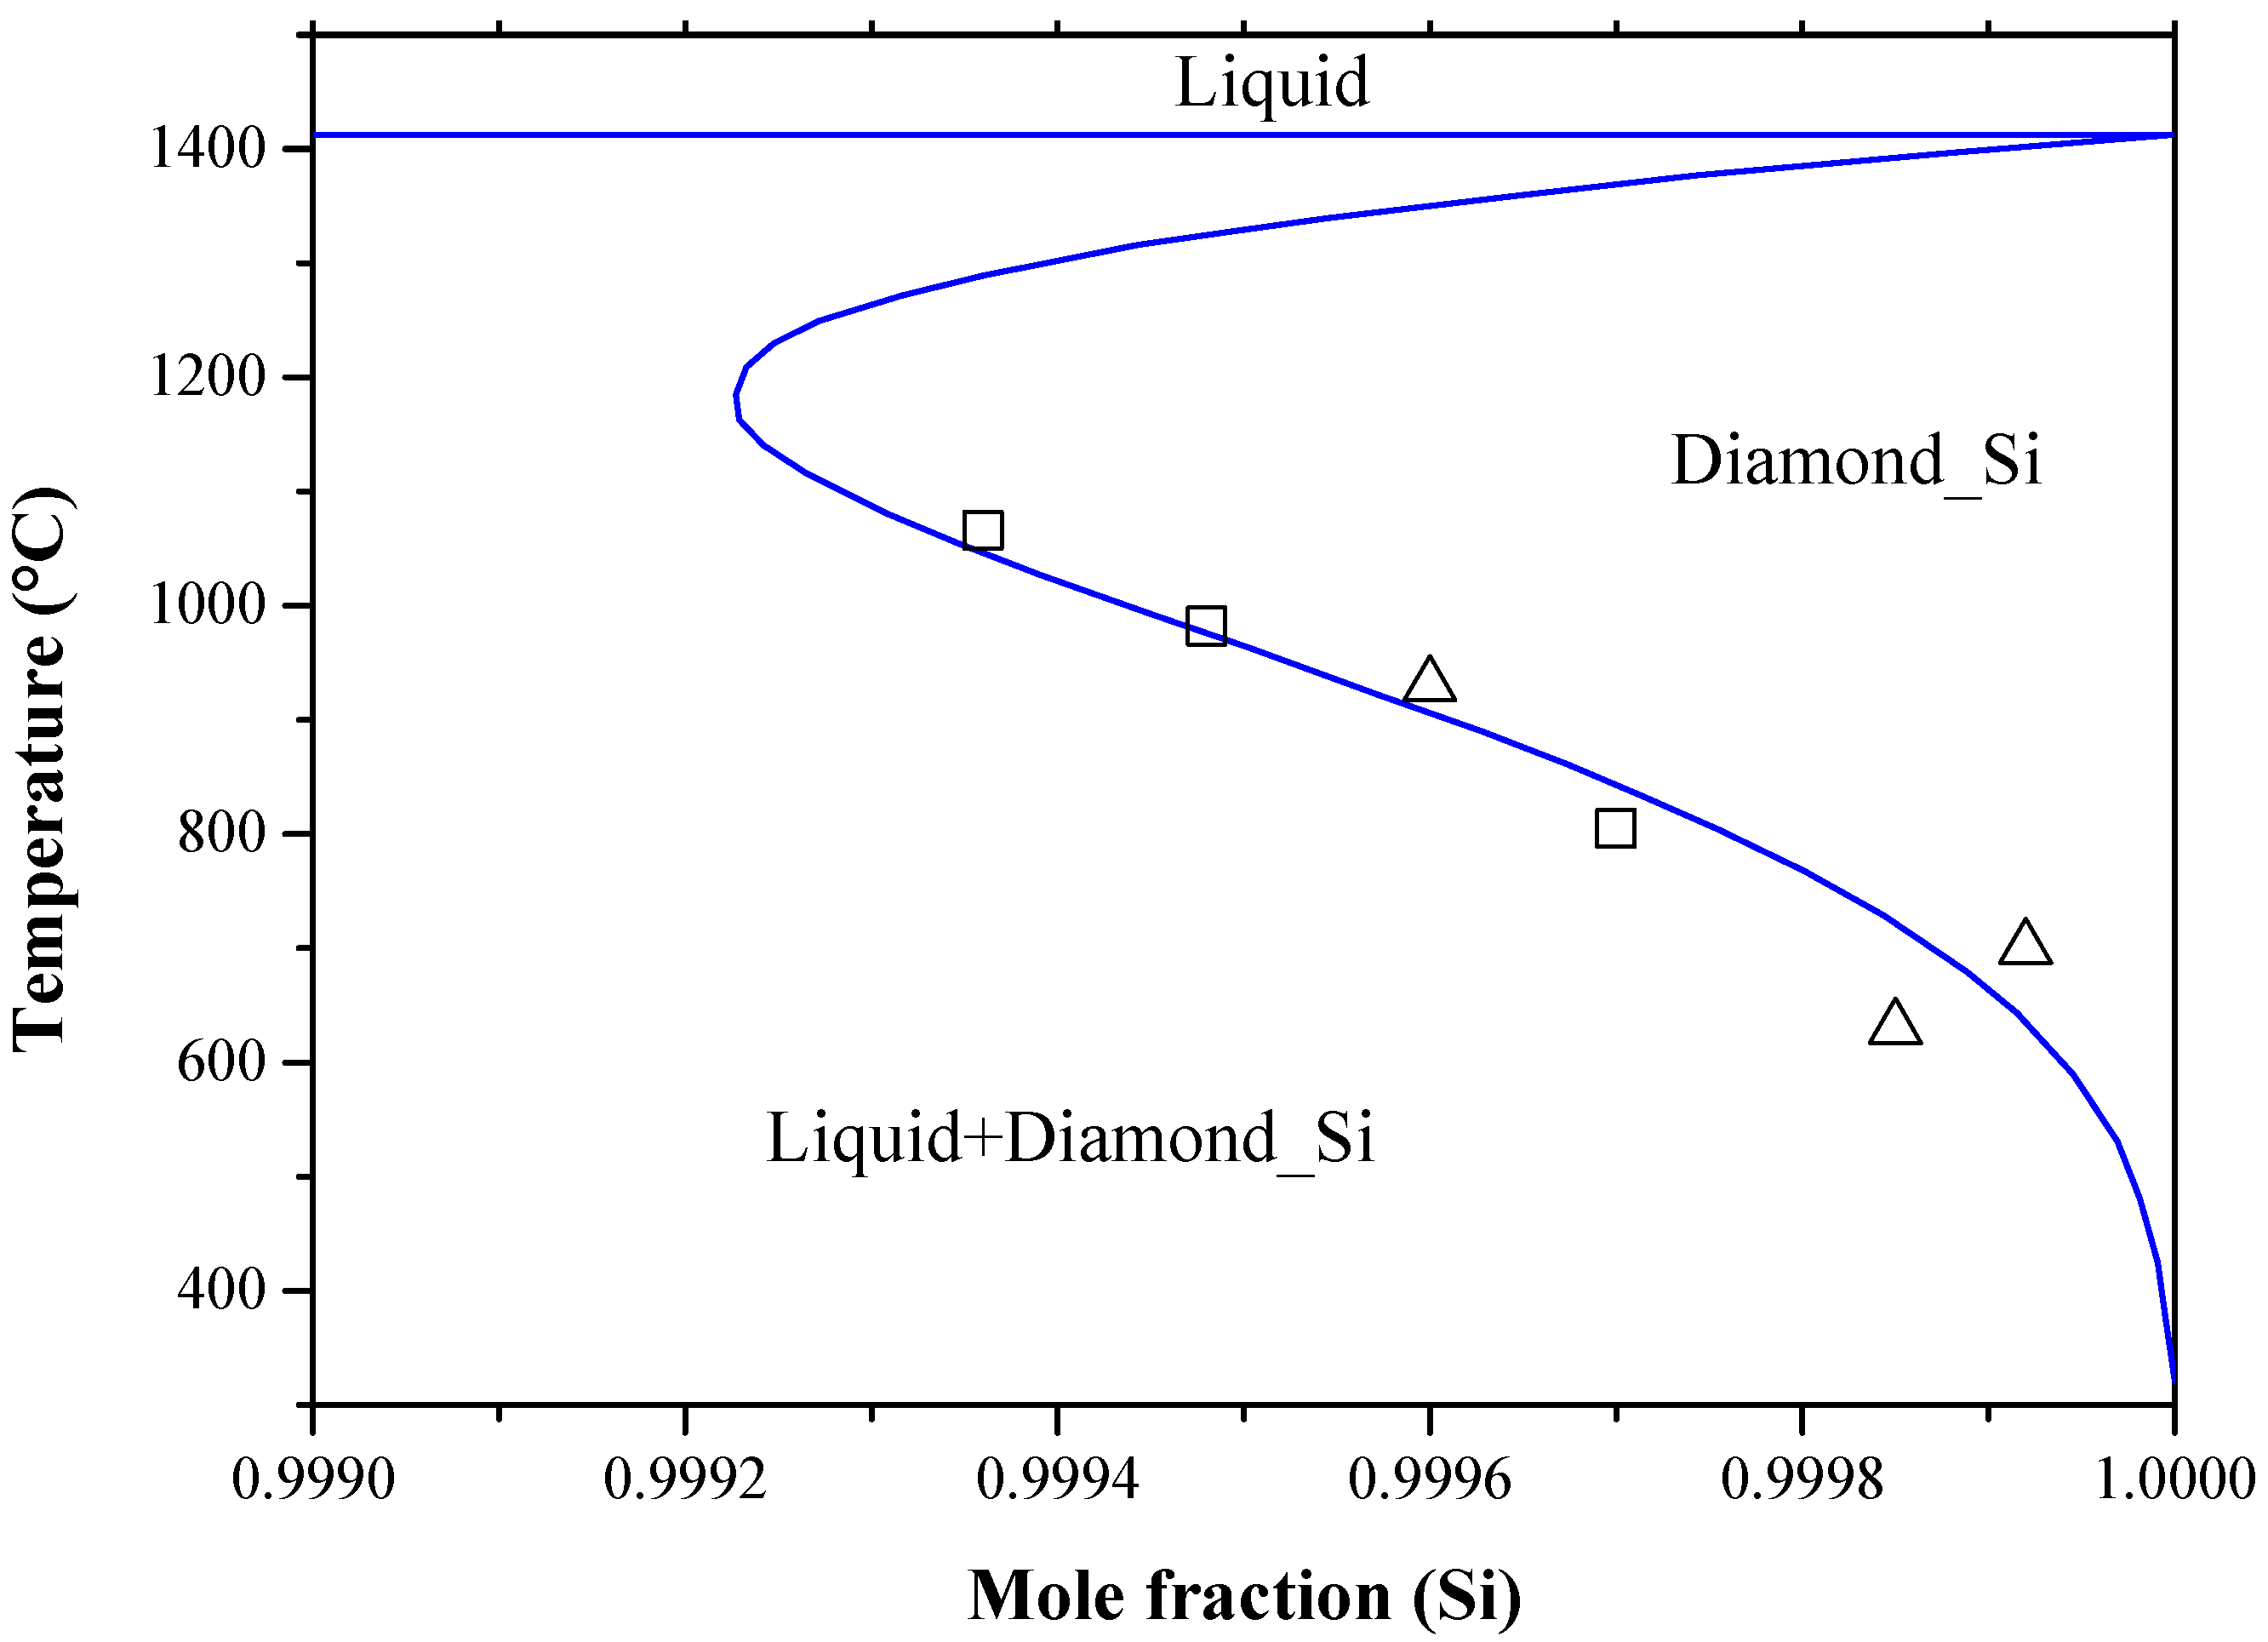
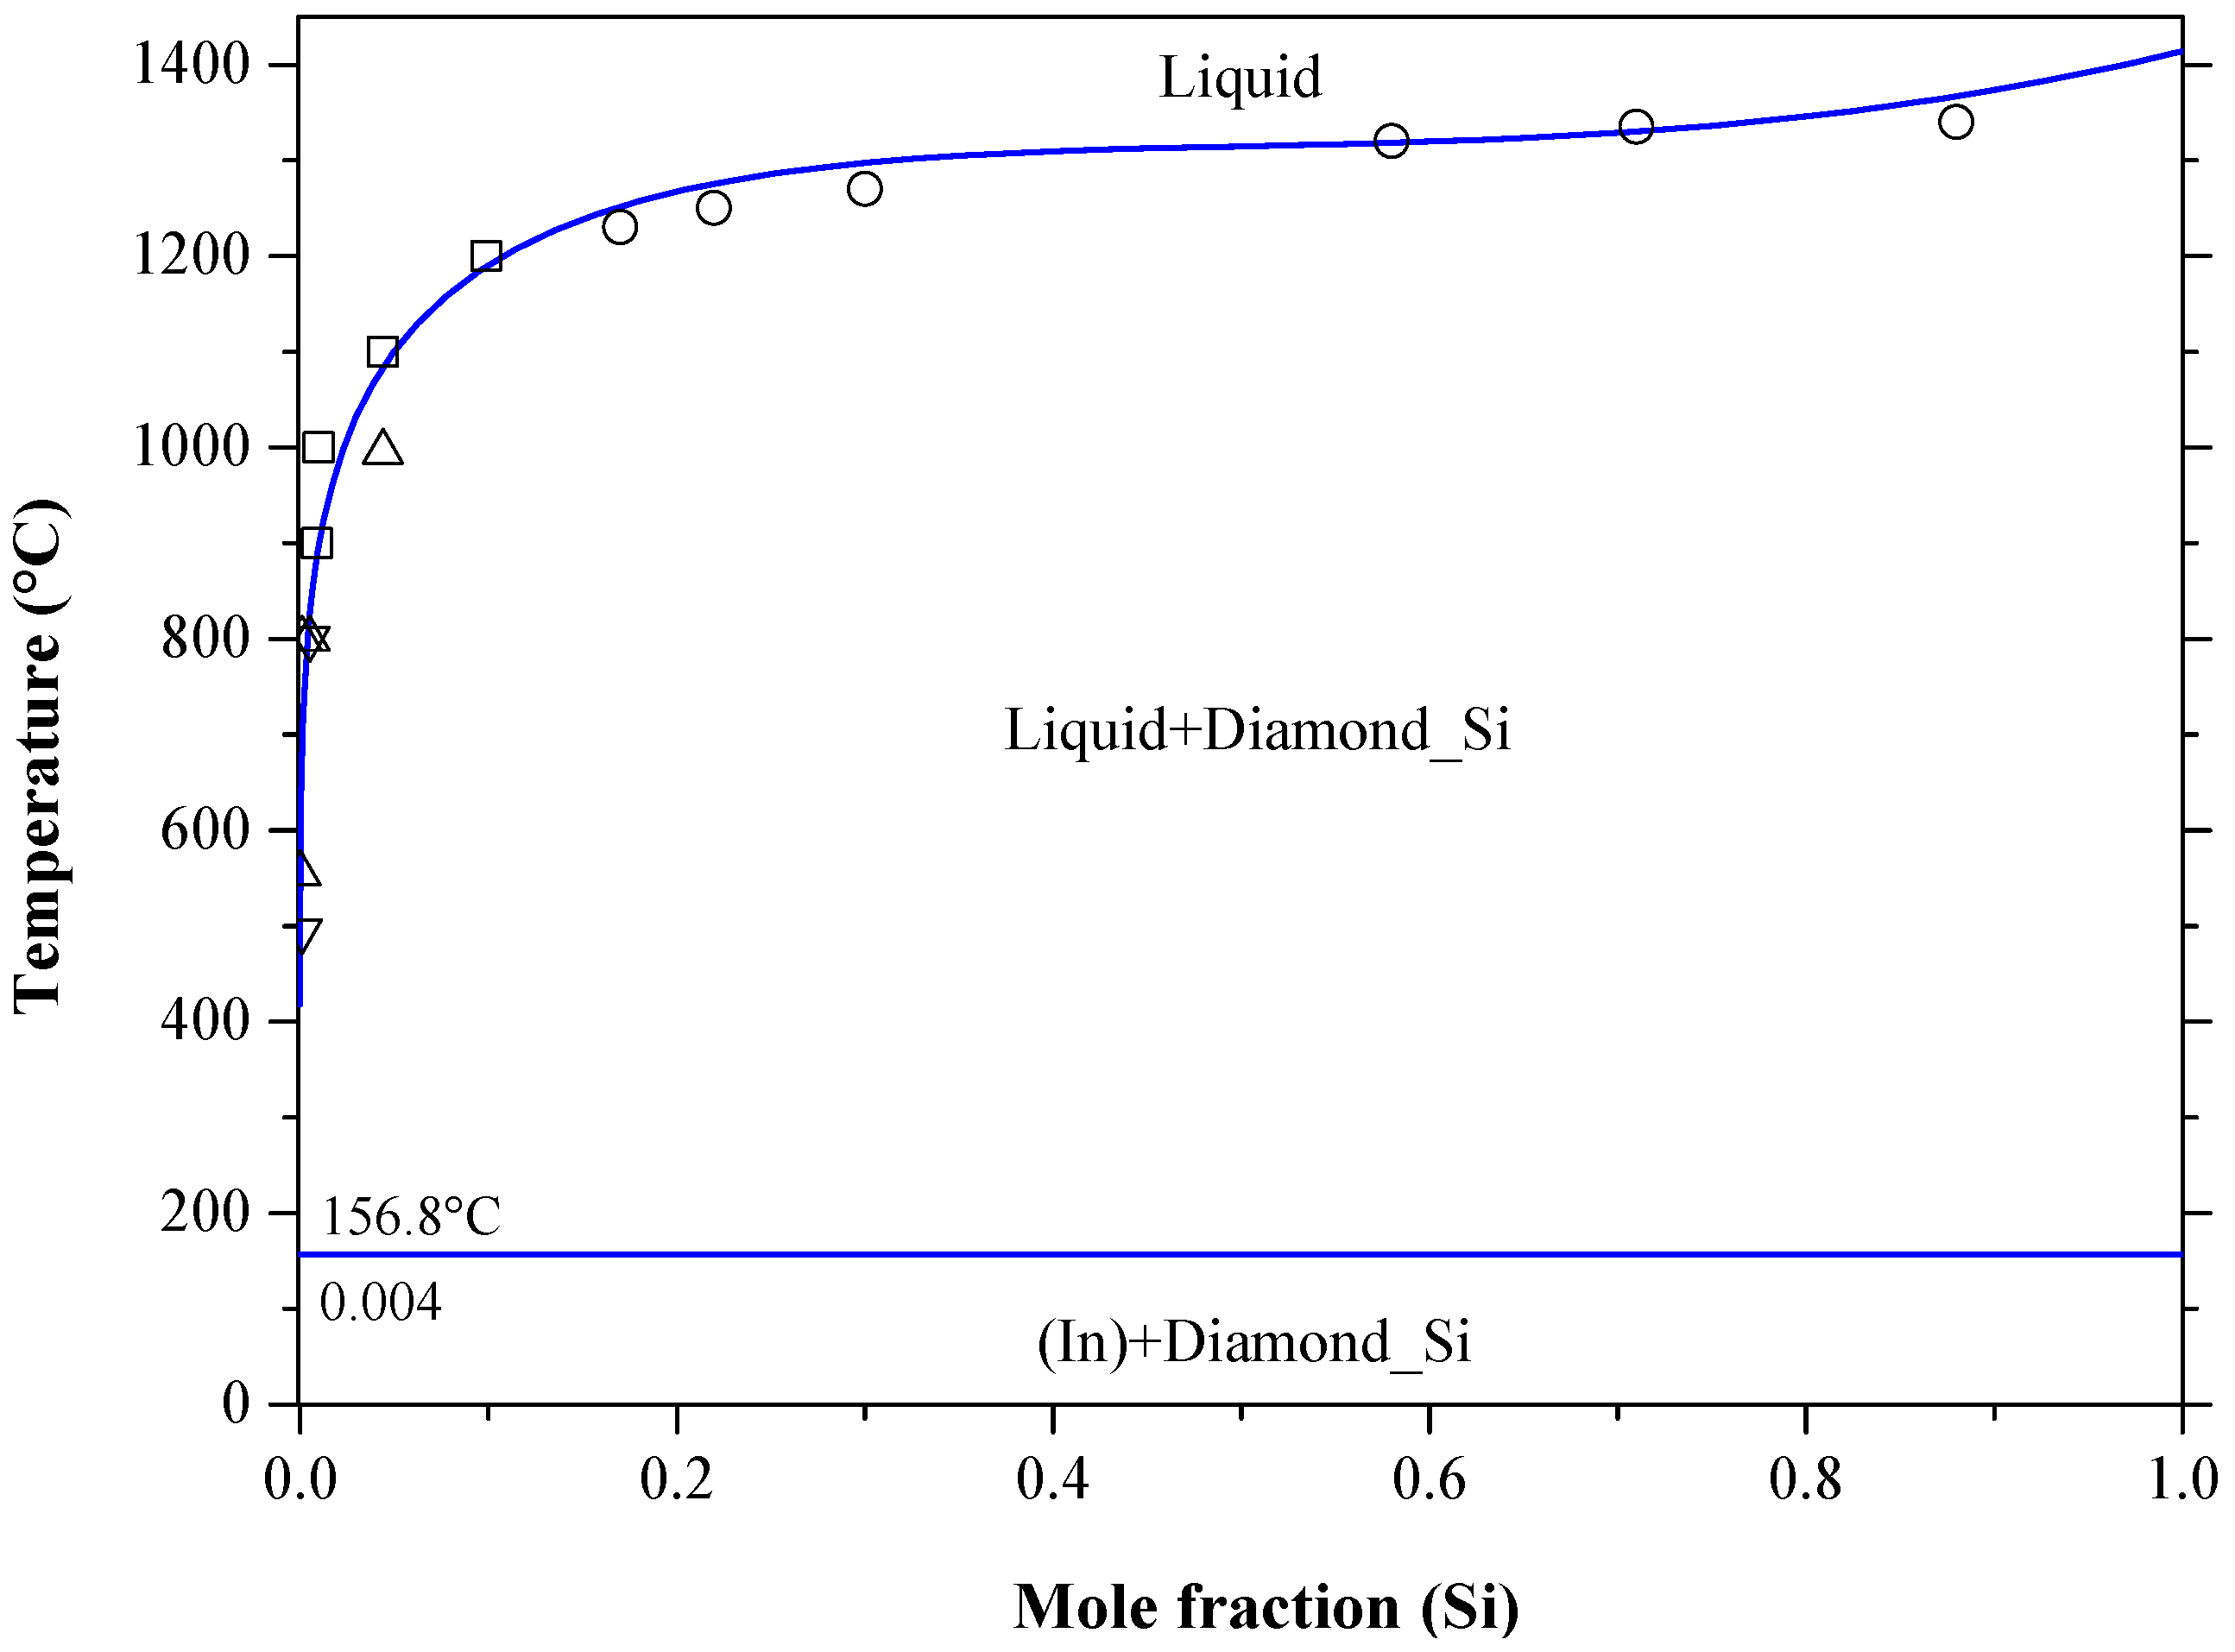
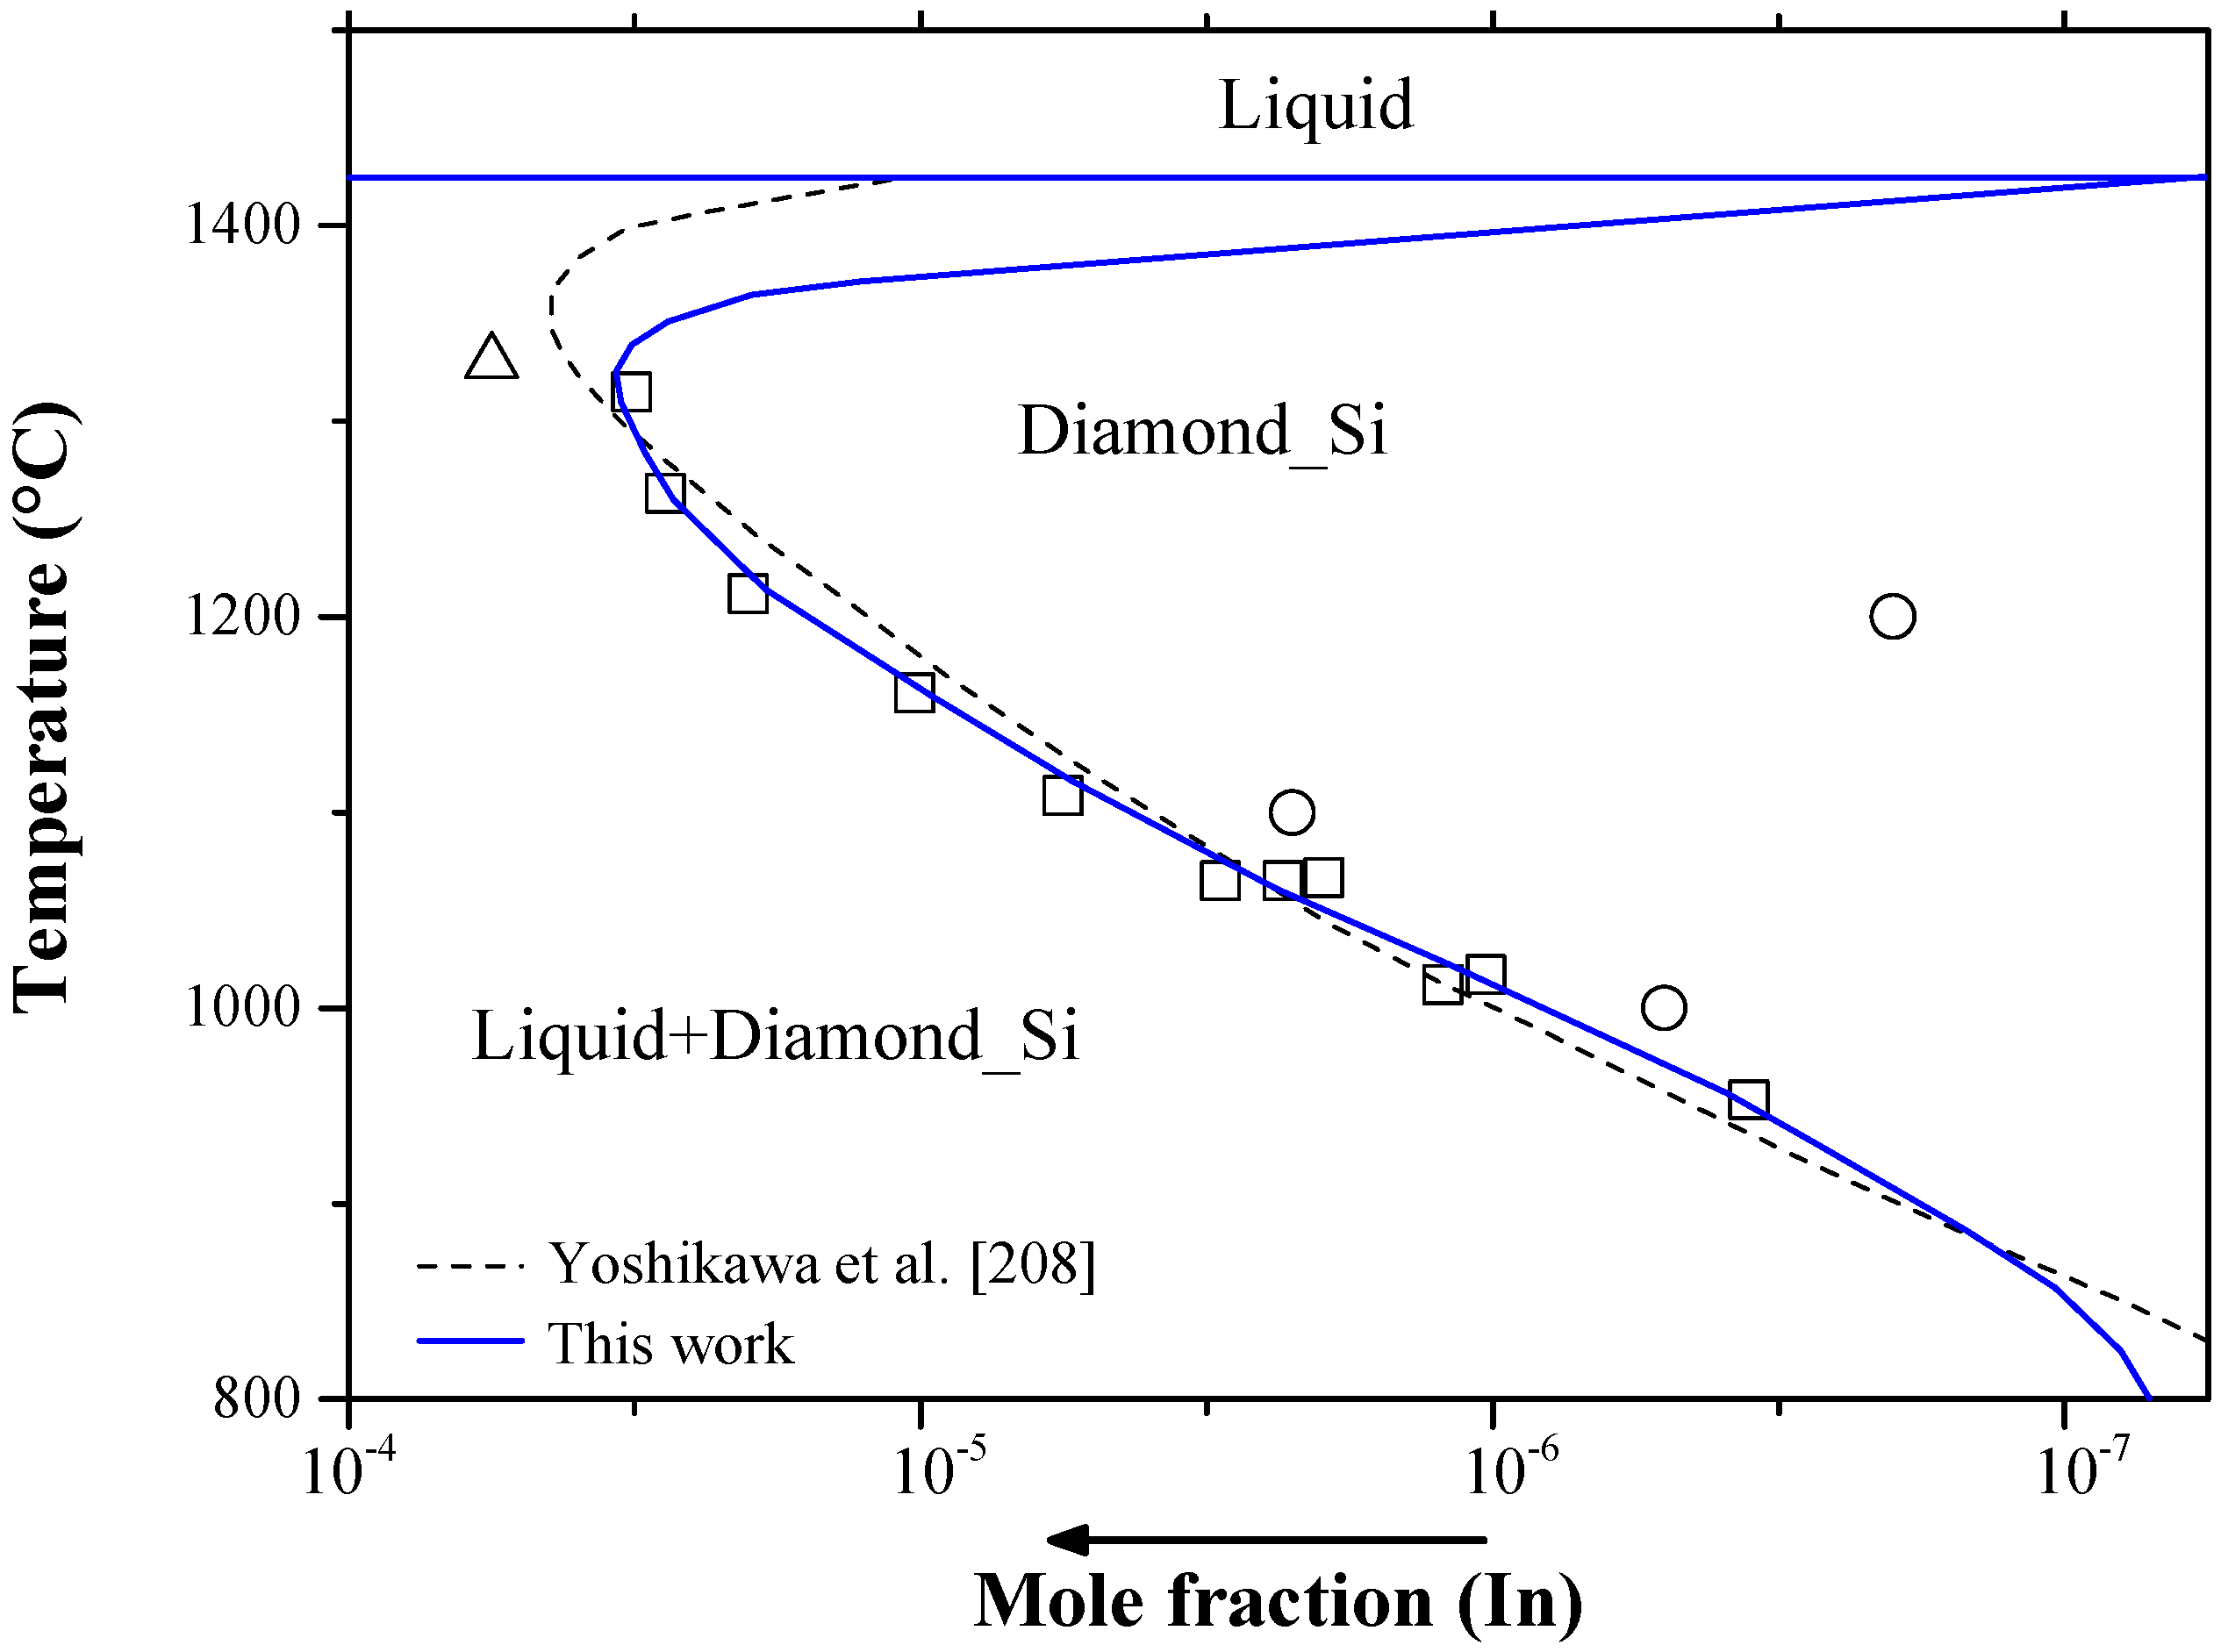
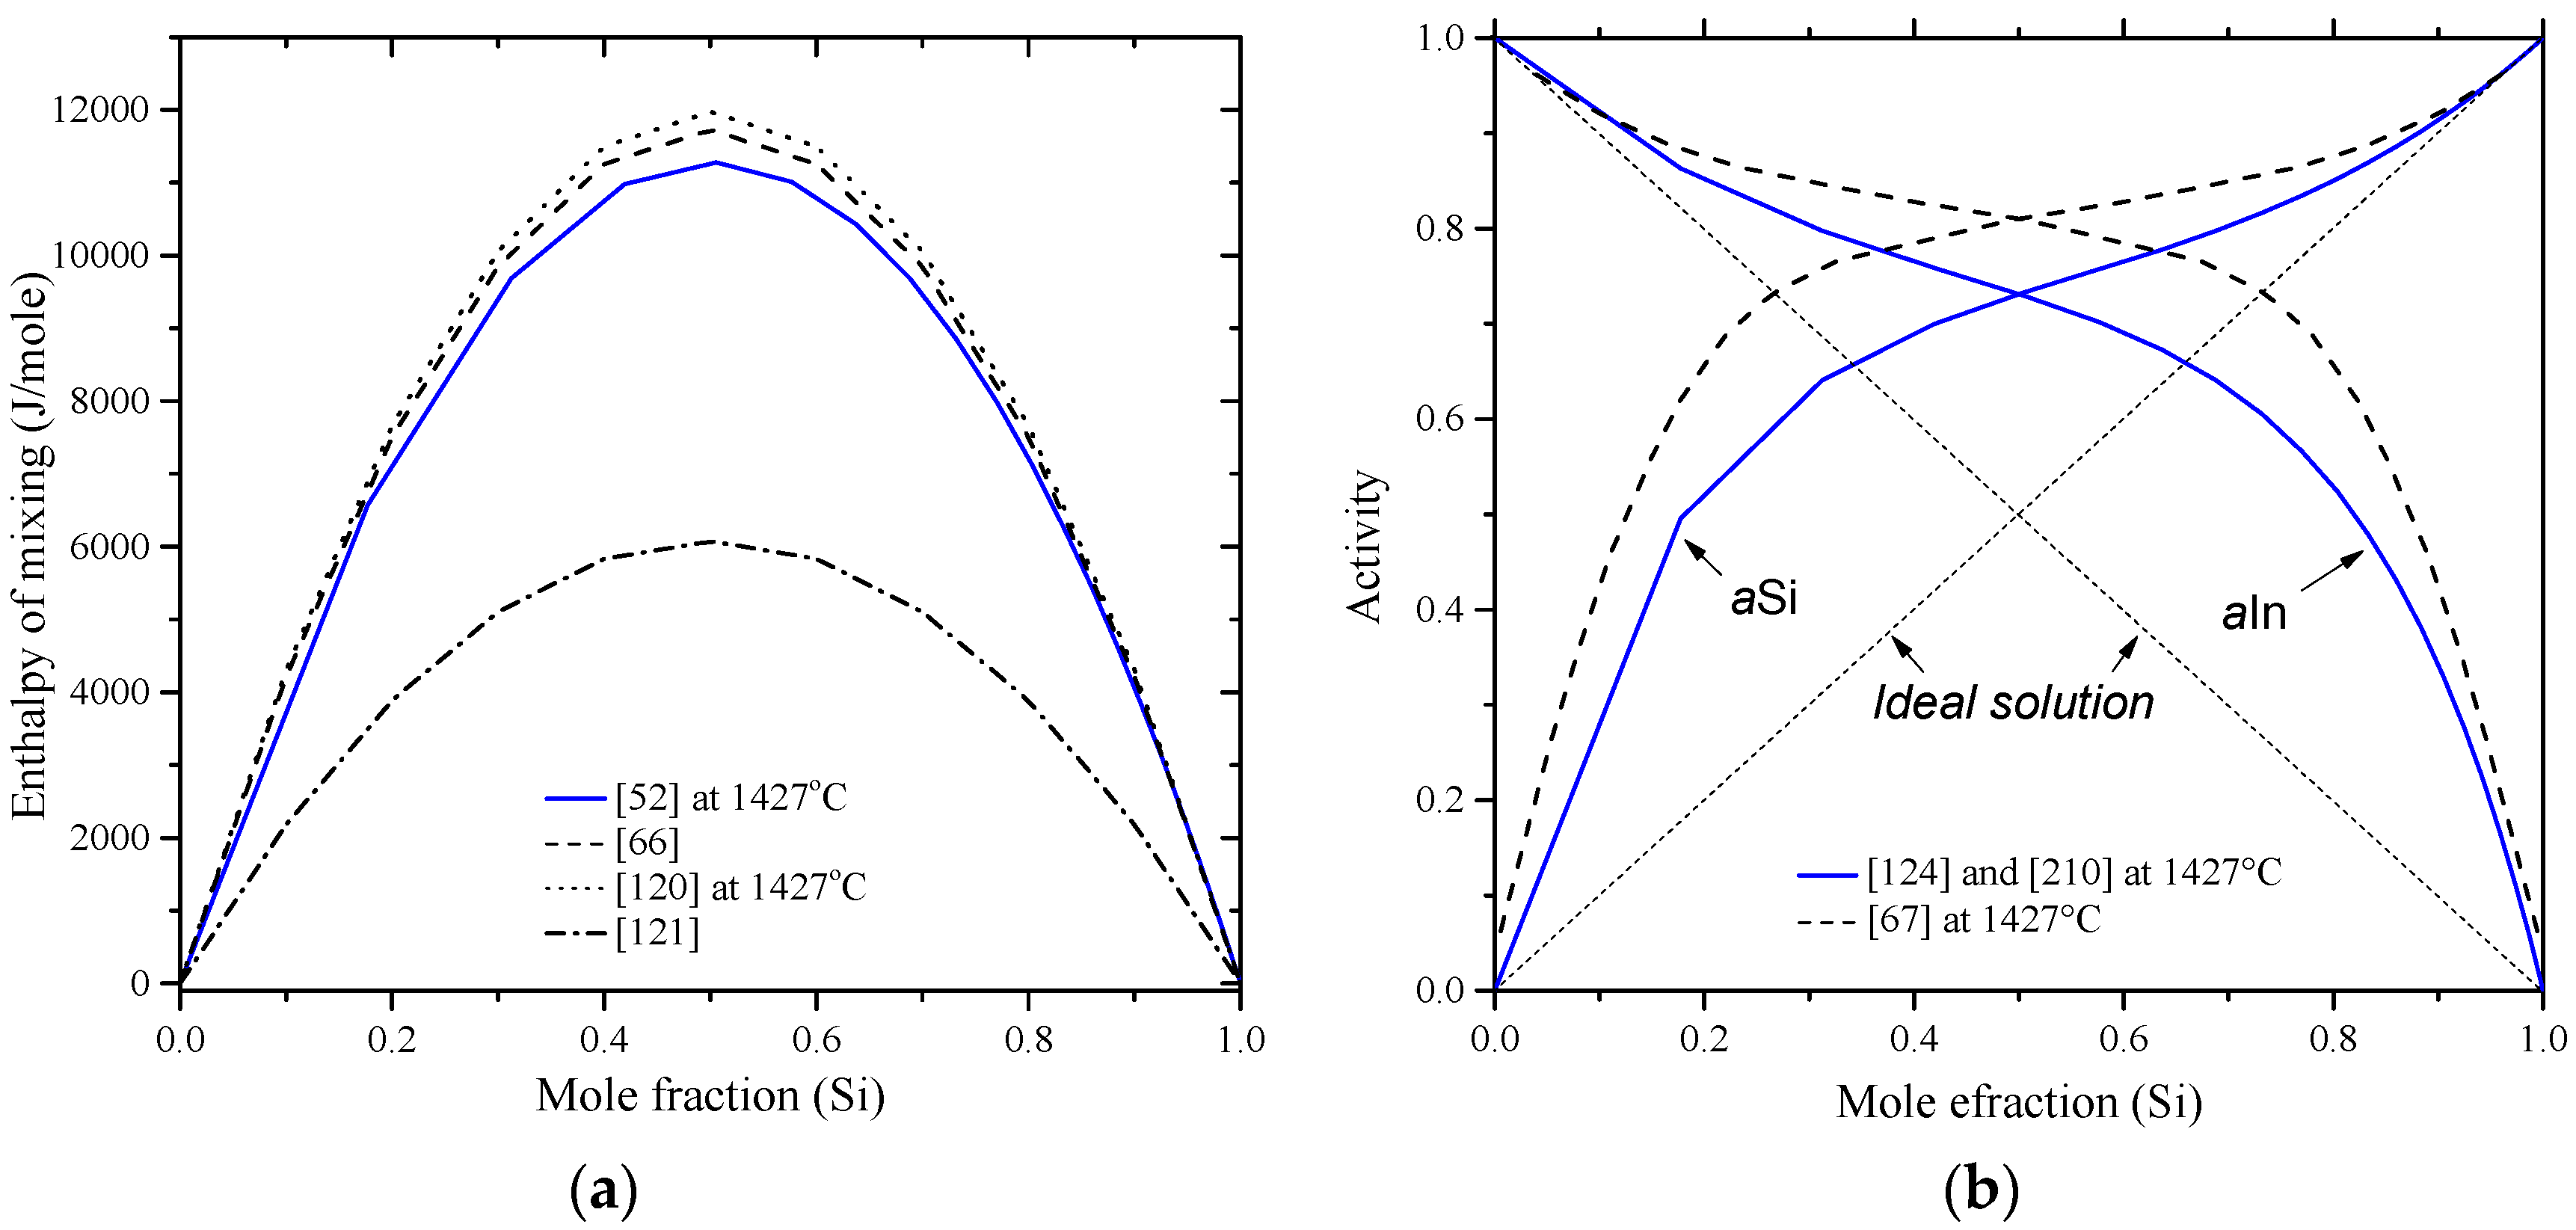
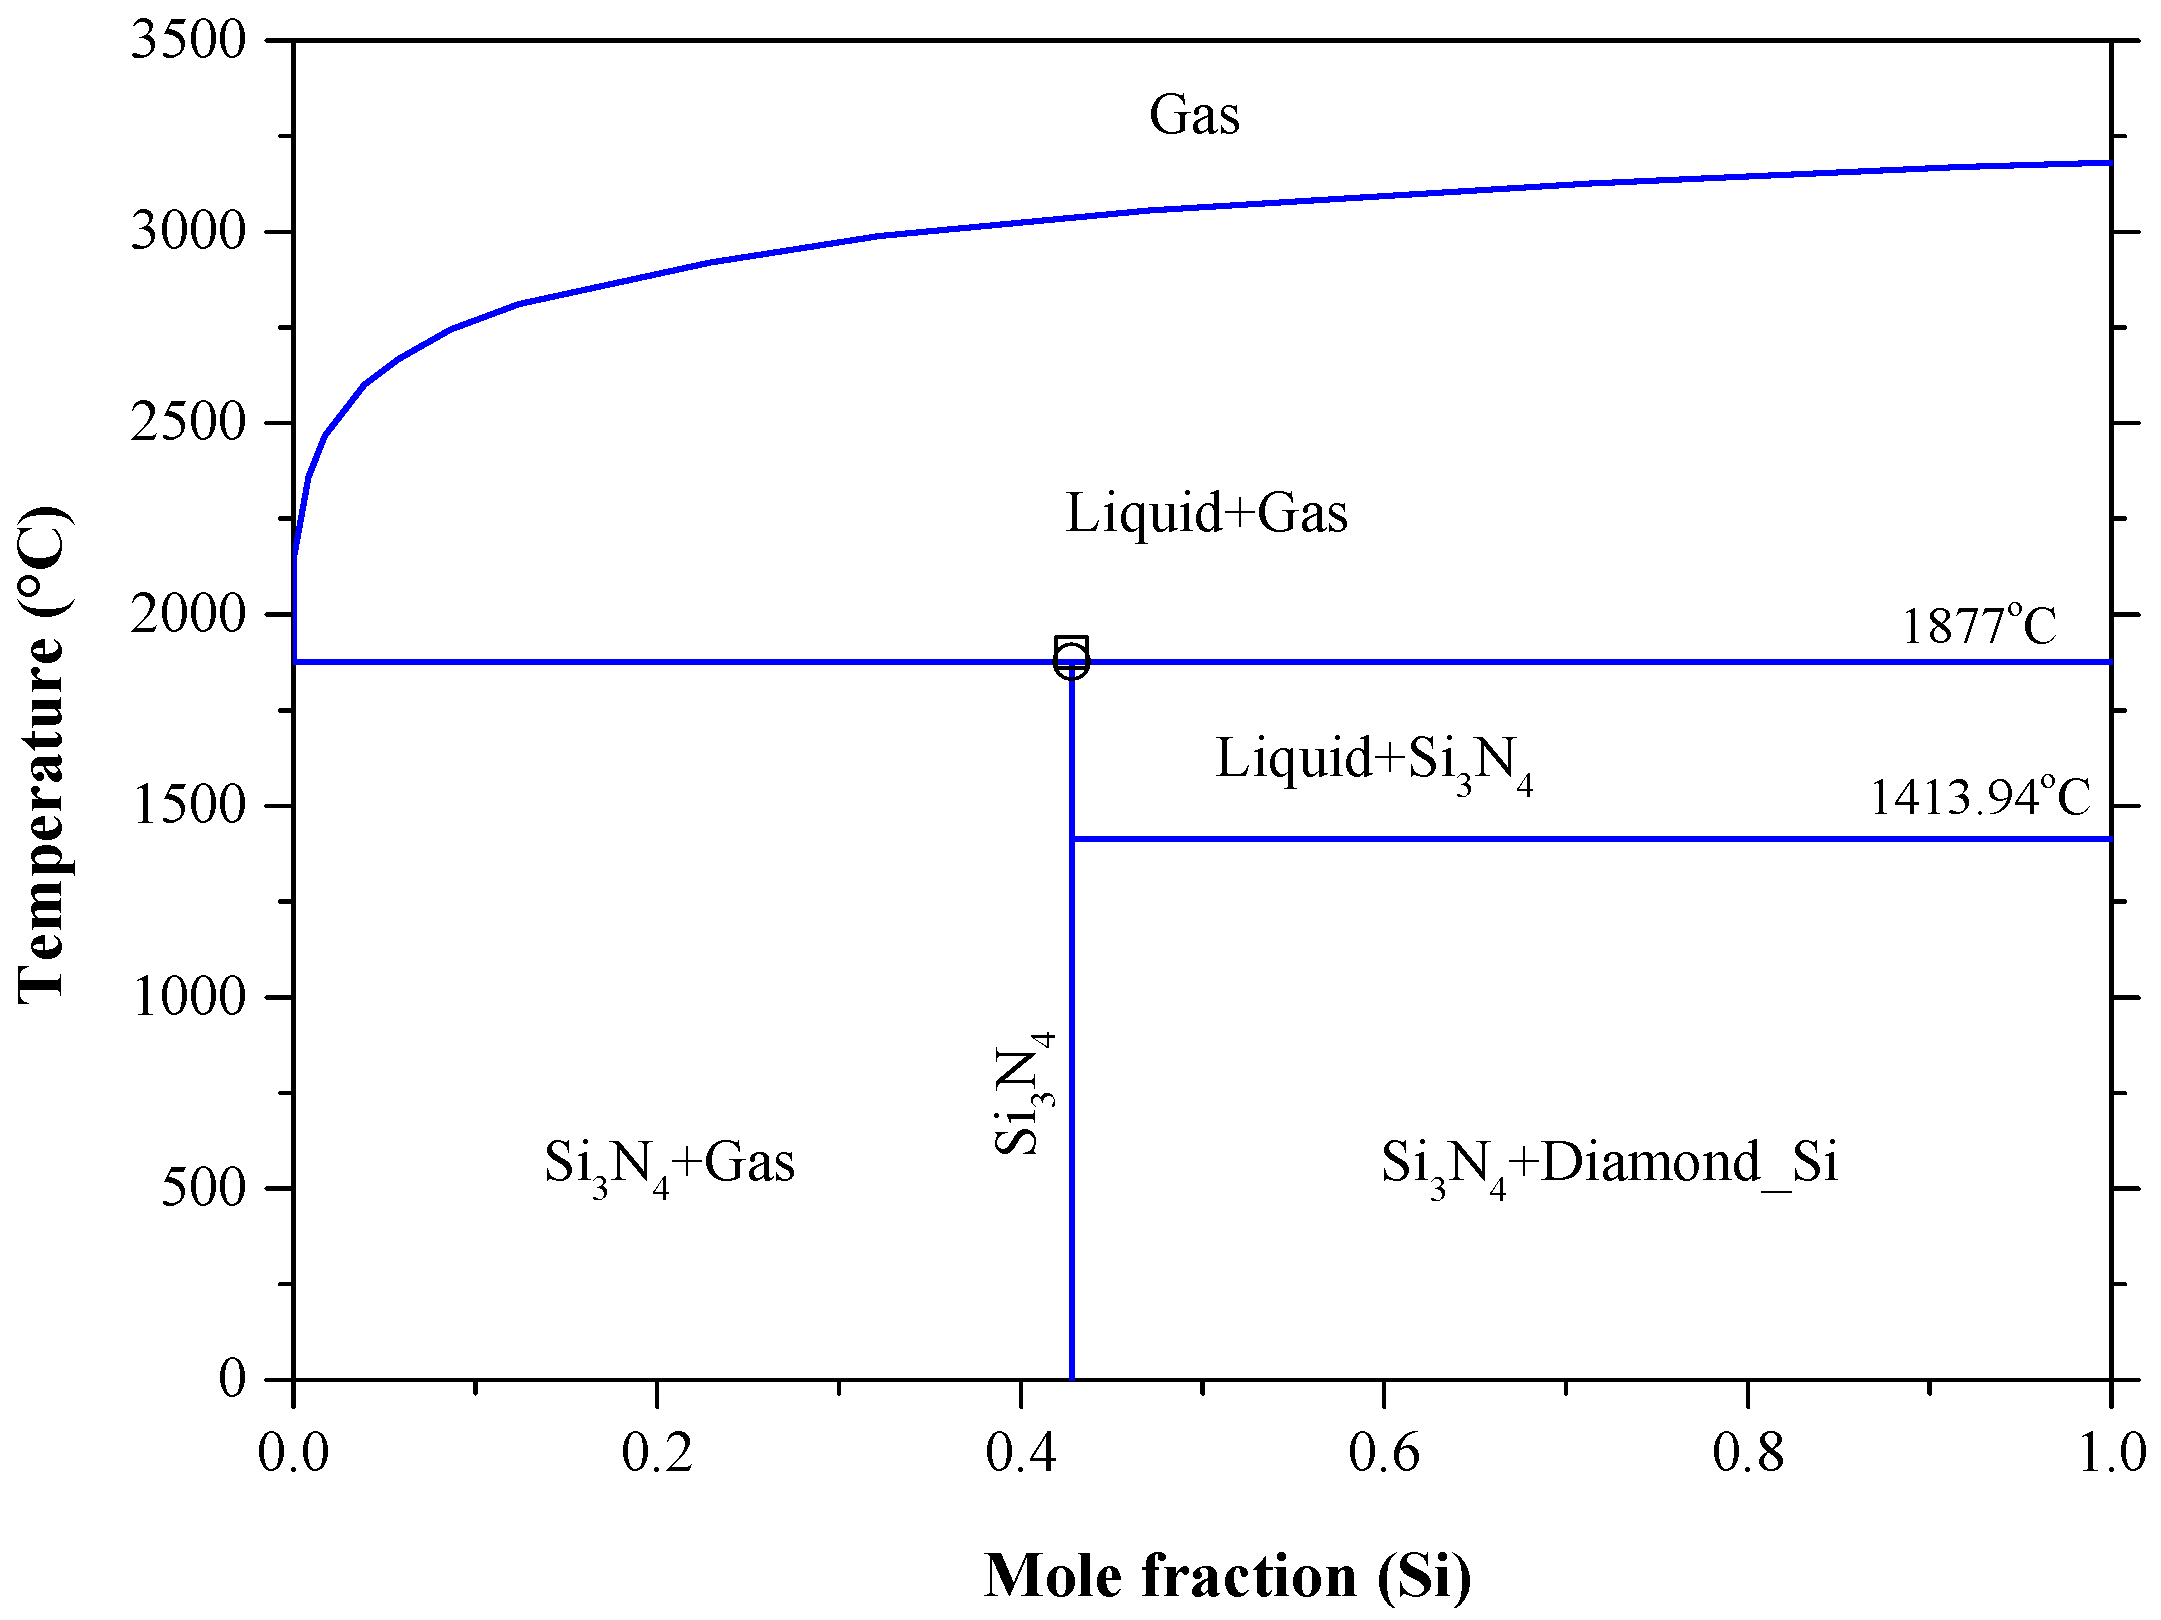
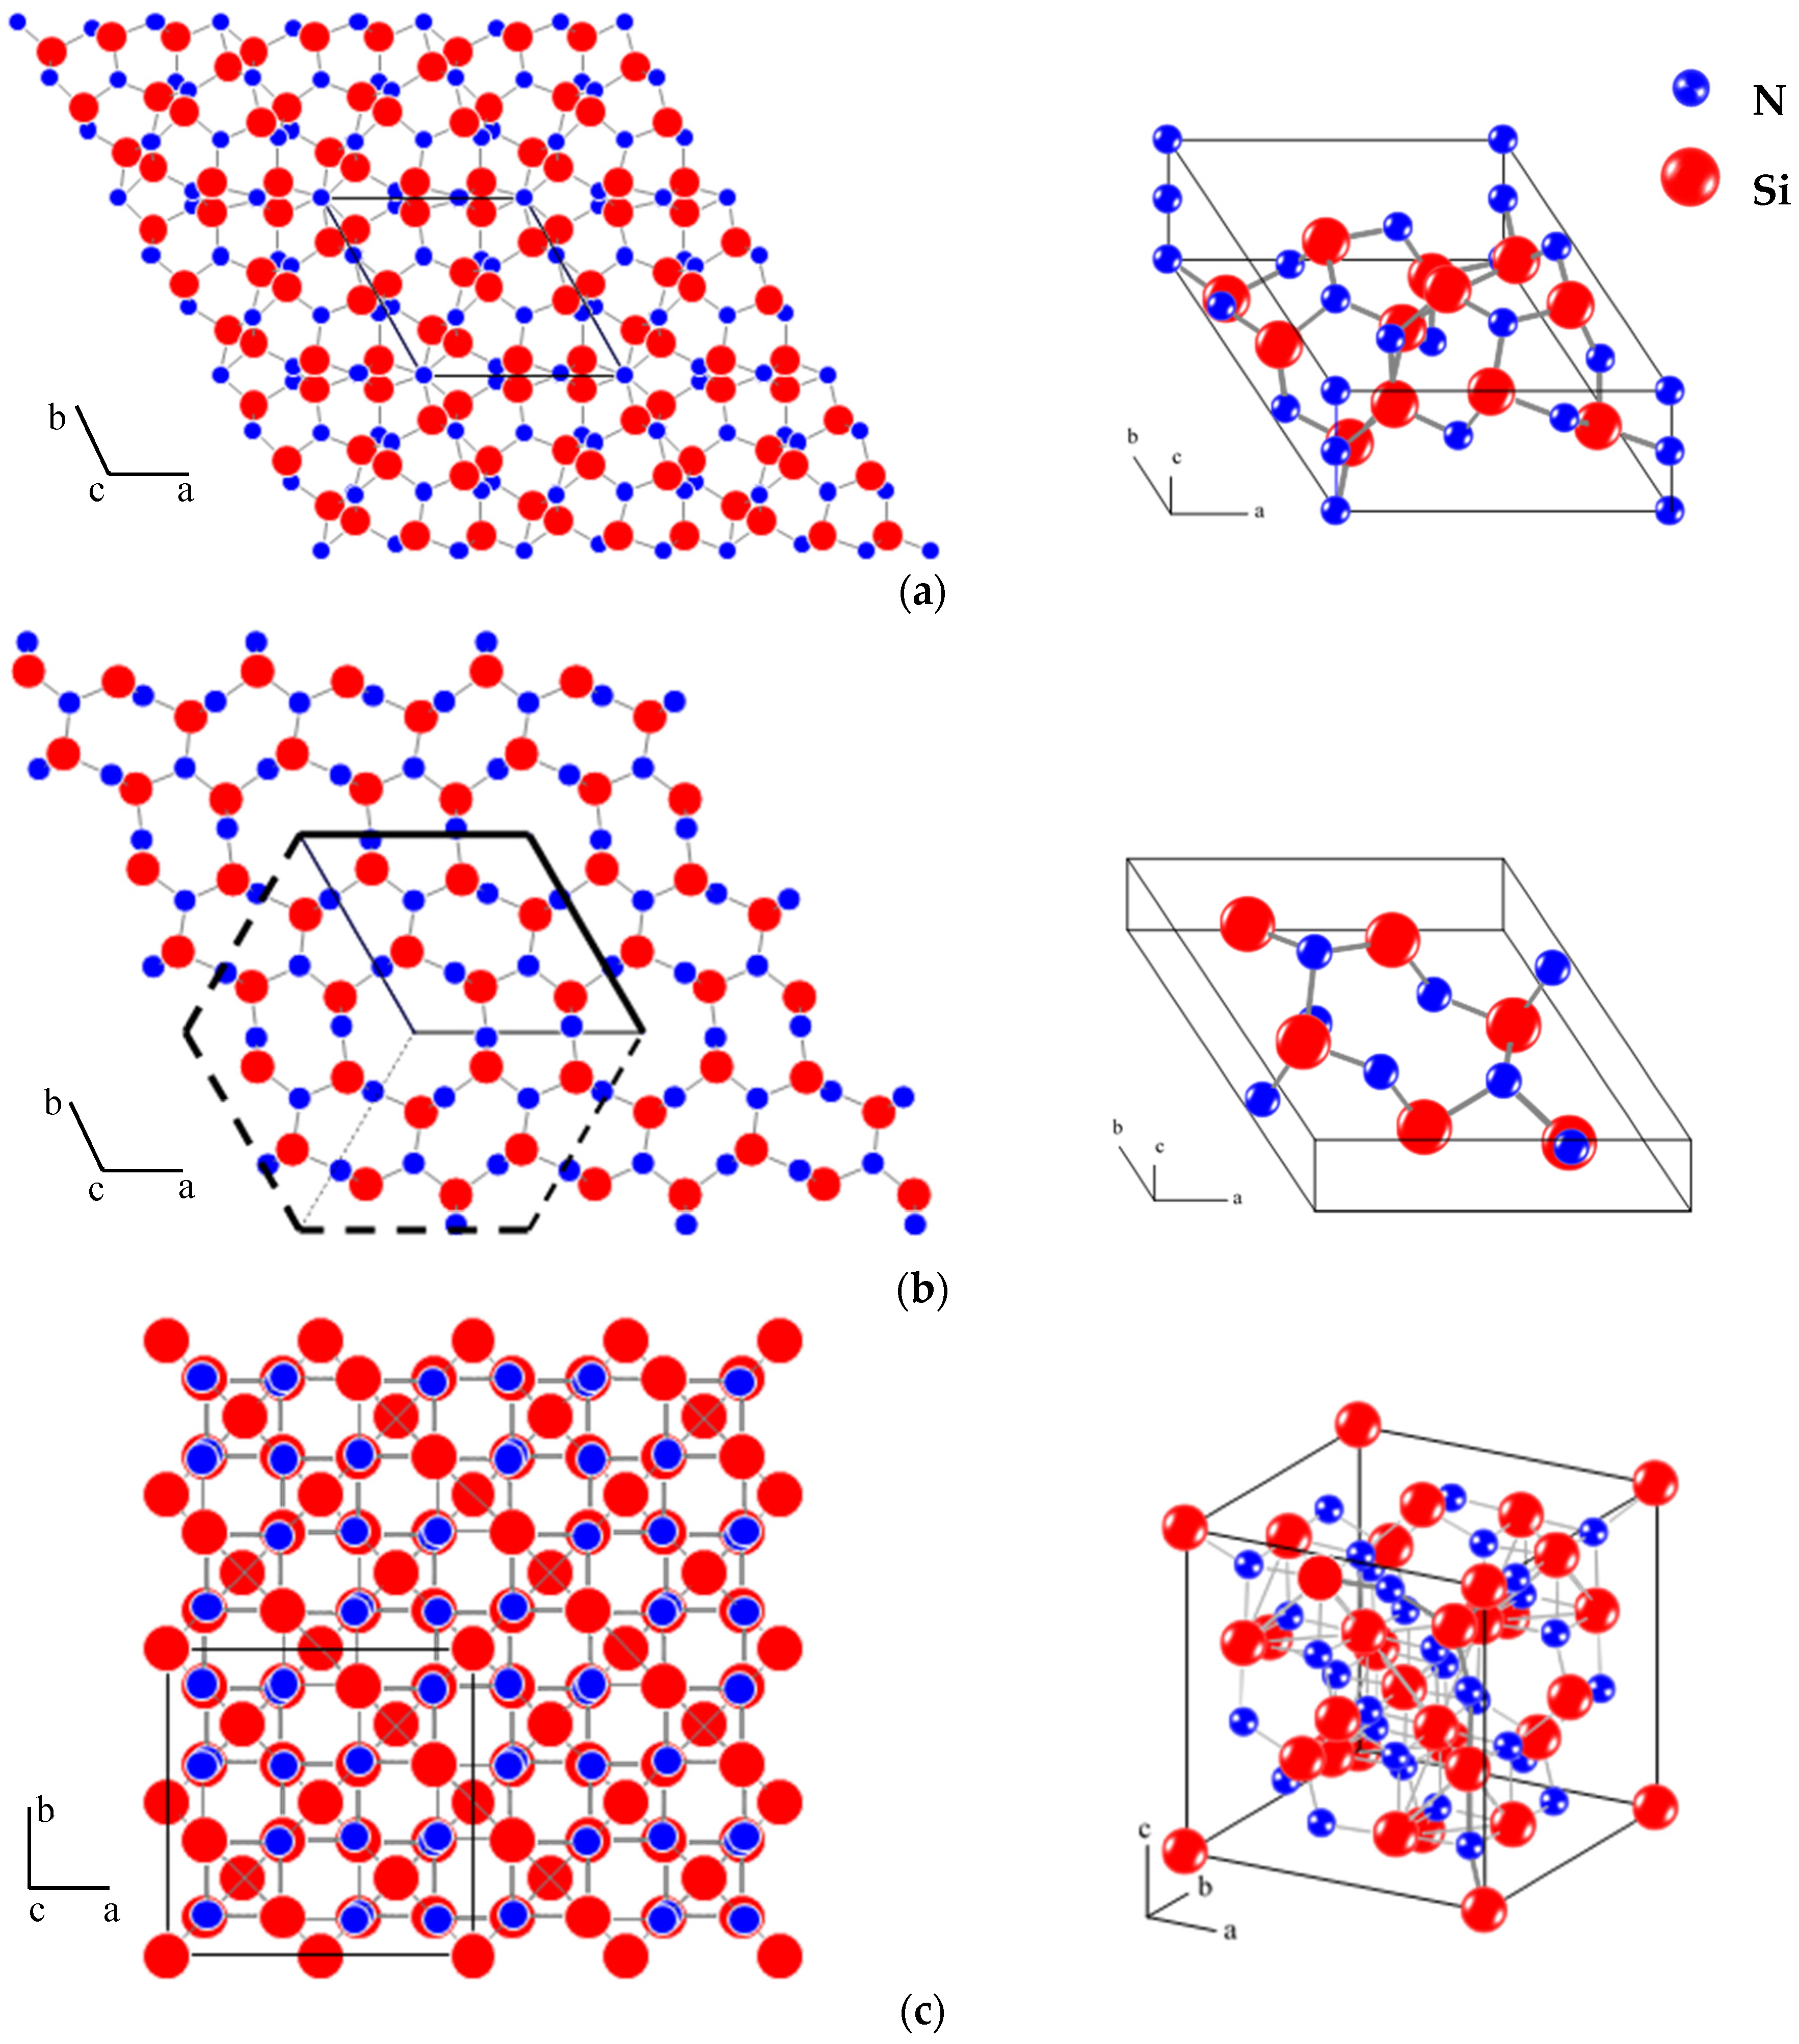
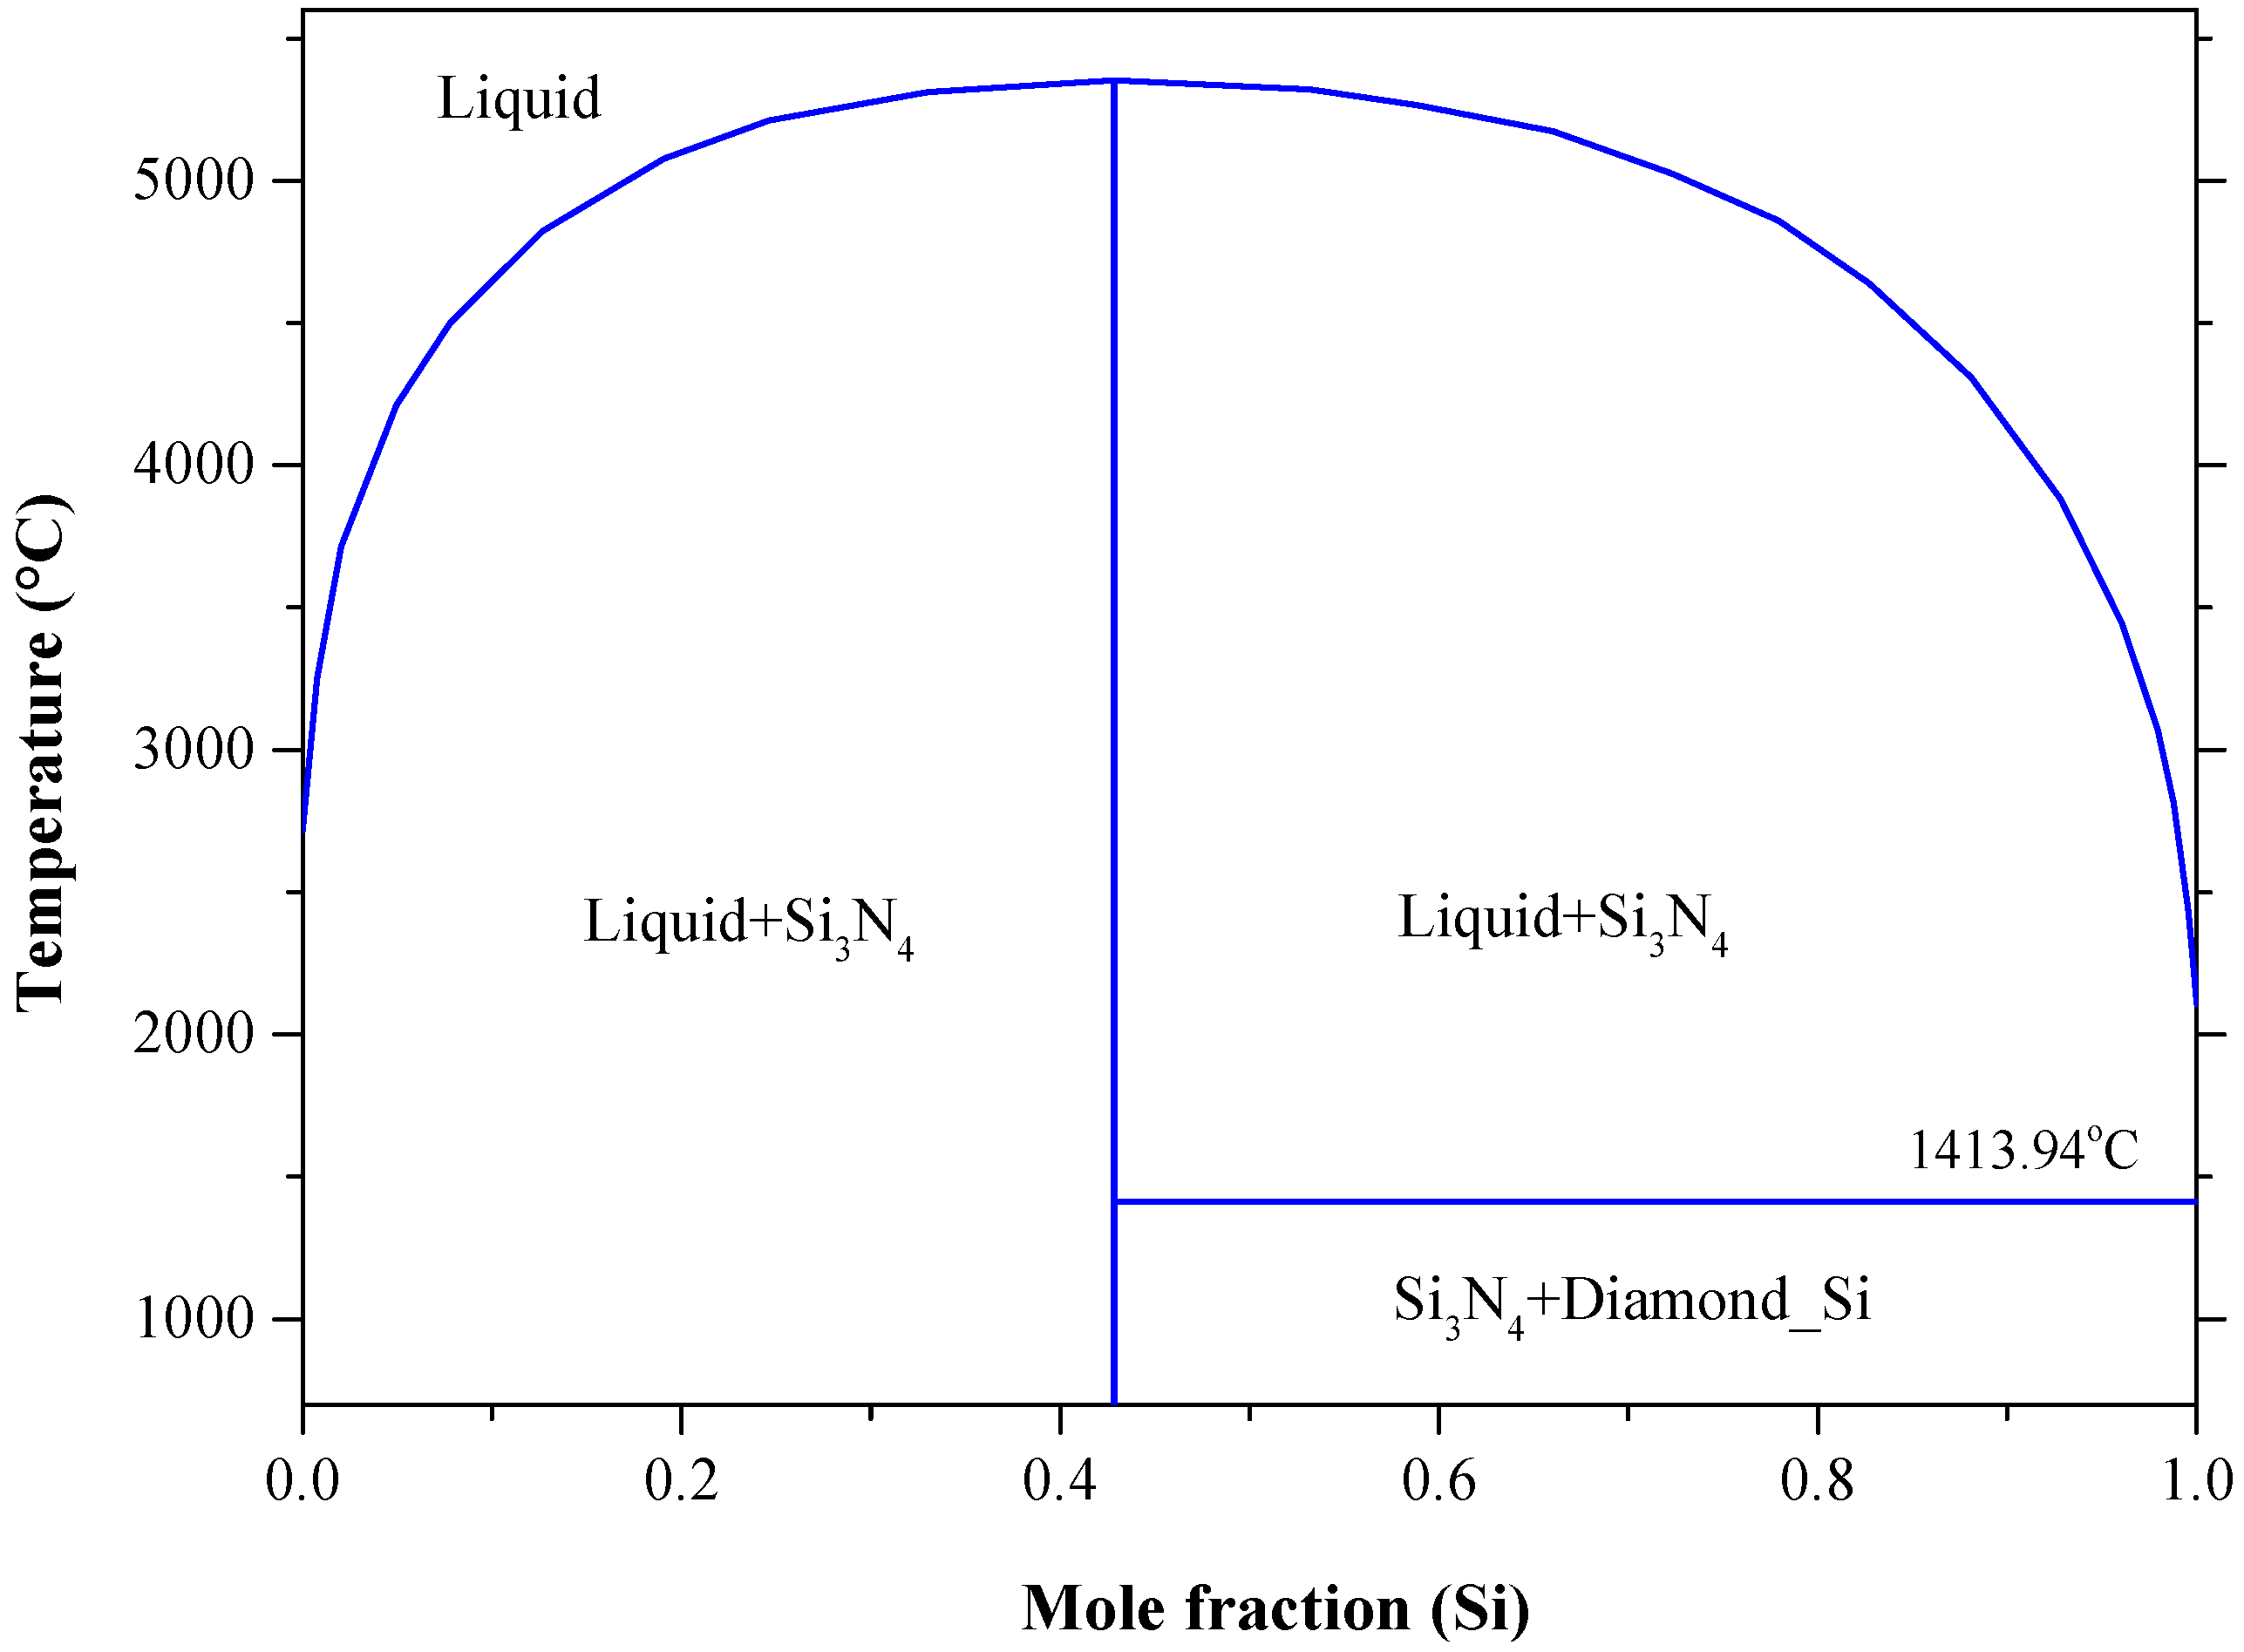
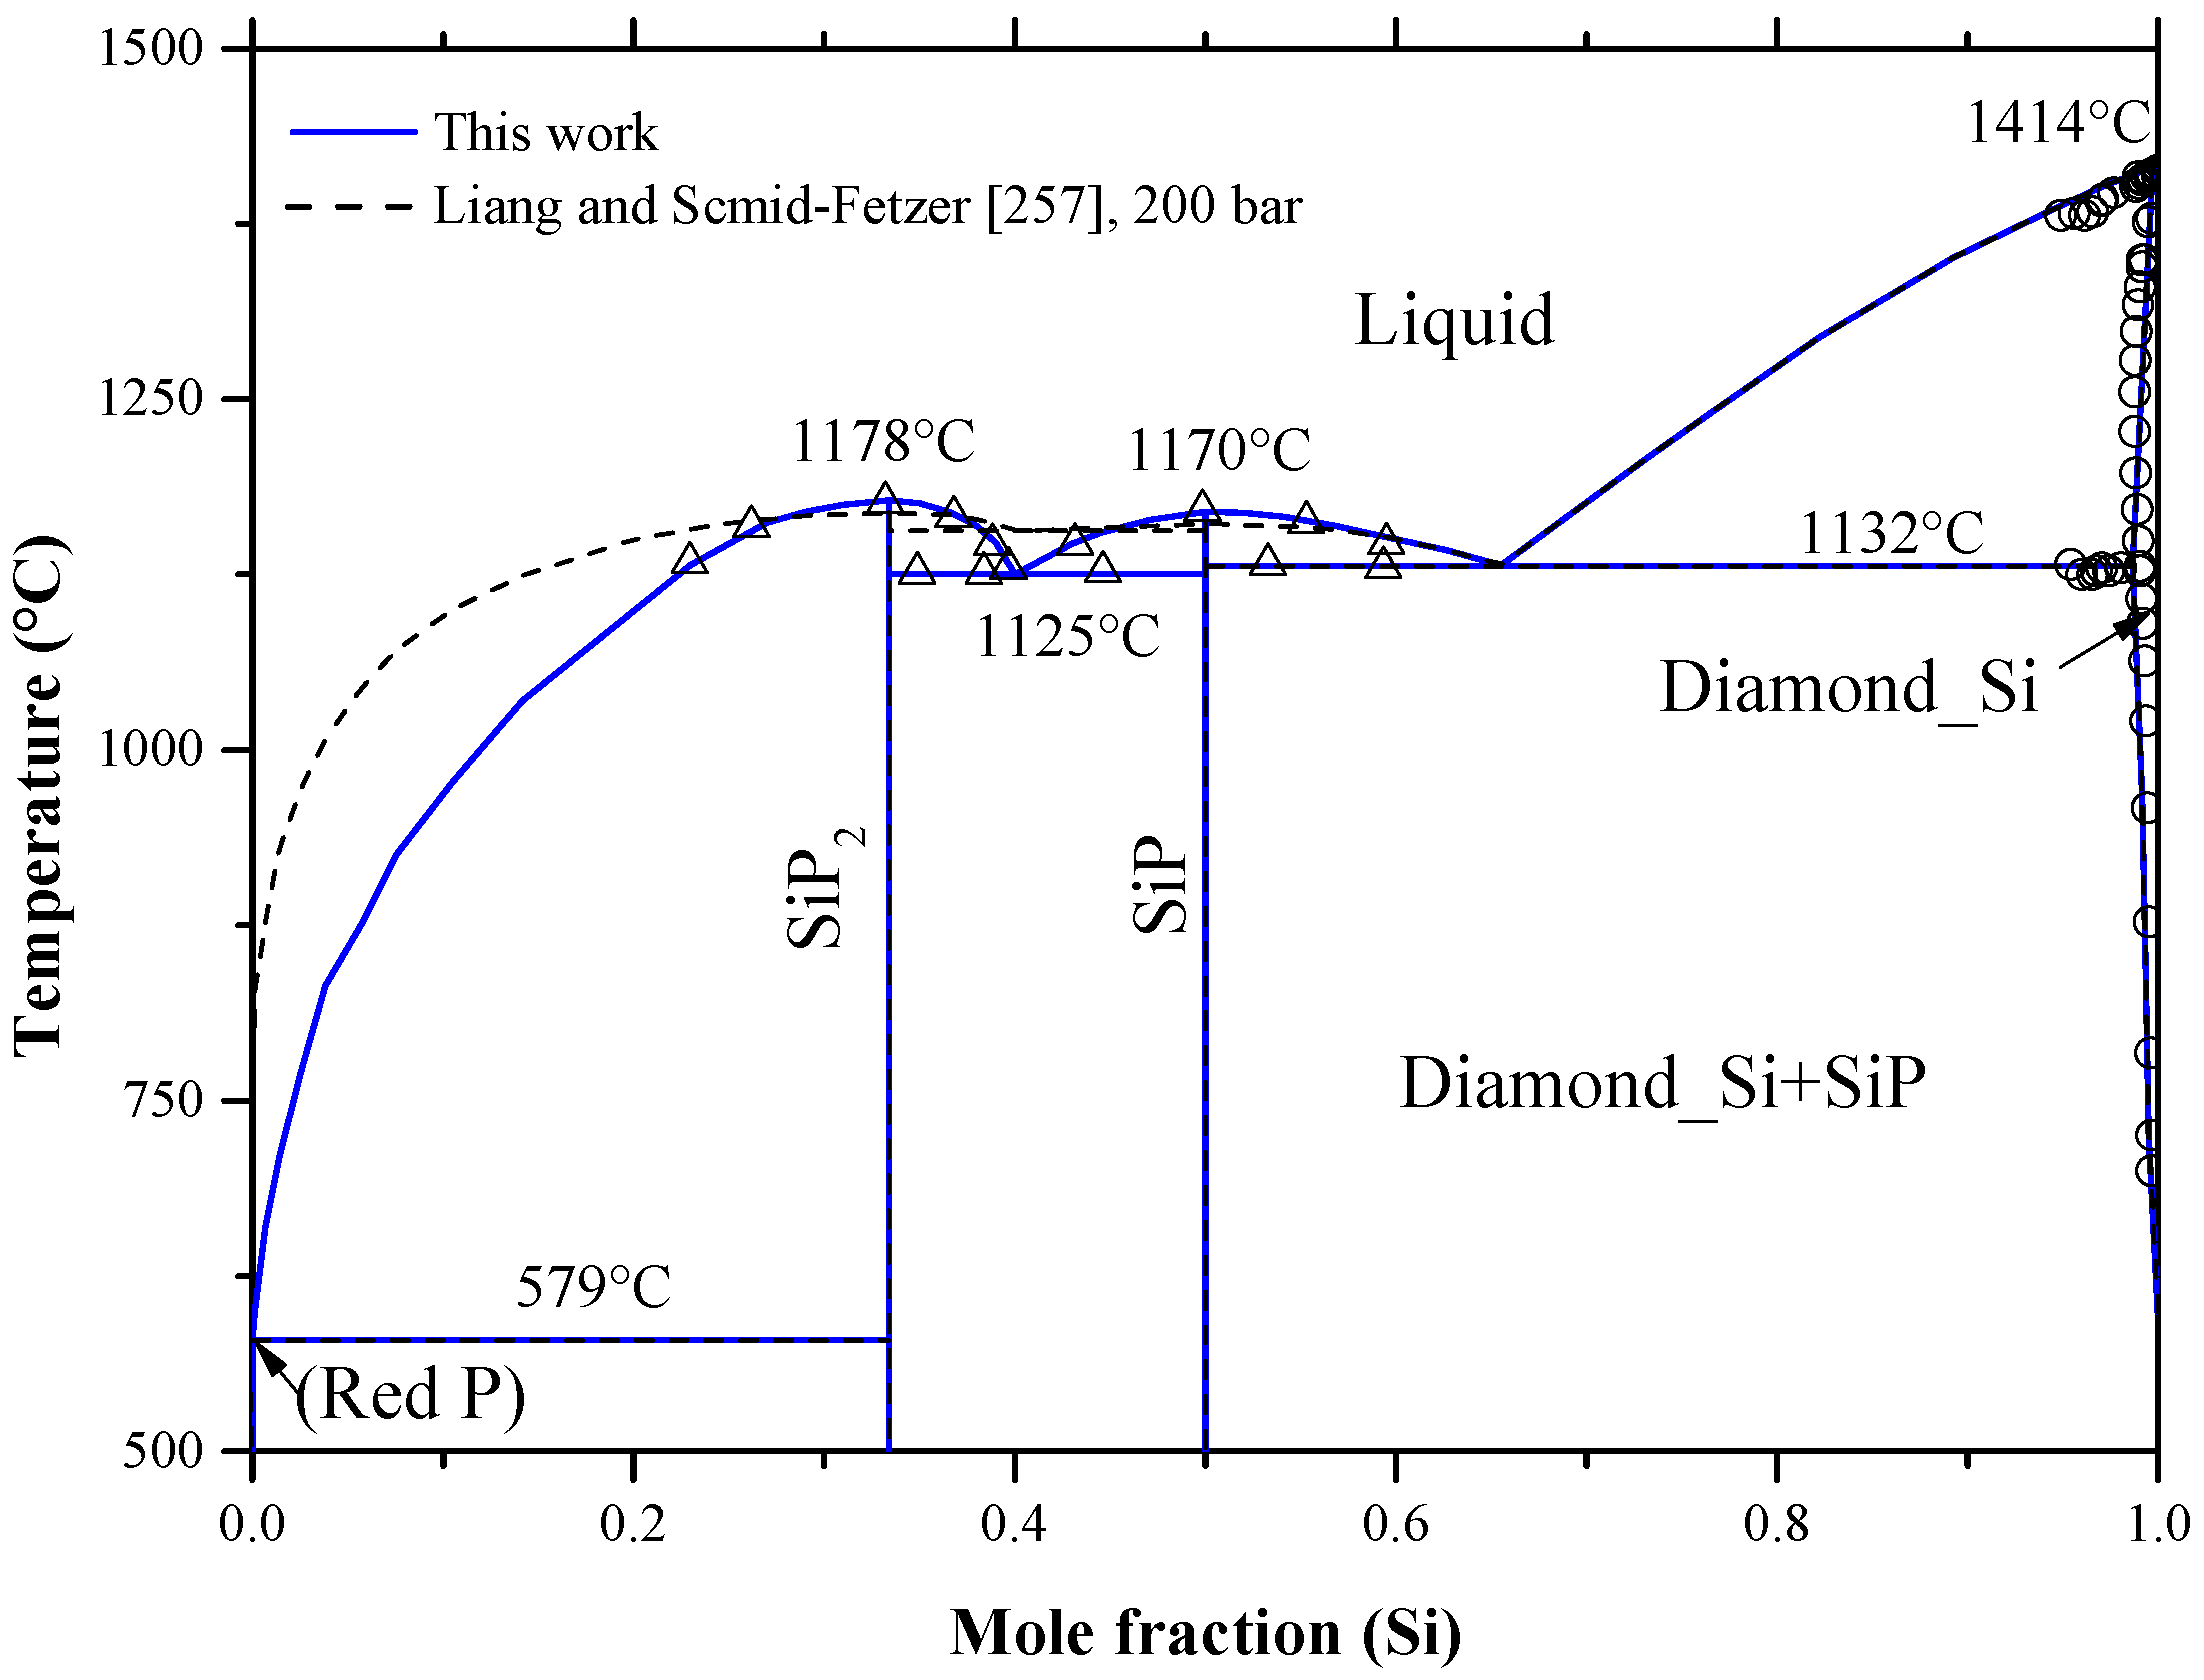
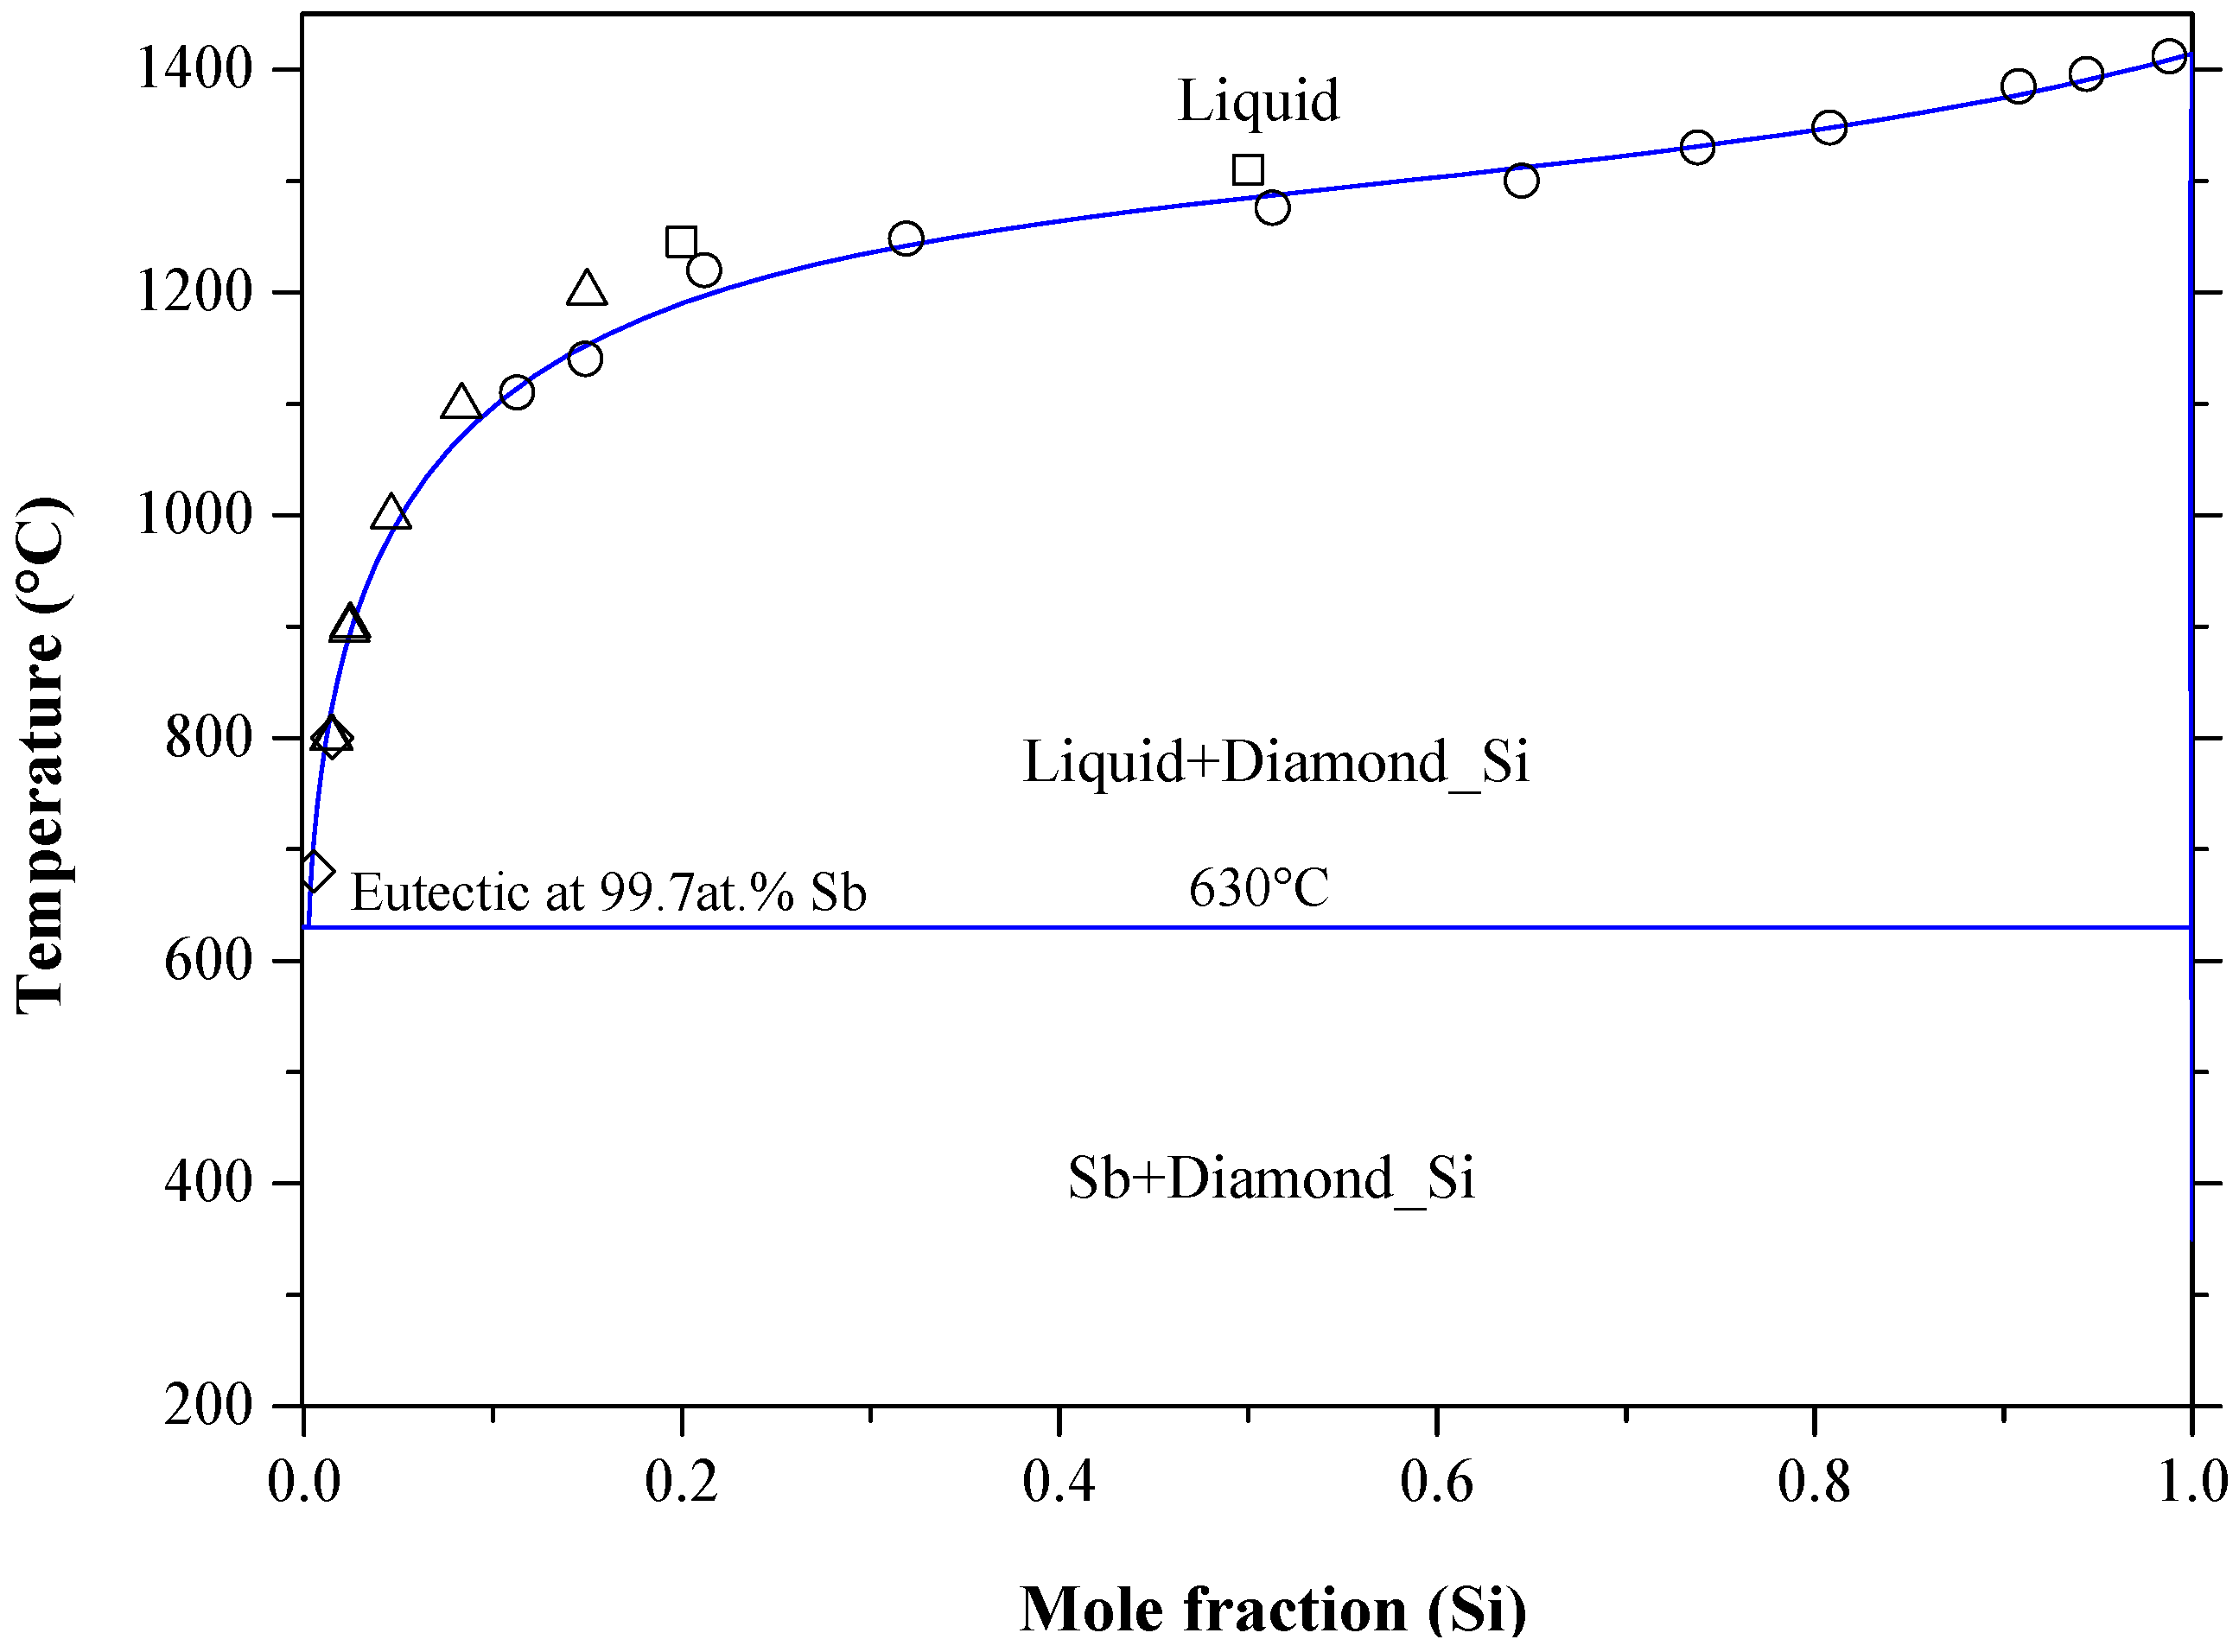
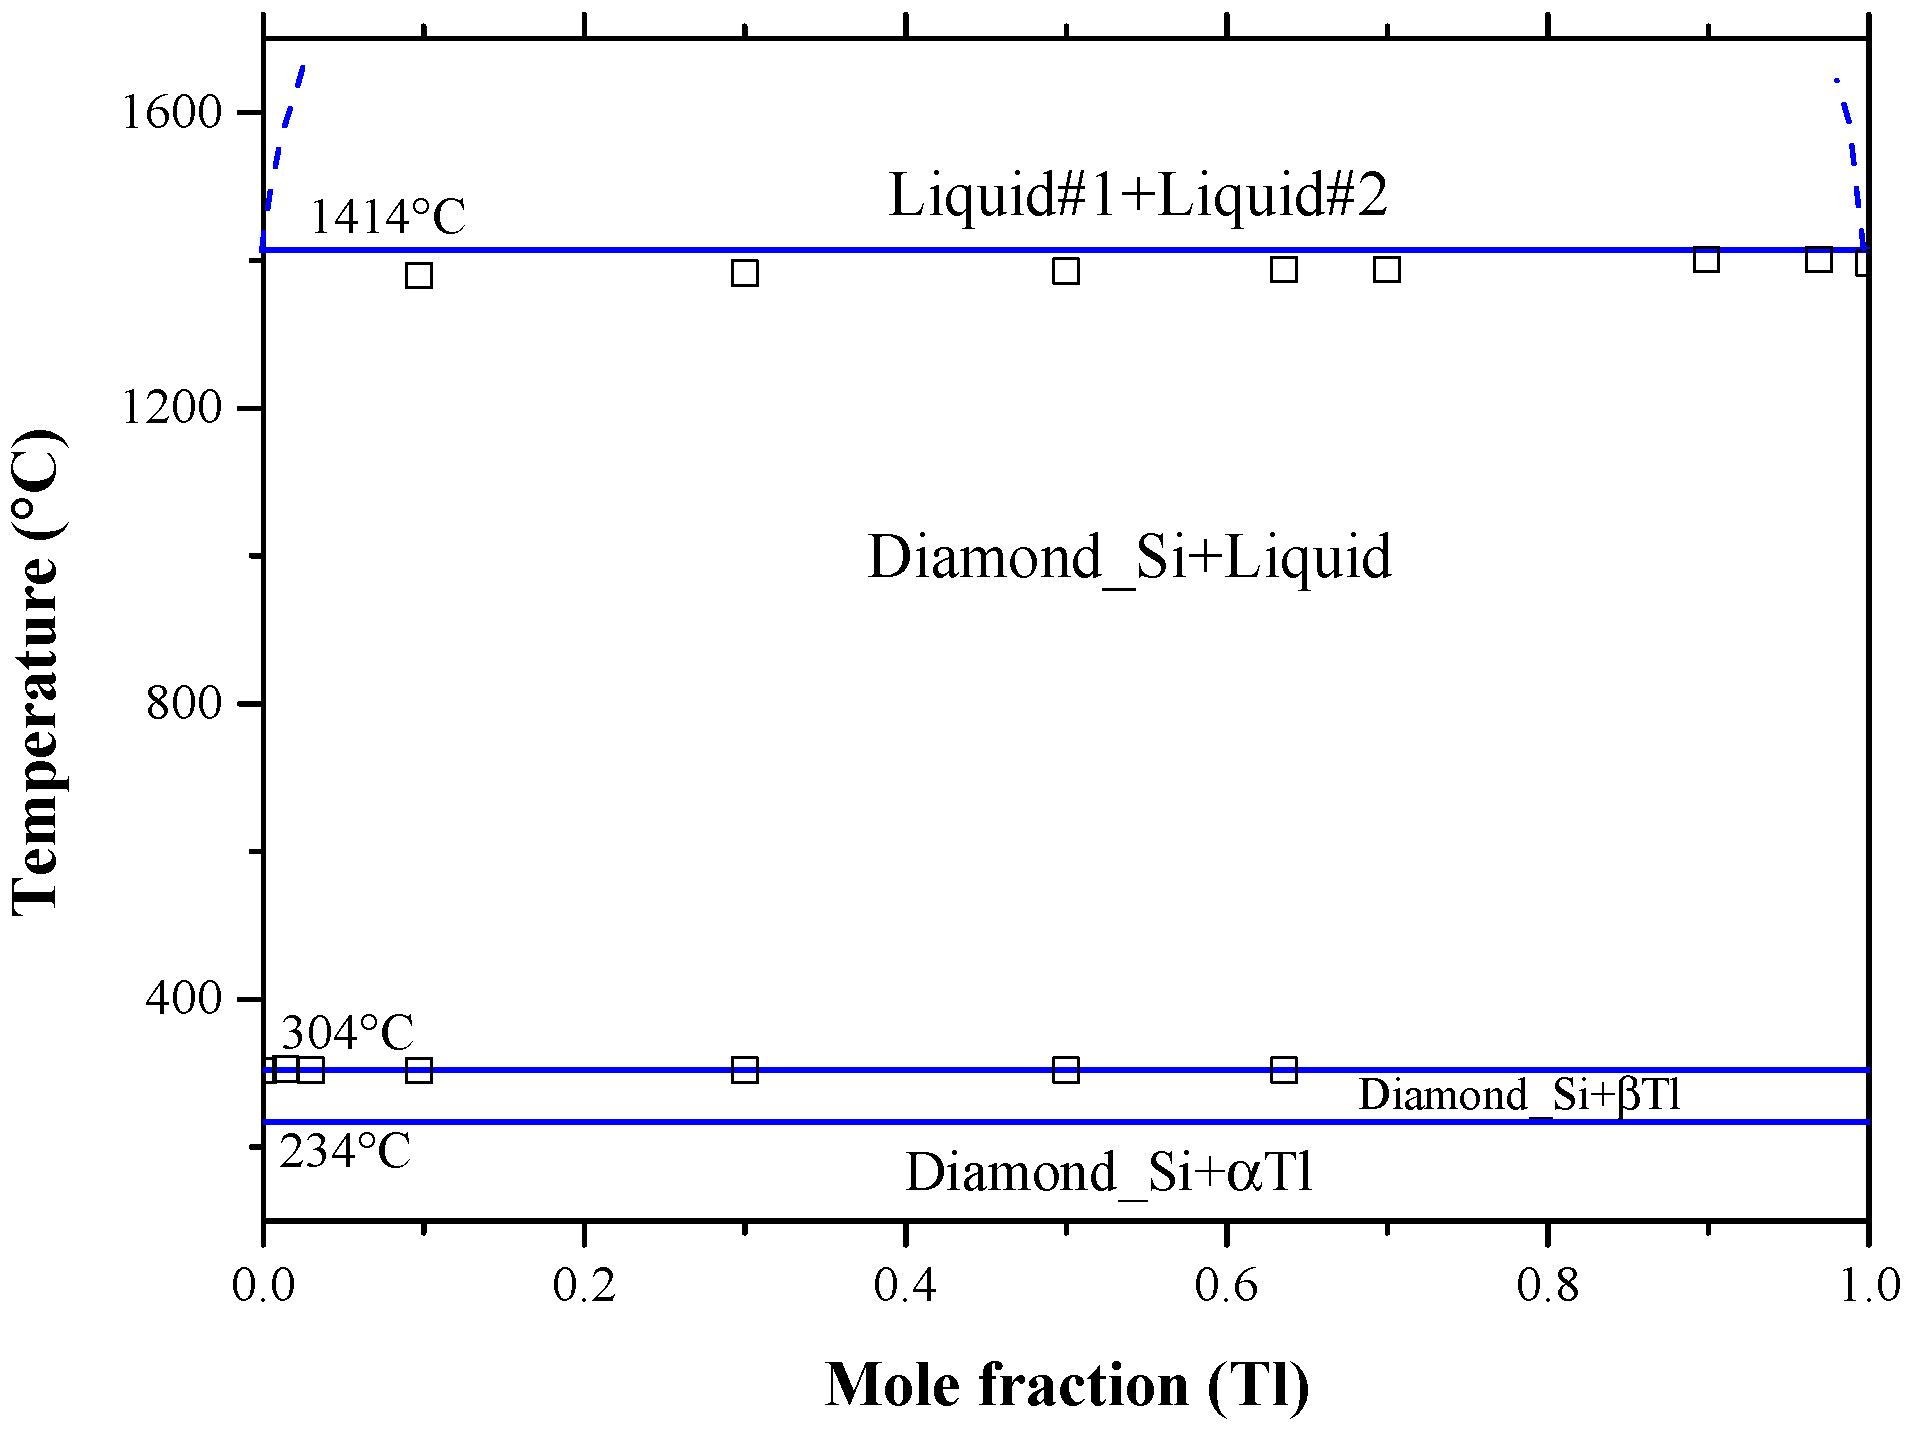
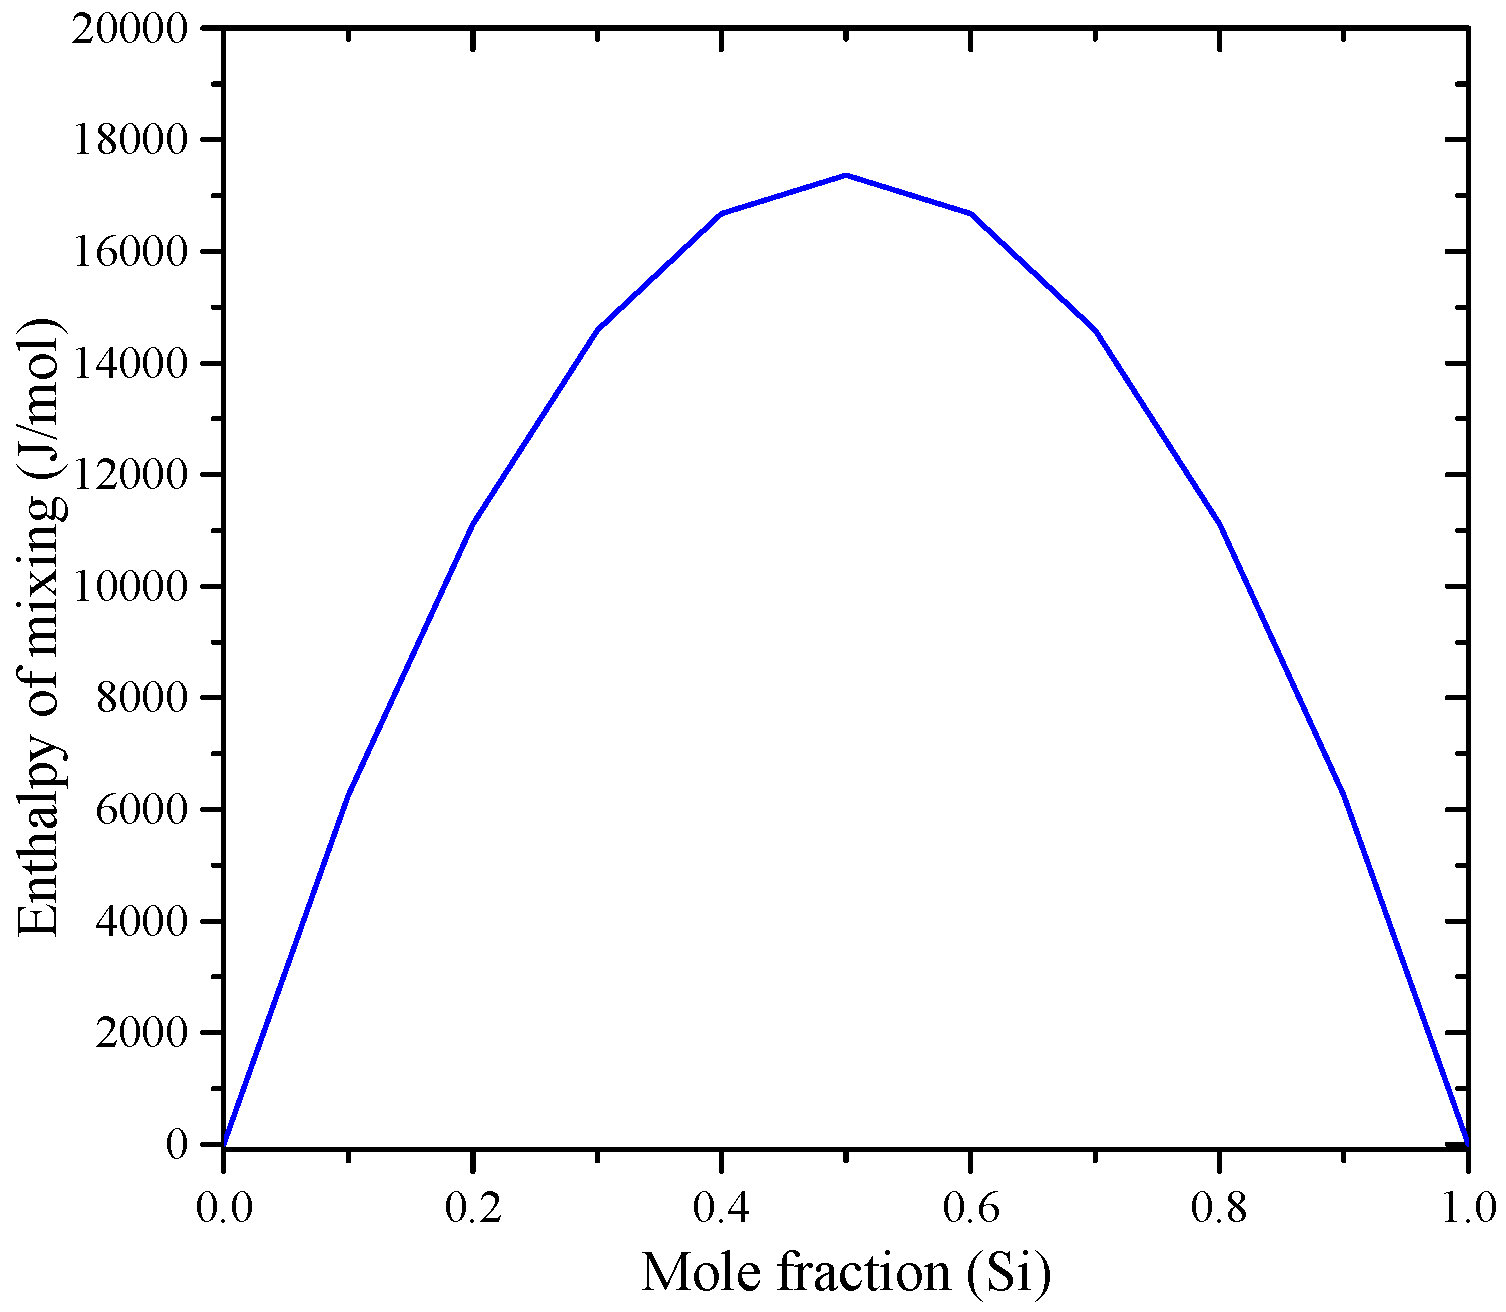
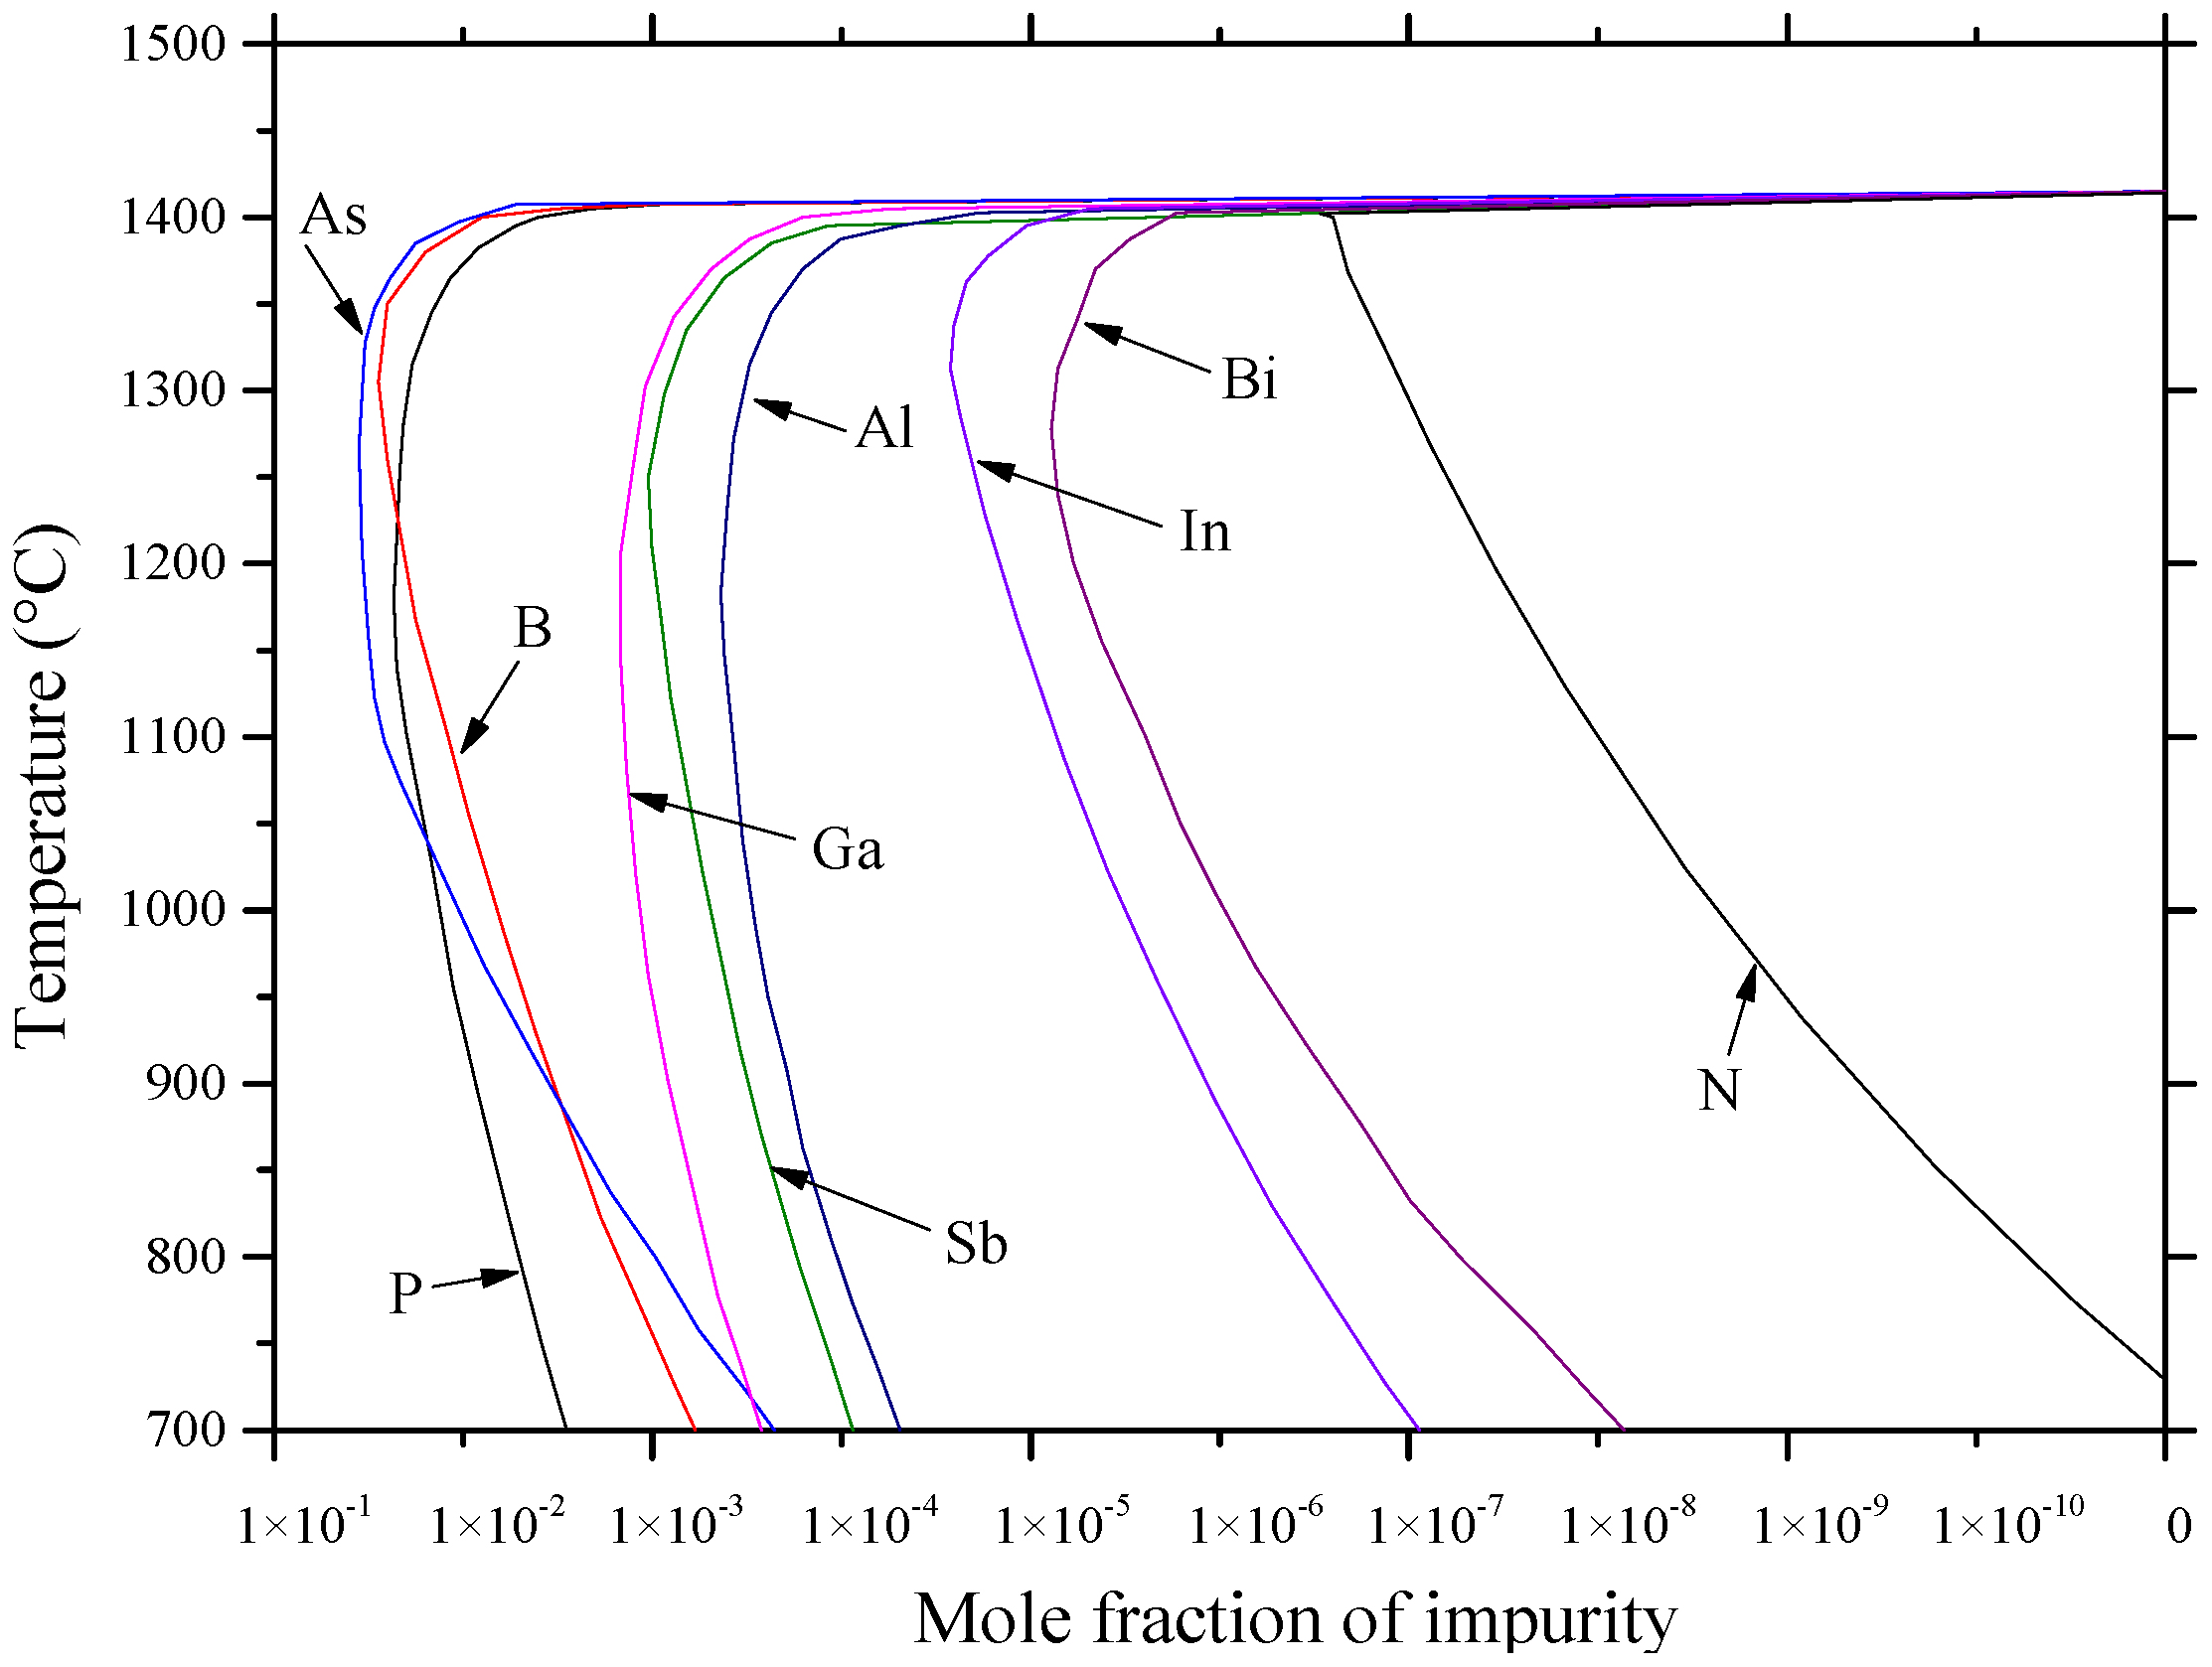
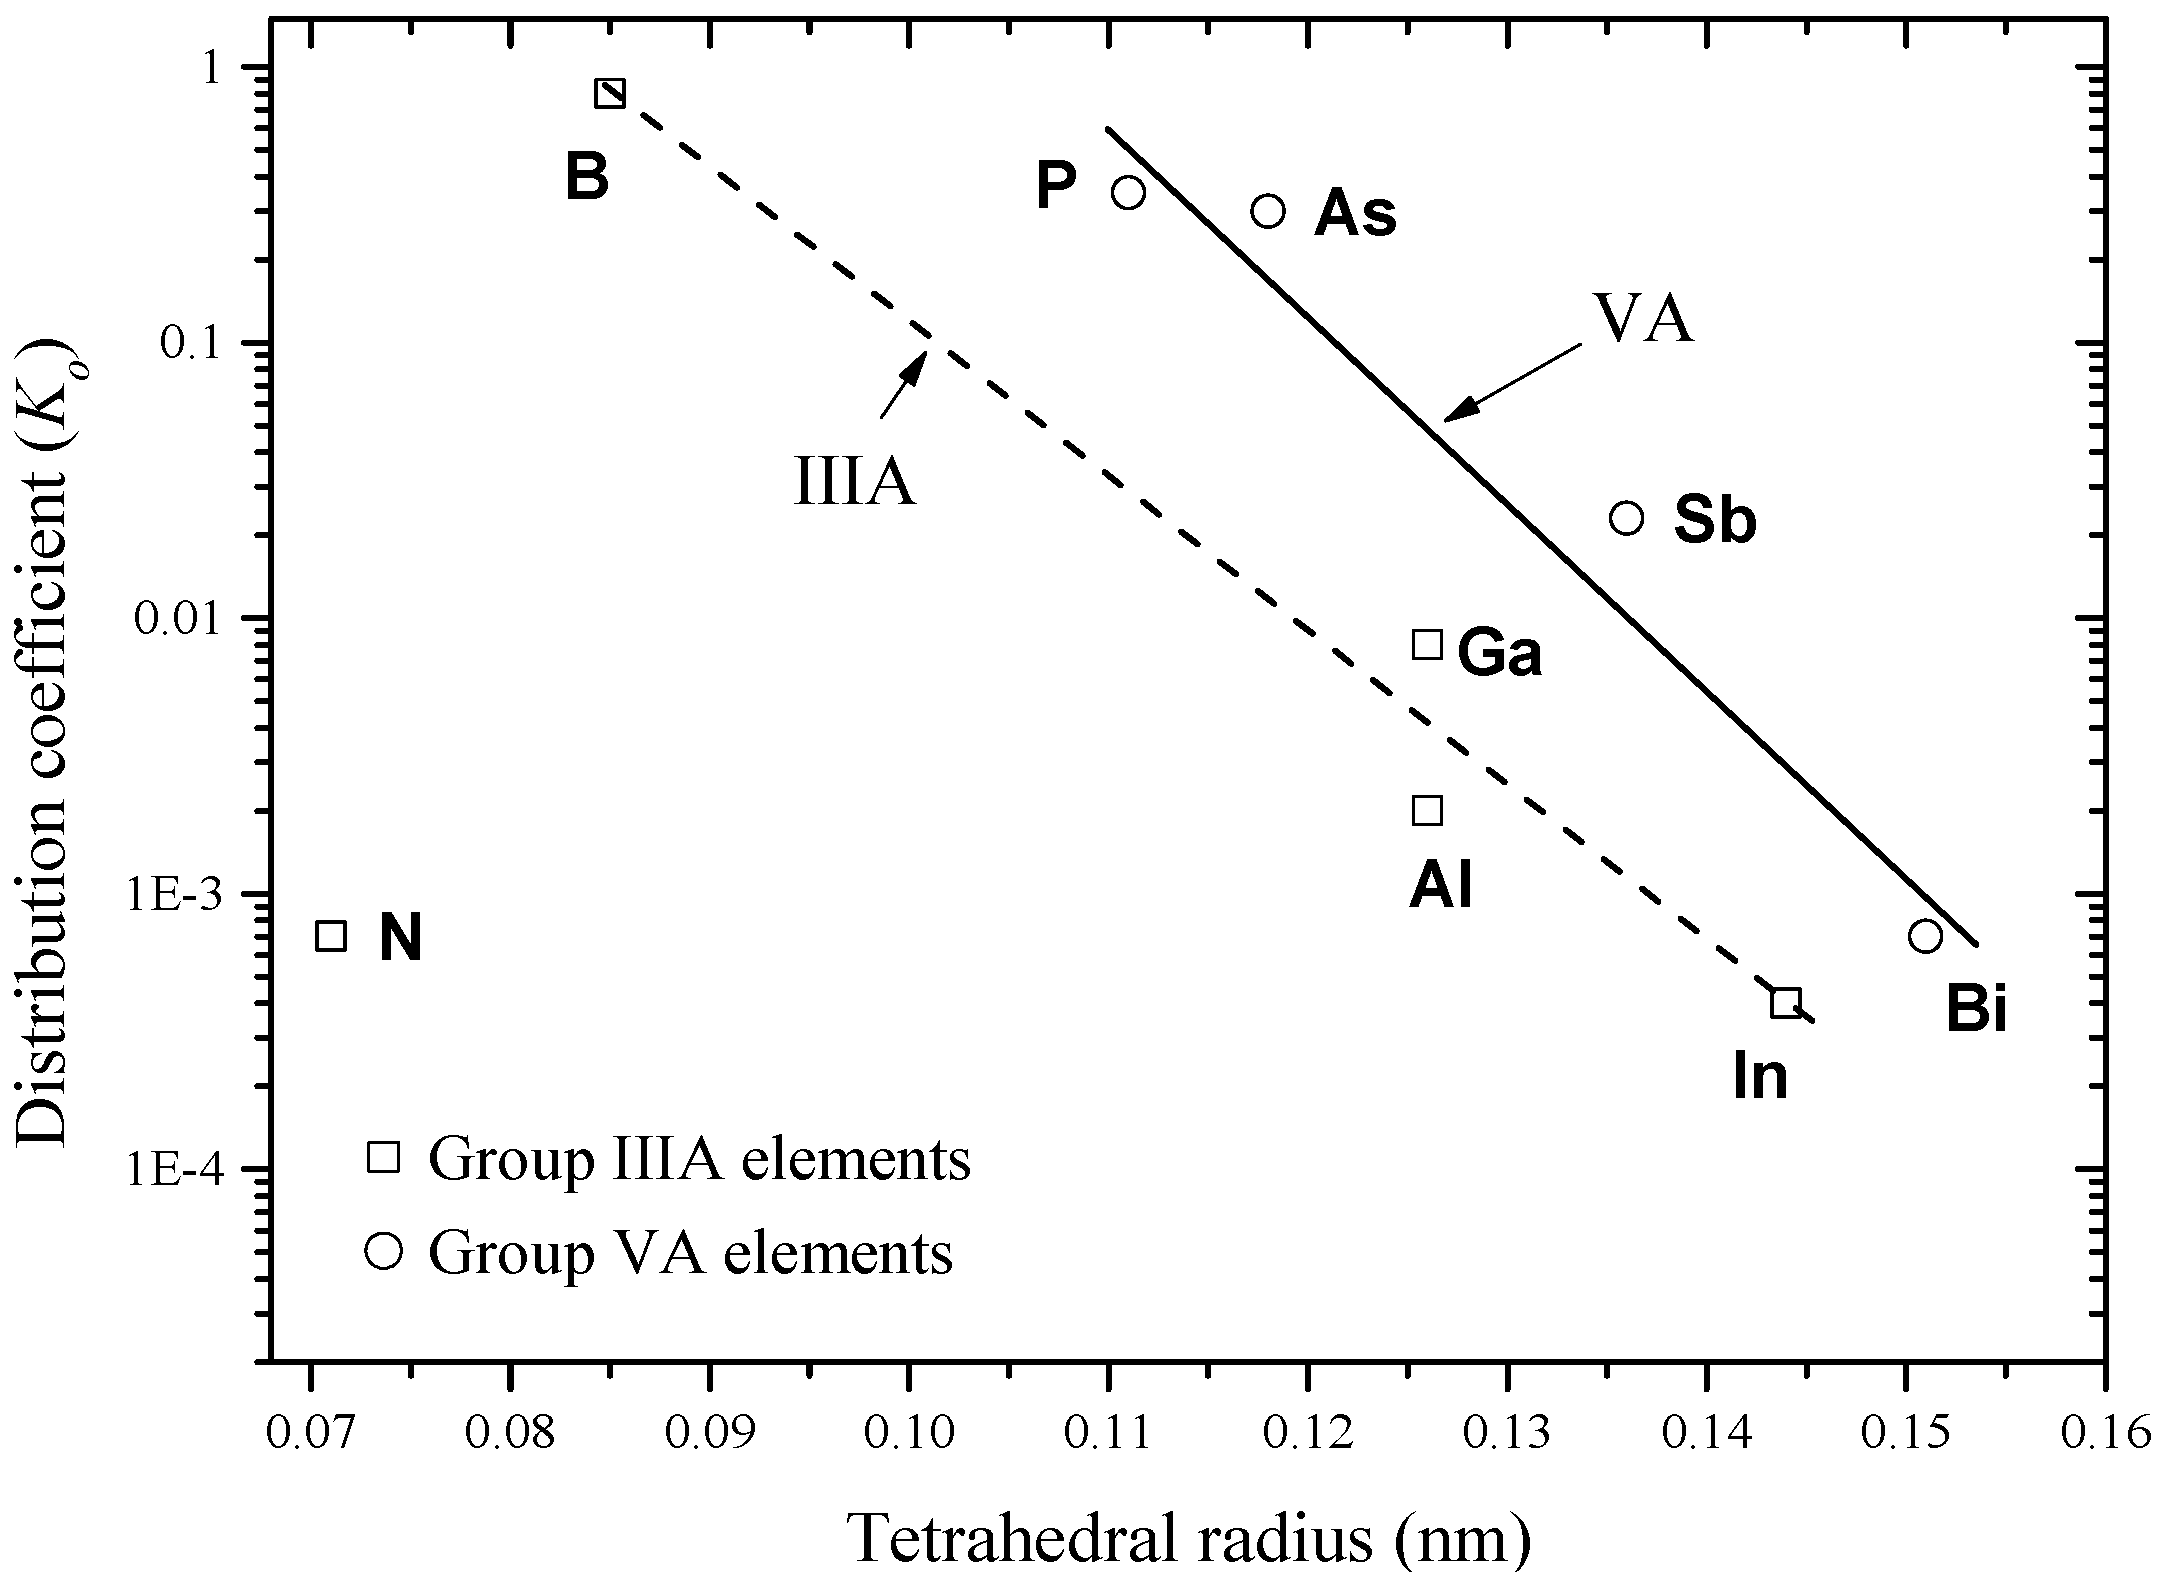
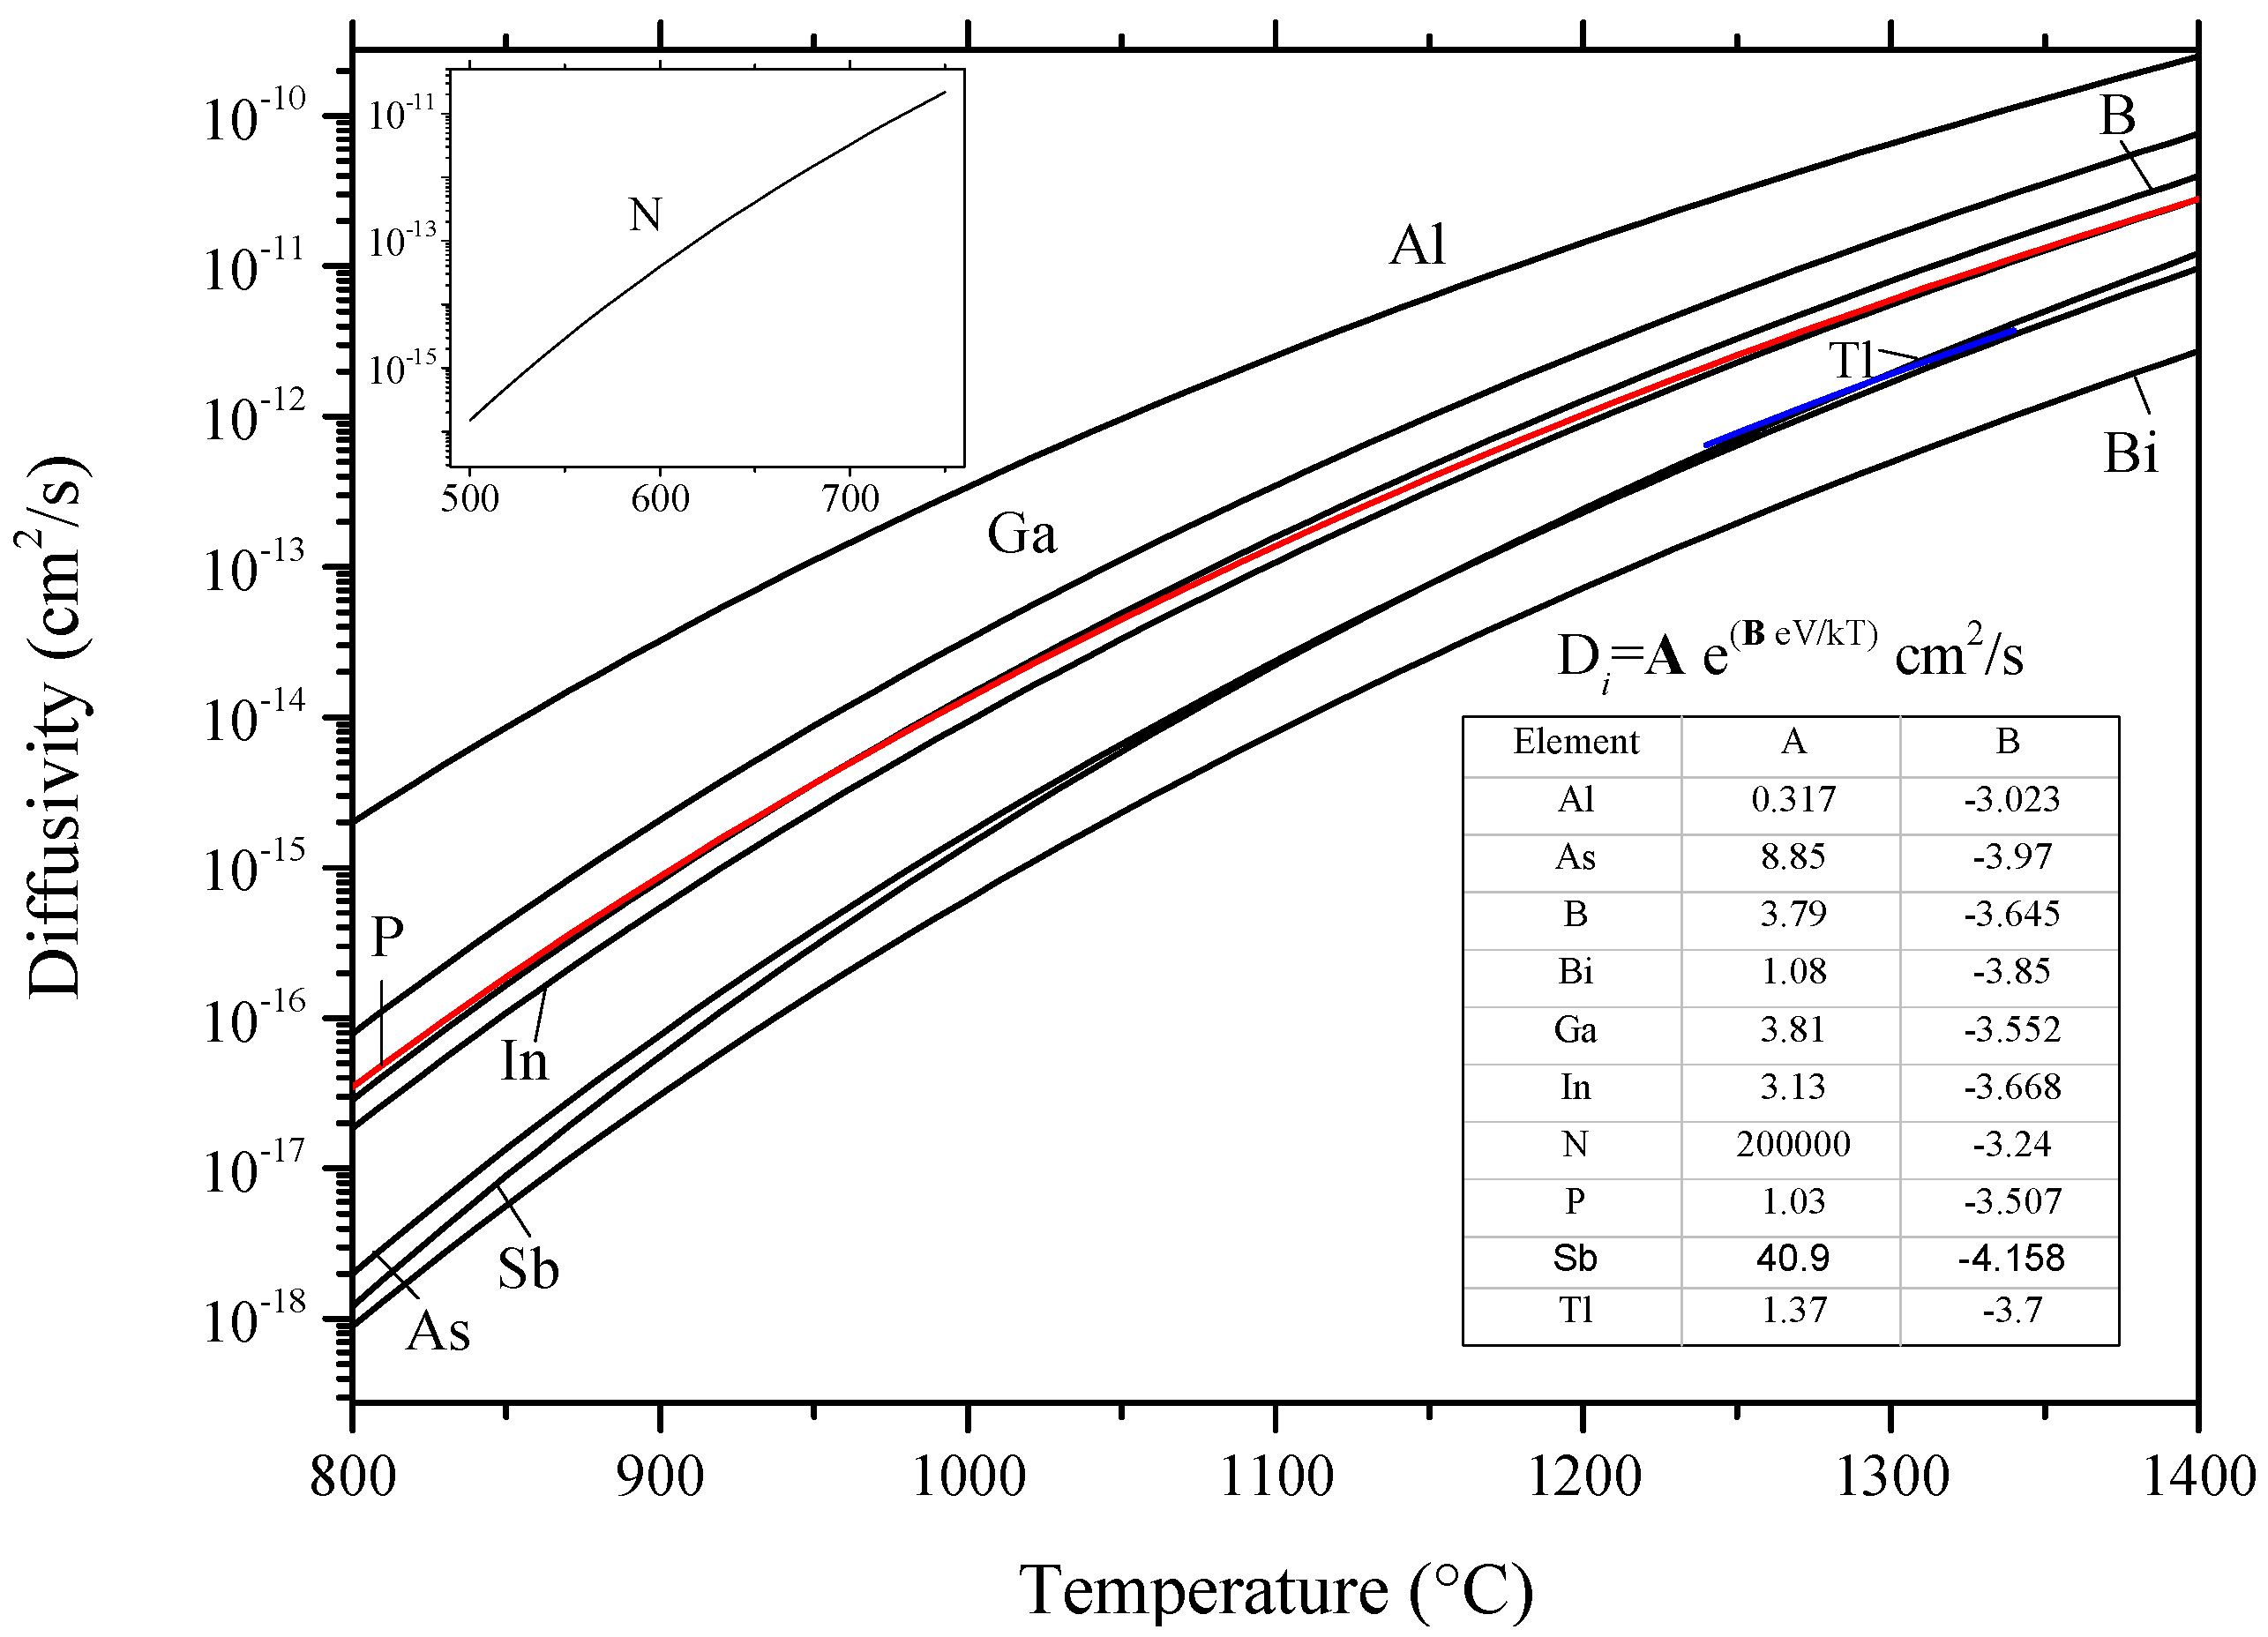
Table 1.
Distribution coefficient (Ko) of studied elements in this work at melting point of Si.
| Element | Ko [28] | Element | Ko [28] |
|---|---|---|---|
| Al | 0.002 | In | 4 × 10⁻⁴ |
| As | 0.300 | N1 | 7 × 10⁻⁴ |
| B | 0.800 | P | 0.350 |
| Bi | 7 × 10⁻⁴ | Sb | 0.023 |
| Ga | 0.008 | Tl | - |
1 Ko for nitrogen was taken from [32].
Table 2.
Crystallographic data of the solid phases in the binary systems covered in the current study.
Table 2.
Crystallographic data of the solid phases in the binary systems covered in the current study.
| System | Phase | Prototype | Lattice Parameters (nm) | Space Groupe Number | Space Group | Ref. | ||
|---|---|---|---|---|---|---|---|---|
| a | b | c | ||||||
| All systems | (Si) | C (diamond) | 0.5430 | 227 | Fd-3m | [38,39] | ||
| Al-Si | (Al) | Cu | 0.4047 | 225 | Fm-3m | [38,39] | ||
| As-Si | AsSi | AsSi | 1.598 | 0.3668 | 0.953 | 12 | C2/m | [39,40,41] |
| As2Si | As2Ge | 1.453 | 1.037 | 0.3728 | 55 | Pbam | [39,42] | |
| As2Si 1 | FeS2 | 6.0232 | 205 | Pa-3 | [41,43] | |||
| (As) | αAs | 0.3760 | 1.0682 | 166 | R-3m | [39,41,43] | ||
| B-Si | β-B | β-B | 1.101 | 2.3900 | 166 | R-3m h | [39,44] | |
| B3Si | B4C | 0.6319 | 1.2713 | 166 | R-3m h | [39,45] | ||
| B6Si | B6Si | 1.439 | 1.827 | 0.988 | 58 | Pnnm | [39,46] | |
| BnSi n ≈ 23 | β-B | 1.101 | 2.390 | 166 | R-3m | [39,47,48] | ||
| Bi-Si | Bi | αAs | 0.4546 | 1.1862 | 166 | R-3m | [49,50] | |
| Ga-Si | (αGa) | αGa | 0.45192 | 0.76586 | 0.45258 | Cmca | [39,51] | |
| (βGa) | 0.27713 | 0.80606 | 0.33314 | 15 | C12/c1 | [39,51] | ||
| (γGa) | γGa | 1.0593 | 1.3523 | 0.5203 | 63 | Cmcm | [39,51] | |
| (δGa) | 0.909 | 1.702 | 177 | R-3m | [39,51] | |||
| In-Si | (In) | In | 0.4599 | 0.4947 | F4/mmm | [52] | ||
| N-Si | αSi3N4 | Si3N4 | 0.7818 | 0.5591 | 159 | P31c | [53] | |
| βSi3N4 | Si3N4 | 0.7595 | 0.2902 | 173 | P63 | [54] | ||
| γSi3N41 | Fe3O4 | 0.7772 | 227 | Fd-3m | [39] | |||
| P-Si | P(red) | P | 0.9210 | 0.9250 | 2.2600 | 13 | P12/c1 | [39] |
| SiP | SiP | 0.3511 | 2.0488 | 1.3607 | 36 | Cmc21 | [39,55] | |
| SiP2 | GeAs2 | 1.397 | 1.008 | 0.3436 | 55 | Pbam | [42] | |
| Si6P2.5 | C5W12 | 0.616 | 1.317 | 162 | P-31m | [39] | ||
| Sb-Si | Sb | αAs | 0.4331 | 1.1374 | 166 | R-3m | [39,56] | |
| Si-Tl | αTl | Mg | 0.3456 | 0.5526 | 194 | P63/mmc | [39,57] | |
| βTl | W | 0.3882 | 229 | Im3m | [39,57] | |||
1 High-pressure phase.
Table 3.
and of aluminum in silicon.
| Temperature (°C) | Intrinsic Diffusivity 1 (cm2/s) | Extrinsic Diffusivity 1 (cm2/s) |
|---|---|---|
| 900 | 1.9 × 10⁻¹⁴ | 1.2 × 10⁻¹⁶ |
| 1000 | 2.5 × 10⁻¹³ | 1.4 × 10⁻¹⁵ |
| 1100 | 2.3 × 10⁻¹² | 1.0 × 10⁻¹³ |
1 Diffusivity values reported by [91].
Table 4.
Optimized model parameters of the Al-Si system.
| Phase | Excess Gibbs Energy Parameter (J/Mole) | Ref. |
|---|---|---|
| Liquid | 0 1 2 | [59,98] |
| FCC_Al | 0 | [59,98] |
| Diamond_Si | 0 | This work |
T is the absolute temperature in this table and throughout the paper.
Table 5.
Comparison between the available As-Si phase diagram data.
| Features | Olesinski and Abbaschian [112] | FTlite Database [124] |
|---|---|---|
| Si terminal solid solution | Retrograde behavior | Typical behavior |
| Si-rich eutectic | 60 at % Si at 1097 °C | 56 at % at 1108 °C |
| As-rich eutectic | 9.8 at % Si at 797 °C | 4.7 at % Si at 795 °C |
| As2Si peritectic temperature | 977 °C | 979 °C |
Table 6.
The enthalpy and entropy of formation of the As-Si intermetallic compounds (at 298 K and 1 atmospheric pressure).
Table 6.
The enthalpy and entropy of formation of the As-Si intermetallic compounds (at 298 K and 1 atmospheric pressure).
| Compound | Enthalpy of Formation kJ·(Mole·Atom)−1 | Entropy of Formation (J/Mole·Atom·K) | Ref. | |
|---|---|---|---|---|
| AsSi | Experimental | −5.4 ± 1.2 | - | [140] |
| Calculated | −114.0 | - | [141] | |
| CALPHAD 1 | −5.9 | 30.64 | [124] | |
| As2Si | Experimental | −3.7 ± 2.3 | - | [140] |
| Calculated | −89.0 | - | [141] | |
| CALPHAD | −4.3 | 33.8 | [124] | |
1 Calculations of phase diagram.
Table 7.
Thermodynamic model parameters of the B-Si system.
| Phase | Excess Gibbs Energy Parameter (J/Mole) [155] |
|---|---|
| Liquid | 0 1 |
| Diamond_Si | 0 |
| β-B | 0 |
| B3Si | 0 |
| B6Si | 0 |
| BnSi | 0 |
GHSER is Gibbs free energy values at reference state (1 atm and 298.15 K) for a pure element.
Table 8.
The enthalpy and entropy of formation of the B-Si intermetallic compounds.
| Compound | Enthalpy of Formation kJ·(Mole·Atom)−1 | Entropy of Formation (J/Mole·Atom·K) | Ref. |
|---|---|---|---|
| B3Si | −6.150 | − | [124,155] |
| −11.119 | −3.68 | [153] CALPHAD | |
| −6.025 | - | [169] | |
| −27.350 | −16.18 | [170] | |
| B4Si | −18.16 | - | [171] |
| B6Si | −4.230 | - | [124,155] |
| −21.186 ± 1.07 | - | [142] | |
| −17.286 ± 6.85 | −5.31 | [148] | |
| −6.616 | - | [169] | |
| −8.380 | −1.43 | [153] CALPHAD | |
| −17.457 | - | [171] | |
| B14Si | −3.825 | - | [153] CALPHAD |
| BnSi, n = 15.67 | −12.304 ± 1.37 | - | [142] |
| BnSi, n = 36 | −1.810 | - | [124,155] |
| B15Si | −13.563 ± 4.84 | −3.78 | [148] |
| B12Si | −4.316 | - | [169] |
Table 9.
Thermodynamic parameters of the liquid phase in Bi-Si system.
| Phase | Excess Gibbs Energy Parameter (J/Mole) | Ref. |
|---|---|---|
| Liquid | 0 | [50] |
| 0 | [120] |
Table 10.
Optimized model parameters of the Ga-Si system.
| Phase | Excess Gibbs Energy Parameter (J/Mole) | Ref. |
|---|---|---|
| Liquid | 0 | [51] |
Table 11.
Model parameters of the In-Si system.
| Phase | Excess Gibbs Energy Parameter (J/mole) | Ref. |
|---|---|---|
| Liquid | 0 | [52] |
Table 12.
Atom positions in the unit cell of Si3N4.
| Phase | Symmetry | Pearson Symbol | Atom | Wyckoff Position | x | y | z |
|---|---|---|---|---|---|---|---|
| αSi3N4 | Hexagonal | hP28 | N1 | 6c | 0.0424 | 0.3891 | 0.0408 |
| N2 | 6c | 0.3169 | 0.3198 | 0.2712 | |||
| N3 | 2b | 0.3333 | 0.6667 | 0.3649 | |||
| N4 | 2a | 0.0000 | 0.0000 | 1.0000 | |||
| Si1 | 6c | 0.0821 | 0.5089 | 0.3172 | |||
| Si2 | 6c | 0.1712 | 0.2563 | 0.0274 | |||
| βSi3N4 | Hexagonal | hP14 | N1 | 6c | 0.0298 | 0.3294 | 0.2680 |
| N2 | 2b | 0.3333 | 0.6667 | 1.0000 | |||
| Si | 6c | 0.7686 | 0.1744 | 0.2550 | |||
| γSi3N4 | Cubic | cF56 | N | 32e | 0.8676 | 0.8676 | 0.8676 |
| Si1 | 8a | 0 | 0 | 0 | |||
| Si2 | 16d | 0.6250 | 0.6250 | 0.6250 |
Table 13.
Optimized model parameters of the N-Si system.
| Phase | Excess Gibbs Energy Parameter (J/Mole) [214] |
|---|---|
| Liquid | 0 |
| Si3N4 | 0 |
Table 14.
The enthalpy and entropy of formation of the N-Si intermetallic compounds.
| Compound | Enthalpy of FormationkJ·(Mole·Atom)−1 | Entropy of Formation(J/Mole·Atom·K) | Ref. |
|---|---|---|---|
| Si3N4 | −103.400 | −45.000 | [216] |
Table 15.
Optimized model parameters of the P-Si system.
| Phase | Excess Gibbs Energy Parameter (J/Mole) [257] |
|---|---|
| Gas | |
| Liquid | |
| Diamond_Si | |
| SiP | |
| SiP2 | |
| P is the pressure in Pascal | |
Table 16.
The enthalpy and entropy of formation of the P-Si intermetallic compound.
| Compound | Enthalpy of Formation kJ·(Mole·Atom)−1 | Entropy of Formation (J/Mole·Atom·K) | Ref. |
|---|---|---|---|
| SiP | −61.118 | 15.016 | [55] |
| −71.128 | - | [271] | |
| −61.923 | 32.635 | [124,242] | |
| −63.300 | 34.735 | [256] | |
| −63.300 | 34.740 | [257] | |
| −63.220 | 29.400 | [272] | |
| SiP2 | −80.070 | 64.050 | [257] |
| −79.300 | 67.000 | [256] | |
| −84.300 | 69.900 | [270] |
Table 17.
Optimized model parameters of the Sb-Si system [277].
Table 17.
Optimized model parameters of the Sb-Si system [277].
| Phase | Excess Gibbs Energy Parameter (J/Mole) | Ref. |
|---|---|---|
| Liquid | ° | [277] |
| Diamond_Si | ° | [277] |
| Sb | Obtained from SGTE database | [237] |
Table 18.
Model parameters of the Si-Tl system.
| Phase | Excess Gibbs Energy Parameter (J/Mole) | Ref. |
|---|---|---|
| Liquid | 0 | [120] |
© 2017 by the authors. Licensee MDPI, Basel, Switzerland. This article is an open access article distributed under the terms and conditions of the Creative Commons Attribution (CC BY) license (http://creativecommons.org/licenses/by/4.0/).
Share and Cite
MDPI and ACS Style
Mostafa, A.; Medraj, M. Binary Phase Diagrams and Thermodynamic Properties of Silicon and Essential Doping Elements (Al, As, B, Bi, Ga, In, N, P, Sb and Tl). Materials 2017, 10, 676. https://doi.org/10.3390/ma10060676
AMA Style
Mostafa A, Medraj M. Binary Phase Diagrams and Thermodynamic Properties of Silicon and Essential Doping Elements (Al, As, B, Bi, Ga, In, N, P, Sb and Tl). Materials. 2017; 10(6):676. https://doi.org/10.3390/ma10060676
Chicago/Turabian StyleMostafa, Ahmad, and Mamoun Medraj. 2017. "Binary Phase Diagrams and Thermodynamic Properties of Silicon and Essential Doping Elements (Al, As, B, Bi, Ga, In, N, P, Sb and Tl)" Materials 10, no. 6: 676. https://doi.org/10.3390/ma10060676
Note that from the first issue of 2016, this journal uses article numbers instead of page numbers. See further details here.