Method of Optimisation for Ambient Temperature Cured Sustainable Geopolymers for 3D Printing Construction Applications


Centre for Sustainable Infrastructure, Faculty of Science, Engineering and Technology, Swinburne University of Technology, 3122 Melbourne, Australia
*
Authors to whom correspondence should be addressed.
Materials 2019, 12(6), 902; https://doi.org/10.3390/ma12060902
Submission received: 12 February 2019
/
Revised: 12 March 2019
/
Accepted: 14 March 2019
/
Published: 18 March 2019
(This article belongs to the Special Issue Concrete 3D Printing and Digitally-Aided Fabrication)
Abstract
:Since the initial introduction of geopolymers, these materials have been characterised as environmentally-friendly sustainable substitutes for ordinary Portland cement (OPC). There is a routine increase in the application of geopolymers, especially in advanced technologies. Because of its better rheological characteristics compared to OPC, geopolymers are appropriate materials for extrusion-based 3D printing technologies. This paper focuses on the optimisation of an ambient temperature cured geopolymer for 3D printing construction applications. The effects of mixture parameters, including the type of hydroxide solution (HS), the type of silicate solution (SS) and the mass ratio of SS to HS on the workability, extrudability, shape retention ability and mechanical performance of different geopolymer mixtures were investigated. Accordingly, an optimum mixture was identified for geopolymers cured at ambient temperatures. Mechanical properties of the optimised mixture, including flexural and compressive strengths, were measured in different directions with respect to the printed layers. Further, uniaxial tension tests were also conducted on the optimised mixture to measure its interlayer bond strength. The results showed that among the activators investigated, the sodium-based activator composed of sodium hydroxide and sodium silicate solutions, with a SiO2/Na2O ratio of 3.22, was the most effective activator, providing appropriate workability and extrudability, along with reasonable strength and a high shape retention ability. The acquired mechanical properties exhibited anisotropic behaviour in different testing direction. The strength of the interlayer bond was found to be adequate to avoid interfacial shear failure.
1. Introduction
Additive manufacturing (AM), or 3D printing in other terms, utilises an automated assembly procedure which manufactures layered components from digital model data. Despite the extensive application of AM in advanced areas of science such as the biomedical, aerospace and automotive fields [1], its development in the construction industry is still in its infancy. In the past few years, the application of AM in the construction industry has attracted a significant amount of attention. This is because AM can offer several benefits when compared to the conventional construction approach, such as improved geometrical freedom, increased safety in construction and reduced construction time, cost and waste [2,3]. There are a wide variety of challenges to be addressed before AM technologies could be thoroughly implemented in the construction industry. Some of the challenges include: (1) Limited scope of 3D printable cementitious materials, (2) limited reinforcing methods for 3D printed building components, (3) the existing design approaches and standards are not applicable for automated construction and (4) the high cost of construction-scale 3D-concrete-printing (3DCP) machines [4,5].
In recent years, extrusion-based and powder-based AM techniques, which are the primary methods of approximately all AM procedures, have been used to develop several 3DCP technologies. The powder particles are selectively bonded together by use of a liquid binder in the powder-based 3DCP [2]. Examples of powder-based 3DCP technologies are Emerging Objects [6] and D-shape [7]. In extrusion-based 3DCP, the cementitious material is extruded from a nozzle mounted on a robotic arm, crane or gantry. Examples of extrusion-based 3DCP technologies are Contour Crafting [8,9,10], Concrete Printing [11,12] and CONPrint3D [13].
Most of the printable cementitious materials used in extrusion-based 3DCP techniques are ordinary Portland cement (OPC)-based binders [11,12,14,15]. The production of OPC emits a significant amount of carbon dioxide (CO2) into the atmosphere [16]. In addition, the manufacture of OPC is significantly energy intensive [17]. Both of these factors may compromise the sustainability of 3DCP using OPC-based materials. Hence, it is necessary to develop materials without OPC that are appropriate for extrusion-based 3DCP processes. Geopolymer, a cement-free alternative binder to OPC, is the resultant of a geopolymerisation process where an aluminosilicate resource, such as fly ash or blast furnace slag, is activated by an alkali solution [18]. Geopolymers are affordable environmentally friendly products, where the energy consumption and carbon dioxide emission for the production of fly ash-based geopolymer, for example, is 60% and 80% less than OPC, respectively [19,20]. Apart from being environmentally friendly, geopolymers are specifically suitable for extrusion-based printing because they have modifiable setting characteristics [21] and gain higher strength much faster than OPC.
Panda et al. [22] examined a geopolymer mix suitable for extrusion-based 3DCP. Panda et al. [23] have also investigated the effect of aluminosilicate resources such as silica fume, fly ash and slag on the rheological and hardened properties of printable geopolymer mixtures. However, the effects of alkaline activators on the printability of geopolymer have not yet been investigated. Results of previous studies have indicated that the hydroxide solution (HS), silicate solution (SS) and the mass ratio of SS to HS not only affect properties of hardened geopolymer, but also significantly influence the rheological properties of fresh geopolymer [24,25,26,27,28]. In the extrusion-based 3DCP, the rheology of fresh concrete is a critical parameter that extensively affects the fresh properties of printable concrete, including open time, workability, extrudability and buildability [11,29]. Therefore, this paper investigates the effects of several parameters, including the type of HS, the type of SS and the mass ratio of SS to HS on workability, shape retention ability, extrudability and mechanical properties of printable geopolymer mixtures. The final aim is to identify a 3D printable geopolymer mixture which has the optimum characteristics and is curable at ambient temperature. A series of tests were conducted to characterise the mechanical properties of the optimised mixture, including the compressive strength, flexural strength and interlayer bond strength.
2. Materials
Fly ash and granulated ground blast furnace slag (henceforth referred to slag) were used as the source materials to synthesise the 3D printable geopolymer mixtures in this paper. The fly ash was supplied from Gladstone power station, Gladstone, Australia and classified as a low calcium (Class F) fly ash. The slag was supplied by Building Products Supplies Pty Ltd., Melbourne, Australia. The chemical composition of the fly ash and slag were determined by X-ray fluorescence (XRF, SPECTRO Analytical Instruments Inc., Mahwah, NJ, USA) analysis, and the results are presented in Table 1. The total percentages do not sum to 100% due to rounding.
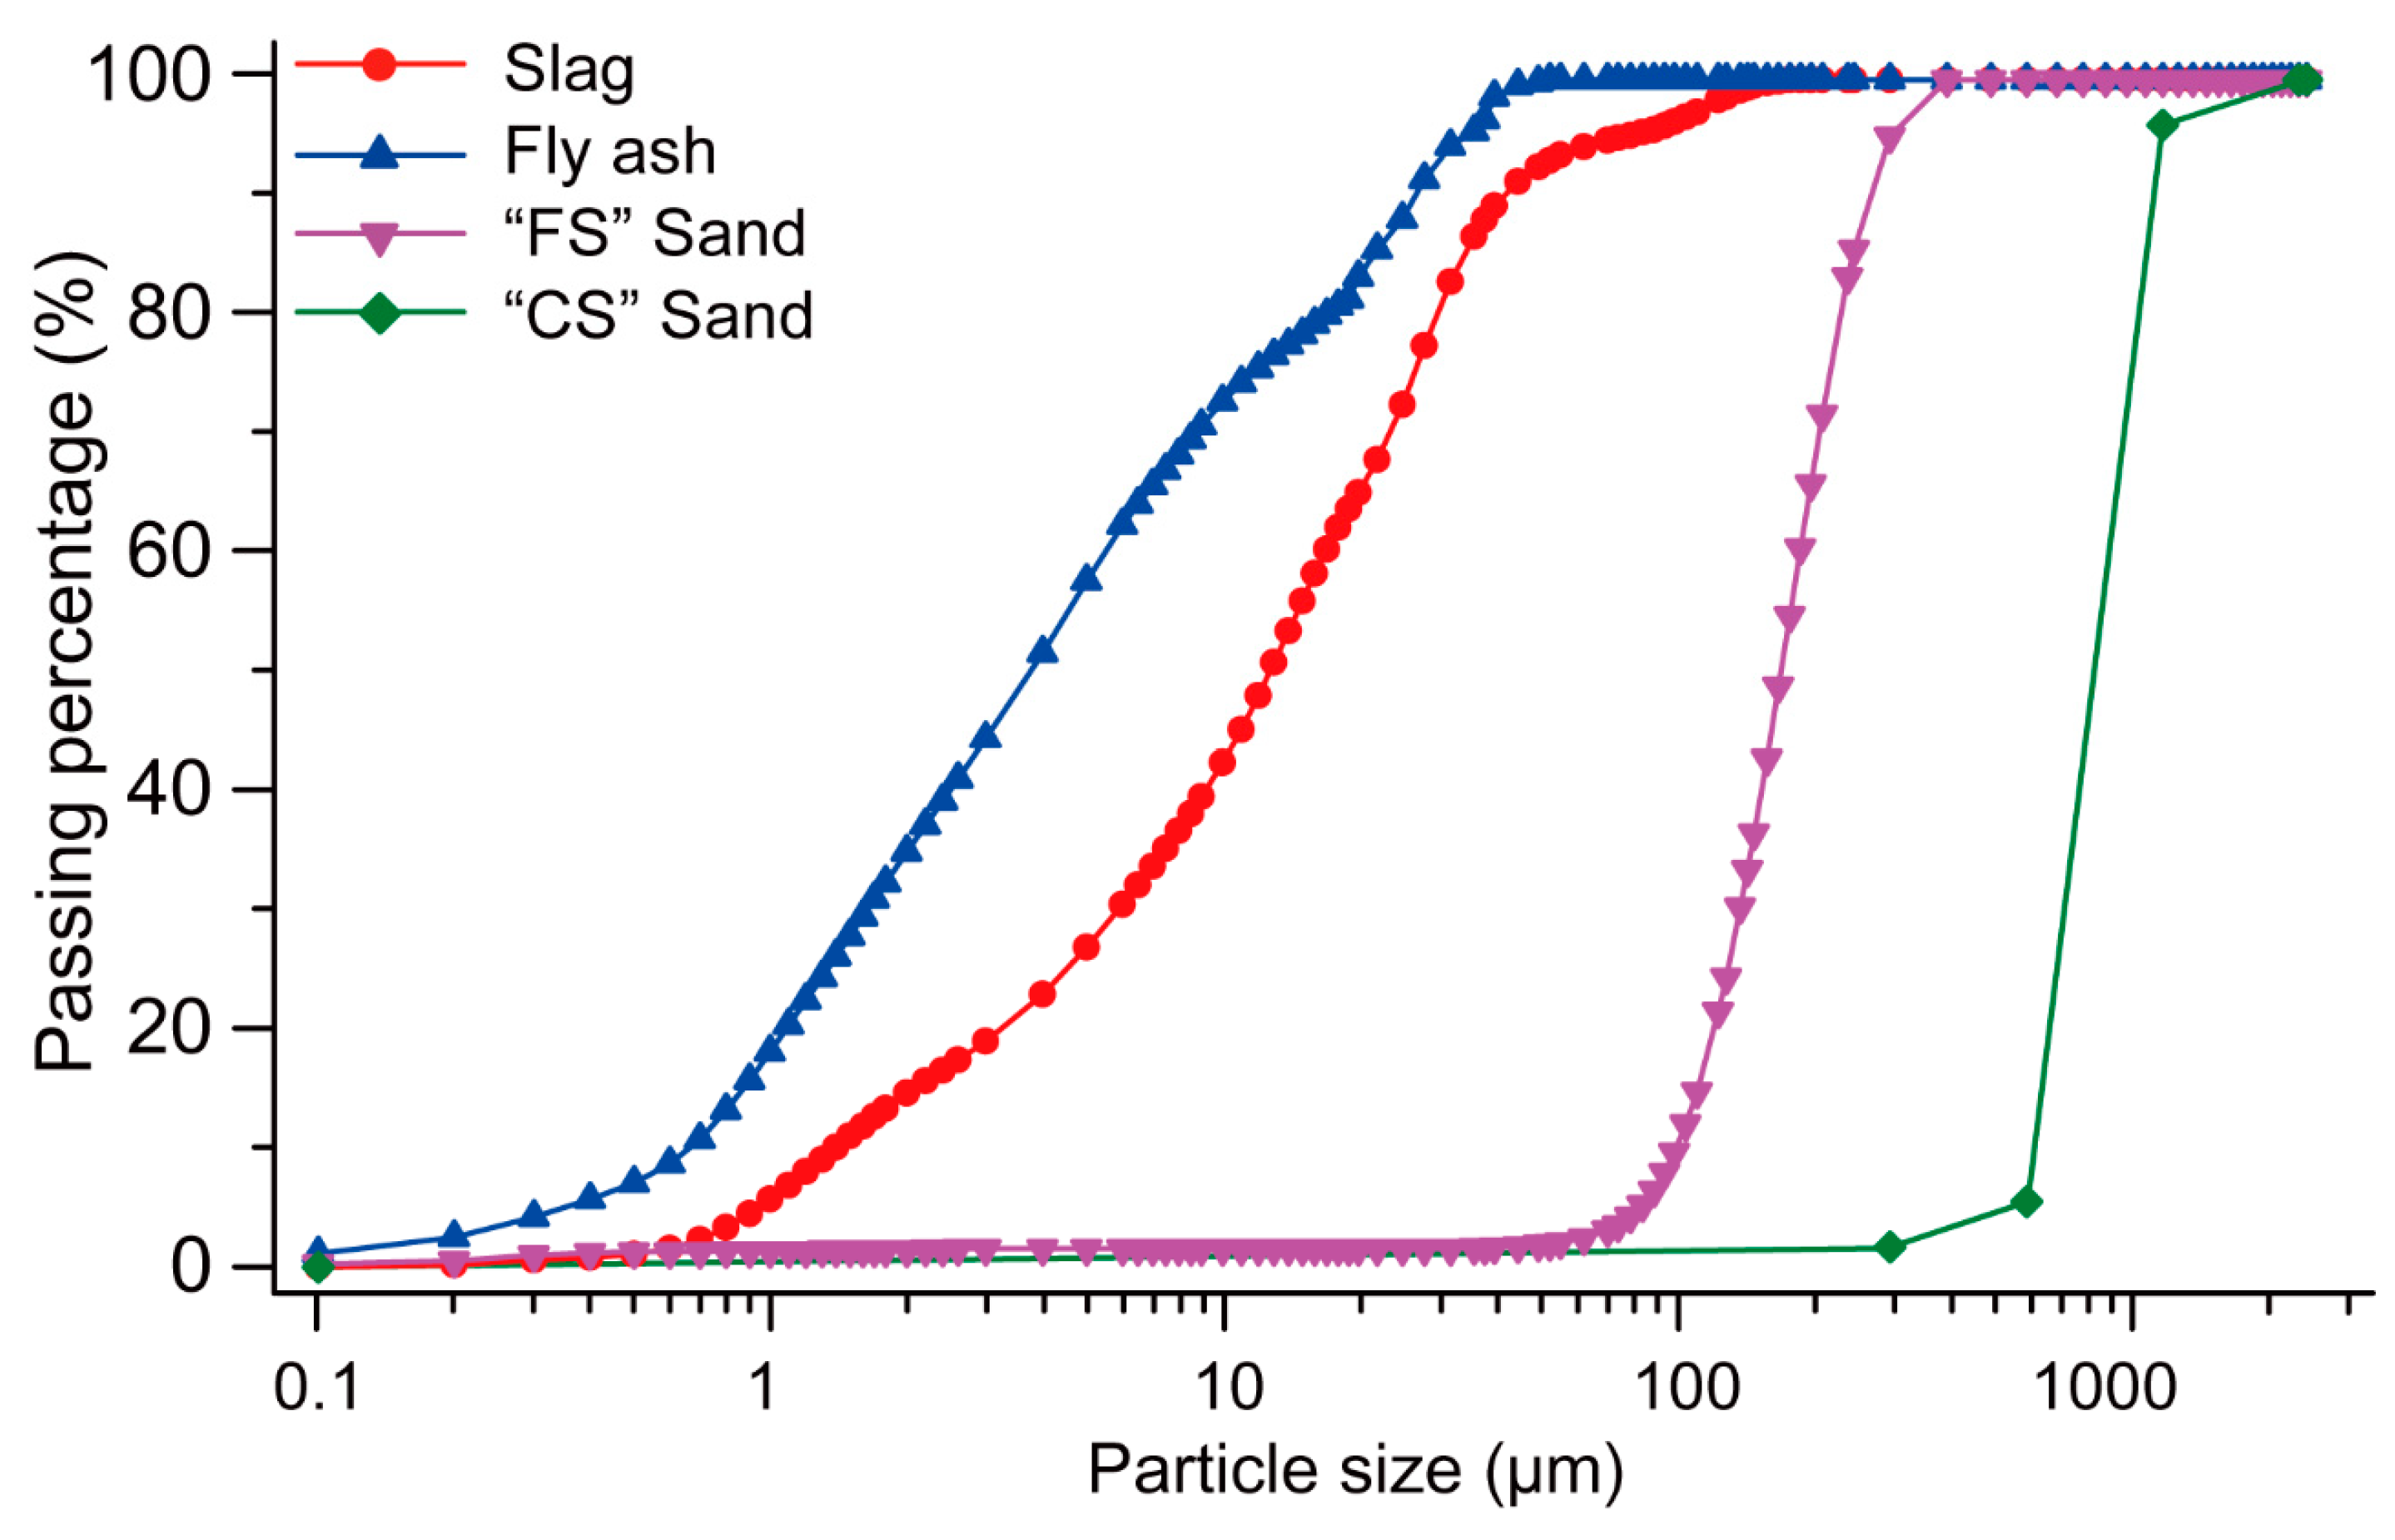
Two different sizes of silica sands were used in this paper. The fine sand supplied by TGS Industrial Sands Pty Ltd., Melbourne, Australia was denoted as “FS” and had a D50 of 172 µm. The relatively coarser sand, supplied by Sibelco Australia Ltd. (Melbourne, Australia), was denoted as “CS” and had a D50 of 898 µm. The particle size distributions of the fly ash, slag and both silica sands are shown in Figure 1.
Two types of sodium silicate (Na2SiO3) solutions and two types of potassium silicate (K2SiO3) solutions were used as silicate solutions (SSs) in this paper. All SSs were supplied by PQ Australia Pty Ltd. (Melbourne, Australia) The specifications of the SSs are presented in Table 2. Two types of HSs (a sodium hydroxide (NaOH) solution and a potassium hydroxide (KOH) solution) were also used in this paper. Both HSs were supplied by Sigma Aldrich Pty Ltd., Sydney, Australia. The NaOH and KOH pellets were dissolved in tap water to produce NaOH and KOH solutions with 8.0 M concentration. Both hydroxide solutions were left to cool in the laboratory environment before mixing with the silicate solutions with different SS/HS mass ratios.
Four different activator solutions, including two sodium (Na)-based and two potassium (K)-based solutions, were designed by mixing HS and SS with different mass ratios. The Na-based activators were: (1) A combination of NaOH and D grade Na2SiO3 solutions and (2) a combination of NaOH and N grade Na2SiO3 solutions. The K-based activators were: (1) A combination of KOH and KASIL 2040 grade K2SiO3 solutions and (2) a combination of KOH and KASIL 2236 grade K2SiO3 solutions. In both Na-based and K-based activators, three different mass ratios of SS to HS were used: 1.5, 2.5 and 3.0.
Admixtures such as anhydrous borax and sodium carboxymethyl cellulose (CMC) powders were used as retarder and viscosity modifying agents, respectively.
3. Experimental Procedure
The procedure followed in this paper can be separated into two parts:
In part I, 12 mixtures were designed and the effects of different parameters, including the type of HS, the type of SS and the mass ratio of SS to HS, on workability, extrudability, compressive strength and shape retention ability of printed mixtures were investigated. All specimens printed in this part were consisted of only a single layer. An optimum mixture exhibiting desirable properties was selected based on the results obtained in part I.
In part II, two-layer specimens were printed using the optimum mixture. The flexural and compressive strengths of the samples, in different load directions, with respect to the printed layers, were measured. Interlayer bond strength was the other feature investigated in part II.
3.1. Mixture Proportions and Mixing Procedure
Table 3 represents mixtures proportions of the 12 designed mixtures. In all mixtures, the mass ratio of fly ash to slag was kept constantly equal to 3.0. The mass ratio of activator to geopolymer source materials (fly ash and slag) was also kept constantly equal to 0.4. The dosages of anhydrous borax and CMC powders in each mixture were adjusted to achieve the appropriate rheological properties suitable for extrusion-based 3DCP (visually assessed). The water-to-geopolymer-solids ratio (W/GP-solids) of each mix [30] was also given in Table 3.
The fly ash, slag, anhydrous borax and sands were added to a Hobart mixer (Hobartcorp, Troy, OH, USA) and dry-mixed at low-speed for 3 min. The activator solutions were then gradually added to the mixer and mixing was continued for another 7 min. Once the materials were fully mixed and a uniform mixture was obtained, the CMC powder was added to the mixer and the mixing was continued for another 5 min to obtain the appropriate rheology for extrusion.
3.2. Printing and Curing of Specimens
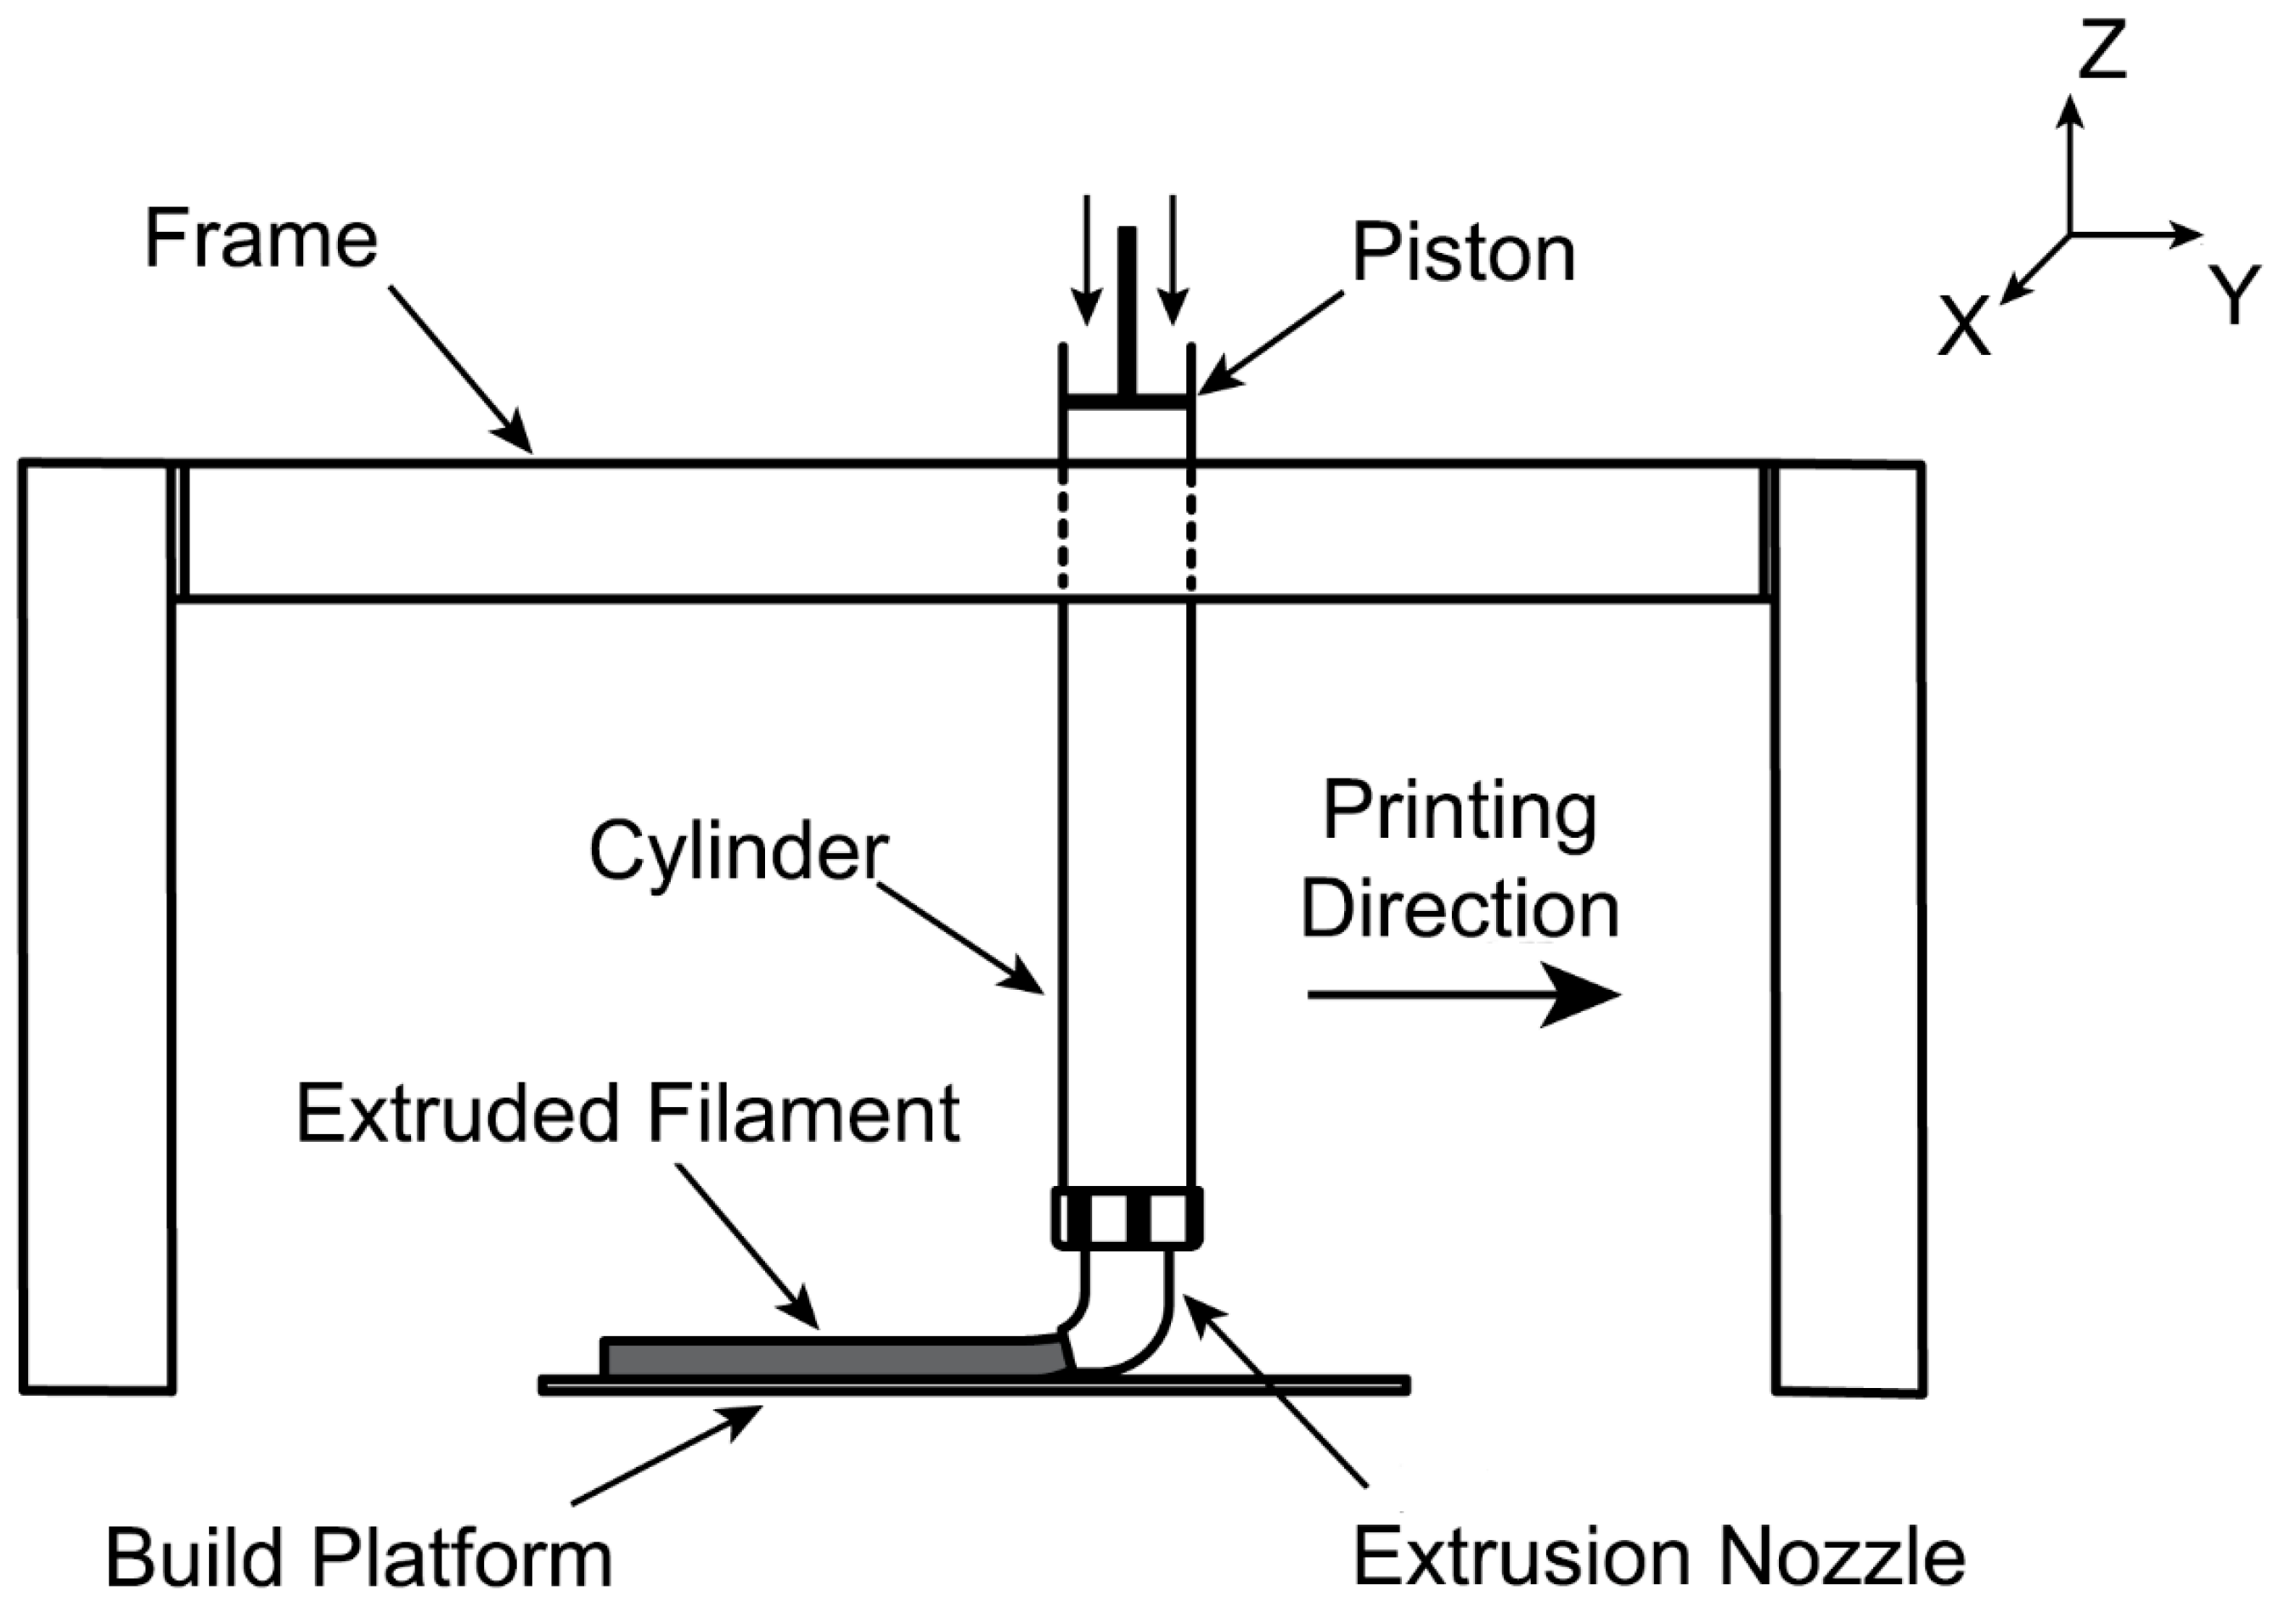
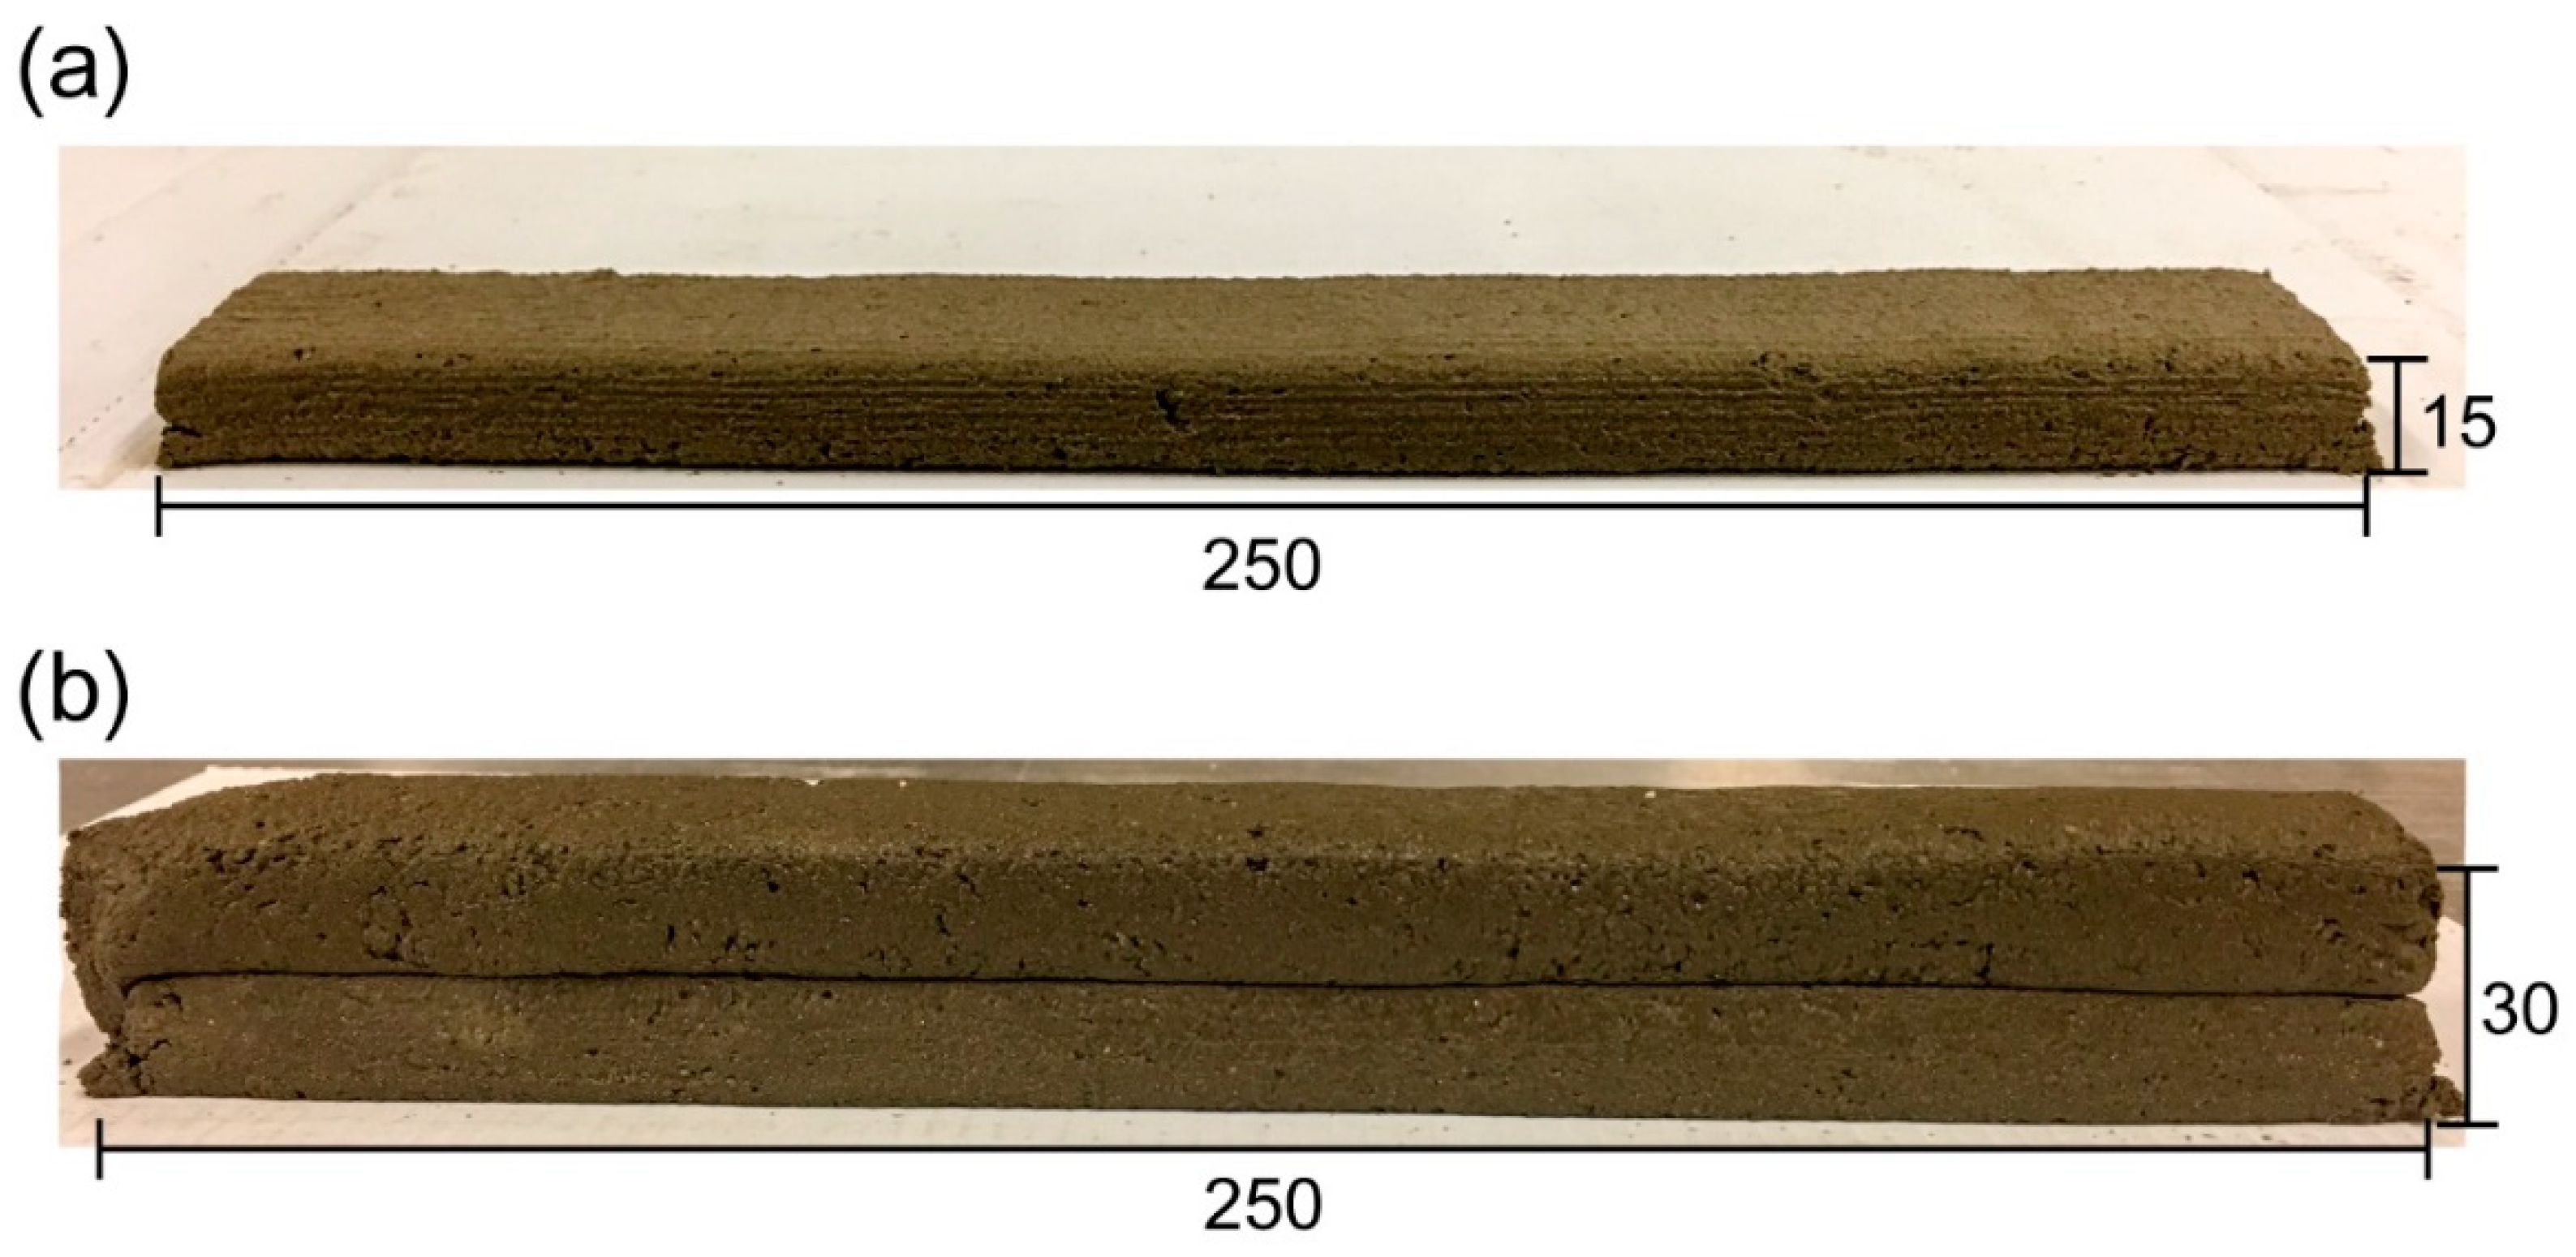
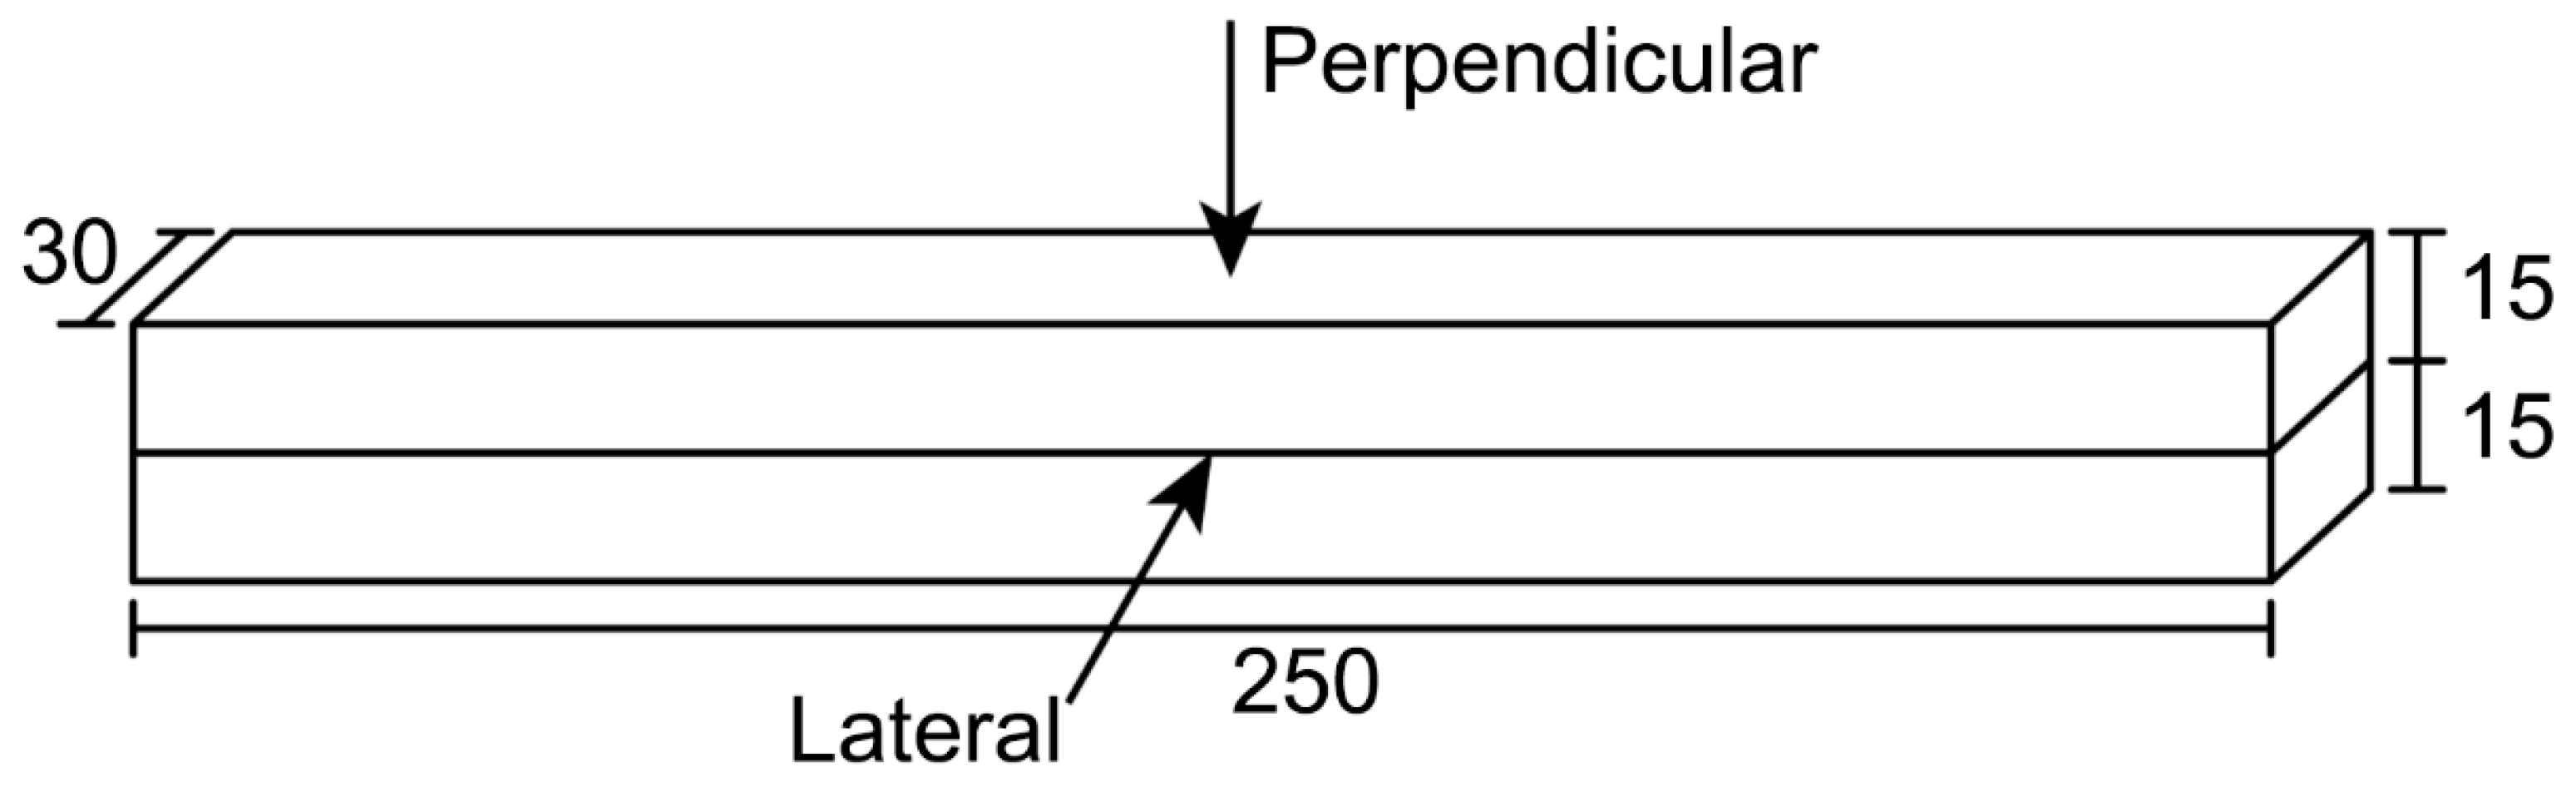
A custom-made small-scale 3D printing apparatus (designed and manufactured by the authors) was used for the printing process (Figure 2). The apparatus has a piston-type extruder, where fresh material was extruded from a 45° extrusion nozzle with a rectangle opening (30 mm × 15 mm). An external vibration was applied to the extruder while loading the fresh mixture to ensure the mixture inside the extruder received adequate compaction. The specimens were printed by moving the extruder in a horizontal direction at a constant speed. In part I, one-layer filaments with dimensions of 250 mm × 30 mm × 15 mm (L × W × H) were extruded for each mixture (Figure 3a). In part II, two-layer filaments with the dimensions of 250 mm × 30 mm × 30 mm (L × W × H) were prepared using the optimum 3D printable geopolymer mix (Figure 3b). The first layer was extruded, and the second layer was then extruded on top of the first layer after 2 min (the delay time or print-time interval between the layers).
All printed filaments were placed in a sealed container to prevent excessive moisture loss and kept in the laboratory environment at ambient temperature (23 °C ± 3 °C) until the testing day. The testing day for part I was 3 days after printing, while for part II it was 7 and 28 days after printing.
3.3. Testing
3.3.1. Workability
The workability of fresh mixtures was measured by conducting a mini-slump test in accordance with ASTM C1437 [31].
3.3.2. Extrudability
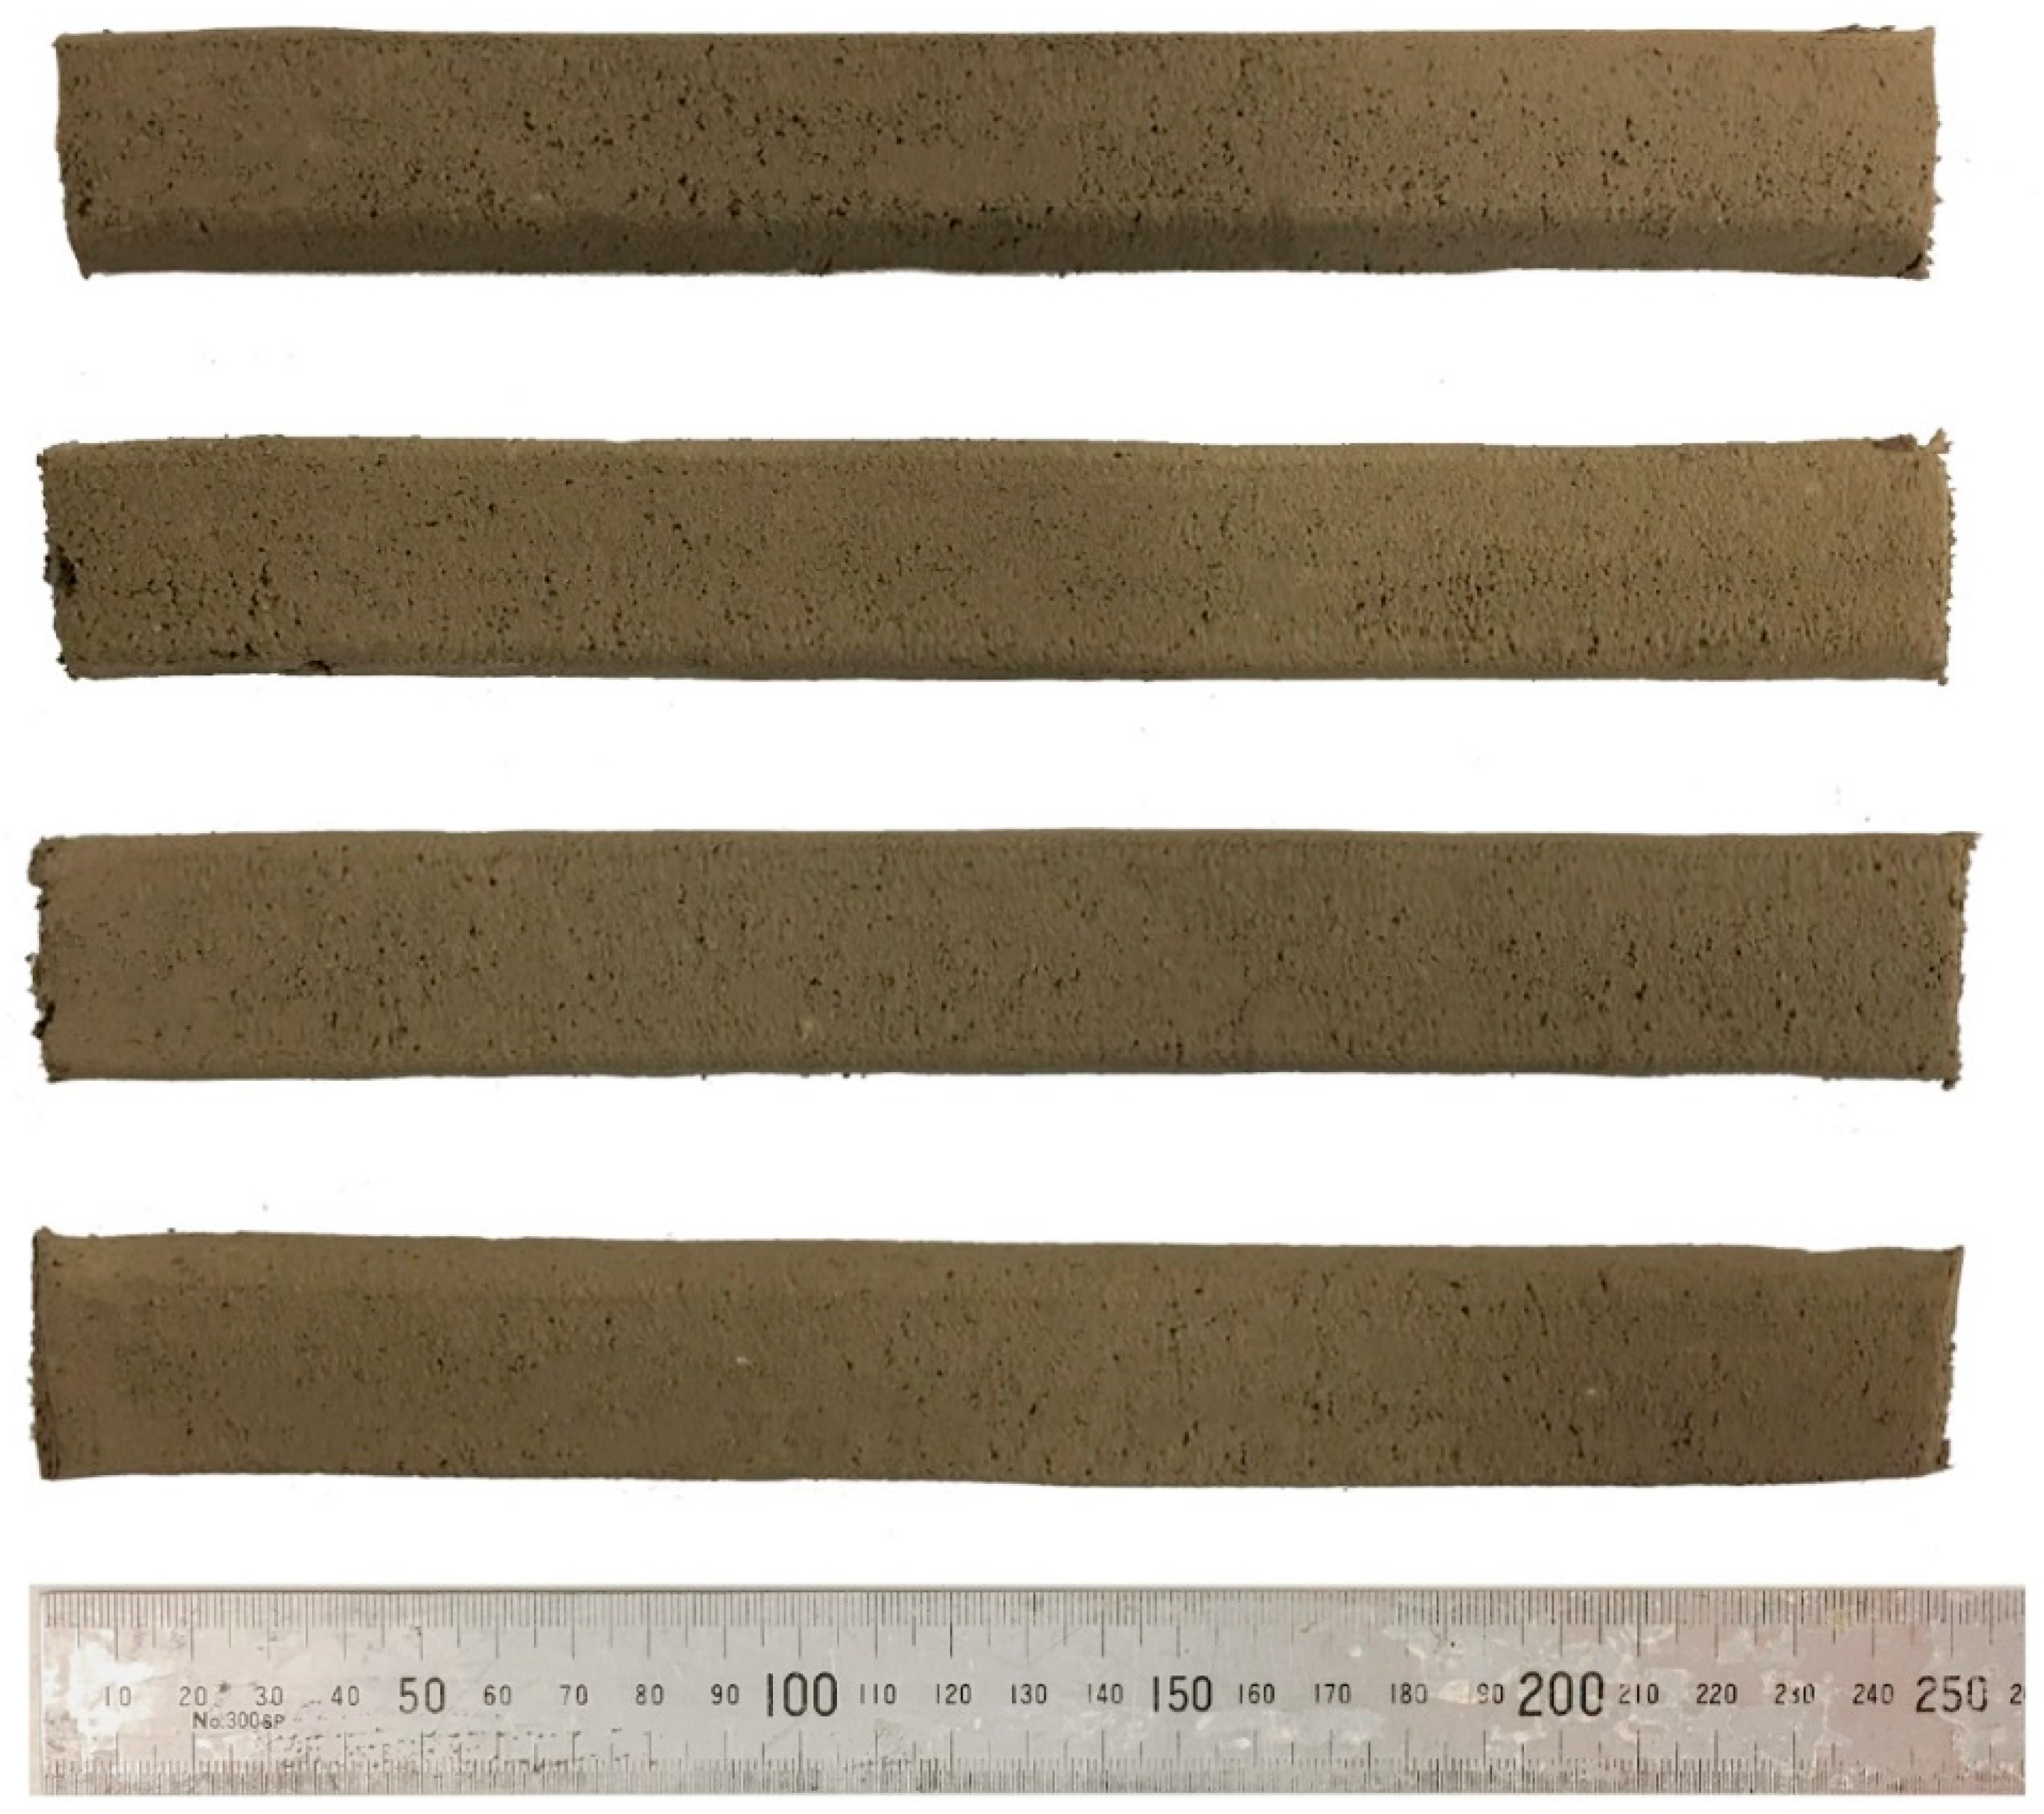
The method proposed by Le et al. [11] was followed in this paper to evaluate the extrudability of each geopolymer mixture. In this regard, for each mixture, four 250 mm long single-layer filaments were extruded. A mixture was considered to have “acceptable” extrudability if all four filaments could be extruded through the nozzle successfully without any blockage, tearing, segregation or bleeding.
3.3.3. Shape Retention Ability
The shape retention ratio (SRR) was defined in this paper to quantify the shape retention ability of each mixture. The SRR can be calculated by the following equation:
where WFilament is the bottom width of the extruded filament and WNozzle is the width of the nozzle opening. The higher the SRR, the better the shape retention ability of the mixture. As mentioned in Section 3.2, WNozzle was equal to 30 mm in this paper. For each mix, specimens measuring 60 mm × 30 mm × 15 mm (L × W × H) were sawn from the 250 mm × 30 mm × 15 mm (L × W × H) printed filaments. For each mix, the WFilament of at least six 60 mm × 30 mm × 15 mm specimens was measured using a digital Vernier calliper with an accuracy of up to 0.01 mm. The average SRR and the standard deviation values were calculated.
3.3.4. Compressive Strength
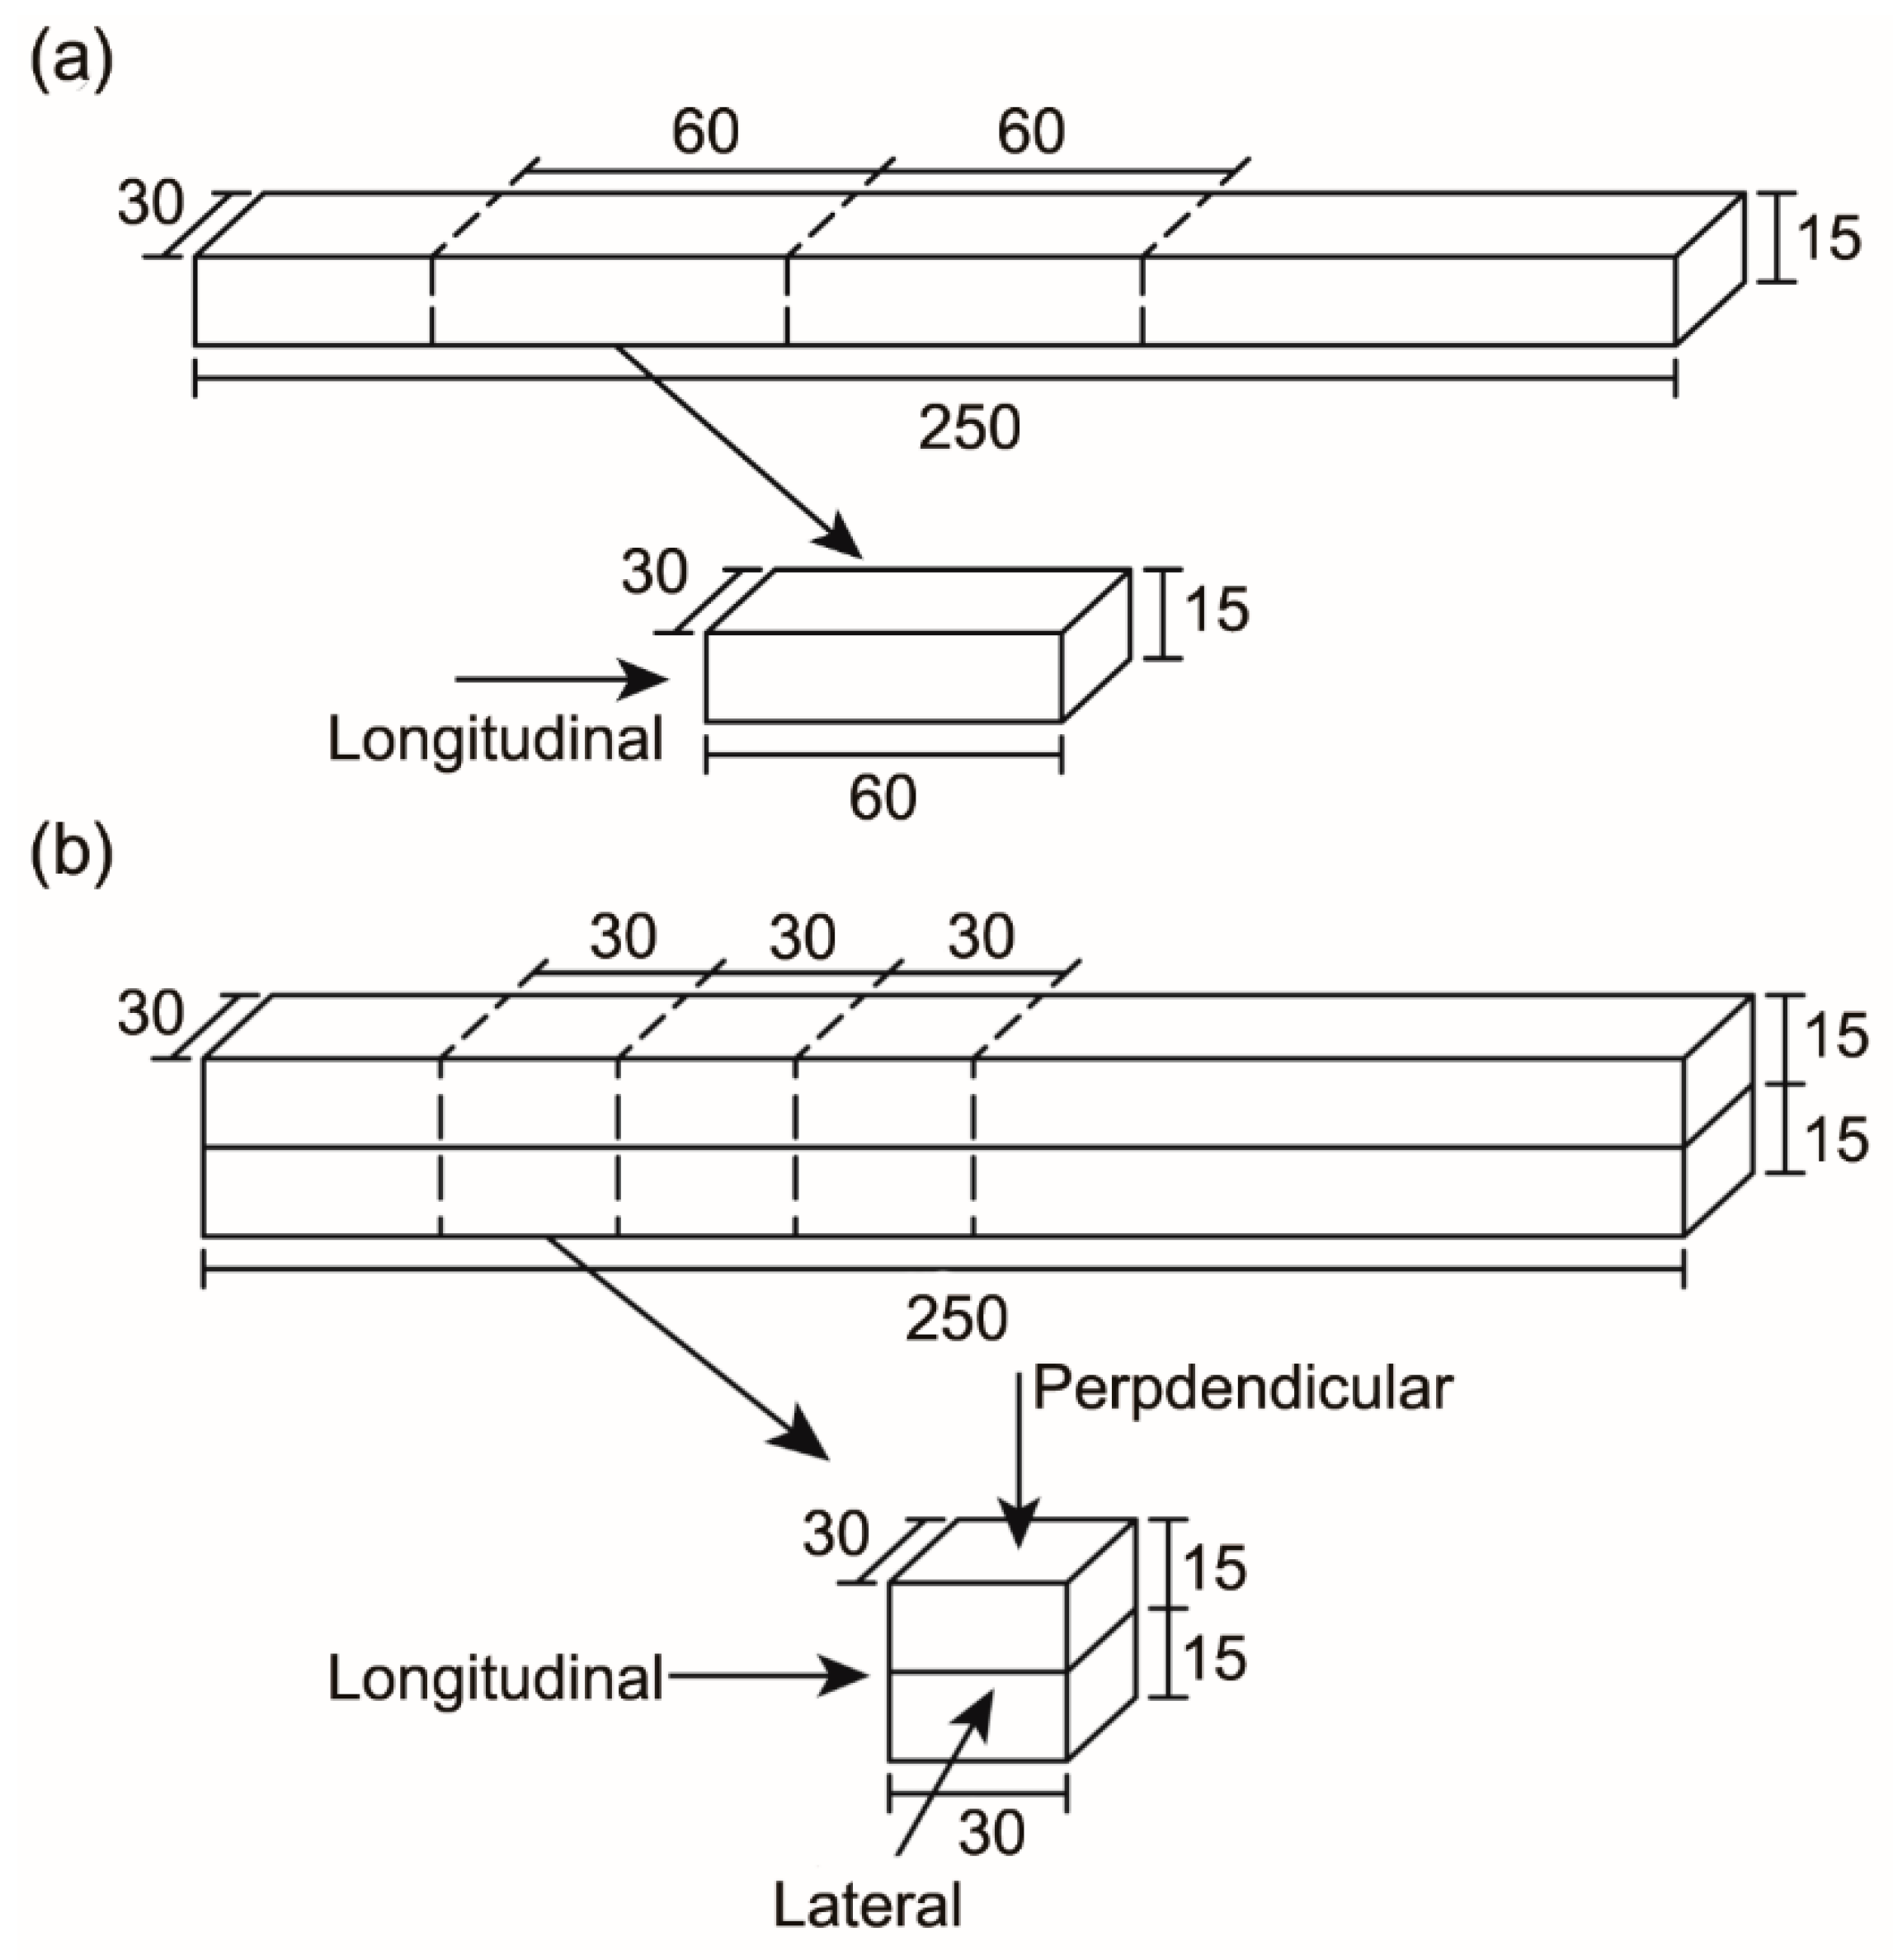
In part I, specimens with dimensions of 60 mm × 30 mm × 15 mm (L × W × H) were sawn from the 250 mm × 30 mm × 15 mm (L × W × H) printed filaments and tested in the longitudinal direction only (Figure 4a). The average value of six tested specimens was reported as the compressive strength of the corresponding mix. In part II, 30 mm cube specimens were sawn from the 250 mm × 30 mm × 30 mm (L × W × H) printed filaments and tested in one of the three directions: Longitudinal, lateral or perpendicular (Figure 4b). The average value of the three tested specimens was reported as the compressive strength of the corresponding mix. A loading rate of 0.33 MPa/s, using uniaxial compression, was applied to all specimens.
3.3.5. Flexural Strength
In part II, the flexural strength of the optimum mixture was tested in different loading directions. Three filaments with dimensions of 250 mm × 30 mm × 30 mm (L × W × H) for each of the lateral and perpendicular directions (six samples in total) were printed (Figure 5). A three-point bending test with a 150 mm span length was adopted. All specimens were tested under displacement control at the rate of 1.0 mm/min. It is pointing out that all surfaces of the 3D printed specimens were ground to have a flat and smooth surface before conducting the compression and flexural tests.
3.3.6. Interlayer Bond Strength
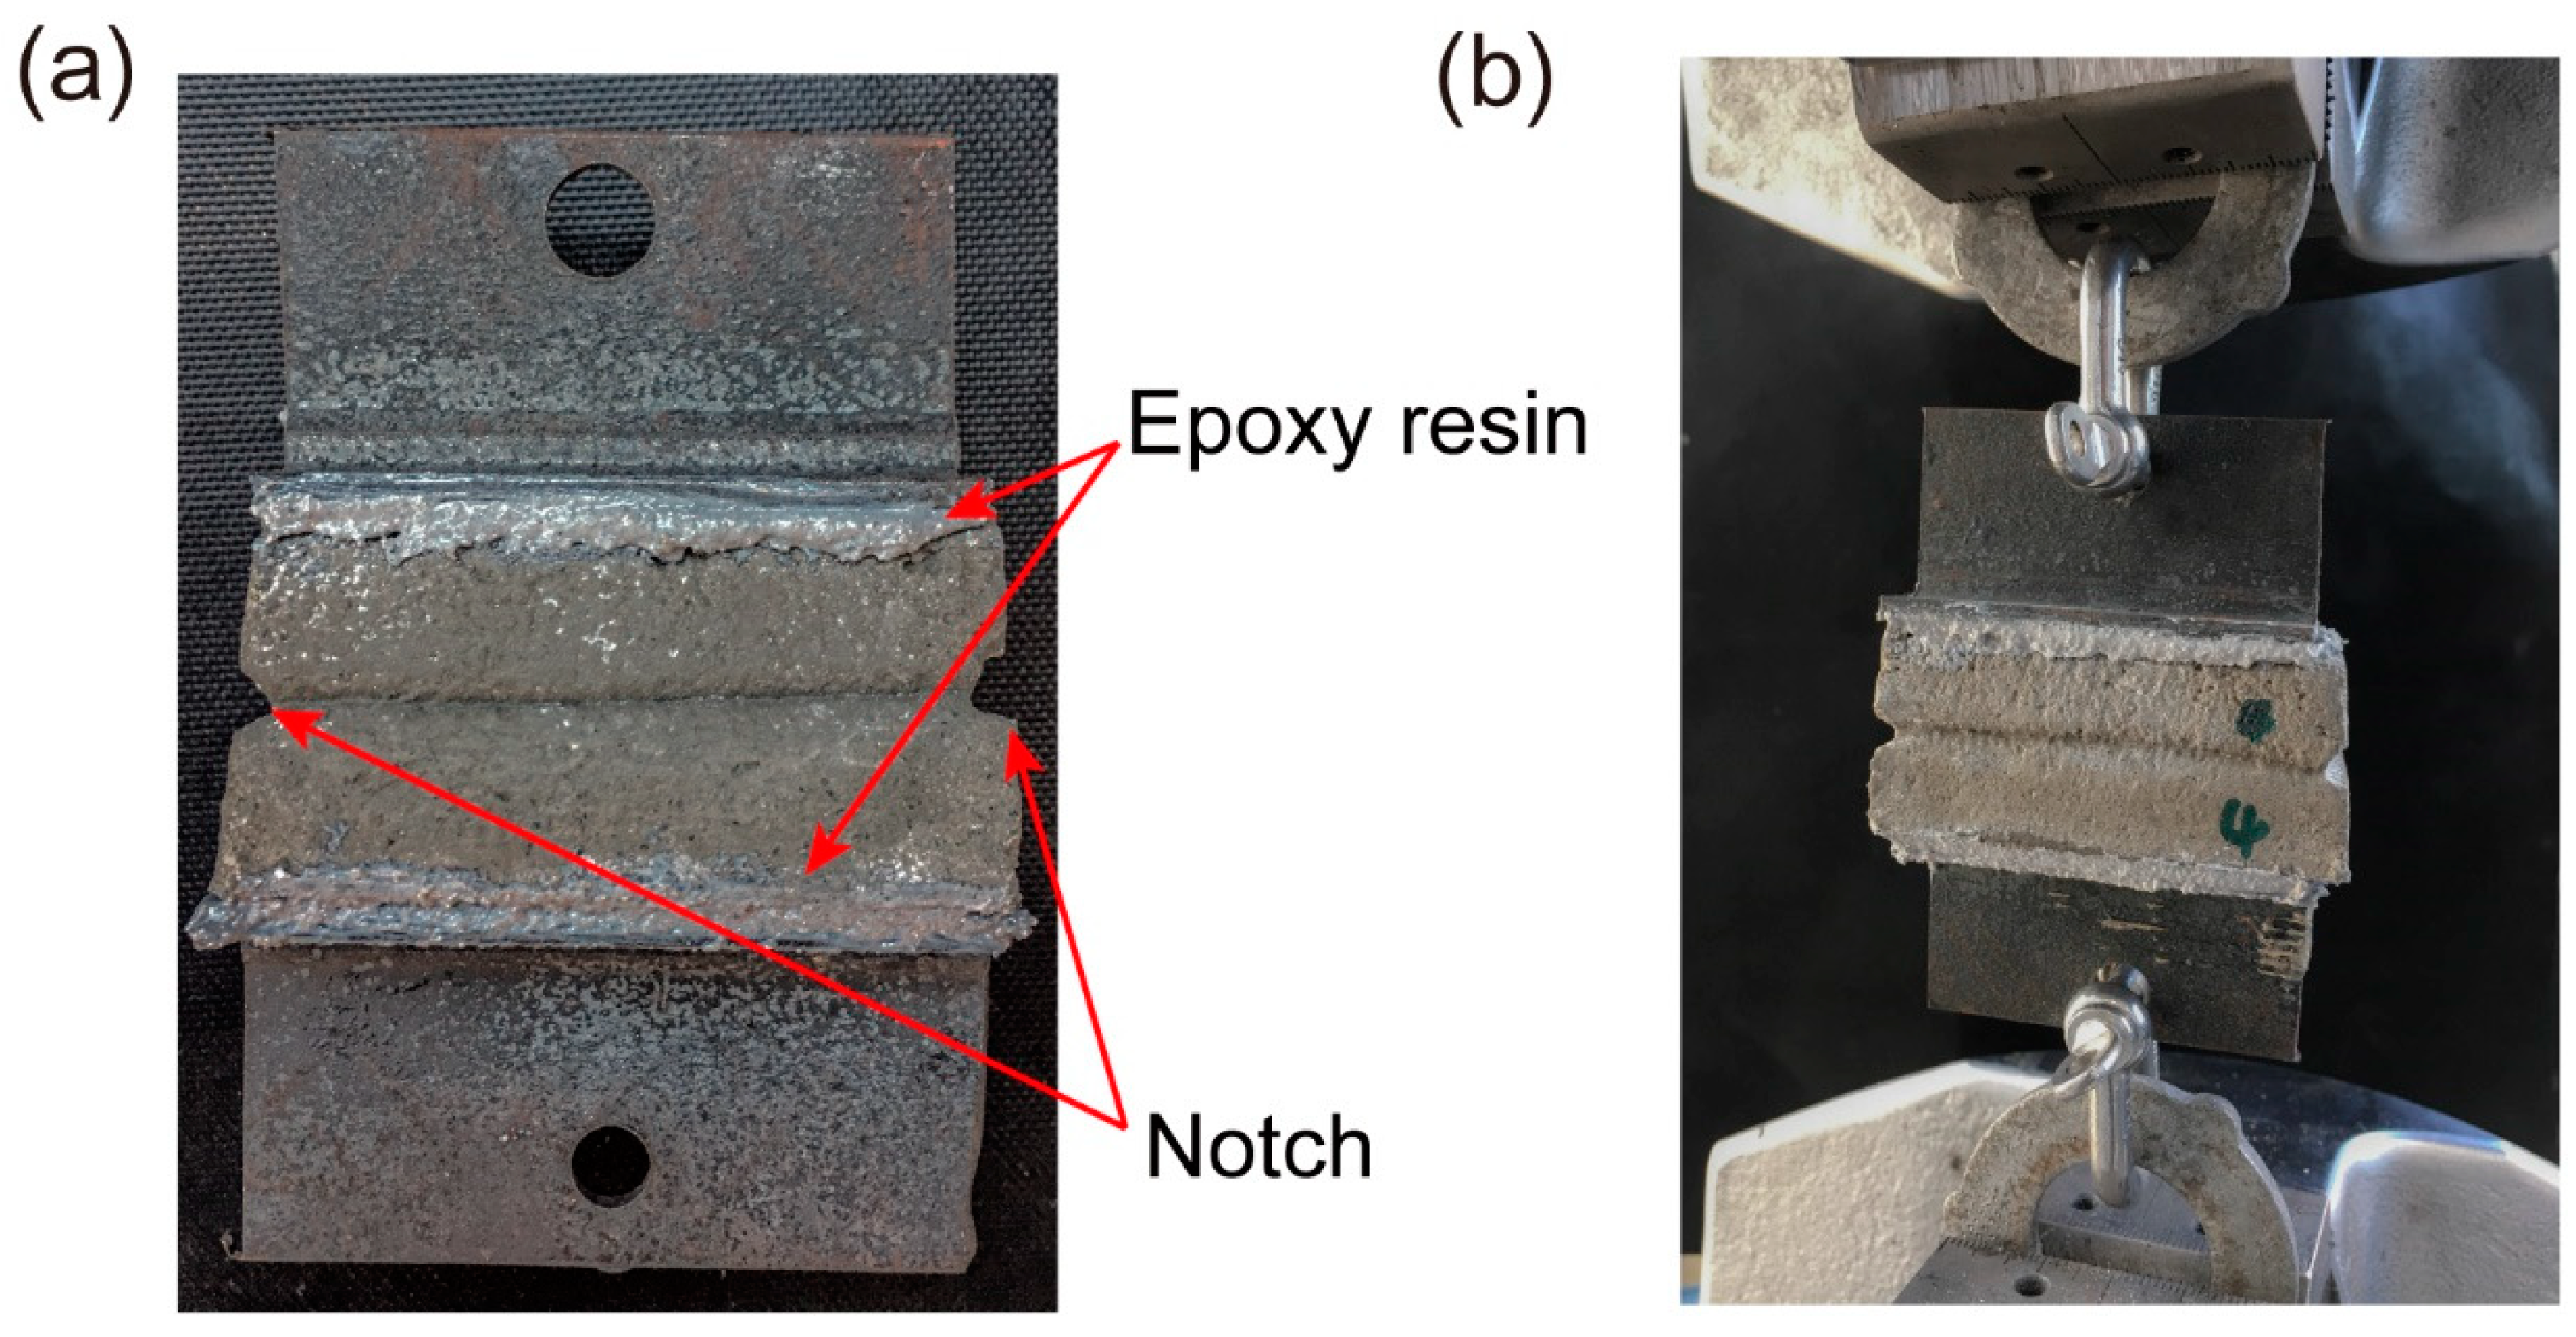
Another task of part II was the measurement of the interlayer bond strength of the selected optimum mixture from part I. Specimens with dimensions of 50 mm × 30 mm × 30 mm (L × W × H) were sawn from the 250 mm × 30 mm × 30 mm (L × W × H) printed filaments. The average value of five tested samples was considered as the bond strength of the optimum mix. To measure the bond strength, two metallic T-sections were connected to the bottom and top of the sawn samples using epoxy glue. To ensure that the failure of the samples occurred at the interface, a small notch was created at either side of the interface (Figure 6a). A displacement rate of 1 mm/min was applied to all specimens using uniaxial tension (Figure 6b). To avoid any eccentricity, extra attention was taken to have specimens aligned in the tensile machine.
4. Results and Discussions
4.1. Results of Part I
4.1.1. Extrudability
According to the results, no blockage, tearing, segregation or bleeding was observed during the extrusion process of all mixtures. Therefore, it can be concluded that all mixtures investigated in this paper exhibited “acceptable” extrudability. For example, Figure 7 depicts four printed filaments from the “Na-N-2.5” mixture, showing the “acceptable” extrudability of this mixture. Based on the results obtained, the investigated parameters showed insignificant influence on the extrudability of the tested fresh mixes. This is because the dosage of admixtures (i.e., borax and CMC) were adjusted in each mixture to obtain useful rheological properties appropriate for 3DCP. It should be noted that the extrudability of a 3D printable cementitious material is influenced by several factors, including the printing parameters (e.g., size of nozzle, type of extruder and extrusion rate), mixture proportions and rheological properties of the mixture (e.g., viscosity and yield stress) [11,32,33].
4.1.2. Workability
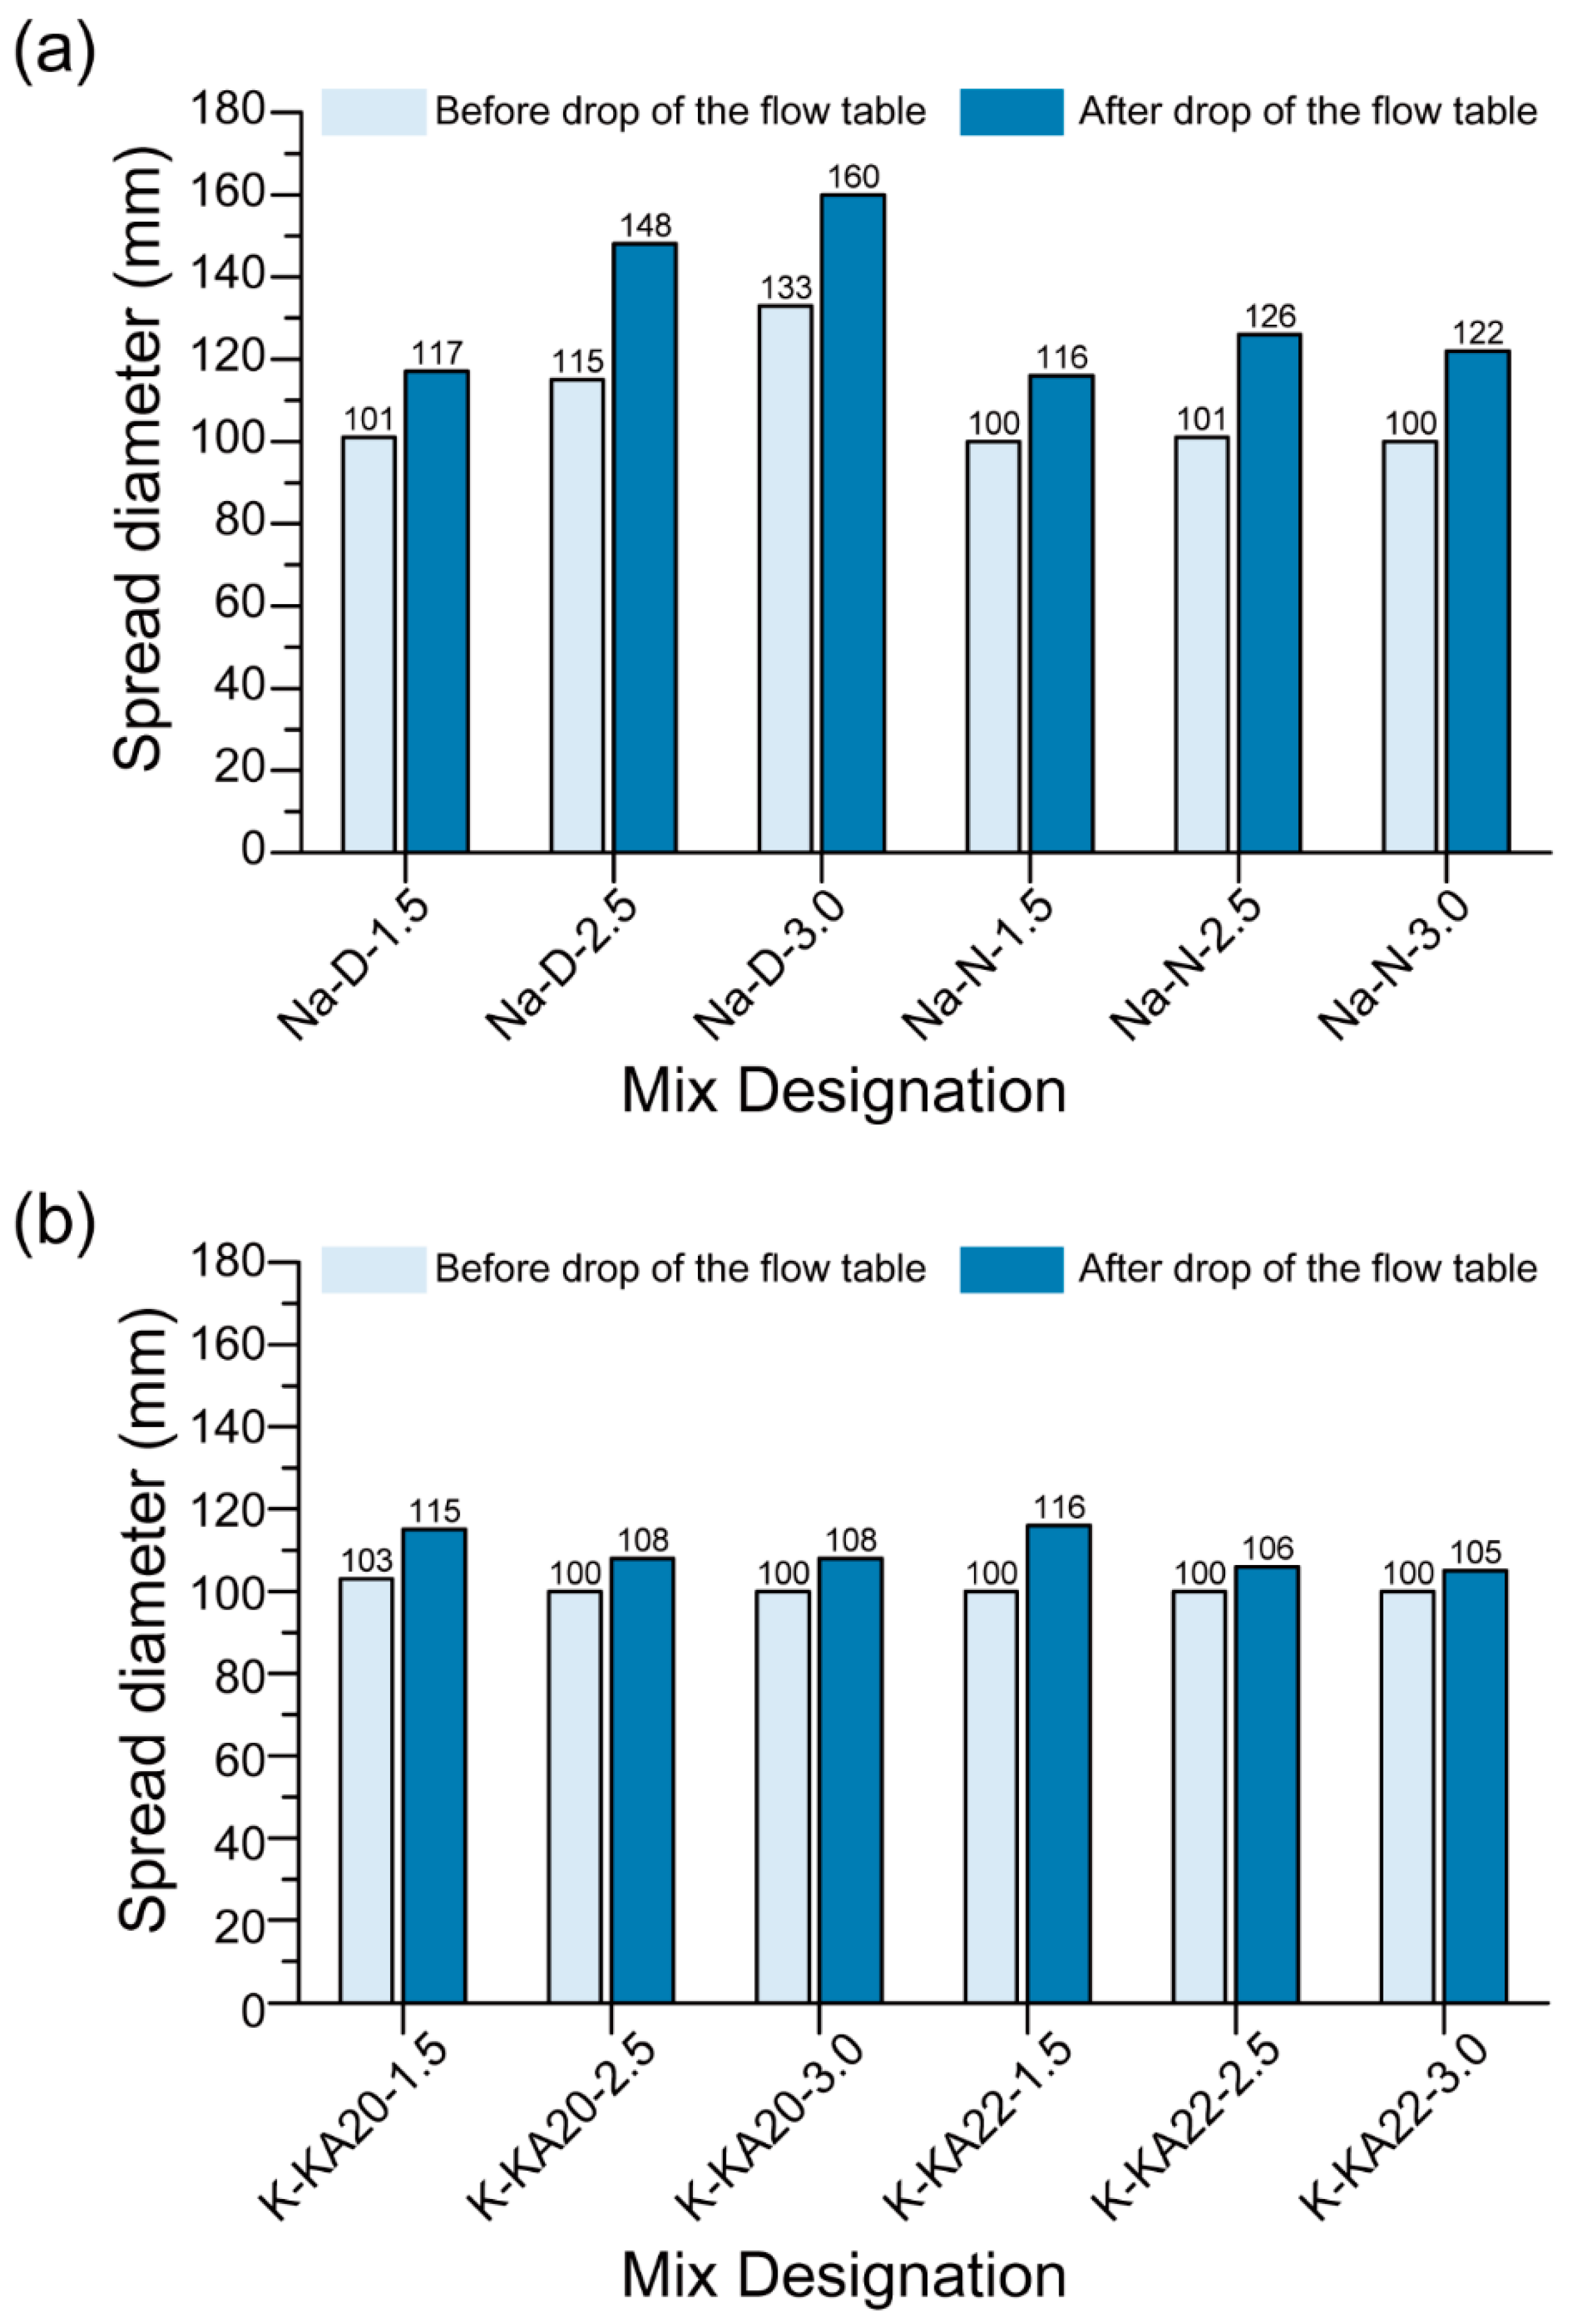
Figure 8 shows the average workability of the fresh mixtures before and after the drop of the flow table. The average spread dimeter of all mixtures, except “Na-D-2.5” and “Na-D-3.0”, before the drop of the flow table was almost 100 mm, i.e., equal to the diameter of the bottom of the mini-slump cone. This indicates all fresh mixtures except “Na-D-2.5” and “Na-D-3.0” had zero-slump. Having a mixture with zero-slump is beneficial for extrusion-based 3DCP mixtures as it helps the filament to keep its shape when extruded. It should be noted that although the “Na-D-2.5” and “Na-D-3.0” mixtures contained the highest amount of CMC and had the lowest W/GP-solids, the mixtures still exhibited the highest spread diameter, both before and after the drop of the flow table, which makes them unsuitable for extrusion-based 3DCP. This is because of the high viscosity of D grade Na2SiO3 when the W/GP-solids decrease. The resultant solution has an insufficient ability to wet all solid particles and hence proper mixing does not occur. Therefore, the initial setting time for the mix increases considerably and the spread diameter of the mix becomes the highest out of all mixes.
For a constant mass ratio of SS to HS of 1.5, the average spread diameter of the Na-based geopolymer mixture after the drop of the flow table was comparable to that of the corresponding K-based geopolymer mixture. Nevertheless, for constant mass ratios of SS and HS of 2.5 and 3.0, respectively, the average spread diameter of the Na-based geopolymer mixture after the drop of the flow table was 13–52% higher than that of the corresponding K-based geopolymer mixture, depending on the type of SS used. A previous study showed that slump is affected by the yield stress of the paste that is used [34]. Therefore, the higher workability of the Na-based geopolymer mixtures than the K-based geopolymer mixtures indicates lower yield stress. In the K-based geopolymer mixtures, for a constant mass ratio of SS to HS, regardless of the type of K-silicate solution used, the average spread diameter after the drop of the flow table was comparable. In general, it can be concluded that the type of HS, the type of SS and the mass ratio of SS to HS had considerable effects on the workability of the fresh geopolymer mixtures investigated in this paper.
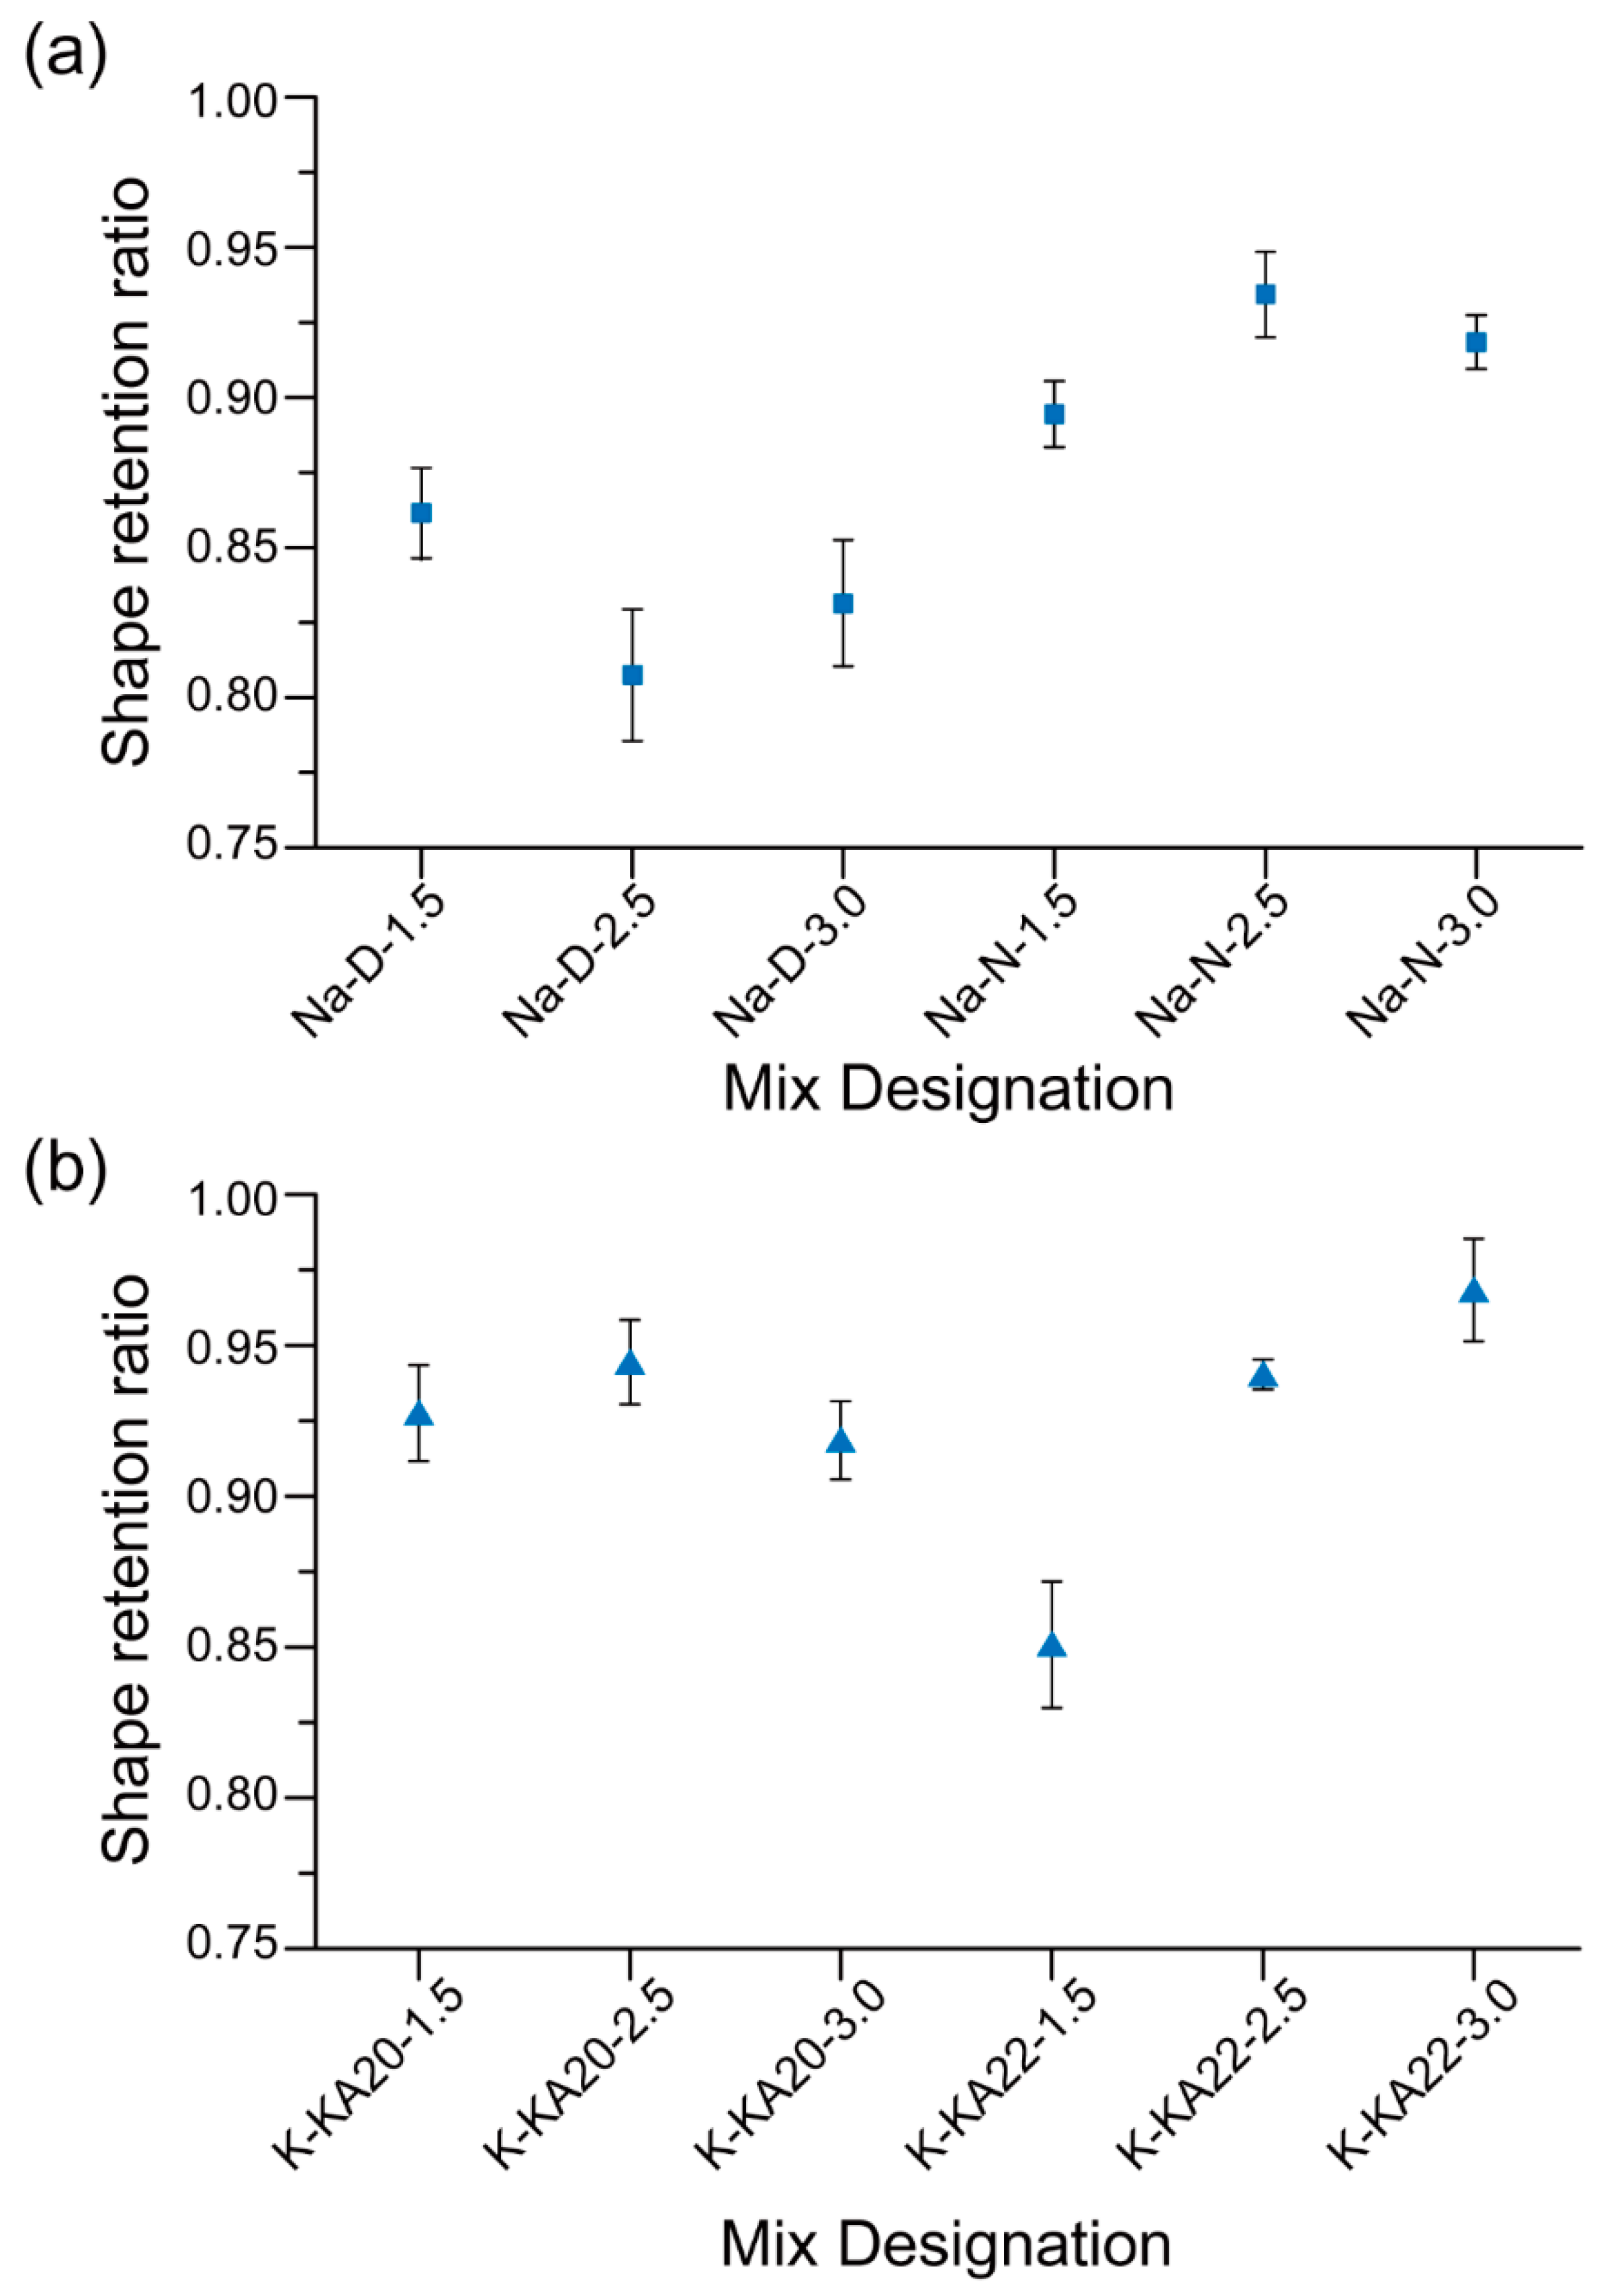
4.1.3. Shape Retention Ability
Figure 9 shows the SRRs of the 3D printable geopolymer mixtures. Among the Na-based geopolymers, the mixtures made of D grade Na2SiO3 solution contained a higher amount of CMC powder (Table 3), however, the SRRs of these mixtures were lower than that of the mixtures made with the N grade Na2SiO3 solution. This is true regardless of the SS/HS mass ratio. This result is consistent with the workability results (Figure 8a), where the “Na-D-2.5” and “Na-D-3.0” mixtures had the highest spread diameter both before and after the dropping of the flow table, indicating the poor shape retention ability of these mixtures.
Among the geopolymers made of N grade Na2SiO3 solution, the “Na-N-2.5” mixture exhibited the highest mean SRR, and thereby the highest shape retention ability. The higher SRR of the “Na-N-2.5” mixture than that of the “Na-N-1.5” mixture is due to its lower W/GP-solids and higher CMC content. The SRR of the “Na-N-3.0” mixture was lower than that of the “Na-N-2.5” mixture, which may be due to its lower CMC content.
As can be seen in Figure 9b, the SRR of the K-based geopolymers significantly depended on the type of SS and mass ratio of SS/HS. The “K-KA22-1.5” mixture exhibited the lowest SRR and thereby the lowest shape retention ability. This may be because this mixture had the highest W/GP-solids among the K-based mixtures (Table 3).
4.1.4. Compressive Strength
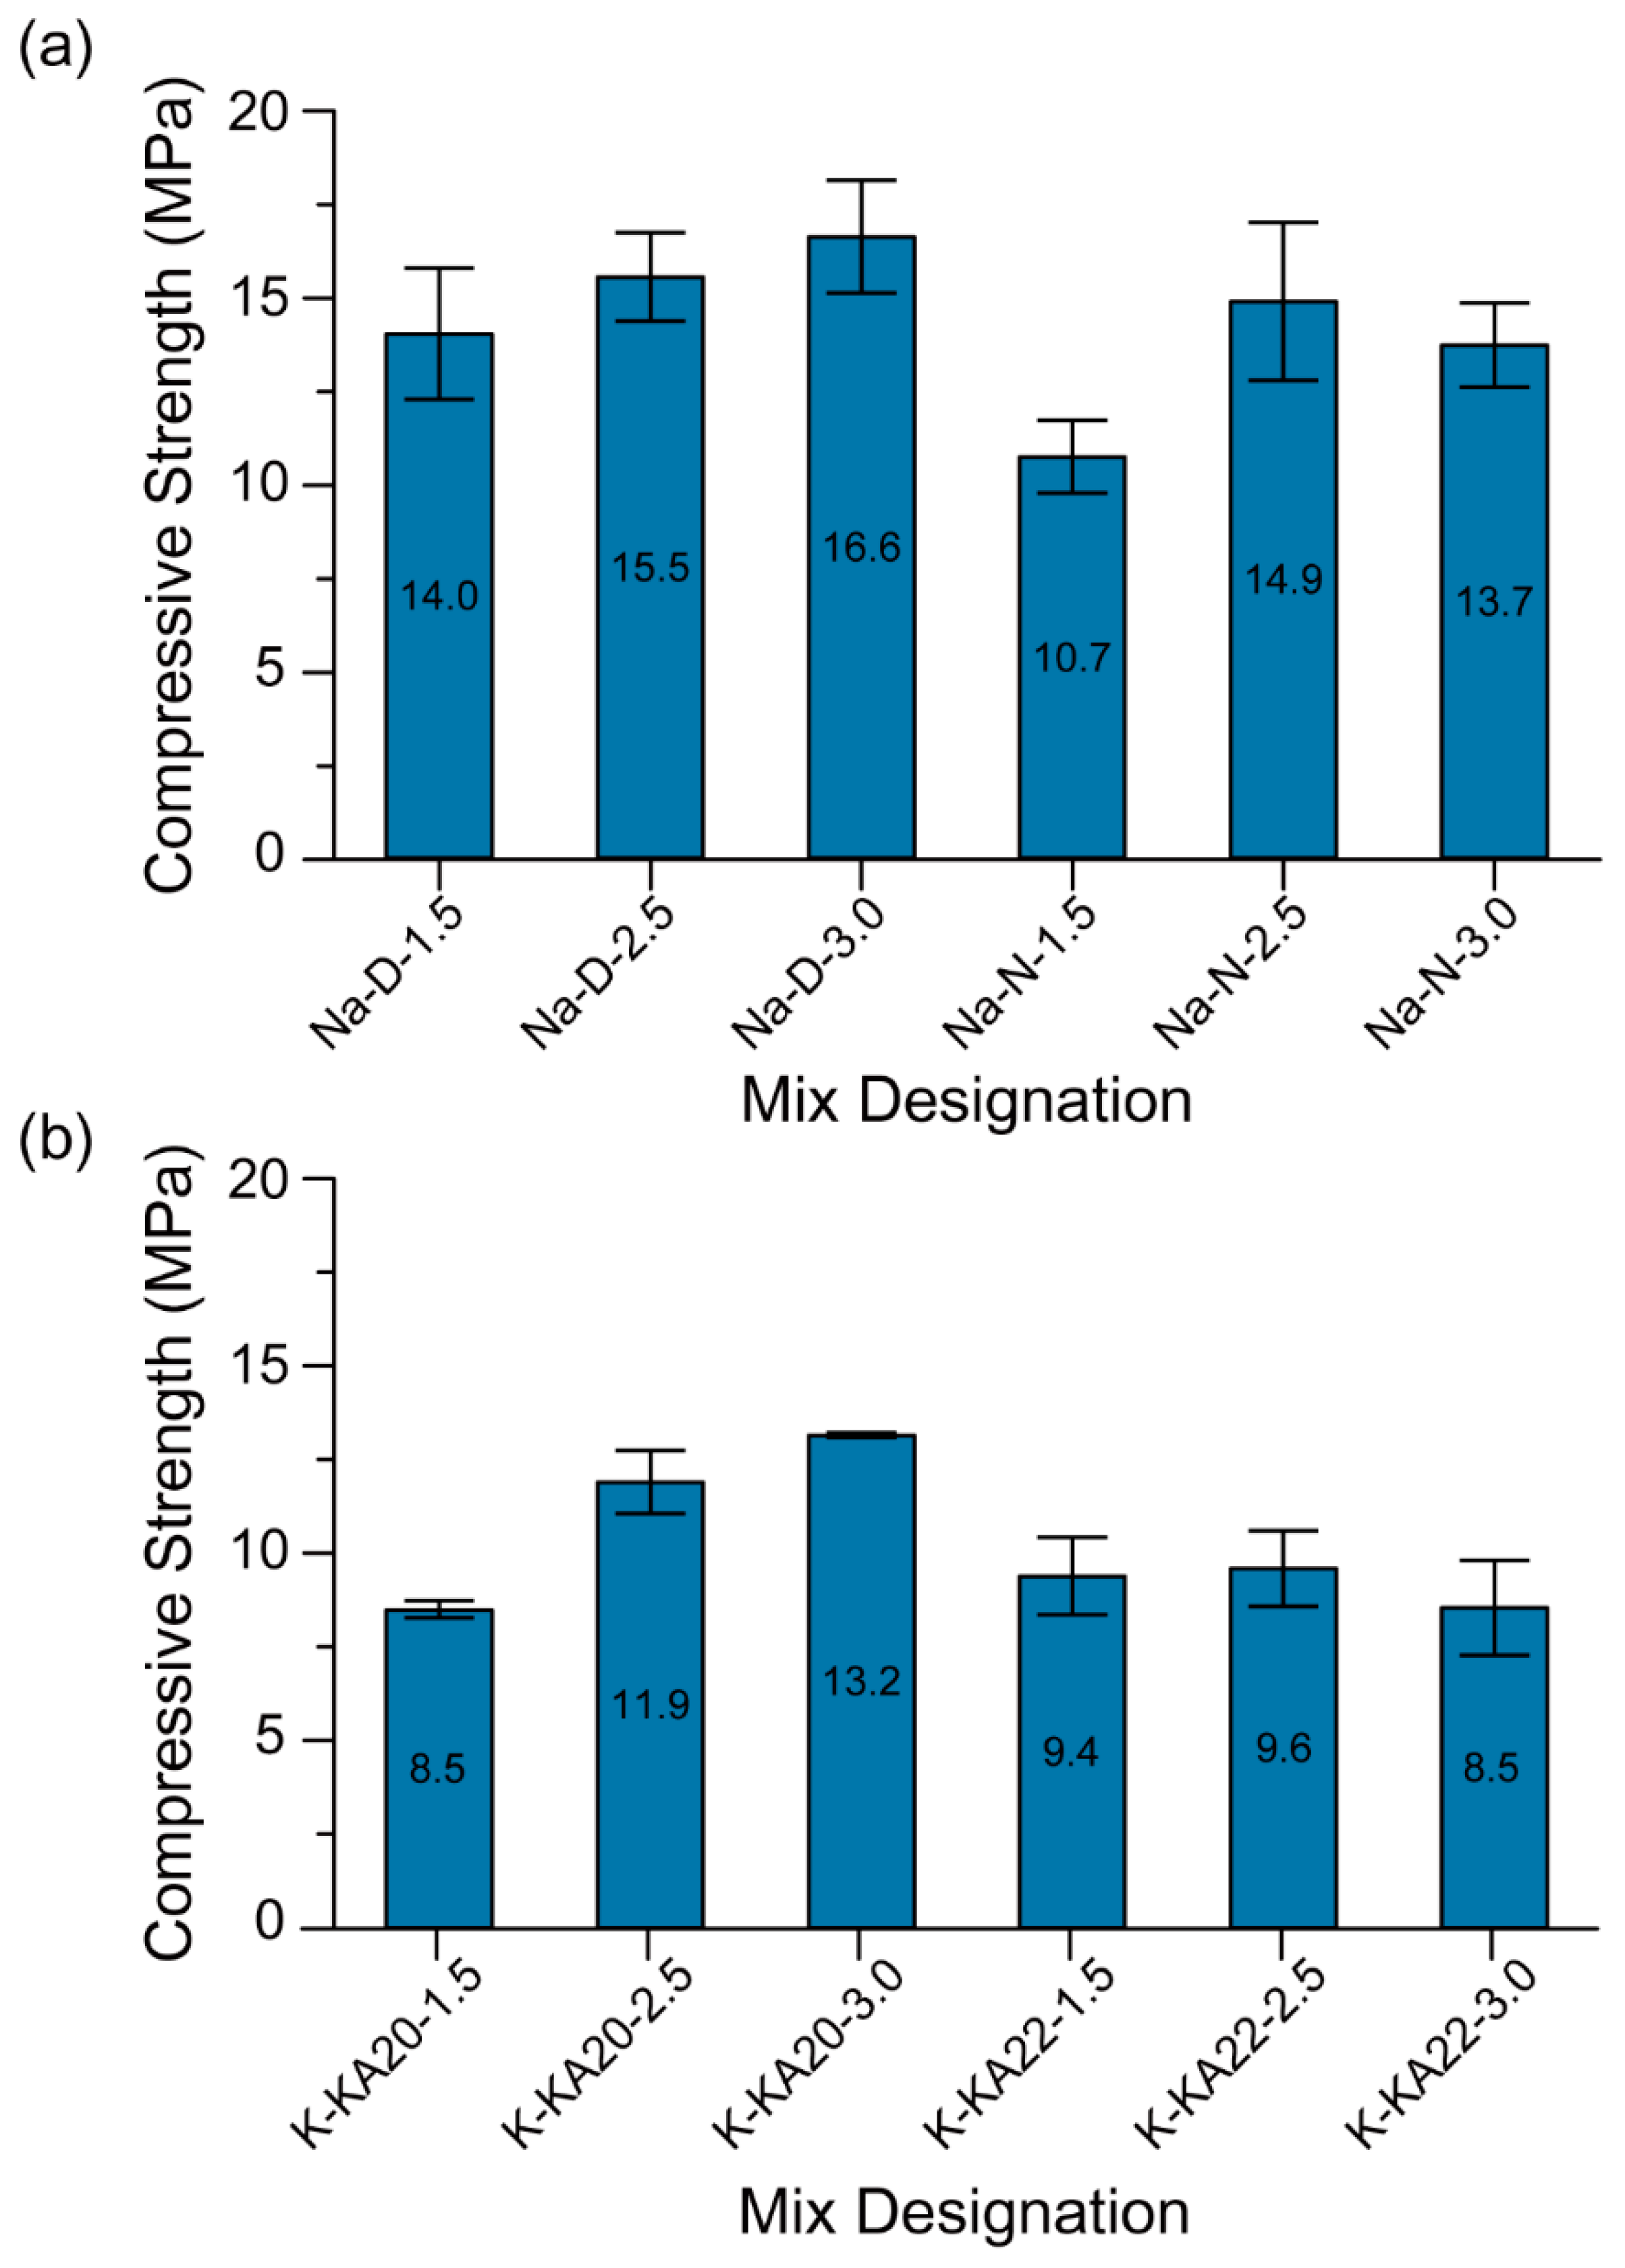
The 3-day compressive strength of the 3D printable geopolymer mixtures is shown in Figure 10. As mentioned in Section 3.3.4, the specimens tested in this section consisted of a single layer only, tested in the longitudinal direction. Regardless of the type of SS and HS, the mean compressive strength of printed geopolymers increases when raising the SS/HS mass ratio from 1.5 to 2.5. Nonetheless, the type of HS and SS are the factors that determine the rate of compressive strength increase. This is because the increase of the SS/HS mass ratio not only reduces the W/GP-solids (Table 3), but also increases the soluble silicate content in the geopolymeric system. As a result, the geopolymerisation reaction and hence compressive strength improves [35,36].
In addition, the increase in the SS/HS mass ratio from 2.5 to 3.0 slightly increased the mean compressive strength of printed geopolymers made of D grade Na2SiO3 solution (SiO2/Na2O = 2.00) or KASIL 2040 grade K2SiO3 solution (SiO2/K2O = 2.02). However, the increase in the SS/HS mass ratio from 2.5 to 3.0 slightly reduced the mean compressive strength of printed geopolymers made from the N grade Na2SiO3 solution (SiO2/Na2O = 3.22) or the KASIL 2236 grade K2SiO3 solution (SiO2/K2O = 2.22). This is because of the use of SS with a higher SiO2/M2O ratio (M = Na or K). The slight increase or decrease in the compressive strength of printed geopolymers due to the increase of the SS/HS mass ratio from 2.5 to 3.0 depended on the SiO2/M2O ratio of SS. Previous studies have reported that the increase in compressive strength of geopolymers directly relates to the content of silicon. However, there is an optimum silicon content where further increase has a slight or negative impact in terms of increasing the compressive strength [36,37].
As can be seen in Figure 10, geopolymers with Na-based activators have higher compressive strength than K-based ones. This result is valid for all samples, regardless of the type of SS and the SS/HS mass ratio. Palomo et al. [38] have reported the same results for the conventionally mould-casted geopolymers. Among the Na-based geopolymers, the mixtures containing the D grade Na2SiO3 solution exhibited higher compressive strength than that of the mixtures containing the N grade Na2SiO3 solution. This is true regardless of the SS/HS mass ratio. However, as mentioned in Section 4.1.3 (Figure 9a), the shape retention ability of the mixtures made of the D grade Na2SiO3 solution was lower than that of the mixtures made from the N grade Na2SiO3 solution. Therefore, the “Na-N-2.5” mixture was selected as the optimum mixture suitable for 3D printing because it exhibited the highest compressive strength and shape retention ability among the mixtures made from the N grade Na2SiO3 solution.
4.2. Results of Part II
4.2.1. Compressive Strength
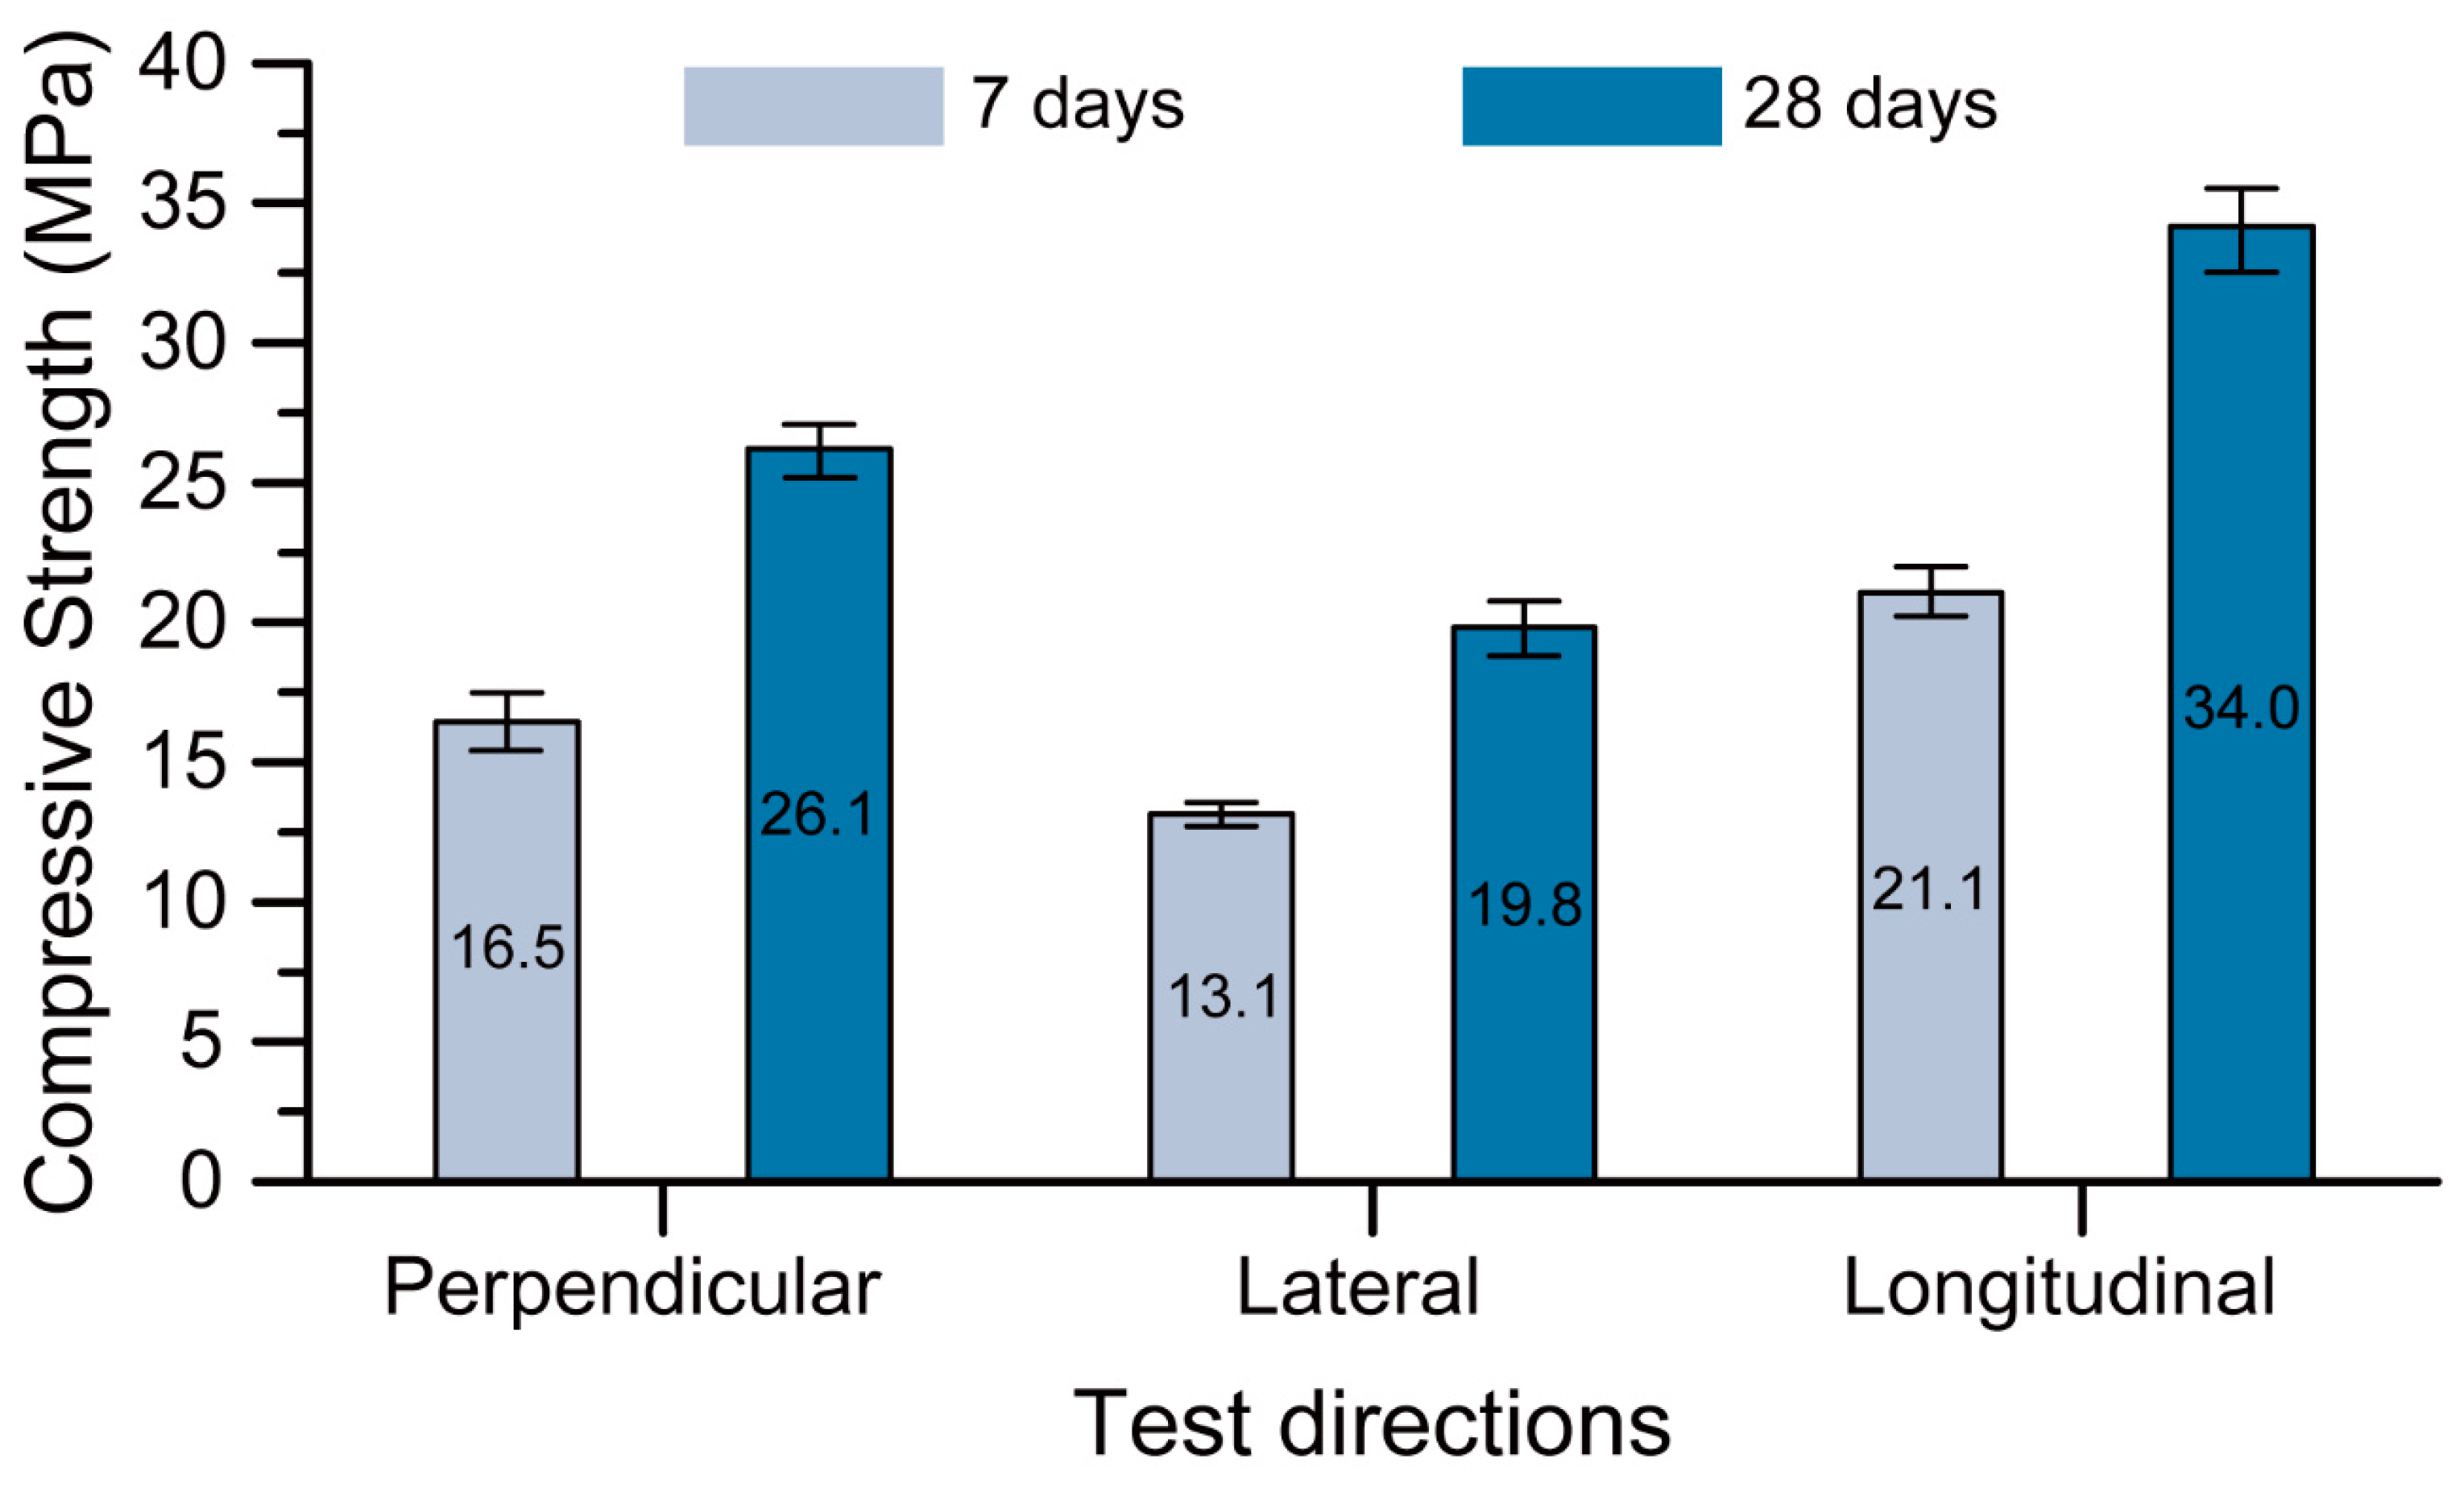
Figure 11 presents the 7-day and 28-day compressive strengths of the Na-N-2.5 mix (the optimum 3D printable mixture) in the tested loading directions. Similar to other 3D printed concretes, the optimum mix exhibited anisotropic behaviour with respect to the loading directions [11,22,39]. Figure 11 shows that the longitudinal and lateral loading directions have the highest and the lowest compressive strength at any age, respectively. This agrees with the results obtained by Sanjayan et al. [39] for printable OPC concrete and Panda et al. [40] and Nematollahi et al. [41] for printable geopolymer concrete. High pressure applies to the fresh material during extrusion in the print direction and hence it is anticipated to have the highest strength in longitudinal direction [39,40]. On the other hand, no pressure is applied in the lateral direction, and the printed material expands and settles freely in this direction, therefore, it shows the lowest strength in this direction [39]. The fresh material in the perpendicular direction experiences some pressure because of its own weight and hence it has a strength between the materials printed in the other two directions.
As expected, the samples cured for 28 days had higher strengths than those cured for 7 days. Deb et al. [42] reported similar results for conventionally mould-casted geopolymers. It is interesting that the loading direction was effective on this increase, where the rate of increase in the longitudinal, perpendicular and lateral directions was 61%, 58% and 51%, respectively.
4.2.2. Flexural Strength
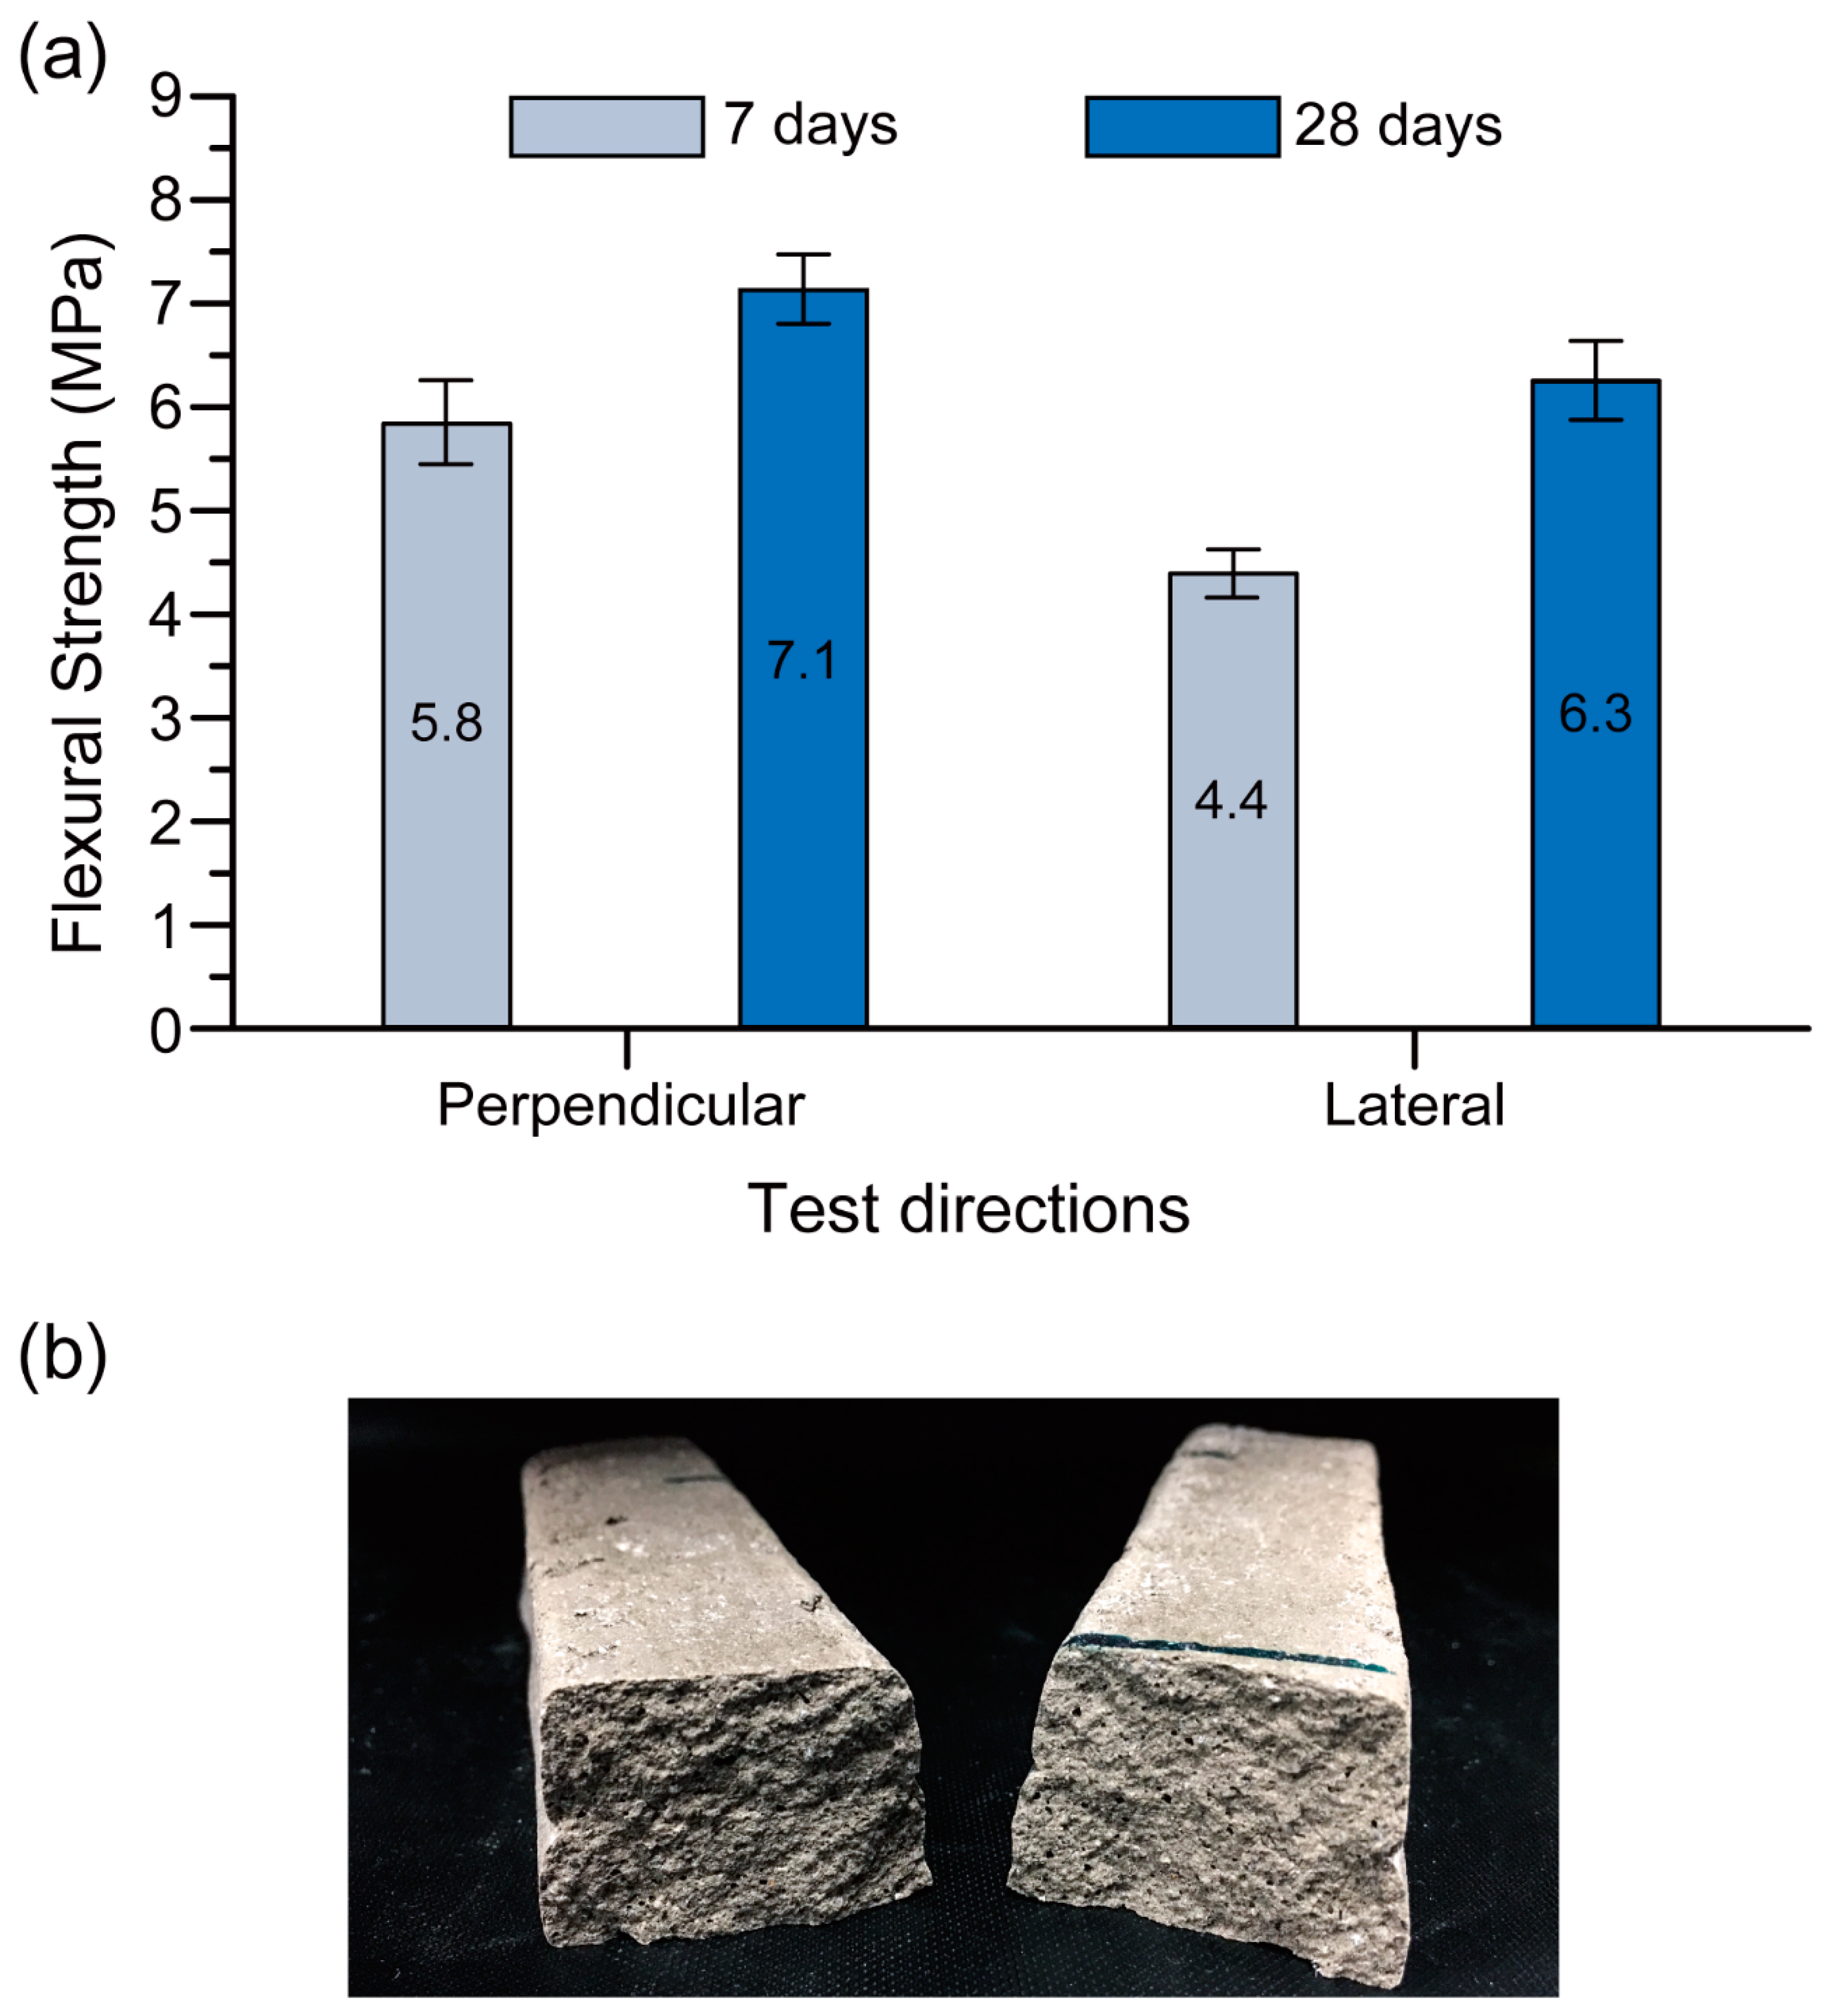
Figure 12a shows the 7-day and 28-day flexural strengths of the Na-N-2.5 mix (the optimum 3D printable mixture) in the tested loading directions. Similar to the compressive strength results, anisotropic behaviour was observed for flexural strength testing in the different load directions [11,22,39]. This behaviour could be considered as an inherent characteristic which is observable in additive manufacturing processes and layered composites [43]. The failure observed in the flexural testing was a tensile failure rather than a shear failure of the interface. The seamless interface between layers is noticeable in Figure 12b, supporting this statement.
Figure 12a shows that the testing of the printed mix under flexural load in the perpendicular direction exhibited higher strength than in the lateral direction for any age of curing. This agrees with the results obtained by Sanjayan et al. [39] for printable OPC concrete and Panda et al. [40] for printable geopolymer concrete. Because of the weight of the top layer during printing, the bottom layer is probably well compacted and hence the flexural strength of the sample in the perpendicular load direction is higher than the lateral direction [39].
The flexural strength of the Na-N-2.5 mix was also significantly higher at 28 days than that at 7 days, owing to the longer age of curing. The loading direction was effective on this increase where the rate of increase in lateral and perpendicular directions was 43% and 22% respectively.
The compressive strength of the material tested in the perpendicular direction after 28 days of curing was 32% higher than the same material tested in the lateral direction. This difference for the flexural strength test was only 13%. This result indicates that the anisotropic behaviour in the compression test of the optimum 3D printed geopolymer mix was more pronounced than in the flexural test.
4.2.3. Interlayer Bond Strength
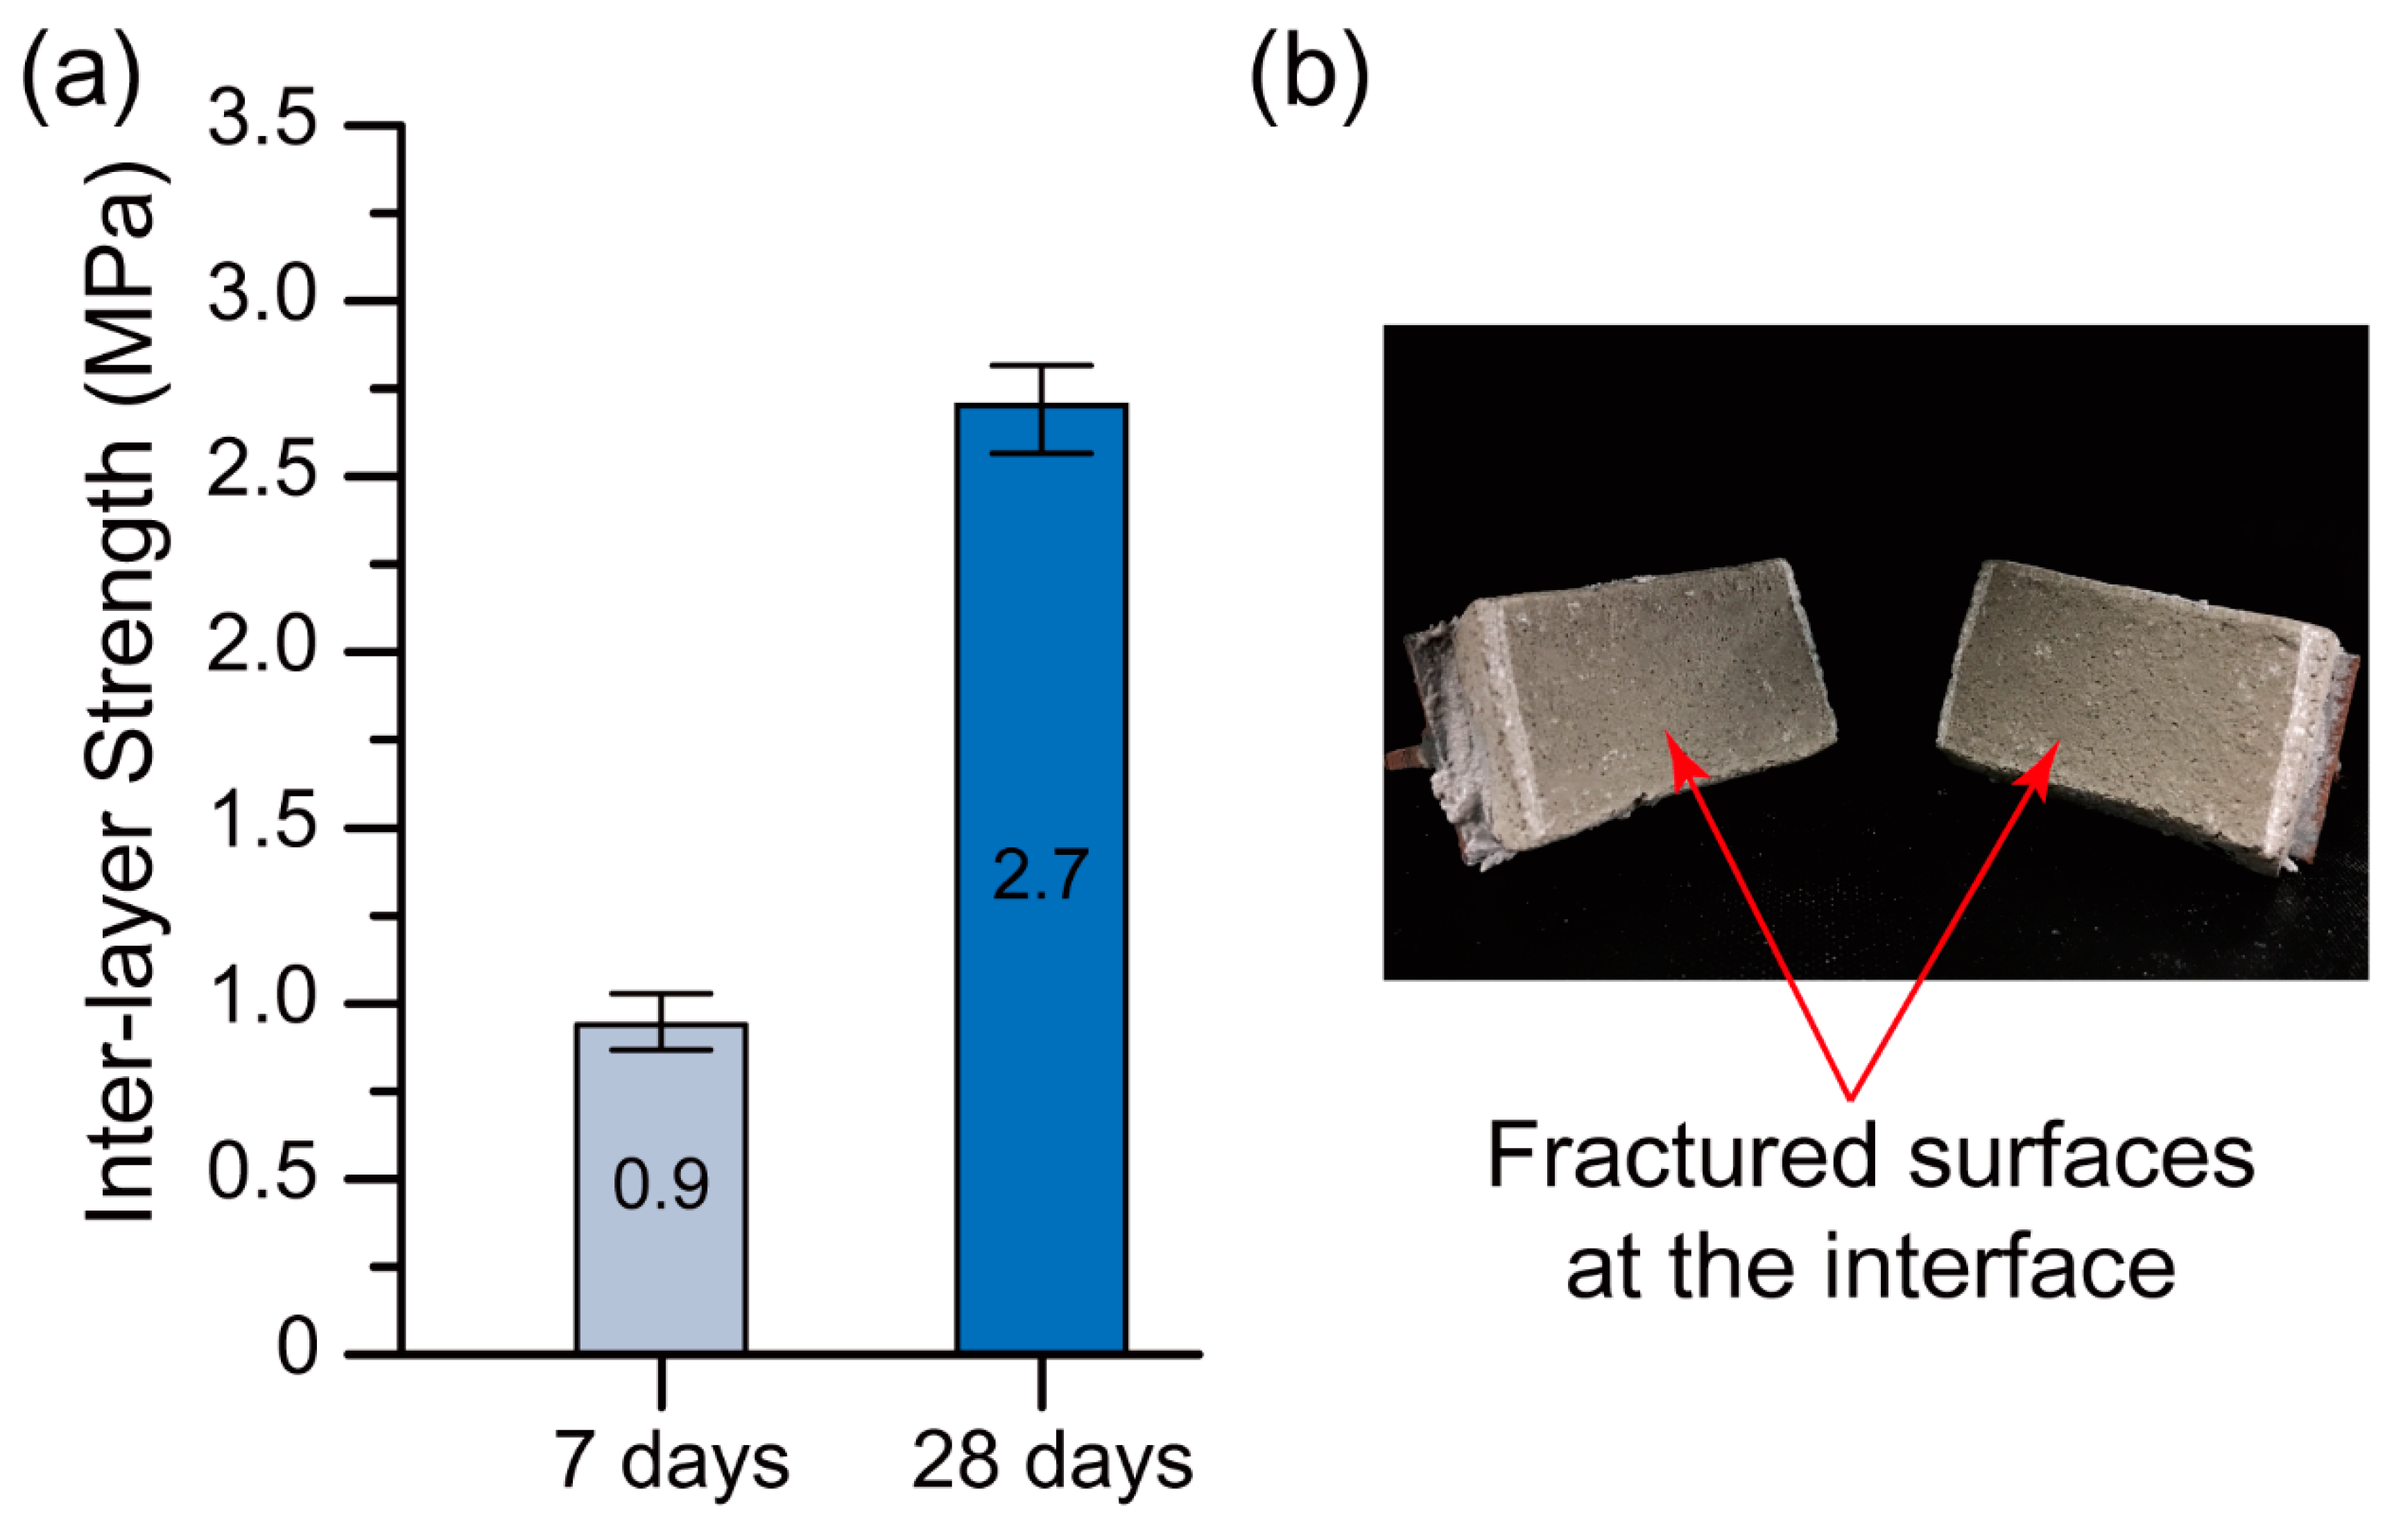
Figure 13a presents the 7-day and 28-day interlayer bond strengths of the Na-N-2.5 mix (the optimum 3D printable mixture). The mean interlayer bond strength at 28 days was exactly three times higher than that at 7 days. It should be noted that the 7-day interlayer bond strength (0.9 MPa) obtained was still adequate to avoid interfacial shear failure. The failure mode in the flexural test, which was tensile, not shear, confirms this statement. Figure 12b supports the high interlayer bond strength obtained because there was not any noticeable layer interface on the fractured surfaces of the printed specimen. As shown in Figure 13b, regardless of the testing age, the failure of all interlayer bond strength samples happened at the bottom and top layer interfaces.
The 28-day interlayer bond strength obtained was almost two times higher than that obtained in a previous study [22], where the strength was 1.4 MPa as compared to the 2.7 MPa obtained. This reveals that optimising material ingredients is of high importance.
5. Conclusions
An optimum 3D printable geopolymer mixture cured at ambient temperature was developed in this paper by optimizing the geopolymer mixture parameters (including the type of hydroxide solutions (HS), the type of silicate solutions (SS) and the SS/HS mass ratio) across multiple performance criteria (including workability, extrudability, shape retention ability and compressive strength). According to the testing direction, the optimum mixture exhibited a 28-day compressive strength of 19.8–34.0 MPa and a flexural strength of 6.3–7.1 MPa. Additionally, a 28-day interlayer bond strength of 2.7 MPa was achieved. From the obtained results, the following conclusions can be made:
- The parameters investigated had insignificant impact on the extrudability of the mixtures, as no blockage, tearing, segregation, or bleeding was observed during the extrusion process of all mixtures. This is because the dosage of admixtures (i.e., viscosity modifying agent and retarder) were adjusted in each mixture to obtain beneficial rheological properties appropriate for concrete 3D printing, based on the extrusion method.
- The mixture parameters investigated had considerable effects on the workability of the fresh printable geopolymers. In general, the sodium (Na)-based geopolymers had higher workability than the potassium (K)-based ones, which indicates the lower yield stress of the Na-based geopolymers than that of the K-based geopolymers.
- The shape retention ability of the printable geopolymers made from the Na2SiO3 solution with SiO2/Na2O of 3.22 (N grade) was higher than that of the mixtures made from the Na2SiO3 solution with SiO2/Na2O of 2.00 (D grade) for all SS/HS mass ratios.
- Na-based printable geopolymers had higher compressive strengths than K-based ones for all types of SS and SS/HS mass ratios.
- The compressive strengths of the optimum printable mixture for the printed materials tested in the longitudinal, perpendicular and lateral directions were 34.0, 26.1 and 19.8 MPa, respectively.
- The flexural strengths of the optimum printable mixture for the printed materials tested in the perpendicular and lateral directions were 7.10 and 6.30 MPa, respectively.
Author Contributions
This research project was conceived and performed under supervision of J.S., B.N. and A.N.; B.N. designed the experiments; S.H.B. and M.X. performed the experiments; B.N. and S.H.B. jointly analysed the data and wrote the draft of the paper; A.N. and J.S. reviewed and edited the paper.
Funding
This research was funded by the Australian Research Council Discovery Grant DP170103521, Linkage Infrastructure Grant LE170100168, Discovery Early Career Researcher Grant DE180101587, and Future Fellowship Grant FT160100066.
Acknowledgments
The authors would like to thank the technical staff at Digital Construction Laboratory and Smart Structures Laboratory, Swinburne University of Technology for their assistance during the experimental work.
Conflicts of Interest
The authors declare no conflict of interest. The funders had no role in the design of the study, in the collection, analyses, or interpretation of data, in the writing of the manuscript, or in the decision to publish the results.
References
- Gao, W.; Zhang, Y.; Ramanujan, D.; Ramani, K.; Chen, Y.; Williams, C.B.; Wang, C.C.; Shin, Y.C.; Zhang, S.; Zavattieri, P.D. The status, challenges, and future of additive manufacturing in engineering. Comput. Aided Des. 2015, 69, 65–89. [Google Scholar] [CrossRef]
- Lim, S.; Buswell, R.A.; Le, T.T.; Austin, S.A.; Gibb, A.G.; Thorpe, T. Developments in construction-scale additive manufacturing processes. Autom. Constr. 2012, 21, 262–268. [Google Scholar] [CrossRef] [Green Version]
- Wangler, T.; Lloret, E.; Reiter, L.; Hack, N.; Gramazio, F.; Kohler, M.; Bernhard, M.; Dillenburger, B.; Buchli, J.; Roussel, N. Digital concrete: Opportunities and challenges. RILEM Tech. Lett. 2016, 1, 67–75. [Google Scholar] [CrossRef]
- Nematollahi, B.; Xia, M.; Sanjayan, J. Current progress of 3D concrete printing technologies. In Proceedings of the International Symposium on Automation and Robotics in Construction, Taipei, Taiwan, 28 June–1 July 2017; pp. 260–267. [Google Scholar]
- Paul, S.C.; van Zijl, G.P.; Tan, M.J.; Gibson, I. A review of 3D concrete printing systems and materials properties: Current status and future research prospects. Rapid Prototyp. J. 2018, 24, 784–798. [Google Scholar] [CrossRef]
- Rael, R.; San Fratello, V. Developing Concrete Polymer Building Components for 3D Printing. 2011. Available online: http://www.rael-sanfratello.com/media/emerging_objects/papers/243.pdf (accessed on 27 April 2018).
- Cesaretti, G.; Dini, E.; de Kestelier, X.; Colla, V.; Pambaguian, L. Building components for an outpost on the Lunar soil by means of a novel 3D printing technology. Acta Astronaut. 2014, 93, 430–450. [Google Scholar] [CrossRef]
- Khoshnevis, B.; Bukkapatnam, S.; Kwon, H.; Saito, J. Experimental investigation of contour crafting using ceramics materials. Rapid Prototyp. J. 2001, 7, 32–42. [Google Scholar] [CrossRef]
- Kazemian, A.; Yuan, X.; Cochran, E.; Khoshnevis, B. Cementitious materials for construction-scale 3D printing: Laboratory testing of fresh printing mixture. Constr. Build. Mater. 2017, 145, 639–647. [Google Scholar] [CrossRef]
- Zareiyan, B.; Khoshnevis, B. Interlayer adhesion and strength of structures in contour crafting-effects of aggregate size, extrusion rate, and layer thickness. Autom. Constr. 2017, 81, 112–121. [Google Scholar] [CrossRef]
- Le, T.T.; Austin, S.A.; Lim, S.; Buswell, R.A.; Gibb, A.G.; Thorpe, T. Mix design and fresh properties for high-performance printing concrete. Mater. Struct. 2012, 45, 1221–1232. [Google Scholar] [CrossRef] [Green Version]
- Le, T.T.; Austin, S.A.; Lim, S.; Buswell, R.A.; Law, R.; Gibb, A.G.; Thorpe, T. Hardened properties of high-performance printing concrete. Cem. Concr. Res. 2012, 42, 558–566. [Google Scholar] [CrossRef] [Green Version]
- Nerella, V.; Krause, M.; Näther, M.; Mechtcherine, V. CONPrint3D—3D printing technology for onsite construction. Concr. Aust. 2016, 42, 36–39. [Google Scholar]
- Gosselin, C.; Duballet, R.; Roux, P.; Gaudillière, N.; Dirrenberger, J.; Morel, P. Large-scale 3D printing of ultra-high performance concrete—A new processing route for architects and builders. Mater. Des. 2016, 100, 102–109. [Google Scholar] [CrossRef]
- Marchment, T.; Xia, M.; Dodd, E.; Sanjayan, J.; Nematollahi, B. Effect of delay time on the mechanical properties of extrusion-based 3D printed concrete. In Proceedings of the International Symposium on Automation and Robotics in Construction, Taipei, Taiwan, 28 June–1 July 2017; pp. 240–245. [Google Scholar]
- Sarker, P.K.; Mcbeath, S. Fire endurance of steel reinforced fly ash geopolymer concrete elements. Constr. Build. Mater. 2015, 90, 91–98. [Google Scholar] [CrossRef]
- Taylor, M.; Tam, C.; Gielen, D. Energy efficiency and CO2 emissions from the global cement industry. Korea 2006, 50, 61–67. [Google Scholar]
- Nematollahi, B.; Sanjayan, J.; Shaikh, F.U.A. Synthesis of heat and ambient cured one-part geopolymer mixes with different grades of sodium silicate. Ceram. Int. 2015, 41, 5696–5704. [Google Scholar] [CrossRef]
- Li, Z.; Ding, Z.; Zhang, Y. Development of sustainable cementitious materials. Proceedings of International Workshop on Sustainable Development and Concrete Technology, Beijing, China, 20–21 May 2004; pp. 55–76. [Google Scholar]
- Duxson, P.; Provis, J.L.; Lukey, G.C.; Van Deventer, J.S. The role of inorganic polymer technology in the development of ‘green concrete’. Cem. Concr. Res. 2007, 37, 1590–1597. [Google Scholar] [CrossRef]
- Sanjayan, J. Materials technology research to structural design of geopolymer concrete. In Mechanics of Structures and Materials XXIV; CRC Press: Boca Raton, FL, USA, 2016; pp. 60–69. [Google Scholar]
- Panda, B.; Paul, S.C.; Hui, L.J.; Tay, Y.W.D.; Tan, M.J. Additive manufacturing of geopolymer for sustainable built environment. J. Clean. Prod. 2017, 167, 281–288. [Google Scholar] [CrossRef]
- Panda, B.; Unluer, C.; Tan, M.J. Investigation of the rheology and strength of geopolymer mixtures for extrusion-based 3D printing. Cem. Concr. Compos. 2018, 94, 307–314. [Google Scholar] [CrossRef]
- Nath, P.; Sarker, P.K. Use of OPC to improve setting and early strength properties of low calcium fly ash geopolymer concrete cured at room temperature. Cem. Concr. Compos. 2015, 55, 205–214. [Google Scholar] [CrossRef]
- Panias, D.; Giannopoulou, I.P.; Perraki, T. Effect of synthesis parameters on the mechanical properties of fly ash-based geopolymers. Colloids Surf. A Physicochem. Eng. Asp. 2007, 301, 246–254. [Google Scholar] [CrossRef]
- Sathonsaowaphak, A.; Chindaprasirt, P.; Pimraksa, K. Workability and strength of lignite bottom ash geopolymer mortar. J. Hazard. Mater. 2009, 168, 44–50. [Google Scholar] [CrossRef] [PubMed]
- Nematollahi, B.; Qiu, J.; Yang, E.-H.; Sanjayan, J. Microscale investigation of fiber-matrix interface properties of strain-hardening geopolymer composite. Ceram. Int. 2017, 43, 15616–15625. [Google Scholar] [CrossRef]
- Nematollahi, B.; Qiu, J.; Yang, E.H.; Sanjayan, J. Micromechanics constitutive modelling and optimization of strain hardening geopolymer composite. Ceram. Int. 2017, 43, 5999–6007. [Google Scholar] [CrossRef]
- Panda, B.; Paul, S.C.; Mohamed, N.A.N.; Tay, Y.W.D.; Tan, M.J. Measurement of tensile bond strength of 3D printed geopolymer mortar. Measurement 2018, 113, 108–116. [Google Scholar] [CrossRef]
- Hardjito, D.; Wallah, S.E.; Sumajouw, D.M.; Rangan, B.V. On the development of fly ash-based geopolymer concrete. Mater. J. 2004, 101, 467–472. [Google Scholar]
- ASTM. Standard Test Method for Flow of Hydraulic Cement Mortar; C1437-15; ASTM International: West Conshohocken, PA, USA, 2015. [Google Scholar]
- Bong, S.H.; Nematollahi, B.; Nazari, A.; Xia, M.; Sanjayan, J.G. Fresh and hardened properties of 3D printable geopolymer cured in ambient temperature. In Proceedings of the RILEM International Conference on Concrete and Digital Fabrication, Zurich, Swithzerland, 10–12 September 2018; pp. 3–11. [Google Scholar]
- Panda, B.; Tan, M.J. Experimental study on mix proportion and fresh properties of fly ash based geopolymer for 3D concrete printing. Ceram. Int. 2018, 44, 10258–10265. [Google Scholar] [CrossRef]
- Wallevik, J.E. Relationship between the Bingham parameters and slump. Cem. Concr. Res. 2006, 36, 1214–1221. [Google Scholar] [CrossRef]
- Nadoushan, M.J.; Ramezanianpour, A.A. The effect of type and concentration of activators on flowability and compressive strength of natural pozzolan and slag-based geopolymers. Constr. Build. Mater. 2016, 111, 337–347. [Google Scholar] [CrossRef]
- Komljenović, M.; Baščarević, Z.; Bradić, V. Mechanical and microstructural properties of alkali-activated fly ash geopolymers. J. Hazard. Mater. 2010, 181, 35–42. [Google Scholar] [CrossRef]
- Law, D.W.; Adam, A.A.; Molyneaux, T.K.; Patnaikuni, I.; Wardhono, A. Long term durability properties of class F fly ash geopolymer concrete. Mater. Struct. 2015, 48, 721–731. [Google Scholar] [CrossRef]
- Palomo, A.; Grutzeck, M.; Blanco, M. Alkali-activated fly ashes: A cement for the future. Cem. Concr. Res. 1999, 29, 1323–1329. [Google Scholar] [CrossRef]
- Sanjayan, J.G.; Nematollahi, B.; Xia, M.; Marchment, T. Effect of surface moisture on interlayer strength of 3D printed concrete. Constr. Build. Mater. 2018, 172, 468–475. [Google Scholar] [CrossRef]
- Panda, B.; Paul, S.C.; Tan, M.J. Anisotropic mechanical performance of 3D printed fiber reinforced sustainable construction material. Mater. Lett. 2017, 209, 146–149. [Google Scholar] [CrossRef]
- Nematollahi, B.; Xia, M.; Bong, S.H.; Sanjayan, J. Hardened properties of 3D printable ‘one-part’geopolymer for construction applications. Proceedings of RILEM International Conference on Concrete and Digital Fabrication, Zurich, Swithzerland, 10–12 September 2018; pp. 190–199. [Google Scholar]
- Deb, P.S.; Nath, P.; Sarker, P.K. The effects of ground granulated blast-furnace slag blending with fly ash and activator content on the workability and strength properties of geopolymer concrete cured at ambient temperature. Mater. Des. 2014, 62, 32–39. [Google Scholar] [CrossRef]
- Oxman, N.; Tsai, E.; Firstenberg, M. Digital anisotropy: A variable elasticity rapid prototyping platform: This paper proposes and demonstrates a digital anisotropic fabrication approach by employing a multi-material printing platform to fabricate materials with controlled gradient properties. Virtual Phys. Prototyp. 2012, 7, 261–274. [Google Scholar] [CrossRef]
Figure 1.
Particle size distributions of the fly ash, slag, fine sand (FS) and coarser sand (CS).

Figure 2.
Schematic drawing of the custom-made 3D printing apparatus.

Figure 3.
(a) One layer of 3D printed geopolymer filament. (b) Two layers of 3D printed geopolymer filament.
Figure 3.
(a) One layer of 3D printed geopolymer filament. (b) Two layers of 3D printed geopolymer filament.

Figure 4.
Dimensions and testing directions for the compression test of (a) the 3D printed one-layer specimen and (b) the 3D printed two-layer specimen.
Figure 4.
Dimensions and testing directions for the compression test of (a) the 3D printed one-layer specimen and (b) the 3D printed two-layer specimen.

Figure 5.
Testing directions for the flexural test of the two-layer optimum 3D printed geopolymer mix.
Figure 5.
Testing directions for the flexural test of the two-layer optimum 3D printed geopolymer mix.

Figure 6.
(a) Specimen prepared for interlayer bond test. (b) Test setup for interlayer bond tests.

Figure 7.
Four 250 mm printed filaments of the “Na-N-2.5” mixture.

Figure 8.
Workability test results of the 3D printable geopolymers with (a) Na-based activators and (b) K-based activators.
Figure 8.
Workability test results of the 3D printable geopolymers with (a) Na-based activators and (b) K-based activators.

Figure 9.
Shape retention ratios of 3D printable geopolymers with (a) Na-based activators and (b) K-based activators.
Figure 9.
Shape retention ratios of 3D printable geopolymers with (a) Na-based activators and (b) K-based activators.

Figure 10.
Compressive strength of 3D printed geopolymers with (a) Na-based activators and (b) K-based activators.
Figure 10.
Compressive strength of 3D printed geopolymers with (a) Na-based activators and (b) K-based activators.

Figure 11.
Compressive strength of Na-N-2.5 (the optimum 3D printable mixture) in different directions.
Figure 11.
Compressive strength of Na-N-2.5 (the optimum 3D printable mixture) in different directions.

Figure 12.
(a) Flexural strength of Na-N-2.5 (the optimum 3D printable mixture) in different directions. (b) Side view of the fractured surfaces.
Figure 12.
(a) Flexural strength of Na-N-2.5 (the optimum 3D printable mixture) in different directions. (b) Side view of the fractured surfaces.

Figure 13.
(a) Interlayer bond strength of Na-N-2.5 (the optimum 3D printable mixture). (b) Failure mode of a tested specimen.
Figure 13.
(a) Interlayer bond strength of Na-N-2.5 (the optimum 3D printable mixture). (b) Failure mode of a tested specimen.


Table 1.
Chemical composition of the slag and fly ash (wt.%).
| Chemical | Component | |
|---|---|---|
| Slag | Fly Ash | |
| Al2O3 | 12.4 | 25.6 |
| SiO2 | 32.8 | 51.1 |
| CaO | 44.6 | 4.30 |
| Fe2O3 | 0.54 | 12.5 |
| K2O | 0.33 | 0.70 |
| MgO | 5.15 | 1.45 |
| Na2O | 0.22 | 0.77 |
| P2O5 | 0.88 | 0.01 |
| TiO2 | 0.51 | 1.32 |
| MnO | 0.15 | 0.37 |
| SO3 | 4.26 | 0.24 |
| L.O.I. 1 | 0.09 | 0.57 |
1 Loss on ignition.
Table 2.
Specifications of the silicate solutions (SSs).
| Type of SS | SiO2/M2O * | SiO2 (wt.%) | M2O * (wt.%) | H2O (wt.%) | Viscosity 1 (cps) | Density 1 (g/cc) |
|---|---|---|---|---|---|---|
| D Grade Na2SiO3 | 2.00 | 29.4 | 14.7 | 55.9 | 250–450 | 1.52 |
| N Grade Na2SiO3 | 3.22 | 28.7 | 8.9 | 62.4 | 100–300 | 1.38 |
| KASIL 2040 Grade K2SiO3 | 2.02 | 26.7 | 13.3 | 60.0 | 100–300 | 1.39 |
| KASIL 2236 Grade K2SiO3 | 2.22 | 24.5 | 11.0 | 64.5 | 80–120 | 1.33 |
* M in M2O refers to Na or K; 1 The viscosity and density values are reported at 20 °C.
Table 3.
The mixture proportions of 3D printable geopolymers.
| Mix Designation | Source Materials | Activator | Sand | Borax g | CMC h | W/GP-Solids | ||
|---|---|---|---|---|---|---|---|---|
| HS | SS | CS | FS | |||||
| Na-D-1.5 | 1.000 | 0.160 a | 0.240 c | 1.000 | 0.500 | 0.002 | 0.015 | 0.220 |
| Na-D-2.5 | 1.000 | 0.114 a | 0.286 c | 1.000 | 0.500 | 0.002 | 0.020 | 0.211 |
| Na-D-3.0 | 1.000 | 0.100 a | 0.300 c | 1.000 | 0.500 | 0.002 | 0.020 | 0.208 |
| Na-N-1.5 | 1.000 | 0.160 a | 0.240 d | 1.000 | 0.500 | 0.002 | 0.011 | 0.236 |
| Na-N-2.5 | 1.000 | 0.114 a | 0.286 d | 1.000 | 0.500 | 0.002 | 0.013 | 0.231 |
| Na-N-3.0 | 1.000 | 0.100 a | 0.300 d | 1.000 | 0.500 | 0.002 | 0.010 | 0.229 |
| K-KA20-1.5 | 1.000 | 0.160 b | 0.240 e | 1.000 | 0.500 | 0.002 | 0.010 | 0.222 |
| K-KA20-2.5 | 1.000 | 0.114 b | 0.286 e | 1.000 | 0.500 | 0.004 | 0.009 | 0.218 |
| K-KA20-3.0 | 1.000 | 0.100 b | 0.300 e | 1.000 | 0.500 | 0.005 | 0.007 | 0.216 |
| K-KA22-1.5 | 1.000 | 0.160 b | 0.240 f | 1.000 | 0.500 | 0.005 | 0.008 | 0.234 |
| K-KA22-2.5 | 1.000 | 0.114 b | 0.286 f | 1.000 | 0.500 | 0.005 | 0.006 | 0.232 |
| K-KA22-3.0 | 1.000 | 0.100 b | 0.300 f | 1.000 | 0.500 | 0.005 | 0.004 | 0.231 |
Note: All numbers are mass ratios of the source material (fly ash and slag) weights. a The 8.0 M NaOH solution. b The 8.0 M KOH solution. c The D grade Na2SiO3 solution. d The N grade Na2SiO3 solution. e The KASIL 2040 grade K2SiO3 solution. f The KASIL 2236 grade K2SiO3 solution. g Used as the retarder. f Used as the viscosity modifying agent.
© 2019 by the authors. Licensee MDPI, Basel, Switzerland. This article is an open access article distributed under the terms and conditions of the Creative Commons Attribution (CC BY) license (http://creativecommons.org/licenses/by/4.0/).
Share and Cite
MDPI and ACS Style
Bong, S.H.; Nematollahi, B.; Nazari, A.; Xia, M.; Sanjayan, J. Method of Optimisation for Ambient Temperature Cured Sustainable Geopolymers for 3D Printing Construction Applications. Materials 2019, 12, 902. https://doi.org/10.3390/ma12060902
AMA Style
Bong SH, Nematollahi B, Nazari A, Xia M, Sanjayan J. Method of Optimisation for Ambient Temperature Cured Sustainable Geopolymers for 3D Printing Construction Applications. Materials. 2019; 12(6):902. https://doi.org/10.3390/ma12060902
Chicago/Turabian StyleBong, Shin Hau, Behzad Nematollahi, Ali Nazari, Ming Xia, and Jay Sanjayan. 2019. "Method of Optimisation for Ambient Temperature Cured Sustainable Geopolymers for 3D Printing Construction Applications" Materials 12, no. 6: 902. https://doi.org/10.3390/ma12060902
Note that from the first issue of 2016, this journal uses article numbers instead of page numbers. See further details here.