Dimensionless Analysis for Investigating the Quality Characteristics of Aluminium Matrix Composites Prepared through Fused Deposition Modelling Assisted Investment Casting

 ,
,  , , ,
, , ,  and
and 
Abstract
:1. Introduction
2. Materials and Methods
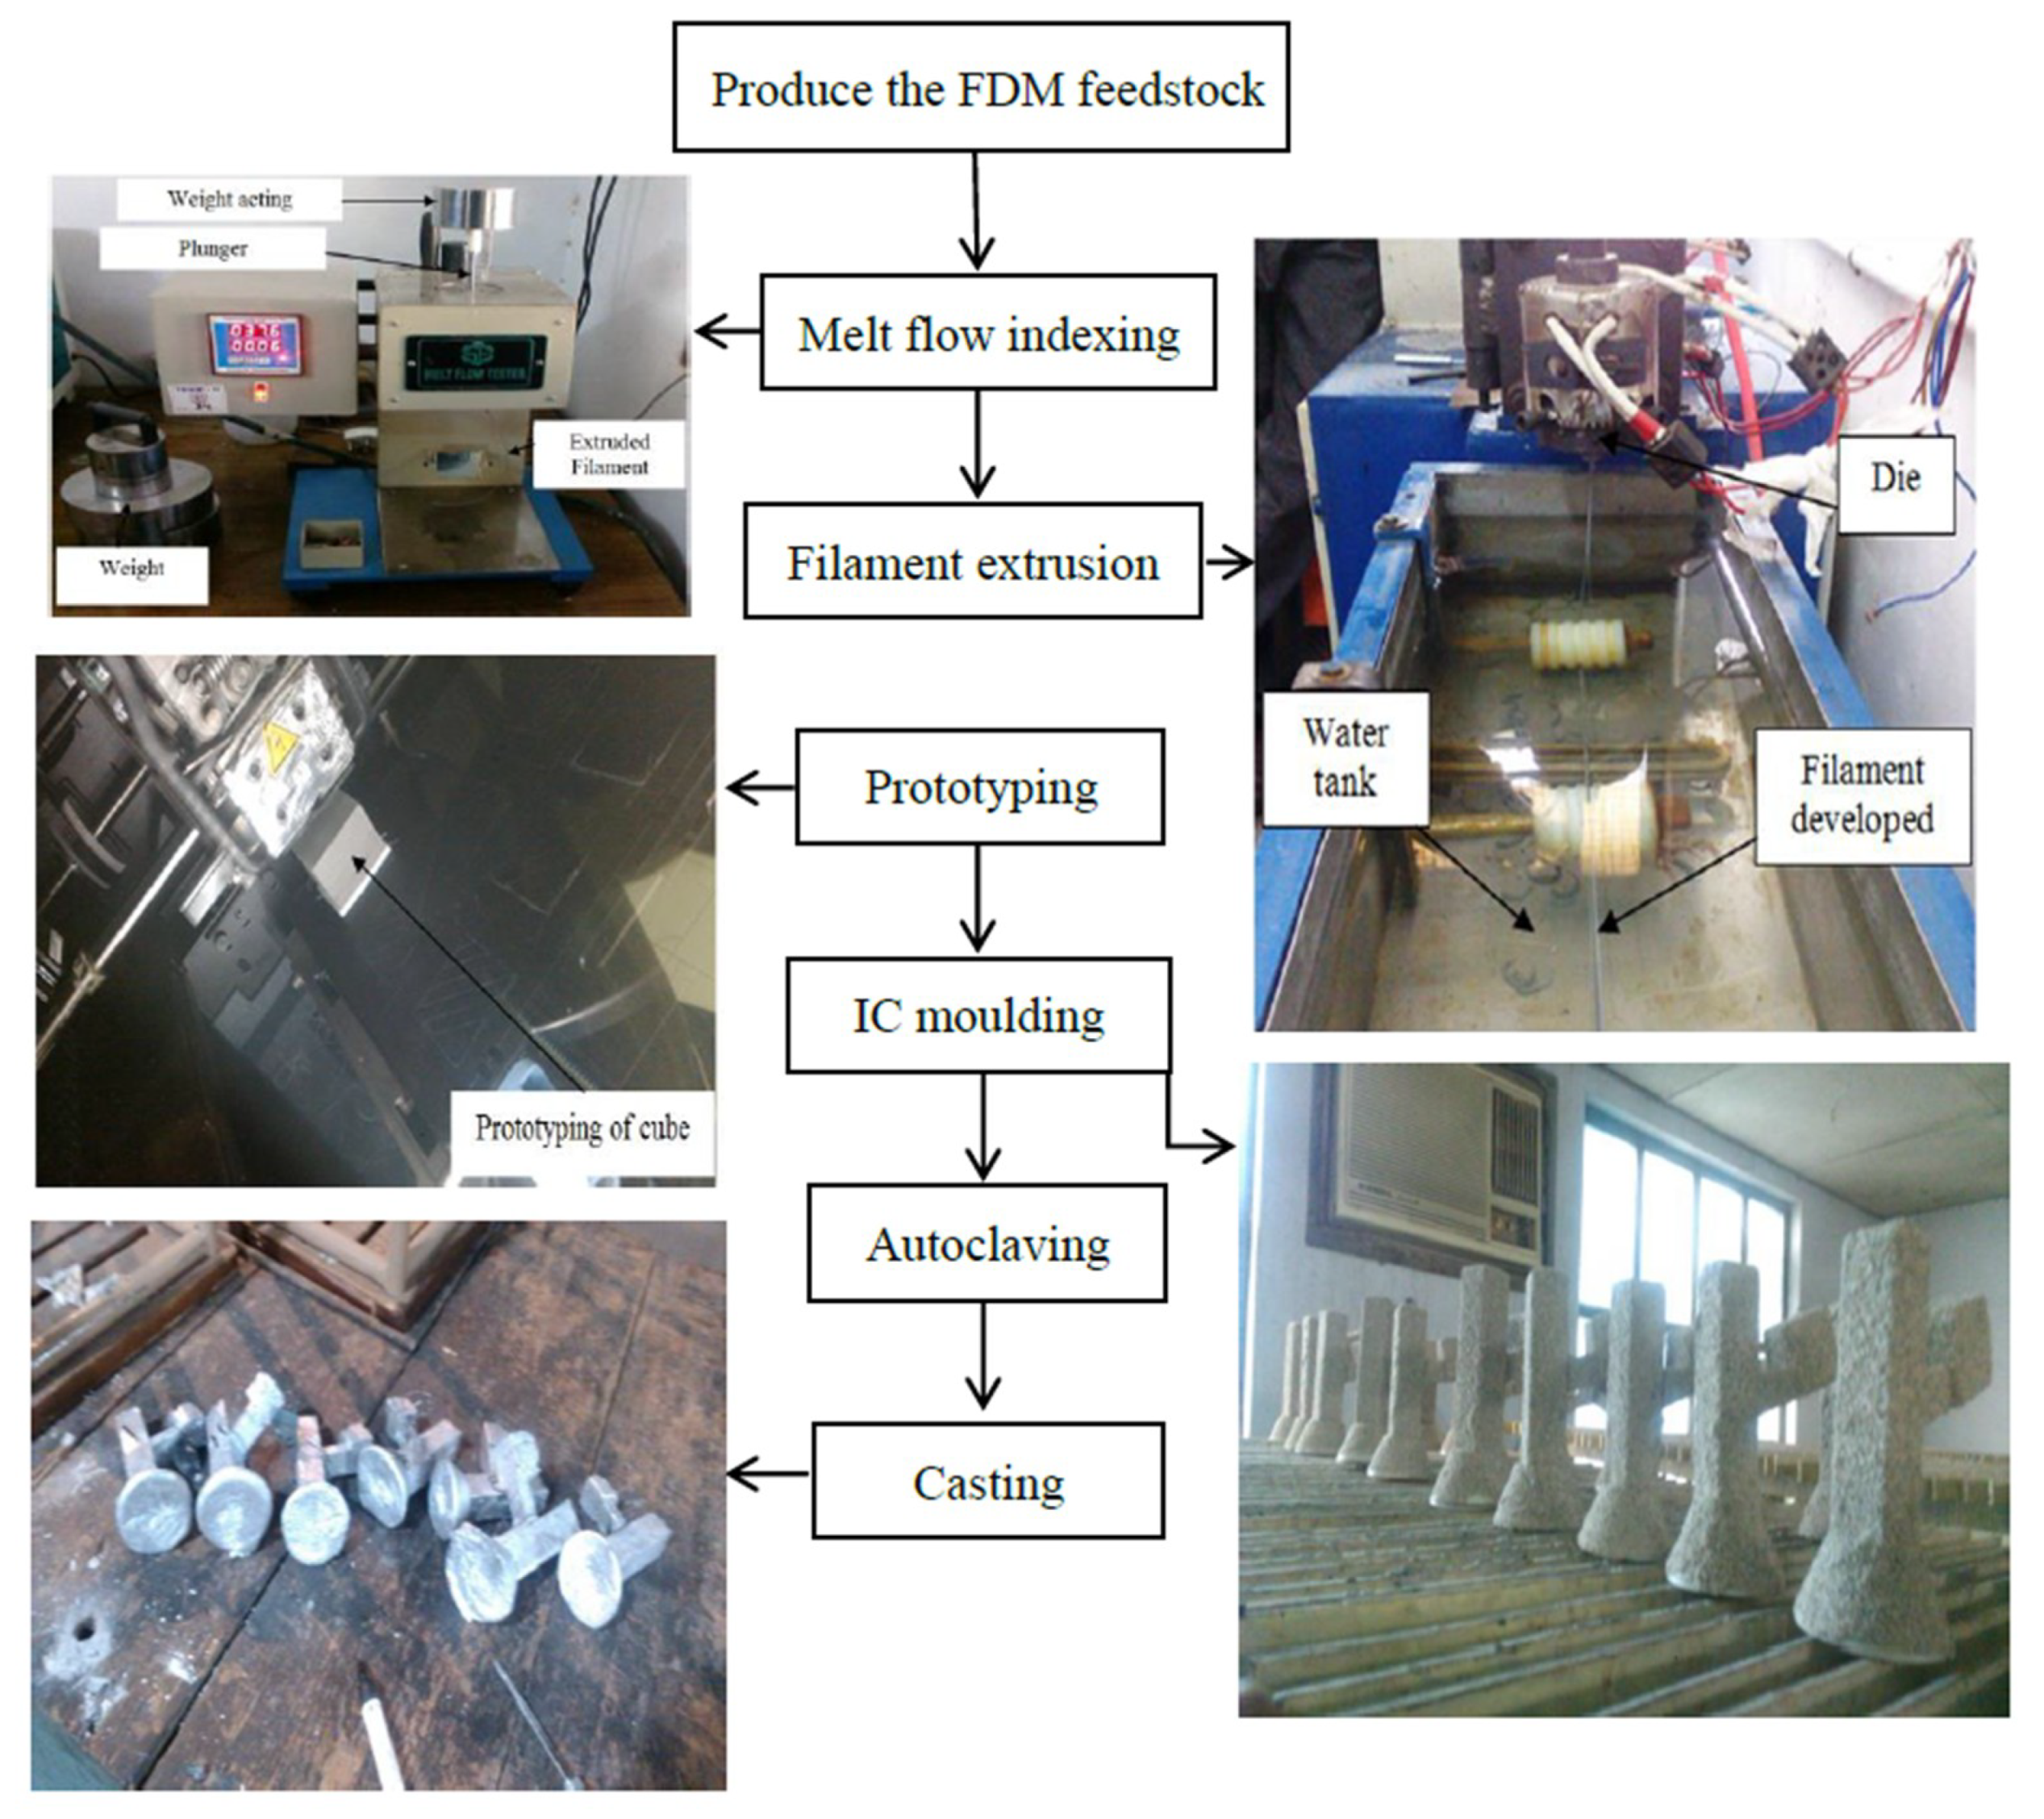
- The alternative feedstock filaments (FP) have been prepared using PA, Al2O3, and Al in different %wt. proportions with the help of single screw extrusion process.
- The formed filaments were used for the development of sacrificial patterns of cubical shape with three different volumes (VP), such as 17,576 mm3, 27,000 mm3, and 39,304 mm3. They were produced at low, high, and solid density of FDM process (DP) by using uPrint-SE system of Stratasys Inc. (Edina, MN, USA). In the works, reported previously, it has been seen that the change in the in-fill density affects the mechanical and tribological performances of the developed AMCs [1,2,3]. The prime reason behind the selection of FDM technology is due to its affordability and suitability for hybridization within the IC process [23,24,41]. Further, the selection of the process parametric levels from previous studies has been judicially selected, based on the pilot studies.
- Prior to shell moulding, the barrel finishing (BF) process was performed on the samples, for the refurbishment of resulted surface finish [31]. Here, barrel finishing time (BFT) and barrel finishing media weight (BFW) have been selected as input process parameters.
- Then, the IC moulds were prepared by coating the trees (consisting of riser, pouring basin, gating, and also the FDM printed sacrificial pattern) with refractory layers of silica. The number of IC slurry layers (NSL) has also varied in accordance to Table A1 in the Appendix A.
- Autoclaving and baking were performed in one step at 1150 °C (by maintaining the pouring sprue in a vertical up position so that the Al2O3 filler particles could be arrested within the cavity only). At this range of temperature, the matrix of the sacrificial patterns evaporates, immediately, without causing mould cracks.
- Finally, pouring of molten Al-6063 has been carried out.
3. Dimensionless modelling: Buckingham Pi Approach
- First of all, the units of the input and the output process parameters have been unified and converted into physical quantities (such as M, L, and T). Further, it is of utmost importance to highlight that any kind of categorical parameter, either input or output, is not suitable for the modelling. Moreover, upon such conversions, it should be considered that the replacement could be represented in-terms of M, L, and T formats. Therefore, in present work, the original Table A1 in the Appendix A has been modified in order to balance the units, as well as to convert the qualitative parameters into quantitative. For instance, the parameter “filament proportion” has been quantified in-terms of its tensile strength; density of the FDM pattern has been considered in terms of mass and volume; mould wall thickness has been converted from a number of layers to thickness of the wall, etc. Table 1 is the final prepared modified version of Table A1.The obtained dimensions of input and output parameters would be:Hardness (H) as ML−1T−2,Dimensional accuracy as L,Surface roughness as L,Filament proportion (P) in-terms of tensile strength of filament as MLT−2,Volume of FDM reinforced pattern (V) as L3,Density of FDM pattern (ρ) as ML−3,BF cycle time (t) as T,BF media weight (W) as M and the Number of IC slurry layers (l) resulting into mould wall thickness as L.
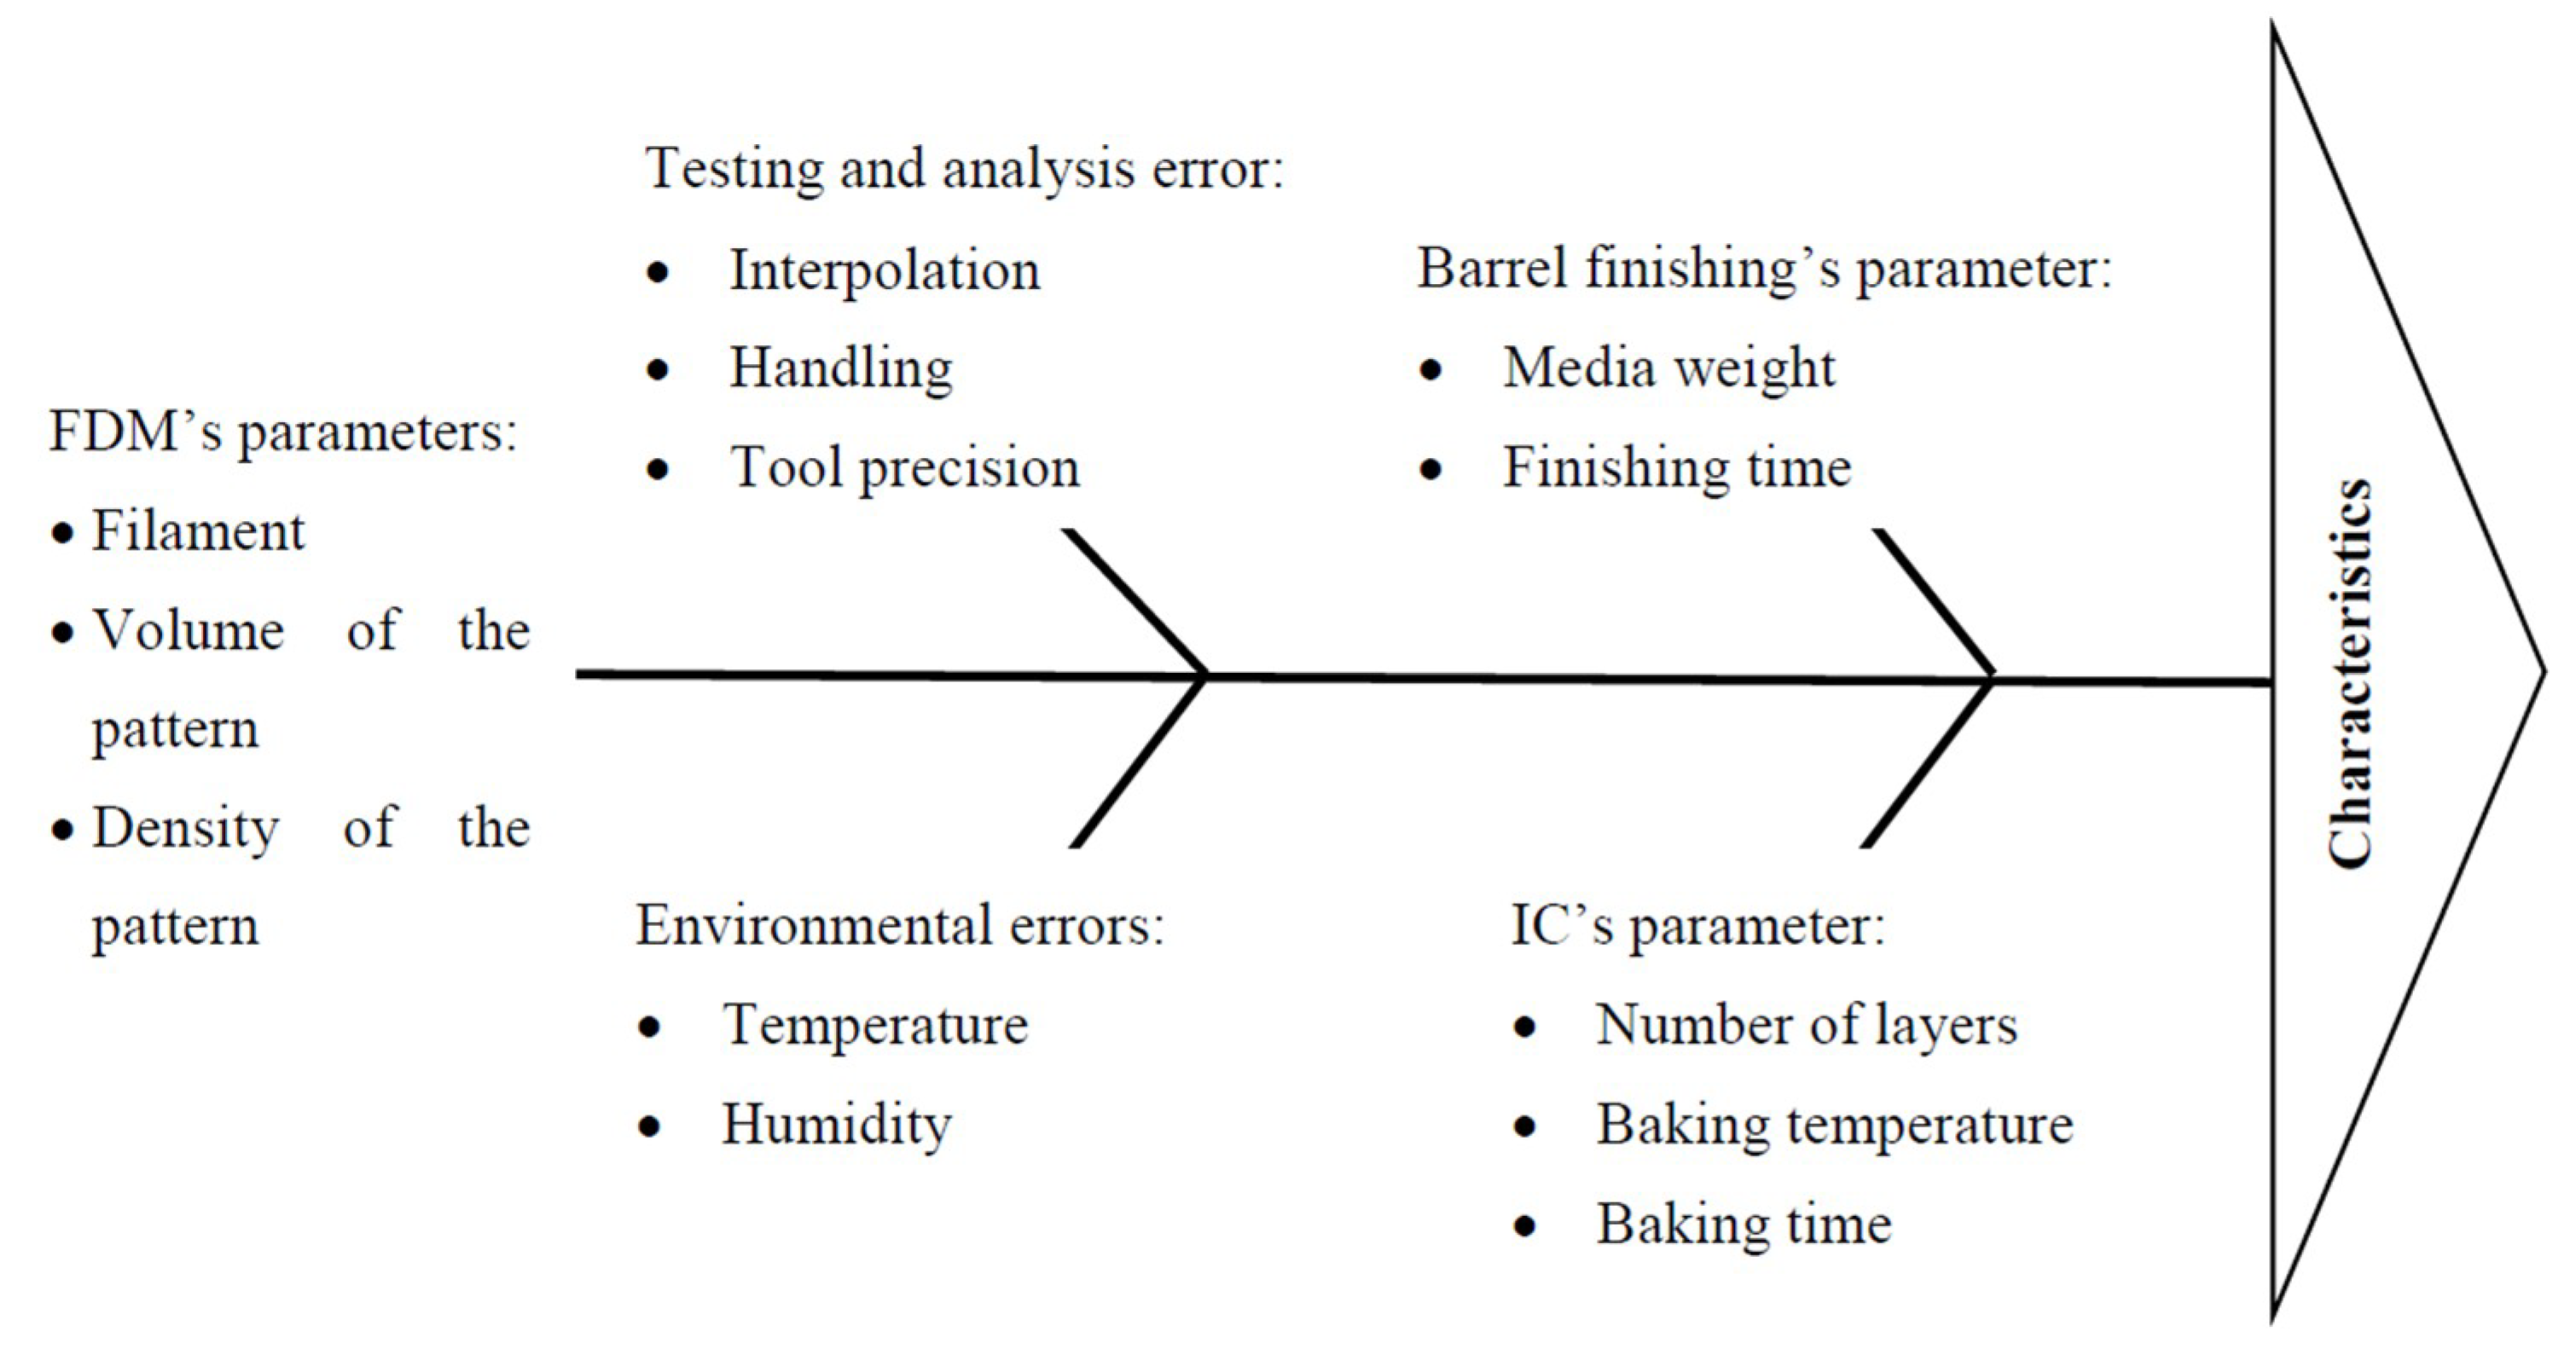
- Then, it is mandatory to find out the significance level of the input process parameters for the measured outcomes. In the present case, ANOVA has been implemented with the help of MINITAB-17 based statistical software in order to identify the significance and contribution of input parameters. Table 2 shows the contribution percentage of input process parameters for surface hardness, dimensional accuracy, and surface roughness.
- Before starting to formulate the π equations (let us say ‘x’), it is necessary to identify the ‘x − 1’ top performing input parameters. For instance, in the case of surface hardness, when ‘x’ is equal to 4 that allows to develop 4 π-equations, three top performing input parameters have to be identified.
- Now, the top performing input parameters and the output parameters being analyzed represent the π equations.
- After calculating the π equations, the π1 (related to the output parameter) is solved as a function of other πs (π2, π3, and π4, consisted of input parameters).
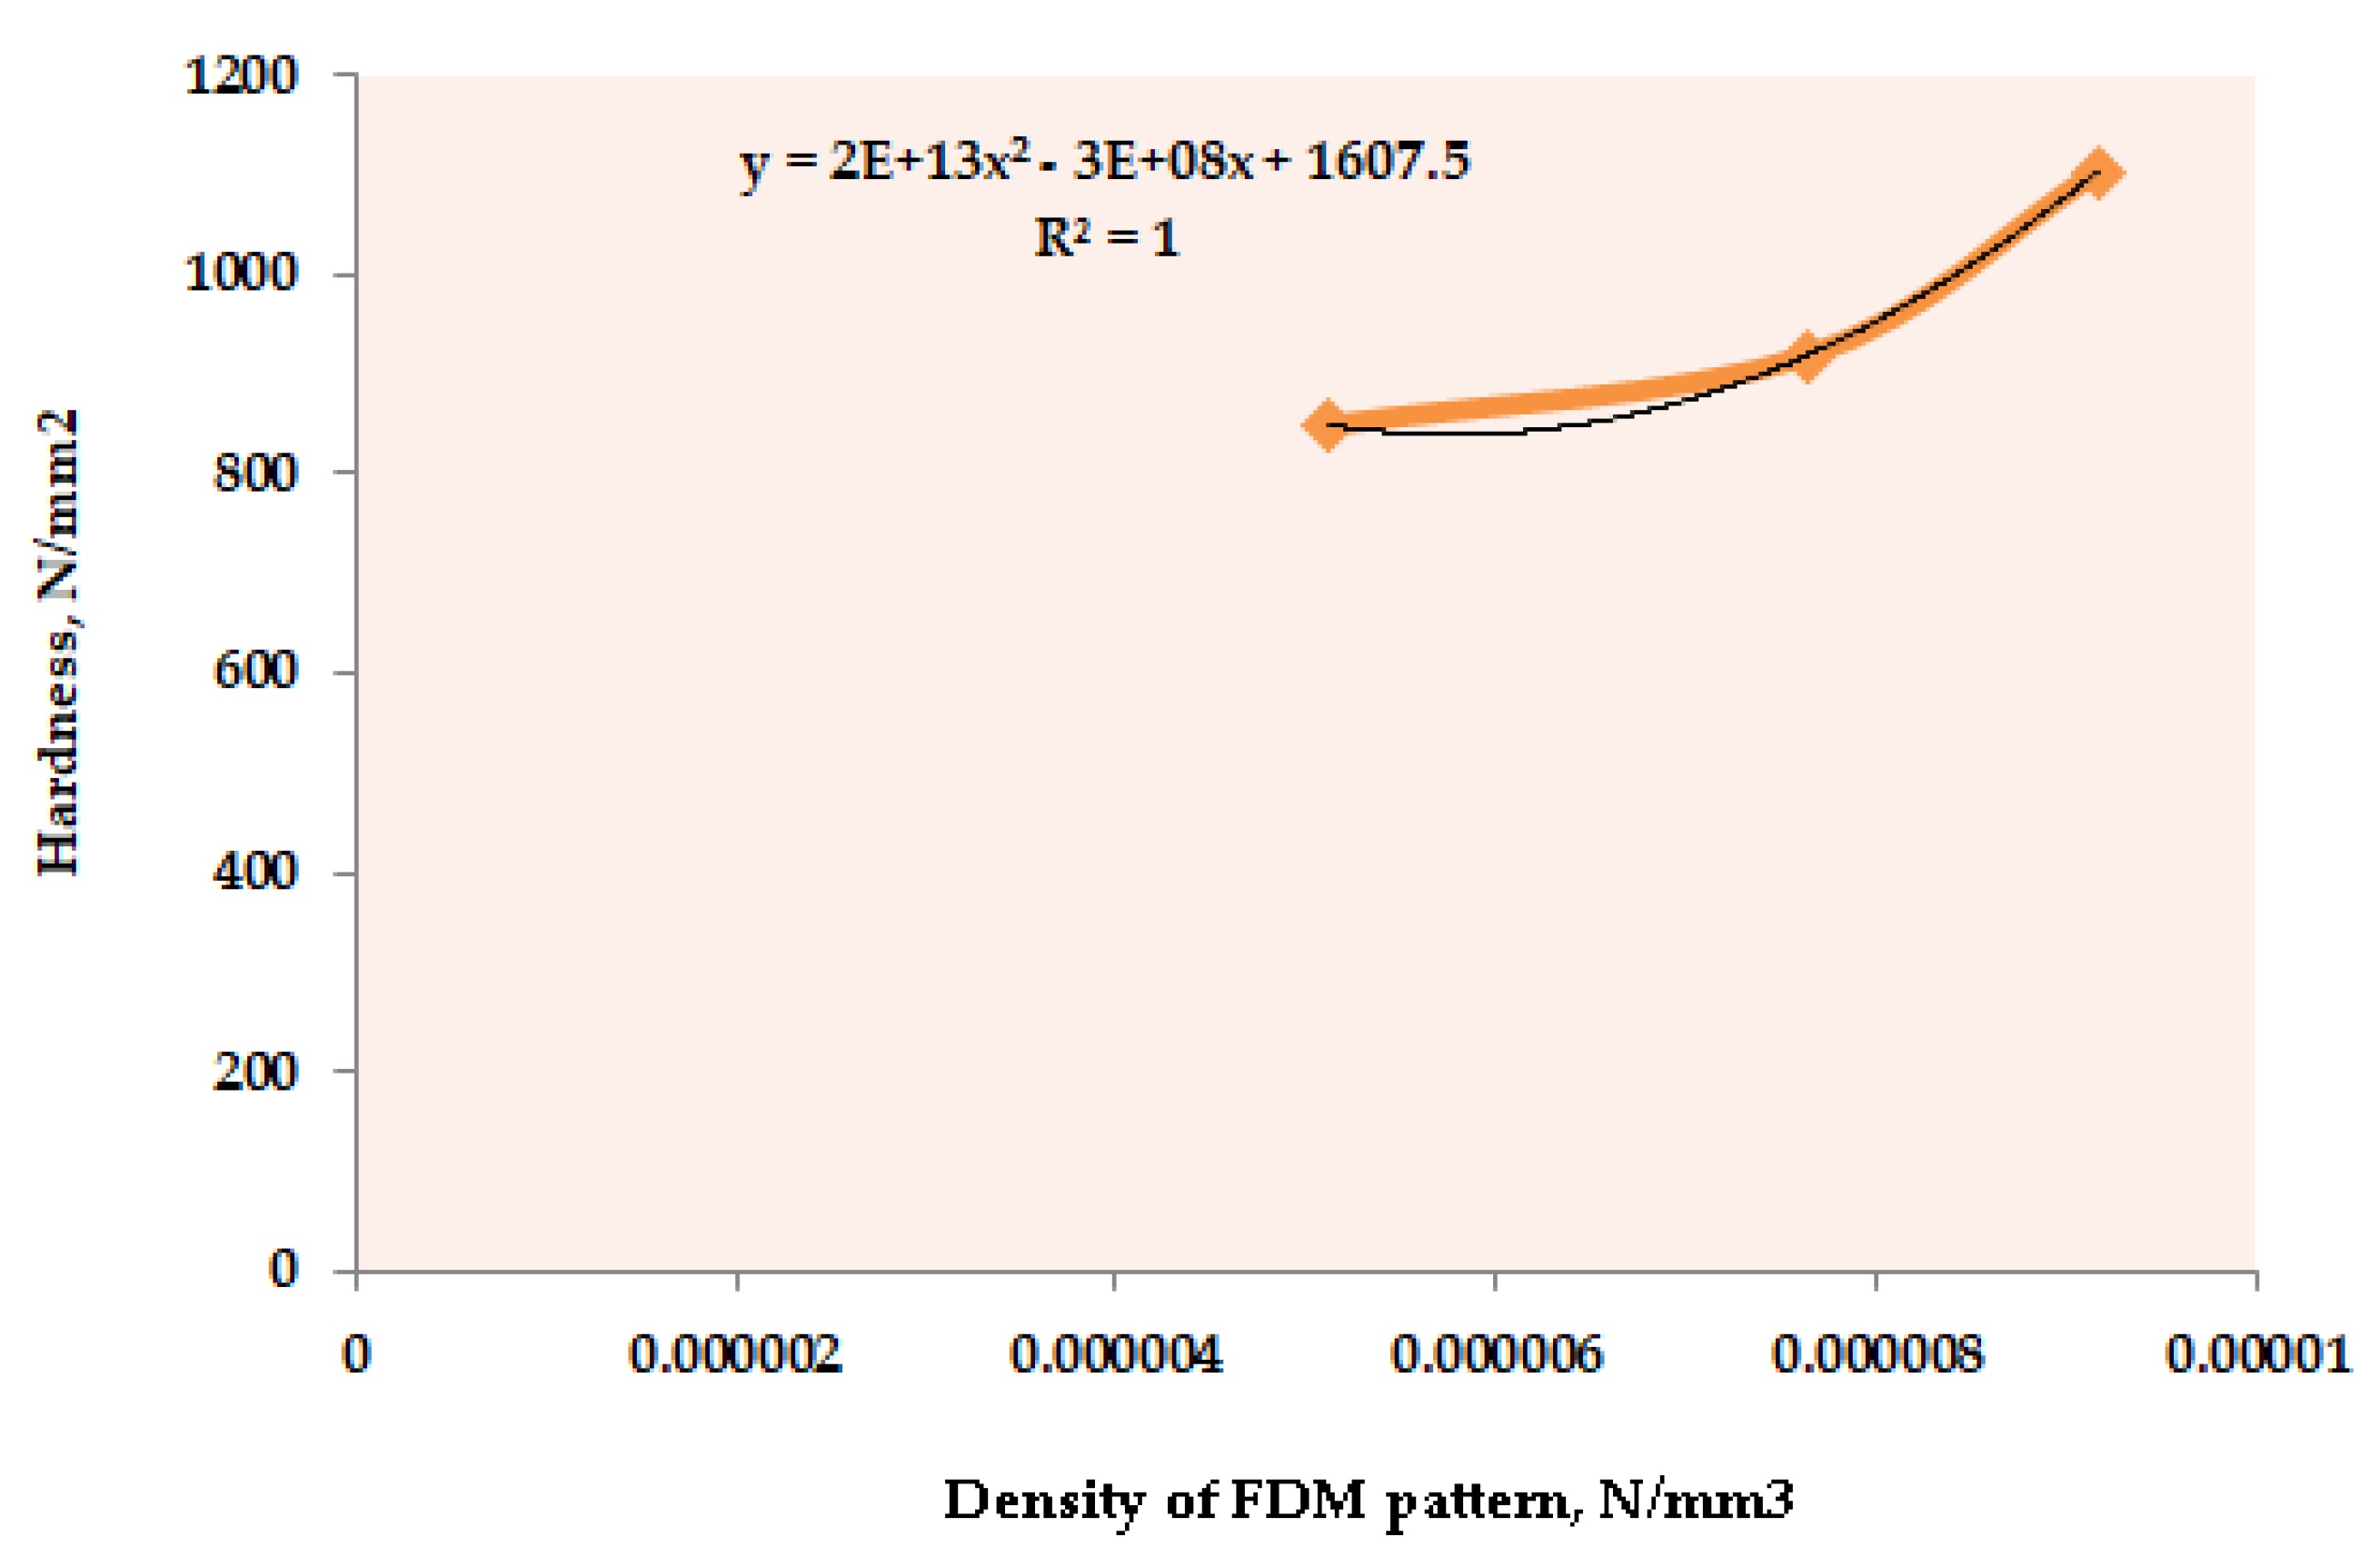
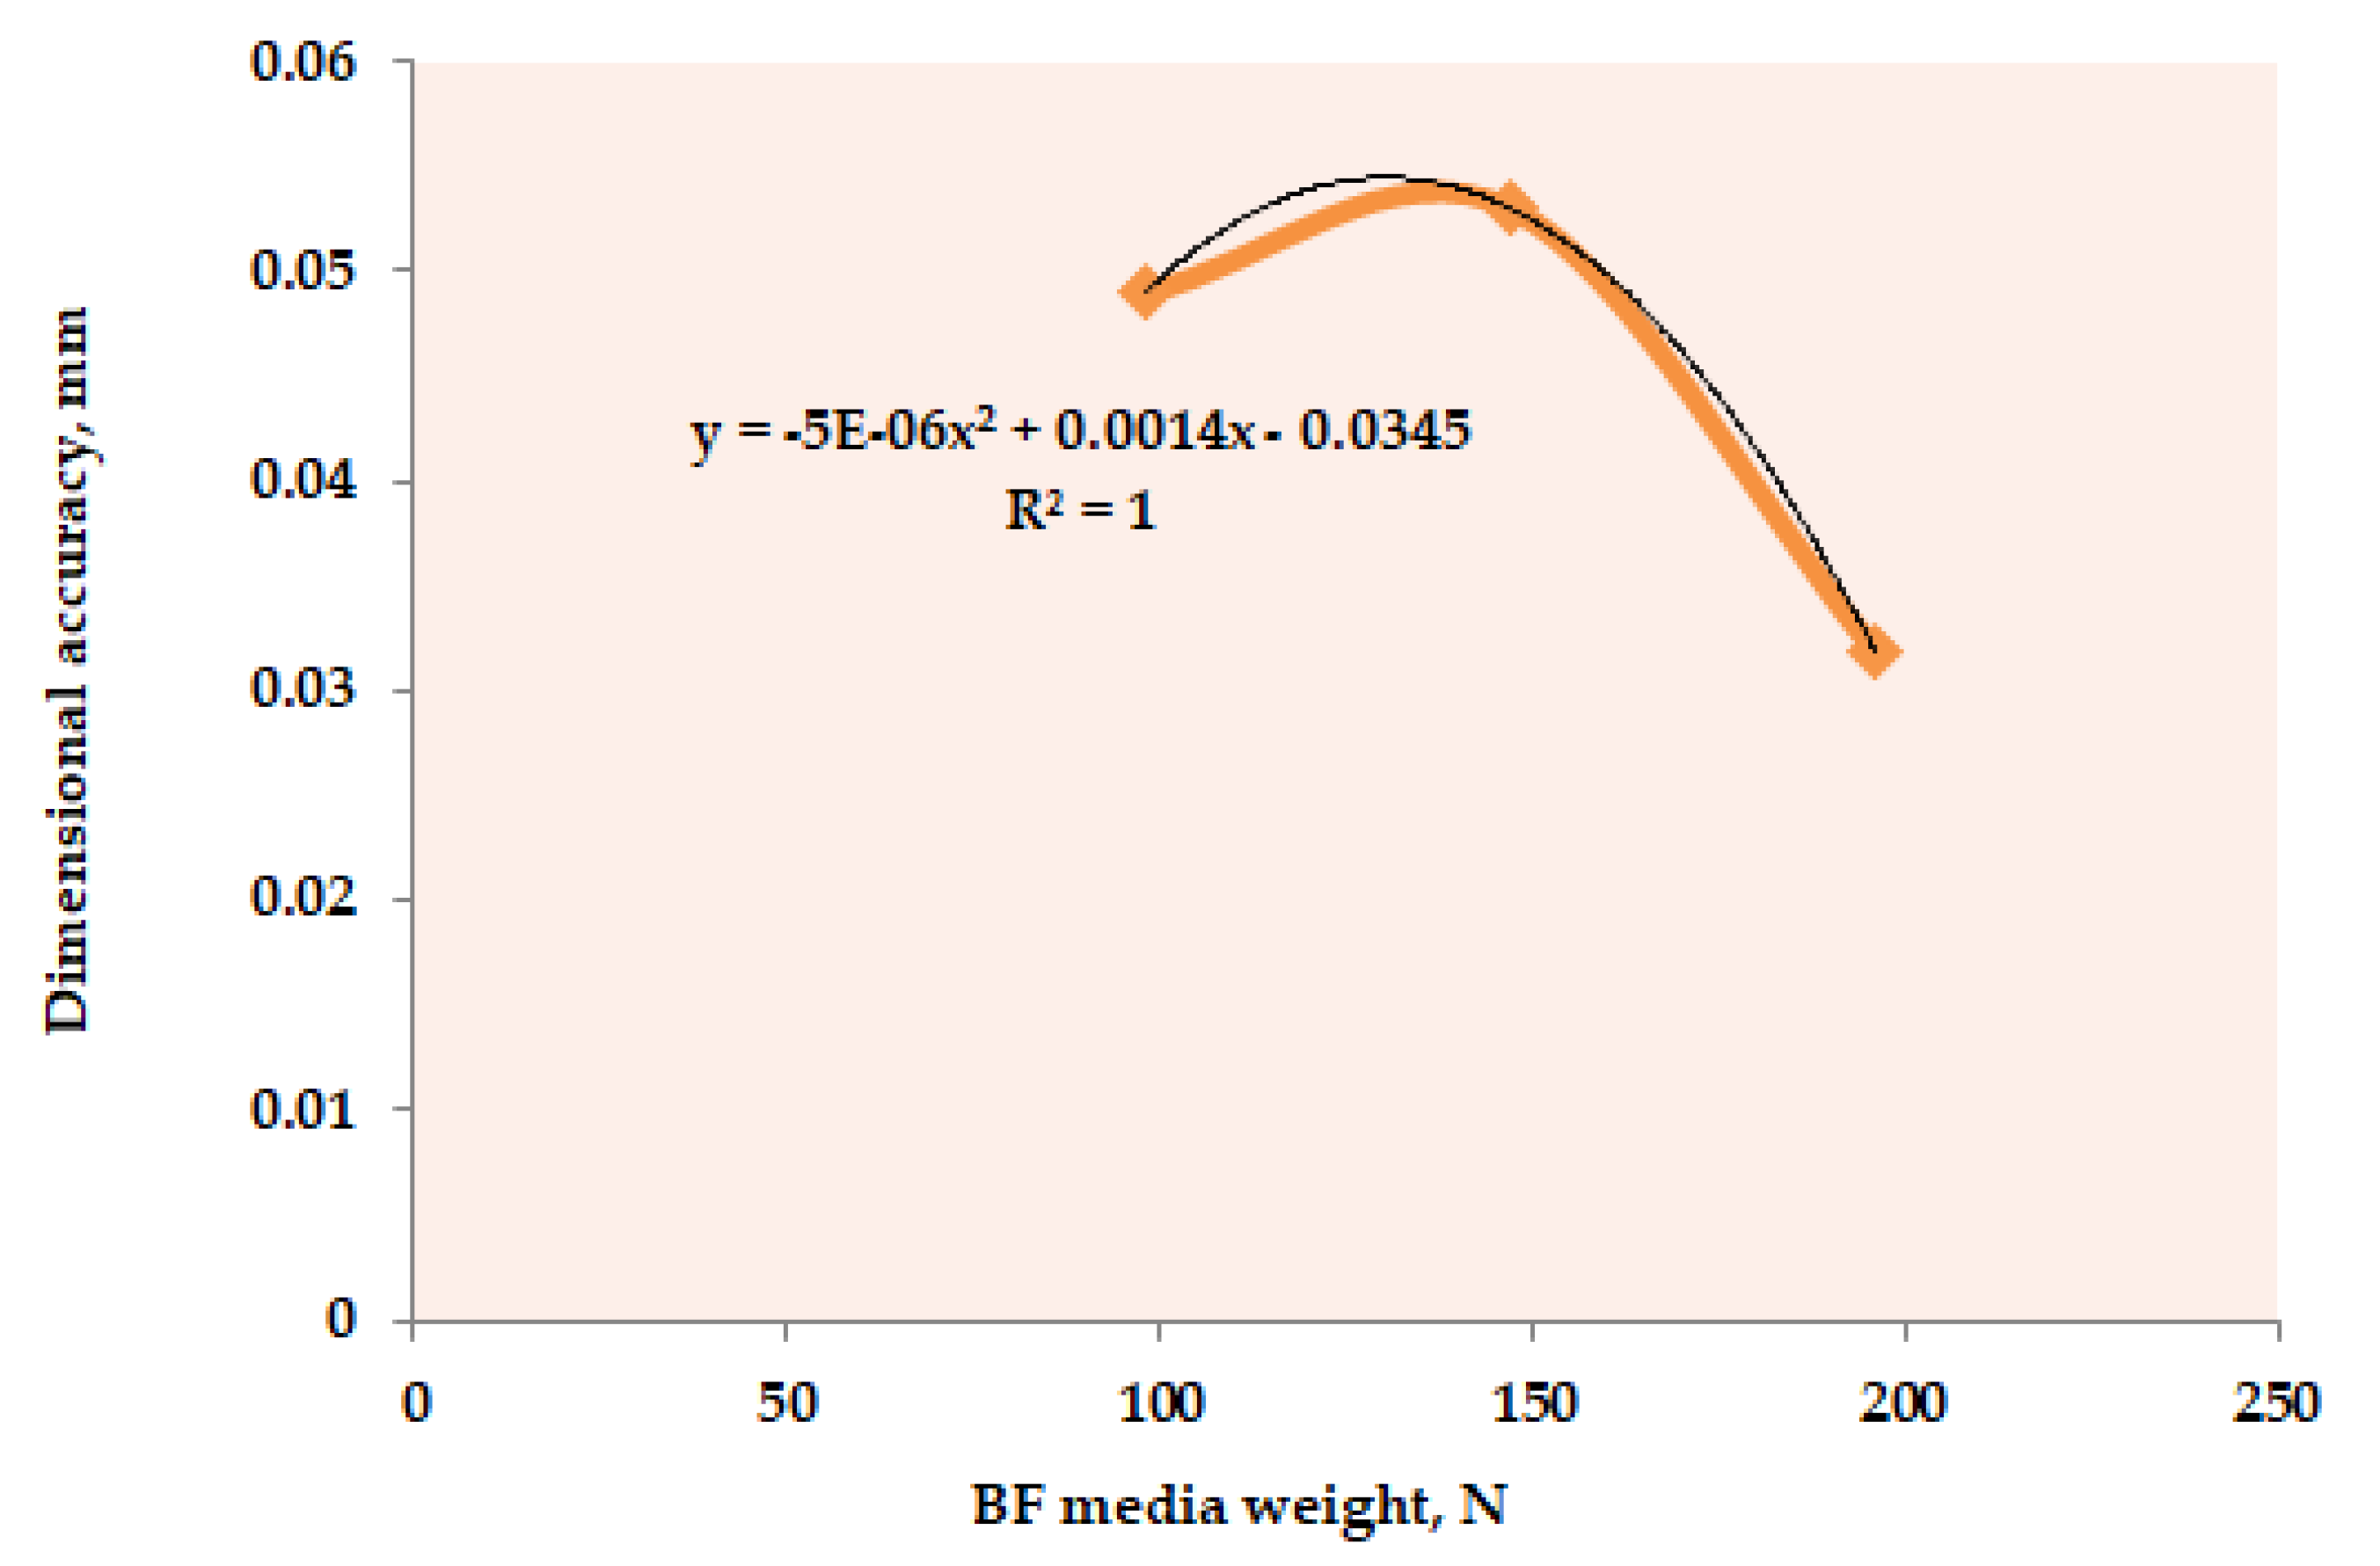
- Once the step-v is completed, a constant ‘K’ has been considered whose value has been driven from a second order quadratic equation of the fitness curve that connect the output response and the most contributing input parameter.
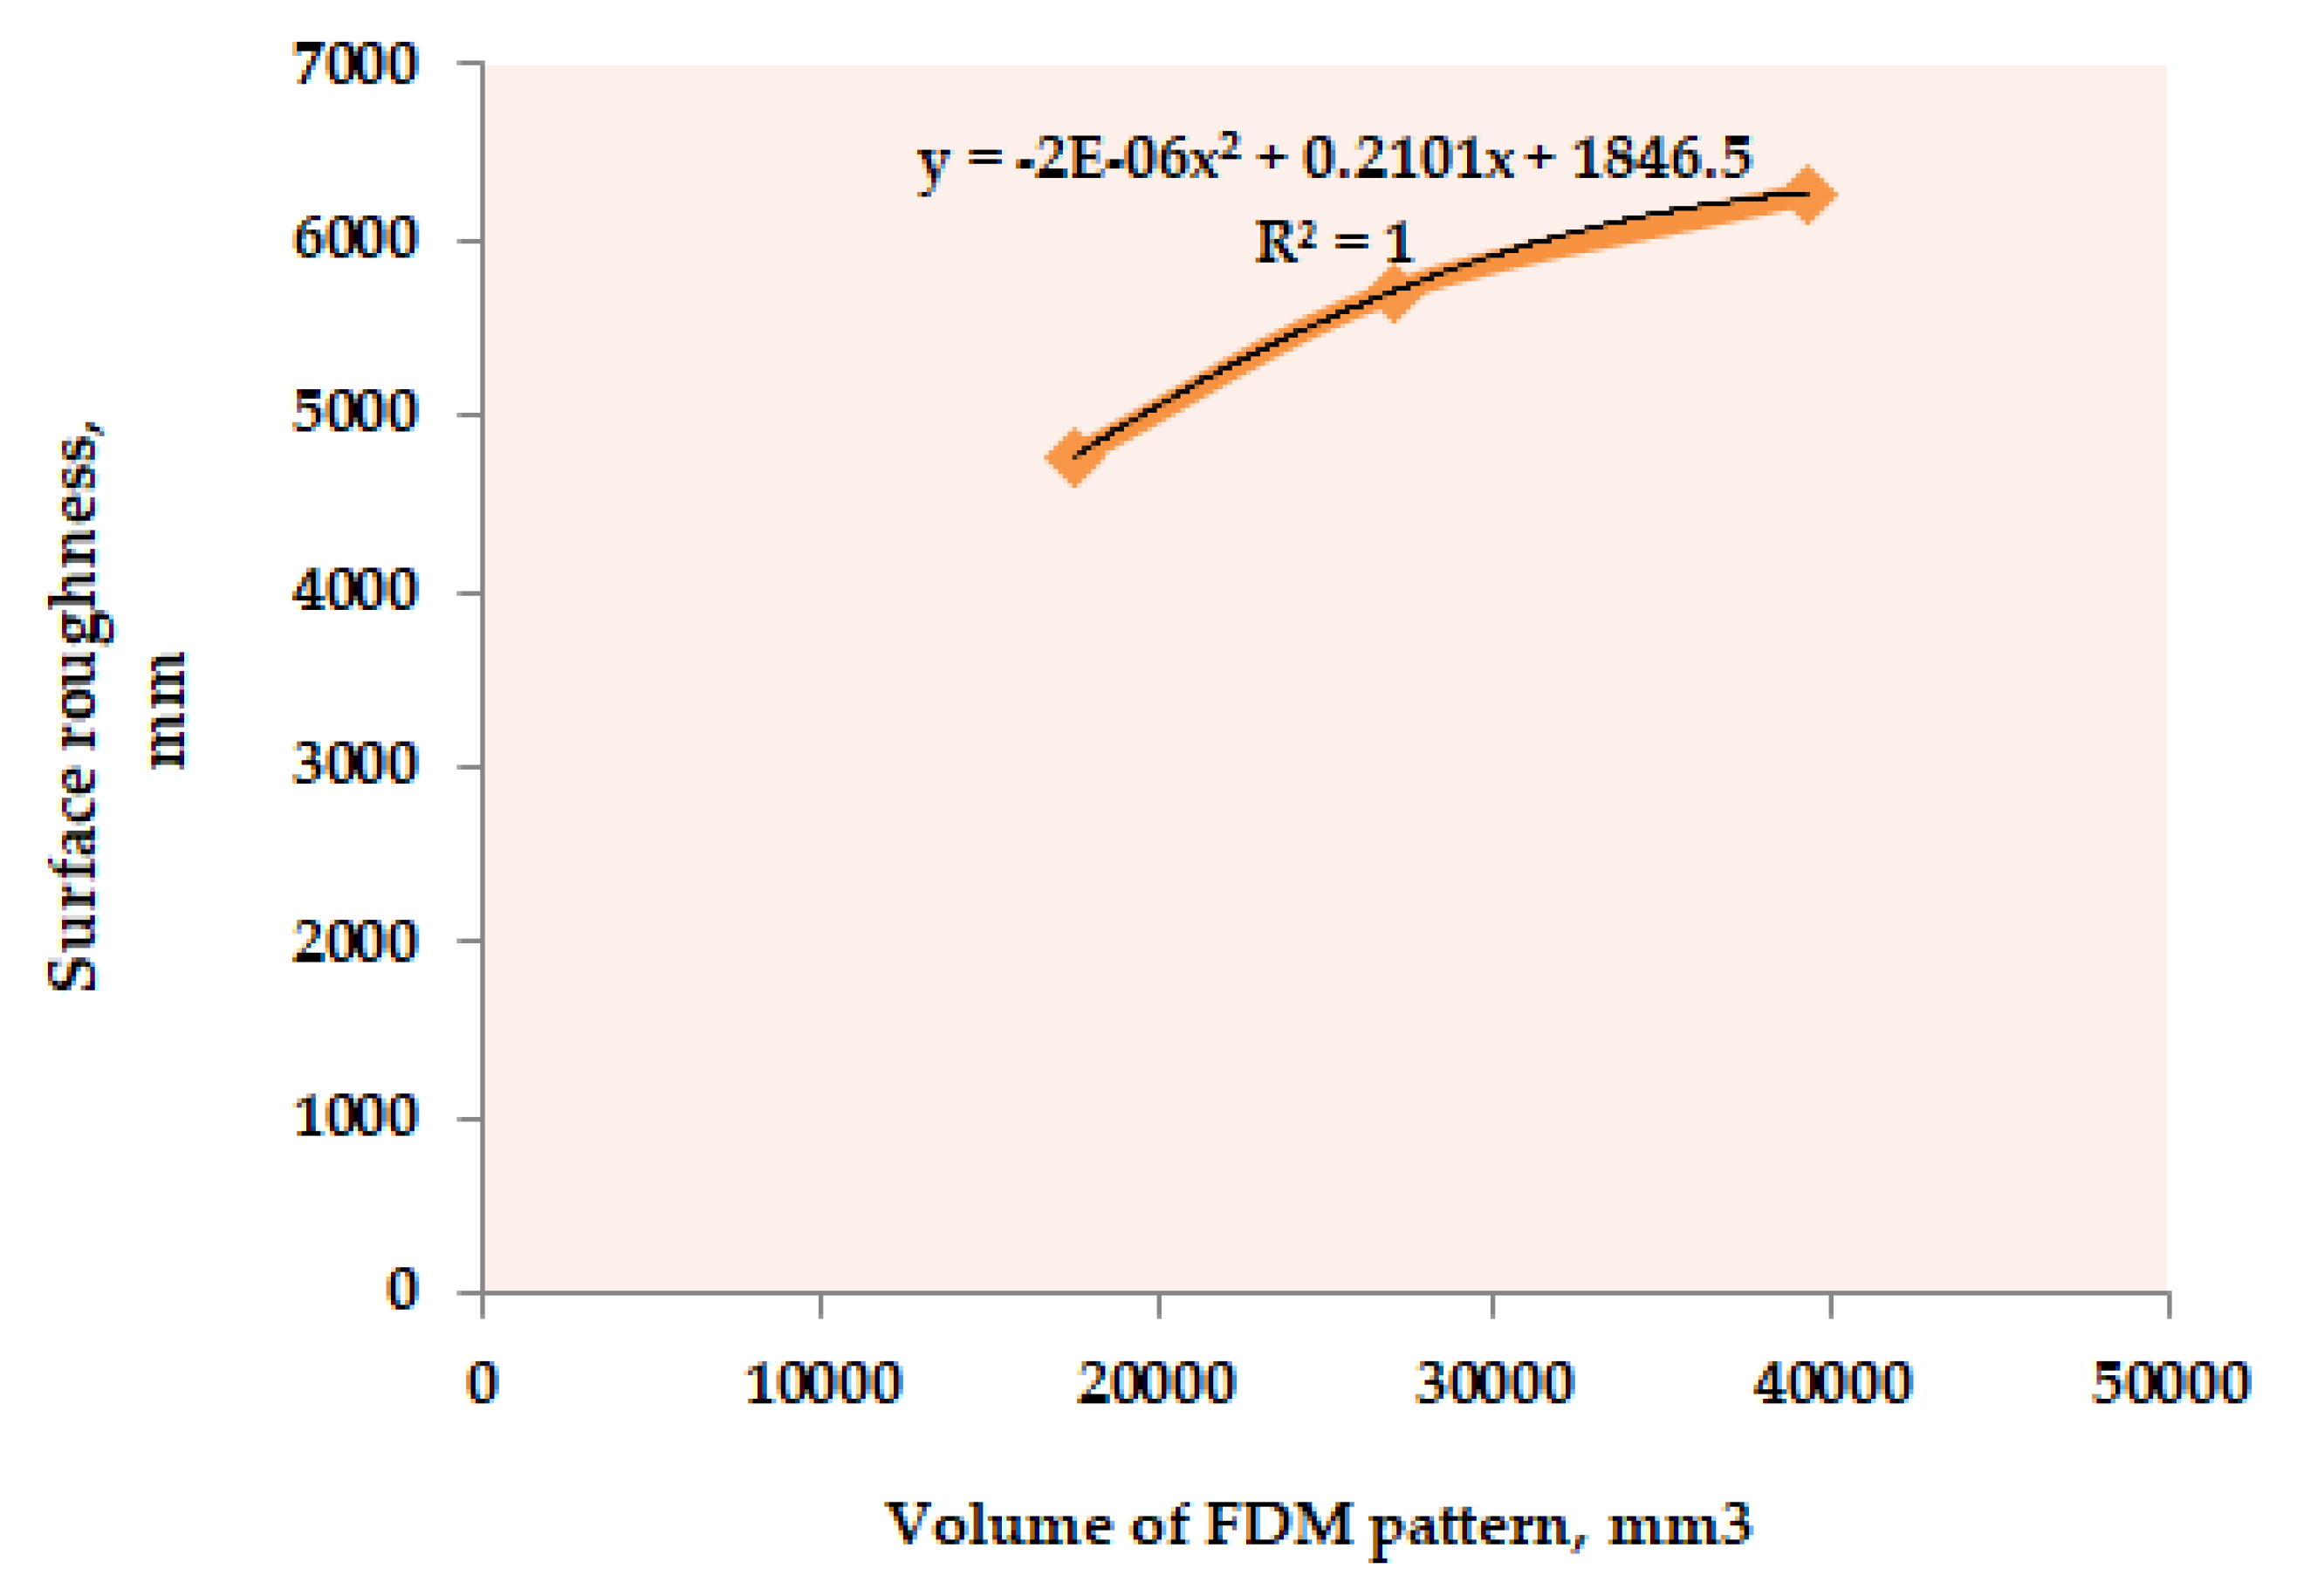
- Further, the fitness curve should be plotted between the measured output values and the corresponding values of the most significant input parameter, while keeping the rest of the parameters constant. Alternatively, in the present case, the plots have been drawn between the three levels of the input process parameters and the average of the corresponding output result. For instance, in case of Figure 4, the average of hardness for experiment #1, #4, #7, #10, #13, and #16 has been plotted against first level of FD (5.12 × 10⁻⁶ N/mm3) and the average of hardness for experiment #2, #5, #8, #11, #14, and #17 has been plotted against second level of FD (7.63 × 10⁻⁶ N/mm3). Similar procedure has been adopted for the third level of the FD.
- Noticeably, the regression (R2) ~ 1 indicates the best fitness of the data.
3.1. Hardness
3.2. Dimensional Accuracy
3.3. Surface Roughness
4. Conclusions
Author Contributions
Funding
Conflicts of Interest
Appendix A

| Exp. No. | FP | VP (mm3) | DP | BFT | BFW | NSL | Ra (µm) | S/N ratio (dB) | Δd (mm) | S/N ratio (dB) | HV | S/N ratio (dB) |
|---|---|---|---|---|---|---|---|---|---|---|---|---|
| 1 | C1 | 26 × 26 × 26 | Low density | 20 | 10 | 7 | 4.762 | −13.55 | 0.026 | 31.34 | 89.5 | 39.01 |
| 2 | C1 | 26 × 26 × 26 | High density | 40 | 15 | 8 | 5.151 | −14.27 | 0.03 | 29.45 | 91.8 | 39.18 |
| 3 | C1 | 26 × 26 × 26 | Solid | 60 | 20 | 9 | 4.778 | −13.58 | 0.02 | 33.30 | 115 | 41.18 |
| 4 | C1 | 30 × 30 × 30 | Low density | 20 | 15 | 8 | 4.371 | −12.82 | 0.06 | 23.37 | 80.3 | 38.06 |
| 5 | C1 | 30 × 30 × 30 | High density | 40 | 20 | 9 | 5.582 | −14.93 | 0.063 | 23.80 | 86.5 | 38.72 |
| 6 | C1 | 30 × 30 × 30 | Solid | 60 | 10 | 7 | 6.094 | −15.69 | 0.053 | 25.32 | 115 | 41.22 |
| 7 | C1 | 34 × 34 × 34 | Low density | 40 | 10 | 9 | 5.368 | −14.59 | 0.043 | 27.06 | 77.1 | 37.73 |
| 8 | C1 | 34 × 34 × 34 | High density | 60 | 15 | 7 | 5.658 | −15.05 | 0.08 | 21.89 | 91.9 | 39.25 |
| 9 | C1 | 34 × 34 × 34 | Solid | 20 | 20 | 8 | 6.404 | −16.13 | 0.016 | 35.22 | 100.4 | 39.92 |
| 10 | C2 | 26 × 26 × 26 | Low density | 60 | 20 | 8 | 4.709 | −13.45 | 0.016 | 35.22 | 93.4 | 39.38 |
| 11 | C2 | 26 × 26 × 26 | High density | 20 | 10 | 9 | 4.573 | −13.20 | 0.076 | 22.29 | 95.9 | 39.62 |
| 12 | C2 | 26 × 26 × 26 | Solid | 40 | 15 | 7 | 4.658 | −13.36 | 0.056 | 24.72 | 134.3 | 42.60 |
| 13 | C2 | 30 × 30 × 30 | Low density | 40 | 20 | 7 | 5.297 | −14.48 | 0.033 | 29.45 | 95.3 | 39.56 |
| 14 | C2 | 30 × 30 × 30 | High density | 60 | 10 | 8 | 5.889 | −15.40 | 0.050 | 25.90 | 93.8 | 39.41 |
| 15 | C2 | 30 × 30 × 30 | Solid | 20 | 15 | 9 | 6.845 | −16.70 | 0.060 | 24.35 | 104.5 | 40.37 |
| 16 | C2 | 34 × 34 × 34 | Low density | 60 | 15 | 9 | 8.564 | −18.65 | 0.033 | 29.20 | 84.1 | 38.29 |
| 17 | C2 | 34 × 34 × 34 | High density | 20 | 20 | 7 | 5.721 | −15.15 | 0.043 | 27.06 | 102.4 | 40.20 |
| 18 | C2 | 34 × 34 × 34 | Solid | 40 | 10 | 8 | 5.894 | −15.40 | 0.046 | 26.44 | 106.2 | 40.48 |
References
- Singh, S.; Singh, R. Investigations for dimensional accuracy of AMC prepared by using Nylon6-Al-Al2O3 reinforced FDM filament in investment casting. Rapid Prototyp. J. 2016, 22, 445–455. [Google Scholar] [CrossRef]
- Singh, S.; Singh, R. Effect of process parameters on micro hardness of Al–Al2O3 composite prepared using an alternative reinforced pattern in fused deposition modelling assisted investment casting. Robot. Comput. Integr. Manuf. 2016, 37, 162–169. [Google Scholar] [CrossRef]
- Singh, S.; Singh, R. Some investigations on surface roughness of aluminium metal composite primed by fused deposition modeling-assisted investment casting using reinforced filament. J. Braz. Soc. Mech. Sci. Eng. 2017, 39, 471–479. [Google Scholar] [CrossRef]
- Koli, D.K.; Agnihotri, G.; Purohit, R. Advanced aluminium matrix composites: The critical need of automotive and aerospace engineering fields. Mater. Today: Proc. 2015, 2, 3032–3041. [Google Scholar] [CrossRef]
- Iwai, Y.; Honda, T.; Miyajima, T.; Iwasaki, Y.; Surappa, M.K.; Xu, J.F. Dry sliding wear behavior of Al2O3 fibre reinforced aluminum composites. Compos. Sci. Technol. 2002, 60, 1781–1789. [Google Scholar] [CrossRef]
- Barekar, N.; Tzamtzis, S.; Dhindaw, B.K.; Patel, J.; Babu, N.H.; Fan, Z. Processing of aluminum-graphite particulate metal matrix composites by advanced shear technology. J. Mater. Eng. Perform. 2009, 18, 1230–1240. [Google Scholar] [CrossRef]
- Kathiresan, M.; Sornakumar, T. Friction and wear studies of die cast aluminum alloy-aluminum oxide-reinforced composites. Ind. Lubr. Tribol. 2010, 62, 361–371. [Google Scholar] [CrossRef]
- Miyajima, T.; Iwai, Y. Effects of reinforcement on sliding wear behavior of aluminium matrix composite. Wear 2003, 255, 606–616. [Google Scholar] [CrossRef]
- Prasad, S.V.; Asthana, R. Aluminum metal-matrix composites for automotive applications: Tribological considerations. Tribol. Lett. 2004, 17, 445–453. [Google Scholar] [CrossRef]
- Surappa, M.K. Aluminium matrix composites challenges and opportunities. Sadhana 2003, 28, 319–325. [Google Scholar] [CrossRef]
- Mohan, S.; Srivastava, S. Surface behaviour of as Cast Al-Fe intermetallic composites. Tribol. Lett. 2006, 22, 45–51. [Google Scholar] [CrossRef]
- Sajjadi, S.A.; Ezatpour, H.R.; Parizi, M.T. Comparison of microstructure and mechanical properties of A356 aluminum alloy/Al2O3 composites fabricated by stir and compo-casting processes. Mater. Des. 2012, 34, 106–111. [Google Scholar] [CrossRef]
- Ralph, B.; Yuen, H.C.; Lee, W.B. The processing of metal matrix composites—An overview. J. Mater. Process. Technol. 1997, 63, 339–353. [Google Scholar] [CrossRef]
- Kurşun, A.; Bayraktar, E.; Robert, M.H. Low cost manufacturing of aluminium-alumina composites. Adv. Mater. Process. Technol. 2015, 1, 515–528. [Google Scholar] [CrossRef]
- Woo, K.D.; Huo, H.W. Effect of high energy ball milling on displacement reaction and sintering of Al−Mg/SiO2 composite powders. Met. Mater. Int. 2006, 12, 45. [Google Scholar] [CrossRef]
- Tjong, S.C.; Ma, Z.Y. Microstructural and mechanical characteristics of in situ metal matrix composites. Mater. Sci. Eng. R Rep. 2000, 29, 49–113. [Google Scholar] [CrossRef]
- Maleki, A.; Niroumand, B.; Meratian, M. Effects of processing temperature on in-situ reinforcement formation in Al (Zn)/Al2O3 (ZnO) nanocomposite. Metall. Mater. Eng. 2015, 21, 283–291. [Google Scholar] [CrossRef]
- Afkham, Y.; Khosroshahi, R.A.; Rahimpour, S.; Aavani, C.; Brabazon, D.; Mousavian, R.T. Enhanced mechanical properties of in situ aluminium matrix composites reinforced by alumina nanoparticles. Arch. Civ. Mech. Eng. 2018, 18, 215–226. [Google Scholar] [CrossRef] [Green Version]
- Harrigan, W.C. Commercial processing of metal matrix composites. Mater. Sci. Eng. A 1998, 244, 75–79. [Google Scholar] [CrossRef]
- Degischer, H.P. Innovative light metals: Metal matrix composites and foamed aluminium. Mater. Des. 1997, 18, 221–226. [Google Scholar] [CrossRef]
- Neussl, E.; Sahm, P.R. Selectively reinforced component produced by the modified investment casting process. Compos. Part A 2001, 32, 1177–1183. [Google Scholar] [CrossRef]
- Mazahery, A.; Abdizadeh, H.; Baharvandi, R. Development of high-performance A356/nano-Al2O3 composites. Mater. Sci. Eng. A 2009, 518, 61–64. [Google Scholar] [CrossRef]
- Singh, S.; Singh, R. Fused deposition modelling based rapid patterns for investment casting applications: A review. Rapid Prototyp. J. 2016, 22, 123–143. [Google Scholar] [CrossRef]
- Kumar, P.; Ahuja, I.S.; Singh, R. Experimental investigations on hardness of the biomedical implants prepared by hybrid investment casting. J. Manuf. Process. 2016, 21, 160–171. [Google Scholar] [CrossRef]
- Kisasoz, A.; Guler, K.A.; Karaaslan, A. Infiltration of A6063 aluminium alloy into SiC−B4C hybrid preforms using vacuum assisted block mould investment casting technique. Trans. Nonferrous Met. Soc. China 2012, 22, 563–1567. [Google Scholar] [CrossRef]
- Reddy, C.; Zitoun, E. Tensile behavior of 6063/Al2O3 particulate metal matrix composites fabricated by investment casting process. Int. J. Appl. Eng. Res. 2010, 1, 542–552. [Google Scholar]
- Rooks, B. Rapid tooling for casting prototypes. Assem. Autom. 2012, 22, 40–45. [Google Scholar] [CrossRef]
- Kakde, K.U.; Tumane, A.S. Development of customized innovative product using fused deposition modeling technique of rapid prototyping and investment casting. In Proceedings of the National Conference on Innovative Paradigms in Engineering and Technology, Nagpur, Maharashtra, India, 28 January 2012; pp. 27–30. [Google Scholar]
- Singh, R.; Singh, S.; Mahajan, V. Investigations for dimensional accuracy of investment casting process after cycle time reduction by advancements in shell moulding. Procedia Mater. Sci. 2014, 6, 859–865. [Google Scholar] [CrossRef]
- Singh, R.; Singh, S.; Singh, G. Dimensional accuracy comparison of investment castings prepared with wax and abs patterns for bio-medical application. Procedia Mater. Sci. 2014, 6, 851–858. [Google Scholar] [CrossRef]
- Boschetto, V.G.; Veniali, F. Modelling micro geometrical profiles in fused deposition process. Int. J. Adv. Manuf. Technol. 2012, 61, 945–956. [Google Scholar] [CrossRef]
- Blake, P.; Fodran, E.; Koch, M.; Menon, U.; Priedeman, B.; Sharp, S. FDM of ABS patterns for investment casting. In Proceedings of the 1997 International Solid Freeform Fabrication Symposium, Austin, TX, USA, 11–13 August 1997. [Google Scholar]
- Hafsa, M.N.; Ibrahim, M.; Wahab, M.; Zahid, M.S. Evaluation of FDM pattern with ABS and PLA material. In Applied Mechanics and Materials; Trans Tech Publications: Switzerland, Switzerland, 2014; Volume 465, pp. 55–59. [Google Scholar]
- Harun, W.S.; Sharif, S.; Idris, M.H.; Kadirgama, K. Characteristic studies of collapsibility of ABS patterns produced from FDM for investment casting. Mater. Res. Innov. 2009, 13, 340–343. [Google Scholar] [CrossRef]
- Harun, W.S.; Safian, S.; Idris, M.H. Evaluation of ABS patterns produced from FDM for investment casting process. Comput. Method Exp. Mater. Characterisation IV 2009, 1, 319–328. [Google Scholar]
- Idris, M.H.; Sharif, S.; Harun, W.S. Evaluation of ABS patterns produced from FDM for investment casting process. In Proceedings of the 9th Asia Pasific Industrial Engineering & Management Systems Conference, Kaohsiung, Taiwan, 3–5 December 2008; pp. 3–5. [Google Scholar]
- Singh, S.; Singh, R. Study on tribological properties of Al–Al2O3 composites prepared through FDMAIC route using reinforced sacrificial patterns. J. Manuf. Sci. Eng. 2016, 138, 021009. [Google Scholar] [CrossRef]
- Singh, R.; Singh, S. Effect of process parameters on surface hardness, dimensional accuracy and surface roughness of investment cast components. J. Mech. Sci. Technol. 2013, 27, 191–197. [Google Scholar] [CrossRef]
- Sun, S.C.; Bo, Y.; Liu, M.P. Effects of moulding sands and wall thickness on microstructure and mechanical properties of Sr-modified A356 aluminum casting alloy. Trans. Nonferrous Met. Soc. China 2012, 22, 1884–1890. [Google Scholar] [CrossRef]
- Jiang, W.; Fan, Z.; Chen, X.; Wang, B.; Wu, H. Combined effects of mechanical vibration and wall thickness on microstructure and mechanical properties of A356 aluminum alloy produced by expendable pattern shell casting. Mater. Sci. Eng. A 2014, 619, 228–237. [Google Scholar] [CrossRef]
- Bikas, H.; Stavropoulos, P.; Chryssolouris, G. Additive manufacturing methods and modelling approaches: A critical review. Int. J. Adv. Manuf. Technol. 2015, 83, 389–405. [Google Scholar] [CrossRef]
- Shanmughasundaram, P. Investigation on the Wear Behaviour of Eutectic Al-Si Alloy-Al2O3-Graphite Composites Fabricated Through Squeeze Casting. Mater. Res. 2014, 17, 940–946. [Google Scholar] [CrossRef]
- Singh, S.; Singh, R. Wear modelling of Al-Al2O3 functionally graded material prepared by FDM assisted investment castings using dimensionless analysis. J. Manuf. Process. 2015, 20, 507–514. [Google Scholar] [CrossRef]
- Wang, J. Predictive depth of jet penetration models for abrasive water jet cutting of alumina ceramics. Int. J. Mech. Sci. 2007, 49, 306–316. [Google Scholar] [CrossRef]
- Anders, D.; Munker, T.; Artel, J.; Weinberg, K. A dimensional analysis of front-end bending in plate rolling applications. J. Mater. Process. Technol. 2012, 212, 1387–1398. [Google Scholar] [CrossRef]
- Singh, R.; Khamba, J.S. Mathematical modeling of surface roughness in ultrasonic machining of titanium using Buckingham-∏ approach: A Review. Int. J. Abras. Technol. 2009, 2, 3–24. [Google Scholar] [CrossRef]
- Tinker, D.C.; Osborne, R.J.; Pitz, R.W. Annular-Electrode Spark Discharges in Flowing Oxygen: Buckingham Pi Analysis; American Inst. of Aeronautics and Astronautics: Reston, VA, USA, 2019. [Google Scholar]
- Ekici, C.; Teke, I. Developing a new solar radiation estimation model based on Buckingham theorem. Results Phys. 2018, 9, 263–269. [Google Scholar] [CrossRef]
- Tavakoli, S.; Sadeghi, J.; Griffin, I.; Fleming, P.J. PI controller tuning for load disturbance rejection using constrained optimization. Int. J. Dyn. Control 2018, 6, 188–199. [Google Scholar] [CrossRef]
- Salmani, F.; Mahpeykar, M.R.; Rad, E.A. Estimating heat release due to a phase change of high-pressure condensing steam using the Buckingham Pi theorem. Eur. Phys. J. Plus 2019, 134, 48. [Google Scholar] [CrossRef]
- Bakhtar, F.; White, A.J.; Mashmoushy, H. Theoretical treatments of two-dimensional two-phase flows of steam and comparison with cascade measurements. Proc. Inst. Mech. Eng. Part C J. Mech. Eng. Sci. 2005, 219, 1335–1355. [Google Scholar] [CrossRef]
- Buckingham, E. On physically similar systems; illustrations of the use of dimensional equations. Phys. Rev. 1914, 4, 345. [Google Scholar] [CrossRef]
- Zohuri, B. Dimensional Analysis beyond the Pi Theorem; Springer: Berlin, Germany, 2017. [Google Scholar]


| Exp. No. | Tensile Strength, N/mm2 | Volume of Fused Deposition Modelling (FDM) Reinforced Pattern (mm3) | Density of FDM Pattern, N/mm3 | BF Cycle Time (sec) | BF Media Weight (N) | Mould Wall Thickness Obtained, mm | H, N/mm2 (Converted from HV with a Multiplying Factor of 9.807) | Δd, mm | Ra, mm (Converted from µm with a Dividing Factor of 0.001) |
|---|---|---|---|---|---|---|---|---|---|
| 1 | 21.65 | 17576 | 5.12 × 10⁻⁶ | 1200 | 98 | 11.5 | 877.72 | 0.026 | 4762 |
| 2 | 21.65 | 17576 | 7.63 × 10⁻⁶ | 2400 | 147 | 13 | 900.28 | 0.033 | 5151 |
| 3 | 21.65 | 17576 | 9.16 × 10⁻⁶ | 3600 | 196 | 15 | 1127.80 | 0.02 | 4778 |
| 4 | 21.65 | 27000 | 5.12 × 10⁻⁶ | 1200 | 147 | 13 | 787.50 | 0.056 | 4371 |
| 5 | 21.65 | 27000 | 7.63 × 10⁻⁶ | 2400 | 196 | 15 | 848.30 | 0.063 | 5582 |
| 6 | 21.65 | 27000 | 9.16 × 10⁻⁶ | 3600 | 98 | 11.5 | 1127.80 | 0.053 | 6094 |
| 7 | 21.65 | 39304 | 5.12 × 10⁻⁶ | 2400 | 98 | 15 | 756.11 | 0.043 | 5368 |
| 8 | 21.65 | 39304 | 7.63 × 10⁻⁶ | 3600 | 147 | 11.5 | 901.26 | 0.08 | 5658 |
| 9 | 21.65 | 39304 | 9.16 × 10⁻⁶ | 1200 | 196 | 13 | 984.62 | 0.016 | 6404 |
| 10 | 21.53 | 17576 | 5.12 × 10⁻⁶ | 3600 | 196 | 13 | 915.97 | 0.016 | 4709 |
| 11 | 21.53 | 17576 | 7.63 × 10⁻⁶ | 1200 | 98 | 15 | 940.49 | 0.076 | 4573 |
| 12 | 21.53 | 17576 | 9.16 × 10⁻⁶ | 2400 | 147 | 11.5 | 1317.08 | 0.056 | 4658 |
| 13 | 21.53 | 27000 | 5.12 × 10⁻⁶ | 2400 | 196 | 11.5 | 934.60 | 0.033 | 5297 |
| 14 | 21.53 | 27000 | 7.63 × 10⁻⁶ | 3600 | 98 | 13 | 919.89 | 0.05 | 5889 |
| 15 | 21.53 | 27000 | 9.16 × 10⁻⁶ | 1200 | 147 | 15 | 1024.83 | 0.06 | 6845 |
| 16 | 21.53 | 39304 | 5.12 × 10⁻⁶ | 3600 | 147 | 15 | 824.76 | 0.033 | 8564 |
| 17 | 21.53 | 39304 | 7.63 × 10⁻⁶ | 1200 | 196 | 11.5 | 1004.23 | 0.043 | 5721 |
| 18 | 21.53 | 39304 | 9.16 × 10⁻⁶ | 2400 | 98 | 13 | 1041.50 | 0.046 | 5894 |
| Source | Surface Hardness (H) | Dimensional Accuracy (Δd) | Surface Roughness (Ra) |
|---|---|---|---|
| FP | 7.69% | 0.76% | 4.16% |
| VP | 8.85% | 16.95% | 43.84% * |
| DP | 65.75% * | 19.83% | 3.03% |
| BFT | 1.03% | 3.30% | 6.45% |
| BFW | 0.8 % | 31.71% * | 2.94% |
| NSL | 14.14% | 8.97% | 5.72% |
| Residual Error | 1.74% | 18% | 33.86% |
| Total | 100% | 100% | 100% |
© 2019 by the authors. Licensee MDPI, Basel, Switzerland. This article is an open access article distributed under the terms and conditions of the Creative Commons Attribution (CC BY) license (http://creativecommons.org/licenses/by/4.0/).
Share and Cite
Singh, S.; Prakash, C.; Antil, P.; Singh, R.; Królczyk, G.; Pruncu, C.I. Dimensionless Analysis for Investigating the Quality Characteristics of Aluminium Matrix Composites Prepared through Fused Deposition Modelling Assisted Investment Casting. Materials 2019, 12, 1907. https://doi.org/10.3390/ma12121907
Singh S, Prakash C, Antil P, Singh R, Królczyk G, Pruncu CI. Dimensionless Analysis for Investigating the Quality Characteristics of Aluminium Matrix Composites Prepared through Fused Deposition Modelling Assisted Investment Casting. Materials. 2019; 12(12):1907. https://doi.org/10.3390/ma12121907
Chicago/Turabian StyleSingh, Sunpreet, Chander Prakash, Parvesh Antil, Rupinder Singh, Grzegorz Królczyk, and Catalin I. Pruncu. 2019. "Dimensionless Analysis for Investigating the Quality Characteristics of Aluminium Matrix Composites Prepared through Fused Deposition Modelling Assisted Investment Casting" Materials 12, no. 12: 1907. https://doi.org/10.3390/ma12121907