Vibrational Spectroscopy Fingerprinting in Medicine: from Molecular to Clinical Practice

 , , , ,
Abstract
: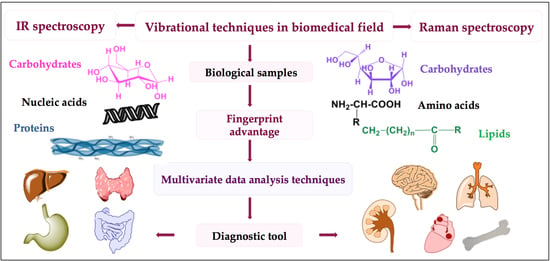
1. Introduction
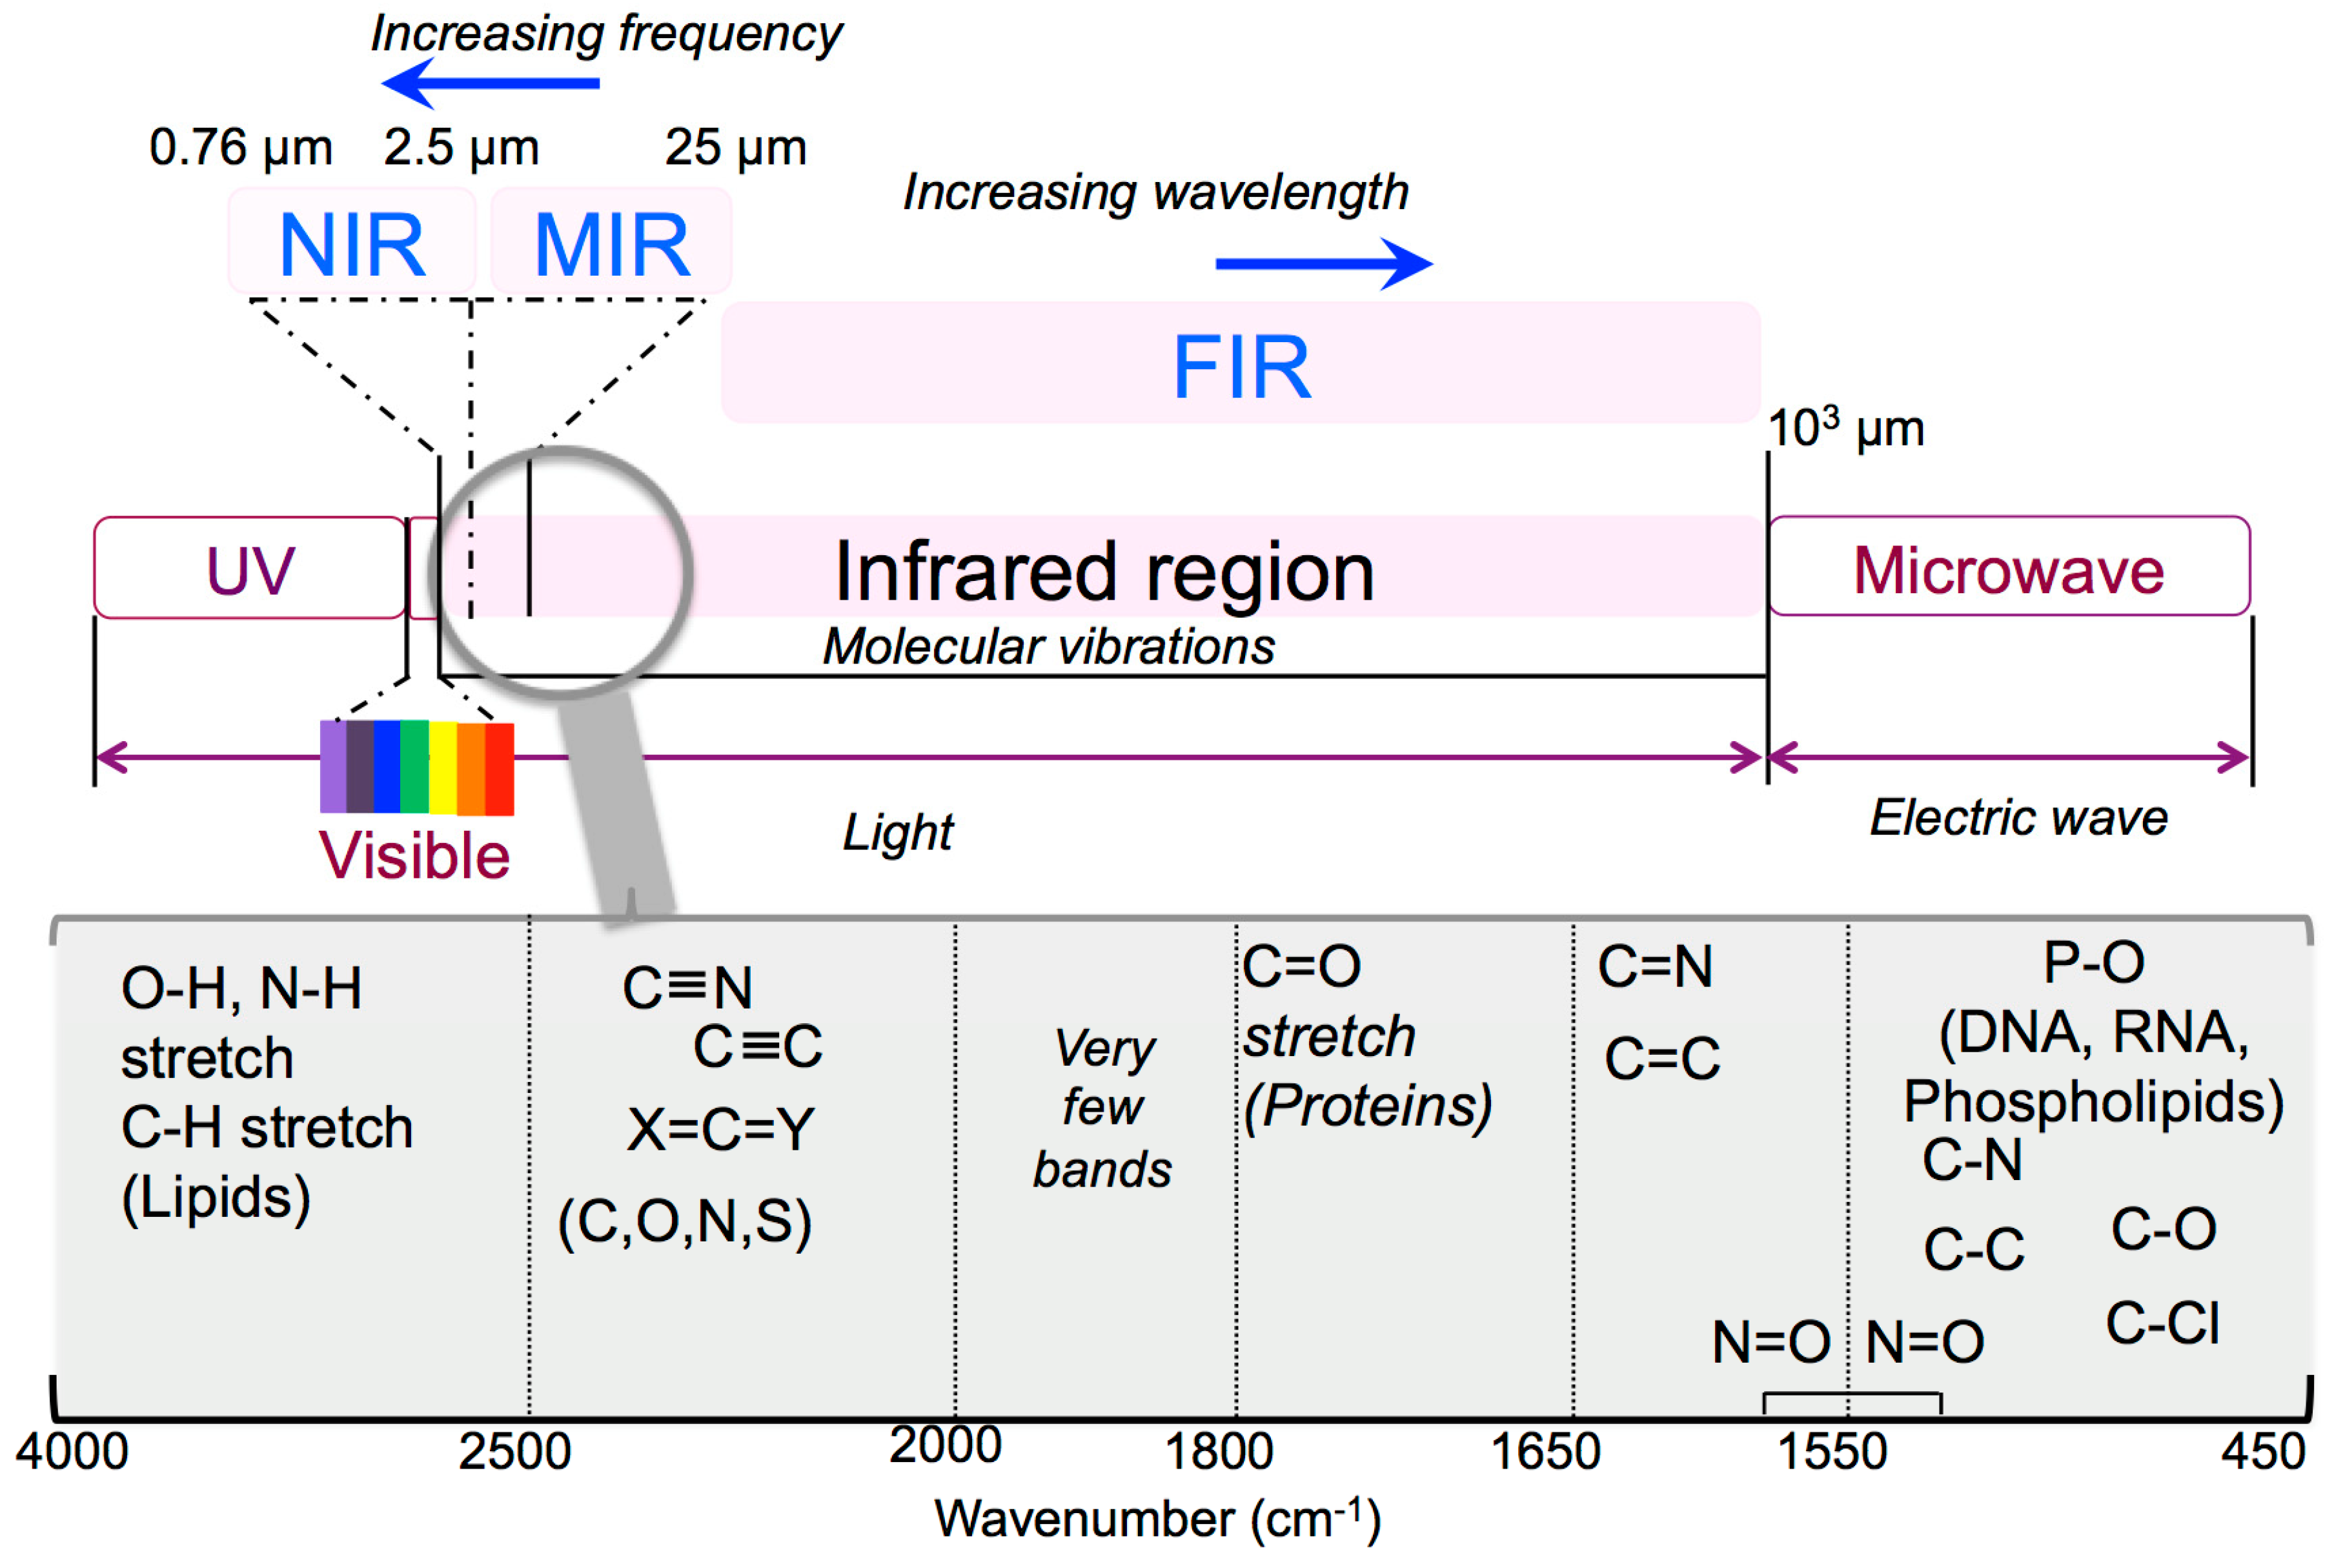
1.1. IR Multi-Range Options
1.2. Sample Preparation
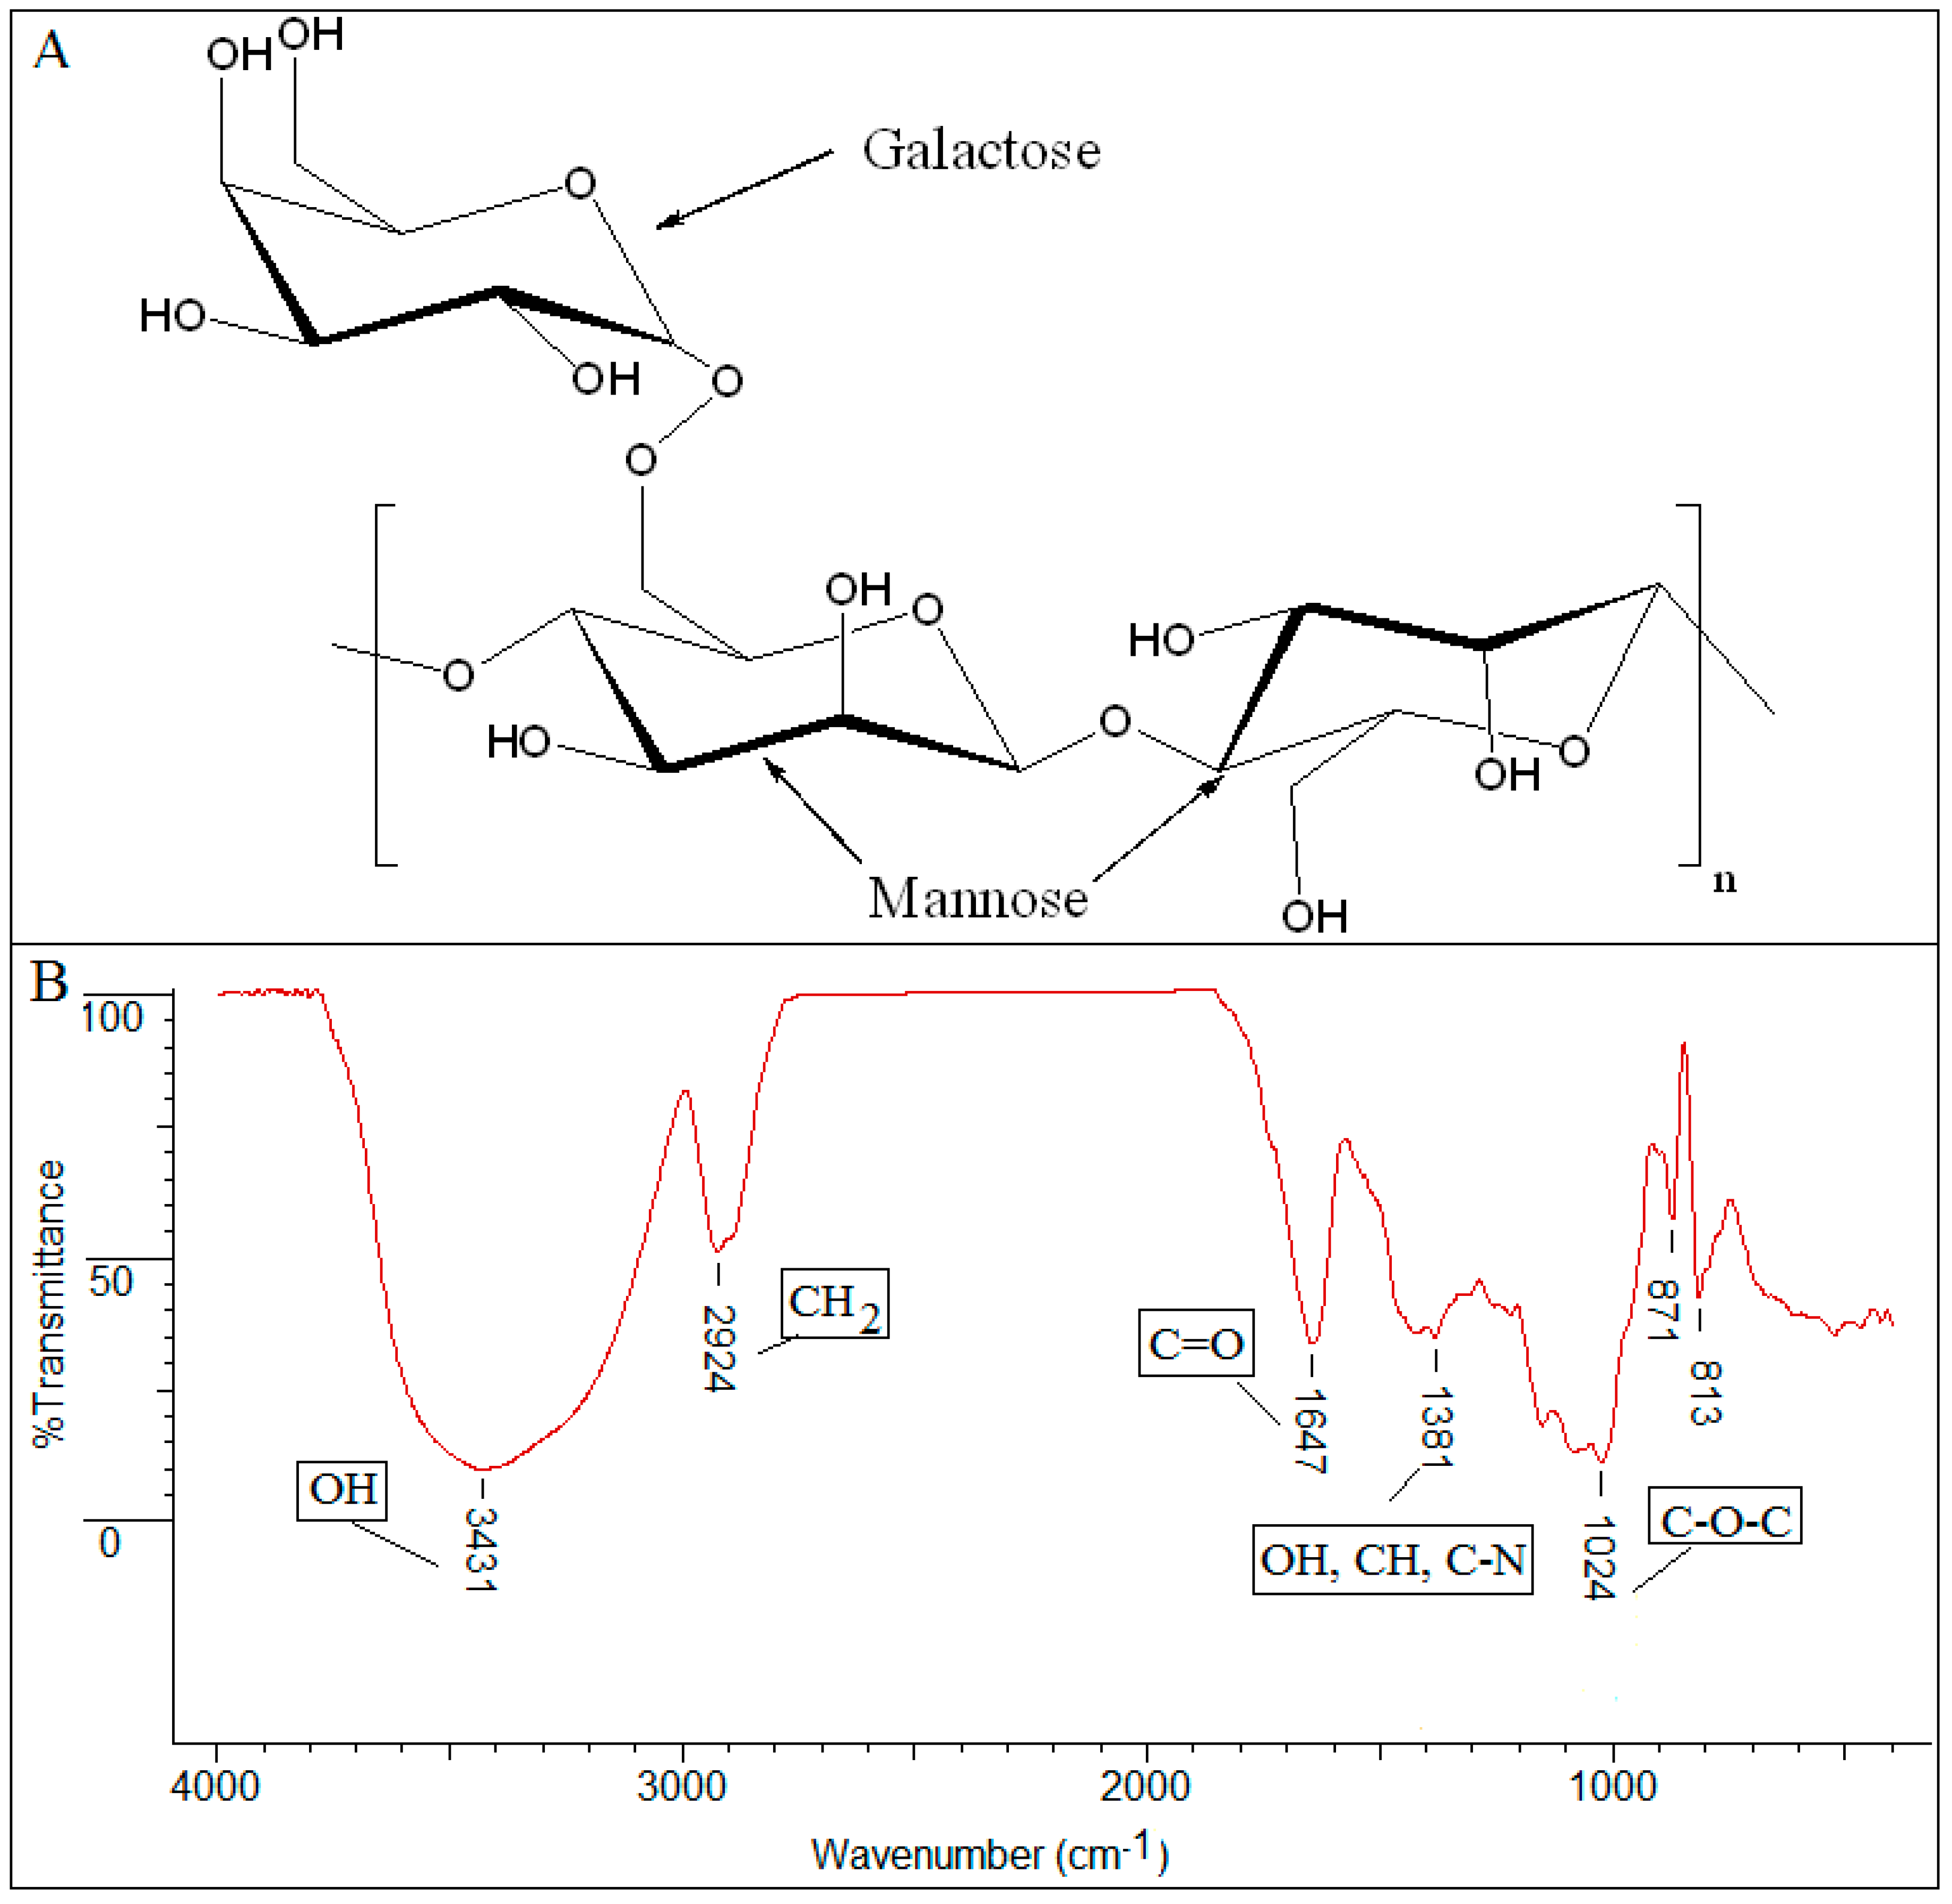
1.3. Band Assignments
- the prominent peak in the region of 3431 cm−1 denotes the presence of a significant quantity of hydroxyl groups (OH) in the structure;
- the 2924 cm−1 peak is attributed to vibration of axial deformation of C–H of the CH2 group;
- 1647 cm−1 stretching suggests the presence of carbonyl of non-substituted amide and water;
- the 1381 cm−1 band corresponds to deformation modes with participation of the OH, CH, and C–N groups;
- the sharp peak at 1024 cm−1 is dominated by absorptions from the hydroxylic C–O single bond stretching of the C–O–C group in the anhydroglucose ring;
- the absorption bands between 871 − 813 cm−1 were attributed to the galactose and mannose moieties specific to guar gum.
1.4. International Available Databases
1.5. Data Processing
1.6. Computational Methods and Chemometrics
- Principal component analysis (PCA), the most basic feature extraction unsupervised techniques, based on the analysis of the variance of features within the full spectrum;
- Independent component analysis (ICA) that identifies spectral components by searching for independent components;
- Vertex component analysis (VCA) that is specifically designed for hyperspectral images;
- Partial least squares (PLS), the most widely used supervised multivariate data analysis technique that estimates and quantify components in a sample;
- Clustering unsupervised methods, used to identify biological subtypes within a sample, such as hierarchical cluster analysis (HCA), k-nearest neighbours (KNN), artificial neural networks (ANN), discriminant analysis (DA), and support vector machines (SVM).
1.7. Strategy in Biomedical Analysis
- experimental accessibility to a number of infrared and Raman active transitions derived from specific moieties in spatially localized regions within the biomolecules;
- noninvasive method that does not involve spin labels or fluorescent probes;
- no limits on sample molecular weight, such as DNA;
- instantaneous snapshots of all molecular conformations;
- absence of line broadening compared with magnetic resonance spectra, due to relaxation phenomena;
- minimal sample preparation as described above;
- simplicity, rapidity, and low-cost;
- high molecular sensitivity joined with spatial resolution down to a few micrometers.
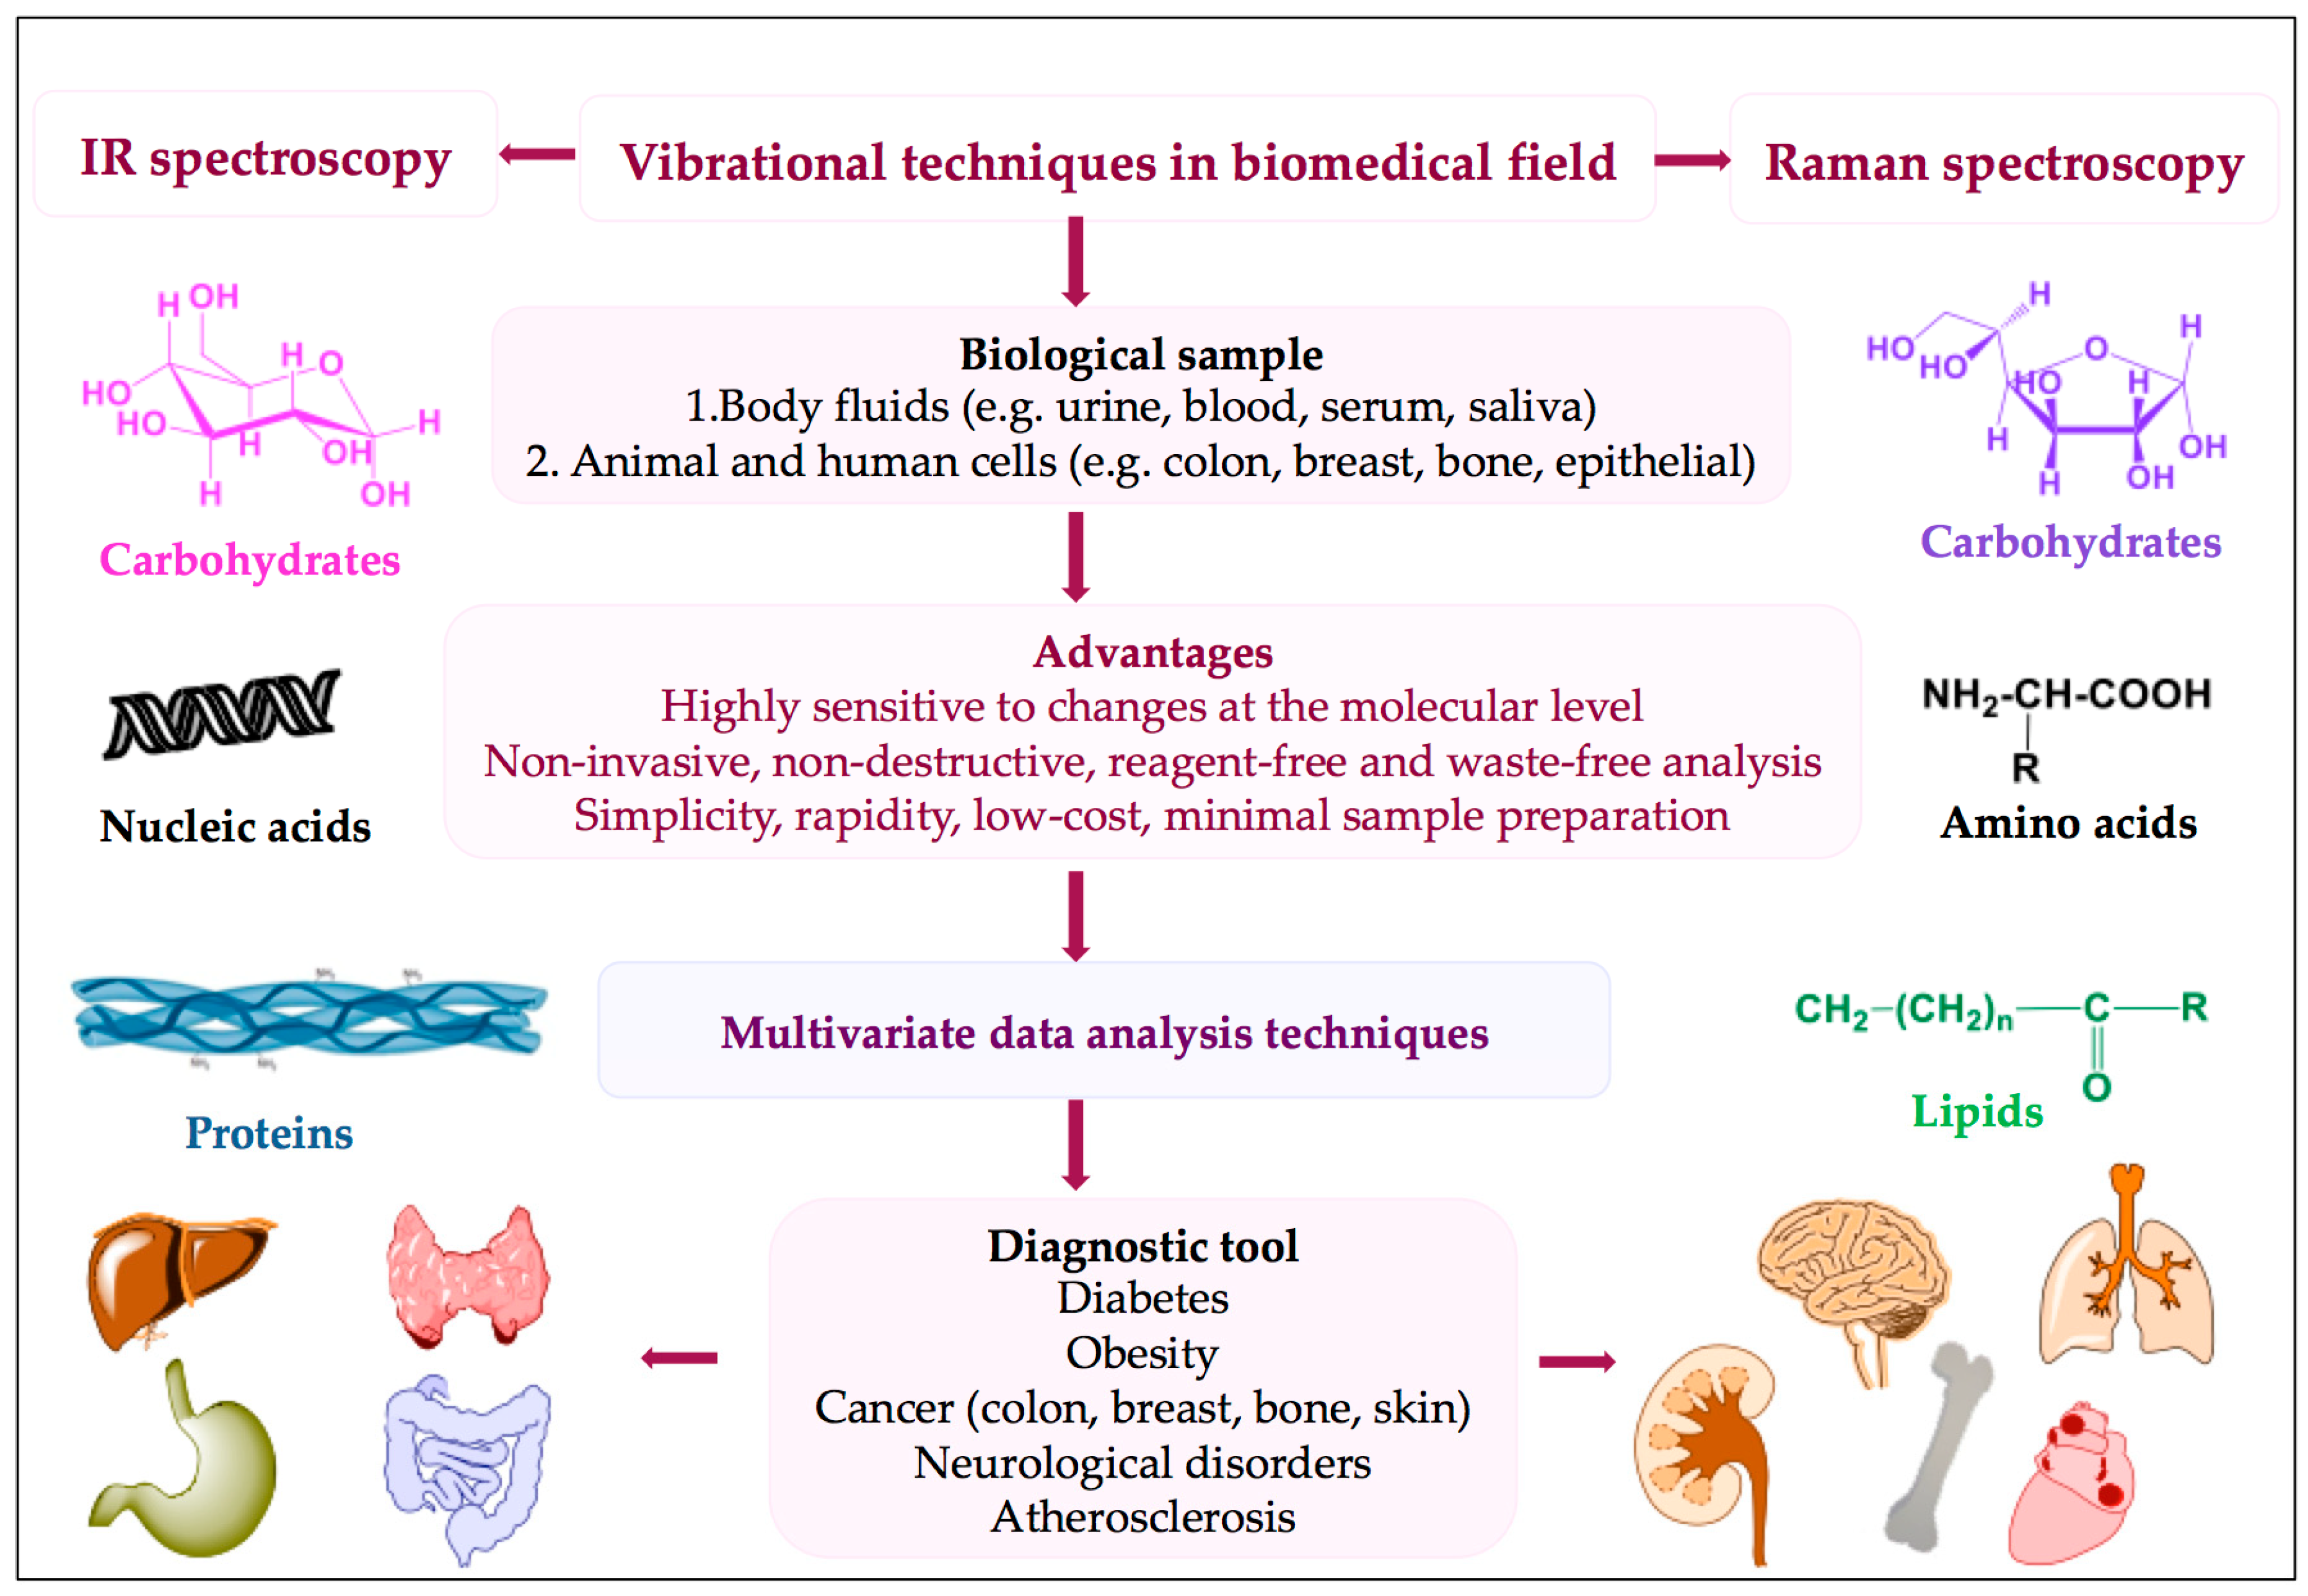
2. Drifting from Molecular to Clinical Practice
2.1. Body Fluids
- chemicals or specific molecular probes free;
- identification and quantification based on IR “spectral patterns” of the compounds;
- minimum sample quantities (μL of fluids or nearly 103 cells);
- automation capability since IR systems can yield test results within minutes (≈15), with basic training of the operator.
2.2. Animal and Human Cells
- 1449, 1257, 1003, and 936 cm−1 were attributed to the CH2 bend, amide III, protein phenylalanine symmetric ring, and C–C unfolding;
- both weak and sharp Raman bands at 1618, 1605, 1209, 1175, 852, 642, and 620 cm−1 were assigned to tryptophan, tyrosine, phenylalanine, and aromatic amino acid deposits;
- 1577, 1421, 1340, 1086, 830, 785, and 720 cm−1 were related to DNA and RNA content; and
- intense peaks at 1583, 1127, and 747 cm−1 were associated with cytochrome c (cyt-c) in a reduced state.
- FLV-CMs vs. hESCs: lower peak intensities for 1578, 1320, 1128, 1090, 854, 811, and 785 cm−1 and slightly superior intensity of the 937 cm−1 region;
- hESCs vs. FLV-CMs: higher content of DNA and RNA according to the 1090 cm−1 (PO2− stretch of the DNA phosphate backbone), 937 cm−1 (protein α-helix carbon backbone stretch), 811 cm−1 (RNA O-P-O stretching), and 785 cm−1 (DNA cytosine ring) peaks;
- hESCs vs. hESC-CMs: similar pattern regarding the DNA/RNA bands with lower intensity at 1320, 1090, 811, and 785 cm−1 and different trend for proteins, lipids, and carbohydrates located in the 1450 − 1320 cm−1 and 980 − 930 regions. The abovementioned results could represent the foundation for establishing a label-free noninvasive automated approach for hESCs and CMs discrimination valuable in cell-based heart therapies.
2.3. Vibrational Spectroscopy as A Diagnostic Tool
2.3.1. Diabetes and Obesity
2.3.2. Cancer
- increased sensitivity of Raman to homo-nuclear functional moieties;
- increased sensitivity of FTIR to hetero-nuclear molecular groups and polar chains.
2.3.3. Neurological Disorders
- the bands in the 3050 − 2800 cm−1 region are subject to antisymmetric and symmetric CH stretches of methyl, methylene, and methine moieties from lipid and proteins;
- the absorption bands starting from 1700 to 1500 cm−1 region are dedicated to proteins;
- the absorption bands identified in the 1350 − 1000 cm−1 area were ascribed to phosphate groups and carbohydrates.
3. Future Perspectives: Framing in a Broader Vision of Health Infrastructure and Policies
4. Conclusions
Author Contributions
Funding
Conflicts of Interest
References
- Gilbert, A.S. Vibrational, Rotational and Raman Spectroscopy, Historical Perspective. In Encyclopedia of Spectroscopy and Spectrometry; Elsevier: Amsterdam, NY, USA, 2017; pp. 600–609. ISBN 978-0-12-803224-4. [Google Scholar]
- Reich, G. Mid and Near Infrared Spectroscopy. In Analytical Techniques in the Pharmaceutical Sciences; Müllertz, A., Perrie, Y., Rades, T., Eds.; Springer: New York, NY, USA, 2016; pp. 61–138. ISBN 978-1-4939-4027-1. [Google Scholar]
- Durig, J.R. Far-IR Spectroscopy, Applications. In Encyclopedia of Spectroscopy and Spectrometry; Elsevier: Amsterdam, NY, USA, 1999; pp. 498–504. ISBN 978-0-12-226680-5. [Google Scholar] [Green Version]
- Han, Y.; Ling, S.; Qi, Z.; Shao, Z.; Chen, X. Application of far-infrared spectroscopy to the structural identification of protein materials. Phys. Chem. Chem. Phys. 2018, 20, 11643–11648. [Google Scholar] [CrossRef] [PubMed]
- Steele, D. IR Spectroscopy, Theory. In Encyclopedia of Spectroscopy and Spectrometry; Elsevier: Amsterdam, NY, USA, 2017; pp. 463–468. ISBN 978-0-12-803224-4. [Google Scholar]
- Smith, R.; Wright, K.L.; Ashton, L. Raman spectroscopy: An evolving technique for live cell studies. Analyst 2016, 141, 3590–3600. [Google Scholar] [CrossRef] [PubMed]
- Das, R.S.; Agrawal, Y.K. Raman spectroscopy: Recent advancements, techniques and applications. Vib. Spectrosc. 2011, 57, 163–176. [Google Scholar] [CrossRef]
- Auner, G.W.; Koya, S.K.; Huang, C.; Broadbent, B.; Trexler, M.; Auner, Z.; Elias, A.; Mehne, K.C.; Brusatori, M.A. Applications of Raman spectroscopy in cancer diagnosis. Cancer Metast. Rev. 2018, 37, 691–717. [Google Scholar] [CrossRef] [PubMed] [Green Version]
- Ember, K.J.I.; Hoeve, M.A.; McAughtrie, S.L.; Bergholt, M.S.; Dwyer, B.J.; Stevens, M.M.; Faulds, K.; Forbes, S.J.; Campbell, C.J. Raman spectroscopy and regenerative medicine: A review. Npj Regen. Med. 2017, 2, 12. [Google Scholar] [CrossRef] [PubMed]
- Sato, H.; Ishigaki, M.; Taketani, A.; Andriana, B.B. Raman spectroscopy and its use for live cell and tissue analysis. BSI 2019, 7, 97–104. [Google Scholar] [CrossRef] [Green Version]
- Feng, S.; Pan, J.; Wu, Y.; Lin, D.; Chen, Y.; Xi, G.; Lin, J.; Chen, R. Study on gastric cancer blood plasma based on surface-enhanced Raman spectroscopy combined with multivariate analysis. Sci. China Life Sci. 2011, 54, 828–834. [Google Scholar] [CrossRef] [PubMed] [Green Version]
- Cui, S.; Zhang, S.; Yue, S. Raman spectroscopy and imaging for cancer diagnosis. J. Healthc. Eng. 2018, 8619342, 2018. [Google Scholar] [CrossRef] [PubMed]
- Ramírez-Elías, M.G.; González, F.J. Raman Spectroscopy for In Vivo Medical Diagnosis. In Raman Spectroscopy; do Nascimento, G.M., Ed.; InTech: London, UK, 2018; ISBN 978-1-78923-000-0. [Google Scholar] [Green Version]
- Dumas, P. Microanalysis and imaging capabilities of synchrotron infraredmicroscopy. J. Phys. IV France 2003, 104, 359–364. [Google Scholar] [CrossRef]
- Stuart, B. Modern Infrared Spectroscopy, 2nd ed.; John Wiley & Sons, LTD: Chichester, UK, 1996. [Google Scholar]
- Wetzel, D.L.; LeVine, S.M. Biological Applications of Infrared Microspectroscopy: Infrared and Raman Spectroscopy of Biological Materials; Marcel Dekker Inc.: New York, NY, USA, 2001. [Google Scholar]
- Humecki, H.J. Practical Guide to Infrared Microspectroscopy; Marcel Dekker Inc.: New York, NY, USA, 1995. [Google Scholar]
- Kazarian, S.G.; Chan, K.L. Applications of ATR-FTIR spectroscopic imaging to biomedical samples. Biochim. Biophys. Acta. 2006, 1758, 858–867. [Google Scholar] [CrossRef] [PubMed] [Green Version]
- Caine, S.; Heraud, P.; Tobin, M.J.; McNaughton, D.; Bernard, C.C.A. The application of Fourier transform infrared microspectroscopy for the study of diseased central nervous system tissue. NeuroImage 2012, 59, 3624–3640. [Google Scholar] [CrossRef] [PubMed]
- Dodi, G.; Pala, A.; Barbu, E.; Peptanariu, D.; Hritcu, D.; Popa, M.I.; Tamba, B.I. Carboxymethyl guar gum nanoparticles for drug delivery applications: Preparation and preliminary in-vitro investigations. Mater. Sci. Eng. C Mater. Biol. Appl. 2016, 63, 628–636. [Google Scholar] [CrossRef] [PubMed] [Green Version]
- Dodi, G.; Hritcu, D.; Popa, M.I. Carboxymethylation of guar gum: Synthesis and characterization. Cell. Chem. Technol. 2011, 45, 171–176. [Google Scholar]
- Geladi, P.; Dåbakk, E. Computational methods and chemometrics in near infrared spectroscopy. In Encyclopedia of Spectroscopy and Spectrometry (Third Edition); Academic Press: Amsterdam, NY, USA, 2017; pp. 350–355. [Google Scholar]
- Bonnier, F.; Baker, M.J.; Byrne, H.J. Vibrational spectroscopic analysis of body fluids: Avoiding molecular contamination using centrifugal filtration. Anal. Methods 2014, 6, 5155–5160. [Google Scholar] [CrossRef]
- Kendall, C.; Isabelle, M.; Bazant-Hegemark, F.; Hutchings, J.; Orr, L.; Babrah, J.; Baker, R.; Stone, N. Vibrational spectroscopy: A clinical tool for cancer diagnostics. Analyst 2009, 134, 1029–1065. [Google Scholar] [CrossRef] [PubMed]
- Carter, E.A.; Tam, K.K.; Armstrong, R.S.; Lay, P.A. Vibrational spectroscopic mapping and imaging of tissues and cells. Biophys. Rev. 2009, 1, 95–103. [Google Scholar] [CrossRef] [PubMed] [Green Version]
- Petibois, C.; Desbat, B. Clinical application of FTIR imaging: New reasons for hope. Trends Biotechnol. 2010, 28, 495–500. [Google Scholar] [CrossRef] [PubMed]
- Kazarian, S.G.; Chan, K.L. ATR-FTIR spectroscopic imaging: Recent advances and applications to biological systems. Analyst 2013, 138, 1940–1951. [Google Scholar] [CrossRef] [PubMed]
- Baker, M.J.; Trevisan, J.; Bassan, P.; Bhargava, R.; Butler, H.J.; Dorling, K.M.; Fielden, P.R.; Fogarty, S.W.; Fullwood, N.J.; Heys, K.A.; et al. Using fourier transform IR spectroscopy to analyze biological materials. Nat. Protoc. 2014, 9, 1771–1791. [Google Scholar] [CrossRef] [PubMed]
- Depciuch, J.; Parlinska-Wojtan, M. Comparing dried and liquid blood serum samples of depressed patients: An analysis by Raman and infrared spectroscopy methods. J. Pharm. Biomed. Anal. 2018, 150, 80–86. [Google Scholar] [CrossRef] [PubMed]
- Travo, A.; Paya, C.; Déléris, G.; Colin, J.; Mortemousque, B.; Forfar, I. Potential of FTIR spectroscopy for analysis of tears for diagnosis purposes. Anal. Bioanal. Chem. 2014, 406, 2367–2376. [Google Scholar] [CrossRef] [PubMed]
- Takamura, A.; Watanabe, K.; Akutsu, T.; Ozawa, T. Soft and robust identification of body fluid using fourier transform infrared spectroscopy and chemometric strategies for forensic analysis. Sci. Rep. 2018, 8, 8459. [Google Scholar] [CrossRef] [PubMed]
- Orphanou, C.M. The detection and discrimination of human body fluids using ATR FT-IR spectroscopy. Forensic Sci. Int. 2015, 252, e10–e16. [Google Scholar] [CrossRef] [PubMed]
- Bunaciu, A.A.; Fleschin, S.; Hoang, V.D.; Aboul-Enein, H.Y. Vibrational spectroscopy in body fluids analysis. Crit. Rev. Anal. Chem. 2017, 47, 67–75. [Google Scholar] [CrossRef] [PubMed]
- Shin, H.; Markey, M.K. A Machine learning perspective on the development of clinical decision support systems utilizing mass spectra of blood serum. J. Biomed. Inf. 2006, 39, 227–248. [Google Scholar] [CrossRef] [PubMed]
- Shaw, R.A.; Mantsch, H.H. Sampling technology for vibrational spectroscopy. In Infrared Spectroscopy of Biological Fluids in Clinical and Diagnostic Analysis; Mayers, R.A., Ed.; John Wiley & Sons Ltd.: Chichester, UK, 2008. [Google Scholar]
- Hu, S.; Loo, J.A.; Wong, D.T. Human body fluid proteome analysis. Proteomics 2006, 6, 6326–6353. [Google Scholar] [CrossRef] [PubMed]
- Hands, J.R.; Abel, P.; Ashton, K.; Dawson, T.; Davis, C.; Lea, R.W.; McIntosh, A.J.; Baker, M.J. Investigating the rapid diagnosis of gliomas from serum samples using infrared spectroscopy and cytokine and angiogenesis factors. Anal. Bioanal. Chem. 2013, 405, 7347–7355. [Google Scholar] [CrossRef] [PubMed]
- Gonzalez-Solıs, J.L.; Martınez-Espinosa, J.C.; Torres-Gonzalez, L.A.; Aguilar-Lemarroy, A.; Jave-Suarez, L.F.; Palomares-Anda, P. Cervical cancer detection based on serum sample raman spectroscopy. Laser Med. Sci. 2014, 29, 979–985. [Google Scholar] [CrossRef]
- Wang, X.; Shen, X.; Sheng, D.; Chen, X.; Liu, X. FTIR spectroscopic comparison of serum from lung cancer patients and healthy persons. Spectrochim. Acta A 2014, 122, 193–197. [Google Scholar] [CrossRef]
- Sheng, D.; Liu, X.; Li, W.; Wang, Y.; Chen, X.; Wang, X. Distinction of leukemia patients’ and healthy persons’ serum using FTIR spectroscopy. Spectrochim. Acta A 2013, 101, 228–232. [Google Scholar] [CrossRef]
- Hughes, C.; Brown, M.; Clemens, G.; Henderson, A.; Monjardez, G.; Clarke, N.W.; Gardner, P. Assessing the challenges of fourier transform infrared spectroscopic analysis of blood serum. J. Biophotonics 2014, 7, 180–188. [Google Scholar] [CrossRef] [PubMed]
- Sahu, A.; Nandakumar, N.; Sawant, S.; Krishna, C.M. Recurrence prediction in oral cancers: A serum raman spectroscopy study. Analyst 2015, 140, 2294–2301. [Google Scholar] [CrossRef] [PubMed]
- Gajjar, K.; Trevisan, J.; Owens, G.; Keating, P.J.; Wood, N.J.; Stringfellow, H.F.; Martin-Hirsch, P.L.; Martin, F.L. Fourier-transform infrared spectroscopy coupled with a classification machine for the analysis of blood plasma or serum: A novel diagnostic approach for ovarian cancer. Analyst 2013, 138, 3917–3926. [Google Scholar] [CrossRef] [PubMed]
- Ostrovsky, E.; Zelig, U.; Gusakova, I.; Ariad, S.; Mordechai, S.; Nisky, I.; Kapilushnik, J. Detection of cancer using advanced computerized analysis of infrared spectra of peripheral blood. IEEE Trans. Biomed. Eng. 2013, 60, 343. [Google Scholar] [CrossRef] [PubMed]
- Manavbasi, Y.; Suleymanoglu, E. Nucleic acid-phospholipid recognition: Fourier transform infrared spectrometric characterization of ternary phospho-lipid-inorganic cation-DNA complex and its relevance to chemicopharmaceutical design of nanometric liposome based gene delivery formulations. Arch. Pharm. Res. 2007, 30, 1027–1040. [Google Scholar] [CrossRef] [PubMed]
- Elmi, F.; Movaghar, A.F.; Elmi, M.M.; Alinezhad, H.; Nikbakhsh, N. Application of FT-IR spectroscopy on breast cancer serum analysis. Spectrochim. Acta A 2017, 187, 87–91. [Google Scholar] [CrossRef] [PubMed]
- Rusciano, G. Experimental Analysis of Hb Oxy-Deoxy transition in single optically stretched red blood cells. Phys. Medica 2010, 26, 233–239. [Google Scholar] [CrossRef]
- Garcia-Garcia, J.L.; Perez-Guaita, D.; Ventura-Gayete, J.; Garrigues, S.; de la Guardia, M. Determination of biochemical parameters in human serum by near-infrared spectroscopy. Anal. Methods 2014, 6, 3982–3989. [Google Scholar] [CrossRef]
- Hou, S.; Riley, C.B.; Mitchell, C.A.; Shaw, R.A.; Bryanton, J.; Bigsby, K.; McClure, J.T. Exploration of attenuated total reflectance mid- infrared spectroscopy and multivariate calibration to measure immunoglobulin G in human sera. Talanta 2015, 142, 110–119. [Google Scholar] [CrossRef]
- Sitole, L.; Steffens, F.; Kruger, T.P.J.; Meyer, D. Mid-ATR-FTIR spectroscopic profiling of HIV/AIDS sera for novel systems diagnostics in global health. OMICS. 2014, 18, 513–523. [Google Scholar] [CrossRef]
- Liu, K.Z.; Shaw, R.A.; Dembinski, T.C.; Reid, G.J.; Low-Ying, S.; Mantsch, H.H. Comparison of Infrared Spectroscopic and Fluorescence Depolarization Assays for Fetal Lung Maturity. Am. J. Obstet. Gynecol. 2000, 183, 181–187. [Google Scholar] [CrossRef]
- Shaw, R.A.; Kotowich, S.; Eysel, H.H.; Jackson, M.; Thomson, G.T.D.; Mantsch, H.H. Arthritis diagnosis based upon the near-infrared spectrum of synovial fluid. Rheumatol. Int. 1995, 15, 159–165. [Google Scholar] [CrossRef] [PubMed]
- Shaw, R.A.; Rigatto, C.; Reslerova, M.; Ying, S.L.; Man, A.; Schattka, B.; Battrell, C.F.; Matthewson, J.; Mansfield, C. Toward point-of-care diagnostic metabolic fingerprinting: Quantification of plasma creatinine by infrared spectroscopy of microfluidic-preprocessed samples. Analyst 2009, 134, 1224–1231. [Google Scholar] [CrossRef] [PubMed]
- Lovergne, L.; Clemens, G.; Untereiner, V.; Lukaszweski, R.A.; Sockalingum, G.D.; Baker, M.J. Investigating optimum sample preparation for infrared spectroscopic serum diagnostics. Anal. Methods 2015, 7, 7140–7149. [Google Scholar] [CrossRef] [Green Version]
- Byrne, H.J.; Baranska, M.; Puppels, G.J.; Stone, N.; Wood, B.; Gough, K.M.; Lasch, P.; Heraud, P.; Sule-Suso, J.; Sockalingum, G.D. Spectropathology for the Next Generation: Quo Vadis? Analyst 2015, 140, 2066–2073. [Google Scholar] [CrossRef] [PubMed]
- Bonnier, F.; François Petitjean, F.; Baker, M.J.; Byrne, H.J. Improved Protocols for Vibrational Spectroscopic Analysis of Body Fluids. J. Biophotonics 2014, 7, 167–179. [Google Scholar] [CrossRef]
- Firdous, S.; Nawaz, M.; Ahmed, M.; Anwar, S.; Rehman, A.; Rashid, R.; Mahmood, A. Measurement of Diabetic Sugar Concentration in Human Blood Using Raman Spectroscopy. Laser Phys. 2012, 22, 1090–1094. [Google Scholar] [CrossRef]
- Aydin, S. A Comparison of Ghrelin, Glucose, Alpha-Amylase and Protein Levels in Saliva from Diabetics. J. Biochem. Mol. Biol. 2007, 40, 29–35. [Google Scholar] [CrossRef]
- D’Elia, V.; Montalvo Garcıa, G.; Garcıa Ruiz, C. Spectroscopic Trends for the Determination of Illicit Drugs in Oral Fluid. Appl. Spectrosc. Rev. 2015, 50, 775–796. [Google Scholar] [CrossRef]
- Filik, J.; Stone, N. Investigation into the protein composition of human tear fluid using centrifugal filters and drop coating deposition Raman spectroscopy. J. Raman Spectrosc. 2009, 40, 218–224. [Google Scholar] [CrossRef]
- Qi, D.; Berger, A.J. Chemical concentration measurement in blood serum and urine samples using liquid-core optical fiber Raman spectroscopy. Appl. Opt. 2007, 46, 1726–1734. [Google Scholar] [CrossRef] [PubMed] [Green Version]
- Wood, B.R.; McNaughton, D. Raman excitation wavelength investigation of single red blood cells in vivo. J. Raman Spectrosc. 2002, 33, 517–523. [Google Scholar] [CrossRef]
- Taleb, I.; Thiéfin, G.; Gobinet, C.; Untereiner, V.; Bernard-Chabert, B.; Heurgué, A.; Truntzer, C.; Hillon, P.; Manfait, M.; Ducoroy, P.; et al. Diagnosis of hepatocellular carcinoma in cirrhotic patients: A proof-of-concept study using serum micro-Raman spectroscopy. Analyst 2013, 138, 4006–4014. [Google Scholar] [CrossRef] [PubMed]
- Chan, J.W.; Taylor, D.S.; Lane, S.M.; Zwerdling, T.; Tuscano, J.; Huser, T. Nondestructive identification of individual leukemia cells by laser trapping Raman spectroscopy. Anal. Chem. 2008, 80, 2180–2187. [Google Scholar] [CrossRef] [PubMed]
- Harvey, T.J.; Faria, E.C.; Henderson, A.; Gazi, E.; Ward, A.D.; Clarke, N.W.; Brown, M.D.; Snook, R.D.; Gardner, P. Spectral discrimination of live prostate and bladder cancer cell lines using Raman optical tweezers. J. Biomed. Opt. 2008, 13, 064004. [Google Scholar] [CrossRef]
- MacLaughlin, C.M.; Mullaithilaga, N.; Yang, G.; Ip, S.Y.; Wang, C.; Walker, G.C. Surface enhanced Raman scattering dye-labeled Au nanoparticles for triplexed detection of leukemia and lymphoma cells and SERS flow cytometry. Langmuir 2013, 29, 1908–1919. [Google Scholar] [CrossRef] [PubMed]
- Bergholt, M.S.; Hassing, S. Qantification of C-Reactive protein in human blood plasma using near-infrared Raman spectroscopy. Analyst 2009, 134, 2123–2127. [Google Scholar] [CrossRef]
- Poon, K.W.C.; Lyng, F.M.; Knief, P.; Howe, O.; Meade, A.D.; Curtin, J.F.; Byrne, H.J.; Vaughan, J. Quantitative reagent-free detection of fibrinogen levels in human blood plasma using Raman spectroscopy. Analyst 2012, 137, 1807–1814. [Google Scholar] [CrossRef] [Green Version]
- Monfared, A.M.T.; Tiwari, V.S.; Tripathi, M.M.; Anis, H. Raman spectroscopy for clinical-level detection of heparin in serum by partial least-squares analysis. J. Biomed. Opt. 2013, 18, 27010. [Google Scholar] [CrossRef]
- Murray, C.J.; Rosenfeld, L.C.; Lim, S.S.; Andrews, K.G.; Foreman, K.J.; Haring, D.; Fullman, N.; Naghavi, M.; Lozano, R.; Lopez, A.D. Global malaria mortality between 1980 and 2010: A systematic analysis. Lancet 2012, 379, 413–431. [Google Scholar] [CrossRef]
- Hobro, A.J.; Konishi, A.; Coban, C.; Smith, N.I. Raman spectroscopic analysis of malaria disease progression via blood and plasma samples. Analyst 2013, 138, 3927–3933. [Google Scholar] [CrossRef] [PubMed]
- Matthäus, C.; Dochow, S.; Bergner, G.; Lattermann, A.; Romeike, B.F.M.; Marple, E.T.; Krafft, C.; Dietzek, B.; Brehm, B.R.; Popp, J. In vivo characterization of atherosclerotic plaque depositions by Raman probe spectroscopy and in vitro coherent anti-stokes Raman scattering microscopic imaging on a rabbit model. Anal. Chem. 2012, 84, 7845–7851. [Google Scholar] [CrossRef] [PubMed]
- Wrobel, T.P.; Fedorowicz, A.; Mateuszuk, L.; Maslak, E.; Jasztal, A.; Chlopicki, S.; Marzec, K.M. Vibrational microspectroscopy for analysis of atherosclerotic arteries. In Optical Spectroscopy and Computational Methods in Biology and Medicine; Baranska, M., Ed.; Springer: Dordrecht, The Netherlands, 2013; pp. 505–535. [Google Scholar]
- Marzec, K.M.; Wrobel, T.P.; Ryguła, A.; Mas’lak, E.; Jasztal, A.; Fedorowicz, A.; Chlopicki, S.; Baranska, M. Visualization of the biochemical markers of atherosclerotic plaque with the use of Raman, IR and AFM. J. Biophotonics 2014, 7, 744–756. [Google Scholar] [CrossRef] [PubMed]
- Yang, Y.C.; Chang, W.T.; Huang, S.K.; Liau, I. Characterization of the pharmaceutical effect of drugs on atherosclerotic lesions in vivo using integrated fluorescence imaging and Raman spectral measurements. Anal. Chem. 2014, 86, 3863–3868. [Google Scholar] [CrossRef] [PubMed]
- Kostogrys, R.B.; Johann, C.; Czyzynska, I.; Franczyk-Zarow, M.; Drahun, A.; Maślak, E.; Jasztal, A.; Gajda, M.; Mateuszuk, Ł.; Wrobel, T.P.; et al. Characterisation of atherogenic effects of low carbohydrate, high protein diet (LCHP) in ApoE/LDLR/ mice. J. Nutr. Health Aging 2015, 19, 710–718. [Google Scholar] [CrossRef] [PubMed]
- Kochan, K.; Marzec, K.M.; Chruszcz-Lipska, K.; Jasztal, A.; Maslak, E.; Musiolik, H.; Chłopicki, S.; Baranska, M. Pathological changes in biochemical profile of liver in atherosclerosis and diabetes assessed by Raman spectroscopy. Analyst 2013, 138, 3885–3890. [Google Scholar] [CrossRef] [PubMed]
- Floria, M.; Blommaert, D.; Lacrosse, M.; Ambarus, V.; Dormal, F.; Dabiri Abkenari, L.; Jamart, J.; Rezus, C.; Cozma, D.; De Roy, L. Assessment of left atrial shape and volume in structural remodeling secondary to atrial fibrillation. J. Interv. Card. Electrophysiol. 2009, 25, 167–170. [Google Scholar] [CrossRef] [PubMed]
- Wrobel, T.P.; Malek, K.; Chlopicki, S.; Mateuszuk, L.; Baranska, M. Imaging of lipids in atherosclerotic lesions in aorta from ApoE/LDLR/mice by FT-IR spectroscopy and hierarchical cluster analysis. Analyst 2011, 136, 5247–5255. [Google Scholar] [CrossRef]
- Wrobel, T.P.; Majzner, K.; Baranska, M. Protein profile in vascular wall of atherosclerotic mice analyzed ex vivo using FT-IR spectroscopy. Spectrochim. Acta A 2012, 96, 940–945. [Google Scholar] [CrossRef]
- Lattermann, A.; Matthaus, C.; Bergner, N.; Beleites, C.; Romeike, B.F.; Krafft, C.; Brehm, B.R.; Popp, J. Characterization of atherosclerotic plaque depositions by Raman and FTIR imaging. J. Biophotonics 2013, 6, 110–121. [Google Scholar] [CrossRef]
- Czamara, K.; Majzner, K.; Pilarczyk, M.; Kochan, K.; Kaczor, A.; Baranska, M. Raman spectroscopy of lipids: A review. J. Raman Spectrosc. 2015, 46, 4–20. [Google Scholar] [CrossRef]
- Rygula, A.; Pacia, M.Z.; Mateuszuk, L.; Kaczor, A.; Kostogrys, R.B.; Chlopicki, S.; Baranska, M. Identification of a biochemical marker for endothelial dysfunction using Raman spectroscopy. Analyst 2015, 140, 2185–2189. [Google Scholar] [CrossRef] [PubMed]
- Matthäus, C.; Bird, B.; Miljković, M.; Chernenko, T.; Romeo, M.; Diem, M. Chapter 10 infrared and raman microscopy in cell biology. In Methods in Cell Biology; Elsevier: Amsterdam, NY, USA, 2008; Volume 89. [Google Scholar]
- Clemens, G.; Hands, J.R.; Dorling, K.M.; Baker, M.J. Vibrational spectroscopic methods for cytology and cellular research. Analyst 2014, 139, 4411–4444. [Google Scholar] [CrossRef] [PubMed]
- Dogan Mollaoglu, A.; Ozyurt, I.; Severcan, F. Applications of infrared spectroscopy and microscopy in diagnosis of obesity. In Infrared Spectroscopy—Principles, Advances, and Applications; El-Azazy, M., Ed.; IntechOpen: London, UK, 2019. [Google Scholar]
- Farhane, Z.; Bonnier, F.; Casey, A.; Byrne, H.J. Raman micro spectroscopy for in vitro drug screening: Subcellular localisation and interactions of doxorubicin. Analyst 2015, 140, 4212–4223. [Google Scholar] [CrossRef] [PubMed]
- Jamin, N.; Dumas, P.; Moncuit, J.; Fridman, W.H.; Teillaud, J.L.; Carr, G.L.; Williams, G.P. Highly resolved chemical imaging of living cells by using synchrotron infrared microspectrometry. Proc. Natl. Acad. Sci. USA 1998, 95, 4837–4840. [Google Scholar] [CrossRef] [Green Version]
- Miller, L.M.; Smith, G.D.; Carr, G.L. Synchrotron-based Biological Microspectroscopy: From the Mid-Infrared through the Far-Infrared Regimes. J. Biol. Phys. 2003, 29, 219–230. [Google Scholar] [CrossRef] [PubMed]
- Gazi, E.; Dwyer, J.; Gardner, P.; Ghanbari-Siahkali, A.; Wade, A.P.; Miyan, J.; Lockyer, N.P.; Vickerman, J.C.; Clarke, N.W.; Shanks, J.H.; et al. Applications of Fourier transform infrared microspectroscopy in studies of benign prostate and prostate cancer. A pilot study. J. Pathol. 2003, 201, 99–108. [Google Scholar] [CrossRef]
- Schubert, J.M.; Bird, B.; Papamarkakis, K.; Miljković, M.; Bedrossian, K.; Laver, N.; Diem, M. Spectral cytopathology of cervical samples: Detecting cellular abnormalities in cytologically normal cells. Lab. Invest. 2010, 90, 1068–1077. [Google Scholar] [CrossRef]
- Kyriakidou, M.; Anastassopoulou, J.; Tsakiris, A.; Koui, M.; Theophanides, T. FT-IR spectroscopy study in early diagnosis of skin cancer. In Vivo 2017, 31, 1131–1137. [Google Scholar] [CrossRef]
- Hashimoto, K.; Kudoh, S.N.; Sato, H. Analysis of the developing neural system using an in vitro model by Raman spectroscopy. Analyst 2015, 140, 2344–2349. [Google Scholar] [CrossRef]
- Hashimoto, K.; Andriana, B.B.; Matsuyoshi, H.; Sato, H. Discrimination analysis of excitatory and inhibitory neurons using Raman spectroscopy. Analyst 2018, 143, 2889–2894. [Google Scholar] [CrossRef] [PubMed]
- Oshima, Y.; Shinzawa, H.; Takenaka, T.; Furihata, C.; Sato, H. Discrimination analysis of human lung cancer cells associated with histological type and malignancy using Raman spectroscopy. J. Biomed. Opt. 2010, 15, 017009. [Google Scholar] [CrossRef] [PubMed]
- Talari, A.C.S.; Evans, C.A.; Holen, I.; Coleman, R.E.; Ihtesham Ur Rehmana. Raman spectroscopic analysis differentiates between breast cancer cell lines. J. Raman Spectrosc. 2015, 46, 421–427. [Google Scholar] [CrossRef]
- Chaturvedi, D.; Balaji, S.; Bn, V.; Ariese, F.; Umapathy, S.; Rangarajan, A. Different phases of breast cancer cells: Raman study of immortalized, transformed, and invasive cells. Biosensors 2016, 6, 57. [Google Scholar] [CrossRef] [PubMed]
- Lee, S.H.; Kim, O.K.; Lee, S.; Kim, J.K. Local-dependency of morphological and optical properties between breast cancer cell lines. Spectrochim. Acta A 2018, 205, 132–138. [Google Scholar] [CrossRef] [PubMed]
- Batista de Carvalho, A.L.M.; Pilling, M.; Gardner, P.; Doherty, J.; Cinque, G.; Wehbe, K.; Kelley, C.; Batista de Carvalho, L.A.E.; Marques, M.P.M. Chemotherapeutic response to cisplatin-like drugs in human breast cancer cells probed by vibrational microspectroscopy. Faraday Discuss. 2016, 187, 273–298. [Google Scholar] [CrossRef] [Green Version]
- Denbigh, J.L.; Perez-Guaita, D.; Vernooij, R.R.; Tobin, M.J.; Bambery, K.R.; Xu, Y.; Southam, A.D.; Khanim, F.L.; Drayson, M.T.; Lockyer, N.P.; et al. Probing the action of a novel anti-leukaemic drug therapy at the single cell level using modern vibrational spectroscopy techniques. Sci. Rep. 2017, 7. [Google Scholar] [CrossRef]
- Surmacki, J.M.; Woodhams, B.J.; Haslehurst, A.; Ponder, B.A.J.; Bohndiek, S.E. Raman micro-spectroscopy for accurate identification of primary human bronchial epithelial cells. Sci. Rep. 2018, 8. [Google Scholar] [CrossRef]
- Chan, J.W.; Lieu, D.K.; Huser, T.; Li, R.A. Label-free separation of human embryonic stem cells and their cardiac derivatives using Raman spectroscopy. Anal. Chem. 2009, 81, 1324–1331. [Google Scholar] [CrossRef]
- Tan, Y.; Konorov, S.O.; Schulze, H.G.; Piret, J.M.; Blades, M.W.; Turner, R.F.B. Comparative study using Raman microspectroscopy reveals spectral signatures of human induced pluripotent cells more closely resemble those from human embryonic stem cells than those from differentiated cells. Analyst 2012, 137, 4509–4515. [Google Scholar] [CrossRef]
- Giesbertz, P.; Daniel, H. Branched-chain amino acids as biomarkers in diabetes. Curr. Opin. Clin. Nutr. 2016, 19, 48–54. [Google Scholar] [CrossRef] [PubMed]
- Chen, X.; Yang, W. Branched-chain amino acids and the association with type 2 diabetes. J. Diabetes Invest. 2015, 6, 363–370. [Google Scholar] [CrossRef] [PubMed]
- Yamakado, M.; Nagao, K.; Imaizumi, A.; Tani, M.; Toda, A.; Tanaka, T.; Jinzu, H.; Miyano, H.; Yamamoto, H.; Daimon, T.; et al. Plasma free amino acid profiles predict four-year risk of developing diabetes, metabolic syndrome, dyslipidemia, and hypertension in Japanese population. Sci. Rep. 2015, 5, 11918. [Google Scholar] [CrossRef] [PubMed]
- Birech, Z.; Mwangi, P.W.; Bukachi, F.; Mandela, K.M. Application of Raman spectroscopy in type 2 diabetes screening in blood using leucine and isoleucine amino-acids as biomarkers and in comparative anti-diabetic drugs efficacy studies. PLoS ONE 2017, 12, e0185130. [Google Scholar] [CrossRef] [PubMed]
- Zhu, G.Y.; Zhu, X.; Fan, Q.; Wan, X.L. Raman spectra of amino acids and their aqueous solutions. Spectrochim. Acta A 2011, 78, 1187–1195. [Google Scholar] [CrossRef] [PubMed]
- Shao, J.; Lin, M.; Li, Y.; Li, X.; Liu, J.; Liang, J.; Yao, H. In Vivo blood glucose quantification using Raman spectroscopy. PLoS ONE 2012, 7, 1–6. [Google Scholar] [CrossRef] [PubMed]
- Silveira, L.; Borges, R.F.; Navarro, R.S.; Giana, H.E.; ZaÃngaro, R.A.; Pacheco, M.T.T.; Fernandes, A.B. Quantifying glucose and lipid components in human serum by Raman spectroscopy and multivariate statistics. Lasers Med. Sci. 2017, 1–9. [Google Scholar] [CrossRef] [PubMed]
- Almeida, F.M.; Freire, P.T.C.; Lima, R.J.C.; RemeÂdios, C.M.R.; Mendes, J.F.; Melo, F.E.A. Raman spectra of L-isoleucine crystals. J. Raman Spectrosc. 2006, 37, 1296–1301. [Google Scholar] [CrossRef]
- Zhou, G.; Yu, D.; Li, S.; Yang, D. Surface enhanced Raman spectroscopy of leucine and isoleucine. Acta Chim. Sin. 2007, 65, 640. [Google Scholar] [CrossRef]
- Jenkinsa, A.L.; Larsena, R.A.; Williams, T.B. Characterization of amino acids using Raman spectroscopy. Spectrochim. Acta A 2005, 61, 1585–1594. [Google Scholar] [CrossRef]
- Baloglu, F.K.; Severcan, F. Characterization and differentiation of adipose tissue by spectroscopic and spectral imaging techniques. In Adipose Tissue; Szablewski, L., Ed.; InTechOpen: London, UK, 2018. [Google Scholar] [CrossRef]
- Movasaghi, Z.; Rehman, S.; ur Rehman, D.I. Fourier transform infrared (FTIR) spectroscopy of biological tissues. Appl. Spectrosc. Rev. 2008, 43, 134–179. [Google Scholar] [CrossRef]
- Dogan, A.; Lasch, P.; Neuschl, C.; Millrose, M.K.; Alberts, R.; Schughart, K.; Naumann, D.; Brockmann, G.A. ATR-FTIR spectroscopy reveals genomic loci regulating the tissue response in high fat diet fed BXD recombinant inbred mouse strains. BMC Genomics 2013, 14, 386. [Google Scholar] [CrossRef] [PubMed]
- Faghihzadeh, F.; Anaya, N.M.; Schifman, L.A.; Oyanedel-Craver, V. Fourier transform infrared spectroscopy to assess molecular-level changes in microorganisms exposed to nanoparticles. Nanotechnol. Environ. Eng. 2016, 1, 1. [Google Scholar] [CrossRef]
- Severcan, F.; Sahin, I.; Kazancı, N. Melatonin strongly interacts with zwitterionic model membranes-evidence from Fourier transform infrared spectroscopy and differential scanning calorimetry. BBA-Biomembranes 2005, 1668, 215–222. [Google Scholar] [CrossRef] [PubMed]
- Severcan, F.; Bozkurt, O.; Gurbanov, R.; Gorgulu, G. FT-IR spectroscopy in diagnosis of diabetes in rat animal model. J. Biophoton. 2010, 3, 621–631. [Google Scholar] [CrossRef] [PubMed]
- World Cancer Day 2019. International Agency for Research on Cancer Press release no. 264/4 February 2019. Available online: https://www.worldcancerday.org/sites/default/files/2019-02/WCD%2029012019Vfinal.pdf (accessed on 1 June 2019).
- Theophilou, G.; Paraskevaidi, M.; Lima, K.M.; Kyrgiou, M.; Martin-Hirsch, P.L.; Martin, F.L. Synchrotron- and focal plane array-based Fourier-transform infrared spectroscopy differentiates the Basalis and Functionalis epithelial endometrial regions and identifies putative stem cell regions of human endometrial glands. Expert Rev. Mol. Diagn. 2015, 15, 693–713. [Google Scholar] [CrossRef] [PubMed]
- Wood, B.R.; Chiriboga, L.; Yee, H.; Quinn, M.A.; McNaughton, D.; Diem, M. Fourier transform infrared (FTIR) spectral mapping of the cervical transformation zone, and dysplastic squamous epithelium. Gynecol. Oncol. 2004, 93, 59–68. [Google Scholar] [CrossRef] [Green Version]
- Romeo, M.; Matthäus, C.; Miljkovic, M.; Diem, M. Infrared microspectroscopy of individual human cervical cancer (HeLa) cells: IR Microspectroscopy of Dried Cancer Cells. Biopolymers 2004, 74, 168–171. [Google Scholar] [CrossRef]
- Neves, A.C.O.; Silva, P.P.; Morais, C.L.M.; Miranda, C.G.; Crispim, J.C.O.; Lima, K.M.G. ATR-FTIR and multivariate analysis as a screening tool for cervical cancer in women from northeast Brazil: A biospectroscopic approach. RSC Adv. 2016, 6, 99648–99655. [Google Scholar] [CrossRef]
- Lima, K.M.G.; Gajjar, K.B.; Martin-Hirsch, P.L.; Martin, F.L. Segregation of ovarian cancer stage exploiting spectral biomarkers derived from blood plasma or serum analysis: ATR-FTIR spectroscopy coupled with variable selection methods. Biotechnol. Progr. 2015, 31, 832–839. [Google Scholar] [CrossRef]
- Wood, B.R.; Kiupel, M.; McNaughton, D. Progress in Fourier Transform Infrared Spectroscopic Imaging Applied to Venereal Cancer Diagnosis. Vet. Pathol. 2014, 51, 224–237. [Google Scholar] [CrossRef]
- Wong, P.T.; Wong, R.K.; Caputo, T.A.; Godwin, T.A.; Rigas, B. Infrared spectroscopy of exfoliated human cervical cells: Evidence of extensive structural changes during carcinogenesis. P. Natl. Acad. Sci. USA. 1991, 88, 10988–10992. [Google Scholar] [CrossRef] [PubMed]
- Morris, B.J.; Lee, C.; Nightingale, B.N.; Molodysky, E.; Morris, L.J.; Appio, R.; Sternhell, S.; Cardona, M.; Mackerras, D.; Irwig, L.M. Fourier transform infrared spectroscopy of dysplastic, papillomavirus-positive cervicovaginal lavage specimens. Gynecol. Oncol. 1995, 56, 245–249. [Google Scholar] [CrossRef] [PubMed]
- Wood, B.R.; Burden, F.; Quinn, M.A.; McNaughton, D. An investigation into FTIR spectroscopy as a biodiagnostic tool for cervical cancer. Biospectroscopy 1996, 2, 143–153. [Google Scholar] [CrossRef]
- Dusková, J. False negative PAP test? Cytopathologist as a member of expert group in case of late diagnosis of cervical cancer. Cesk Patol. 2010, 46, 62–64. [Google Scholar] [PubMed]
- Diem, M.; Lee, O.; Roberts, G.M. Vibrational studies, normal-coordinate analysis, and infrared VCD of alanylalanine in the amide III spectral region. J. Phys. Chem. 1992, 96, 548–554. [Google Scholar] [CrossRef]
- Whelan, D.R.; Bambery, K.R.; Heraud, P.; Tobin, M.J.; Diem, M.; McNaughton, D.; Wood, B.R. Monitoring the reversible B to A-like transition of DNA in eukaryotic cells using Fourier transform infrared spectroscopy. Nucleic Acids Res. 2011, 39, 5439–5448. [Google Scholar] [CrossRef] [Green Version]
- Mohlenhoff, B.; Romeo, M.; Diem, M.; Wood, B.R. Mie-Type Scattering and Non-Beer-Lambert Absorption Behavior of Human Cells in Infrared Microspectroscopy. Biophys. J. 2005, 88, 3635–3640. [Google Scholar] [CrossRef] [Green Version]
- Whelan, D.R.; Bambery, K.R.; Puskar, L.; McNaughton, D.; Wood, B.R. Quantification of DNA in simple eukaryotic cells using Fourier transform infrared spectroscopy. J. Biophotonics 2013, 6, 775–784. [Google Scholar] [CrossRef]
- Bassan, P.; Byrne, H.J.; Bonnier, F.; Lee, J.; Dumas, P.; Gardner, P. Resonant Mie scattering in infrared spectroscopy of biological materials – understanding the ‘dispersion artefact’. Analyst 2009, 134, 1586. [Google Scholar] [CrossRef]
- Bassan, P.; Kohler, A.; Martens, H.; Lee, J.; Jackson, E.; Lockyer, N.; Dumas, P.; Brown, M.; Clarke, N.; Gardner, P. RMieS-EMSC correction for infrared spectra of biological cells: Extension using full Mie theory and GPU computing. J. Biophoton. 2010, 3, 609–620. [Google Scholar] [CrossRef] [PubMed]
- Chakraborty, D.; Natarajan, C.; Mukherjee, A. Advances in oral cancer detection. In Advances in Clinical Chemistry; Elsevier: Amsterdam, NY, USA, 2019; Volume 91, pp. 181–200. ISBN 978-0-12-817471-5. [Google Scholar]
- Eskiizmir, G.; Ermertcan, A.T.; Yapici, K. Nanomaterials: Promising structures for the management of oral cancer. In Nanostructures for Oral Medicine; Elsevier: Amsterdam, NY, USA, 2017; pp. 511–544. ISBN 978-0-323-47720-8. [Google Scholar]
- Rai, V.; Mukherjee, R.; Ghosh, A.K.; Routray, A.; Chakraborty, C. “Omics” in oral cancer: New approaches for biomarker discovery. Arch. Oral Biol. 2018, 87, 15–34. [Google Scholar] [CrossRef] [PubMed]
- Sahu, A.; Krishna, C.M. Optical diagnostics in oral cancer: An update on Raman spectroscopic applications. J. Cancer Res. Ther. 2017, 13, 908–915. [Google Scholar] [CrossRef] [PubMed]
- Bakker Schut, T.C.; Witjes, M.J.H.; Sterenborg, H.J.C.M.; Speelman, O.C.; Roodenburg, J.L.N.; Marple, E.T.; Bruining, H.A.; Puppels, G.J. In Vivo Detection of Dysplastic Tissue by Raman Spectroscopy. Anal. Chem. 2000, 72, 6010–6018. [Google Scholar] [CrossRef] [PubMed]
- Venkatakrishna, K.; Kurien, J.; Pai, M.; Valiathan, M.; Kumar, N.; Murali, C.; Ullas, G.; Kartha, V. Optical pathology of oral tissue: A Raman spectroscopy diagnostic method. Curr Sci 2001, 80, 665–669. [Google Scholar]
- Guze, K.; Short, M.; Sonis, S.; Karimbux, N.; Chan, J.; Zeng, H. Parameters defining the potential applicability of Raman spectroscopy as a diagnostic tool for oral disease. J. Biomed. Opt. 2009, 14, 014016. [Google Scholar] [CrossRef] [PubMed]
- Li, Q.B.; Xu, Z.; Zhang, N.W.; Zhang, L.; Wang, F.; Yang, L.M.; Wang, J.S.; Zhou, S.; Zhang, Y.F.; Zhou, X.S.; et al. In vivo and in situ detection of colorectal cancer using Fourier transform infrared spectroscopy. WJG 2005, 11, 327. [Google Scholar] [CrossRef] [PubMed]
- Naurecka, M.L.; Sierakowski, B.M.; Kasprzycka, W.; Dojs, A.; Dojs, M.; Suszyński, Z.; Kwaśny, M. FTIR-ATR and FT-Raman Spectroscopy for Biochemical Changes in Oral Tissue. AJAC 2017, 8, 180–188. [Google Scholar] [CrossRef] [Green Version]
- Adeeba Siddiqui, A.J.; Sherazi, S.T.H.; Ahmed, S.; Iqbal Choudhary, M.; Atta-ur-Rahman; Musharraf, S.G. A comparative profiling of oral cancer patients and high risk niswar users using FT-IR and chemometric analysis. Spectrochim. Acta A 2018, 203, 177–184. [Google Scholar] [CrossRef] [PubMed]
- Grabovac, I.; Smith, L.; Jackson, S.E.; Yang, L. Gastrointestinal Cancer. In Reference Module in Biomedical Sciences; Elsevier: Amsterdam, NY, USA, 2019; ISBN 978-0-12-801238-3. [Google Scholar] [CrossRef]
- Widjaja, E.; Zheng, W.; Huang, Z. Classification of colonic tissues using near-infrared Raman spectroscopy and support vector machines. Int. J. Oncol. 2008, 32, 653–662. [Google Scholar] [CrossRef] [Green Version]
- Mehta, A.; Patel, B.M. Therapeutic opportunities in colon cancer: Focus on phosphodiesterase inhibitors. Life Sci. 2019, 230, 150–161. [Google Scholar] [CrossRef]
- Villalobos, C.; Hernández-Morales, M.; Gutiérrez, L.G.; Núñez, L. TRPC1 and ORAI1 channels in colon cancer. Cell Calcium 2019, 81, 59–66. [Google Scholar] [CrossRef] [PubMed]
- Dong, L.; Sun, X.; Chao, Z.; Zhang, S.; Zheng, J.; Gurung, R.; Du, J.; Shi, J.; Xu, Y.; Zhang, Y.; et al. Evaluation of FTIR spectroscopy as diagnostic tool for colorectal cancer using spectral analysis. Spectrochim. Acta A 2014, 122, 288–294. [Google Scholar] [CrossRef] [PubMed]
- Li, Q.B. Diagnosis of Gastric Inflammation and Malignancy in Endoscopic Biopsies Based on Fourier Transform Infrared Spectroscopy. Clin. Chem. 2005, 51, 346–350. [Google Scholar] [CrossRef] [PubMed] [Green Version]
- Li, Q.B.; Sun, X.J.; Xu, Y.Z.; Yang, L.M.; Zhang, Y.F.; Weng, S.F.; Shi, J.S.; Wu, J.G. Use of Fourier-transform infrared spectroscopy to rapidly diagnose gastric endoscopic biopsies. WJG 2005, 11, 3842–3845. [Google Scholar] [CrossRef] [PubMed] [Green Version]
- Jiang, F.; Hong, F.; Shah, M.W.; Shen, X. Circular RNAs as diagnostic biomarkers in gastric cancer: A meta-analysis review. Pathol. Res. Pract. 2019, 215, 152419. [Google Scholar] [CrossRef] [PubMed]
- Tao, J.; Jiang, L.; Chen, X. Roles of microRNA in liver cancer. Liver Res. 2018, 2, 61–72. [Google Scholar] [CrossRef]
- Zhang, K.; Hao, C.; Man, B.; Zhang, C.; Yang, C.; Liu, M.; Peng, Q.; Chen, C. Diagnosis of liver cancer based on tissue slice surface enhanced Raman spectroscopy and multivariate analysis. Vib. Spectrosc. 2018, 98, 82–87. [Google Scholar] [CrossRef]
- Cojocaru, F.D.; Balan, V.; Popa, I.M.; Munteanu, A.; Anghelache, A.; Verestiuc, L. Magnetic Composite Scaffolds for Potential Applications in Radiochemotherapy of Malignant Bone Tumors. Medicina 2019, 55, 153. [Google Scholar] [CrossRef]
- Chaber, R.; Łach, K.; Depciuch, J.; Szmuc, K.; Michalak, E.; Raciborska, A.; Koziorowska, A.; Cebulski, J. Fourier Transform Infrared (FTIR) spectroscopy of paraffin and deparafinnized bone tissue samples as a diagnostic tool for Ewing sarcoma of bones. Infrared Phys. Techn. 2017, 85, 364–371. [Google Scholar] [CrossRef]
- Liu, C.H.; Zhou, Y.; Sun, Y.; Li, J.Y.; Zhou, L.X.; Boydston-White, S.; Masilamani, V.; Zhu, K.; Pu, Y.; Alfano, R.R. Resonance raman and raman spectroscopy for breast cancer detection. Technol. Cancer Res. T. 2013, 12. [Google Scholar] [CrossRef] [PubMed]
- Nicolson, F.; Jamieson, L.E.; Mabbott, S.; Plakas, K. Through tissue imaging of a live breast cancer tumour model using handheld surface enhanced spatially offset resonance Raman spectroscopy (SESORRS). Chem. Sci. 2018, 9, 3788–3792. [Google Scholar] [CrossRef] [PubMed] [Green Version]
- Surmacki, J.; Musial, J.; Kordek, R.; Abramczyk, H. Raman imaging at biological interfaces: Applications in breast cancer diagnosis. Mol. Cancer 2013, 12, 48. [Google Scholar] [CrossRef] [PubMed]
- Zawlik, I.; Kaznowska, E.; Cebulski, J.; Kolodziej, M.; Depciuch, J.; Vongsvivut, J.; Cholewa, M. FPA-FTIR microspectroscopy for monitoring chemotherapy efficacy in triple-negative breast cancer. Sci. Rep. 2016, 6, 37333. [Google Scholar] [CrossRef] [PubMed]
- Dorling, K.M.; Baker, M.J. Rapid FTIR chemical imaging: Highlighting FPA detectors. Trends Biotechnol. 2013, 31, 437–438. [Google Scholar] [CrossRef] [PubMed]
- Bronchud, M.H.; Foote, M.; Giaccone, G.; Olopade, O.I.; Workman, P. Principles of Molecular Oncology; Humana Press: Totowa, NJ, USA, 2004; ISBN 978-1-4757-6276-1. [Google Scholar]
- Eikje, N.S.; Aizawa, K.; Ozaki, Y. Vibrational spectroscopy for molecular characterisation and diagnosis of benign, premalignant and malignant skin tumours. Biotechnol Annu Rev. 2005, 11, 191–225. [Google Scholar] [CrossRef]
- Peñaranda, F.; Naranjo, V.; Lloyd, G.R.; Kastl, L.; Kemper, B.; Schnekenburger, J.; Nallala, J.; Stone, N. Discrimination of skin cancer cells using Fourier transform infrared spectroscopy. Comput. Biol. Med. 2018, 100, 50–61. [Google Scholar] [CrossRef] [PubMed]
- Holman, H.Y.; Martin, M.C.; Blakely, E.A.; Bjornstad, K.; McKinney, W.R. IR spectroscopic characteristics of cell cycle and cell death probed by synchrotron radiation based Fourier transform IR spectromicroscopy. Biopolymers 2000, 57, 329–335. [Google Scholar] [CrossRef]
- Whelan, D.R.; Bambery, K.R.; Puskar, L.; McNaughton, D.; Wood, B.R. Synchrotron Fourier transform infrared (FTIR) analysis of single living cells progressing through the cell cycle. Analyst 2013, 138, 3891. [Google Scholar] [CrossRef]
- Skrebova, N.; Aizawa, K.; Ozaki, Y.; Arase, S. A method for observation of benign, premalignant and malignant changes in clinical skin tissue samples via FT-IR microspectroscopy. J. Photosci. 2002, 9, 457–459. [Google Scholar]
- McIntosh, L.M.; Jackson, M.; Mantsch, H.H.; Stranc, M.F.; Pilavdzic, D.; Crowson, A.N. Infrared Spectra of Basal Cell Carcinomas are Distinct from Non-Tumor-Bearing Skin Components. J. Invest. Dermatol. 1999, 112, 951–956. [Google Scholar] [CrossRef] [PubMed]
- Coroaba, A.; Pinteala, T.; Chiriac, A.; Chiriac, A.E.; Simionescu, B.C.; Pinteala, M. Degradation Mechanism Induced by Psoriasis in Human Fingernails: A Different Approach. J. Invest. Dermatol. 2016, 136, 311–313. [Google Scholar] [CrossRef] [PubMed] [Green Version]
- Gniadecka, M.; Philipsen, P.A.; Mortensen, N. Diagnosis of basal cell carcinoma by Raman spectroscopy. J Raman Spectrosc. 1997, 28, 125–129. [Google Scholar] [CrossRef]
- Gniadecka, M.; Philipsen, P.A.; Wessel, S.; Gniadecki, R.; Wulf, H.C.; Sigurdsson, S.; Nielsen, O.F.; Christensen, D.H.; Hercogova, J.; Rossen, K.; et al. Melanoma diagnosis by Raman spectroscopy and neural networks: Structure alterations in proteins and lipids in intact cancer tissue. J. Invest. Dermatol. 2004, 122, 443–449. [Google Scholar] [CrossRef] [PubMed]
- Gniadecka, M.; Wulf, H.C.; Nielsen, O.F.; Christensen, D.H.; Hercogova, J. Distinctive molecular abnormalities in benign and malignant skin lesions: Studies by Raman spectroscopy. Photochem. Photobiol. 1997, 66, 418–423. [Google Scholar] [CrossRef] [PubMed]
- Skrebova, N.; Aizawa, K.; Ozaki, Y.; Arase, S. Data processing and analysis of benign, premalignant, and malignant changes in skin tissue samples using FT-IR microspectroscopy. In Proceedings Volume 5047, Smart Nondestructive Evaluation and Health Monitoring of Structural and Biological Systems II; Society of Photo-Optical Instrumentation Engineers (SPIE): San Diego, CA, USA, 2003; p. 378. [Google Scholar] [CrossRef]
- Feigin, V.L.; Nichols, E.; Alam, T.; Bannick, M.S.; Beghi, E.; Blake, N.; Culpepper, W.J.; Dorsey, E.R.; Elbaz, A.; Ellenbogen, R.G.; et al. Global, regional, and national burden of neurological disorders, 1990–2016: A systematic analysis for the Global Burden of Disease Study 2016. Lancet Neurol 2019, 18, 459–480. [Google Scholar] [CrossRef]
- Feigin, V.L.; Vos, T. Global burden of neurological disorders: From global burden of disease estimates to actions. Neuroepidemiology 2019, 52, 1–2. [Google Scholar] [CrossRef] [PubMed]
- Wetzel, D.L.; LeVine, S.M. In situ FT-IR microspectroscopy and mapping of normal brain tissue. Spectroscopy 1993, 8, 40–45. [Google Scholar]
- LeVine, S.M.; Wetzel, D.L.; Eilert, A.J. Neuropathology of twitcher mice: Examination by histochemistry, immunohistochemistry, lectin histochemistry and Fourier transform infrared microspectroscopy. Int. J. Dev. Neurosci. 1994, 12, 275–288. [Google Scholar] [CrossRef]
- Jack, C.R.; Albert, M.S.; Knopman, D.S.; McKhann, G.M.; Sperling, R.A.; Carrillo, M.C.; Thies, B.; Phelps, C.H. Introduction to the recommendations from the National Institute on Aging-Alzheimer’s Association workgroups on diagnostic guidelines for Alzheimer’s disease. Alzheimers Dement. 2011, 7, 257–262. [Google Scholar] [CrossRef]
- Choo, L.P.; Wetzel, D.L.; Halliday, W.C.; Jackson, M.; LeVine, S.M.; Mantsch, H.H. In situ characterization of beta-amyloid in Alzheimer’s diseased tissue by synchrotron Fourier transform infrared microspectroscopy. Biophys. J. 1996, 71, 1672–1679. [Google Scholar] [CrossRef]
- Miller, L.M.; Wang, Q.; Telivala, T.P.; Smith, R.J.; Lanzirotti, A.; Miklossy, J. Synchrotron-based infrared and X-ray imaging shows focalized accumulation of Cu and Zn co-localized with β-amyloid deposits in Alzheimer’s disease. J. Struct. Biol. 2006, 155, 30–37. [Google Scholar] [CrossRef]
- Miklossy, J.; Kis, A.; Radenovic, A.; Miller, L.; Forro, L.; Martins, R.; Reiss, K.; Darbinian, N.; Darekar, P.; Mihaly, L. Beta-amyloid deposition and Alzheimer’s type changes induced by Borrelia spirochetes. Neurobiol. Aging 2006, 27, 228–236. [Google Scholar] [CrossRef]
- Rak, M.; Del Bigio, M.R.; Mai, S.; Westaway, D.; Gough, K. Dense-core and diffuse Aβ plaques in TgCRND8 mice studied with synchrotron FTIR microspectroscopy. Biopolymers 2007, 87, 207–217. [Google Scholar] [CrossRef]
- Tolosa, E.; Wenning, G.; Poewe, W. The diagnosis of Parkinson’s disease. Lancet Neurol. 2006, 5, 75–86. [Google Scholar] [CrossRef]
- Szczerbowska-Boruchowska, M.; Dumas, P.; Kastyak, M.Z.; Chwiej, J.; Lankosz, M.; Adamek, D.; Krygowska-Wajs, A. Biomolecular investigation of human substantia nigra in Parkinson’s disease by synchrotron radiation Fourier transform infrared microspectroscopy. Arch. Biochem. Biophys. 2007, 459, 241–248. [Google Scholar] [CrossRef]
- Heraud, P.; Caine, S.; Campanale, N.; Karnezis, T.; McNaughton, D.; Wood, B.R.; Tobin, M.J.; Bernard, C.C.A. Early detection of the chemical changes occurring during the induction and prevention of autoimmune-mediated demyelination detected by FT-IR imaging. NeuroImage 2010, 49, 1180–1189. [Google Scholar] [CrossRef]
- Ontaneda, D.; Hyland, M.; Cohen, J.A. Multiple Sclerosis: New Insights in Pathogenesis and Novel Therapeutics. Annu. Rev. Med. 2012, 63, 389–404. [Google Scholar] [CrossRef]
- Yonar, D.; Ocek, L.; Tiftikcioglu, B.I.; Zorlu, Y.; Severcan, F. Relapsing-Remitting Multiple Sclerosis diagnosis from cerebrospinal fluids via Fourier transform infrared spectroscopy coupled with multivariate analysis. Sci. Rep. 2018, 8, 1025. [Google Scholar] [CrossRef]
- Surowka, A.D.; Adamek, D.; Radwanska, E.; Szczerbowska-Boruchowska, M. Variability of protein and lipid composition of human subtantia nigra in aging: Fourier transform infrared microspectroscopy study. Neurochem. Int. 2014, 76, 12–22. [Google Scholar] [CrossRef]
- Socrates, G. Infrared and Raman Characteristic Group Frequencies: Tables and Charts, 3rd ed.; Wiley: Chichester, UK, 2010; ISBN 978-0-470-09307-8. [Google Scholar]
- Amharref, N.; Beljebbar, A.; Dukic, S.; Venteo, L.; Schneider, L.; Pluot, M.; Vistelle, R.; Manfait, M. Brain tissue characterisation by infrared imaging in a rat glioma model. BBA-Biomembranes 2006, 1758, 892–899. [Google Scholar] [CrossRef] [Green Version]
- Krafft, C.; Kirsch, M.; Beleites, C.; Schackert, G.; Salzer, R. Methodology for fiber-optic Raman mapping and FTIR imaging of metastases in mouse brains. Anal Bioanal. Chem. 2007, 389, 1133–1142. [Google Scholar] [CrossRef]
- Surewicz, W.K.; Moscarello, M.A.; Mantsch, H.H. Fourier transform infrared spectroscopic investigation of the interaction between myelin basic protein and dimyristoylphosphatidylglycerol bilayers. Biochemistry 1987, 26, 3881–3886. [Google Scholar] [CrossRef]
- Ruiz-Sanz, J.; Ruiz-Cabello, J.; Mateo, P.L.; Cortijo, M. The thermal transition in crude myelin proteolipid has a lipid rather than protein origin. Eur. Biophys. J. 1992, 21. [Google Scholar] [CrossRef]
- Diem, M.; Chalmers, J.M.; Griffiths, P.R. Vibrational Spectroscopy for Medical Diagnosis; John Wiley & Sons: Chichester, UK; Hoboken, NJ, USA, 2008; ISBN 978-0-470-01214-7. [Google Scholar]
- Boydston-White, S.; Gopen, T.; Houser, S.; Bargonetti, J.; Diem, M. Infrared spectroscopy of human tissue. V. Infrared spectroscopic studies of myeloid leukemia (ML-1) cells at different phases of the cell cycle. Biospectroscopy 1999, 5, 219–227. [Google Scholar] [CrossRef]
- Zhizhina, G.P.; Oleinik, E.F. Infrared Spectroscopy of Nucleic Acids. Russ. Chem. Rev. 1972, 41, 258–280. [Google Scholar] [CrossRef]
- Ogruc Ildiz, G.; Arslan, M.; Unsalan, O.; Araujo-Andrade, C.; Kurt, E.; Karatepe, H.T.; Yilmaz, A.; Yalcinkaya, O.B.; Herken, H. FT-IR spectroscopy and multivariate analysis as an auxiliary tool for diagnosis of mental disorders: Bipolar and schizophrenia cases. Spectrochim. Acta A 2016, 152, 551–556. [Google Scholar] [CrossRef]
- Pahlow, S.; Weber, K.; Popp, J.; Wood, B.R.; Kochan, K.; Rüther, A.; Perez-Guaita, D.; Heraud, P.; Stone, N.; Dudgeon, A.; et al. Application of Vibrational Spectroscopy and Imaging to Point-of-Care Medicine: A Review. Appl. Spectrosc. 2018, 72, 52–84. [Google Scholar] [CrossRef]
- Jermyn, M.; Mok, K.; Mercier, J.; Desroches, J.; Pichette, J.; Saint-Arnaud, K.; Bernstein, L.; Guiot, M.C.; Petrecca, K.; Leblond, F. Intraoperative brain cancer detection with Raman spectroscopy in humans. Sci. Transl. Med. 2015, 2015. 7, 274ra19. [Google Scholar] [CrossRef]
- Lakomkin, N.; Hadjipanayis, C.G. The use of spectroscopy handheld tools in brain tumor surgery: Current evidence and techniques. Front Surg. 2019, 6, 30. [Google Scholar] [CrossRef]
- Lin, H.; Deng, K.; Zhang, J.; Wang, L.; Zhang, Z.; Luo, Y.; Sun, Q.; Li, Z.; Chen, Y.; Wang, Z.; et al. Biochemical detection of fatal hypothermia and hyperthermia in affected rat hypothalamus tissues by Fourier transform infrared spectroscopy. Biosci. Rep. 2019, 39, BSR20181633. [Google Scholar] [CrossRef]
- Christensen, D.; Rüther, A.; Kochan, K.; Pérez-Guaita, D.; Wood, B. Whole-Organism Analysis by Vibrational Spectroscopy. Annu. Rev. Anal. Chem. 2019, 12, 89–108. [Google Scholar] [CrossRef]
- Siebert, F.; Hildebrandt, P. Vibrational Spectroscopy in Life Science; Wiley-VCH Verlag GmbH & Co. KGaA: Weinheim, Germany, 2008. [Google Scholar]


| Raman Peak, cm−1 | Assignment | Observations | FTIR Peak, cm−1 | Assignment | Observations |
|---|---|---|---|---|---|
| 2885, 1674 | C–H stretching and bending | Cholesteryl esters and cholesterol [81,82] | 3500, 3100 | Amide A, B | Proteins [79,80] |
| 1740 | C=O stretching | 3005 | Unsaturated aliphatic compounds | Cholesteryl oleate and linoleate [58,73,74] | |
| 1443 | C=C stretching | 2800–3000 | CH2/CH3 | Higher absorbance for lipids than for proteins [58,73,74] | |
| 704 | Vibration of steroid rings | 1710–1750 | C=O stretching | Lipids [58,73,74] | |
| 1660, 1244 | Amide I, III | Proteins [74,81] | 1730 | C=O | Marker for lipids, cholesteryl esters and triglycerides [58,73,74] |
| 1004 | Phenylalanine | 1718–1487 | Alterations of the protein’s secondary structure [79,80] | ||
| 1580, 1130, 750 | Heme | Hb [74,81] | 1652, 1539, 1236 | Amide II and III | Proteins [79,80] |
| 1070–1080 | Phosphate stretching | Hydroxyapatite [74,81] | |||
| 964 | Stretching vibrations of ν(PO4) | Calcification [74,81] | 1080–1100 and 600 | Hydroxyapatite [79,80] | |
| 1058 | C–O | Cholesterol alone [58,73,74] | |||
| Raman Bands, cm−1 | Assignments | Observations | ||
|---|---|---|---|---|
| Leucine | Isoleucine | Diabetic Blood | ||
| 913 | 907 | - | C–C and C–N stretching in leucine and isoleucine | 1125, 1395, and 1585 cm−1 were considered peaks for diabetes type 2 [108,109,110,111,112,113] |
| - | - | 926 | C–O and C–C stretch in glucose | |
| 1106 | 1108 | 1108 | C–C and C–N stretching in leucine and isoleucine; C–OH and C–O–H stretch in glucose | |
| - | - | 1125 | C–OH and C–O-H stretch in glucose | |
| 1236 | 1248 | 1248 | CH2 torsion in leucine and isoleucine C–O–H deformation in leucine | |
| 1302 | - | 1302 | CH deformation in leucine | |
| 1395 | - | 1395 | CH and CH3 bending; CH3 deformation in leucine | |
| - | 1437 | 1437 | Asymmetric rocking, symmetric bending of C atoms in isoleucine | |
| - | 1585 | 1585 | - | |
| FTIR Bands, cm−1 | Assignment | Observations |
|---|---|---|
| 3290 | N–H (Amide A) and OH symmetric stretching - | Proteins and small input of polysaccharides, carbohydrates and water [115] |
| 3006 | CH stretching vibration - | Unsaturated lipids, cholesterol esters [116] |
| 2924, 2854 | CH2 anti-symmetric and symmetric stretching | Lipids with proteins, carbohydrates, nucleic acids effect [116] |
| 1744 | Carbonyl C–O stretch | Triglycerides [116] |
| 1654 | Amide I | Protein C–O stretching [115] |
| 1547 | Amide II (C–N stretch, protein N–H bend) | Proteins [115] |
| 1469 | CH2 bending | Acyl chains of lipids [115] |
| 1375 | C–N stretching | [115] |
| 1238 | Asymmetric PO2− stretching | [115] |
| 1164 | C–O stretching | Found in normal tissue [115] |
| 1100 | Stretching PO2− symmetric (phosphate II) | [115] |
| FTIR Bands, cm−1 | Assignment | Observations | ||
|---|---|---|---|---|
| NILM vs. SIL | NILM vs. LSIL | NILM vs. HSIL | ||
| 1747 | - | 1758 | C=O stretching vibrations | Lipids |
| 1724 | 1724 | 1729 | C=O stretching vibrations | aldehydes |
| 1631 | - | 1639 | C=O stretching vibration; C-N bond stretching | Amide I group coupled with N–H bending |
| 1539 | - | 1531 | C–N stretching and N–H deformation | Amide II |
| - | 1334 | 1342 | Amide III | Proteins |
| 1454 | 1461 | 1467 | CH3 and CH2 deformations | Lipids and proteins |
| 1400 | - | - | CH3 | Lipids and proteins |
| - | 960 | 968 | C–H bending | |
| 1219 | 1221 | - | Asymmetric stretching vibrations of phosphate | |
| 1080 | 1089 | - | Symmetric stretching vibrations of phosphate | |
| 1155 | - | - | C–O | Carbohydrates |
| - | - | 1043 | OH stretching coupled with bending | Glycogen band |
| - | - | 1063 | CO–O–C symmetric stretching | Phospholipids and cholesterol esters |
| FTIR Bands, cm−1 | Assignment | Observations |
|---|---|---|
| 3000 − 2800 | C–H stretching of methyl/methylene | Lipids [126] |
| 1735 | CO–O–C ester carbonyl stretching vibration | |
| 1665 *; 1650–1655 ** and 1635 *** | Amide I (C=O stretching) coupled with N–H in-plane bending | Peptide moiety (* random coil and β-turns; ** α-helical structures; *** β-pleated structures) [126] |
| 1544 | C–N stretching and N–H in-plane bending | Amide II |
| 1400–1450 | C–H bending | Lipids and proteins |
| 1305 | Amide III | Proteins, aliphatic amino acids [131] |
| 1244 * and 1225 ** | Asymmetric stretching vibrations of phosphate | Nucleic acid phosphodiester backbone (* α-DNA, ** β-DNA) [132] |
| 1080 | Symmetric stretching vibrations of phosphate | Stronger hydrated tissues and cells [133,134] |
| 1055, 1080, and 1150 | C–O stretching bands | Glycogen moiety |
| Condition | FTIR Peak, cm−1 | Assignment | Observations | |
|---|---|---|---|---|
| Normal | Cancer | |||
| Oral cancer | 1030 | 1024 OLK or 1025 OSF | C−O Stretching Coupled with C−O bending | Superficial Layer rich in Glycogen [145,146] |
| Colorectal cancer | 3256 | 3261 | N−H and OH stretching vibrations - | Higher intensity of protein and water for malignant tissues [151] |
| 1647 | 1641 | Amide I | Large amount of mucus for colon adenocarcinoma [151] | |
| 1547 | 1544 | Amide II | ||
| 1093 | 1084 | PO2 group of nucleic acids | Endless replication of DNA in cancerous cells [151] | |
| Gastric cancer | 1646 | 1641/1640/1642 | Amide I | (Malign/chronic atrophic/superficial gastritis) [152,153] |
| 1553 | 1549/1547/1546 | Amide II | ||
| 1317 | 1313/1306/1316 | Amide III, symmetric stretch | ||
| Characteristic Bands, cm−1 | Assignments | Observations | ||
|---|---|---|---|---|
| FTIR | 2800–3000 | CH2 | Lipids; BCC tumour cells predominantly [169] | |
| 1740 | Ester and acyl | Lipids; increased amount in BCC tumour cells [170] | ||
| 1650 | Amide I | Proteins; variations of the amide I/amide II intensity ratio [170,171] | ||
| 1480–1575 | Amide II | Proteins [170] | ||
| 1235–1245 | Amide III | Proteins; the amide III and DNA spectral features are modified and enhanced with progression to malignancy [170] | ||
| 980, 1080 and 1240 | Nucleic acids: ribose, phosphate | Increased intensity in all tumour types; most intense in BCC; 1080 cm−1 shoulder in MM and SCC [170] | ||
| Raman | 1420-1450 | CH2 | Lipids in BCC (scissoring vibration) [172] | |
| 1300 | –(CH2)n– | BCC (in-phase twist vibration) [172] | ||
| NIR-FT Raman | 1661 | Amide I | Proteins; variations in intensity (MM, PN) [173,174] | |
| 1451 | CH2 and CH3 | Proteins and lipids; wide signal for MM, BCC and SK [174] | ||
| 1309 | CH2 | Lipids; increased intensity (MM, BCC, SK) [173,174] | ||
| 1271 | Amide III | Proteins; Decreased intensity (BCC, SCC, SK) [173,174] | ||
| 1247 | PO2− | Nucleic acids and phospholipids | Decrease in SK, BCC [174] | |
| 1080 | Increase in SK, SCC [172] | |||
| 939 | C–C | Proline and valine from proteins and lipids; decrease in BCC MM and SK [174] | ||
| Condition | Peak, cm−1 | Assignment | Observations |
|---|---|---|---|
| Normal mouse white matter | 2927, 1469 | CH2 | High concentration of long-chain fatty acids in myelin [19,178] |
| 1740 | C=O | Lipid content | |
| 1550 | Amide II | Cerebrum | |
| 1235 | P=O | Phospholipids (25.2%) | |
| 1085 | OH–C–H | Galactose | |
| Krabbe’s disease | 2919 | CH2 | Psychosine accumulation [179] |
| Normal mouse brain | 2956, 2922, 2871, 2851 | CH3, CH2 | Strong asymmetric and weak symmetric stretching [184] |
| 1630, 1640/1658 and 1652 | Amide I | α-helical protein secondary structure in neuropil and neuron | |
| Alzheimer’s disease | 1623 | Amide I | Dense plaque cores of TgCRND8 mice; |
| 1080 and 1230 | C–H | Increased phospholipids | |
| Human grey matter-Normal | 1650–1656 | Amide I | α-helical conformation [181,183] |
| 1542 | Amide II | ||
| Alzheimer’s disease | 1632-1634 | Amide I | β-amyloid structure [181,183] |
| 1540 | Amide II | ||
| Normal human substantia nigra of brain | 3300, 3080 | N–H | Protein [191] |
| 2960, 2930, 2850, 1460, 1380 | CH3, CH2 | Lipids | |
| 1656, 1633 | Amide I | Proteins with α-helical structures | |
| 1545 | Amide II | ||
| 1300 | Amide III | Proteins | |
| 1170 | CO–O–C | Lipids | |
| 1085 | PO2− | Nucleic aids | |
| Parkinson’s disease | 2930, 2850 | CH2 | Higher intensity [88,186] |
| 1643, 1682, 1662 | Amide I | α-synuclein (β-sheet and β-turn band) [186] | |
| 1236, 1086 | PO2− | Significant intensity decrease [186] | |
| 1173 | –CO–O–C | Higher intensity [186] | |
| Normal central nervous system | 1735 | C=O | Lipids and fatty acids [192,193] |
| 1690, 1650, 1635 | Amide I | β-sheet and α-helix protein secondary structure [194,195] | |
| 1560 | C–N | Proteins [196] | |
| 1235, 1080 | PO2− | Phosphodiester and nucleic acids backbone (RNA and DNA) [197] | |
| 965 | P–O–C | Nucleic acids (DNA and RNA) [198] | |
| Multiple sclerosis | 1690, 1635 | Amide I | Controlled by anti-parallel β-pleated and β-pleated sheet constituents [187] |
| Normal human cerebrospinal fluid | 3010 | C=CH | Unsaturated lipids [189] |
| 2920 and 2850 | CH2 | Long hydrocarbon chains in lipids [189] | |
| 1730 | C=O | Proteins [189] | |
| 1657 | Amide I | ||
| 1546 | Amide II | Lipids [189] | |
| CIS, TCIS, RRMS | 1732 | C=O | Significant increase in carbonyl amount [189] |
| 795 | Guanine C3′-endo/syn conformation in the Z-DNA [189] | ||
© 2019 by the authors. Licensee MDPI, Basel, Switzerland. This article is an open access article distributed under the terms and conditions of the Creative Commons Attribution (CC BY) license (http://creativecommons.org/licenses/by/4.0/).
Share and Cite
Balan, V.; Mihai, C.-T.; Cojocaru, F.-D.; Uritu, C.-M.; Dodi, G.; Botezat, D.; Gardikiotis, I. Vibrational Spectroscopy Fingerprinting in Medicine: from Molecular to Clinical Practice. Materials 2019, 12, 2884. https://doi.org/10.3390/ma12182884
Balan V, Mihai C-T, Cojocaru F-D, Uritu C-M, Dodi G, Botezat D, Gardikiotis I. Vibrational Spectroscopy Fingerprinting in Medicine: from Molecular to Clinical Practice. Materials. 2019; 12(18):2884. https://doi.org/10.3390/ma12182884
Chicago/Turabian StyleBalan, Vera, Cosmin-Teodor Mihai, Florina-Daniela Cojocaru, Cristina-Mariana Uritu, Gianina Dodi, Doru Botezat, and Ioannis Gardikiotis. 2019. "Vibrational Spectroscopy Fingerprinting in Medicine: from Molecular to Clinical Practice" Materials 12, no. 18: 2884. https://doi.org/10.3390/ma12182884