Corrosion and Corrosion Fatigue Properties of Additively Manufactured Magnesium Alloy WE43 in Comparison to Titanium Alloy Ti-6Al-4V in Physiological Environment

 , ,
, , 

Abstract
:1. Introduction
2. Experimental Methods
2.1. Materials
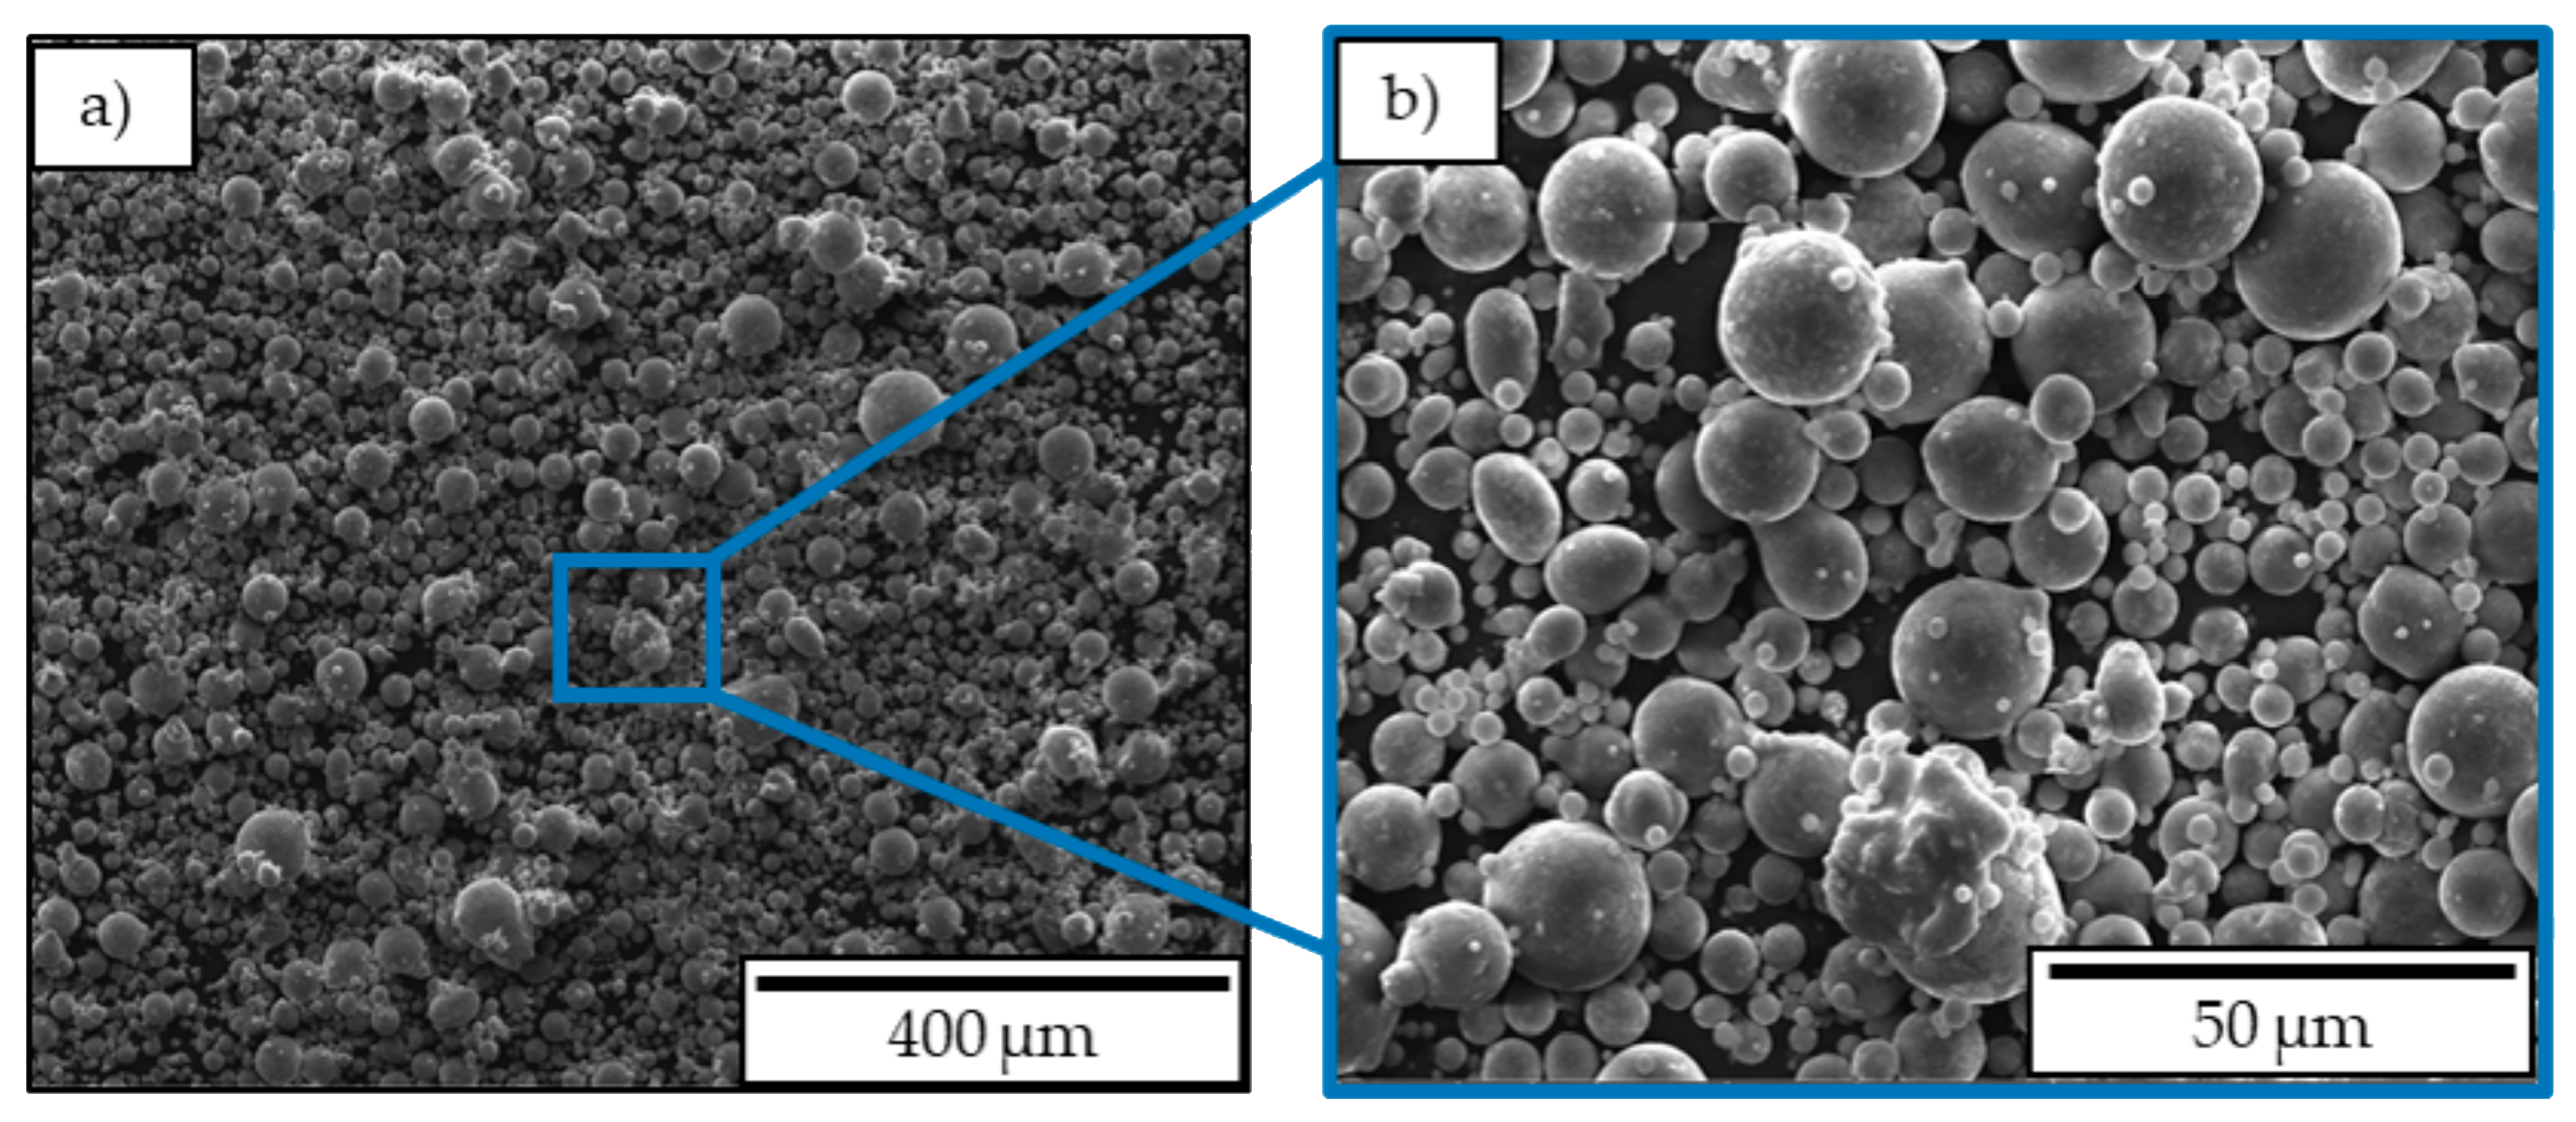
2.1.1. Magnesium
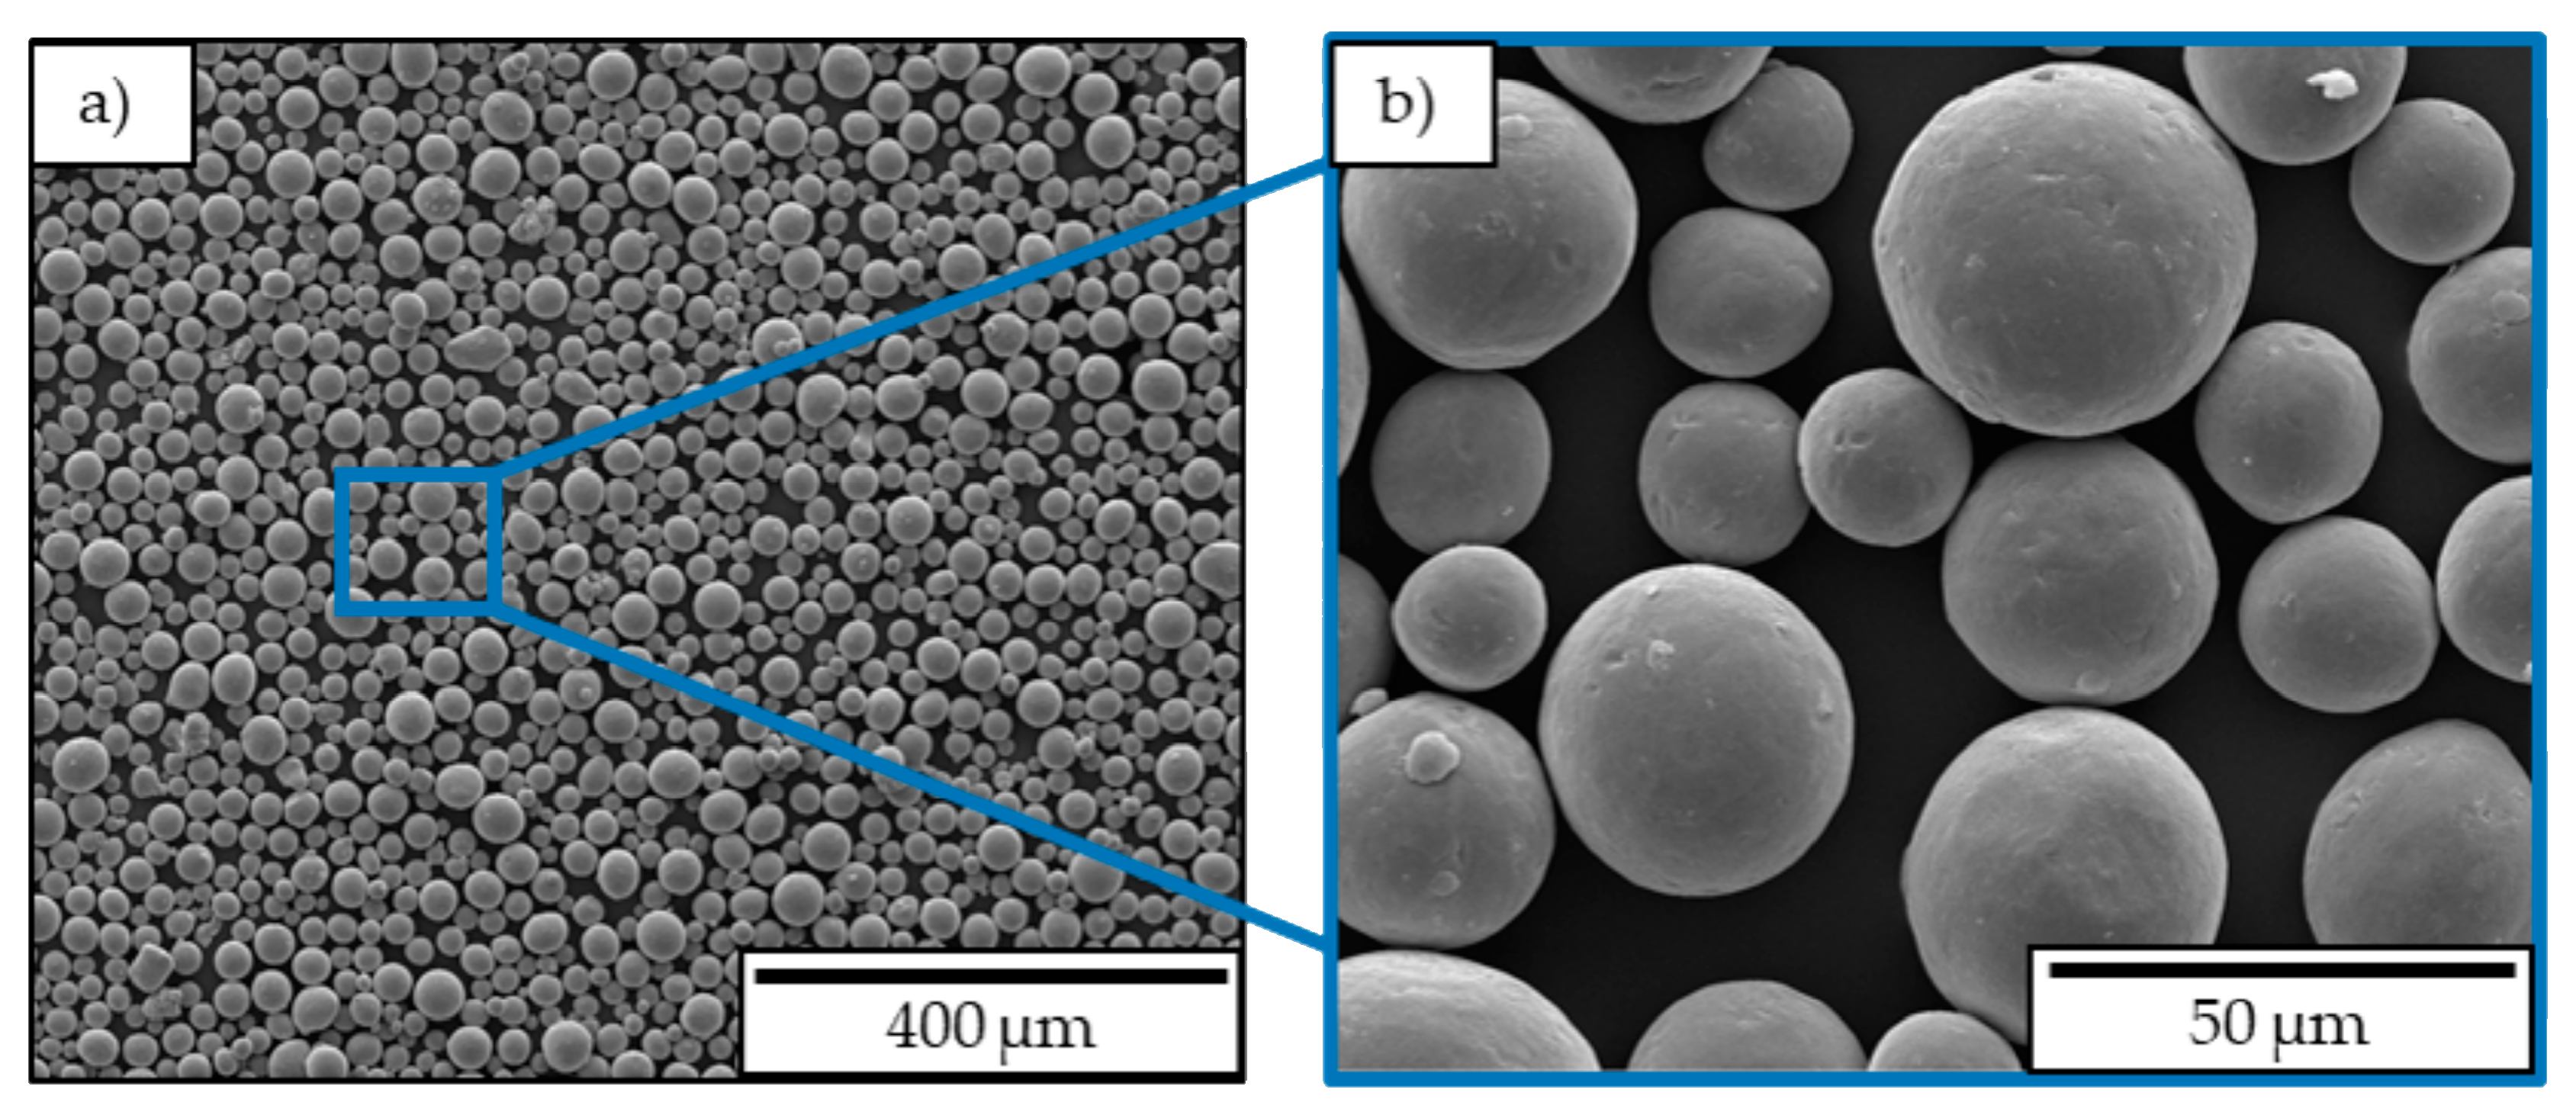
2.1.2. Titanium
2.1.3. Specimen Geometry
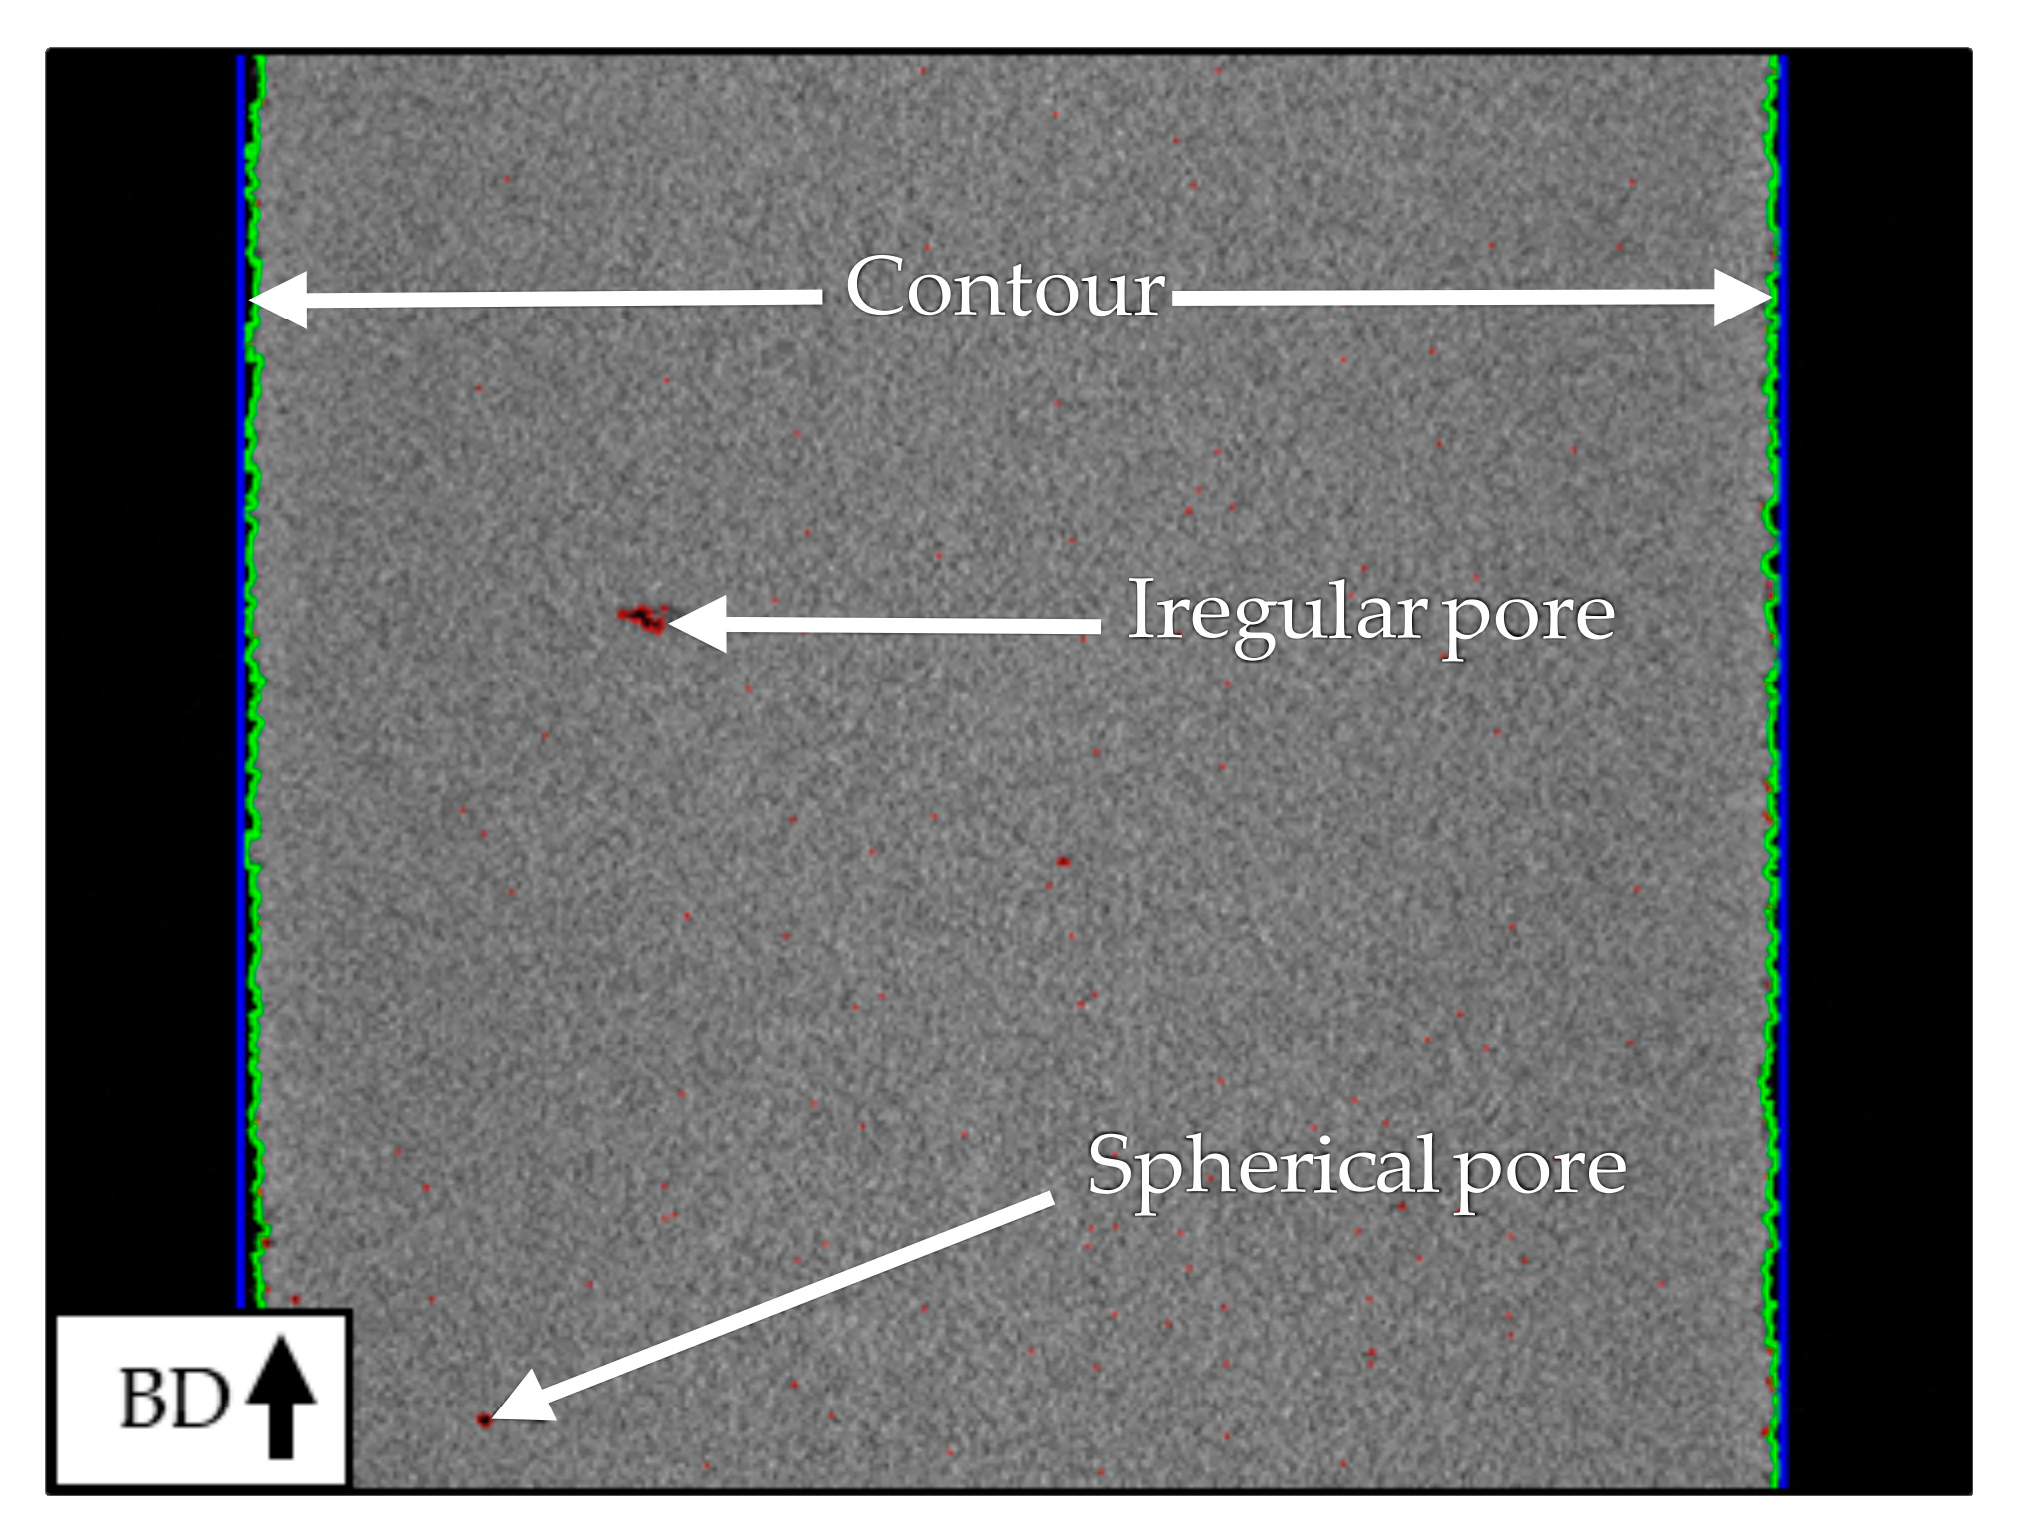
2.2. Computer Tomography
2.3. Microstructure
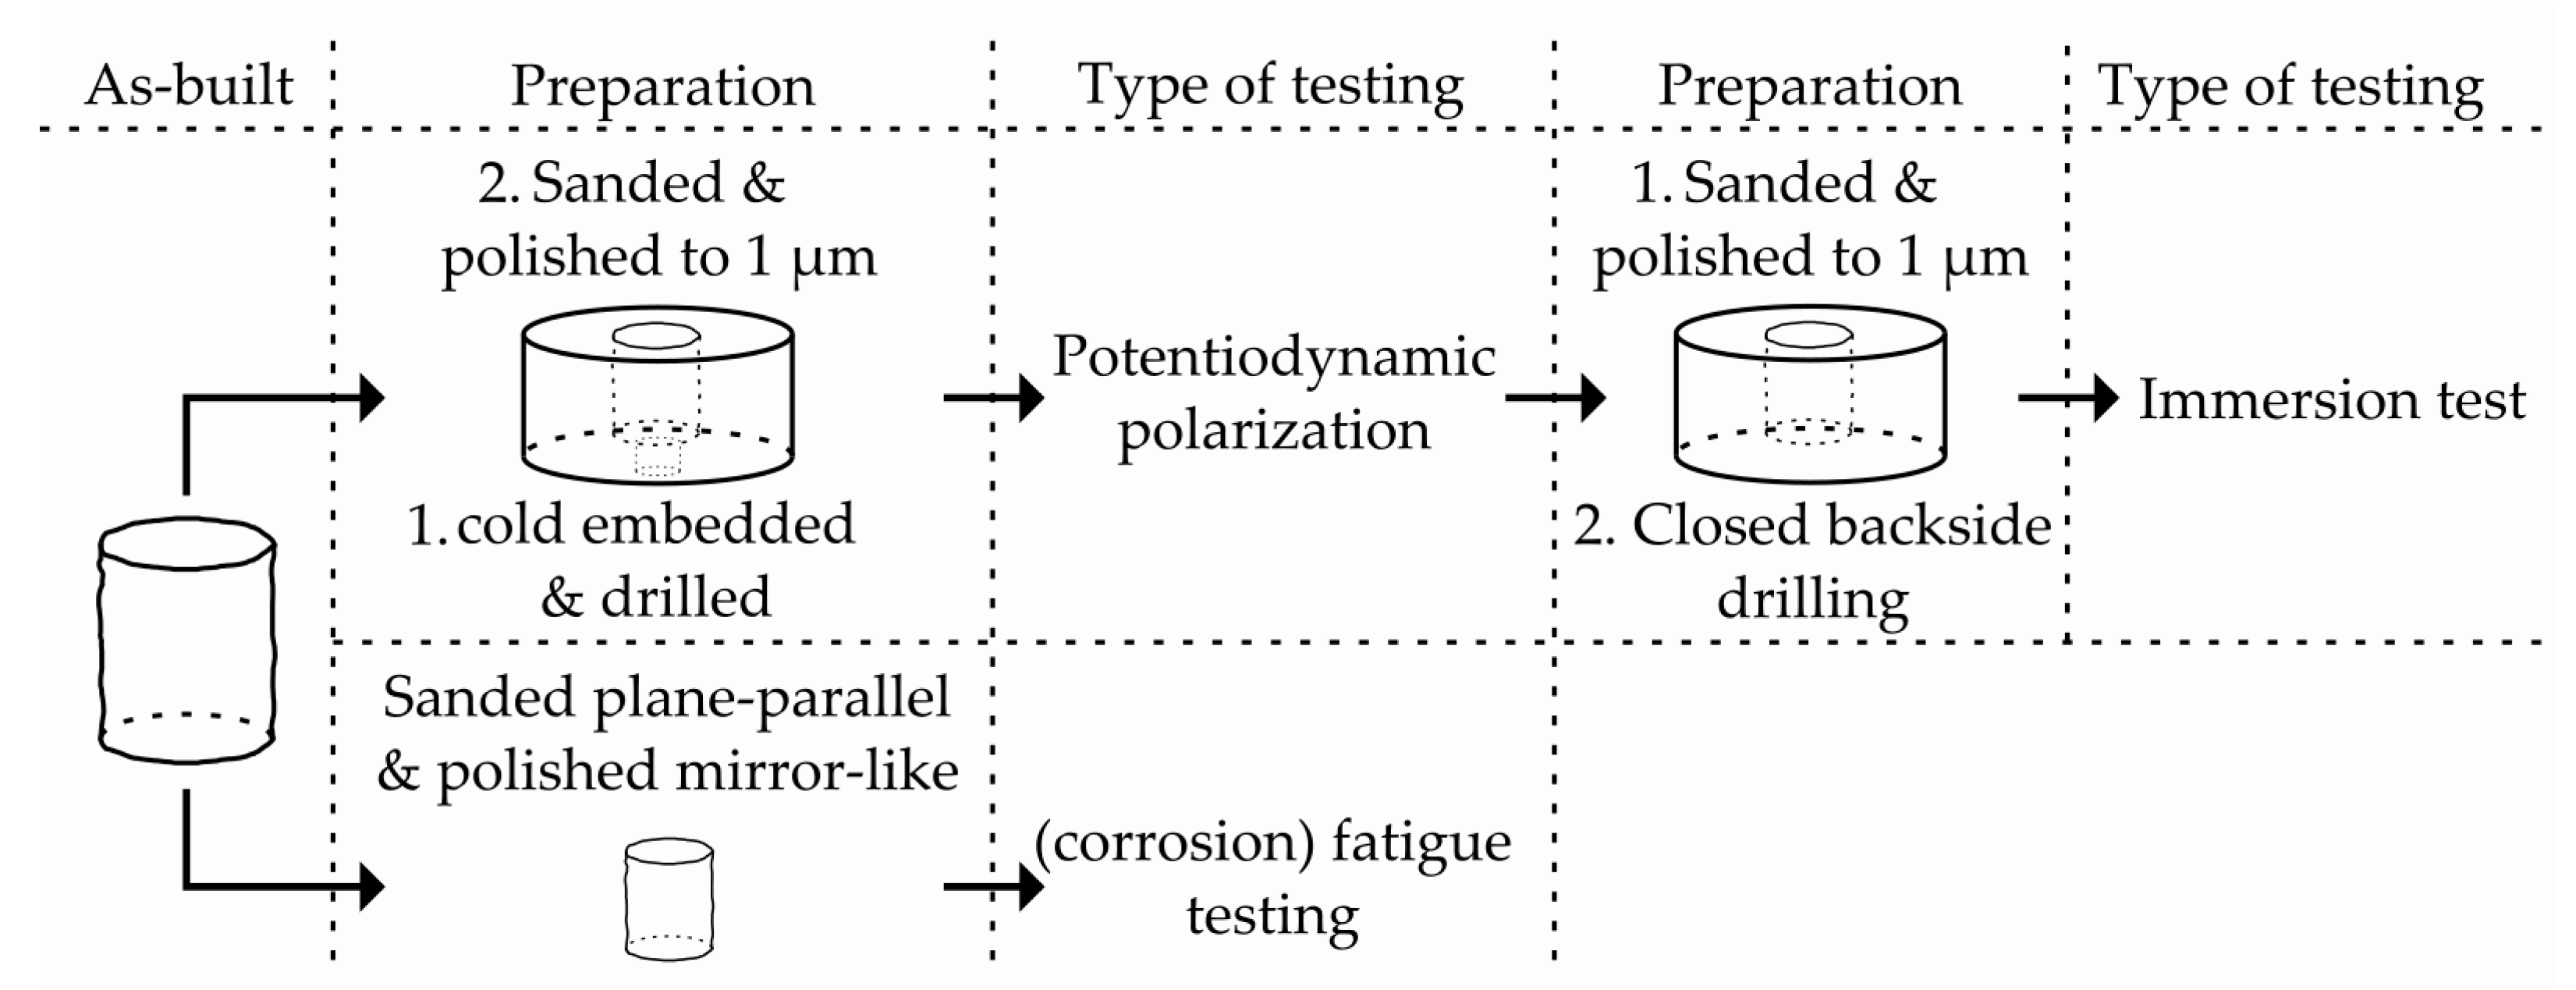
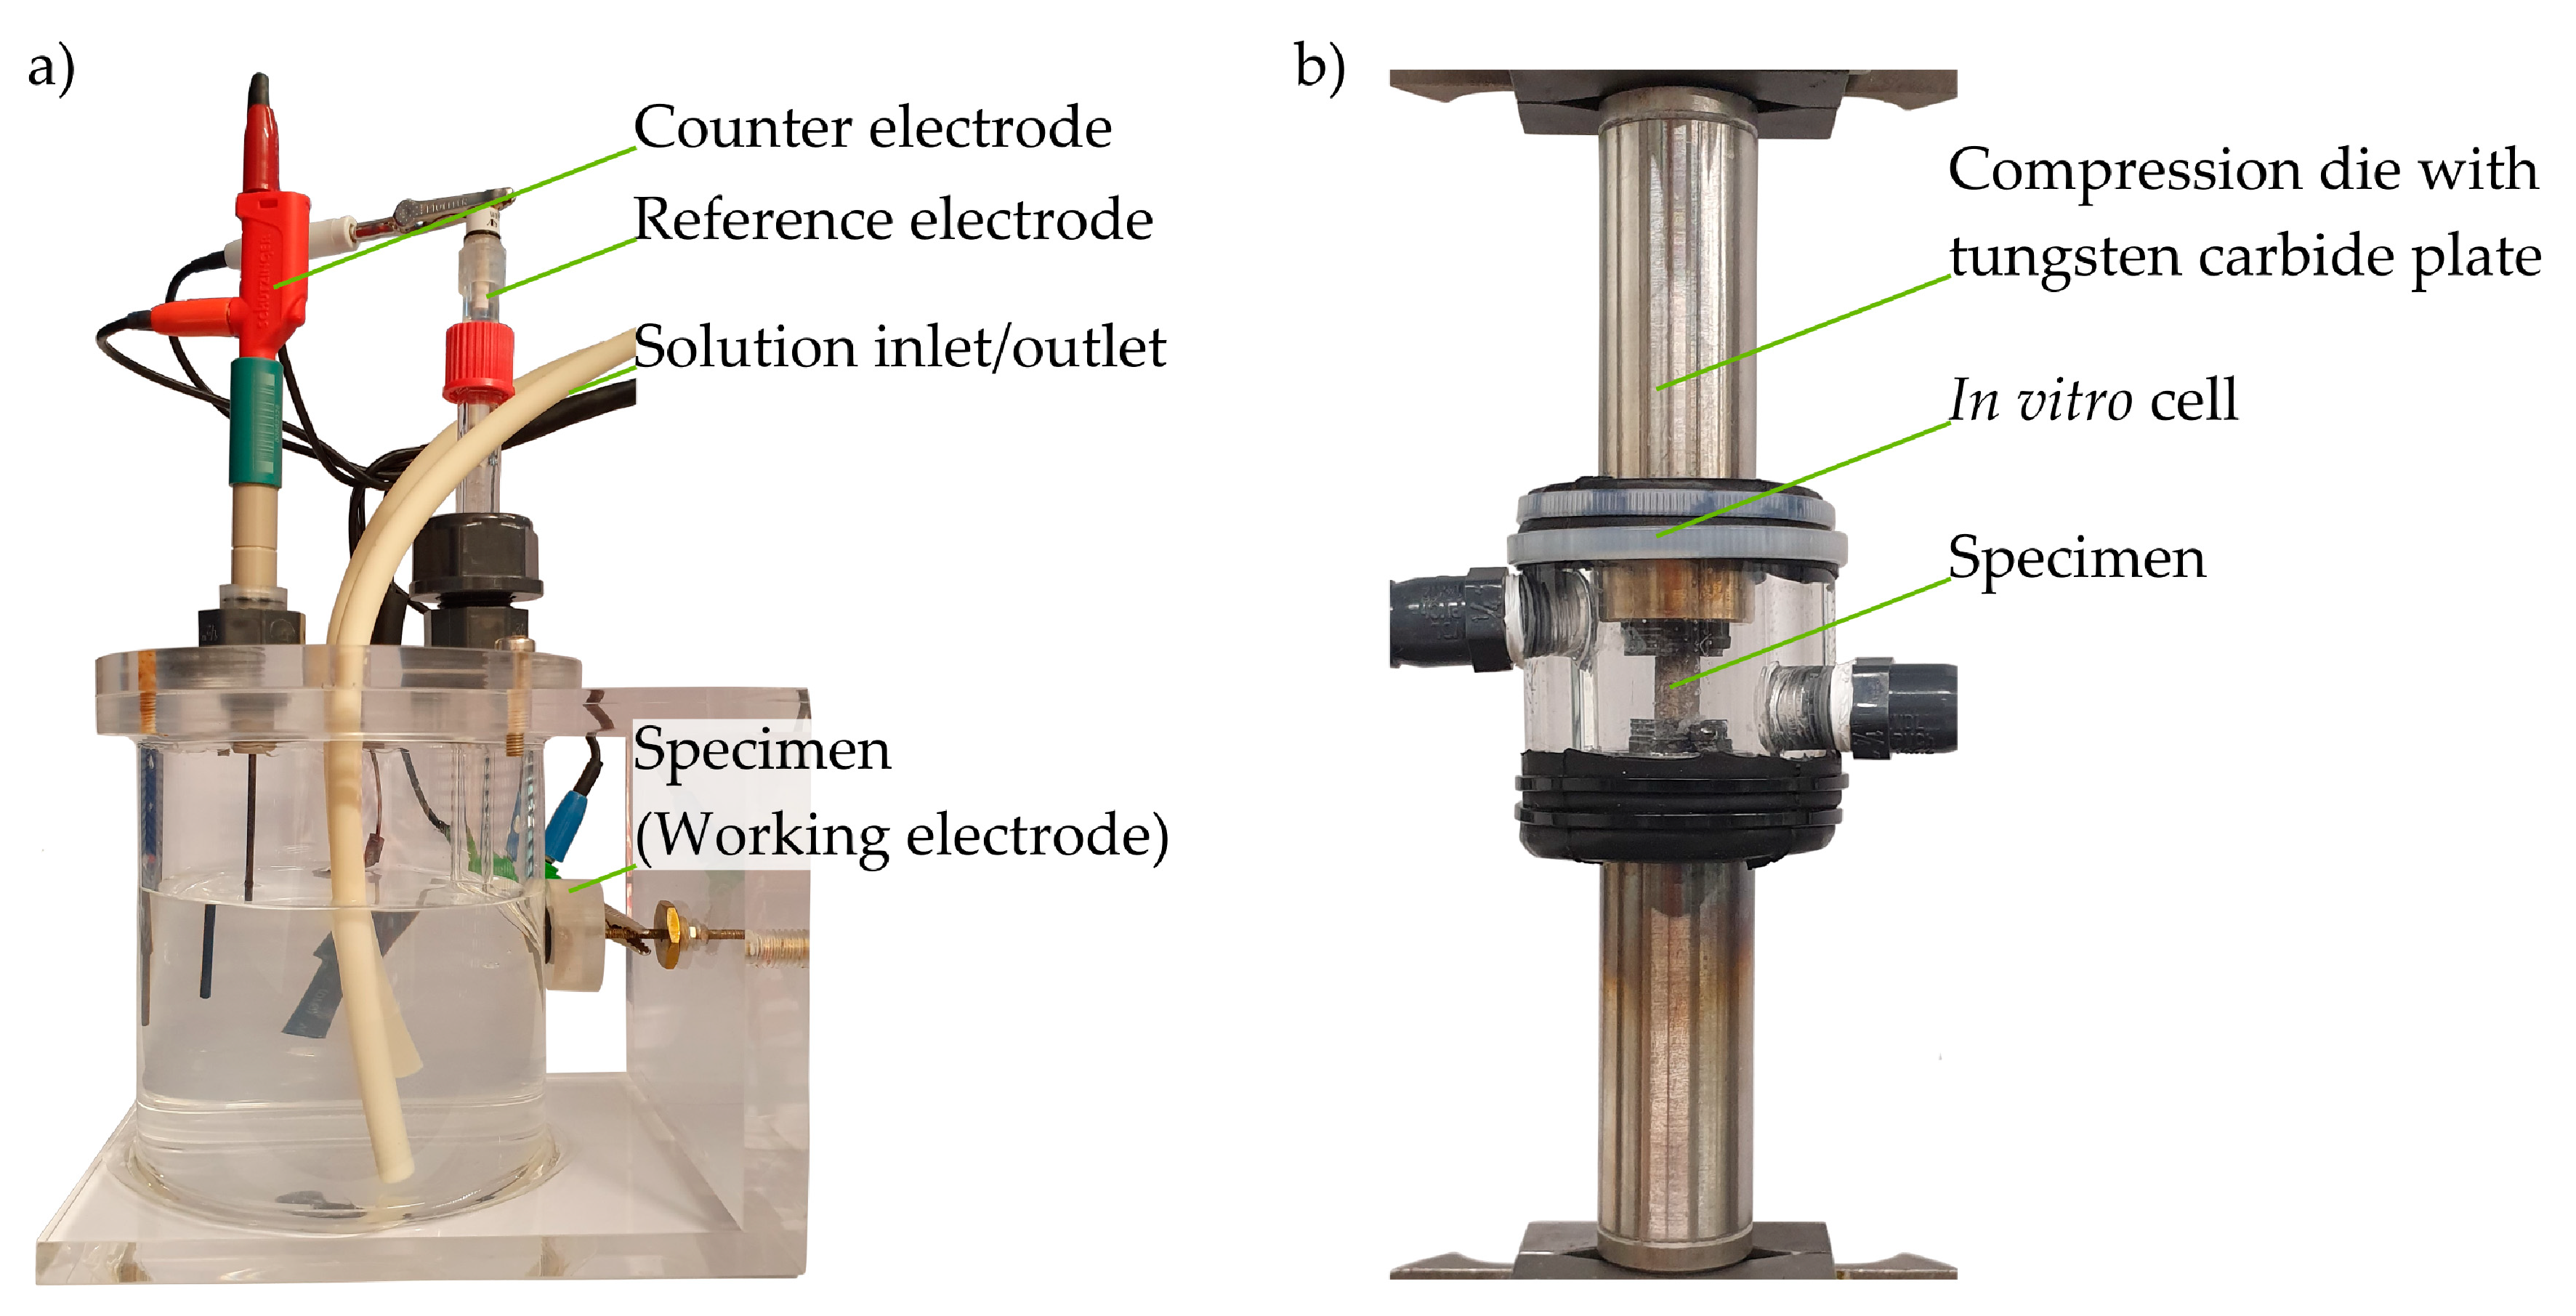
2.4. Corrosion Tests
2.4.1. Potentiodynamic Polarization
2.4.2. Immersion Tests
2.5. Corrosion Fatigue Tests
3. Results
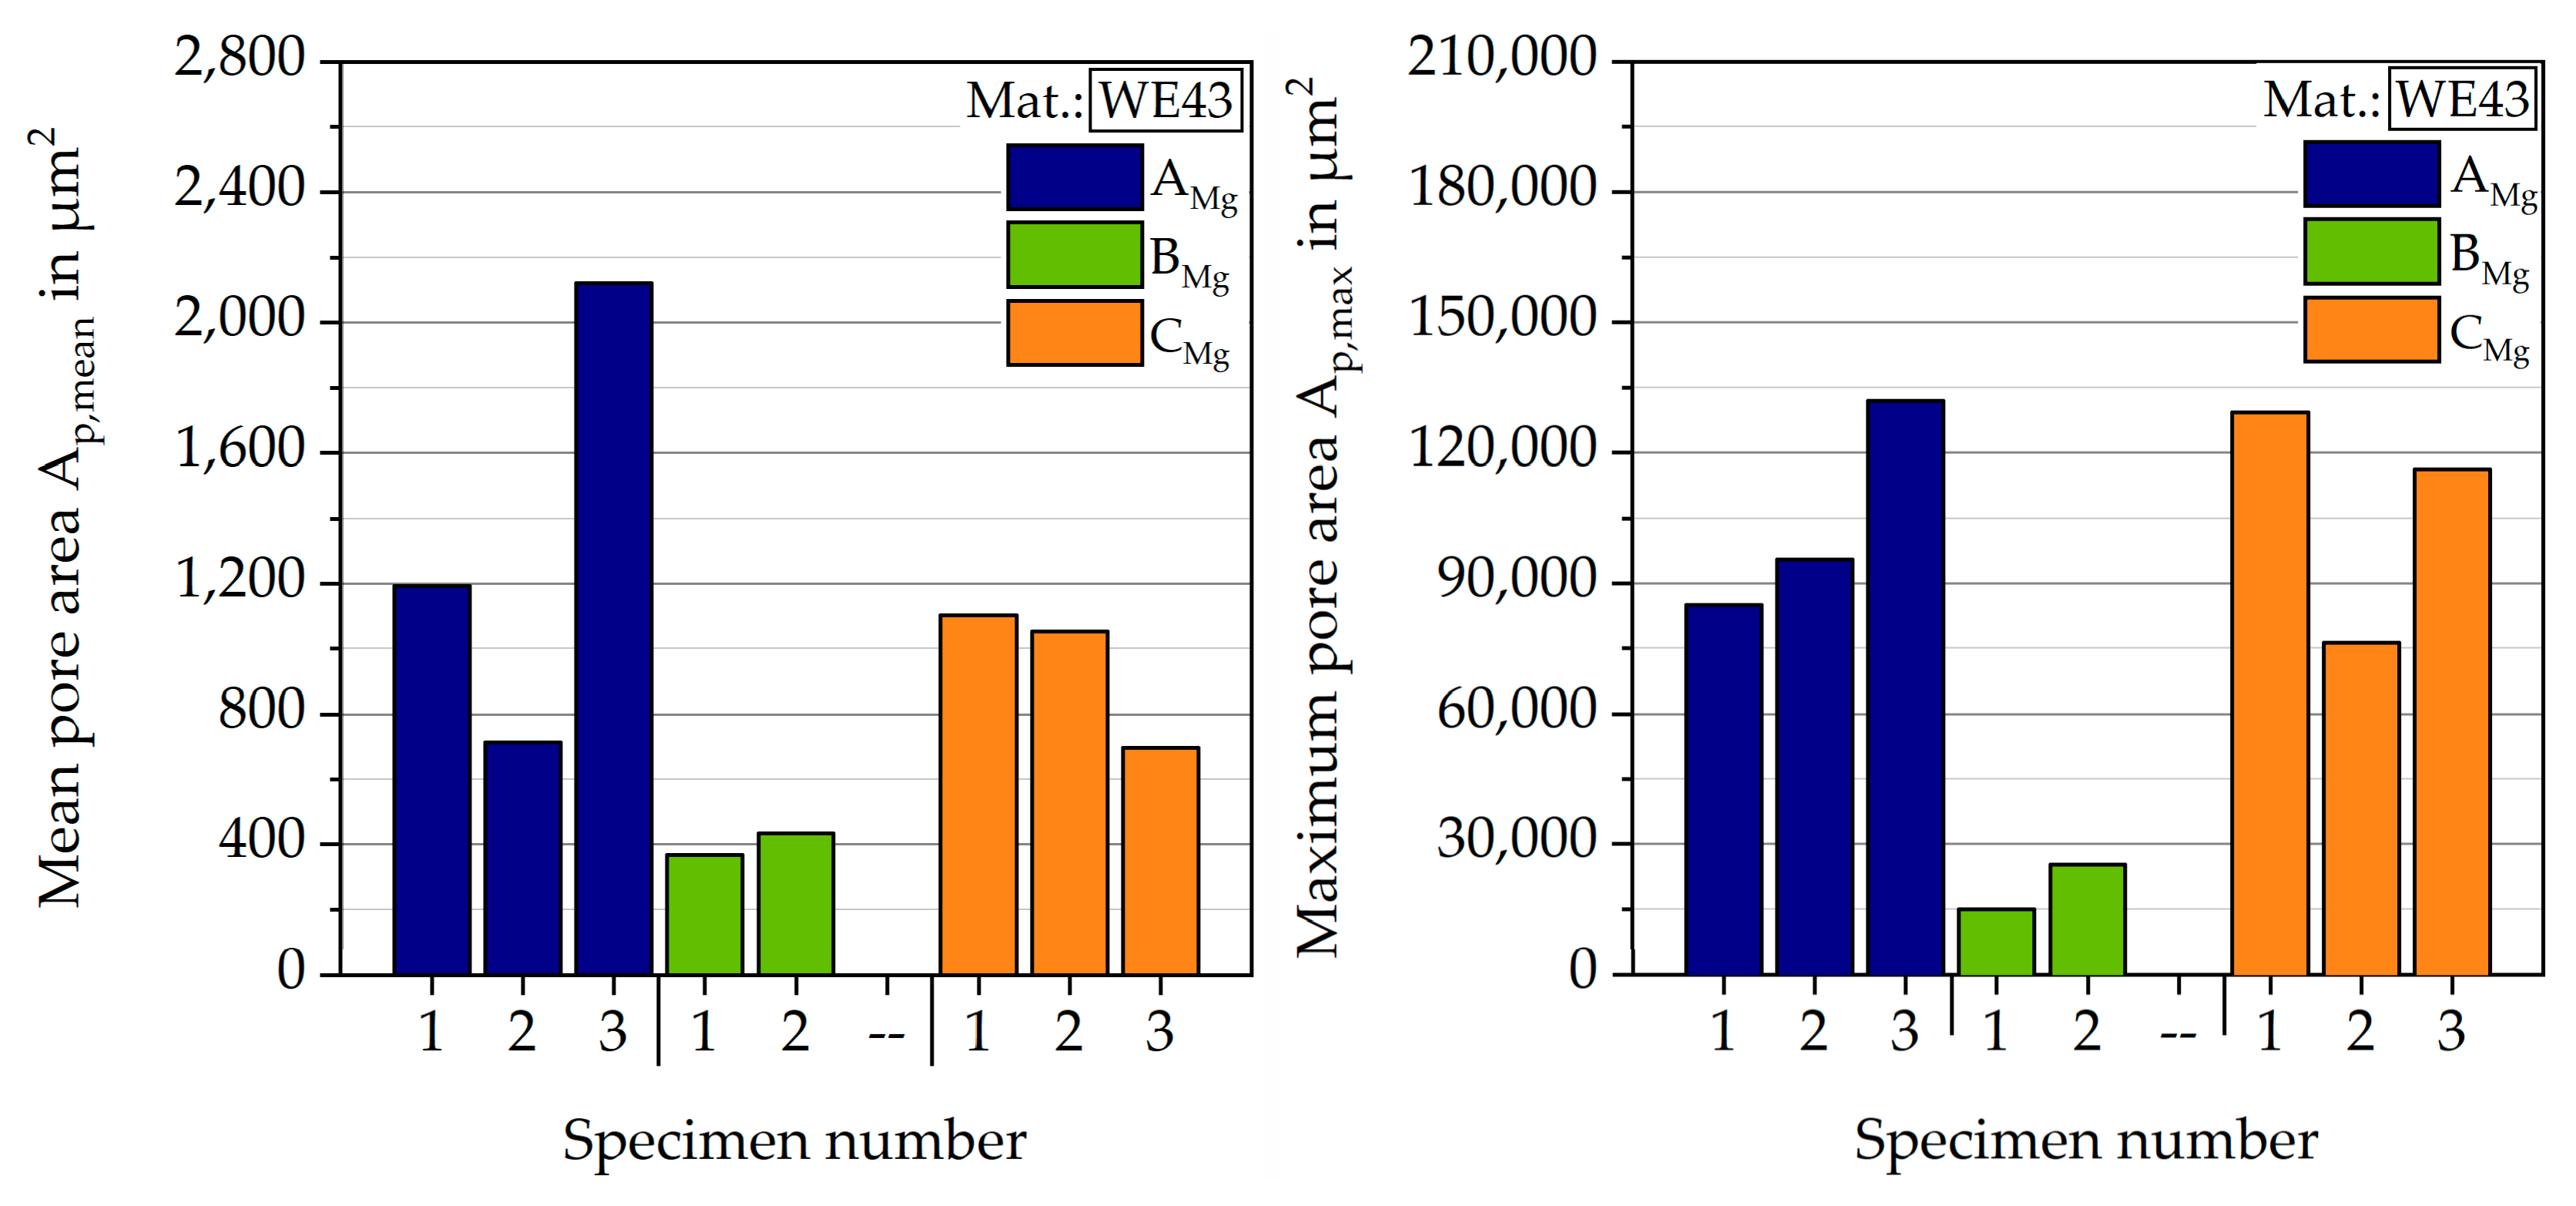
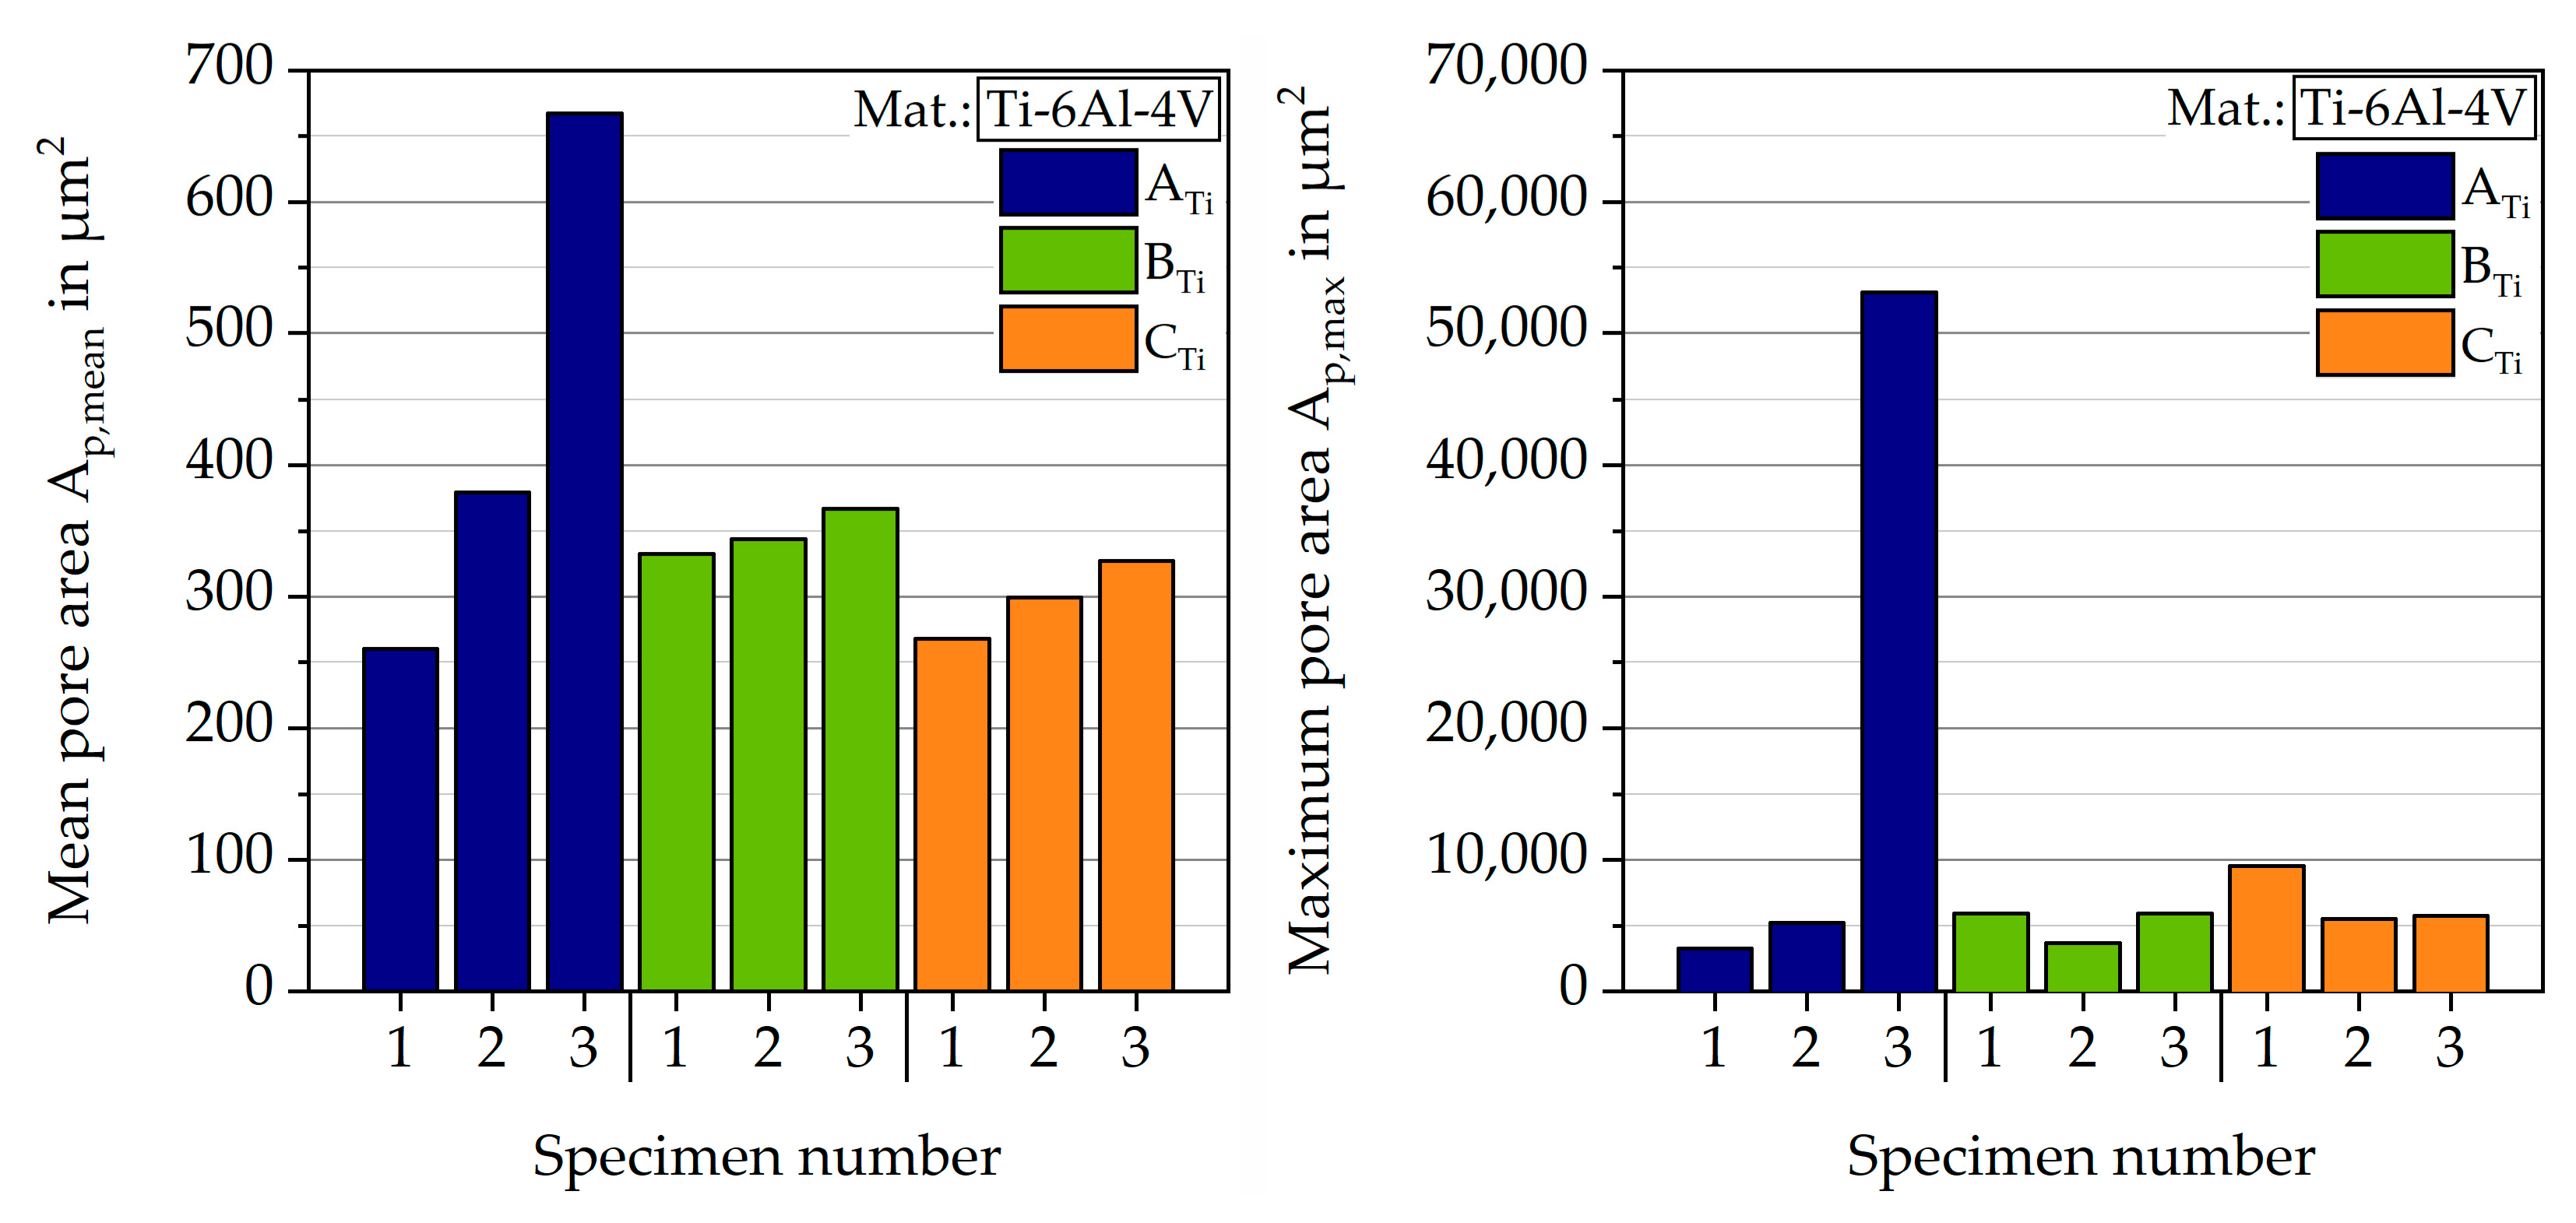
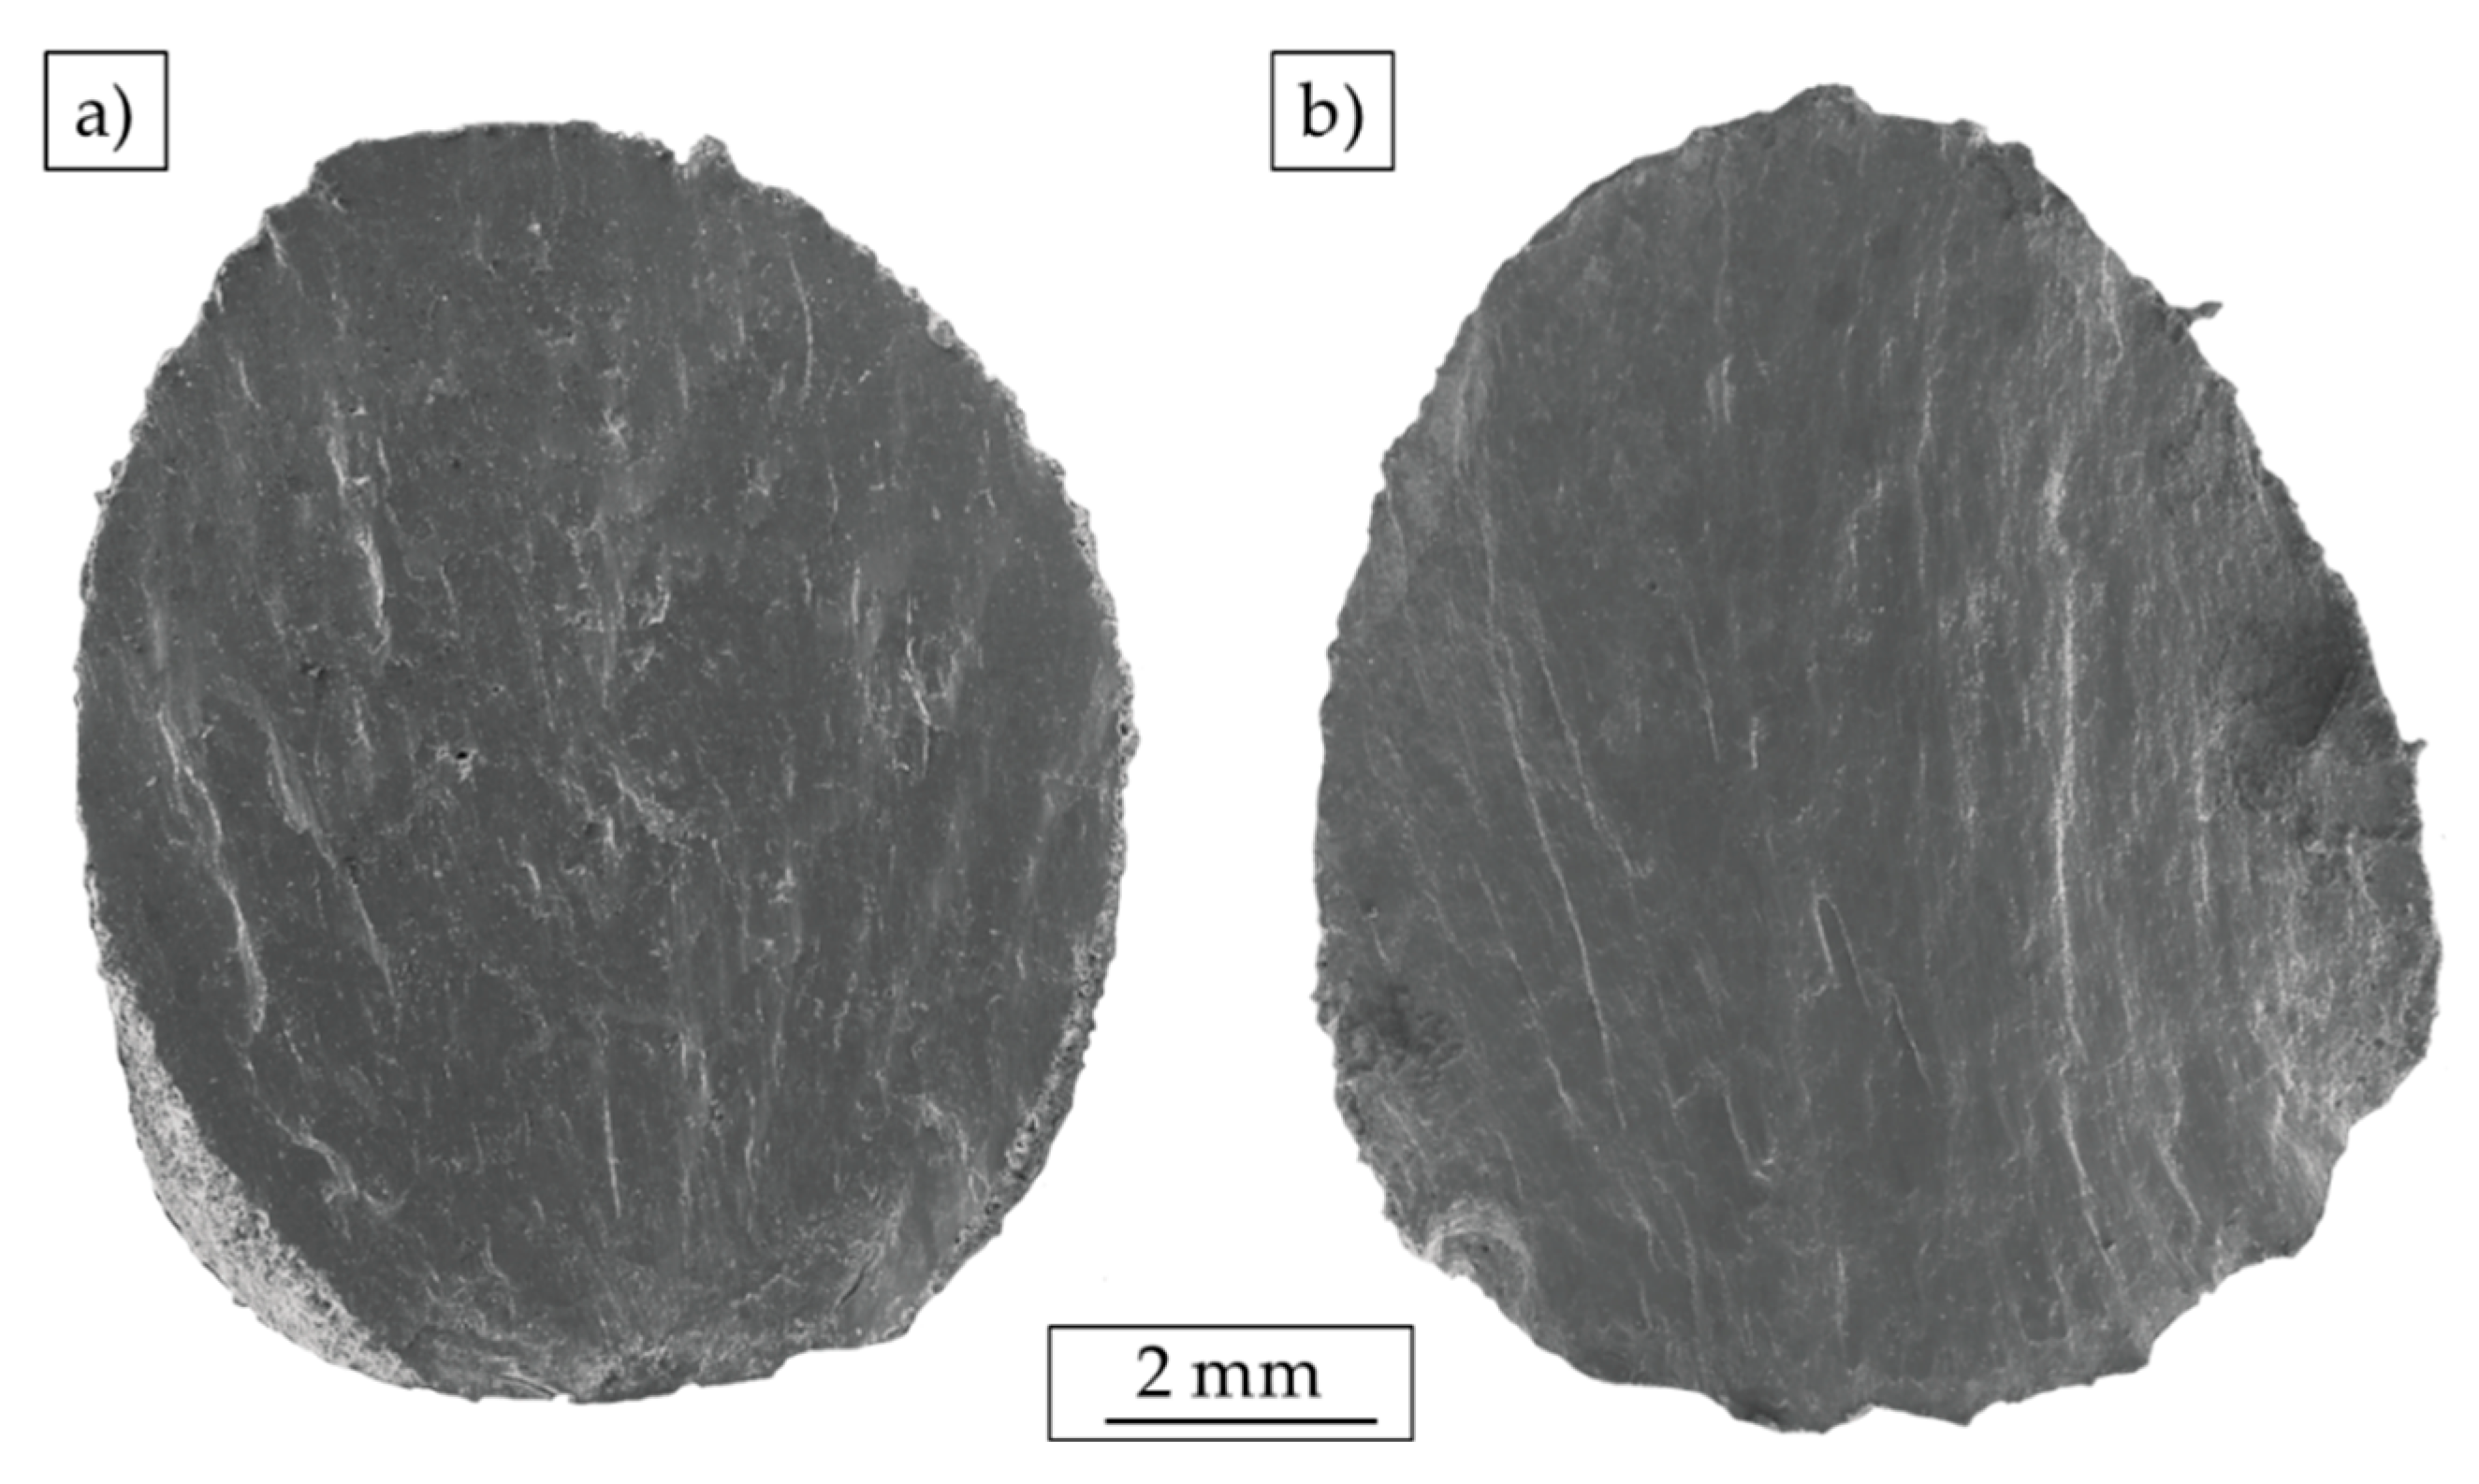
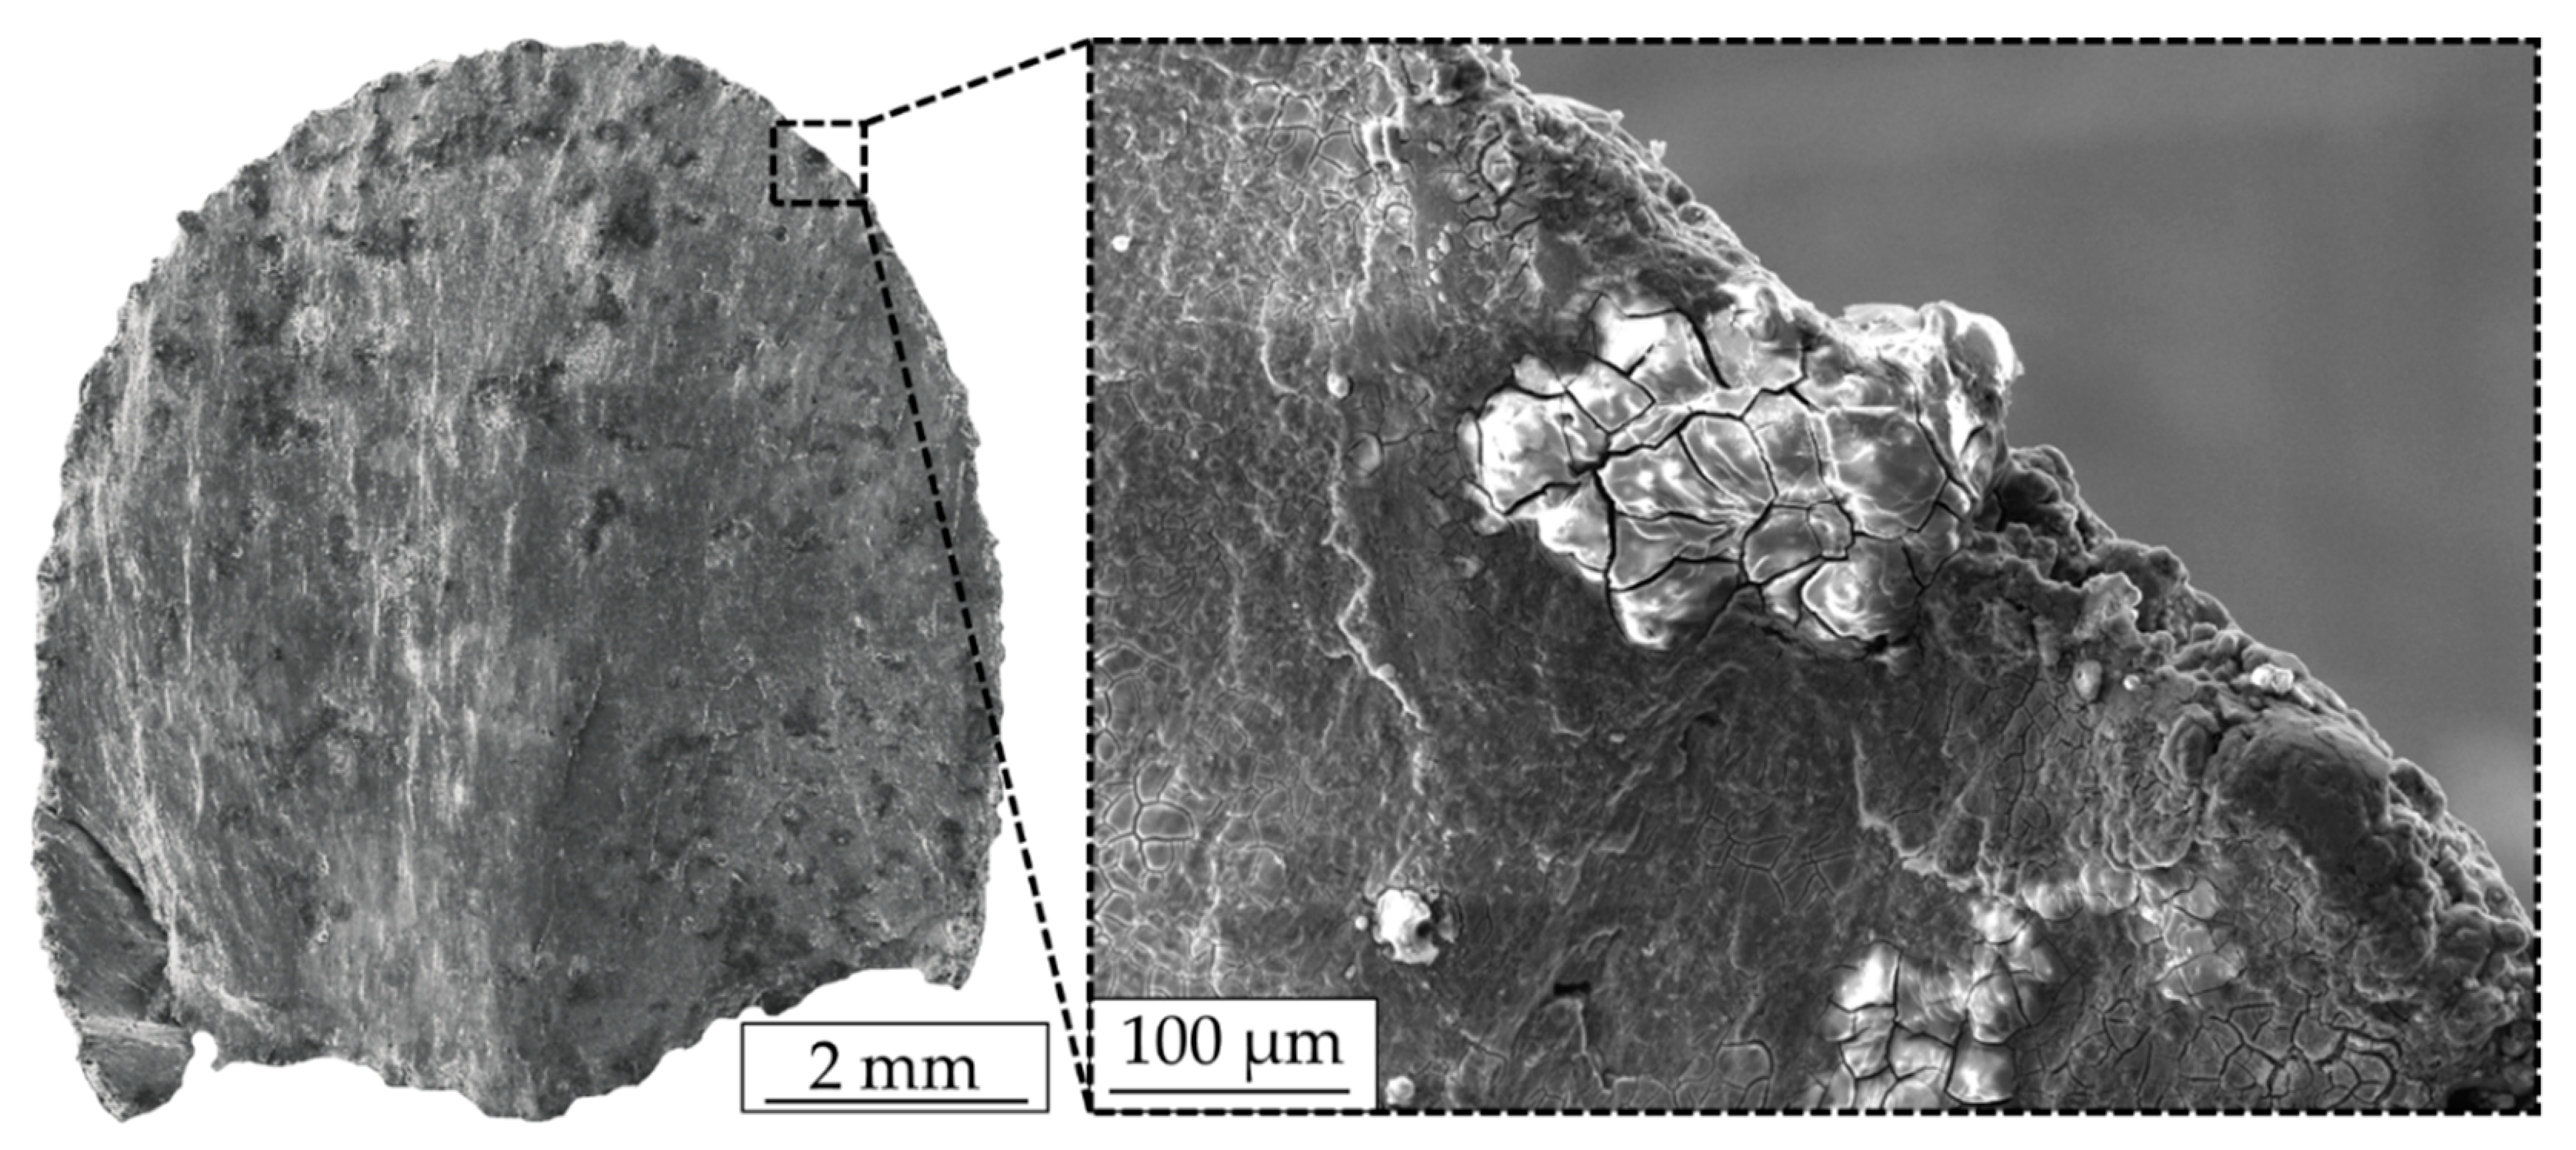
3.1. Computer Tomography
3.1.1. Magnesium
3.1.2. Titanium
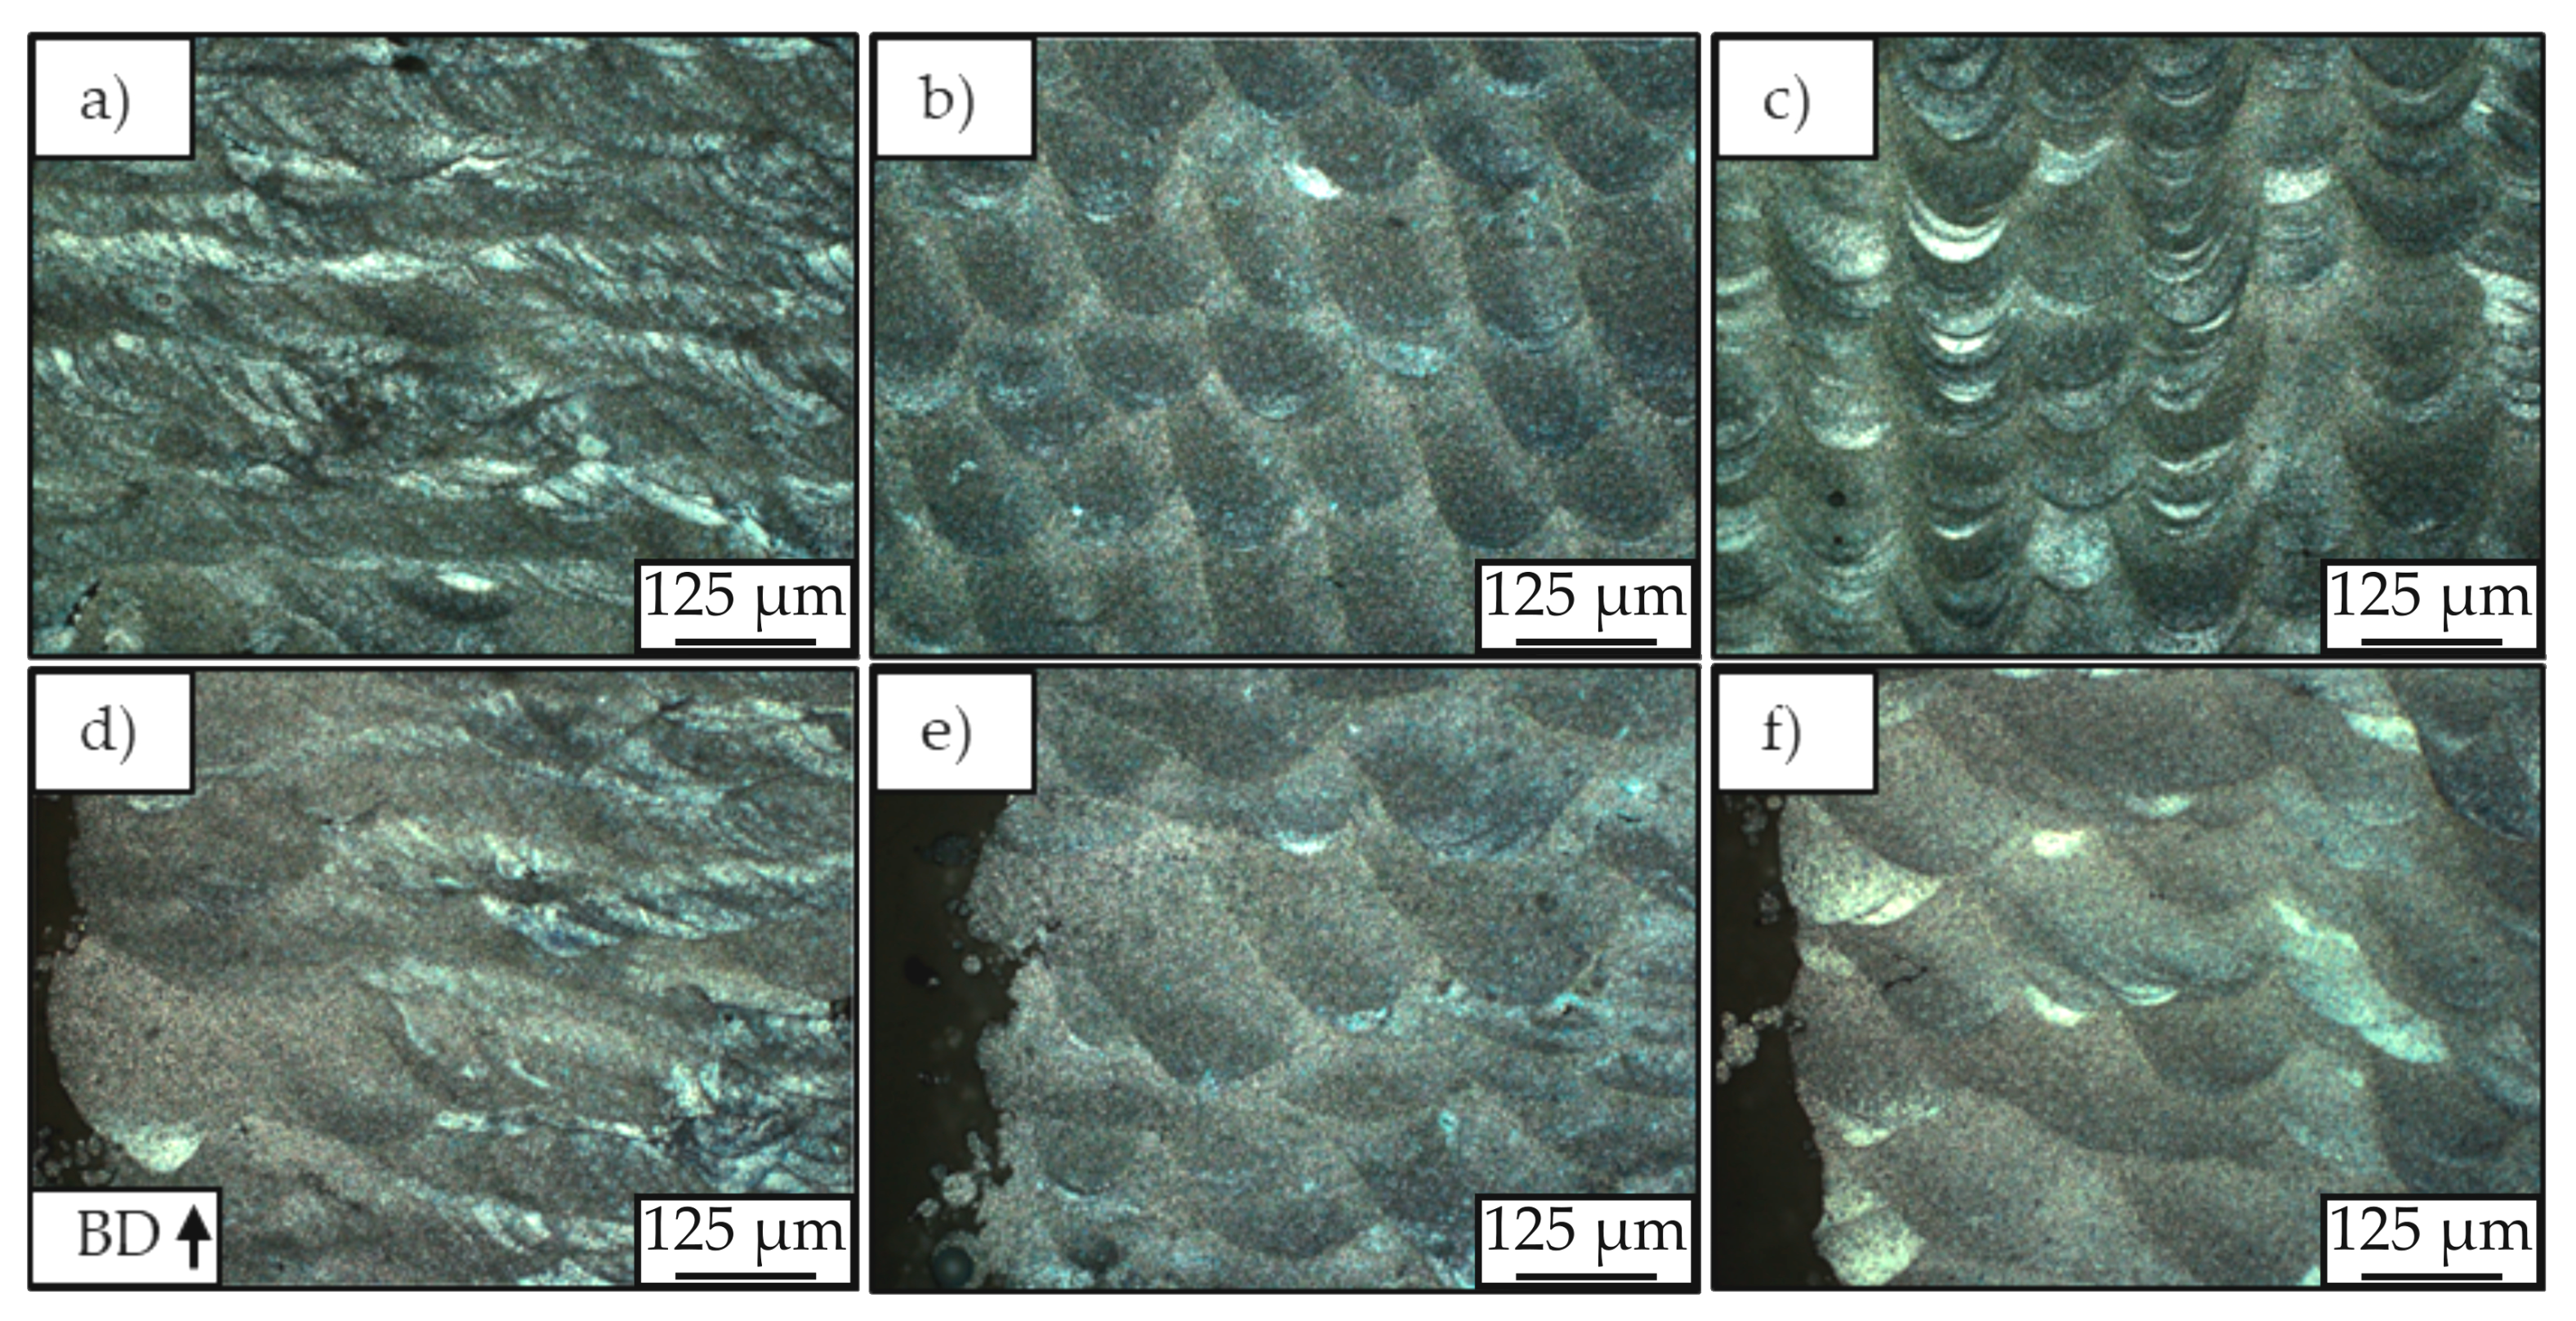
3.2. Microstructure
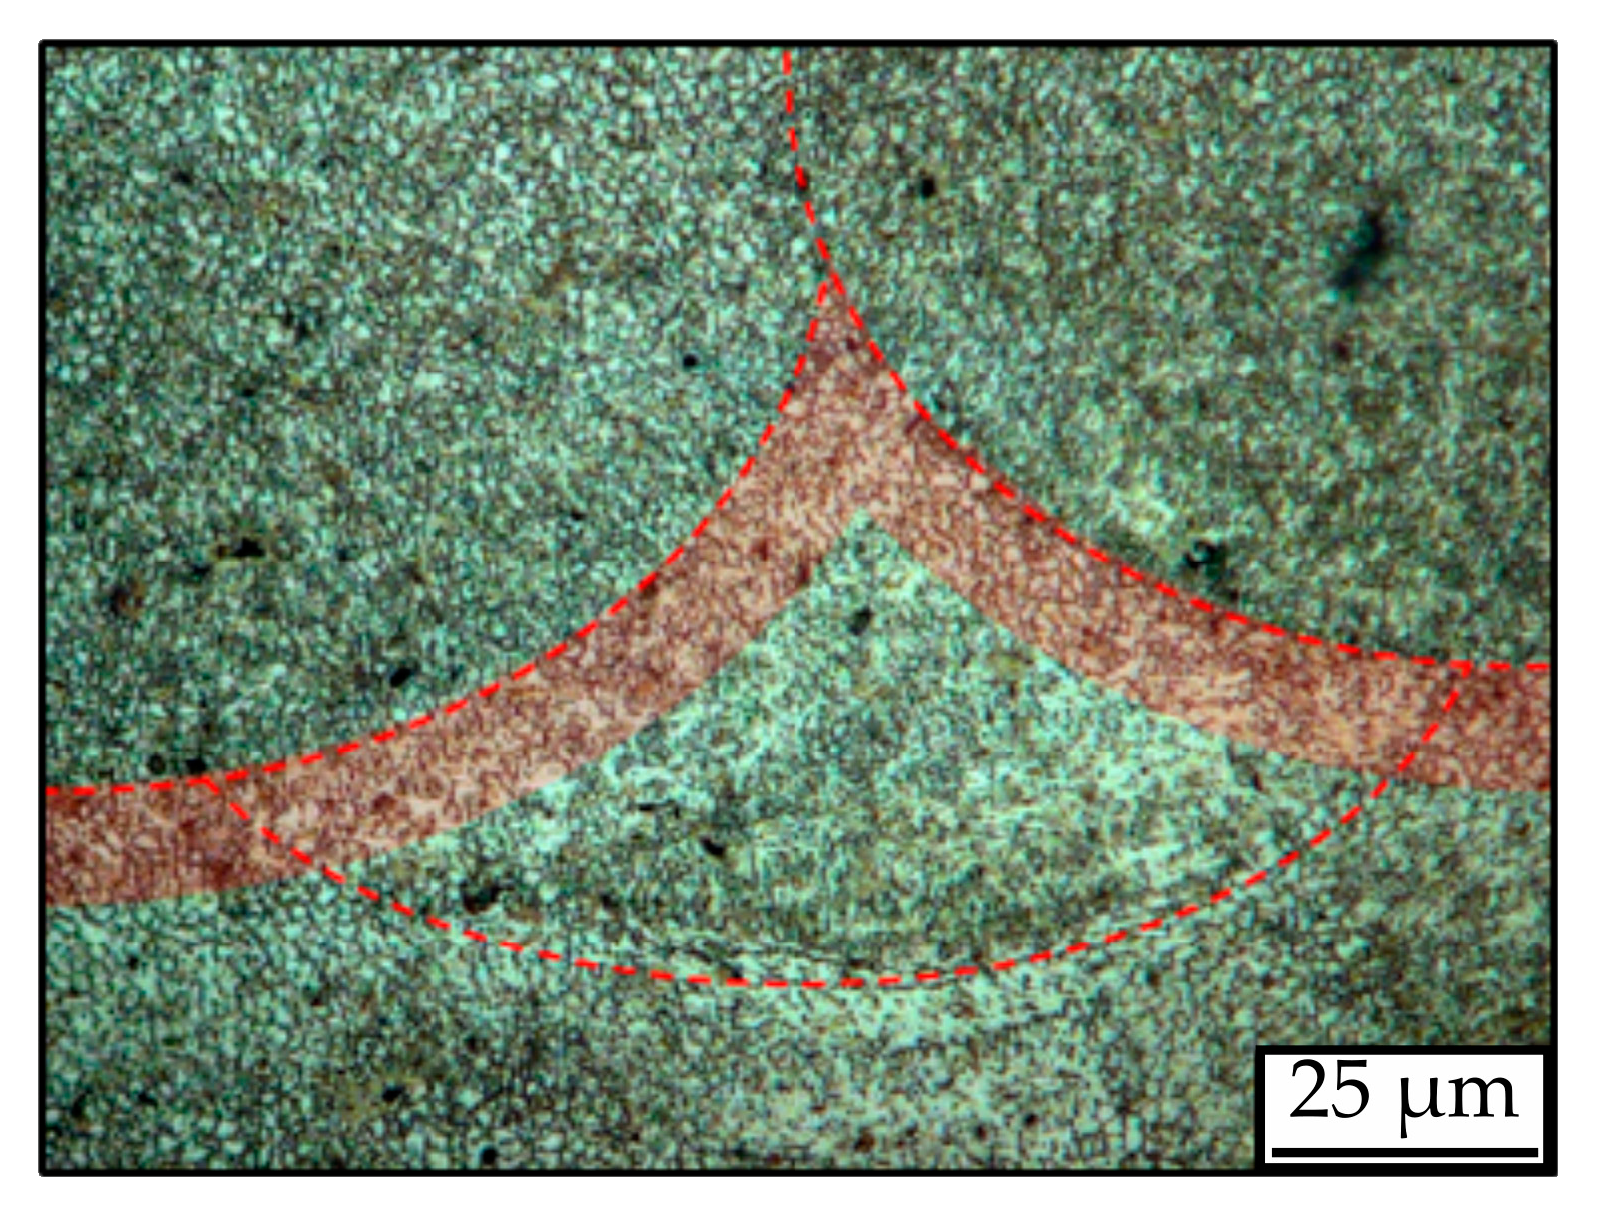
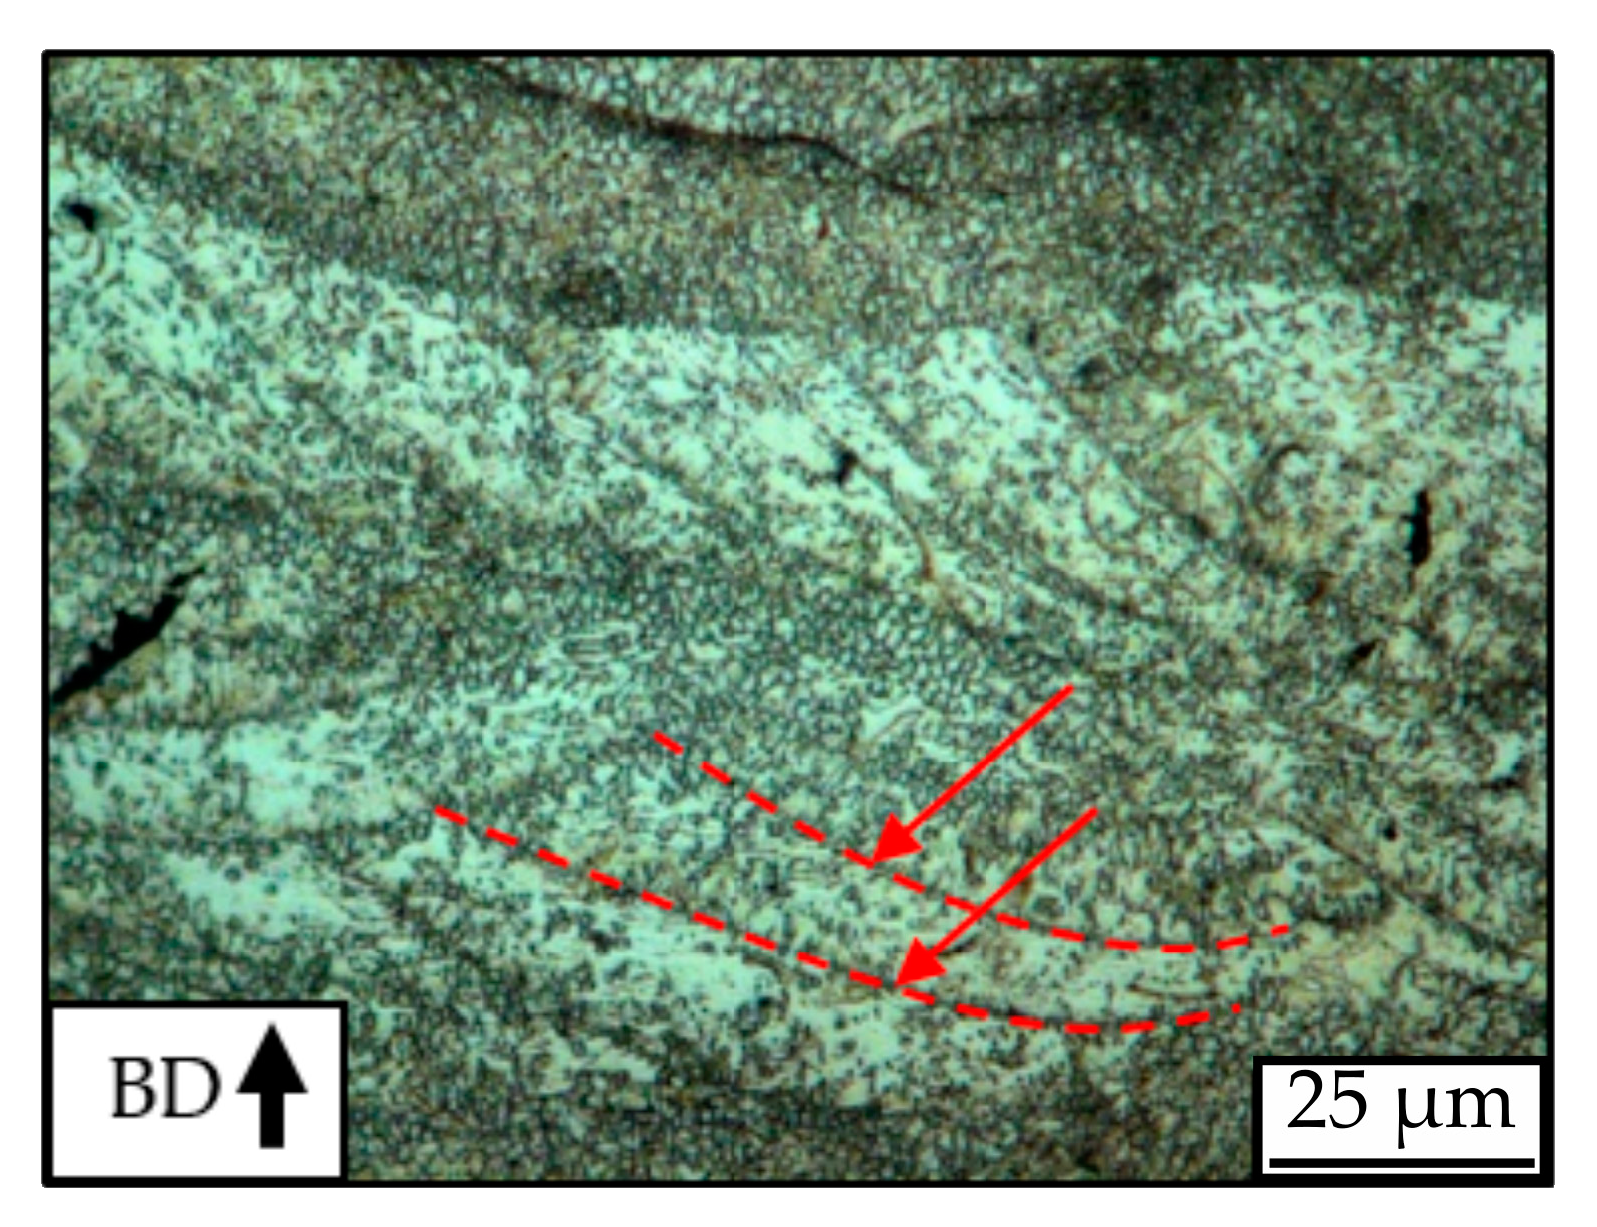
3.2.1. Magnesium
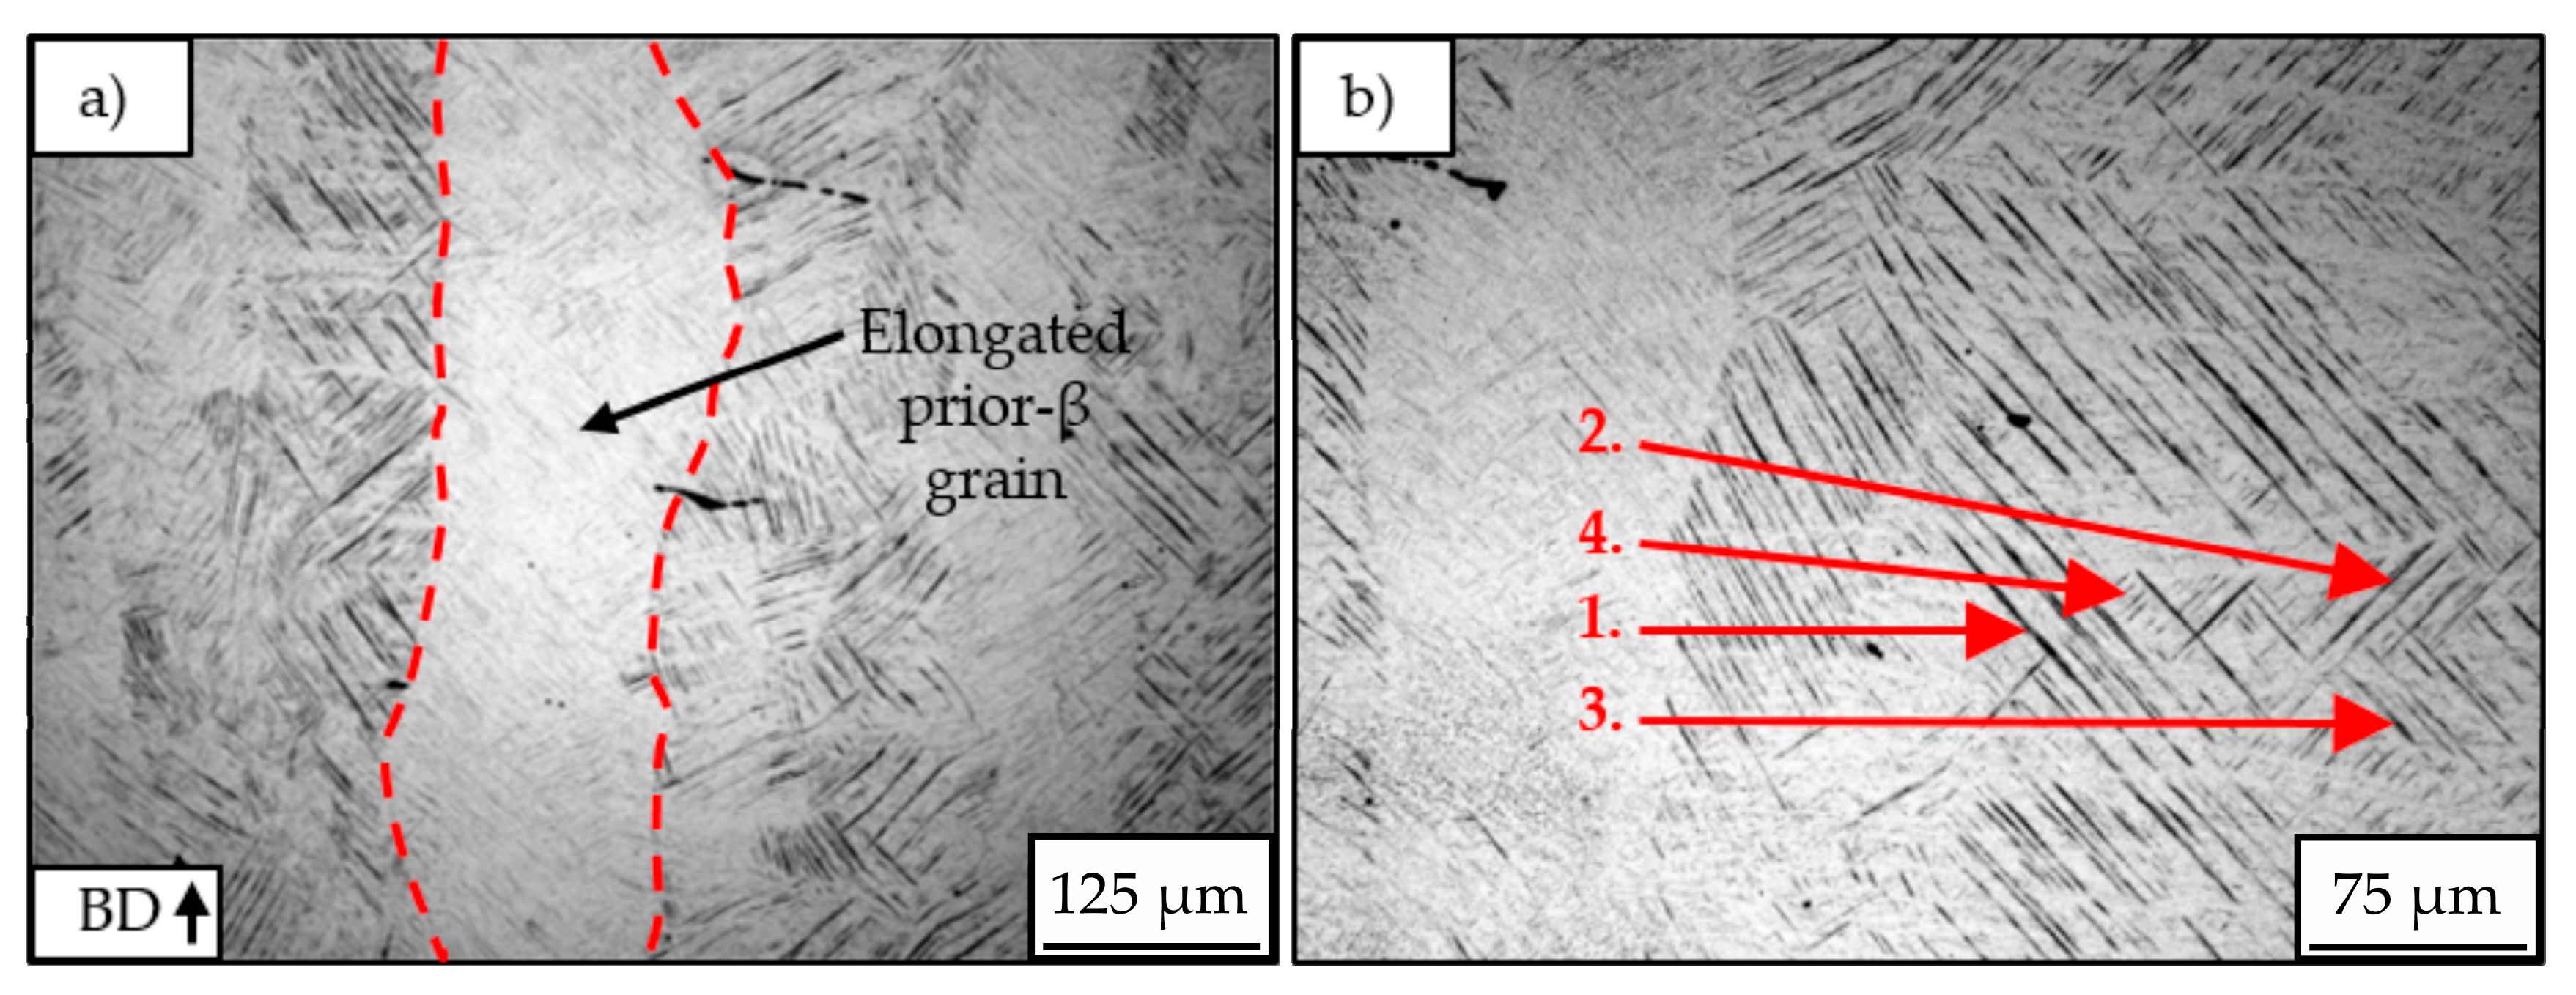
3.2.2. Titanium
3.3. Corrosion Tests
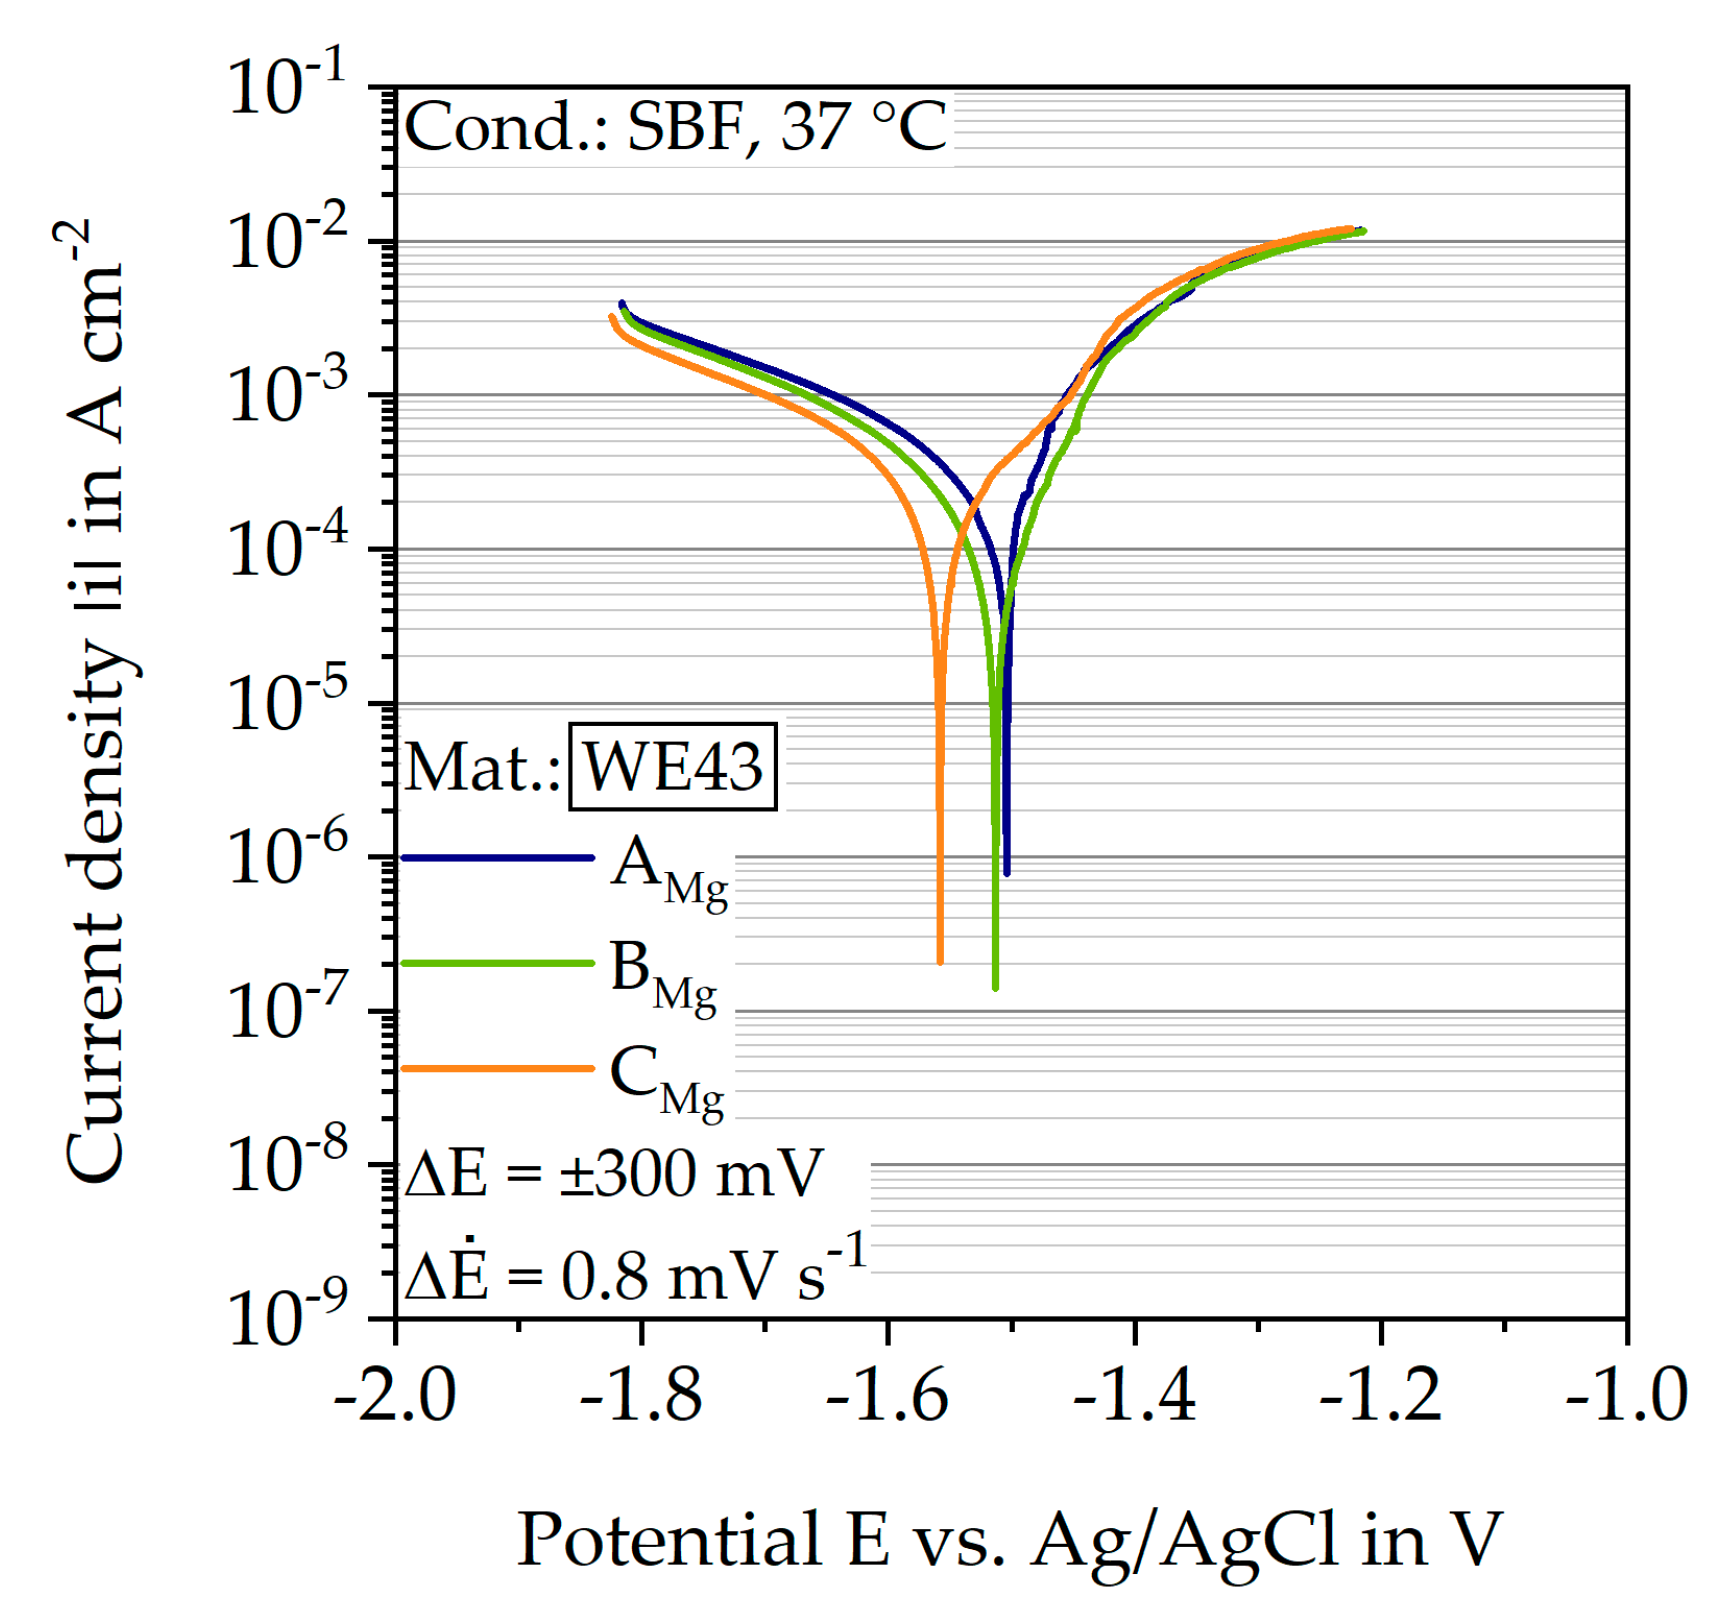
3.3.1. Potentiodynamic Polarization
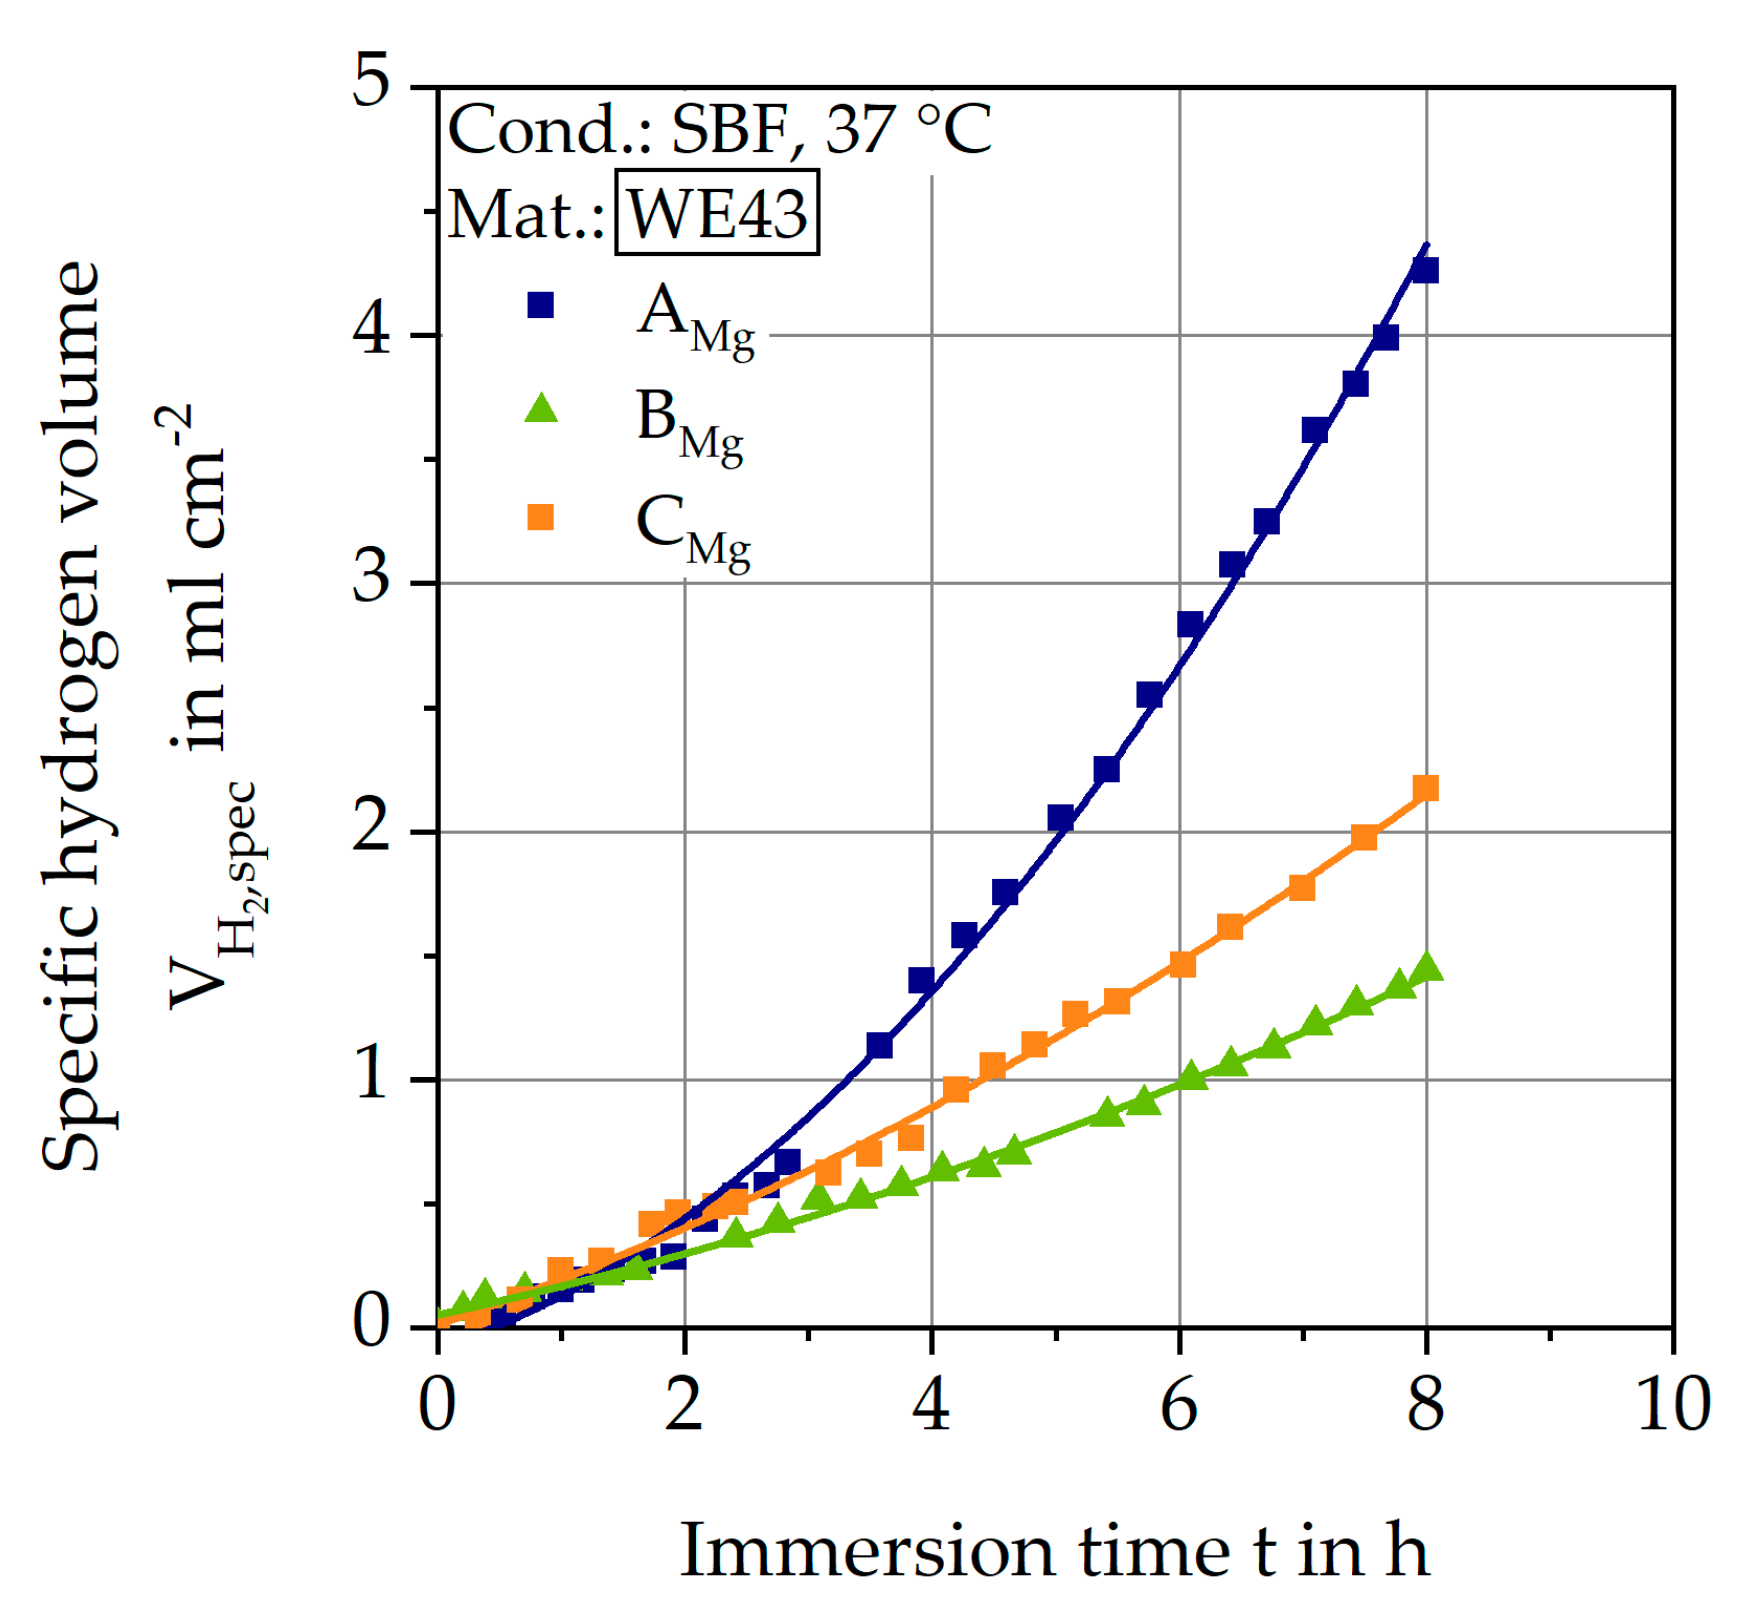
3.3.2. Immersion Tests
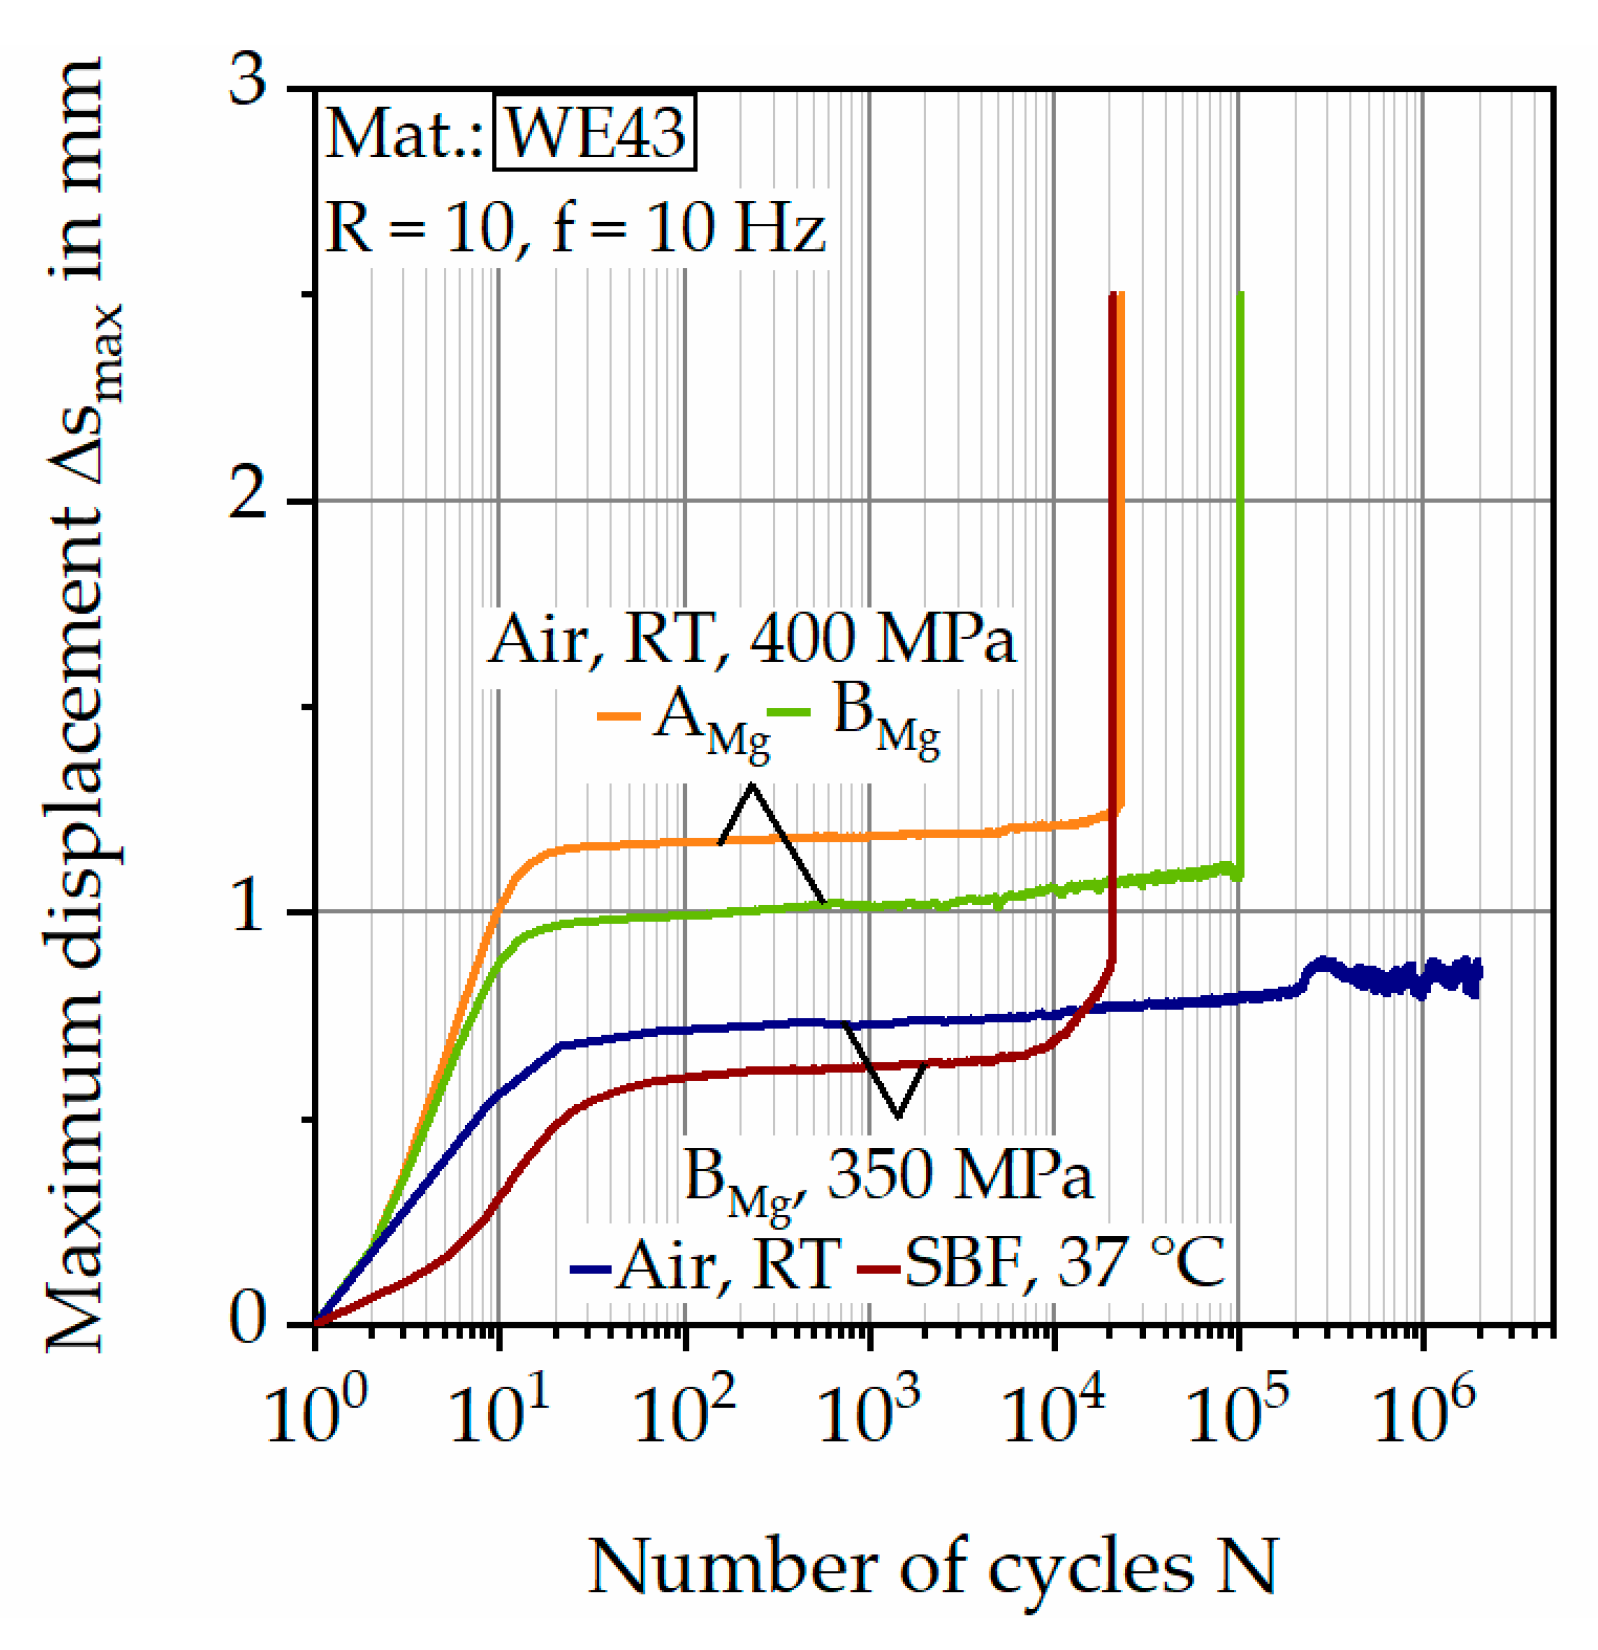
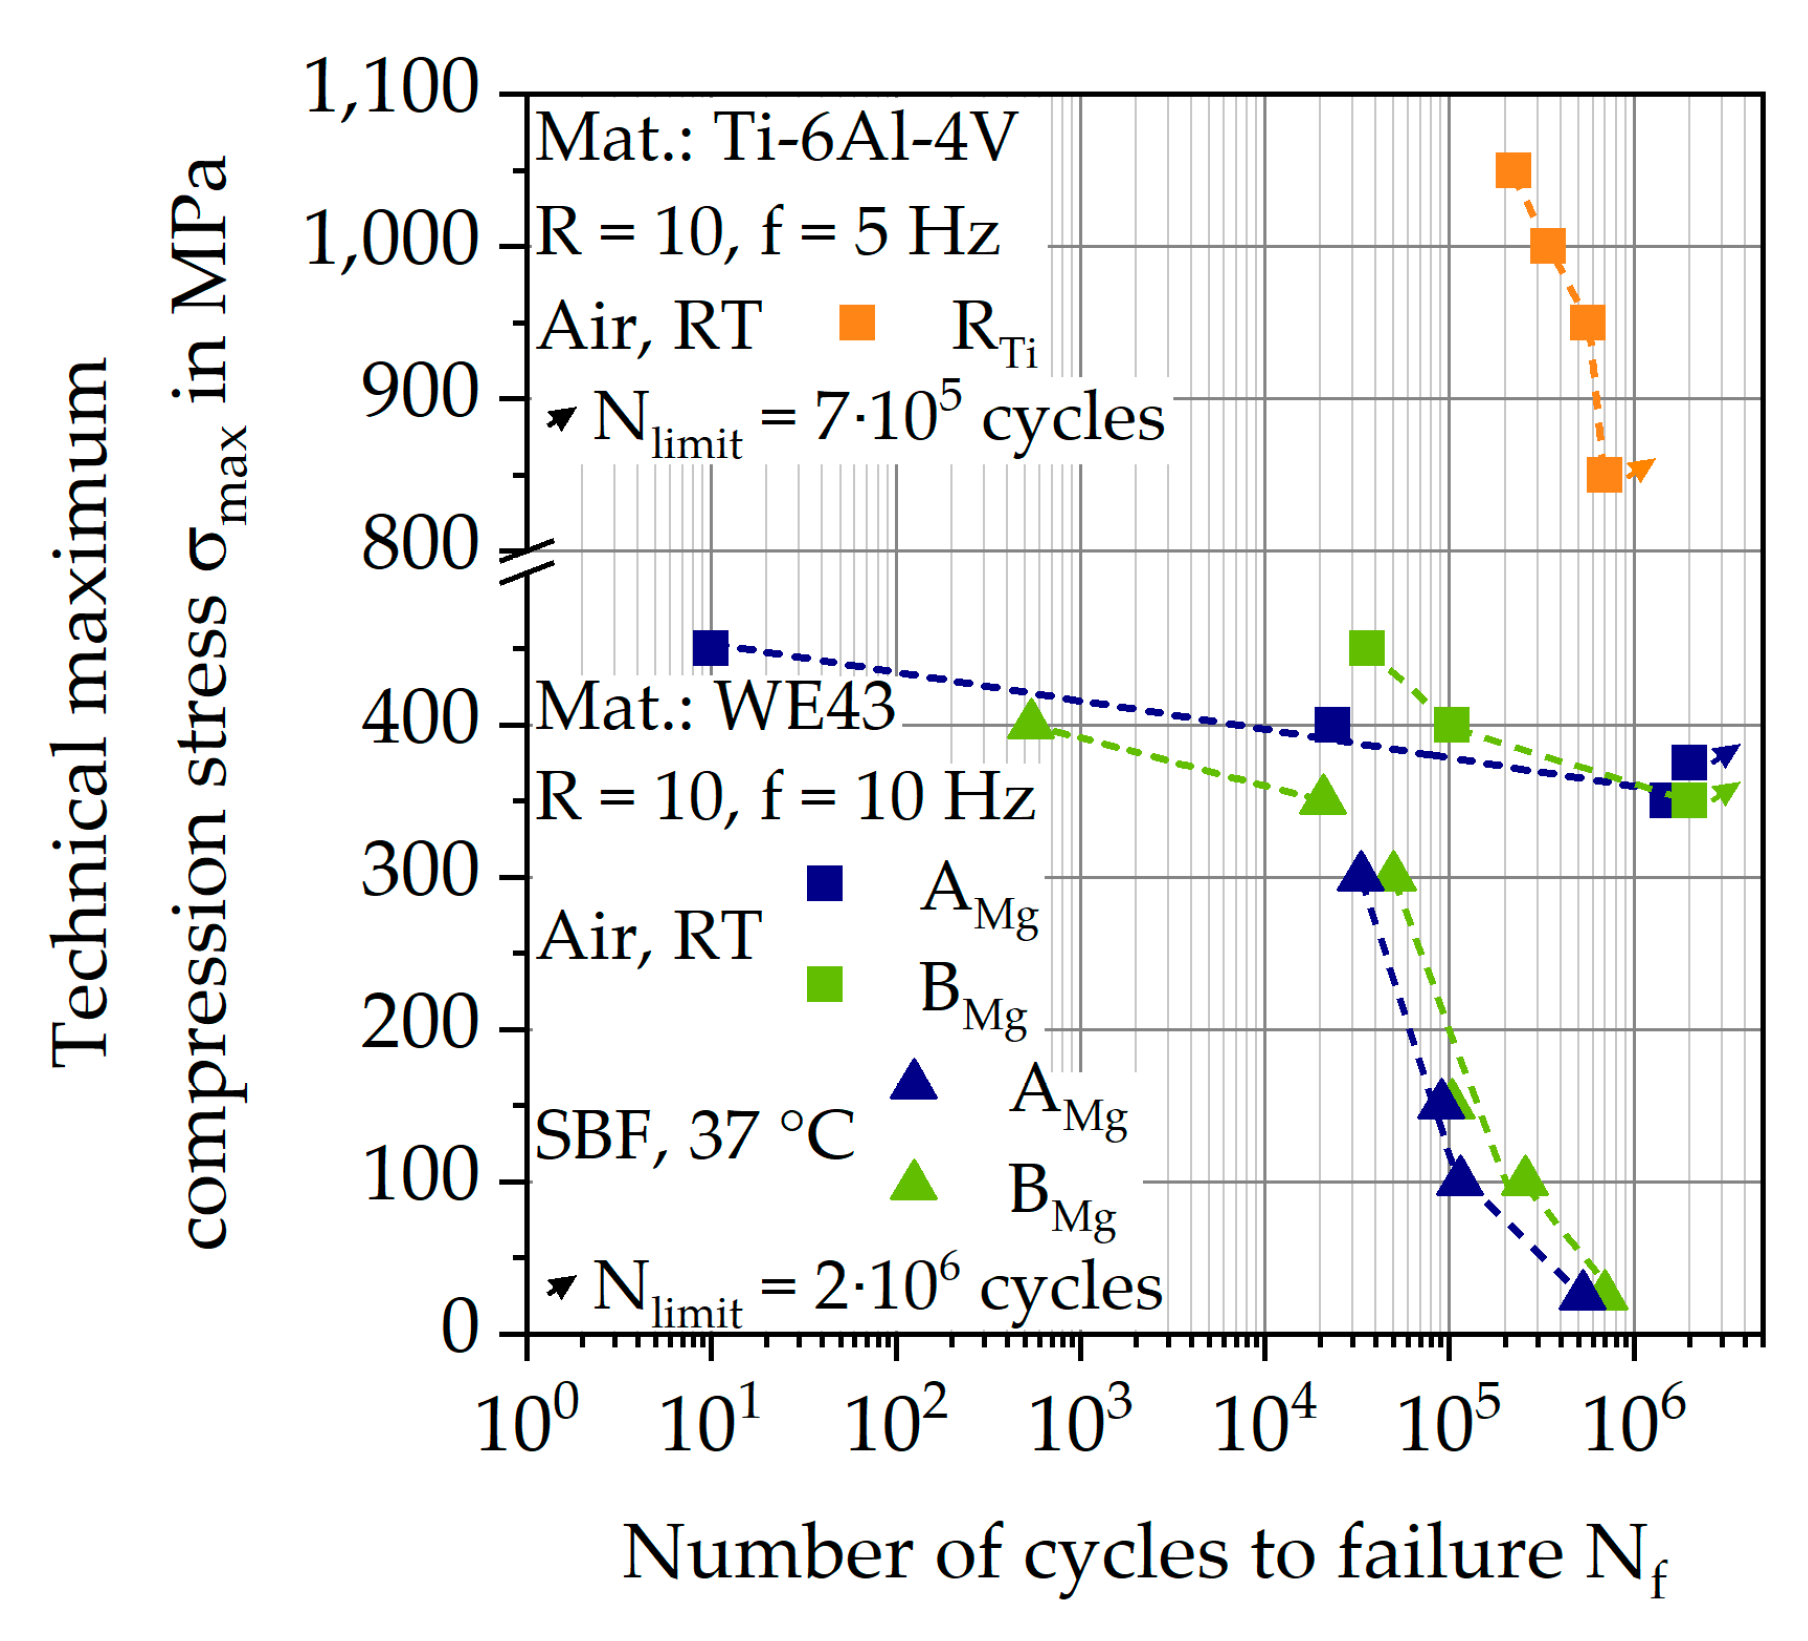
3.4. Corrosion Fatigue Tests
3.5. Fractography
4. Discussion
4.1. Computer Tomography
4.2. Microstructure
4.2.1. Magnesium
4.2.2. Titanium
4.3. Corrosion Behavior
4.4. Fatigue Behavior
5. Conclusions and Outlook
Author Contributions
Funding
Acknowledgments
Conflicts of Interest
References
- Arsiwala, A.; Desai, P.; Patravale, V. Recent advances in micro/nanoscale biomedical implants. J. Control Release 2014, 189, 25–45. [Google Scholar] [CrossRef] [PubMed]
- Wilson, J. Metallic Biomaterials. In Fundamental Biomaterials; Elsevier Duxford: Cambridge, MA, USA, 2018; pp. 1–33. [Google Scholar]
- Murr, L.E.; Gaytan, S.M.; Medina, F.; Martinez, E.; Martinez, J.L.; Hernandez, D.H.; Machado, B.I.; Ramirez, D.A.; Wicker, R.B. Characterization of Ti–6Al–4V open cellular foams fabricated by additive manufacturing using electron beam melting. Mater. Sci. Eng. A 2010, 527, 1861–1868. [Google Scholar] [CrossRef]
- Dallago, M.; Fontanari, V.; Torresani, E.; Leoni, M.; Pederzolli, C.; Potrich, C.; Benedetti, M. Fatigue and biological properties of Ti-6Al-4V ELI cellular structures with variously arranged cubic cells made by selective laser melting. J. Mech. Behav. Biomed. Mater. 2018, 78, 381–394. [Google Scholar] [CrossRef] [PubMed]
- Singh, R.; Lee, P.D.; Dashwood, R.J.; Lindley, T.C. Titanium foams for biomedical applications: A review. Mater. Technol. 2010, 25, 127–136. [Google Scholar] [CrossRef]
- Doi, K.; Miyabe, S.; Tsuchiya, H.; Fujimoto, S. Degradation of Ti-6Al-4V alloy under cyclic loading in a simulated body environment with cell culturing. J. Mech. Behav. Biomed. Mater. 2016, 56, 6–13. [Google Scholar] [CrossRef] [PubMed]
- Liu, Y.J.; Ouyang, Q.L.; Tian, R.H.; Wang, Q.Y. Fatigue Properties of Ti-6Al-4V Subjected to Simulated Body Fluid. Struct. Longev. 2009, 2, 169–176. [Google Scholar]
- Orlov, D.; Joshi, V.; Solanki, K.N.; Neelameggham, N.R. Magnesium Technology; Springer International Publishing: Cham, Germany, 2018. [Google Scholar]
- Saris, N.-E.L.; Mervaala, E.; Karppanen, H.; Khawaja, J.A.; Lewenstam, A. Magnesium—An update on physiological, clinical and analytical aspects. Clin. Chim. Acta 2000, 294, 1–26. [Google Scholar] [CrossRef]
- Staiger, M.P.; Pietak, A.M.; Huadmai, J.; Dias, G. Magnesium and its alloys as orthopedic biomaterials: A review. Biomaterials 2006, 27, 1728–1734. [Google Scholar] [CrossRef] [PubMed]
- Jung, O.; Smeets, R.; Porchetta, D.; Kopp, A.; Ptock, C.; Müller, U.; Heiland, M.; Schwade, M.; Behr, B.; Kröger, N. Optimized in vitro procedure for assessing the cytocompatibility of magnesium-based biomaterials. Acta Biomater. 2015, 23, 354–363. [Google Scholar] [CrossRef]
- Jung, O.; Smeets, R.; Kopp, A.; Porchetta, D.; Hiester, P.; Heiland, M.; Friedrich, R.E.; Precht, C.; Hanken, H.; Gröbe, A.; et al. PEO-generated Surfaces Support Attachment and Growth of Cells In Vitro with No Additional Benefit for Micro-roughness in Sa (0.2–4 µm). In Vivo 2016, 30, 27–33. [Google Scholar]
- Li, Z.; Gu, X.; Lou, S.; Zheng, Y. The development of binary Mg-Ca alloys for use as biodegradable materials within bone. Biomaterials 2008, 29, 1329–1344. [Google Scholar] [CrossRef] [PubMed]
- Singh Raman, R.K.; Jafari, S.; Harandi, S.E. Corrosion fatigue fracture of magnesium alloys in bioimplant applications: A review. Eng. Fract. Mech. 2015, 137, 97–108. [Google Scholar] [CrossRef]
- Kannan, M.B.; Raman, R.K.S. In vitro degradation and mechanical integrity of calcium-containing magnesium alloys in modified-simulated body fluid. Biomaterials 2008, 29, 2306–2314. [Google Scholar] [CrossRef] [PubMed]
- Zander, D.; Schnatterer, C. The influence of manufacturing processes on the microstructure and corrosion of the AZ91D magnesium alloy evaluated using a computational image analysis. Corros. Sci. 2015, 98, 291–303. [Google Scholar] [CrossRef]
- Frankel, G.S.; Fajardo, S.; Lynch, B.M. Introductory lecture on corrosion chemistry: A focus on anodic hydrogen evolution on Al and Mg. Faraday Discuss. 2015, 180, 11–33. [Google Scholar] [CrossRef] [PubMed]
- Höche, D.; Blawert, C.; Lamaka, S.V.; Scharnagl, N.; Mendis, C.; Zheludkevich, M.L. The effect of iron re-deposition on the corrosion of impurity-containing magnesium. Phys. Chem Chem Phys. 2016, 18, 1279–1291. [Google Scholar] [CrossRef]
- Birbilis, N.; King, A.D.; Thomas, S.; Frankel, G.S.; Scully, J.R. Evidence for enhanced catalytic activity of magnesium arising from anodic dissolution. Electrochim. Acta 2014, 132, 277–283. [Google Scholar] [CrossRef]
- Chen, C.; Liu, T.; Lv, C.; Lu, L.; Luo, D. Study on cyclic deformation behavior of extruded Mg–3Al–1Zn alloy. Mater. Sci. Eng. A 2012, 539, 223–229. [Google Scholar] [CrossRef]
- Feng, C.Y.; Wang, X.G.; Tang, P.H. Research on Low Cycle Fatigue Behavior and Life Prediction of Magnesium Alloy AZ91D. Adv. Mater. Res. 2012, 482, 575–580. [Google Scholar] [CrossRef]
- Patel, H.A.; Rashidi, N.; Chen, D.L.; Bhole, S.D.; Luo, A.A. Cyclic deformation behavior of a super-vacuum die cast magnesium alloy. Mater. Sci. Eng. A 2012, 546, 72–81. [Google Scholar] [CrossRef]
- Jafari, S.; Singh Raman, R.K.; Davies, C.H.J. Corrosion fatigue of a magnesium alloy in modified simulated body fluid. Eng. Fract. Mech. 2015, 137, 2–11. [Google Scholar] [CrossRef]
- Jafari, S.; Raman, R.K.S.; Davies, C.H.J.; Hofstetter, J.; Uggowitzer, P.J.; Löffler, J.F. Stress corrosion cracking and corrosion fatigue characterisation of MgZn1Ca0.3 (ZX10) in a simulated physiological environment. J. Mech. Behav. Biomed. Mater. 2017, 65, 634–643. [Google Scholar] [CrossRef] [PubMed]
- Bian, D.; Zhou, W.; Liu, Y.; Li, N.; Zheng, Y.; Sun, Z. Fatigue behaviors of HP-Mg, Mg-Ca and Mg-Zn-Ca biodegradable metals in air and simulated body fluid. Acta Biomater 2016, 41, 351–360. [Google Scholar] [CrossRef] [PubMed]
- Krujatz, F.; Lode, A.; Seidel, J.; Bley, T.; Gelinsky, M.; Steingroewer, J. Additive Biotech-Chances, challenges, and recent applications of additive manufacturing technologies in biotechnology. New Biotechnol. 2017, 39, 222–231. [Google Scholar] [CrossRef] [PubMed]
- Singh, S.; Ramakrishna, S. Biomedical applications of additive manufacturing: Present and future. Curr. Opin. Biomed. Eng. 2017, 2, 105–115. [Google Scholar] [CrossRef]
- Tan, X.P.; Tan, Y.J.; Chow, C.S.L.; Tor, S.B.; Yeong, W.Y. Metallic powder-bed based 3D printing of cellular scaffolds for orthopaedic implants: A state-of-the-art review on manufacturing, topological design, mechanical properties and biocompatibility. Mater. Sci. Eng. C Mater. Biol. Appl. 2017, 76, 1328–1343. [Google Scholar] [CrossRef] [PubMed]
- Emmelmann, C.; Sander, P.; Kranz, J.; Wycisk, E. Laser Additive Manufacturing and Bionics: Redefining Lightweight Design. Phys. Procedia 2011, 12, 364–368. [Google Scholar] [CrossRef] [Green Version]
- Liu, S.; Shin, Y.C. Additive manufacturing of Ti6Al4V alloy: A review. Mater. Des. 2019, 164, 107552. [Google Scholar] [CrossRef]
- Wysocki, B.; Maj, P.; Sitek, R.; Buhagiar, J.; Kurzydłowski, K.; Święszkowski, W. Laser and Electron Beam Additive Manufacturing Methods of Fabricating Titanium Bone Implants. Appl. Sci. 2017, 7, 657. [Google Scholar] [CrossRef]
- Tammas-Williams, S.; Zhao, H.; Léonard, F.; Derguti, F.; Todd, I.; Prangnell, P.B. XCT analysis of the influence of melt strategies on defect population in Ti–6Al–4V components manufactured by Selective Electron Beam Melting. Mater. Charact. 2015, 102, 47–61. [Google Scholar] [CrossRef]
- Liu, D.; Yang, D.; Li, X.; Hu, S. Mechanical properties, corrosion resistance and biocompatibilities of degradable Mg-RE alloys: A review. J. Mater. Res. Technol. 2019, 8, 1538–1549. [Google Scholar] [CrossRef]
- DIN 50106–Testing of Metallic Materials–Compression Test at Room Temperature; German Institute for Standardization: Berlin, Germany, 2016.
- Kokubo, T.; Kushitani, H.; Sakka, S. Solutions able to reproduce in vivo surface-structure changes in bioactive glass-ceramic A-W3. J. Biomed. Mater. Res. 1990, 24, 721–734. [Google Scholar] [CrossRef]
- Voges, I.; Jerosch-Herold, M.; Hedderich, J.; Pardun, E.; Hart, C.; Gabbert, D.D.; Hansen, J.H.; Petko, C.; Kramer, H.-H.; Rickers, C. Normal values of aortic dimensions, distensibility, and pulse wave velocity in children and young adults: A cross-sectional study. J. Cardiovasc. Magn. Reson. 2012, 14, 77. [Google Scholar] [CrossRef] [PubMed]
- Hao, Y.-L.; Li, S.-J.; Yang, R. Biomedical titanium alloys and their additive manufacturing. Rare Met. 2016, 35, 661–671. [Google Scholar] [CrossRef]
- Yang, J.; Yu, H.; Yin, J.; Gao, M.; Wang, Z.; Zeng, X. Formation and control of martensite in Ti-6Al-4V alloy produced by selective laser melting. Mater. Des. 2016, 108, 308–318. [Google Scholar] [CrossRef]
- Agius, D.; Kourousis, K.; Wallbrink, C. A Review of the As-Built SLM Ti-6Al-4V Mechanical Properties towards Achieving Fatigue Resistant Designs. Metals 2018, 8, 75. [Google Scholar] [CrossRef]
- Bourell, D.; Kruth, J.P.; Leu, M.; Levy, G.; Rosen, D.; Beese, A.M.; Clare, A. Materials for additive manufacturing. Cirp. Ann. 2017, 66, 659–681. [Google Scholar] [CrossRef]
- Zumdick, N.A.; Jauer, L.; Kersting, L.C.; Kutz, T.N.; Schleifenbaum, J.H.; Zander, D. Additive manufactured WE43 magnesium: A comparative study of the microstructure and mechanical properties with those of powder extruded and as-cast WE43. Mater. Charact. 2019, 147, 384–397. [Google Scholar] [CrossRef]
- Luo, K.; Zhang, L.; Wu, G.; Liu, W.; Ding, W. Effect of Y and Gd content on the microstructure and mechanical properties of Mg–Y–RE alloys. J. Magnes. Alloy. 2019, 7, 345–354. [Google Scholar] [CrossRef]
- Jiang, H.S.; Zheng, M.Y.; Qiao, X.G.; Wu, K.; Peng, Q.Y.; Yang, S.H.; Yuan, Y.H.; Luo, J.H. Microstructure and mechanical properties of WE43 magnesium alloy fabricated by direct-chill casting. Mater. Sci. Eng. A 2017, 684, 158–164. [Google Scholar] [CrossRef]
- Qin, Y.; Wen, P.; Guo, H.; Xia, D.; Zheng, Y.; Jauer, L.; Poprawe, R.; Voshage, M.; Schleifenbaum, J.H. Additive manufacturing of biodegradable metals: Current research status and future perspectives. Acta Biomater. 2019. [Google Scholar] [CrossRef] [PubMed]
- Xiang, C.; Gupta, N.; Coelho, P.; Cho, K. Effect of microstructure on tensile and compressive behavior of WE43 alloy in as cast and heat treated conditions. Mater. Sci. Eng. A 2018, 710, 74–85. [Google Scholar] [CrossRef]
- Soderlind, J.; Cihova, M.; Schäublin, R.; Risbud, S.; Löffler, J.F. Towards refining microstructures of biodegradable magnesium alloy WE43 by spark plasma sintering. Acta Biomater. 2019. [Google Scholar] [CrossRef] [PubMed]
- Sing, S.L.; An, J.; Yeong, W.Y.; Wiria, F.E. Laser and electron-beam powder-bed additive manufacturing of metallic implants: A review on processes, materials and designs. J. Orthop. Res. 2016, 34, 369–385. [Google Scholar] [CrossRef] [PubMed]
- Parry, L.; Ashcroft, I.A.; Wildman, R.D. Understanding the effect of laser scan strategy on residual stress in selective laser melting through thermo-mechanical simulation. Addit. Manuf. 2016, 12, 1–15. [Google Scholar] [CrossRef] [Green Version]
- Gokuldoss, P.K.; Kolla, S.; Eckert, J. Additive Manufacturing Processes: Selective Laser Melting, Electron Beam Melting and Binder Jetting-Selection Guidelines. Materials 2017, 10, 672. [Google Scholar] [CrossRef]
- Qiu, C.; Kindi, M.A.; Aladawi, A.S.; Hatmi, I.A. A comprehensive study on microstructure and tensile behaviour of a selectively laser melted stainless steel. Sci. Rep. 2018, 8, 7785. [Google Scholar] [CrossRef]
- Lee, E.; Vasudevan, A.; Sadananda, K. Effects of various environments on fatigue crack growth in Laser formed and IM Ti–6Al–4V alloys. Int. J. Fatigue 2005, 27, 1597–1607. [Google Scholar] [CrossRef]
- Bache, M.R.; Evans, W.J. The fatigue crack propagation resistance of Ti–6Al–4V under aqueous saline environments. Int. J. Fatigue 2001, 23, 319–323. [Google Scholar] [CrossRef]
- Fleck, C.; Eifler, D. Corrosion, fatigue and corrosion fatigue behaviour of metal implant materials, especially titanium alloys. Int. J. Fatigue 2010, 32, 929–935. [Google Scholar] [CrossRef]
- Kirkland, N.T.; Birbilis, N.; Staiger, M.P. Assessing the corrosion of biodegradable magnesium implants: A critical review of current methodologies and their limitations. Acta Biomater. 2012, 8, 925–936. [Google Scholar] [CrossRef] [PubMed]
- Davenport, A.J.; Padovani, C.; Connolly, B.J.; Stevens, N.P.C.; Beale, T.A.W.; Groso, A.; Stampanoni, M. Synchrotron X-Ray Microtomography Study of the Role of Y in Corrosion of Magnesium Alloy WE43. Electrochem. Solid State Lett. 2007, 10, C5–C8. [Google Scholar] [CrossRef]
- Jin, W.; Wu, G.; Feng, H.; Wang, W.; Zhang, X.; Chu, P.K. Improvement of corrosion resistance and biocompatibility of rare-earth WE43 magnesium alloy by neodymium self-ion implantation. Corros. Sci. 2015, 94, 142–155. [Google Scholar] [CrossRef]
- Ninlachart, J.; Karmiol, Z.; Chidambaram, D.; Raja, K.S. Effect of heat treatment conditions on the passivation behavior of WE43C Mg-Y-Nd alloy in chloride containing alkaline environments. J. Magnes. Alloys 2017, 5, 147–165. [Google Scholar] [CrossRef]
- Chu, P.-W.; Marquis, E.A. Linking the microstructure of a heat-treated WE43 Mg alloy with its corrosion behavior. Corros. Sci. 2015, 101, 94–104. [Google Scholar] [CrossRef]
- Martinez Sanchez, A.H.; Luthringer, B.J.C.; Feyerabend, F.; Willumeit, R. Mg and Mg alloys: How comparable are in vitro and in vivo corrosion rates? A review. Acta Biomater. 2015, 13, 16–31. [Google Scholar] [CrossRef] [PubMed] [Green Version]
- Körner, C.; Bauereiß, A.; Attar, E. Fundamental consolidation mechanisms during selective beam melting of powders. Model. Simul. Mater. Sci. Eng. 2013, 21, 85011. [Google Scholar] [CrossRef]
- Zhao, J.; Gao, L.-L.; Gao, H.; Yuan, X.; Chen, X. Biodegradable behaviour and fatigue life of ZEK100 magnesium alloy in simulated physiological environment. Fatigue Fract. Eng. Mater. Struct. 2015, 38, 904–913. [Google Scholar] [CrossRef]
- Gu, X.N.; Zhou, W.R.; Zheng, Y.F.; Cheng, Y.; Wei, S.C.; Zhong, S.P.; Xi, T.F.; Chen, L.J. Corrosion fatigue behaviors of two biomedical Mg alloys—AZ91D and WE43—In simulated body fluid. Acta Biomater. 2010, 6, 4605–4613. [Google Scholar] [CrossRef]
- Lévesque, J.; Hermawan, H.; Dubé, D.; Mantovani, D. Design of a pseudo-physiological test bench specific to the development of biodegradable metallic biomaterials. Acta Biomater. 2008, 4, 284–295. [Google Scholar] [CrossRef]


| Processing Parameter | Batch AMg | Batch BMg | Batch CMg |
|---|---|---|---|
| Scanning speed in mm/s | 1000 | 300 | 450 |
| Hatch distance in µm | 15 | 110 | 100 |
| Exposure | single | single | double |
| Layer size in µm | 50 | 30 | 50 |
| Processing Parameter | Batch ATi | Batch BTi | Batch CTi |
|---|---|---|---|
| Laser power in W | 100 | 115 | 130 |
| Scanning speed in mm/s | 1000 | 1200 | 1400 |
| Ion Concentration in mmol/L | |||||||
|---|---|---|---|---|---|---|---|
| Simulated Body Fluid (SBF) | Na+ | K+ | Ca2+ | Mg2+ | (HCO3)− | Cl− | (HPO4)2− |
| 142.0 | 5.0 | 2.5 | 1.5 | 4.2 | 147.8 | 1.0 | |
| in mg cm−2 a−1 | |||
|---|---|---|---|
| Batch | Ecorr in V | PDP | Immersion |
| AMg | −1.50 | 1.5∙103 | 7.2∙103 |
| BMg | −1.51 | 0.6∙103 | 2.2∙103 |
| CMg | −1.56 | 1.1∙103 | 3.1∙103 |
© 2019 by the authors. Licensee MDPI, Basel, Switzerland. This article is an open access article distributed under the terms and conditions of the Creative Commons Attribution (CC BY) license (http://creativecommons.org/licenses/by/4.0/).
Share and Cite
Wegner, N.; Kotzem, D.; Wessarges, Y.; Emminghaus, N.; Hoff, C.; Tenkamp, J.; Hermsdorf, J.; Overmeyer, L.; Walther, F. Corrosion and Corrosion Fatigue Properties of Additively Manufactured Magnesium Alloy WE43 in Comparison to Titanium Alloy Ti-6Al-4V in Physiological Environment. Materials 2019, 12, 2892. https://doi.org/10.3390/ma12182892
Wegner N, Kotzem D, Wessarges Y, Emminghaus N, Hoff C, Tenkamp J, Hermsdorf J, Overmeyer L, Walther F. Corrosion and Corrosion Fatigue Properties of Additively Manufactured Magnesium Alloy WE43 in Comparison to Titanium Alloy Ti-6Al-4V in Physiological Environment. Materials. 2019; 12(18):2892. https://doi.org/10.3390/ma12182892
Chicago/Turabian StyleWegner, Nils, Daniel Kotzem, Yvonne Wessarges, Nicole Emminghaus, Christian Hoff, Jochen Tenkamp, Jörg Hermsdorf, Ludger Overmeyer, and Frank Walther. 2019. "Corrosion and Corrosion Fatigue Properties of Additively Manufactured Magnesium Alloy WE43 in Comparison to Titanium Alloy Ti-6Al-4V in Physiological Environment" Materials 12, no. 18: 2892. https://doi.org/10.3390/ma12182892