Effect of Stochastic Loading on Tensile Damage and Fracture of Fiber-Reinforced Ceramic-Matrix Composites


College of Civil Aviation, Nanjing University of Aeronautics and Astronautics, No.29 Yudao St., Nanjing 210016, China
Materials 2020, 13(11), 2469; https://doi.org/10.3390/ma13112469
Submission received: 27 April 2020
/
Revised: 24 May 2020
/
Accepted: 26 May 2020
/
Published: 28 May 2020
Abstract
:In this paper, the effect of stochastic loading on tensile damage and fracture of fiber-reinforced ceramic-matrix composites (CMCs) is investigated. A micromechanical constitutive model is developed considering multiple damage mechanisms under tensile loading. The relationship between stochastic stress, tangent modulus, interface debonding and fiber broken is established. The effects of the fiber volume, interface shear stress, interface debonding energy, saturation matrix crack spacing and fiber strength on tensile stress–strain curve, tangent modulus, interface debonding fraction and fiber broken fraction are analyzed. The experimental tensile damage and fracture of unidirectional and 2D SiC/SiC composites subjected to different stochastic loading stress are predicted. When fiber volume increases, the initial composite strain decreases, the initial tangent modulus increases, the transition stress for interface debonding decreases and the initial fiber broken fraction decreases. When fiber strength increases, the initial composite strain and fiber broken fraction decrease.
1. Introduction
Ceramic-matrix composites (CMCs) have the advantages of high-temperature resistance, corrosion resistance, low density, high specific strength and high specific modulus [1]. The fabrication methods of CMCs include the chemical vapor infiltration (CVI), polymer infiltration and pyrolysis process (PIP) and melt infiltration (MI). The mechanical performance of CMCs depends on the fabrication method. To ensure the reliability and safety of fiber-reinforced CMCs used in hot-section components of an aero engine, it is necessary to develop performance evaluation, damage evolution, strength and life prediction tools for airworthiness certification [2]. Since the applications of fiber-reinforced CMCs involve components with lives that are measured in tens of thousands of hours, the successful design and implementation of CMC components depend on the knowledge of the material behavior over periods of time comparable to the expected service life of the component [3].
Under tensile loading, multiple damage mechanisms of matrix cracking, interface debonding and fiber failure occur [4,5,6,7,8]. The tensile stress–strain curves can be divided into four stages, including:
- (1)
- Stage I, linear-elastic region.
- (2)
- Stage II, matrix cracking and interface debonding region. Matrix micro cracking occurs first and the fiber debonding from the matrix, leading to nonlinear behavior of CMCs.
- (3)
- Stage III, saturation matrix cracking region. Matrix cracking approaches saturation with complete debonding of the fiber from the matrix.
- (4)
- Stage IV, fiber failure region. The fiber gradually fractures with increasing applied stress.
The composite elastic modulus, proportional limit stress, ultimate tensile strength and the fracture strain can be obtained from the tensile stress–strain curve. For the SiC/SiC composite fabricated using the MI method, the fracture strength and strain of Hi-Nicalon S SiC/SiC composite is much higher than that of Tyranno SA3 SiC/SiC composite; however, the initial elastic modulus and proportional limit stress of Hi-Nicalon S SiC/SiC composite is lower than that of Tyranno SA3 SiC/SiC composite at the same fiber volume of 34.8% and the composite tensile strength increases with the fiber volume [9]. Marshall et al. [10] and Zok and Spearing [11] investigated the first matrix cracking and matrix multiple cracking evolution in fiber-reinforced CMCs using the fracture mechanics approach. Curtin [12] investigated multiple matrix cracking evolution of CMCs considering matrix internal flaws. Evans [13] developed an approach for design and life prediction issues for fiber-reinforced CMCs and established the relationship between macro mechanical behavior and constituent properties of CMCs. McNulty and Zok [14] investigated the low-cycle fatigue damage mechanism and established the damage models for predicting the low-cycle fatigue life of CMCs. Naslain et al. [15] investigated the monotonic and cyclic tensile behavior of Nicalon™ SiC/SiC minicomposite at room temperature. The relationship between the statistical parameters of both the fiber and the matrix and the fiber/matrix interfacial parameters and the effect of environment and the tensile curves has been established. Goto and Kagawa [16] investigated the tensile and fracture behavior of a bi-directional woven Nicalon™ SiC/SiC composite at room temperature. The tensile stress–strain curve shows nonlinear behavior above 70 MPa and the composite effective Young’s modulus at fracture was about 40% of the initial value. Guo and Kagawa [6] investigated the tensile fracture behavior and tensile mechanical properties of Nicalon™ and Hi-Nicalon™ SiC/BN/SiC composites at temperature between 298 and 1400 K in air atmosphere. The tensile strength dropped from 140 MPa at 800 K to 41 MPa at 1200 K. Meyer and Waas [17] investigated tensile response of notched SiC/SiC composite at elevated temperature using a novel digital image correlation technique. Li et al. [18,19,20] developed a micromechanical approach to predict the tensile behavior of unidirectional, cross-ply, 2D and 2.5D woven CMCs considering the damage mechanisms of matrix cracking, interface debonding and fiber failure. However, the effect of stochastic loading on tensile damage and fracture of fiber-reinforced CMCs has not been investigated.
The objective of this paper is to investigate the effect of stochastic loading on tensile damage and fracture of fiber-reinforced CMCs for the first time. A micromechanical constitutive model is developed considering multiple damage mechanisms under tensile loading. The relationship between stochastic stress, tangent modulus, interface debonding and fiber broken is established. The effects of fiber volume, interface shear stress, interface debonding energy, saturation matrix crack spacing and fiber strength on tensile stress–strain curve, tangent modulus, interface debonding fraction and fiber broken fraction are analyzed. The experimental tensile damage and fracture of unidirectional and 2D SiC/SiC composites subjected to different stochastic loading stress are predicted.
2. Theoretical Model
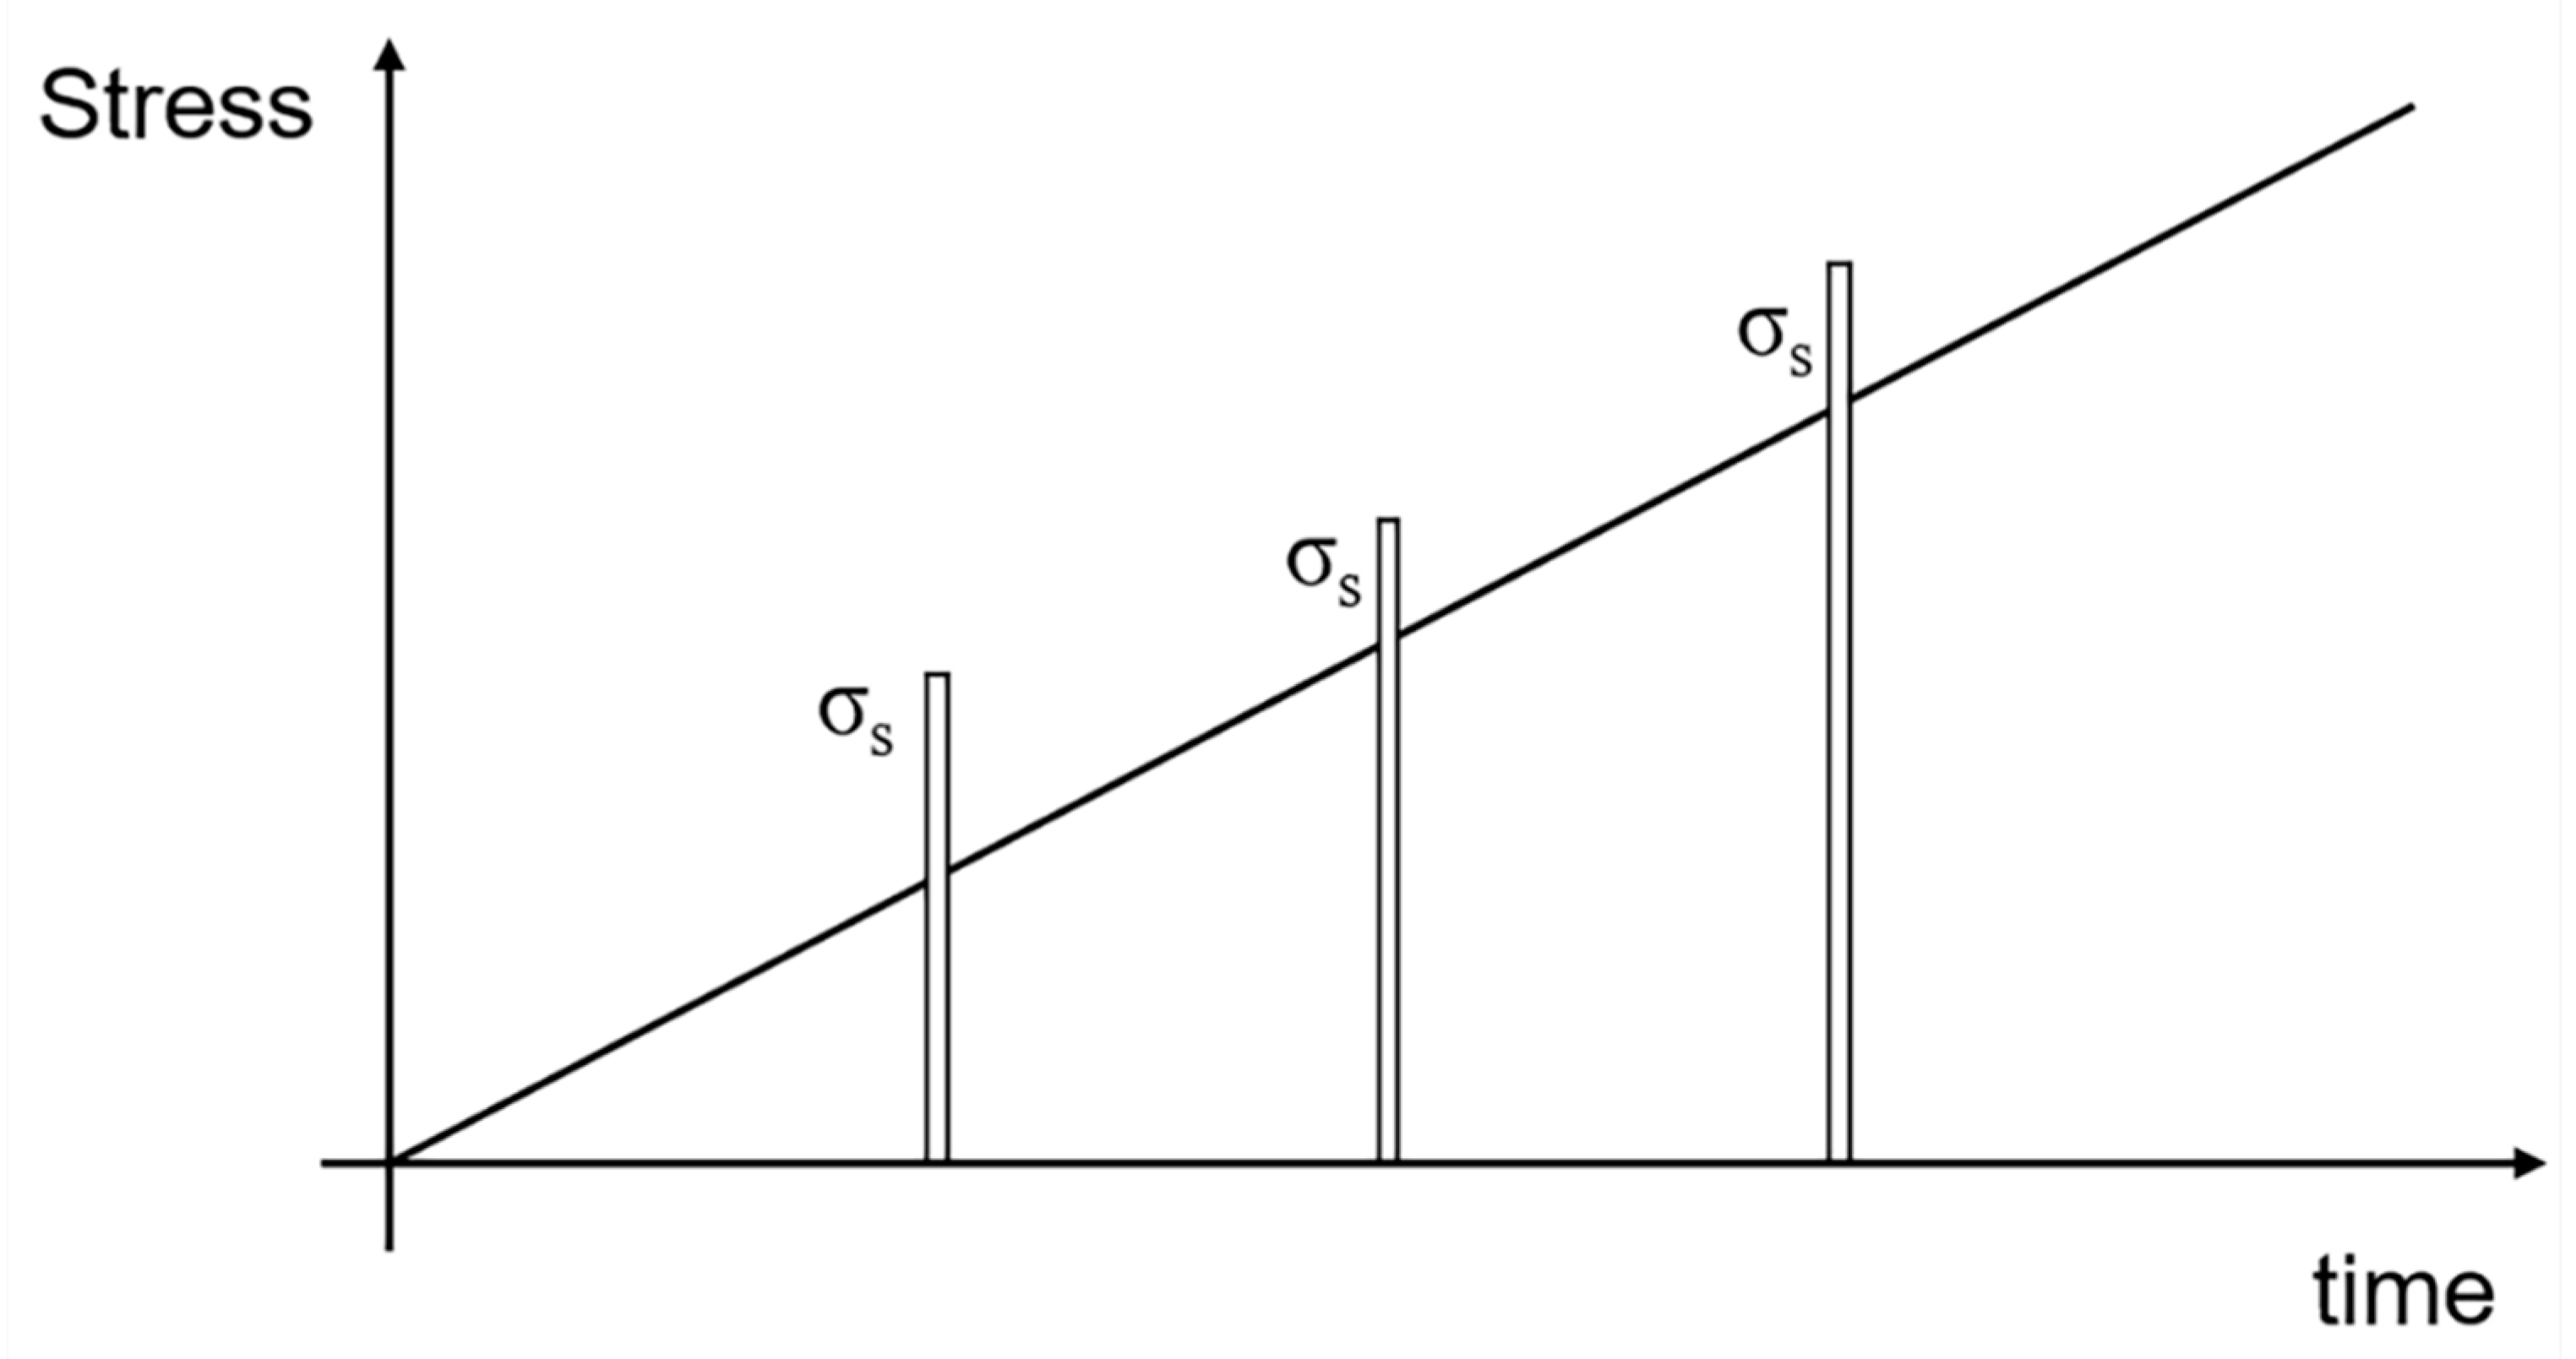
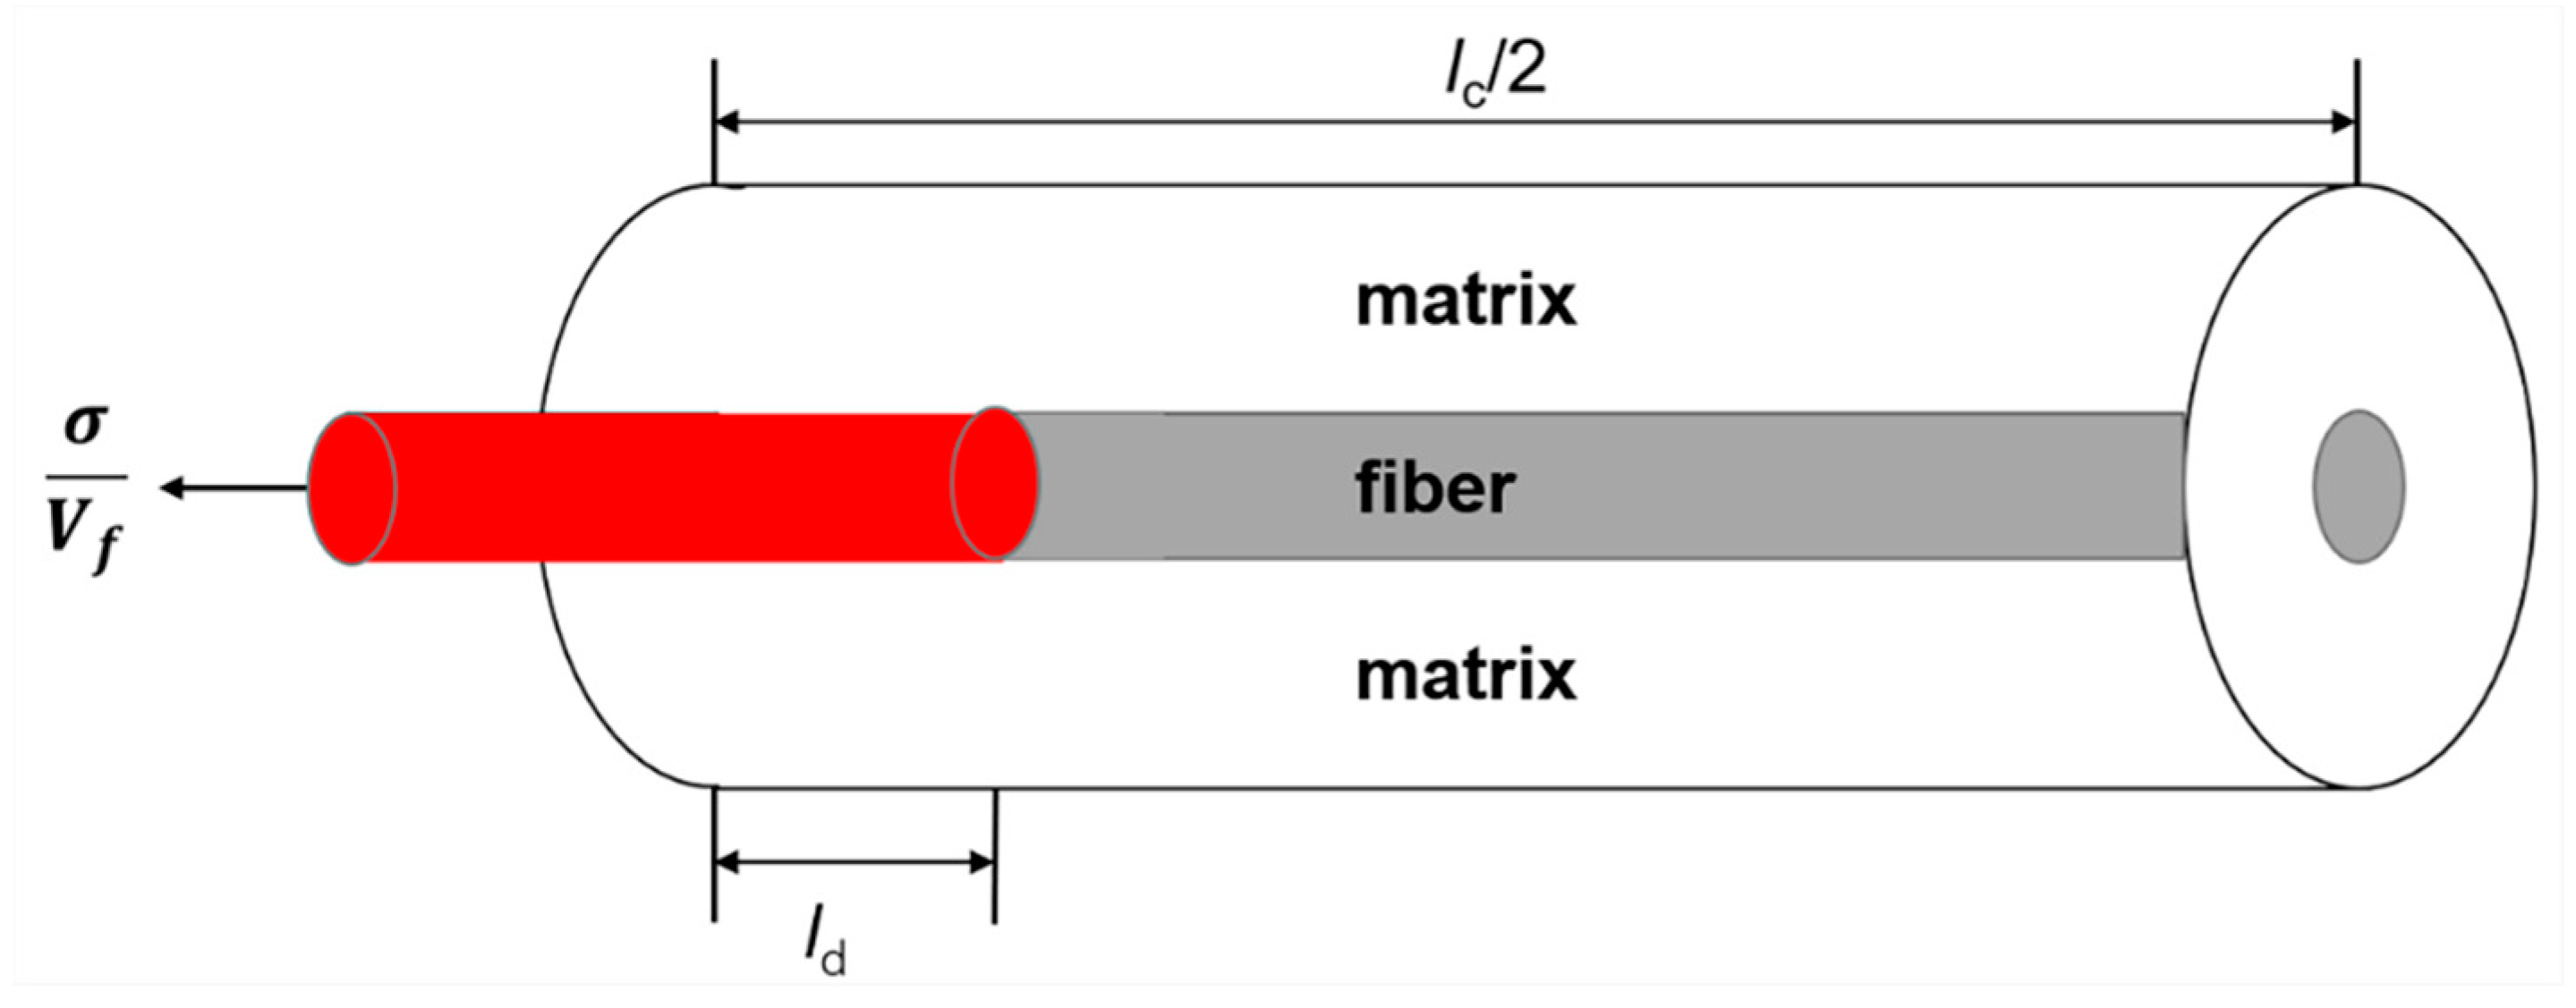
When stochastic stress occurs under tensile loading, matrix cracking, interface debonding, and fiber failure occur. Multiple stochastic loading sequence is shown in Figure 1. The shear-lag model is used to analyze micro stress filed of damaged composite. A unit cell is extracted from the ceramic composite system, as shown in Figure 2. The fiber axial stress in different damage regions is given by Equation (1).
where Φ is the fiber intact stress, τi is the interface shear stress, rf is the fiber radius, σfo is the fiber axial stress in the interface bonding region, ld is the interface debonding length, lc is the matrix crack spacing and ρ is the shear-lag model parameter.
Using stochastic matrix cracking model, the relationship between stochastic stress and matrix crack spacing is given by Equation (2) [12].
where ls is the saturation matrix crack spacing, σm is the matrix stress, σR is matrix cracking characteristic stress and m is the matrix Weibull modulus.
The fracture mechanics approach is used to determine the fiber/matrix interface debonding length. The interface debonding length is determined by Equation (3).
where Vf and Vm are the fiber and matrix volume fraction, respectively, Em and Ec are the matrix and composite elastic modulus, respectively, and ζd is the interface debonding energy.
The Global Load Sharing (GLS) criterion is used to determine the intact fiber stress. The relationship between the fiber intact stress, fiber failure probability and fiber pullout length is given by Equation (4) [21].
where <L> is the average fiber pullout length, and P(Φ) is the fiber failure probability, which is obtained by Equation (5).
where σc is the fiber characteristic strength, and mf is the fiber Weibull modulus.
When matrix cracking and interface debonding occur, the composite strain is given by Equation (6).
When fiber failure occurs, the composite strain is given by Equation (7).
where η is the interface debonding fraction, as shown in Equation (8).
The tangent modulus is defined by Equation (9).
3. Results and Discussion
Under stochastic loading, the damages of the matrix cracking, interface debonding and fiber failure occur. The micro stress filed of the damaged CMCs after stochastic loading is given by Equation (1). The fiber axial stress distribution is affected by the stochastic loading stress level, matrix cracking, interface debonding and fiber failure. The stochastic matrix cracking model is used to determine the matrix crack spacing at the applied stress level, as shown in Equation (2), and the fracture mechanics interface debonding criterion is used to determine the interface debonding length, and the GLS criterion is used to determine the load allocation between fracture and intact fibers. The micromechanical constitutive models for the conditions of the matrix cracking, interface debonding and fiber failure are given by Equations (6) and (7). Using the developed micromechanicam constitutive models and damage models, the effects of the fiber volume, interface shear stress, interface debonding energy, matrix crack spacing and fiber strength on tensile stress–strain curve, tangent modulus, interface debonding fraction and fiber broken fraction of SiC/SiC composite subjected to different stochastic loading are analyzed. Li et al. [4] investigated the tensile behavior of 2D woven SiC/SiC composite at room temperature. The composite was fabricated using the CVI method with the PyC interphase. The tensile experiments were conducted under displacement contrl of 0.3 mm/min. The material properties are given by: Vf = 0.2, Ef = 350 GPa, Em = 300 GPa, rf = 7.5 μm, αf = 4.0 × 10⁻⁶/°C, αm = 4.8 × 10⁻⁶/°C, ∆T = −1000 °C, ζd = 0.5 J/m2, τi = 25 MPa and mf = 3.
3.1. Effect of Fiber Volume on Tensile Damage and Fracture of SiC/SiC Composite with Stochastic Loading
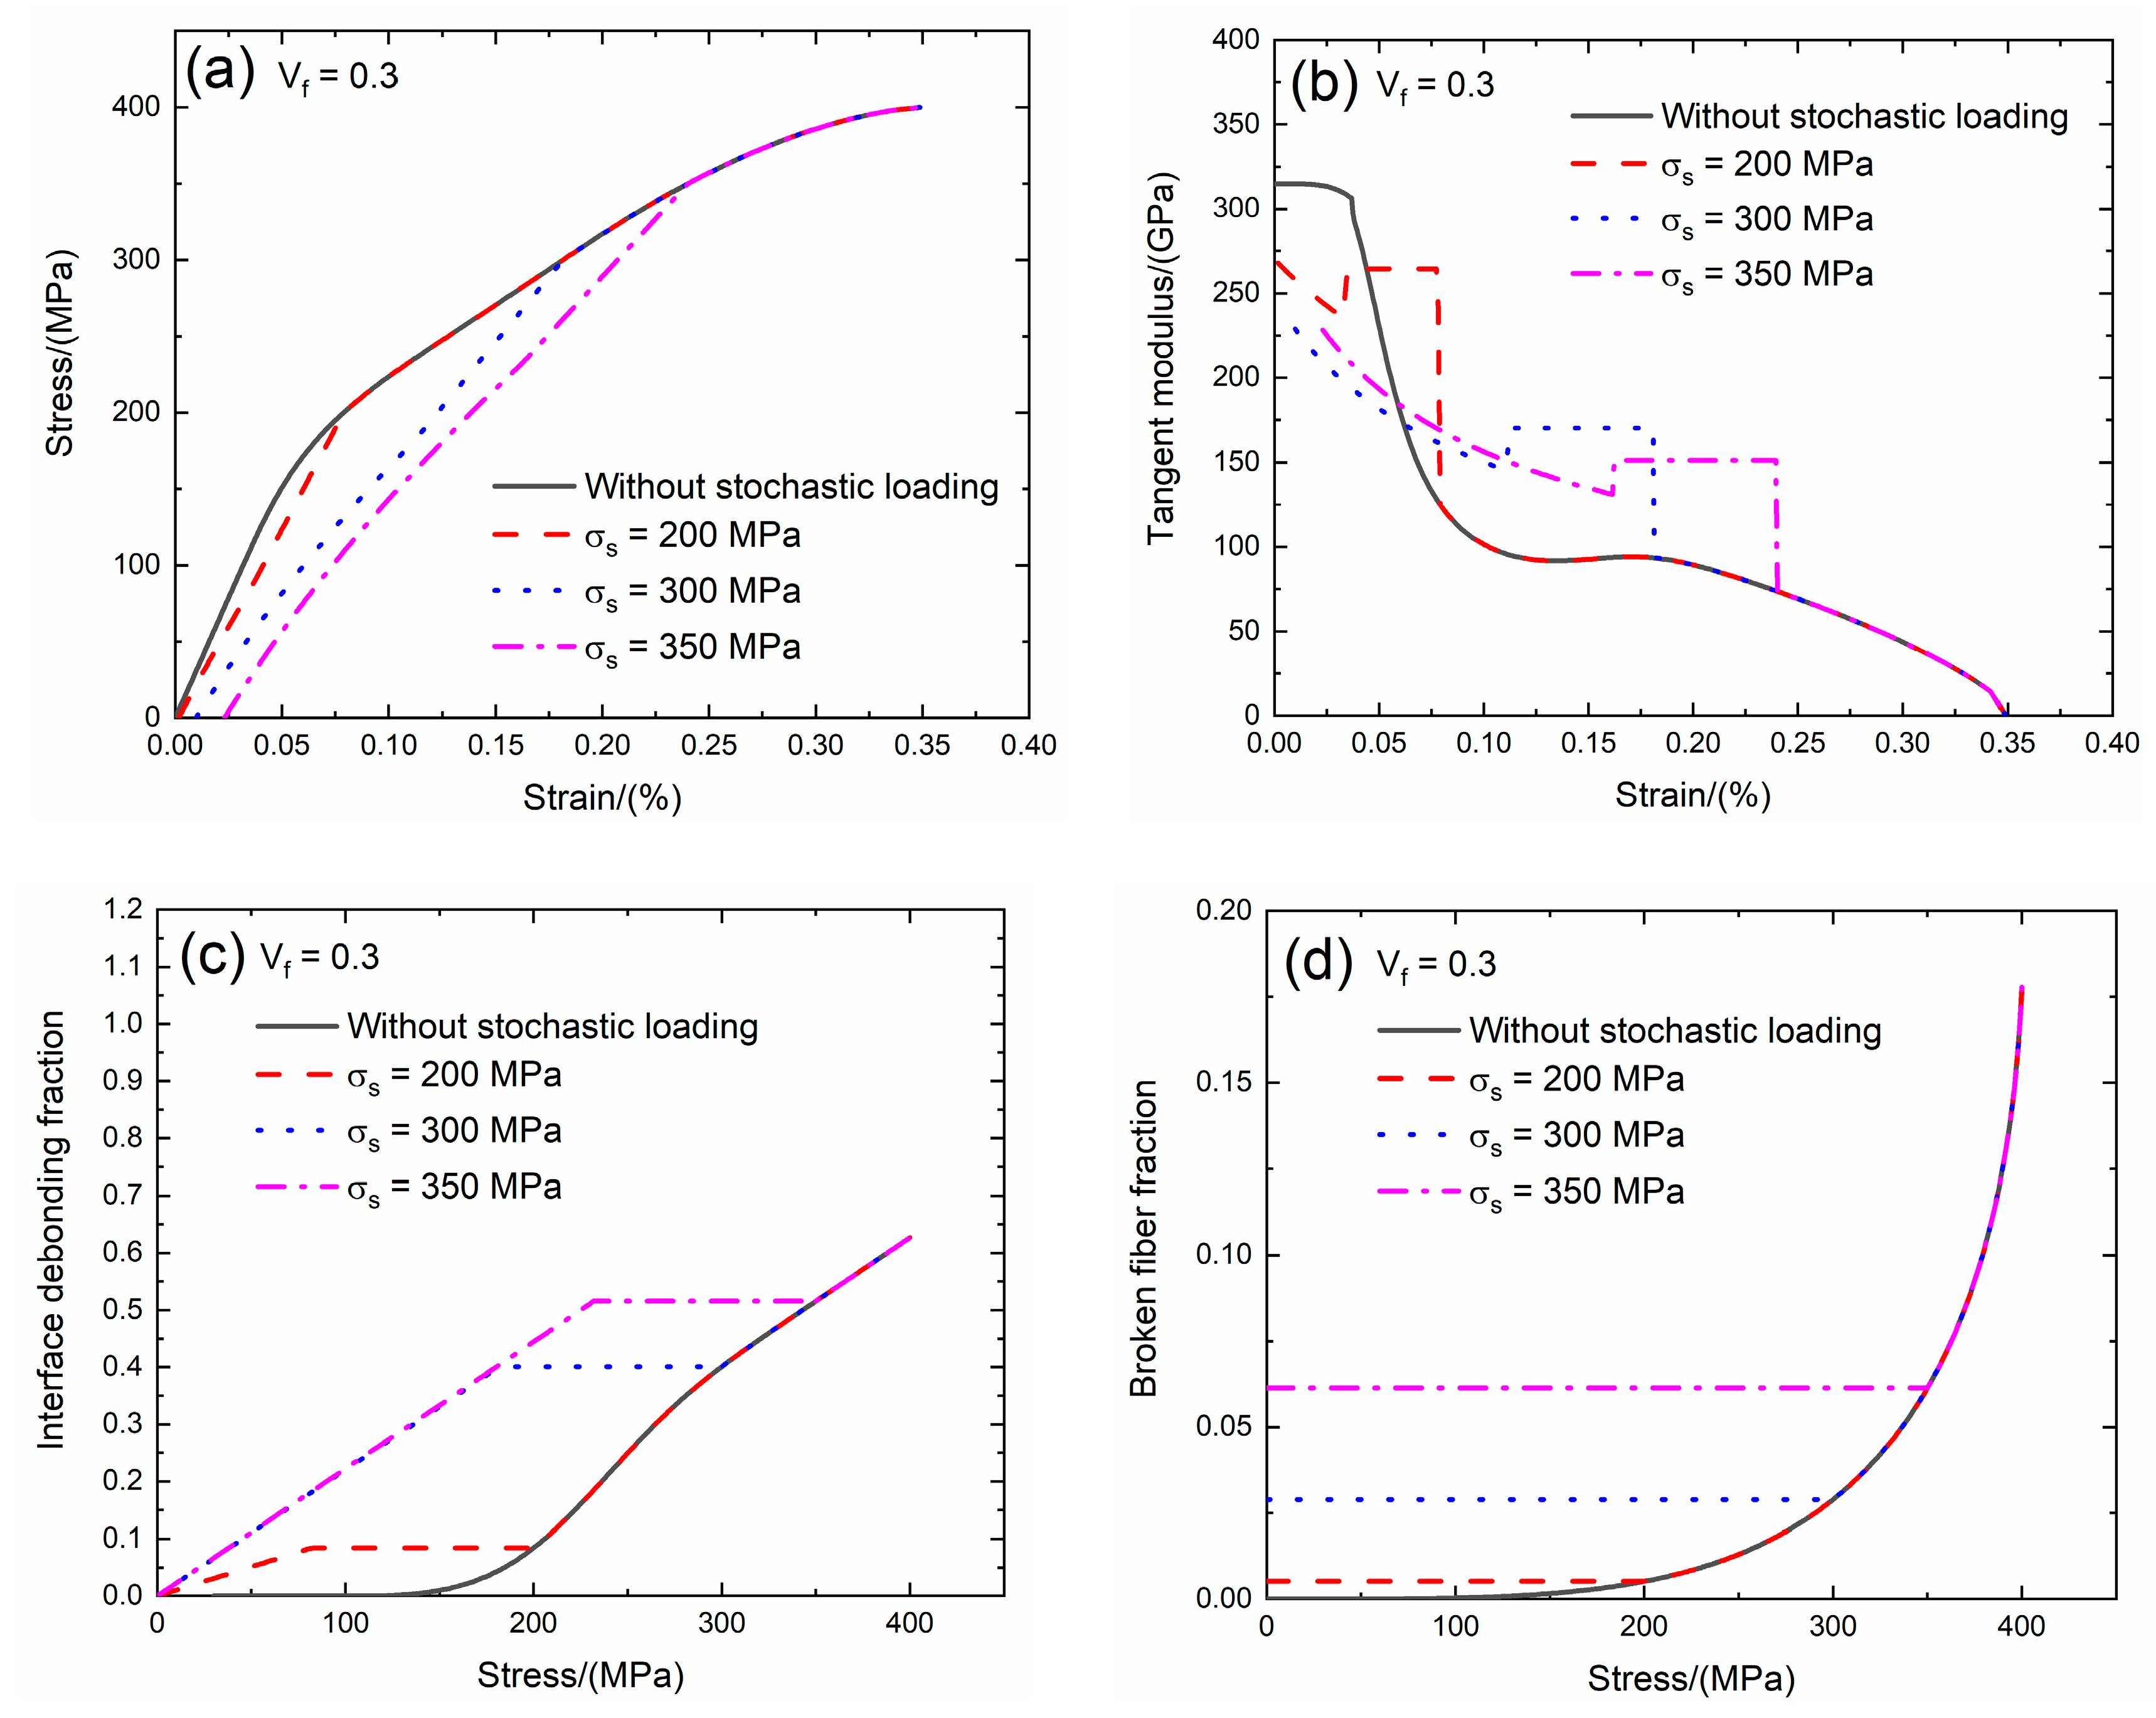
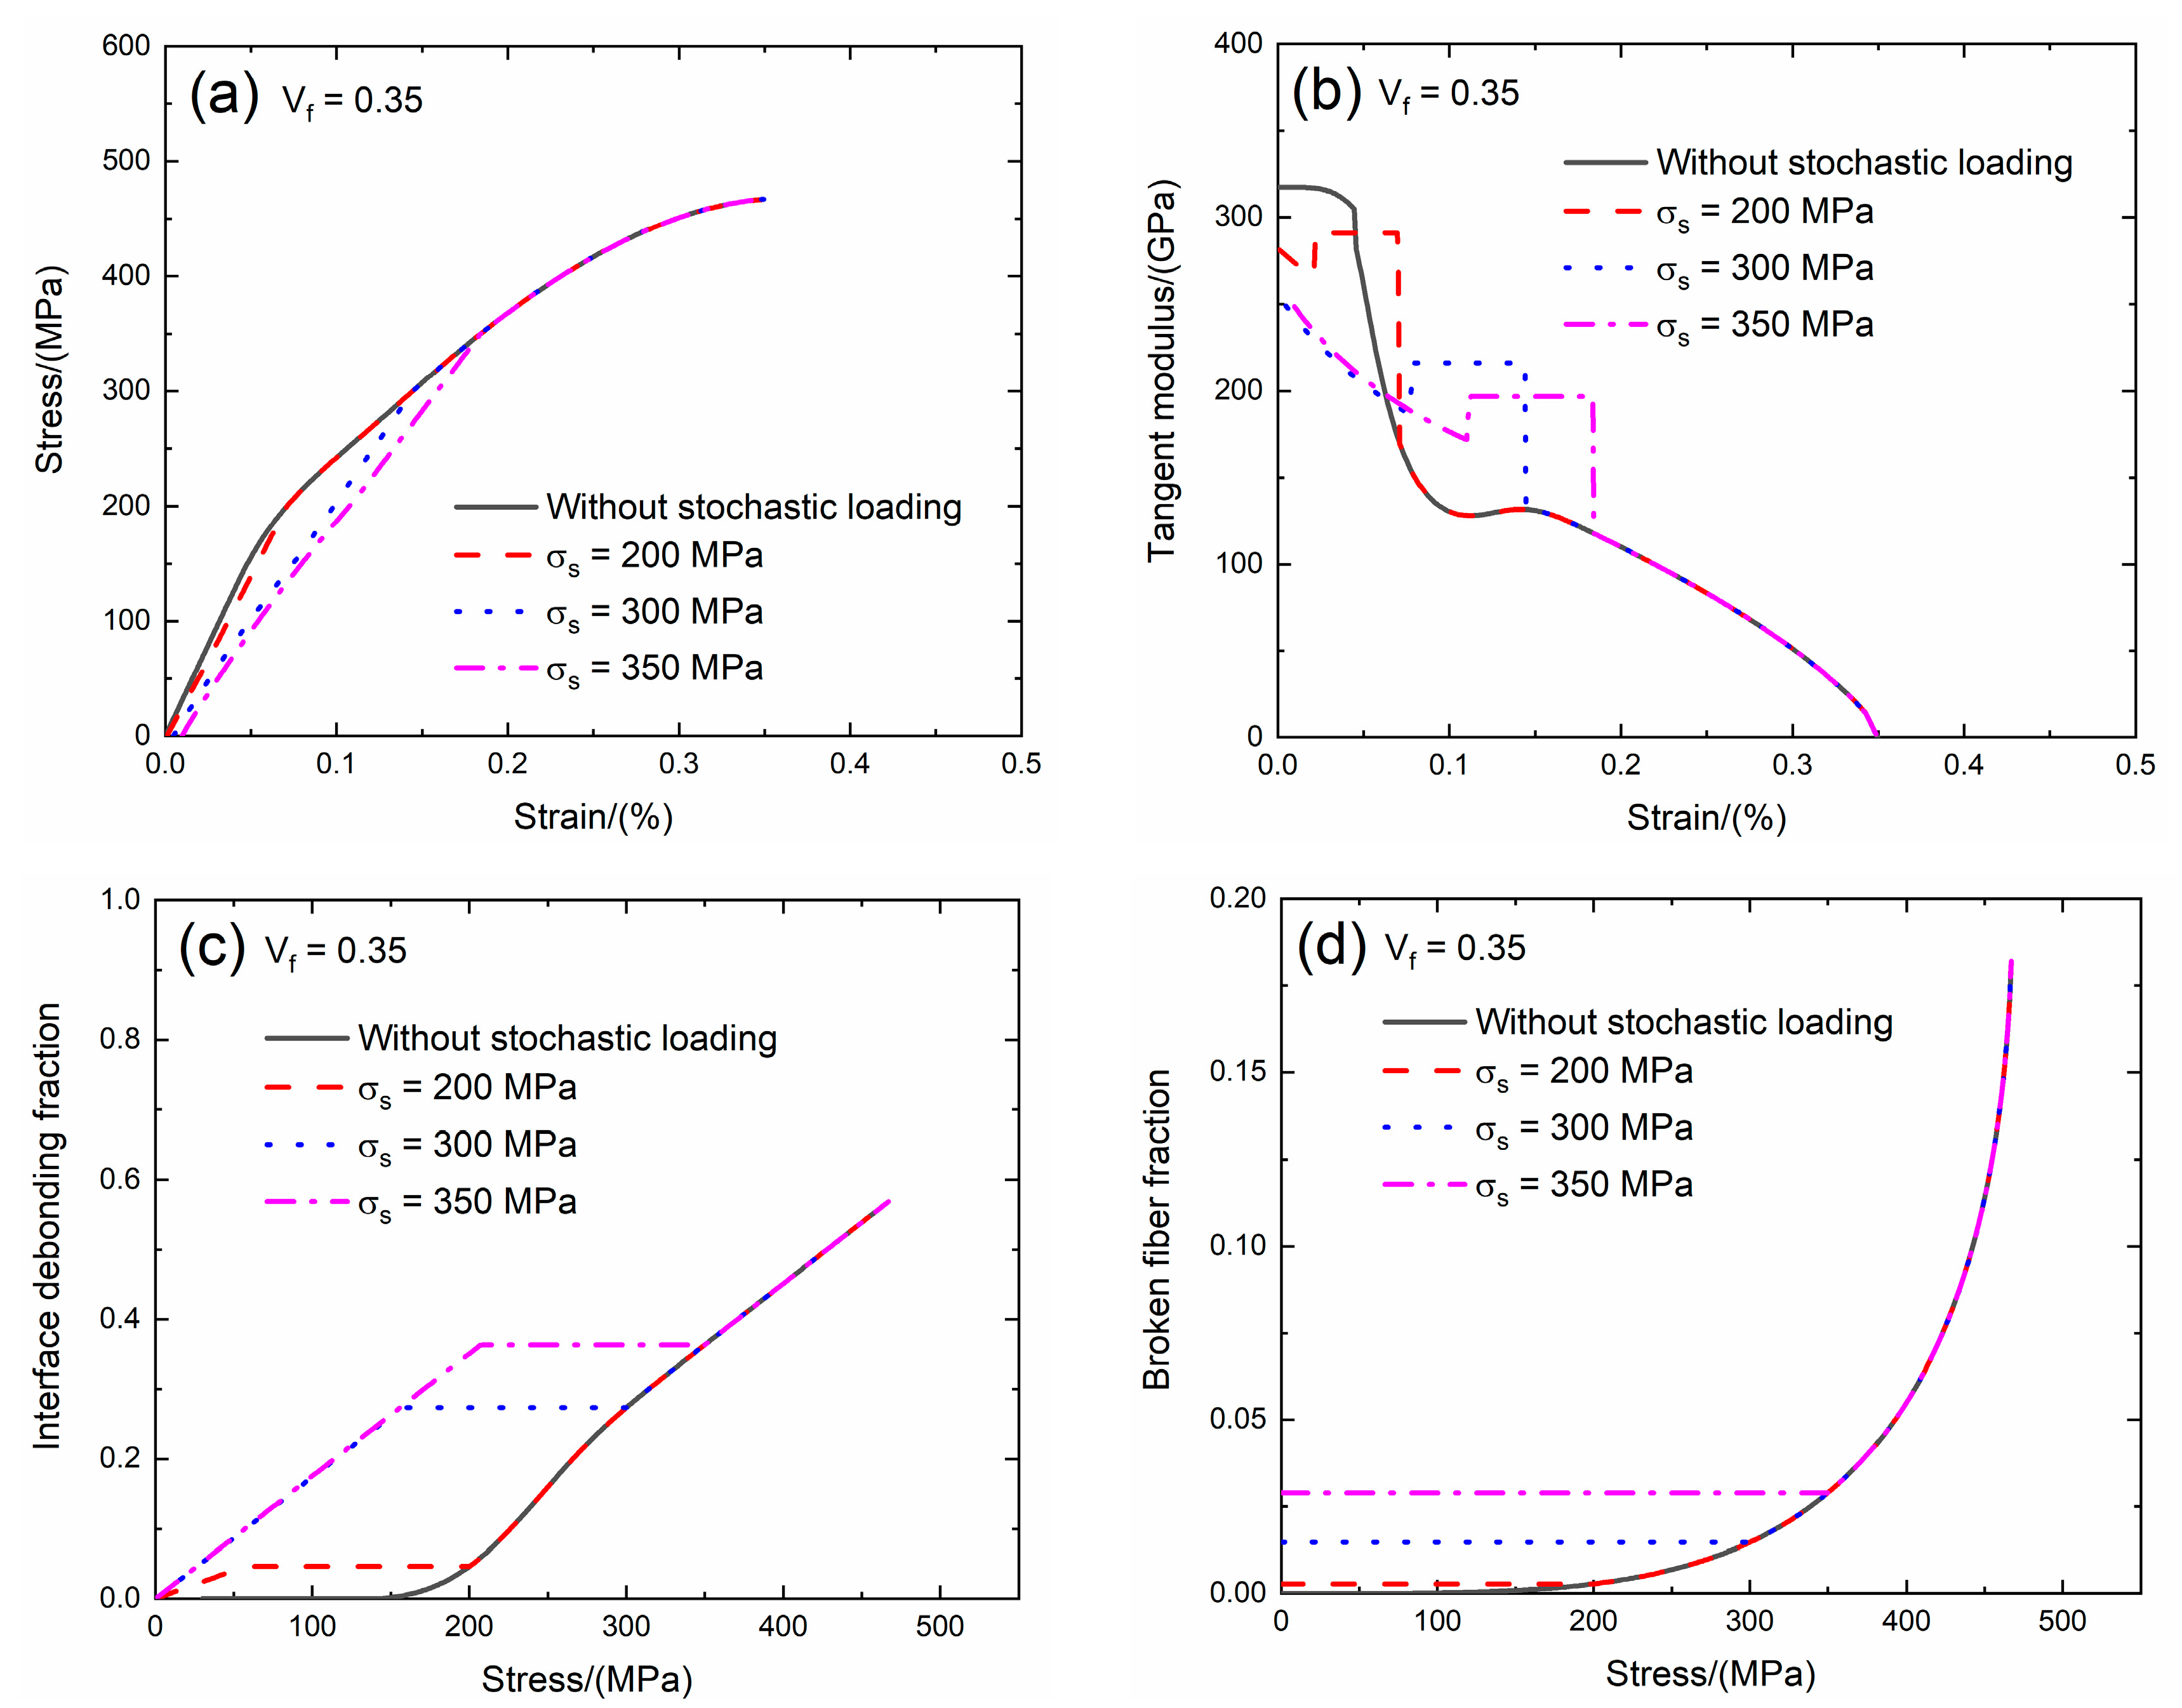
The fiber volume affects the tensile behavior of CMCs. The fiber volume range of SiC/SiC composite is between Vf = 27.7 and 40% [9]. In the present analysis, the effect of the fiber volume (i.e., Vf = 0.3 and 0.35) on the tensile stress–strain curves, tangent modulus, interface debonding fraction and broken fiber fraction of SiC/SiC composite subjected to the stochastic loading of σs = 200, 300 and 350 MPa are shown in Figure 3; Figure 4 and Table 1. When the fiber volume increases, the stress carried by the fiber increases, the initial composite strain decreases, the initial tangent modulus increases, the transition stress for the interface debonding decreases and the initial fiber broken fraction decreases.
When Vf = 0.3 under σs = 200 MPa, the damages of matrix cracking and interface debonding occur at σs = 200 MPa, leading to the increase of the composite initial strain, decreasing of the tangent modulus and increase of the broken fiber fraction. The initial composite strain is ε0 = 0.00161% due to the matrix cracking and interface debonding at σs = 200 MPa; the initial tangent modulus is Ep = 268 GPa, the degradation rate of the tangent modulus is 15% compared with the original specimen and the fiber broken fraction is P = 0.005. With increasing stress to σtr = 79.2 MPa, the interface debonding fraction increases, the tangent modulus decreases to Ep = 235 GPa corresponding to η = 0.081. Upon increasing stress from σtr = 79.2 MPa to σ = 200 MPa, the tangent modulus remains constant of Ep = 264 GPa with η = 0.084.
Under σs = 300 MPa, the initial composite strain is ε0 = 0.00982% due to the damages of the matrix cracking and interface debonding at σs = 300 MPa; the initial tangent modulus is Ep = 229 GPa, the degradation rate of tangent modulus is 28% compared with the original specimen and the fiber broken fraction is P = 0.028. With increasing stress to σtr = 178.2 MPa, the interface debonding fraction increases, the tangent modulus decreases to Ep = 145 GPa corresponding to η = 0.392. Upon increasing stress from σtr = 178.2 MPa to σ = 300 MPa, the tangent modulus remains constant of Ep = 170.1 GPa with η = 0.4.
Under σs = 350 MPa, the initial composite strain is ε0 = 0.023% due to the damages of the matrix cracking and interface debonding at σs = 350 MPa; the initial tangent modulus is Ep = 228 GPa, the degradation rate of tangent modulus is 28% compared with the original specimen and the fiber broken fraction is P = 0.06. With increasing stress to σtr = 231 MPa, the interface debonding fraction increases, the tangent modulus decreases to Ep = 131 GPa corresponding to η = 0.51. Upon increasing stress from σtr = 131 MPa to σ = 350 MPa, the tangent modulus remains constant of Ep = 151 GPa with η = 0.51.
When Vf = 0.35 under σs = 200 MPa, the damages of matrix cracking and interface debonding occur at σs = 200 MPa, leading to the increase of the composite initial strain, decreasing of the tangent modulus and increase of the broken fiber fraction. The initial composite strain is ε0 = 0.0009%; the initial tangent modulus is Ep = 281 GPa, the degradation rate of tangent modulus is 12% compared with original specimen and the fiber broken fraction is P = 0.0027. With increasing stress to σtr = 55 MPa, the interface debonding fraction increases, the tangent modulus decreases to Ep = 265 GPa corresponding to η = 0.046. Upon increasing stress from σtr = 55 MPa to σ = 200 MPa, the tangent modulus remains constant of Ep = 291 GPa with η = 0.046.
Under σs = 300 MPa, the initial composite strain is ε0 = 0.0047% due to the damages of matrix cracking and interface debonding at σs = 300 MPa; the initial tangent modulus is Ep = 249 GPa, the degradation rate of tangent modulus is 22% compared with original specimen and the fiber broken fraction is P = 0.014. With increasing stress to σtr = 156.2 MPa, the interface debonding fraction increases and the tangent modulus decreases to Ep = 201 GPa corresponding to η = 0.27. When the stress increases from σtr = 156.2 MPa to σ = 250 MPa, the tangent modulus remains constant of Ep = 216 GPa with η = 0.27.
Under σs = 350 MPa, the initial composite strain is ε0 = 0.0095% due to the damages of the matrix cracking and interface debonding at σs = 350 MPa; the initial tangent modulus is Ep = 248 GPa, the degradation rate of tangent modulus is 22% compared with original specimen and the fiber broken fraction is P = 0.028. With increasing stress to σtr = 206.8 MPa, the interface debonding fraction increases and the tangent modulus decreases to Ep = 191.9 GPa corresponding to the interface debonding fraction η = 0.362. When the stress increases from σtr = 206.8 MPa to σ = 300 MPa, the tangent modulus remains constant of Ep = 196.7 GPa with η = 0.363.
3.2. Effect of Interface Shear Stress on Tensile Damage and Fracture of SiC/SiC Composite with Stochastic Loading
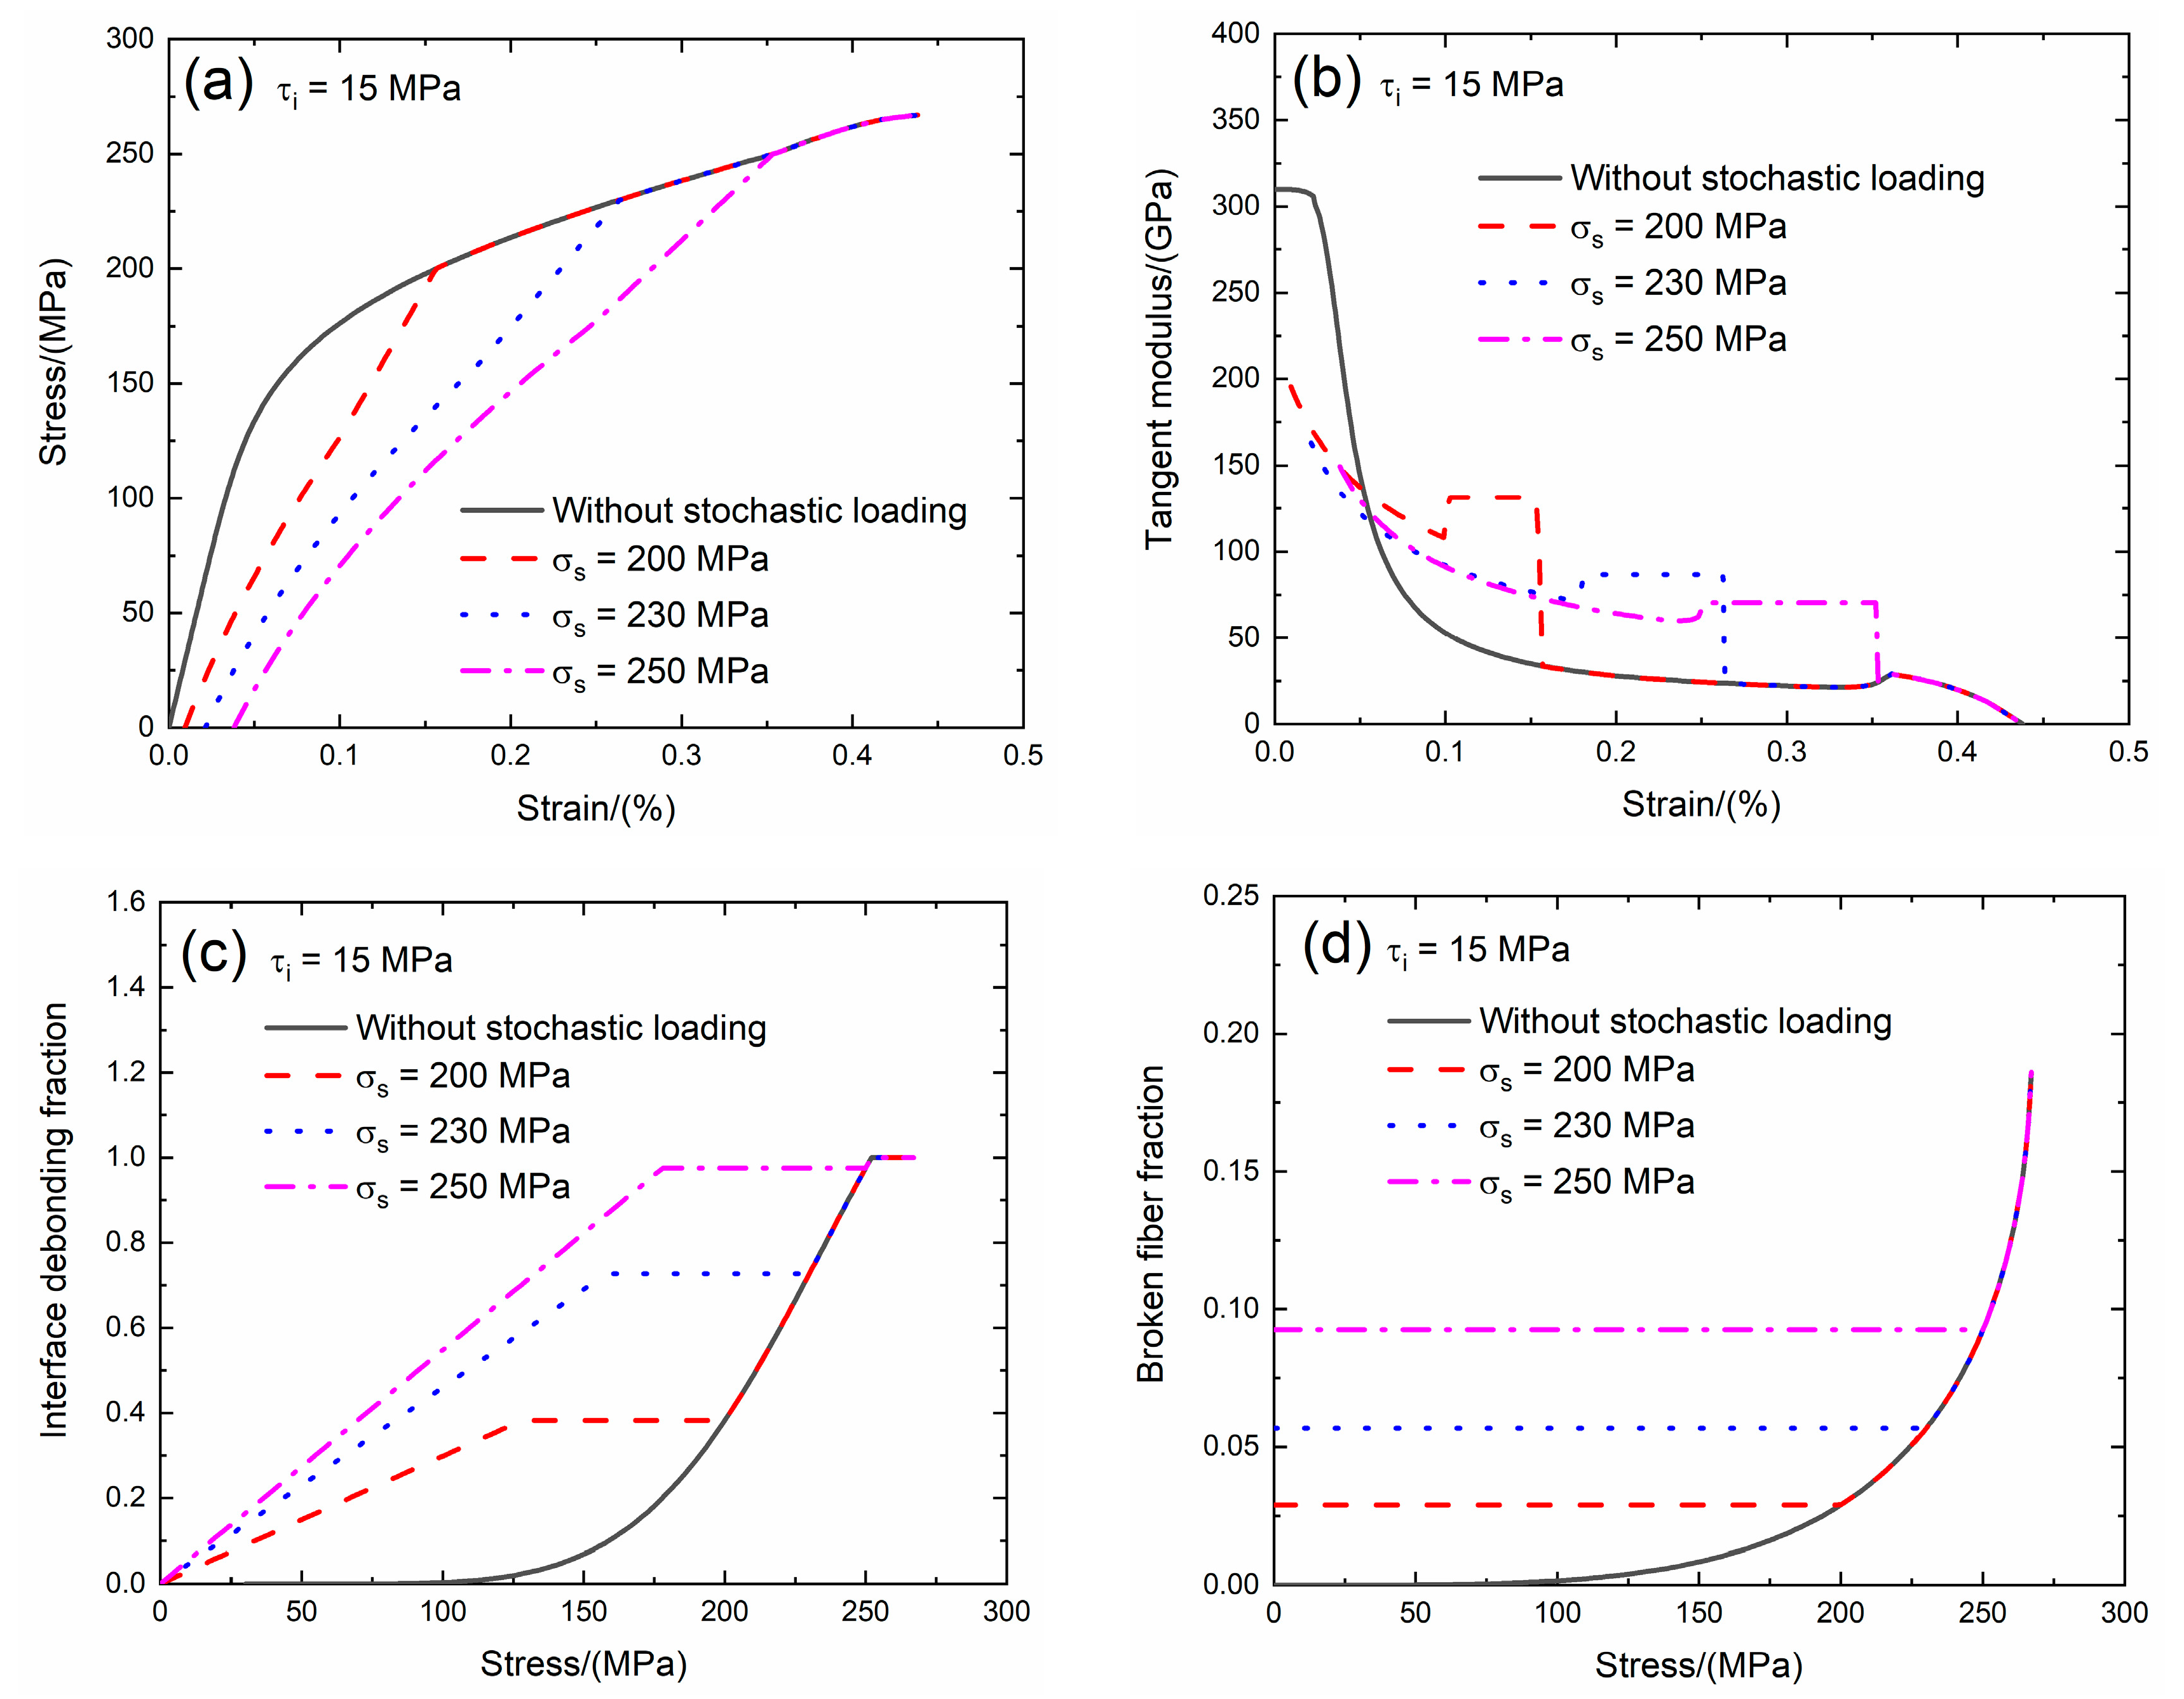
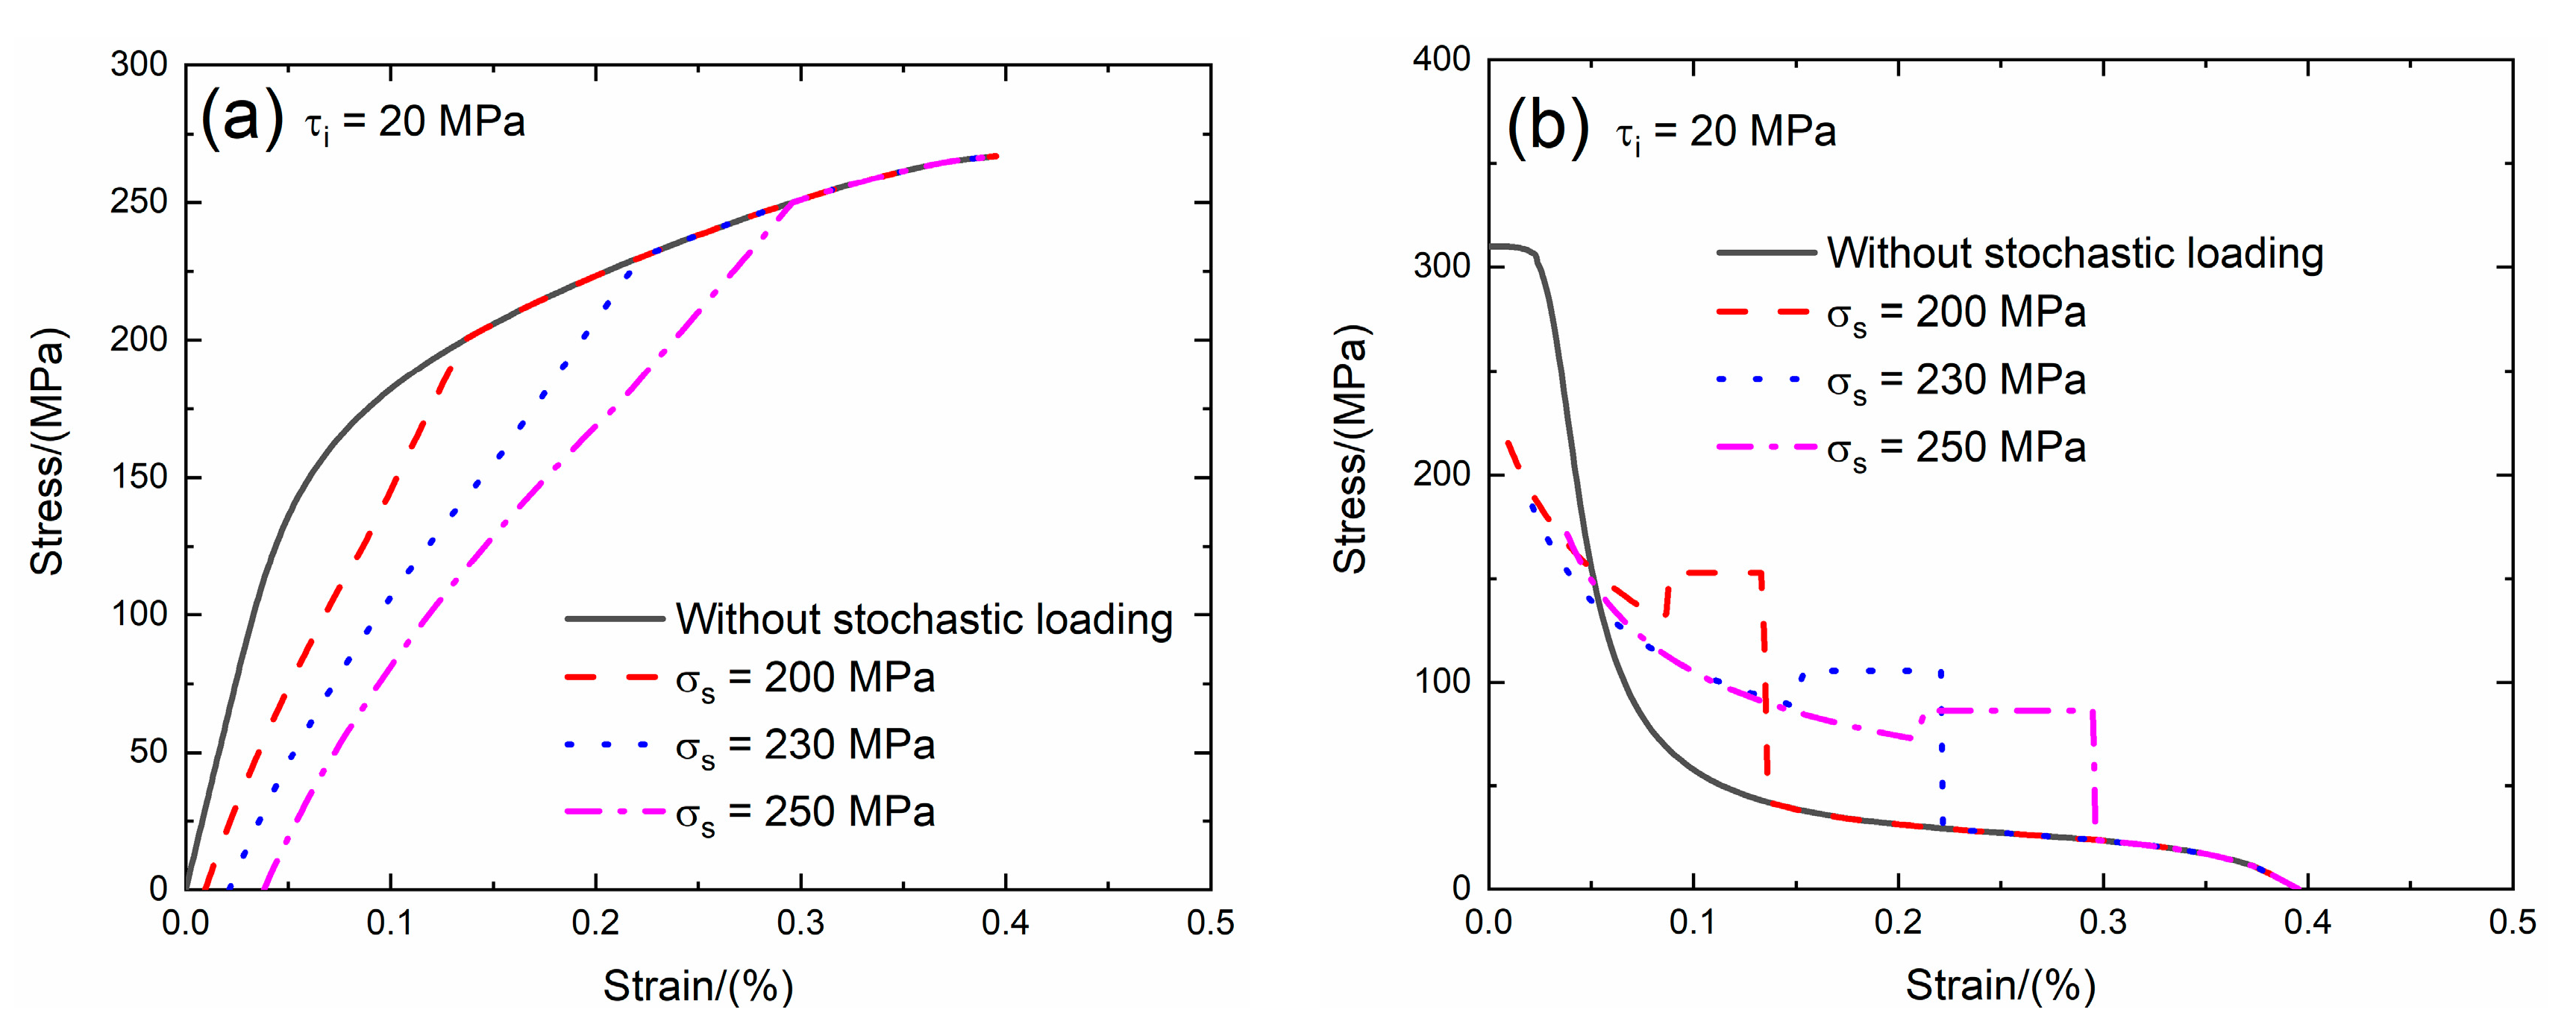
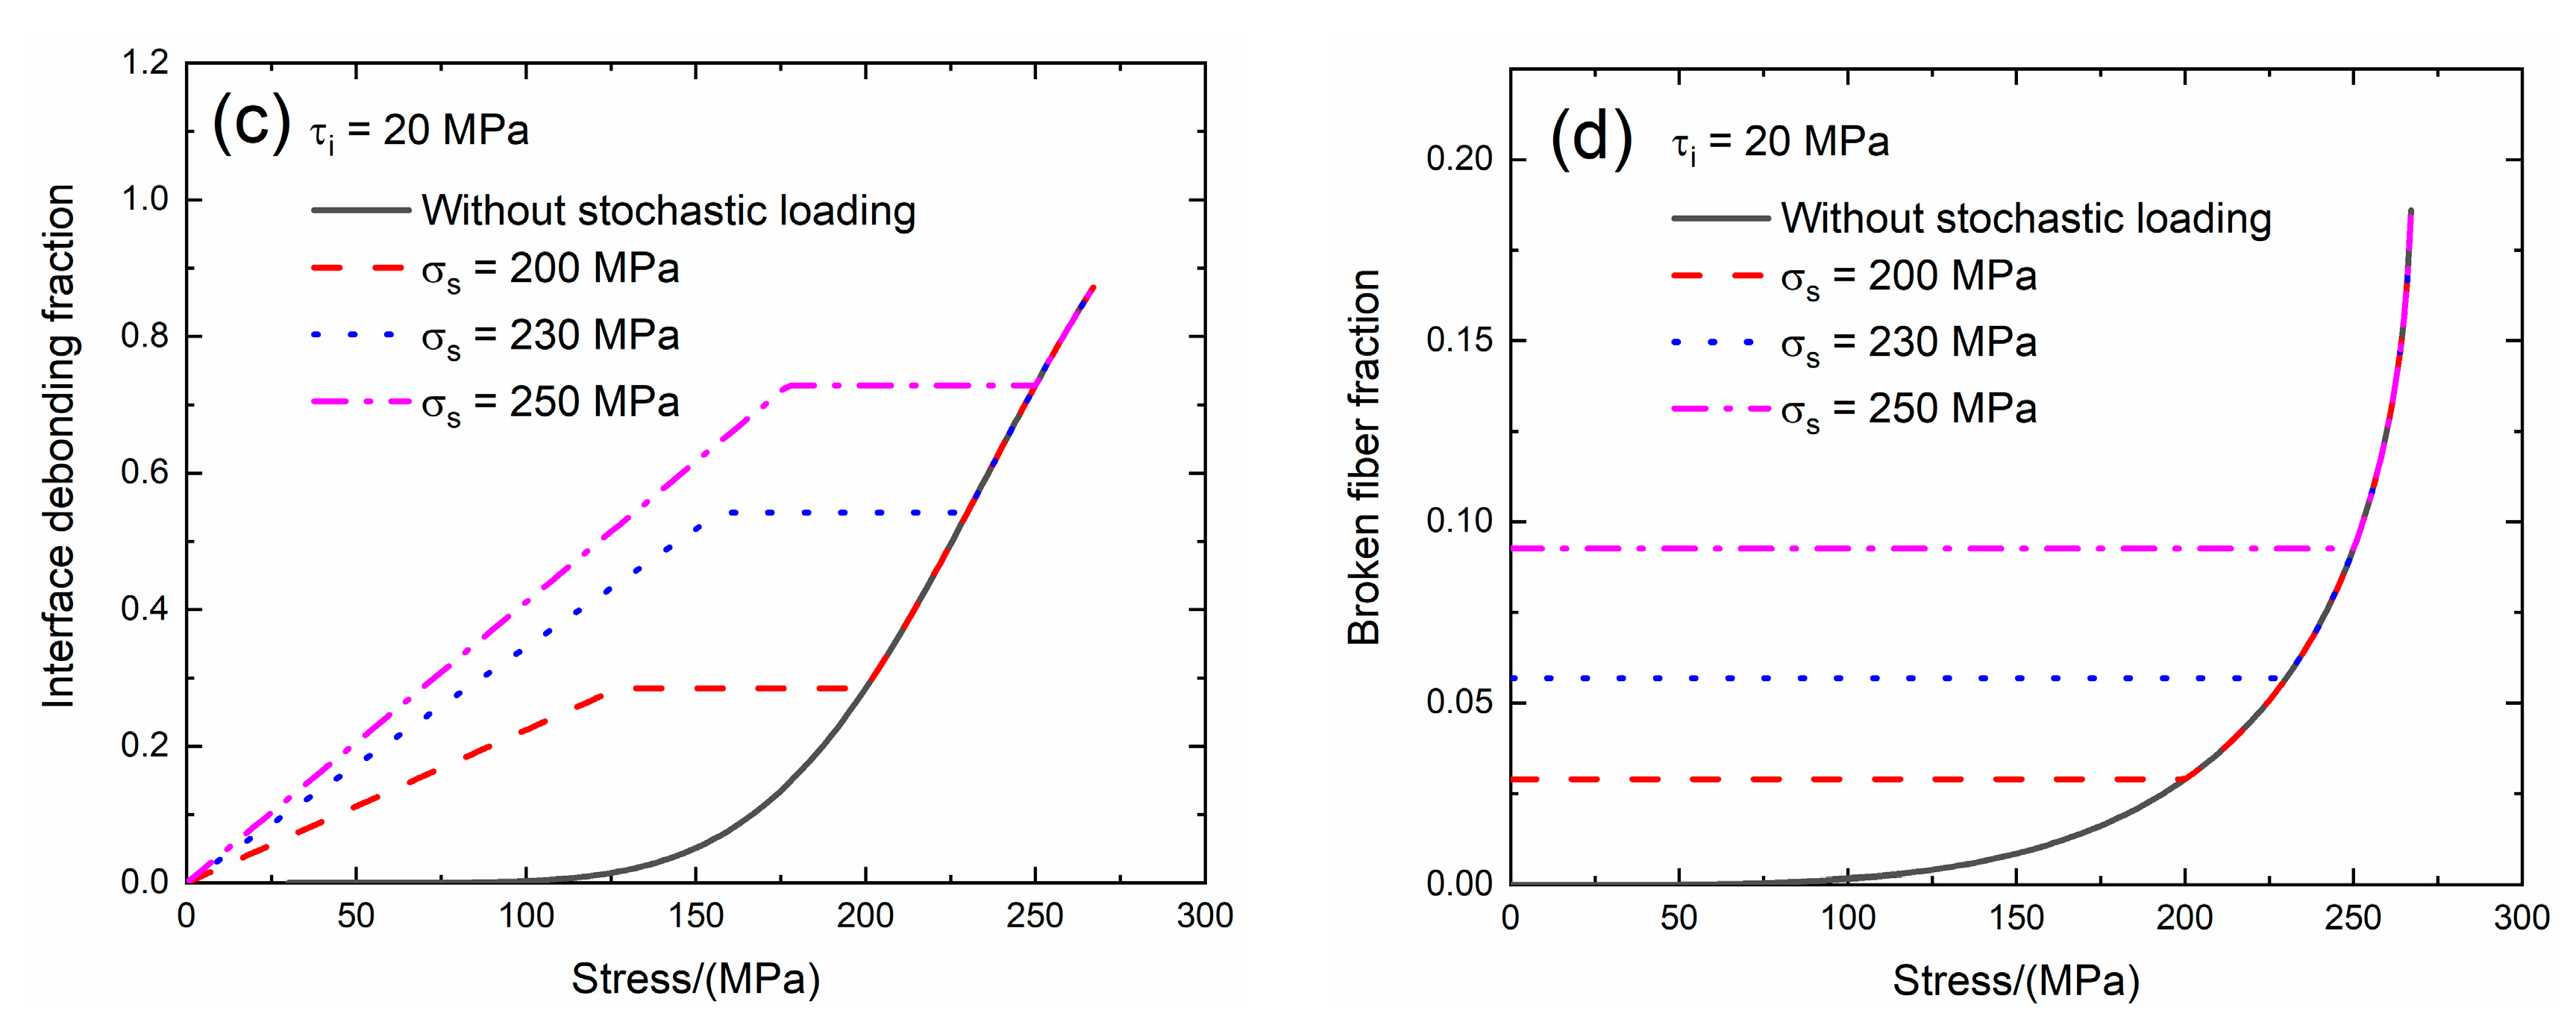
The interface shear stress transfers the load between the fiber and the matrix when the matrix cracking and interface debonding occur. For the weak interface bonding between the fiber and the matrix of SiC/SiC composite, the value of the interface shear stress is between τi = 10 and 30 MPa [22]. In the present analysis, the effect of the interface shear stress (i.e., τi = 15 and 20 MPa) on the tensile stress–strain curves, tangent modulus, interface debonding fraction and broken fiber fraction of SiC/SiC composite subjected to stochastic loading of σs = 200, 230 and 250 MPa are shown in Figure 5 and Figure 6 and Table 2. When the interface shear stress increases, the load transfer capacity between the fiber and the matrix increases, the initial composite strain remains the same, the initial tangent modulus increases, the transition stress for interface debonding remains the same and the initial fiber broken fraction remains the same.
When τi = 15 MPa under σs = 200 MPa, the damages of matrix cracking and interface debonding occur at σs = 200 MPa, leading to the increase of the composite initial strain, decreasing of the tangent modulus and increase of the broken fiber fraction. The initial composite strain is ε0 = 0.00943%; the initial tangent modulus is Ep = 195.6 GPa, the degradation rate of tangent modulus is 37% compared with original specimen and the fiber broken fraction is P = 0.028. With increasing stress to σtr = 125.4 MPa, the interface debonding fraction increases, the tangent modulus decreases to Ep = 108.1 GPa corresponding to η = 0.374. When the stress increases from σtr = 125.4 MPa to σ = 200 MPa, the tangent modulus remains constant of Ep = 131.3 GPa with η = 0.382.
Under σs = 230 MPa, the initial composite strain is ε0 = 0.021% due to the damages of matrix cracking and interface debonding at σs = 230 MPa; the initial tangent modulus is Ep = 163 GPa, the degradation rate of tangent modulus is 48% compared with original specimen and the fiber broken fraction is P = 0.056. With increasing stress to σtr = 154 MPa, the interface debonding fraction increases and the tangent modulus decreases to Ep = 71.5 GPa corresponding to η = 0.727. When the stress increases from σtr = 154 MPa to σ = 230 MPa, the tangent modulus remains constant of Ep = 86.8 GPa with η = 0.72.
Under σs = 250 MPa, the initial composite strain is ε0 = 0.038% due to the damages of the matrix cracking and interface debonding at σs = 250 MPa; the initial tangent modulus is Ep = 149.5 GPa, the degradation rate of the tangent modulus is 52% compared with original specimen and the fiber broken fraction is P = 0.092. With increasing stress to σtr = 173.8 MPa, the interface debonding fraction increases and the tangent modulus decreases to Ep = 60.7 GPa corresponding to η = 0.952. When the stress increases from σtr = 173.8 MPa to σ = 250 MPa, the tangent modulus remains constant of Ep = 70.4 GPa with η = 0.975.
When τi = 20 MPa under σs = 200 MPa, the damages of matrix cracking and interface debonding occur at σs = 200 MPa, leading to the increase of the composite initial strain, decreasing of the tangent modulus and increase of the broken fiber fraction. The initial composite strain is ε0 = 0.00943%; the initial tangent modulus is Ep = 215 GPa, the degradation rate of tangent modulus is 31% compared with original specimen and the fiber broken fraction is P = 0.028. With increasing stress to σtr = 123.2 MPa, the interface debonding fraction increases and the tangent modulus decreases to Ep = 130 GPa corresponding to η = 0.275. When the stress increases from σtr = 123.2 MPa to σ = 200 MPa, the tangent modulus remains constant of Ep = 152.9 GPa with η = 0.284.
Under σs = 230 MPa, the initial composite strain is ε0 = 0.021% due to the damages of the matrix cracking and interface debonding at σs = 230 MPa; the initial tangent modulus is Ep = 185 GPa, the degradation rate of the tangent modulus is 40% compared with original specimen and the fiber broken fraction is P = 0.056. With increasing stress to σtr = 154 MPa, the interface debonding fraction increases and the tangent modulus decreases to Ep = 88.6 GPa corresponding to η = 0.53. When the stress increases from σtr = 154 MPa to σ = 230 MPa, the tangent modulus remains constant of Ep = 105.5 GPa with η = 0.54.
Under σs = 250 MPa, the initial composite strain is ε0 = 0.038% due to the damages of the matrix cracking and interface debonding; the initial tangent modulus is Ep = 171.7 GPa, the degradation rate of tangent modulus is 45% compared with original specimen and the fiber broken fraction is P = 0.092. With increasing stress to σtr = 173.8 MPa, the interface debonding fraction increases and the tangent modulus decreases to Ep = 72.8 GPa corresponding to η = 0.714. When the stress increases from σtr = 173.8 MPa to σ = 250 MPa, the tangent modulus remains constant of Ep = 86.3 GPa with η = 0.73.
3.3. Effect of Interface Debonding Energy on Tensile Damage and Fracture of SiC/SiC Composite with Stochastic Loading
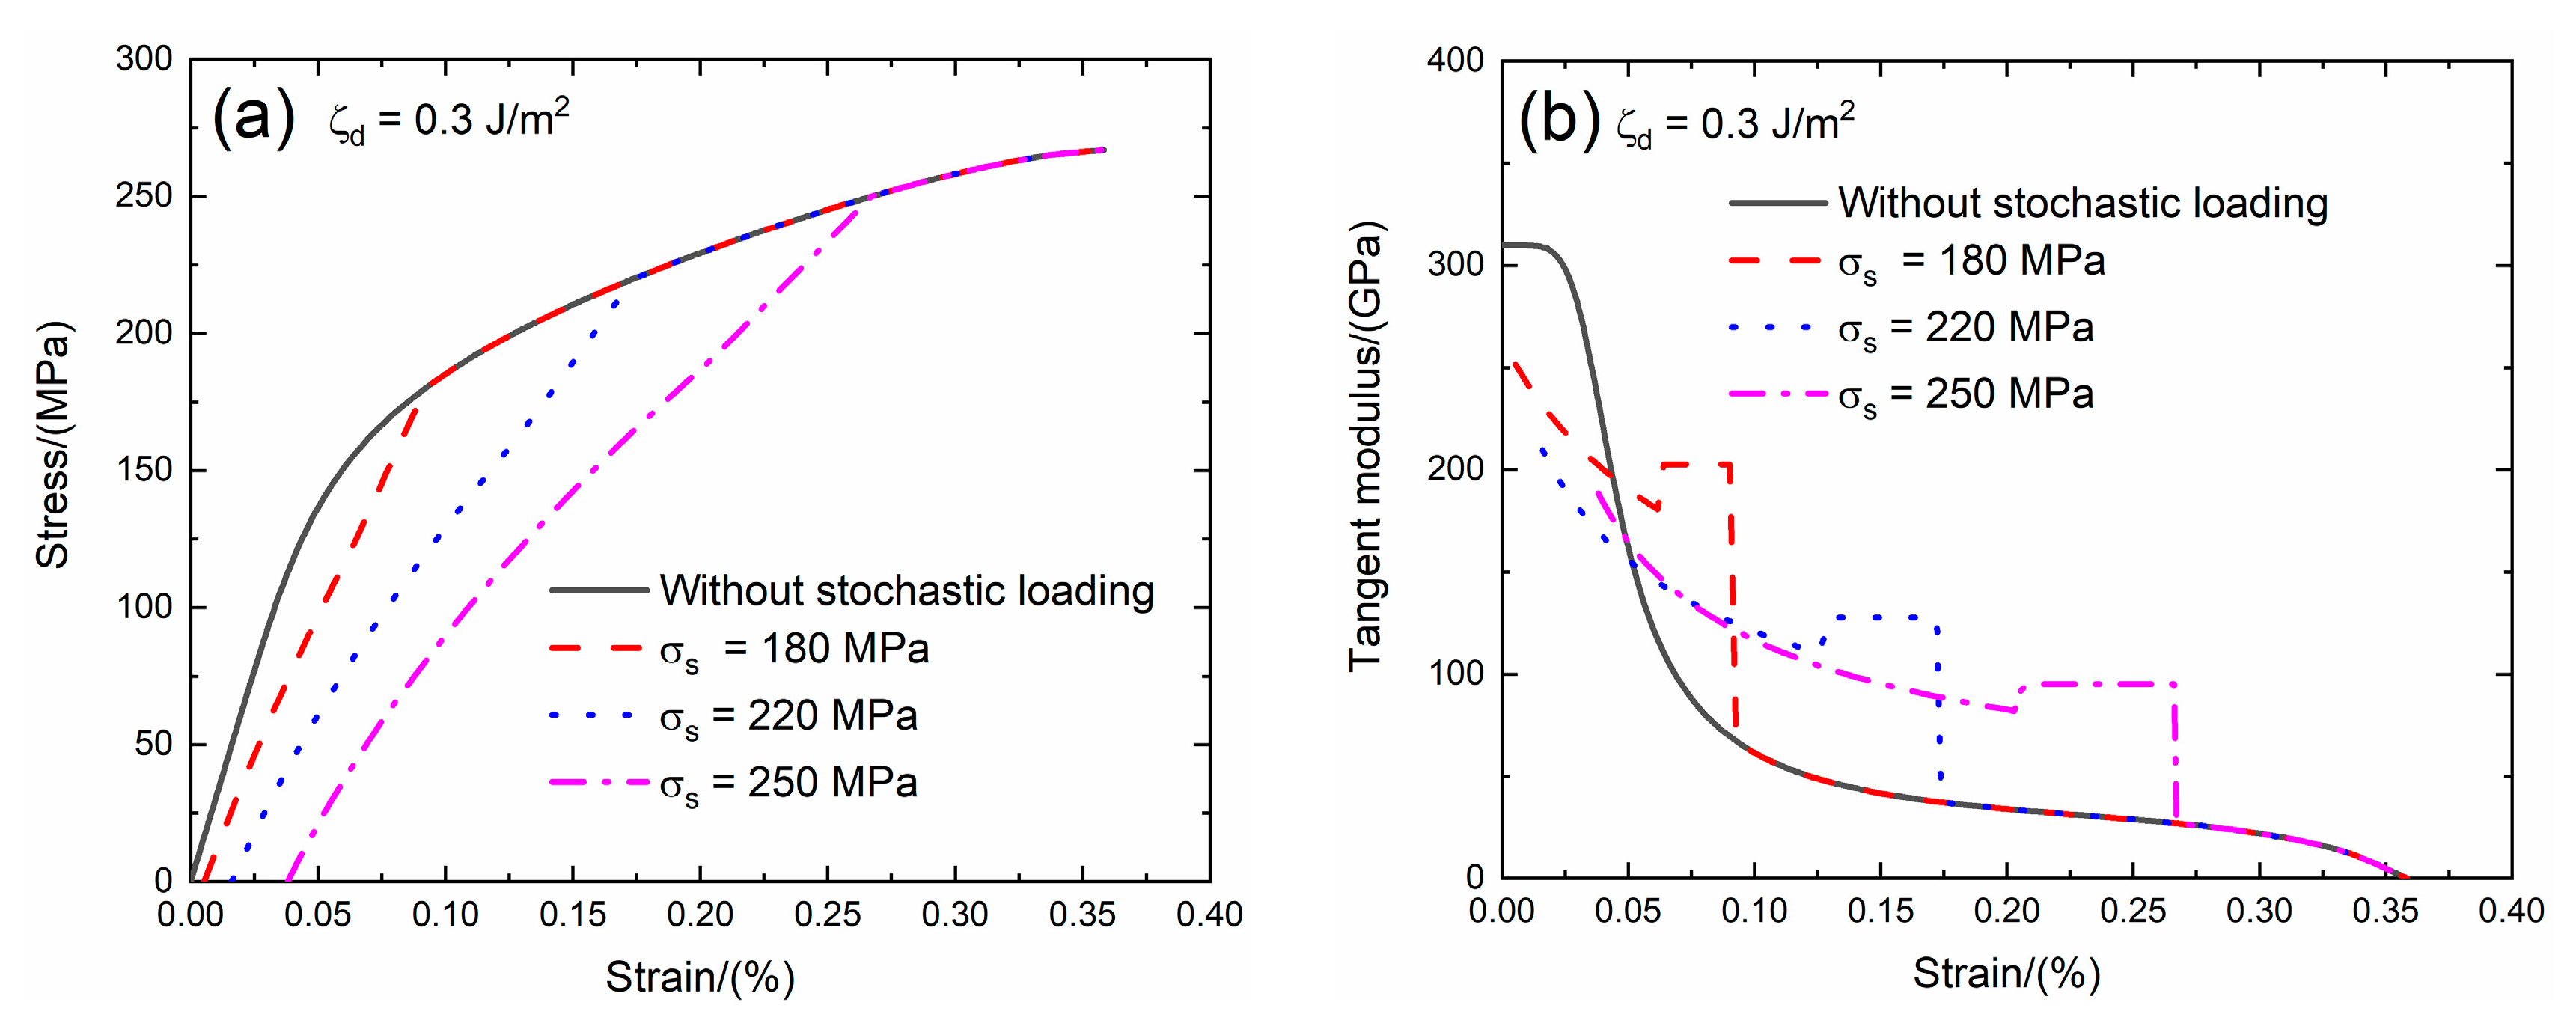
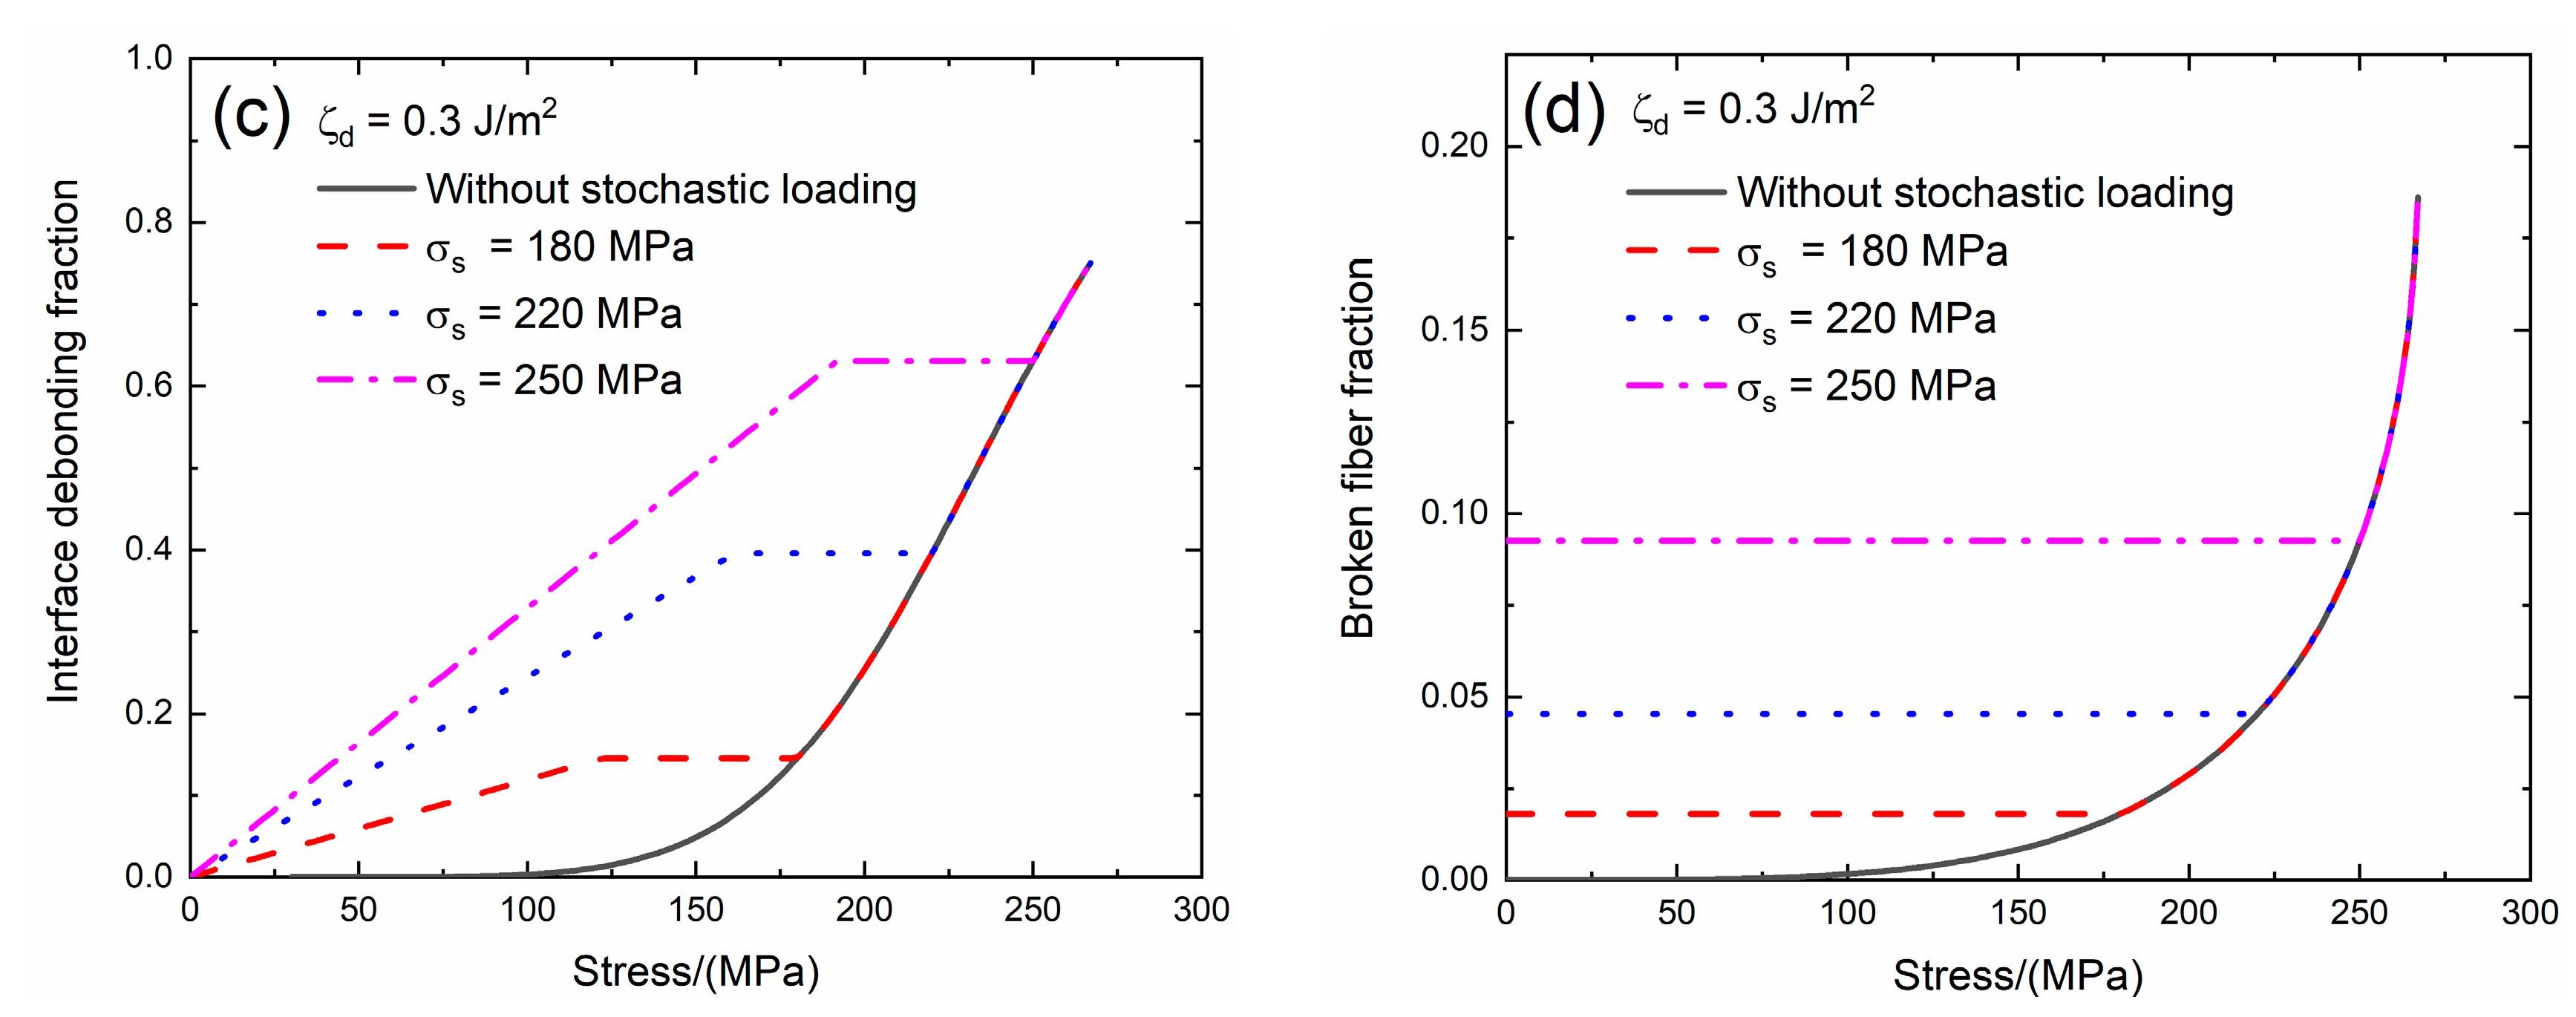
The interface debonding energy is a key interface property of CMCs. Domergue et al. [23] estimated the interface debonding energy of unidirectional SiC/CAS composite by analyzing the hysteresis loops and obtained the interface debonding energy is in the range of ζd = 0.1 – 0.8 J/m2. The effect of the interface debonding energy (i.e., ζd = 0.1 and 0.3 J/m2) on the tensile stress–strain curves, tangent modulus, interface debonding fraction and broken fiber fraction of SiC/SiC composite subjected to stochastic loading of σs = 180, 220 and 250 MPa are shown in Figure 7 and Figure 8 and Table 3. When the interface debonding energy increases, the initial composite strain, tangent modulus and broken fiber fraction remain the same, the transition stress for interface debonding decreases.
When ζd = 0.1 J/m2 under σs = 180 MPa, the damages of matrix cracking and interface debonding occur at σs = 180 MPa, leading to the increase of the composite initial strain, decreasing of the tangent modulus and increase of the broken fiber fraction. The initial composite strain is ε0 = 0.00537%; the initial tangent modulus is Ep = 251.5 GPa, the degradation rate of the tangent modulus is 19% compared with original specimen and the fiber broken fraction is P = 0.018. With increasing stress to σtr = 140.8 MPa, the interface debonding fraction increases and the tangent modulus decreases to Ep = 171.6 GPa corresponding to η = 0.167. When the stress increases from σtr = 140.8 MPa to σ = 180 MPa, the tangent modulus remains constant of Ep = 191 GPa with η = 0.171.
Under σs = 220 MPa, the initial composite strain is ε0 = 0.0161% due to the damages of the matrix cracking and interface debonding; the initial tangent modulus is Ep = 209 GPa, the degradation rate of the tangent modulus is 33% compared with original specimen and the fiber broken fraction is P = 0.045. With increasing stress to σtr = 182.6 MPa, the interface debonding fraction increases and the tangent modulus decreases to Ep = 103.6 GPa corresponding to η = 0.446. When the stress increases from σtr = 182.6 MPa to σ = 220 MPa, the tangent modulus remains constant of Ep = 118.4 GPa with η = 0.451.
Under σs = 250 MPa, the initial composite strain is ε0 = 0.038% due to the damages of the matrix cracking and interface debonding; the initial tangent modulus is Ep = 188.5 GPa, the degradation rate of the tangent modulus is 40% compared with the original specimen and the fiber broken fraction is P = 0.092. With increasing stress to σtr = 211.2 MPa, the interface debonding fraction increases and the tangent modulus decreases to Ep = 77 GPa corresponding to η = 0.694. When the stress increases from σtr = 211.2 MPa to σ = 250 MPa, the tangent modulus remains constant of Ep = 88.2 GPa with η = 0.705.
When ζd = 0.3 J/m2 under σs = 180 MPa, the damages of matrix cracking and interface debonding occur at σs = 180 MPa, leading to the increase of the composite initial strain, decreasing of the tangent modulus and increase of the broken fiber fraction. The initial composite strain is ε0 = 0.00537%; the initial tangent modulus is Ep = 251.5 GPa, the degradation rate of the tangent modulus is 19% compared with the original specimen and the fiber broken fraction is P = 0.018. With increasing stress to σtr = 118.8 MPa, the interface debonding fraction increases and the tangent modulus decreases to Ep = 180.6 GPa corresponding to η = 0.141. When the stress increases from σtr = 118.8 MPa to σ = 180 MPa, the tangent modulus remains constant of Ep = 202 GPa with η = 0.144.
Under σs = 220 MPa, the initial composite strain is ε0 = 0.0161%; the initial tangent modulus is Ep = 209 GPa, the degradation rate of tangent modulus is 33% compared with original specimen and the fiber broken fraction is P = 0.045. With increasing stress to σtr = 158.4 MPa, the interface debonding fraction increases and the tangent modulus decreases to Ep = 110.4 GPa corresponding to η = 0.387. When the stress increases from σtr = 158.4 MPa to σ = 220 MPa, the tangent modulus remains constant of Ep = 127.6 GPa with η = 0.396.
Under σs = 250 MPa, the initial composite strain is ε0 = 0.038% due to the damages of the matrix cracking and interface debonding; the initial tangent modulus is Ep = 188.5 GPa, the degradation rate of tangent modulus is 40% compared with the original specimen and the fiber broken fraction is P = 0.092. With increasing stress to σtr = 189.2 MPa, the interface debonding fraction increases and the tangent modulus decreases to Ep = 82 GPa corresponding to η = 0.622. When the stress increases from σtr = 189.2 MPa to σ = 250 MPa, the tangent modulus remains constant of Ep = 95.1 GPa with η = 0.63.
3.4. Effect of Saturation Matrix Crack Spacing on Tensile Damage and Fracture of SiC/SiC Composite with Stochastic Loading
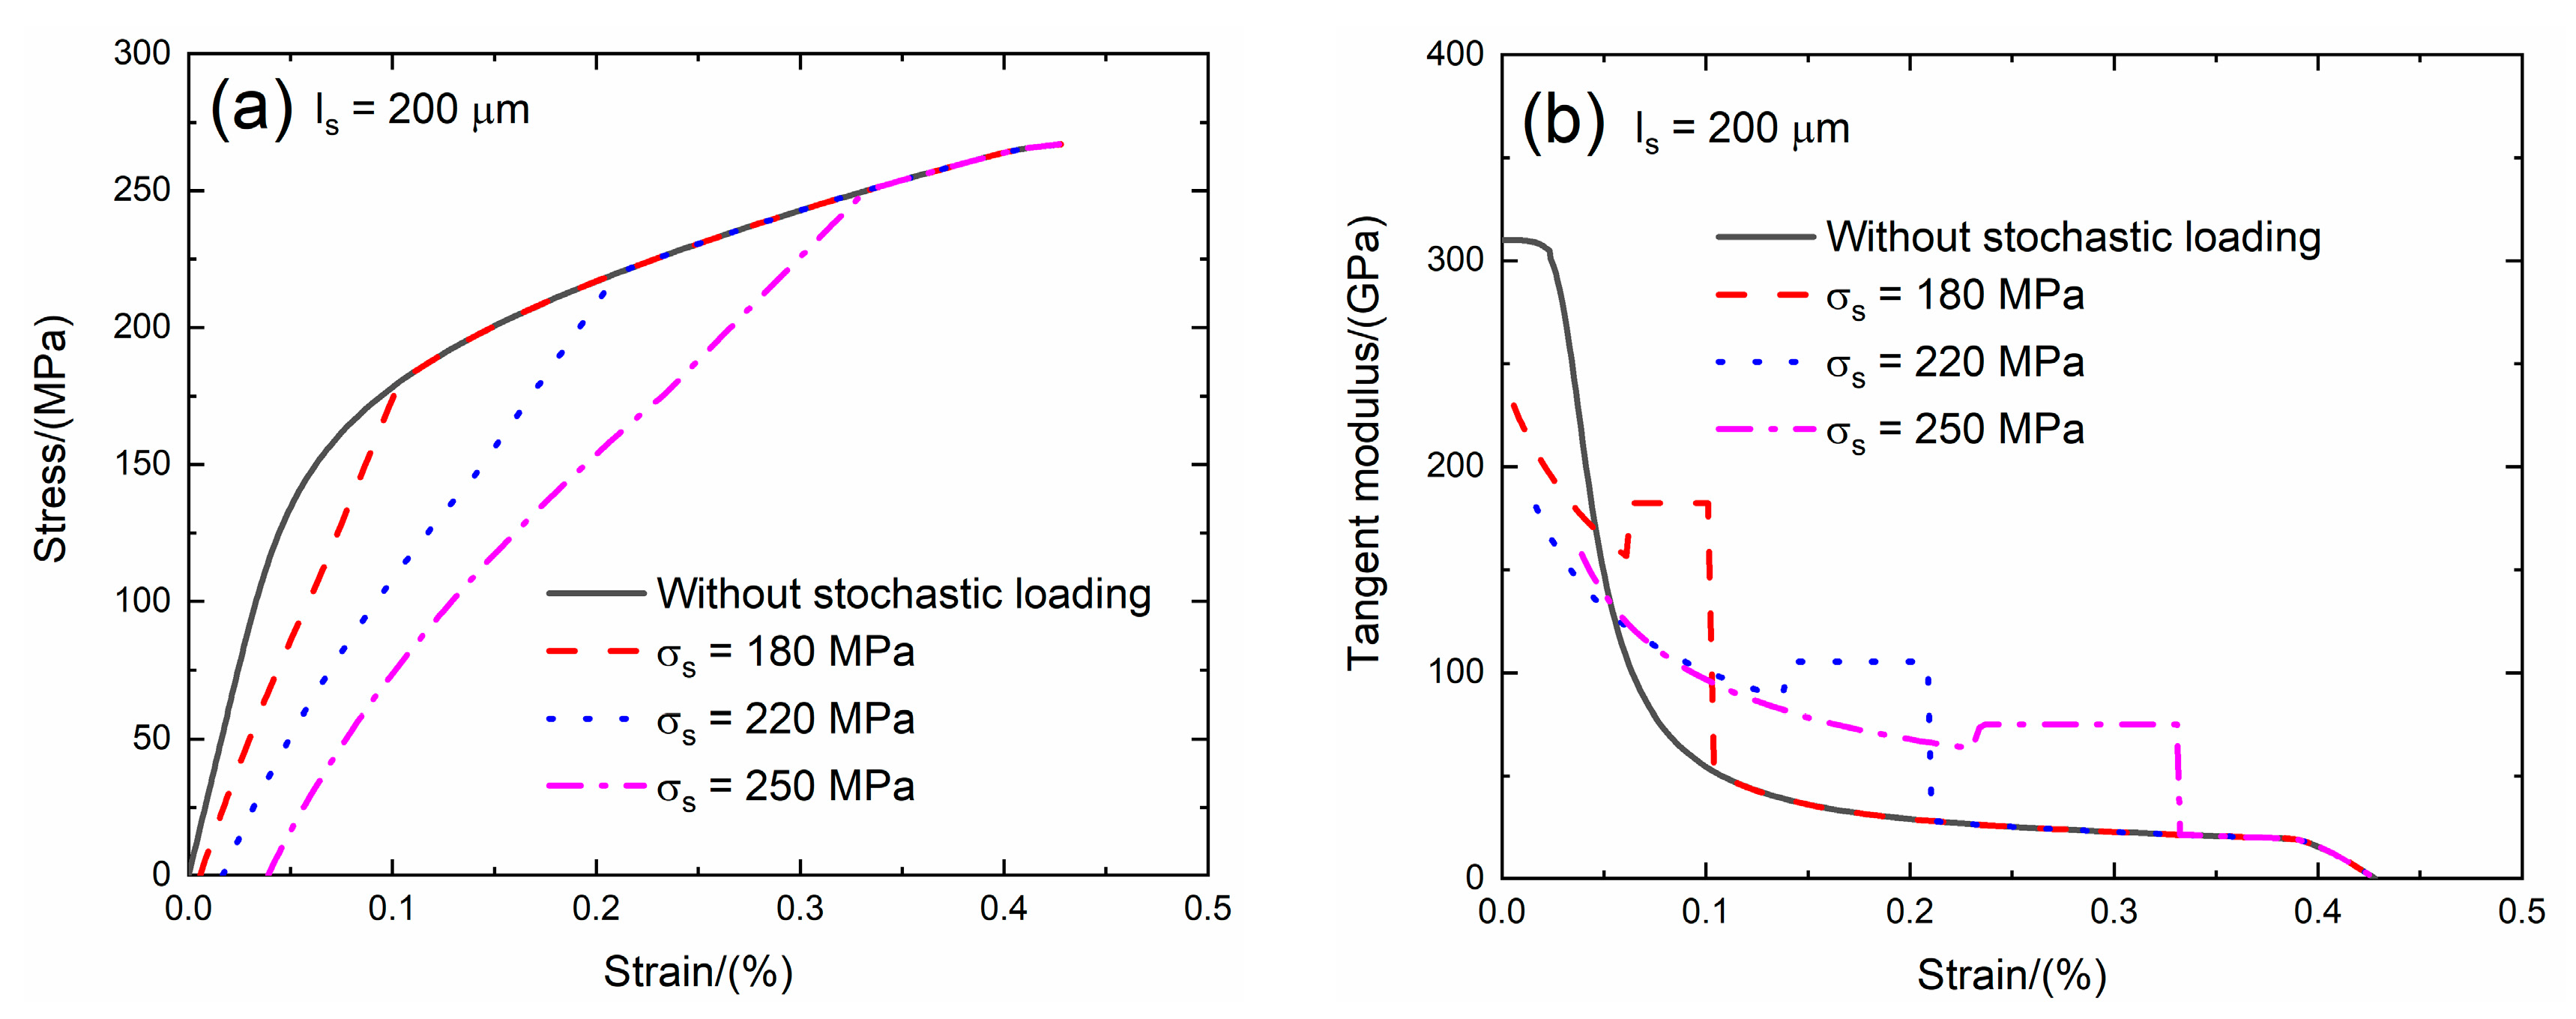
Li [24] investigated multiple matrix cracking of CMCs with different fiber preforms and found that the saturation matrix cracking spacing is in the range of ls = 100 and 500 μm. In the present analysis, the effect of the saturation matrix crack spacing (i.e., ls = 200 and 250 μm) on the tensile stress–strain curves, tangent modulus, interface debonding fraction and broken fiber fraction of SiC/SiC composite subjected to stochastic loading of σs = 180, 220 and 250 MPa are shown in Figure 9 and Figure 10 and Table 4. When saturation matrix crack spacing increases, the initial composite strain decreases, the initial tangent modulus increases, the transition stress for interface debonding and initial fiber broken fraction remain the same.
When ls = 200 μm under σs = 180 MPa, the damages of matrix cracking and interface debonding occur at σs = 200 MPa, leading to the increase of the composite initial strain, decreasing of the tangent modulus and increase of the broken fiber fraction. The initial composite strain is ε0 = 0.00567% due to the damages of the matrix cracking and interface debonding; the initial tangent modulus is Ep = 229.8 GPa, the degradation rate of tangent modulus is 26% compared with the original specimen and the fiber broken fraction is P = 0.018. With increasing stress to σtr = 103.4 MPa, the interface debonding fraction increases and the tangent modulus decreases to Ep = 156.5 GPa corresponding to η = 0.184. When the stress increases from σtr = 103.4 MPa to σ = 180 MPa, the tangent modulus remains constant of Ep = 182.3 GPa with η = 0.189.
Under σs = 220 MPa, the initial composite strain is ε0 = 0.0168% due to the damages of the matrix cracking and the interface debonding; the initial tangent modulus is Ep = 180.3 GPa, the degradation rate of tangent modulus is 42% compared with original specimen and the fiber broken fraction is P = 0.045. With increasing stress to σtr = 143 MPa, the interface debonding fraction increases and the tangent modulus decreases to Ep = 88.1 GPa corresponding to η = 0.524. When the stress increases from σtr = 143 MPa to σ = 220 MPa, the tangent modulus remains constant of Ep = 105.2 GPa with η = 0.536.
Under σs = 250 MPa, the initial composite strain is ε0 = 0.038% due to the damages of the matrix cracking and the interface debonding; the initial tangent modulus is Ep = 157.7 GPa, the degradation rate of tangent modulus is 50% compared with original specimen and the fiber broken fraction is P = 0.092. With increasing stress to σtr = 173.8 MPa, the interface debonding fraction increases and the tangent modulus decreases to Ep = 64 GPa corresponding to η = 0.857. When the stress increases from σtr = 173.8 MPa to σ = 250 MPa, the tangent modulus remains constant of Ep = 75.3 GPa with η = 0.869.
When ls = 250 μm under σs = 180 MPa, the damages of matrix cracking and interface debonding occur at σs = 180 MPa, leading to the increase of the composite initial strain, decreasing of the tangent modulus and increase of the broken fiber fraction. The initial composite strain is ε0 = 0.00549% due to the damages of the matrix cracking and the interface debonding; the initial tangent modulus is Ep = 242.3 GPa, the degradation rate of tangent modulus is 22% compared with original specimen and the fiber broken fraction is P = 0.018. With increasing stress to σtr = 103.4 MPa, the interface debonding fraction increases and the tangent modulus decreases to Ep = 173.7 GPa corresponding to η = 0.147. When the stress increases from σtr = 103.4.5 MPa to σ = 180 MPa, the tangent modulus remains constant of Ep = 198.7 GPa with η = 0.151.
Under σs = 220 MPa, the initial composite strain is ε0 = 0.0164% due to the damages of the matrix cracking and the interface debonding; the initial tangent modulus is Ep = 196.8 GPa, the degradation rate of tangent modulus is 37% compared with original specimen and the fiber broken fraction is P = 0.045. With increasing stress to σtr = 143 MPa, the interface debonding fraction increases and the tangent modulus decreases to Ep = 102.8 GPa corresponding to η = 0.42. When the stress increases from σtr = 143 MPa to σ = 220 MPa, the tangent modulus remains constant of Ep = 121.2 GPa with η = 0.43.
Under σs = 250 MPa, the initial composite strain is ε0 = 0.038% due to the damages of the matrix cracking and the interface debonding; the initial tangent modulus is Ep = 174.8 GPa, the degradation rate of tangent modulus is 44% compared with original specimen and the fiber broken fraction is P = 0.092. With increasing stress to σtr = 173.8 MPa, the interface debonding fraction increases and the tangent modulus decreases to Ep = 75 GPa corresponding to η = 0.685. When the stress increases from σtr = 173.8 MPa to σ = 250 MPa, the tangent modulus remains constant of Ep = 88.6 GPa with η = 0.695.
3.5. Effect of Fiber Strength on Tensile Damage and Fracture of SiC/SiC Composite with Stochastic Loading
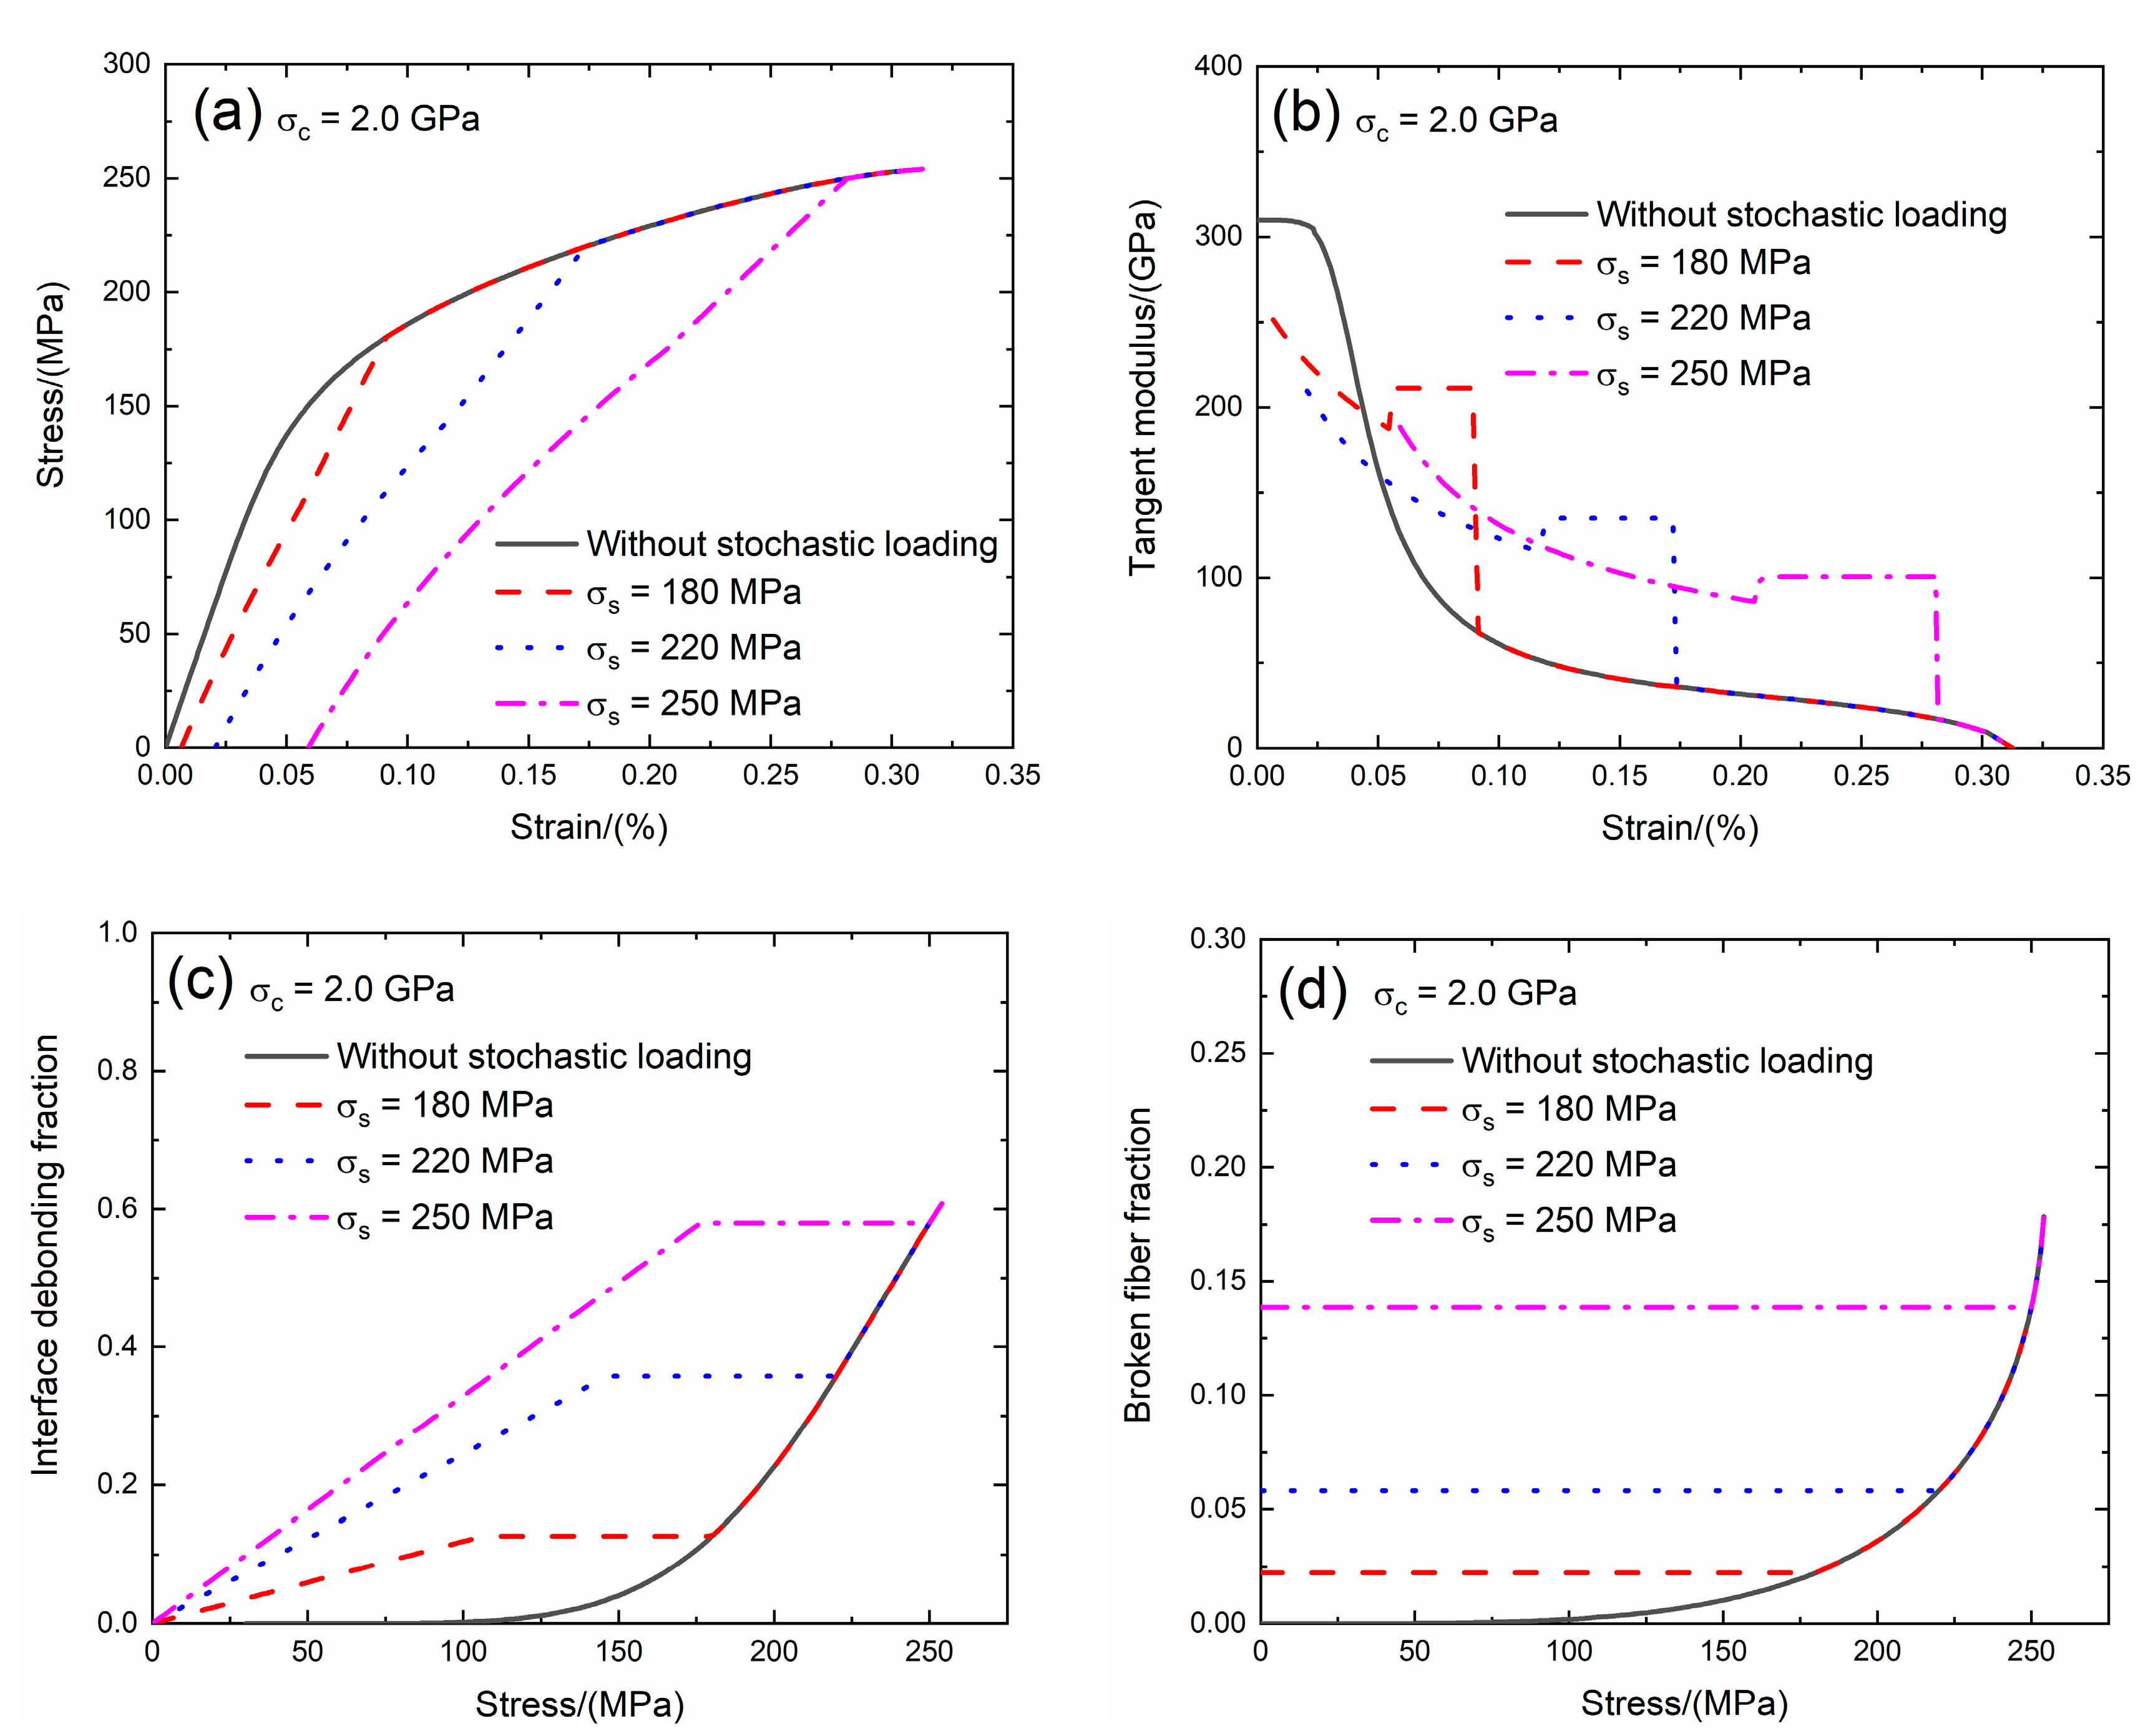
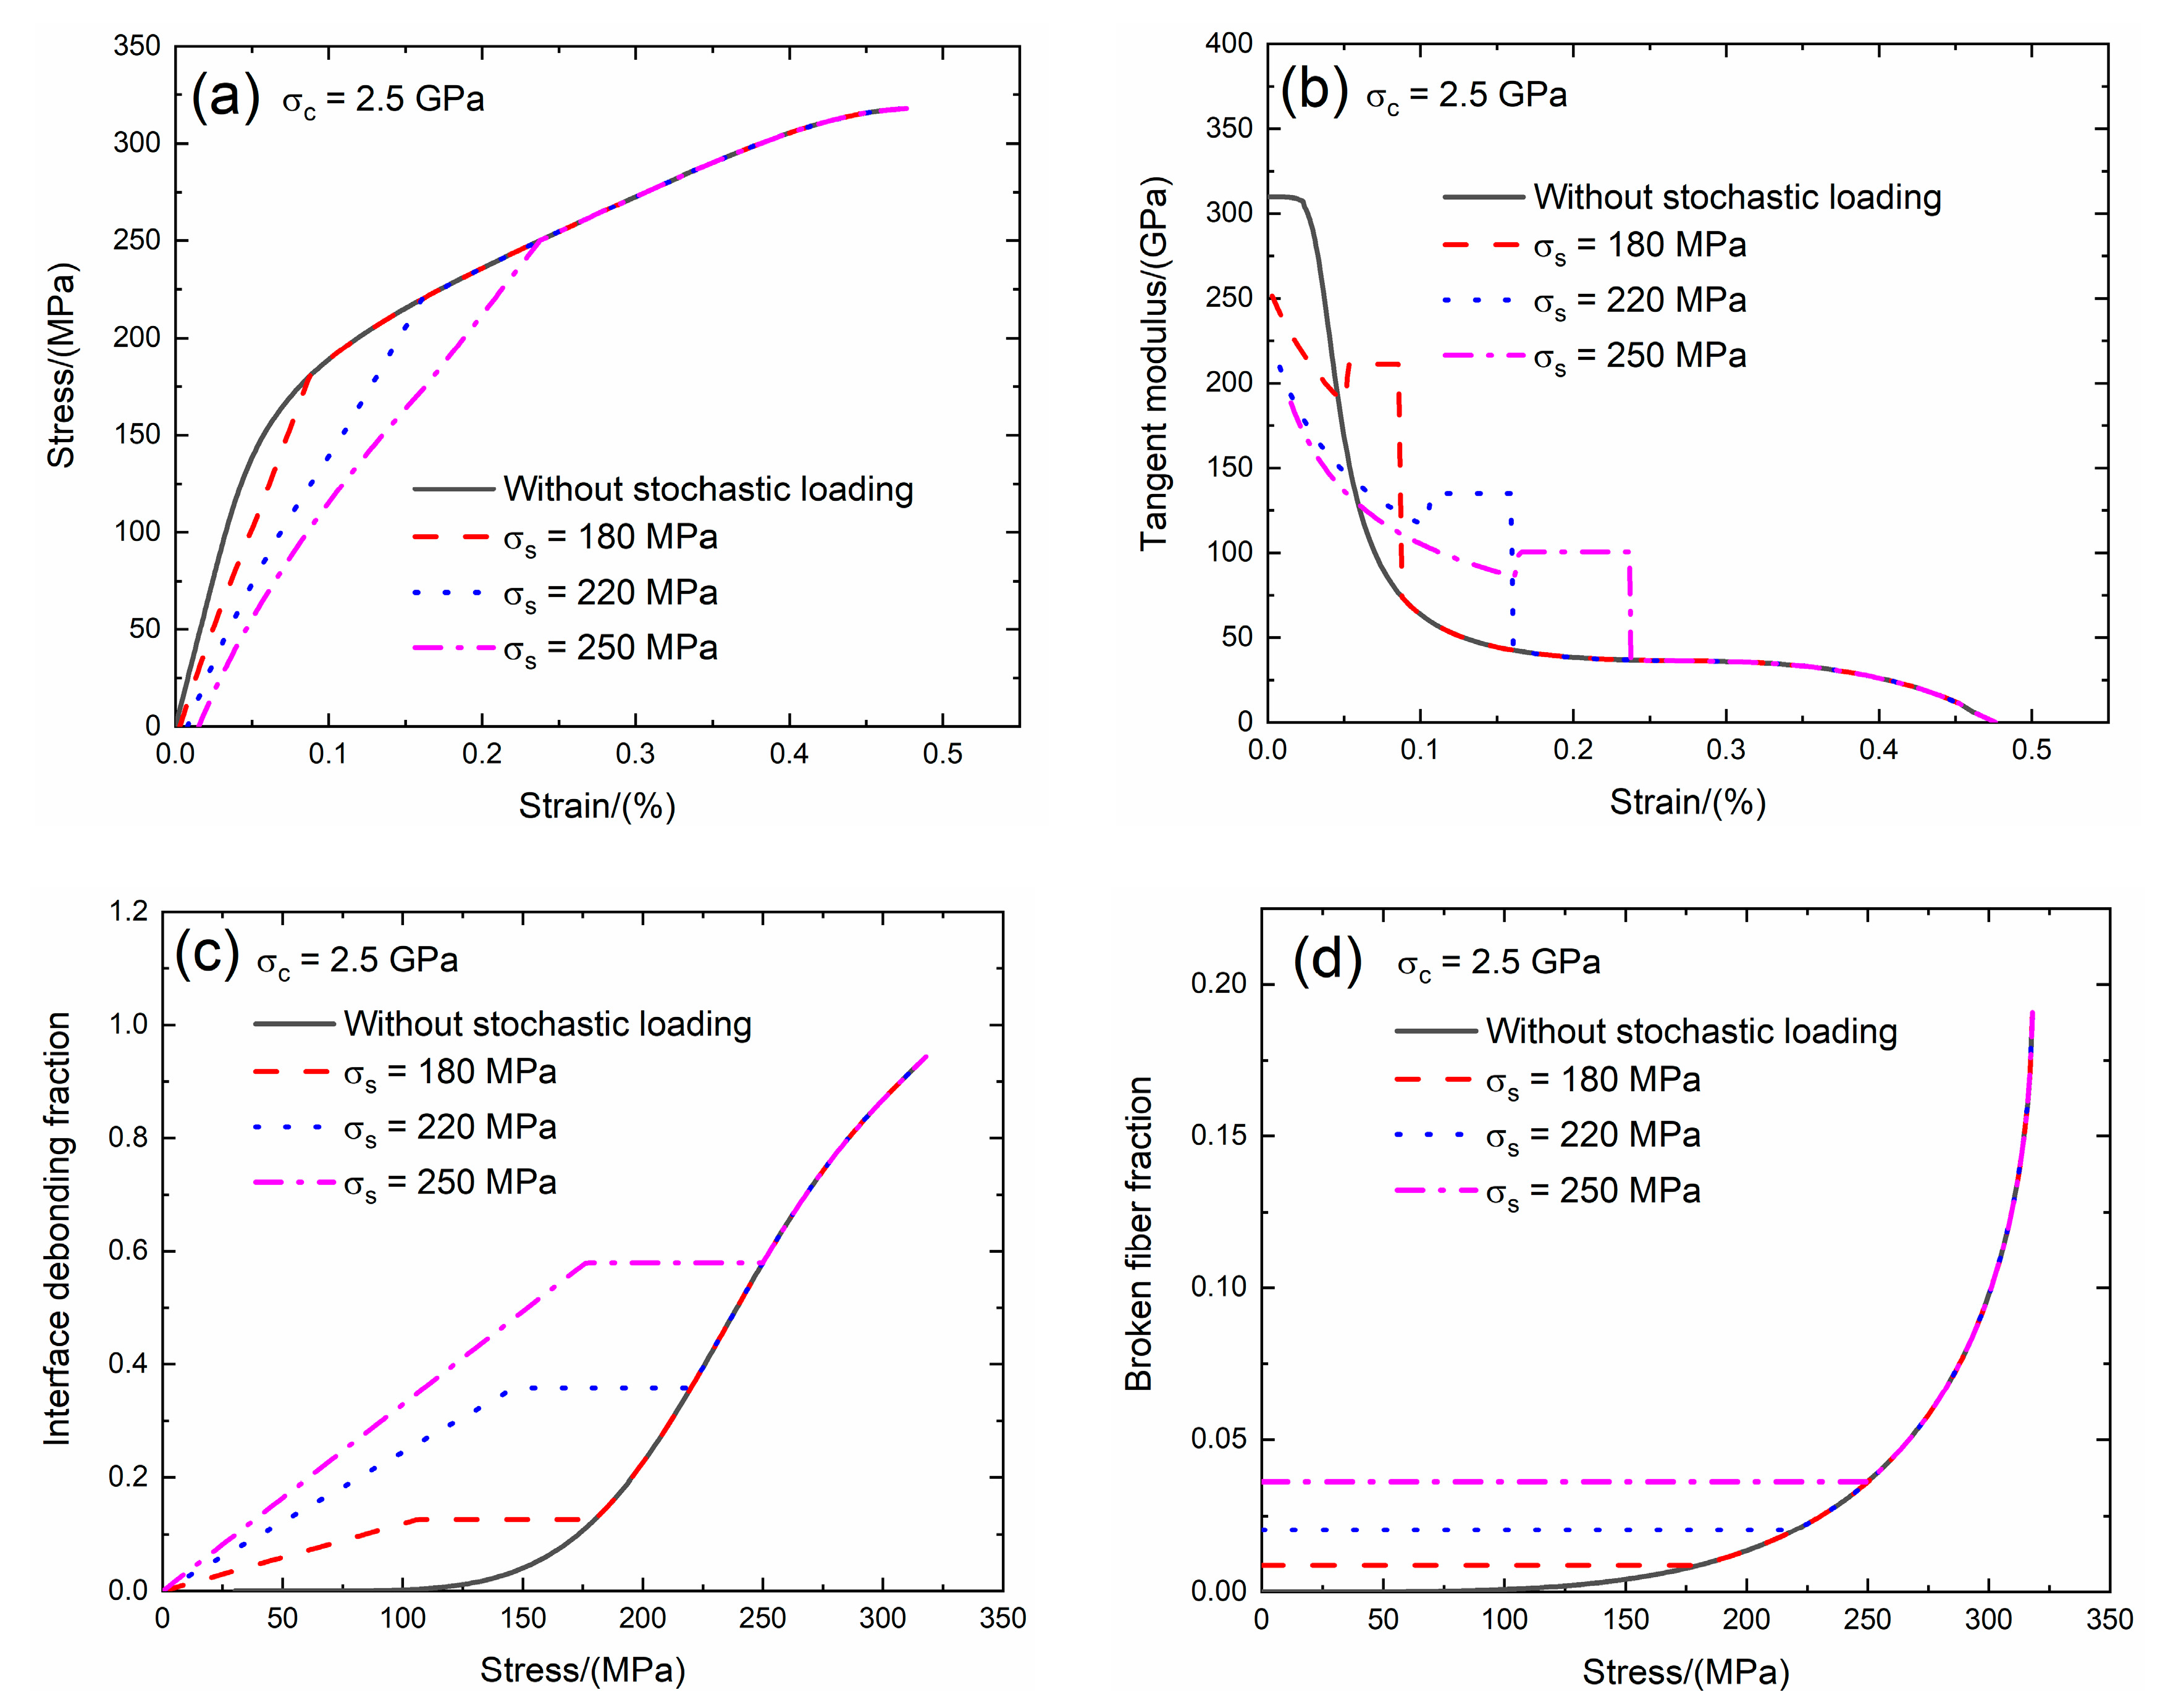
Guo et al. [25] investigated the SiC fiber strength and found that the SiC fiber strength is in the range between σc = 2.3 and 3.7 GPa. In the present analysis, the effect of the fiber strength (i.e., σc = 2.0 and 2.5 GPa) on the tensile stress–strain curves, tangent modulus, interface debonding fraction and broken fiber fraction of SiC/SiC composite subjected to stochastic loading of σs = 180, 220 and 250 MPa are shown in Figure 11 and Figure 12 and Table 5. When the fiber strength increases, the initial composite strain and fiber broken fraction decrease and the initial tangent composite modulus and transition stress for interface debonding remains the same.
When σc = 2.0 GPa under σs = 180 MPa, the damages of matrix cracking and interface debonding occur at σs = 180 MPa, leading to the increase of the composite initial strain, decreasing of the tangent modulus and increase of the broken fiber fraction. The composite initial strain is ε0 = 0.0065% due to the damages of the matrix cracking and the interface debonding; the initial tangent modulus is Ep = 251.5 GPa, the degradation rate of tangent modulus is 19% compared with original specimen and the fiber broken fraction is P = 0.022. With increasing stress to σtr = 103.4 MPa, the interface debonding fraction increases and the tangent modulus decreases to Ep = 187.4 GPa corresponding to η = 0.122. When the stress increases from σtr = 103.4 MPa to σ = 180 MPa, the tangent modulus remains constant of Ep = 211.3 GPa with η = 0.126.
Under σs = 220 MPa, the initial composite strain is ε0 = 0.02% due to the damages of the matrix cracking and the interface debonding; the initial tangent modulus is Ep = 209.6 GPa, the degradation rate of tangent modulus is 33% compared with original specimen and the fiber broken fraction is P = 0.058. With increasing stress to σtr = 143 MPa, the interface debonding fraction increases and the tangent modulus decreases to Ep = 115.7 GPa corresponding to η = 0.349. When the stress increases from σtr = 143 MPa to σ = 220 MPa, the tangent modulus remains constant of Ep = 134.9 GPa with η = 0.357.
Under σs = 250 MPa, the initial composite strain is ε0 = 0.059%; the initial tangent modulus is Ep = 188.5 GPa, the degradation rate of tangent modulus is 40% compared with original specimen and the fiber broken fraction is P = 0.138. With increasing stress to σtr = 173.8 MPa, the interface debonding fraction increases and the tangent modulus decreases to Ep = 86 GPa corresponding to η = 0.571. When the stress increases from σtr = 173.8 MPa to σ = 250 MPa, the tangent modulus remains constant of Ep = 100.6 GPa with η = 0.579.
When σc = 2.5 GPa under σs = 180 MPa, the damages of matrix cracking and interface debonding occur at σs = 180 MPa, leading to the increase of the composite initial strain, decreasing of the tangent modulus and increase of the broken fiber fraction. The initial composite strain is ε0 = 0.0028% due to the damages of the matrix cracking and the interface debonding; the initial tangent modulus is Ep = 251.5 GPa, the degradation rate of tangent modulus is 19% compared with original specimen and the fiber broken fraction is P = 0.0087. With increasing stress to σtr = 103.4 MPa, the interface debonding fraction increases and the tangent modulus decreases to Ep = 187.4 GPa corresponding to η = 0.122. When the stress increases from σtr = 103.4 MPa to σ = 180 MPa, the tangent modulus remains constant of Ep = 211.3 GPa with η = 0.126.
Under σs = 220 MPa, the initial composite strain is ε0 = 0.007% due to the damages of the matrix cracking and the interface debonding; the initial tangent modulus is Ep = 209.6 GPa, the degradation rate of tangent modulus is 33% compared with original specimen and the fiber broken fraction is P = 0.02. With increasing stress to σtr = 143 MPa, the interface debonding fraction increases and the tangent modulus decreases to Ep = 115.7 GPa corresponding to η = 0.344. When the stress increases from σtr = 140.8 MPa to σ = 220 MPa, the tangent modulus remains constant of Ep = 134.9 GPa with η = 0.357.
Under σs = 250 MPa, the initial composite strain is ε0 = 0.015%; the initial tangent modulus is Ep = 188.5 GPa, the degradation rate of the tangent modulus is 40% compared with original specimen and the fiber broken fraction is P = 0.036. With increasing stress to σtr = 173.8 MPa, the interface debonding fraction increases and the tangent modulus decreases to Ep = 86 GPa corresponding to η = 0.571. When the stress increases from σtr = 173.8 MPa to σ = 250 MPa, the tangent modulus remains constant of Ep = 100.6 GPa with η = 0.579.
4. Experimental Comparisons
Li et al. [4], Liu [5], Guo and Kagawa [6] and Morscher [7] investigated tensile behavior of unidirectional and 2D SiC/SiC composites at room temperature. In this section, using the developed damage models and micromechanical constitutive models for the conditions of matrix cracking, interface debonding and fiber failure, the experimental tensile stress–strain curves are predicted. The comparisons between tensile stress–strain curves with and without stochastic loading are analyzed. The relationships between the stochastic loading stress levels, tangent modulus, interface debonding fraction and fiber broken fraction are established.
4.1. 2D SiC/SiC under Stochastic Loading of 140, 180, 200 and 240 MPa
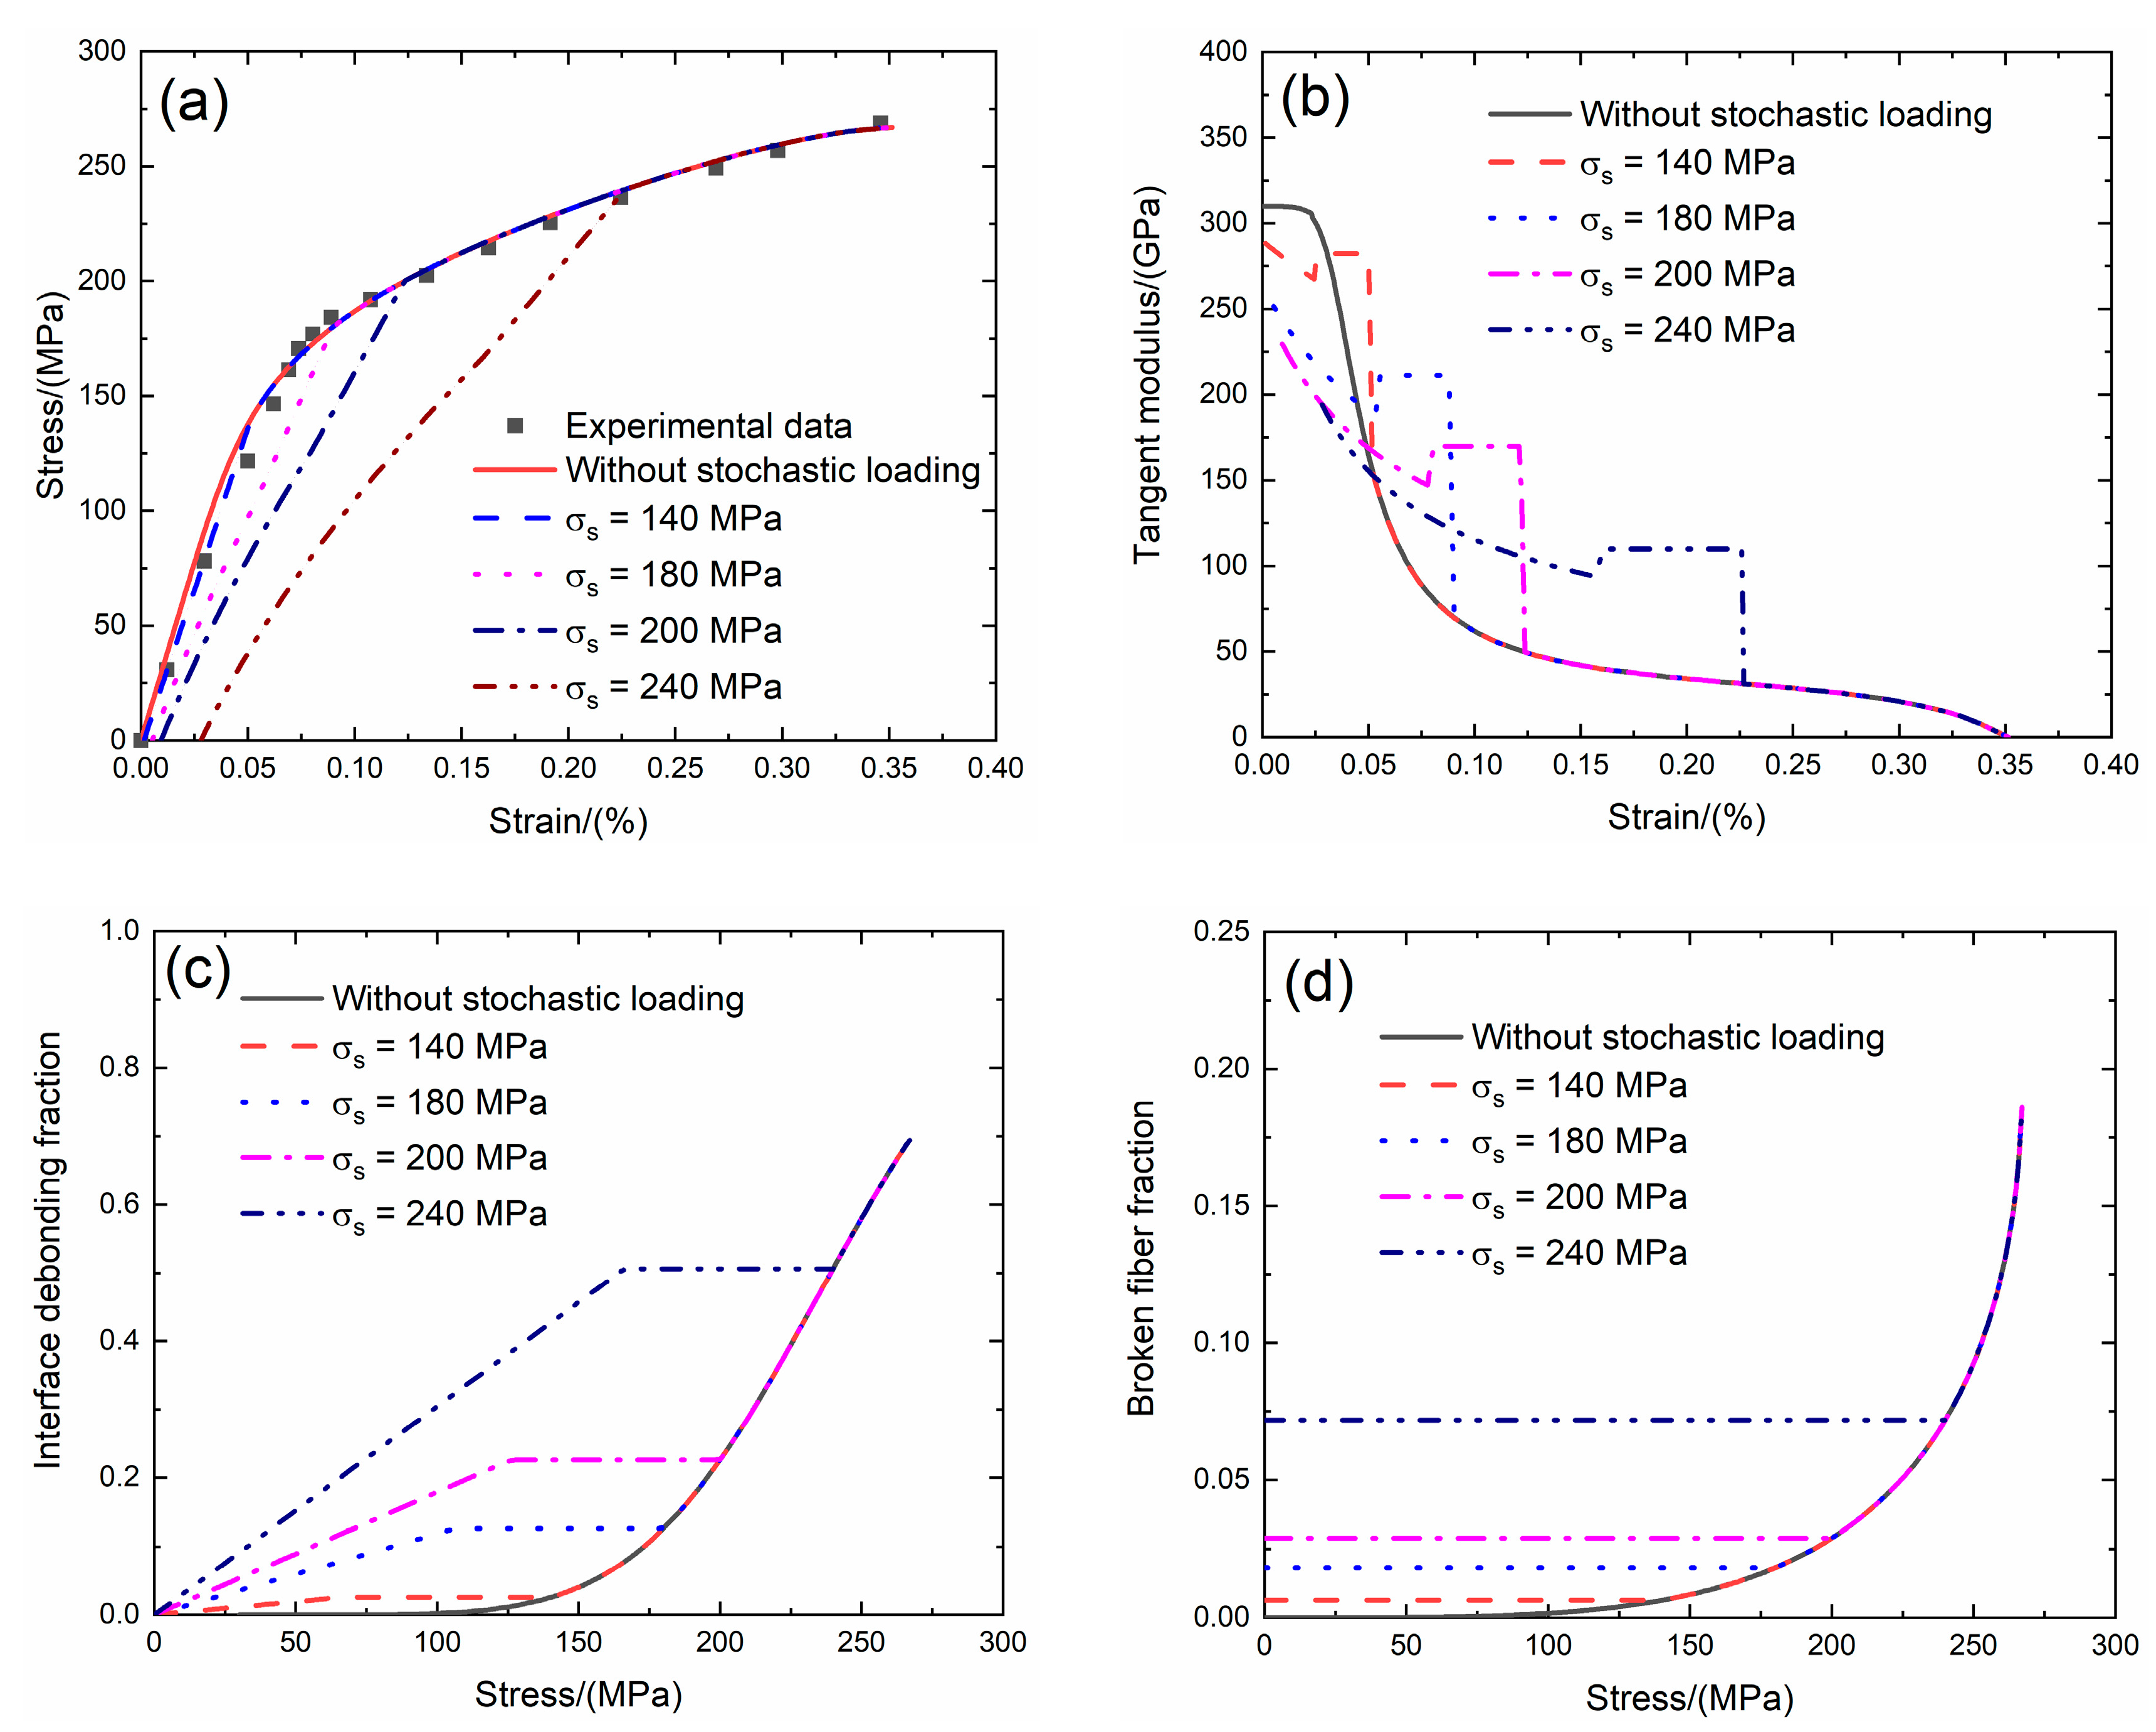
Li et al. [4] investigated the tensile behavior of 2D SiC/SiC composite at room temperature. The composite was fabricated using chemical vapor infiltration (CVI) method. The tensile test was performed under displacement control with the speed of 0.3 mm/min. The experimental tensile stress–strain curves, tangent modulus versus strain curves, interface debonding fraction and broken fiber fraction versus stress curves of 2D SiC/SiC composite without stochastic loading and with stochastic loading at σs = 140, 180, 200 and 240 MPa at room temperature are shown in Figure 13 and Table 6. When stochastic loading stress increases, the initial composite strain increases, the initial tangent modulus decreases, the transition stress for interface debonding increases and the initial fiber broken fraction increases.
Under σs = 140 MPa, the initial strain is ε0 = 0.001%; the initial tangent modulus is Ep = 288 GPa, the degradation rate of tangent modulus is 7% compared with original specimen and the fiber broken fraction is P = 0.006. With increasing stress to σtr = 63.8 MPa, the tangent modulus decreases to Ep = 267.4 GPa corresponding to η = 0.024. When the stress increases from σtr = 63.8 MPa to σ = 140 MPa, the tangent modulus remains constant of Ep = 282.3 GPa with η = 0.025.
Under σs = 180 MPa, the initial strain is ε0 = 0.005%; the initial tangent modulus is Ep = 251 GPa, the degradation rate of tangent modulus is 19% compared with original specimen and the fiber broken fraction is P = 0.018. With increasing stress to σtr = 103.4 MPa, the tangent modulus decreases to Ep = 187.4 GPa corresponding to η = 0.122. When the stress increases from σtr = 103.4 MPa to σ = 180 MPa, the tangent modulus remains constant of Ep = 211.3 GPa with η = 0.126.
Under σs = 200 MPa, the initial strain is ε0 = 0.009%; the initial tangent modulus is Ep = 229.5 GPa, the degradation rate of tangent modulus is 26% compared with original specimen and the fiber broken fraction is P = 0.028. With increasing stress to σtr = 123.2 MPa, the tangent modulus decreases to Ep = 147.1 GPa corresponding to η = 0.22. When the stress increases from σtr = 123.2 MPa to σ = 200 MPa, the tangent modulus remains constant of Ep = 169.7 GPa with η = 0.226.
Under σs = 240 MPa, the initial strain is ε0 = 0.028%; the initial tangent modulus is Ep = 194.2 GPa, the degradation rate of tangent modulus is 38% compared with original specimen and the fiber broken fraction is P = 0.078. With increasing stress to σtr = 162.8 MPa, the tangent modulus decreases to Ep = 94 GPa corresponding to η = 0.49. When the stress increases from σtr = 162.8 MPa to σ = 240 MPa, the tangent modulus remains constant of Ep = 109.8 GPa with η = 0.5.
4.2. UD and 2D SiC/SiC under Stochastic Loading
Liu [5] investigated the tensile behavior of unidirectional and 2D SiC/SiC composites at room temperature. The tensile test was performed under displacement control with the loading rate of 0.2 mm/min.
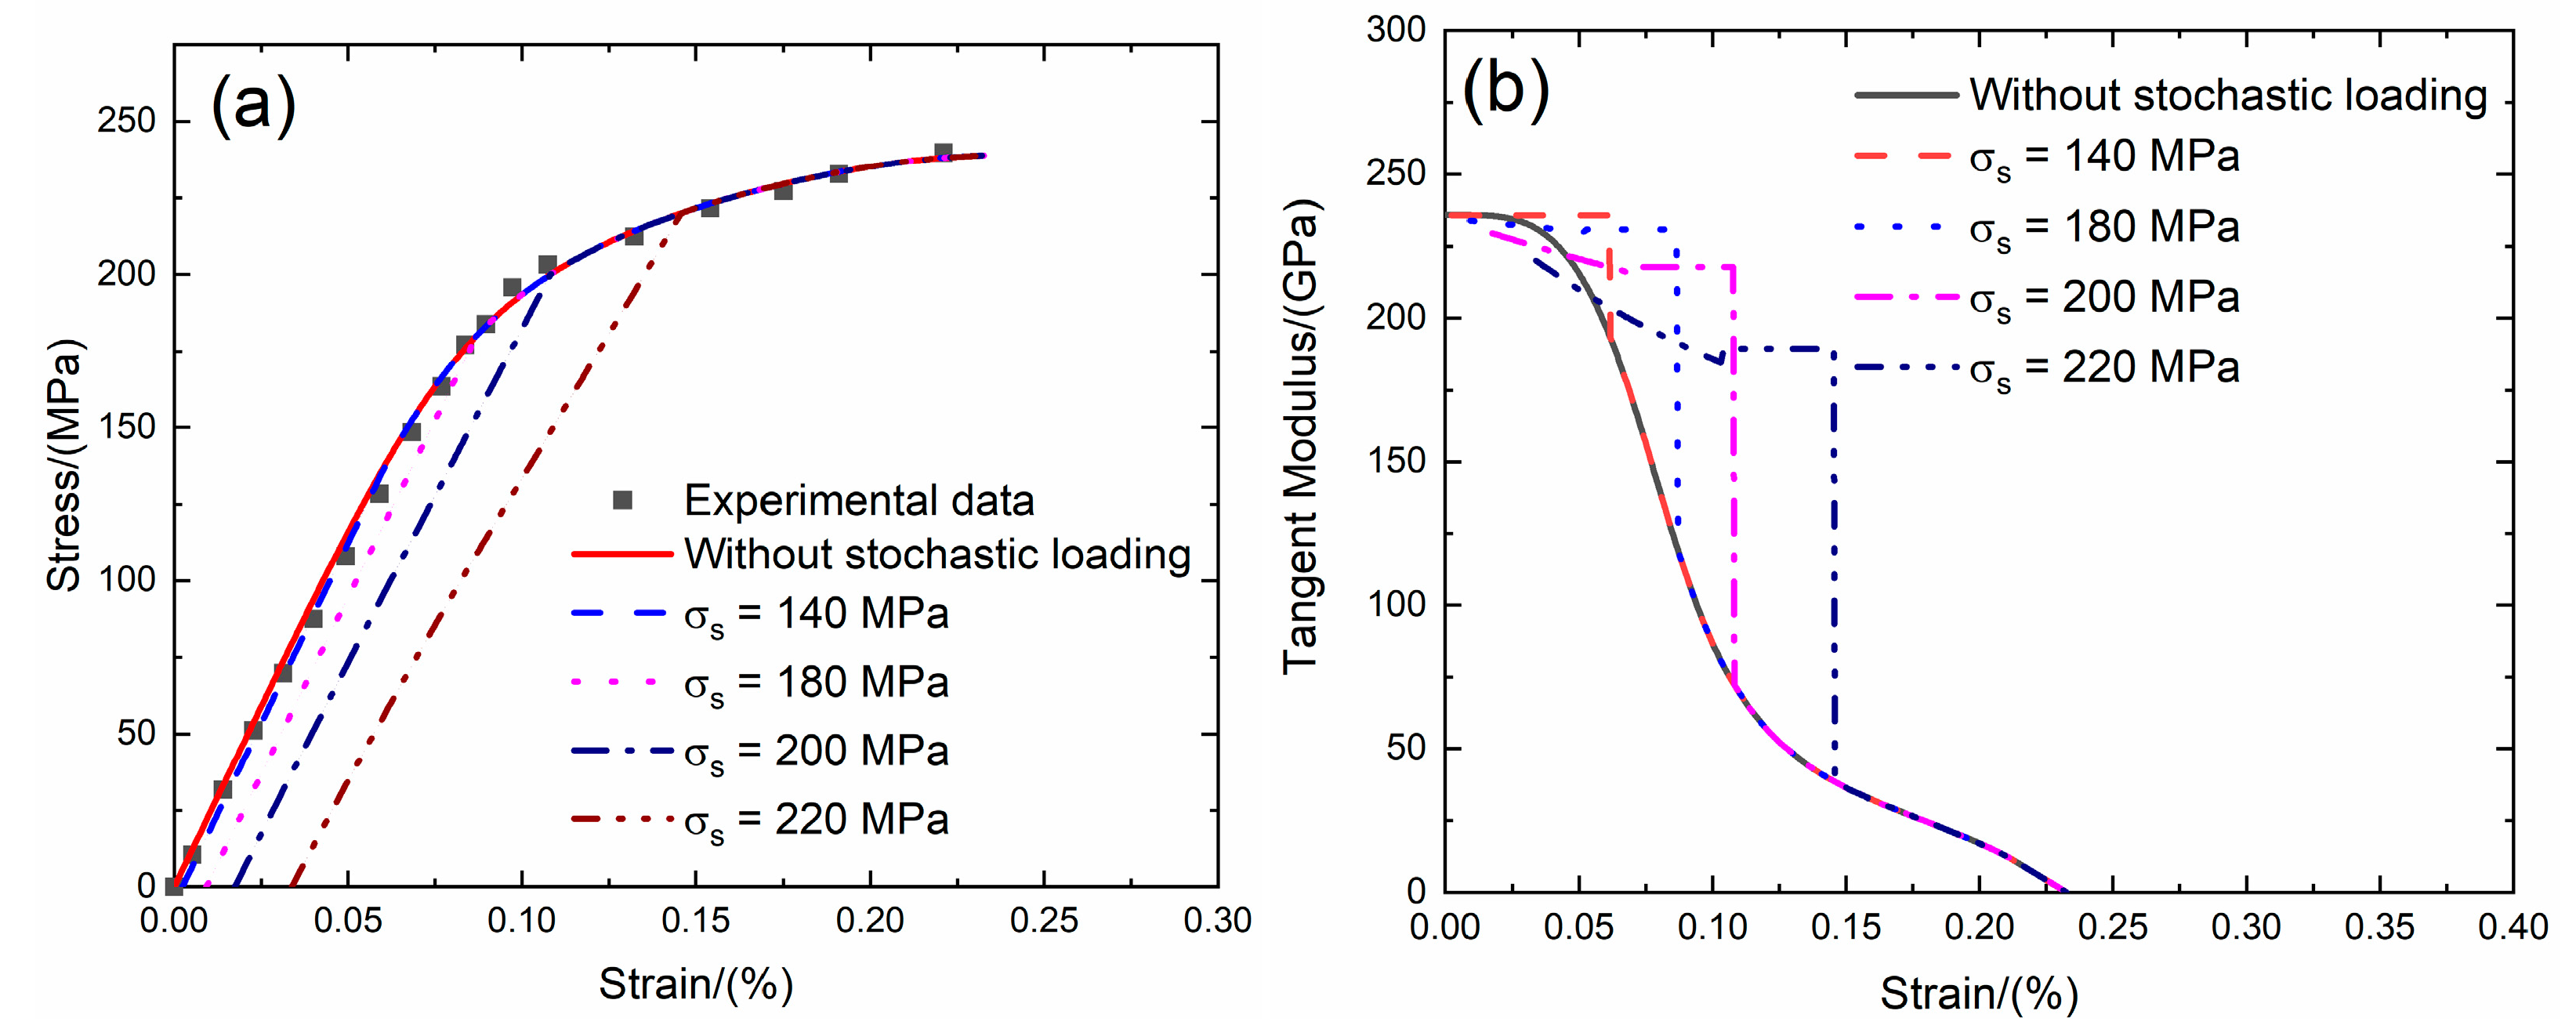
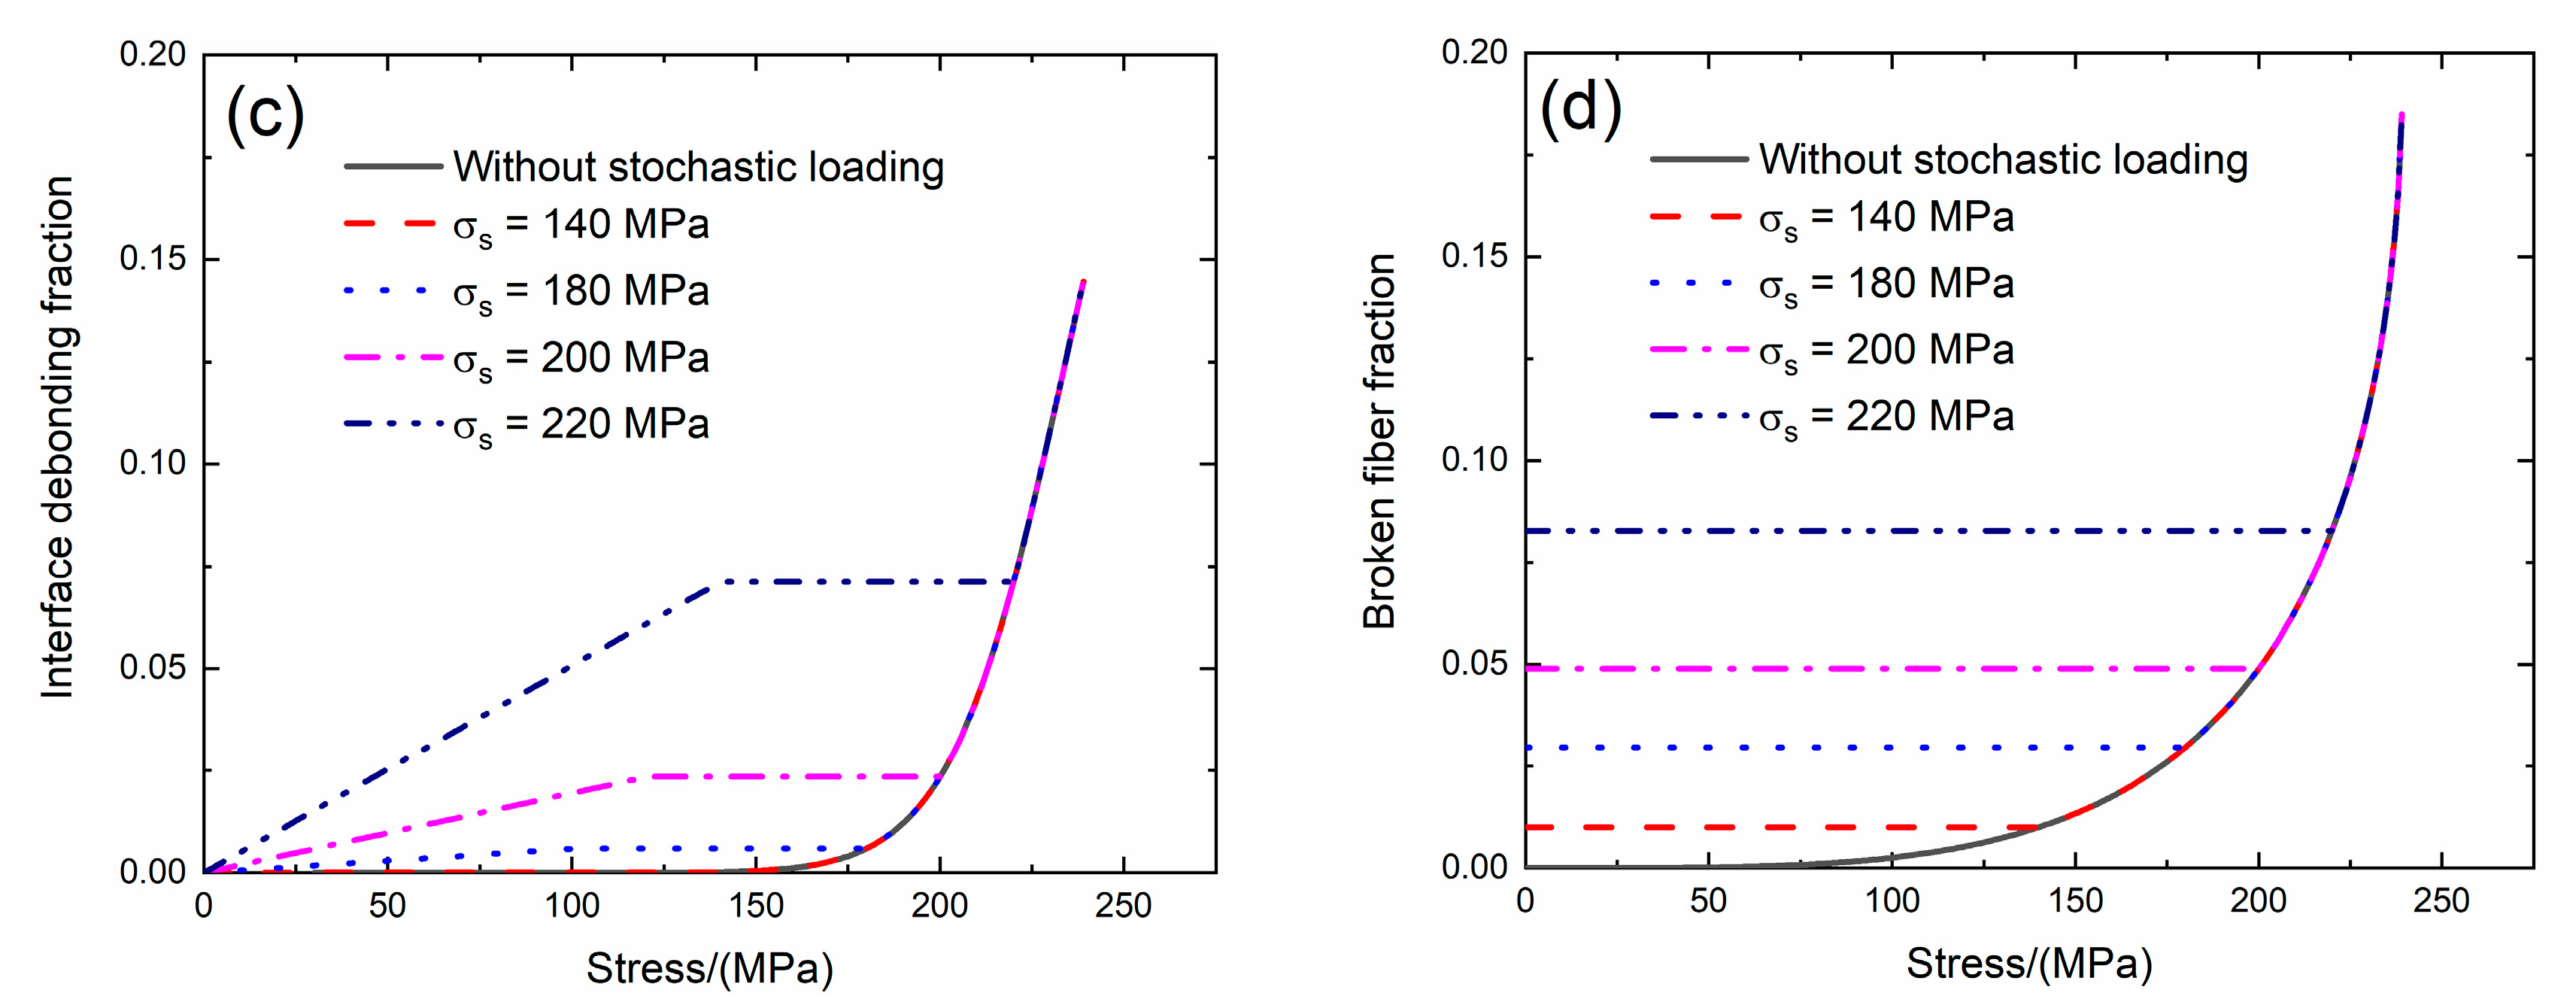
For unidirectional SiC/SiC composite, the tensile stress–strain curves, tangent modulus versus strain curves, interface debonding fraction and broken fiber fraction versus stress curves without stochastic loading and with stochastic loading at σs = 140, 180, 200 and 220 MPa at room temperature are shown in Figure 14 and Table 7.
Under σs = 140 MPa, the initial strain is ε0 = 0.002%; the initial tangent modulus is Ep = 235.9 GPa, the degradation rate of tangent modulus is 1% compared with original specimen and the fiber broken fraction is P = 0.01. With increasing stress to σtr = 58.8 MPa, the tangent modulus decreases to Ep = 235.7 GPa corresponding to η = 0.0001. When the stress increases from σtr = 58.8 MPa to σ = 140 MPa, the tangent modulus remains constant of Ep = 235.8 GPa with η = 0.0001.
Under σs = 180 MPa, the initial strain is ε0 = 0.009%; the initial tangent modulus is Ep = 234 GPa, the degradation rate of tangent modulus is 1.1% compared with original specimen and the fiber broken fraction is P = 0.03. With increasing stress to σtr = 98.4 MPa, the tangent modulus decreases to Ep = 230.1 GPa corresponding to η = 0.005. When the stress increases from σtr = 98.4 MPa to σ = 180 MPa, the tangent modulus remains constant of Ep = 230.9 GPa with η = 0.005.
Under σs = 200 MPa, the initial strain is ε0 = 0.0174%; the initial tangent modulus is Ep = 229.6 GPa, the degradation rate of tangent modulus is 2.8% compared with original specimen and the fiber broken fraction is P = 0.048. With increasing stress to σtr = 118.8 MPa, the tangent modulus decreases to Ep = 215.4 GPa corresponding to η = 0.023. When the stress increases from σtr = 118.8 MPa to σ = 200 MPa, the tangent modulus remains constant of Ep = 217.8 GPa with η = 0.023.
Under σs = 220 MPa, the initial strain is ε0 = 0.033%; the initial tangent modulus is Ep = 220.1 GPa, the degradation rate of tangent modulus is 6.8% compared with original specimen and the fiber broken fraction is P = 0.082. With increasing stress to σtr = 139 MPa, the tangent modulus decreases to Ep = 184.5 GPa corresponding to η = 0.07. When the stress increases from σtr = 139 MPa to σ = 220 MPa, the tangent modulus remains constant of Ep = 189.2 GPa with η = 0.071.
For 2D SiC/SiC composite, the tensile stress–strain curves, tangent modulus versus strain curves, interface debonding fraction and broken fiber fraction versus stress curves without stochastic loading and with stochastic loading at σs = 80, 100 and 120 MPa at room temperature are shown in Figure 15 and Table 8.
Under σs = 80 MPa, the initial strain is ε0 = 0.002%; the initial tangent modulus is Ep = 138.3 GPa, the degradation rate of tangent modulus is 1.2% compared with original specimen and the fiber broken fraction is P = 0.01. With increasing stress to σtr = 13.2 MPa, the tangent modulus decreases to Ep = 137.6 GPa corresponding to η = 0.001. When stress increases from σtr = 13.2 MPa to σ = 80 MPa, the tangent modulus remains constant of Ep = 137.7 GPa with η = 0.002.
Under σs = 100 MPa, the initial strain is ε0 = 0.008%; the initial tangent modulus is Ep = 135.6 GPa, the degradation rate of tangent modulus is 3.1% compared with original specimen and the fiber broken fraction is P = 0.027. With increasing stress to σtr = 32.4 MPa, the tangent modulus decreases to Ep = 131 GPa corresponding to η = 0.012. When stress increases from σtr = 32.4 MPa to σ = 100 MPa, the tangent modulus remains constant of Ep = 131.3 GPa with η = 0.013.
Under σs = 120 MPa, the initial strain is ε0 = 0.025%; the initial tangent modulus is Ep = 131.9 GPa, the degradation rate of tangent modulus is 5.8% compared with original specimen and the fiber broken fraction is P = 0.068. With increasing stress to σtr = 52.8 MPa, the tangent modulus decreases to Ep = 119.5 GPa corresponding to η = 0.038. When stress increases from σtr = 52.8 MPa to σ = 120 MPa, the tangent modulus remains constant of Ep = 119.5 GPa with η = 0.039.
4.3. 2D SiC/SiC under Stochastic Loading of 80, 100 and 120 MPa
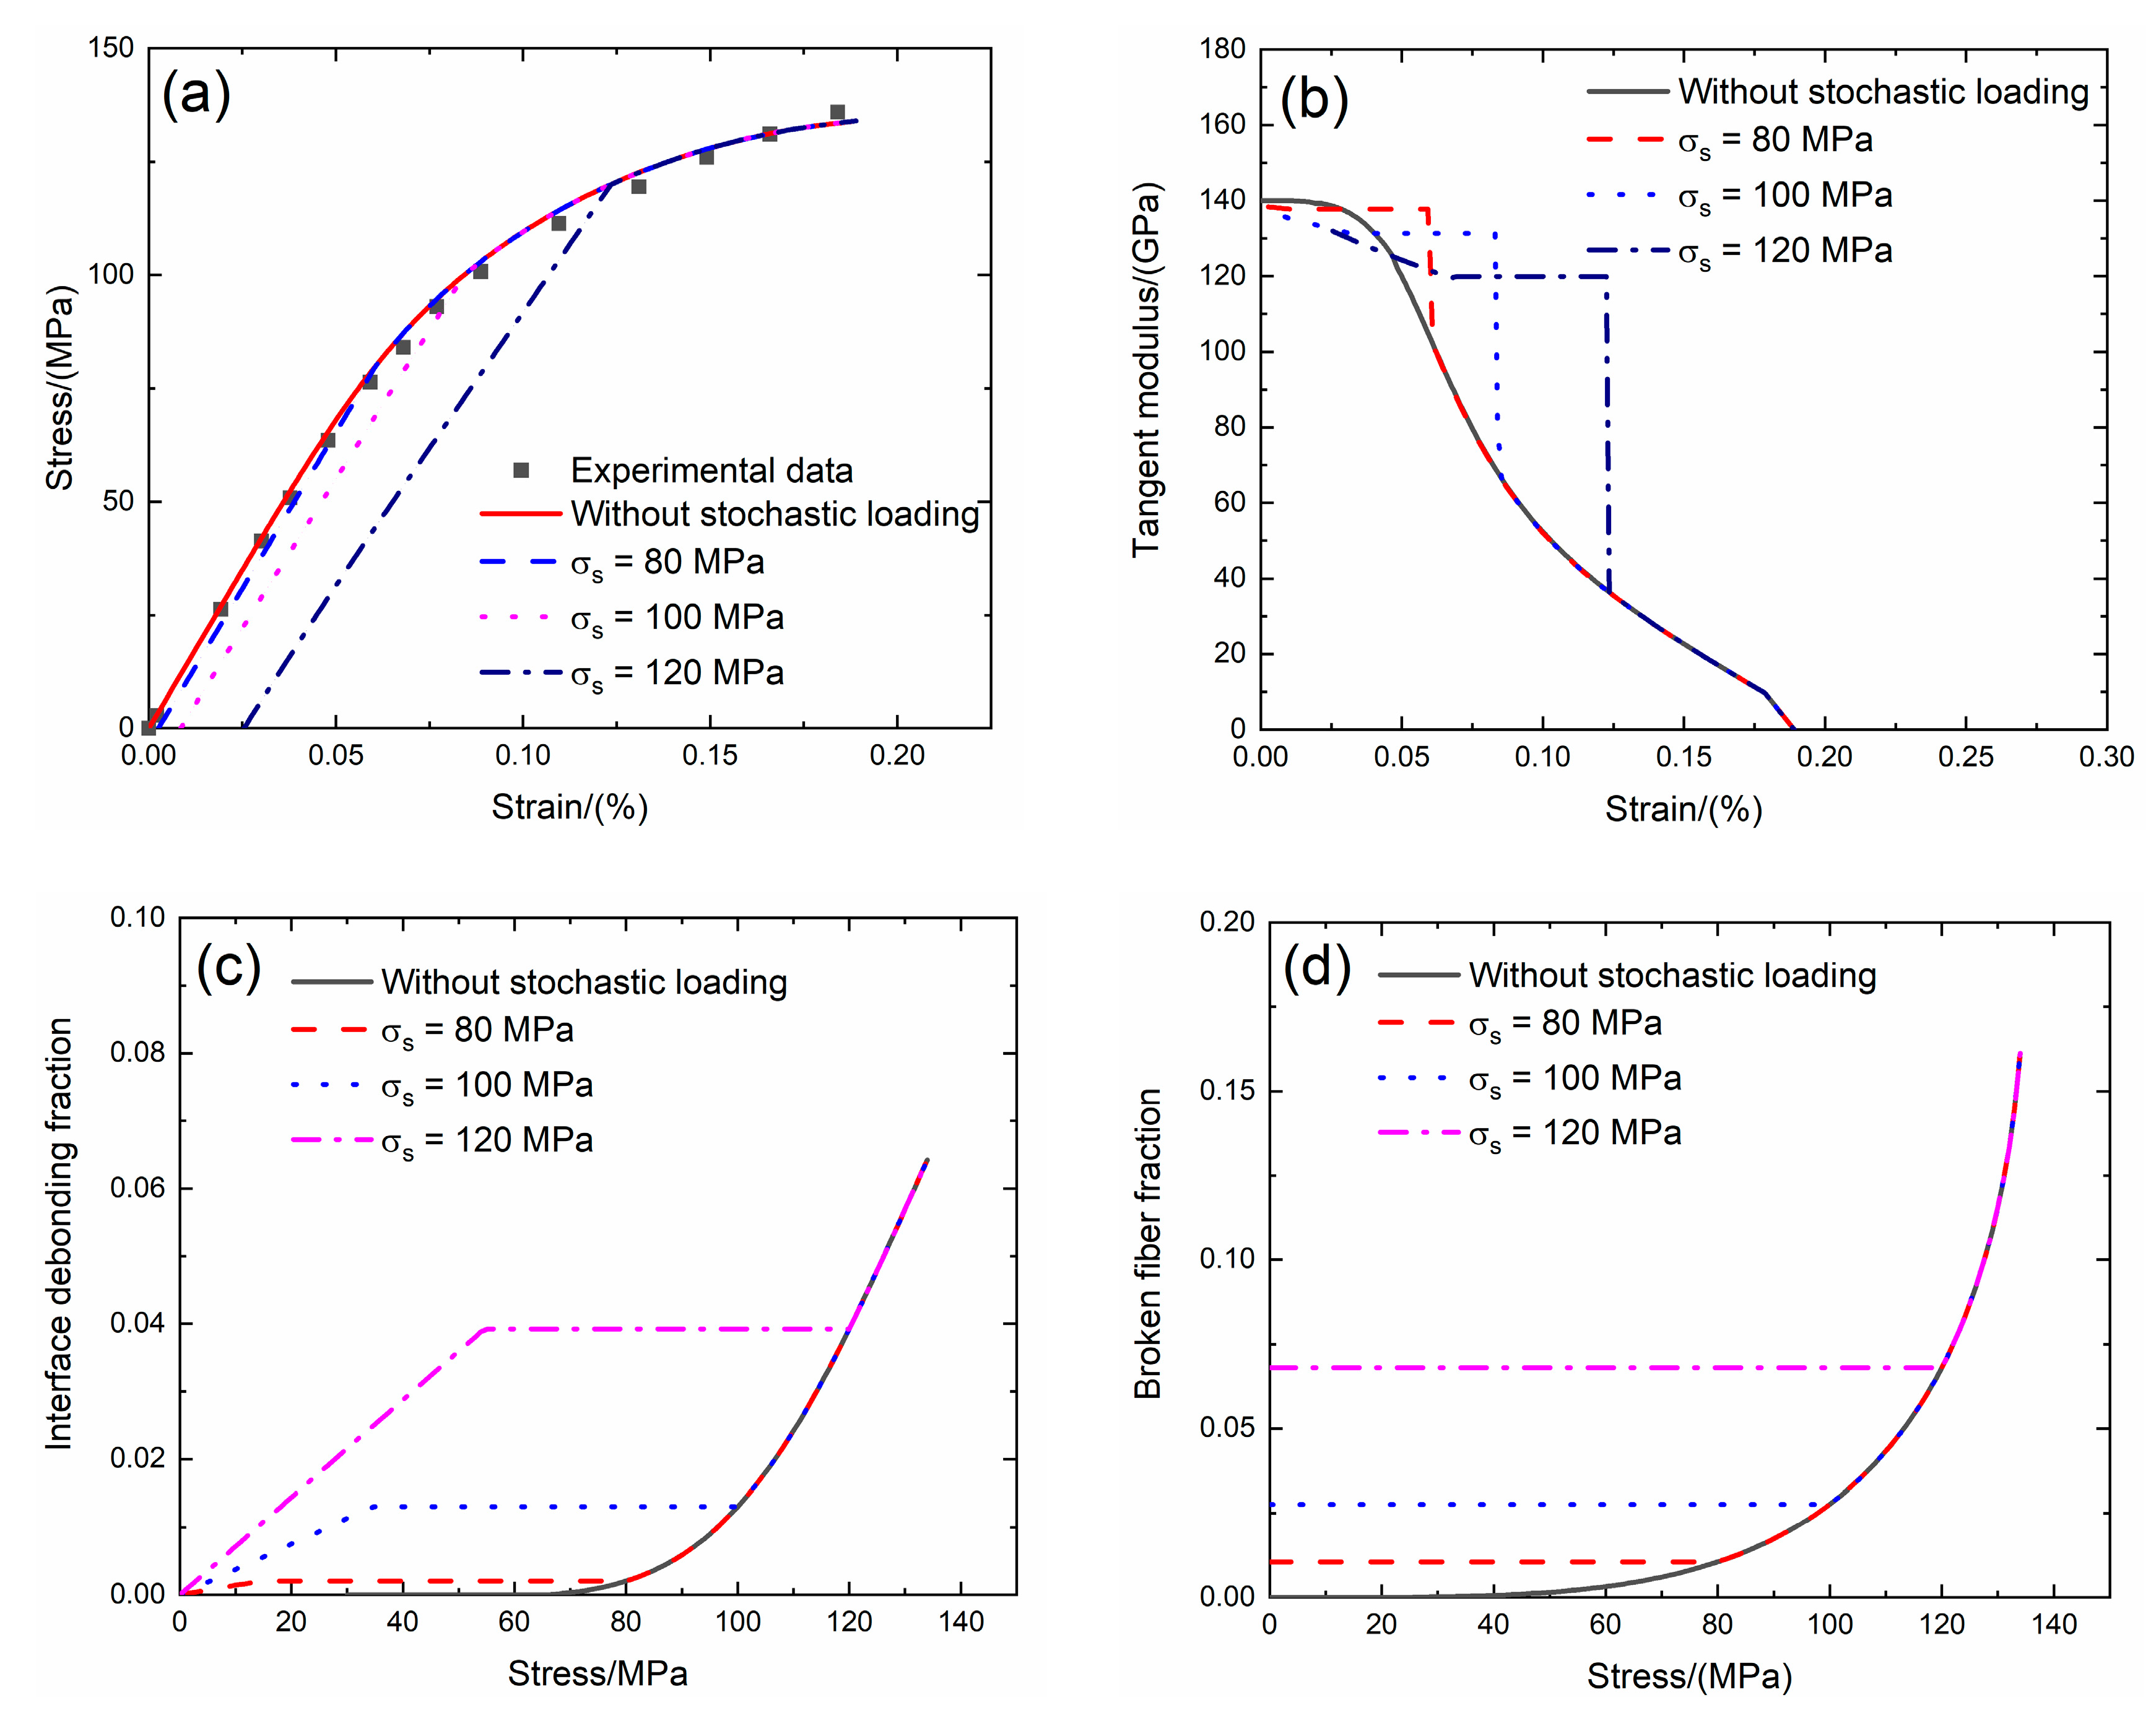
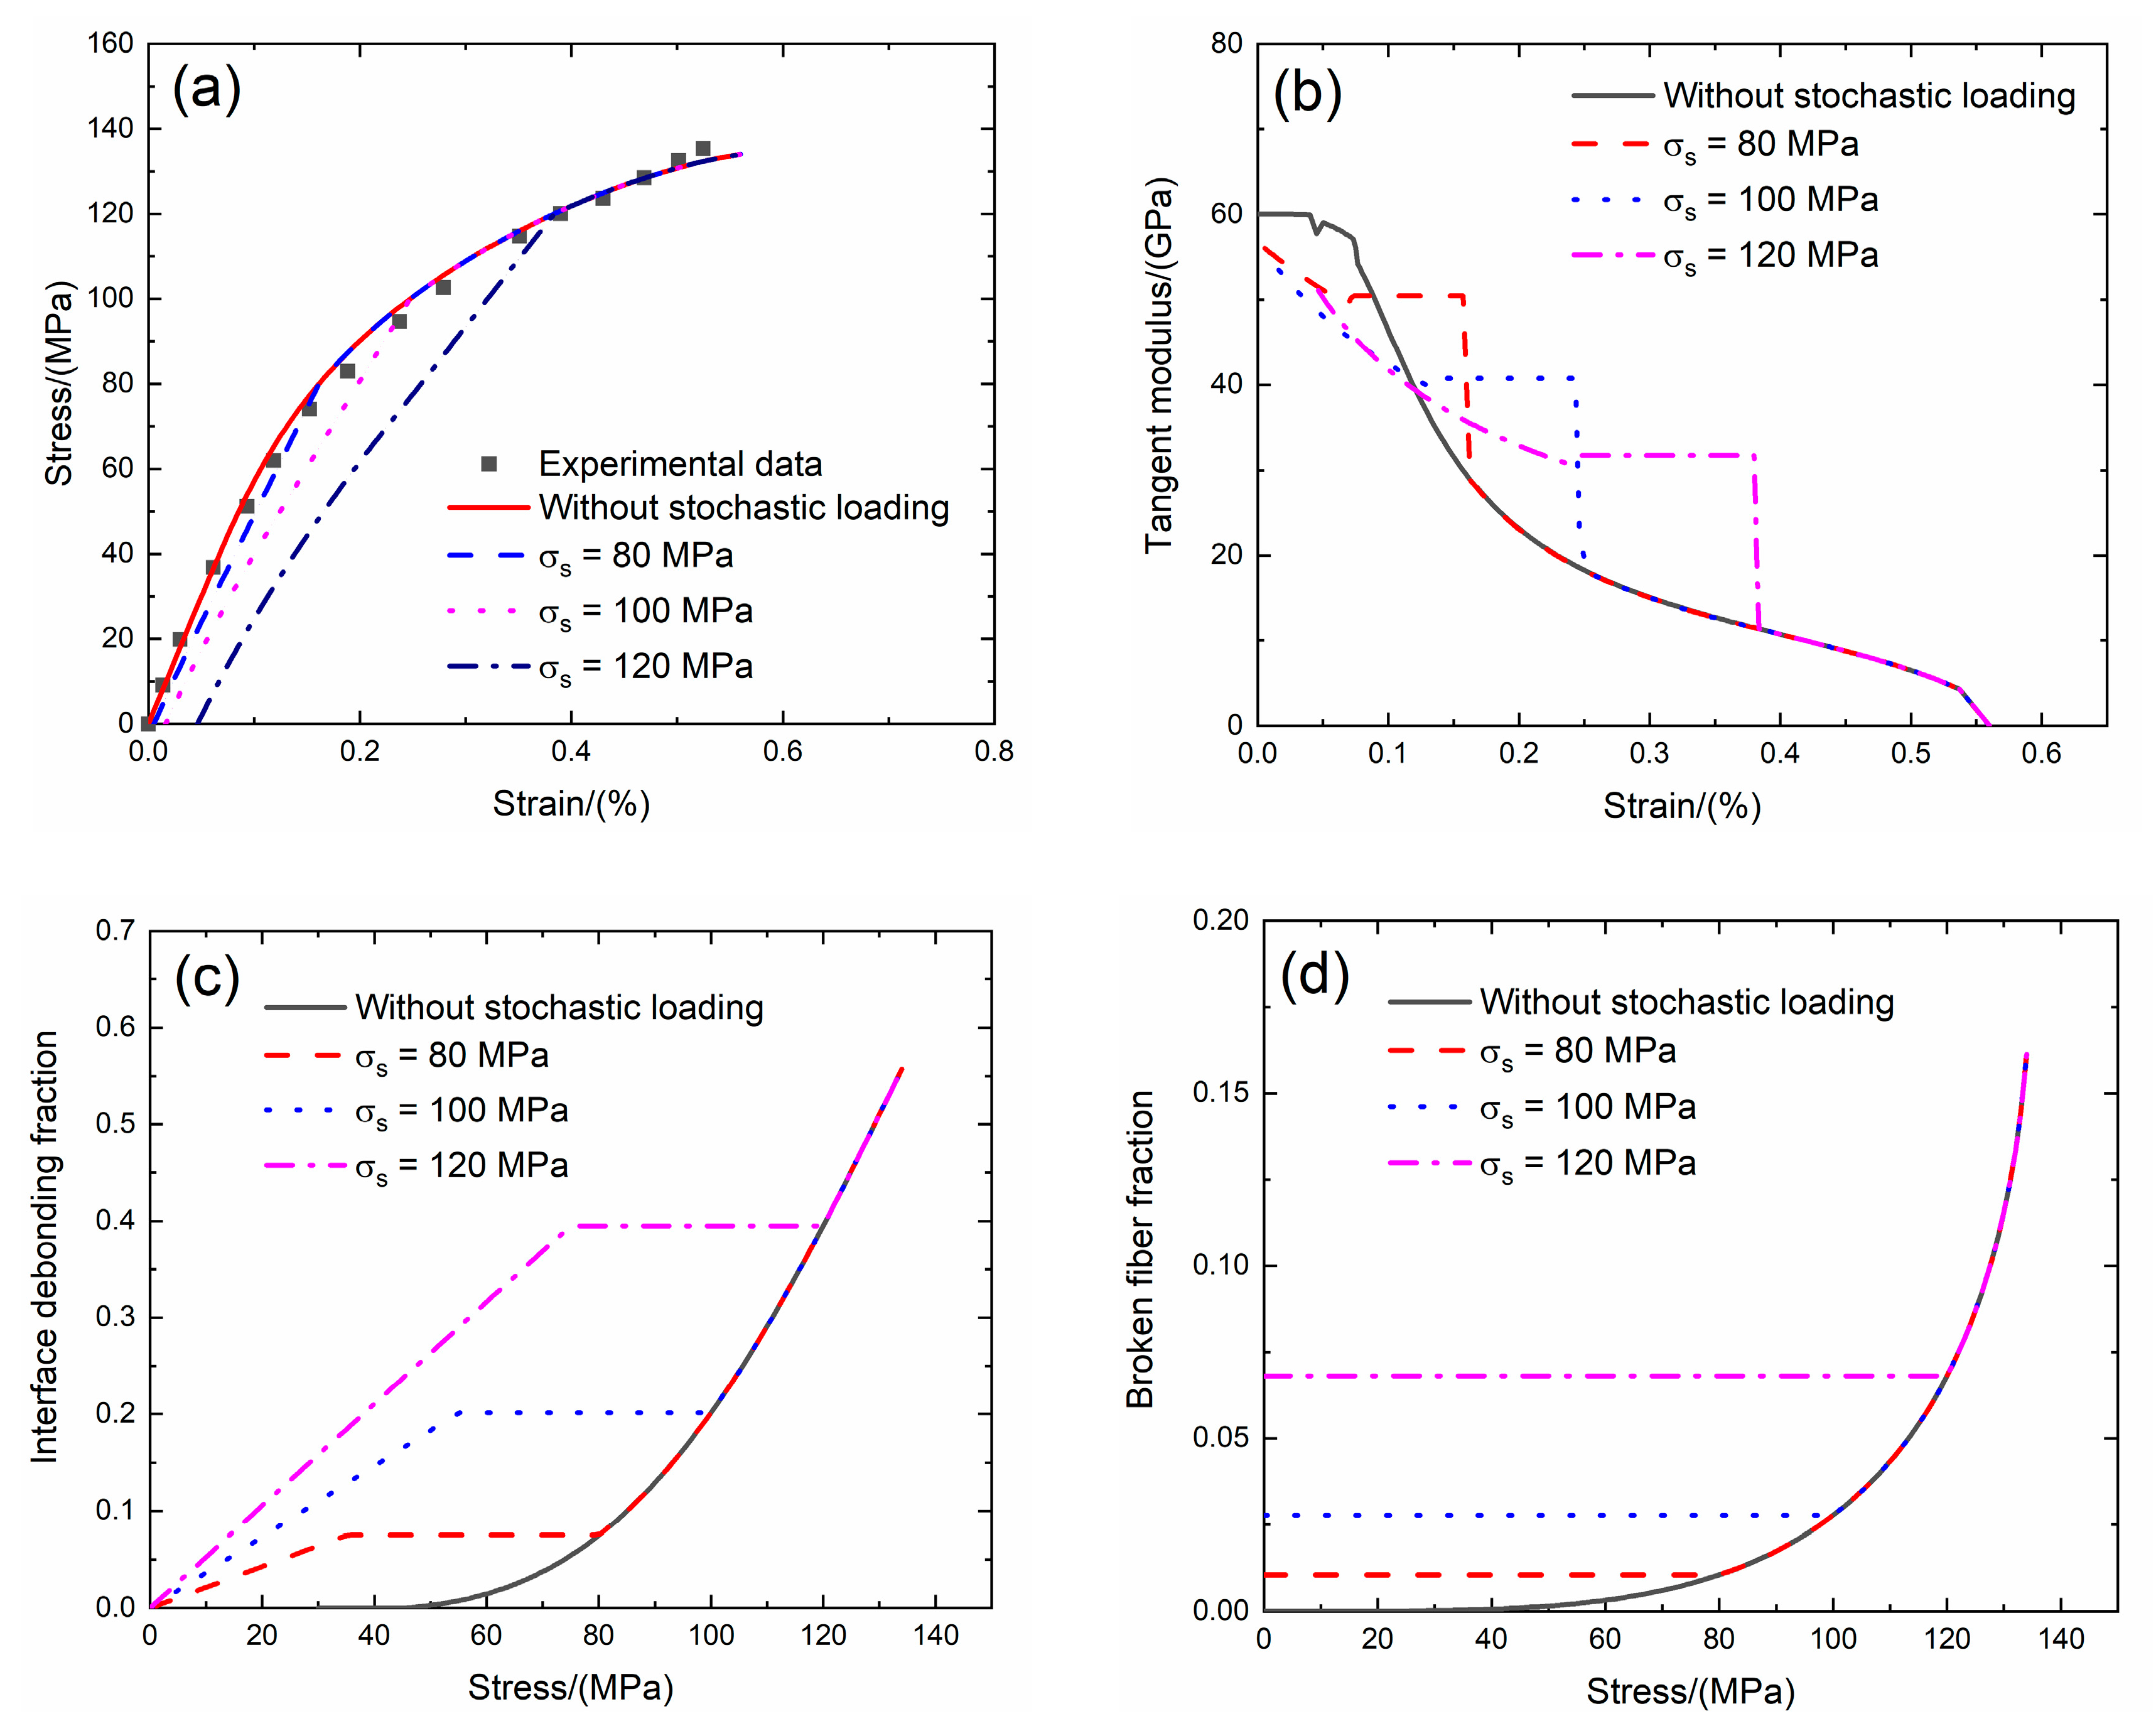
Guo and Kagawa [6] investigated the tensile behavior of 2D plain-woven fabric SiC/SiC composite fabricated by the PIP process. The quasi-static tensile test was conducted under displacement control with the rate of 0.5 mm/min. The tensile stress–strain curves, tangent modulus versus strain curves, interface debonding fraction and broken fiber fraction versus stress curves without stochastic loading and with stochastic loading at σs = 80, 100 and 120 MPa at room temperature are shown in Figure 16 and Table 9.
Under σs = 80 MPa, the initial strain is ε0 = 0.005%; the initial tangent modulus is Ep = 56 GPa, the degradation rate of tangent modulus is 6.7% compared with original specimen and the fiber broken fraction is P = 0.01. With increasing stress to σtr = 33.6 MPa, the tangent modulus decreases to Ep = 49.4 GPa corresponding to η = 0.07. When stress increases from σtr = 33.6 MPa to σ = 80 MPa, the tangent modulus remains constant of Ep = 50.4 GPa with η = 0.074.
Under σs = 100 MPa, the initial strain is ε0 = 0.016%; the initial tangent modulus is Ep = 53.5 GPa, the degradation rate of tangent modulus is 11% compared with original specimen and the fiber broken fraction is P = 0.027. With increasing stress to σtr = 52.8 MPa, the tangent modulus decreases to Ep = 39.7 GPa corresponding to η = 0.19. When stress increases from σtr = 52.8 MPa to σ = 100 MPa, the tangent modulus remains constant of Ep = 40.7 GPa with η = 0.2.
Under σs = 120 MPa, the initial strain is ε0 = 0.046%; the initial tangent modulus is Ep = 51 GPa, the degradation rate of tangent modulus is 15% compared with original specimen and the fiber broken fraction is P = 0.068. With increasing stress to σtr = 73.2 MPa, the tangent modulus decreases to Ep = 30.8 GPa corresponding to η = 0.39. When stress increases from σtr = 73.2 MPa to σ = 120 MPa, the tangent modulus remains constant of Ep = 31.7 GPa with η = 0.395.
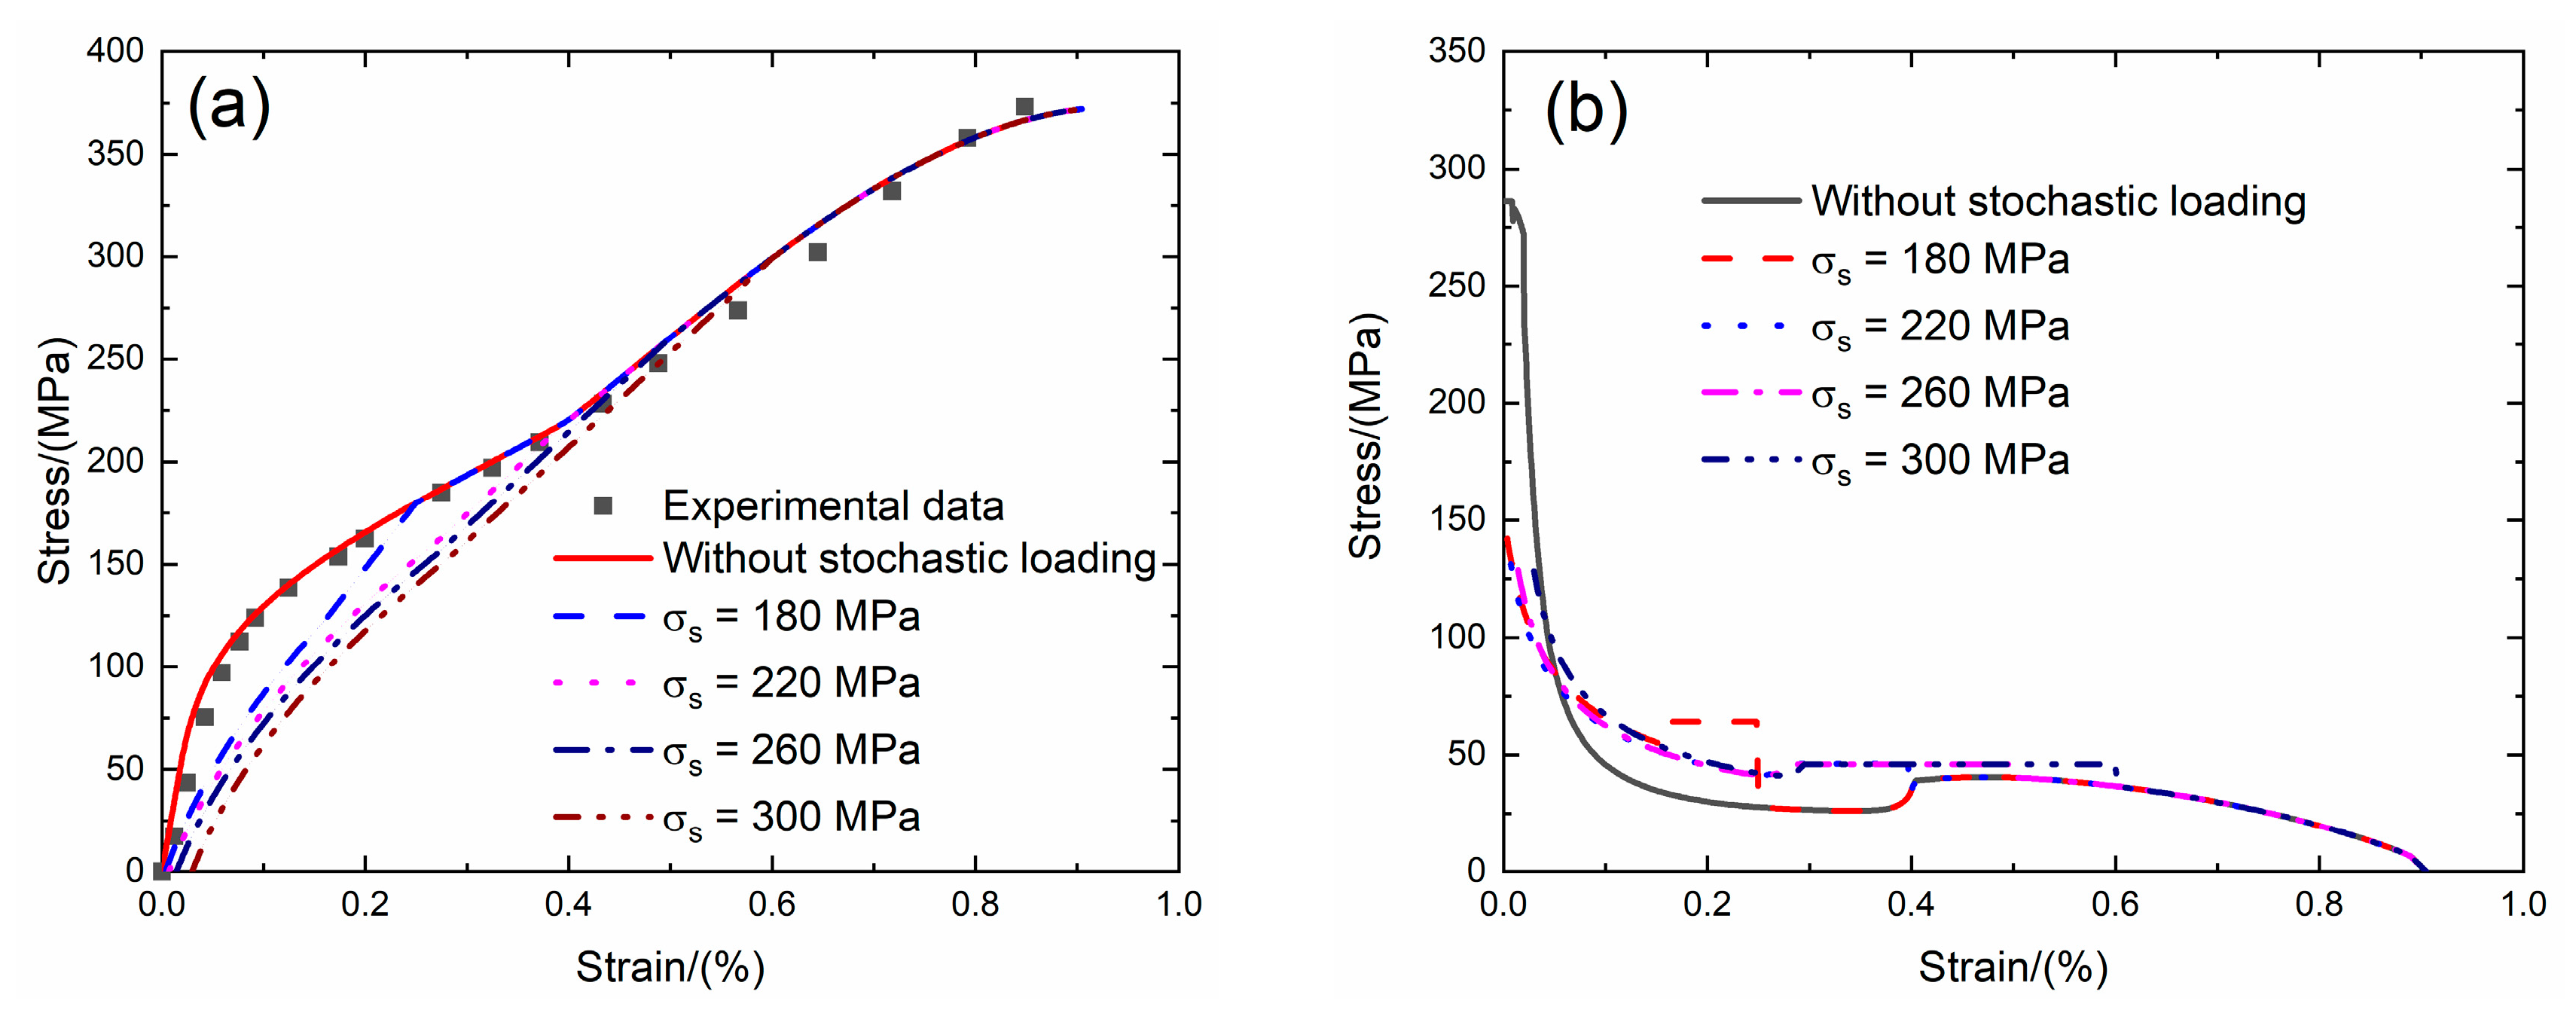
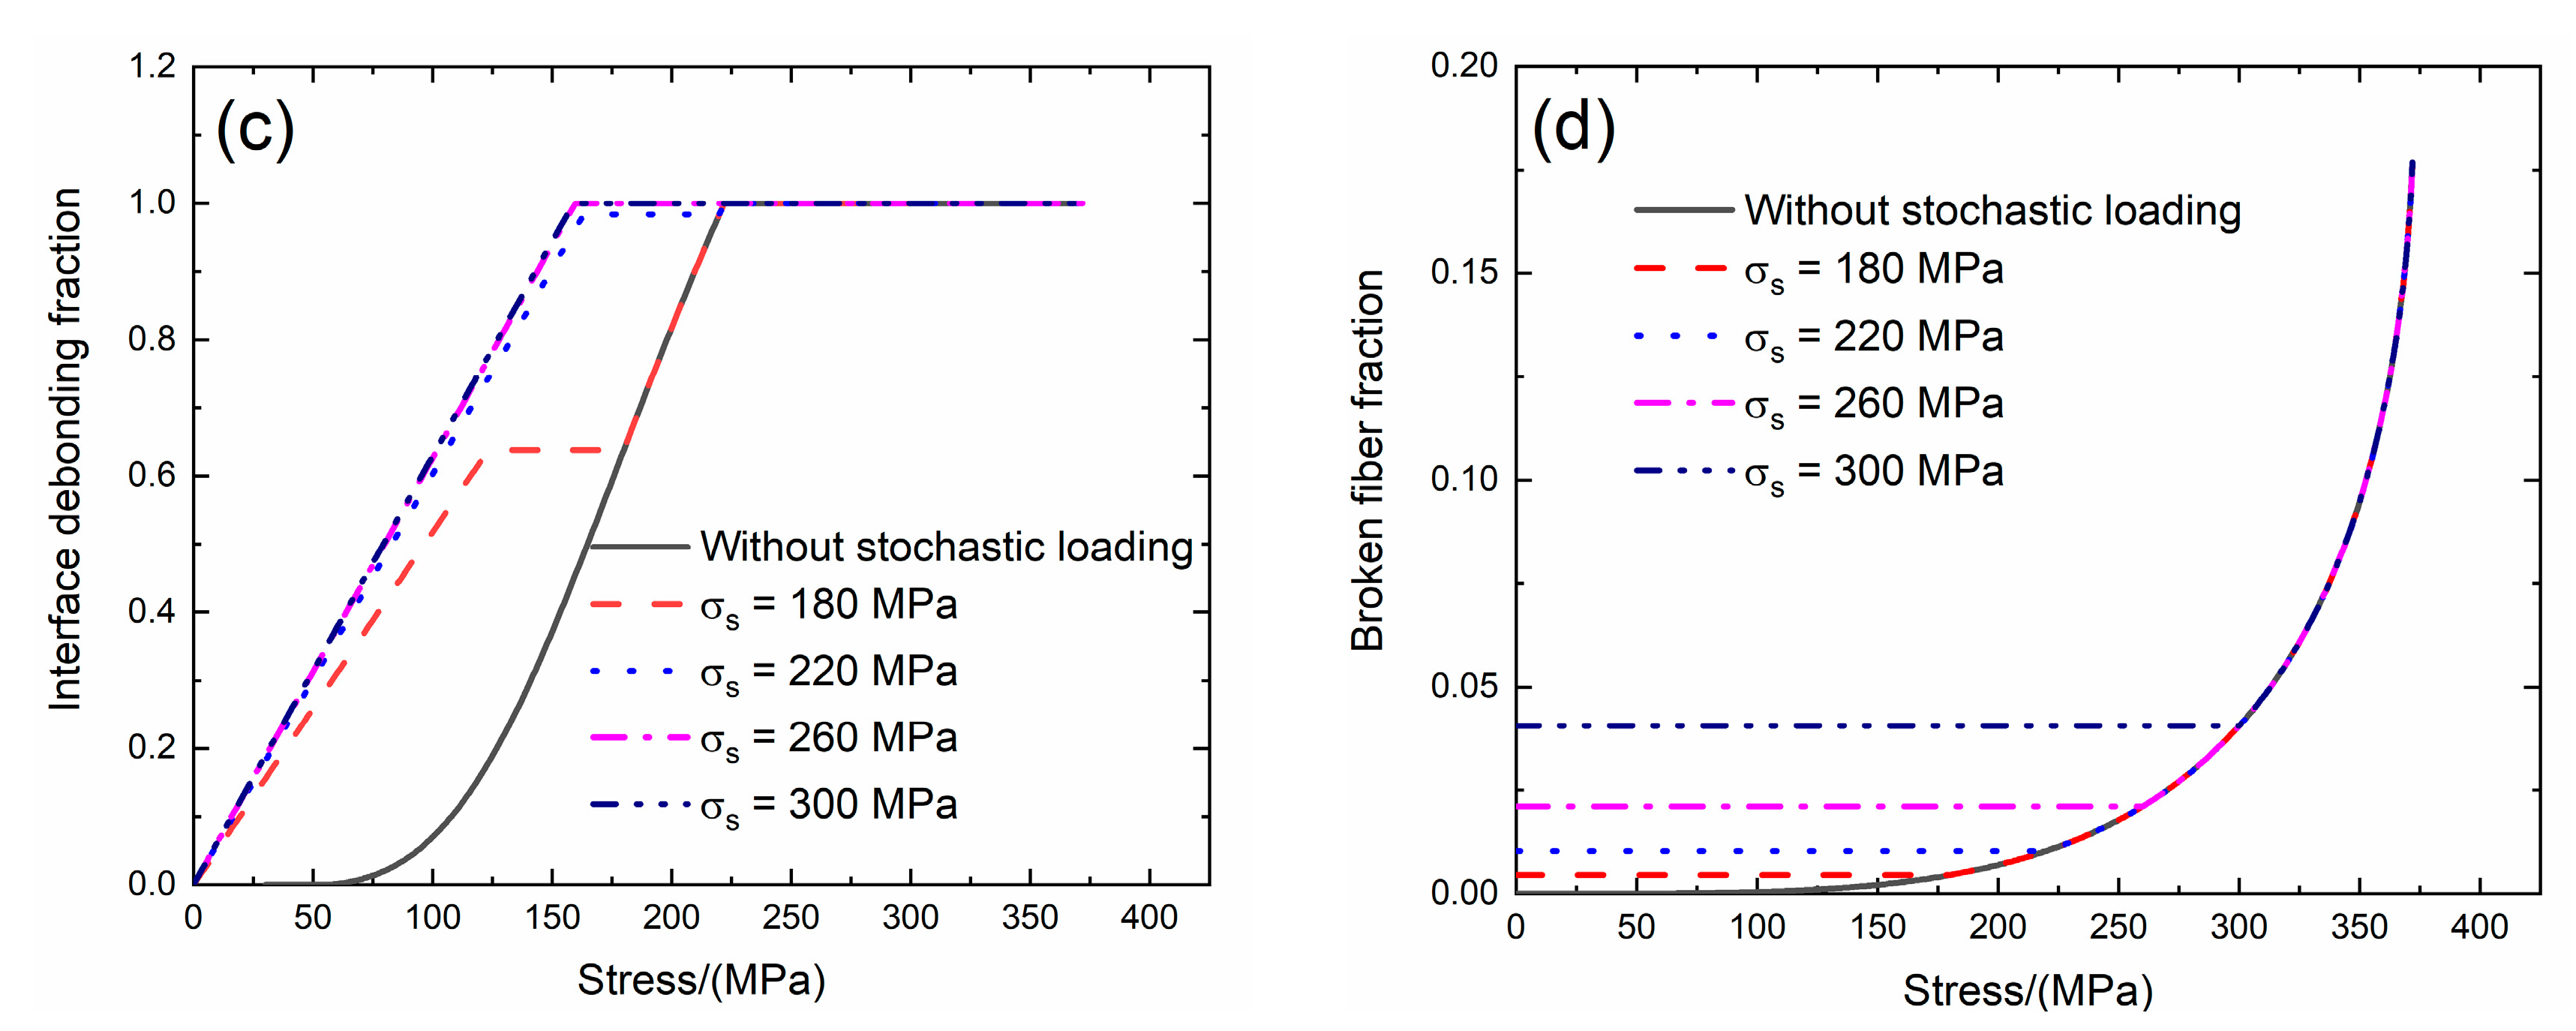
4.4. 2D SiC/SiC under Stochastic Loading of 180, 220, 260 and 300 MPa
Morscher [7] investigated the tensile behavior of 2D SiC/SiC composite at room temperature. The tensile test was conducted under load control. The tensile stress–strain curves, tangent modulus versus strain curves, interface debonding fraction and broken fiber fraction versus stress curves without stochastic loading and with stochastic loading at σs = 180, 220, 260 and 300 MPa are shown in Figure 17 and Table 10.
Under σs = 180 MPa, the initial strain is ε0 = 0.003%; the initial tangent modulus is Ep = 142.3 GPa, the degradation rate of tangent modulus is 50% compared with original specimen and the fiber broken fraction is P = 0.004. With increasing stress to σtr = 122 MPa, the tangent modulus decreases to Ep = 53.9 GPa corresponding to η = 0.63. When stress increases from σtr = 122 MPa to σ = 180 MPa, the tangent modulus remains constant of Ep = 63.9 GPa with η = 0.638.
Under σs = 220 MPa, the initial strain is ε0 = 0.007%; the initial tangent modulus is Ep = 131.4 GPa, the degradation rate of tangent modulus is 54% compared with original specimen and the fiber broken fraction is P = 0.01. With increasing stress to σtr = 162 MPa, the tangent modulus decreases to Ep = 42 GPa corresponding to η = 0.63. When stress increases from σtr = 122 MPa to σ = 180 MPa, the tangent modulus remains constant of Ep = 63.9 GPa with η = 0.97.
Under σs = 260 MPa, the initial strain is ε0 = 0.014%; the initial tangent modulus is Ep = 128.7 GPa, the degradation rate of tangent modulus is 55% compared with original specimen and the fiber broken fraction is P = 0.021. With increasing stress to σtr = 150 MPa, the tangent modulus decreases to Ep = 41.3 GPa corresponding to η = 0.93. When stress increases from σtr = 150 MPa to σ = 260 MPa, the tangent modulus remains constant of Ep = 46 GPa with η = 1.0.
Under σs = 300 MPa, the initial strain is ε0 = 0.029%; the initial tangent modulus is Ep = 128.3 GPa, the degradation rate of tangent modulus is 55.1% compared with original specimen and the fiber broken fraction is P = 0.04. With increasing stress to σtr = 148 MPa, the tangent modulus decreases to Ep = 41.3 GPa corresponding to η = 0.93. When stress increases from σtr = 148 MPa to σ = 300 MPa, the tangent modulus remains constant of Ep = 46 GPa with η = 1.0.
5. Conclusions
In this paper, the effect of stochastic loading on tensile damage and fracture of fiber-reinforced CMCs is investigated. A micromechanical constitutive model is developed considering multiple damage mechanisms under tensile loading. The relationship between stochastic stress, tangent modulus, interface debonding and fiber broken is established. The effects of fiber volume, interface shear stress, interface debonding energy, saturation matrix crack spacing and fiber strength on tensile stress–strain curve, tangent modulus, interface debonding fraction and fiber broken fraction are analyzed. The experimental tensile damage and fracture of unidirectional and 2D SiC/SiC composites subjected to different stochastic loading stress are predicted.
- (1)
- When fiber volume increases, the initial composite strain decreases, the initial tangent modulus increases, the transition stress for interface debonding decreases and the initial fiber broken fraction decreases;
- (2)
- When the interface shear stress increases, the initial composite strain remains the same, the initial tangent modulus increases, the transition stress for interface debonding remains the same and the initial fiber broken fraction remains the same;
- (3)
- When the interface debonding energy increases, the initial composite strain, tangent modulus and broken fiber fraction remain the same and the transition stress for interface debonding decreases;
- (4)
- When saturation matrix crack spacing increases, the initial composite strain decreases, the initial tangent modulus increases and the transition stress for interface debonding and initial fiber broken fraction remain the same;
- (5)
- When the fiber strength increases, the initial composite strain and fiber broken fraction decrease and the initial tangent composite modulus and transition stress for interface debonding remains the same.
Funding
This research was funded by the Fundamental Research Funds for the Central Universities grant number [NS2019038].
Acknowledgments
The author also wishes to thank three anonymous reviewers and editors for their helpful comments on an earlier version of the paper.
Conflicts of Interest
The authors declare no conflict of interest.
References
- Naslain, R. Design, Preparation and properties of non-oxide CMCs for application in engines and nuclear reactors: An overview. Compos. Sci. Technol. 2004, 64, 155–170. [Google Scholar] [CrossRef]
- Li, L.B.; Reynaud, P.; Fantozzi, G. Cyclic-dependent damage evolution in self-healing woven SiC/[Si-B-C] ceramic-matrix composites at elevated temperatures. Materials 2020, 13, 1478. [Google Scholar] [CrossRef] [PubMed] [Green Version]
- Ruggles-Wrenn, M.B.; Christensen, D.T.; Chamberlain, A.L.; Lane, J.E.; Cook, T.S. Effect of frequency and environment on fatigue behavior of a CVI SiC/SiC ceramic matrix composite at 1200 °C. Compos. Sci. Technol. 2011, 71, 190–196. [Google Scholar] [CrossRef]
- Li, P.; Wang, B.; Zhen, W.; Jiao, G. Tensile loading/unloading stress–strain behavior of 2D-SiC/SiC composites. Fuhe Cailiao Xuebao/acta Materiae Compositae Sinica 2014, 31, 676–682. [Google Scholar]
- Liu, Y. Study on damage failure mechanism of SiC/SiC ceramic matrix composites. Master Thesis, Harbin Institute of Technology, Harbin, China, 2019. [Google Scholar]
- Guo, S.; Kagawa, Y. Tensile fracture behavior of continuous SiC fiber-reinforced SiC matrix composites at elevated temperatures and correlation to in situ constituent properties. J. Euro Ceram. Soc. 2002, 22, 2349–2356. [Google Scholar] [CrossRef]
- Morscher, G.N. Modal acoustic emission of damage accumulation in a woven SiC/SiC composite. Compos. Sci Technol. 1999, 59, 687–697. [Google Scholar] [CrossRef]
- Marsili, R.; Rossi, G.; Speranzini, E. Fibre bragg gratings for the monitoring of wooden structures. Materials 2018, 11, 7. [Google Scholar] [CrossRef] [Green Version]
- Morscher, G.N.; Pujar, V.V. Design guidance for in-plane mechanical properties of SiC fiber-reinforced melt-infiltrated SiC composites. Int J. Appl Ceram. Technol 2009, 6, 151–163. [Google Scholar] [CrossRef] [Green Version]
- Marshall, D.B.; Cox, B.N.; Evans, A.G. The mechanics of matrix cracking in brittle-matrix fiber composites. Acta Metall. 1985, 33, 2013–2021. [Google Scholar] [CrossRef]
- Zok, F.W.; Spearing, S.M. Matrix crack spacing in brittle matrix composites. Acta Metall. Mater. 1992, 40, 2033–2043. [Google Scholar] [CrossRef]
- Curtin, W.A. Multiple matrix cracking in brittle matrix composites. Acta Metall. Mater. 1993, 41, 1369–1377. [Google Scholar] [CrossRef]
- Evans, A.G. Design and life prediction issues for high-temperature engineering ceramics and their composites. Acta Mater. 1997, 45, 23–40. [Google Scholar] [CrossRef]
- McNulty, J.C.; Zok, F.W. Low-cycle fatigue of Nicalon-fiber-reinforced ceramic composites. Compos. Sci. Technol. 1999, 59, 1597–1607. [Google Scholar] [CrossRef]
- Naslain, R.; Lamon, J.; Pailler, R.; Bourrat, X.; Guette, A.; Langlais, F. Micro/minicomposites: A useful approach to the design and development of non-oxide CMCs. Compos. Part A 1999, 30, 537–547. [Google Scholar] [CrossRef]
- Goto, K.; Kagawa, Y. Fracture behavior and toughness of a plain-woven SiC fiber-reinforced SiC matrix composite. Mater. Sci. Eng A. 1996, 211, 72–81. [Google Scholar] [CrossRef]
- Meyer, P.; Wass, A.M. Experimental results on the elevated temperature tensile response of SiC/SiC ceramic matrix notched composites. Compos. Part B 2018, 143, 269–281. [Google Scholar] [CrossRef]
- Li, L.B.; Song, Y.; Sun, Y. Modeling the tensile behavior of unidirectional C/SiC ceramic-matrix composites. Mech Compos. Mater. 2013, 49, 659–672. [Google Scholar] [CrossRef]
- Li, L.B.; Song, Y.; Sun, Y. Modeling the tensile behavior of cross-ply C/SiC ceramic-matrix composites. Mech Compos. Mater. 2015, 51, 359–376. [Google Scholar] [CrossRef]
- Li, L.B. Modeling the monotonic and cyclic tensile stress–strain behavior of 2D and 2.5D woven C/SiC ceramic-matrix composites. Mech Compos. Mater. 2018, 54, 165–178. [Google Scholar] [CrossRef]
- Curtin, W.A. Theory of mechanical properties of ceramic-matrix composites. J. Am. Ceram. Soc. 1991, 74, 2837–2845. [Google Scholar] [CrossRef]
- Li, L.B. Assessment of the interfacial properties from fatigue hysteresis loss energy in ceramic-matrix composites with different fiber preforms at room and elevated temperatures. Mater. Sci. Eng. A 2014, 613, 17–36. [Google Scholar]
- Domergue, J.C.; Vagaggini, E.; Evans, A.G. Relationships between hysteresis measurements and the constituent properties of ceramic matrix composites: II, Experimental studies on unidirectional materials. J. Am. Ceram. Soc. 1995, 78, 2721–2731. [Google Scholar] [CrossRef]
- Li, L.B. Modeling matrix fracture in fiber-reinforced ceramic-matrix composites with different fiber preforms. Text. Res. J. 2020, 90, 909–924. [Google Scholar] [CrossRef]
- Guo, S.Q.; Kagawa, Y.; Tanaka, Y.; Masuda, C. Microstructure and role of outermost coating for tensile strength of SiC fiber. Acta Mater. 1998, 46, 4941–4954. [Google Scholar] [CrossRef]
Figure 1.
The diagram of stochastic loading under tensile loading.

Figure 2.
The unit cell of damaged composite.

Figure 3.
(a) The tensile stress–strain curves; (b) the tangent modulus versus strain curves; (c) the interface debonding fraction versus stress curves; and (d) the broken fibers fraction versus stress curves of SiC/SiC composite for conditions without stochastic loading and with stochastic loading of σs = 200, 300 and 350 MPa when Vf = 0.3.

Figure 4.
(a) The tensile stress–strain curves; (b) the tangent modulus versus strain curves; (c) the interface debonding fraction versus stress curves; and (d) the broken fibers fraction versus stress curves of SiC/SiC composite for conditions without stochastic loading and with stochastic loading of σs = 200, 300 and 350 MPa when Vf = 0.35.

Figure 5.
(a) The tensile stress–strain curves; (b) the tangent modulus versus strain curves; (c) the interface debonding fraction versus stress curves; and (d) the broken fibers fraction versus stress curves of SiC/SiC composite for conditions without stochastic loading and with stochastic loading of σs = 200, 230 and 250 MPa when τi = 15 MPa.

Figure 6.
(a) The tensile stress–strain curves; (b) the tangent modulus versus strain curves; (c) the interface debonding fraction versus stress curves; and (d) the broken fibers fraction versus stress curves of SiC/SiC composite for conditions without stochastic loading and with stochastic loading of σs = 200, 230 and 250 MPa when τi = 20 MPa.


Figure 7.
(a) The tensile stress–strain curves; (b) the tangent modulus versus strain curves; (c) the interface debonding fraction versus stress curves; and (d) the broken fibers fraction versus stress curves of SiC/SiC composite for conditions without stochastic loading and with stochastic loading of σs = 180, 220 and 250 MPa when ζd = 0.1 J/m2.

Figure 8.
(a) The tensile stress–strain curves; (b) the tangent modulus versus strain curves; (c) the interface debonding fraction versus stress curves; and (d) the broken fibers fraction versus stress curves of SiC/SiC composite for conditions without stochastic loading and with stochastic loading of σs = 180, 220 and 250 MPa when ζd = 0.3 J/m2.


Figure 9.
(a) The tensile stress–strain curves; (b) the tangent modulus versus strain curves; (c) the interface debonding fraction versus stress curves; and (d) the broken fibers fraction versus stress curves of SiC/SiC composite for conditions without stochastic loading and with stochastic loading of σs = 180, 220 and 250 MPa when ls = 200 μm.


Figure 10.
(a) The tensile stress–strain curves; (b) the tangent modulus versus strain curves; (c) the interface debonding fraction versus stress curves; and (d) the broken fibers fraction versus stress curves of SiC/SiC composite for conditions without stochastic loading and with stochastic loading of σs = 180, 220 and 250 MPa when ls = 250 μm.

Figure 11.
(a) The tensile stress–strain curves; (b) the tangent modulus versus strain curves; (c) the interface debonding fraction versus stress curves; and (d) the broken fibers fraction versus stress curves of SiC/SiC composite for conditions without stochastic loading and with stochastic loading of σs = 180, 220 and 250 MPa when σc = 2.0 GPa.

Figure 12.
(a) The tensile stress–strain curves; (b) the tangent modulus versus strain curves; (c) the interface debonding fraction versus stress curves; and (d) the broken fibers fraction versus stress curves of SiC/SiC composite for conditions without stochastic loading and with stochastic loading of σs = 180, 220 and 250 MPa when σc = 2.5 GPa.

Figure 13.
(a) The tensile stress–strain curves; (b) the tangent modulus versus strain curves; (c) the interface debonding fraction versus stress curves; and (d) the broken fibers fraction versus stress curves of 2D SiC/SiC composite for conditions without stochastic loading and with stochastic loading of σs = 140, 180, 200 and 240 MPa.

Figure 14.
(a) The tensile stress–strain curves; (b) the tangent modulus versus strain curves; (c) the interface debonding fraction versus stress curves; and (d) the broken fibers fraction versus stress curves of UD SiC/SiC composite for conditions without stochastic loading and with stochastic loading of σs = 140, 180, 200 and 220 MPa.


Figure 15.
(a) The tensile stress–strain curves; (b) the tangent modulus versus strain curves; (c) the interface debonding fraction versus stress curves; and (d) the broken fibers fraction versus stress curves of 2D SiC/SiC composite for conditions without stochastic loading and with stochastic loading of σs = 80, 100 and 120 MPa.

Figure 16.
(a) The tensile stress–strain curves; (b) the tangent modulus versus strain curves; (c) the interface debonding fraction versus stress curves; and (d) the broken fibers fraction versus stress curves of 2D SiC/SiC composite for conditions without stochastic loading and with stochastic loading of σs = 80, 100 and 120 MPa.

Figure 17.
(a) The tensile stress–strain curves; (b) the tangent modulus versus strain curves; (c) the interface debonding fraction versus stress curves; and (d) the broken fibers fraction versus stress curves of 2D SiC/SiC composite for conditions without stochastic loading and with stochastic loading of σs = 180, 220, 260 and 300 MPa.


Table 1.
The effect of the fiber volume (Vf = 0.3 and 0.35) on tensile stress–strain curve, tangent modulus, interface debonding fraction and broken fiber fraction of SiC/SiC composite subjected to stochastic loading of σs = 200, 300 and 350 MPa.
Table 1.
The effect of the fiber volume (Vf = 0.3 and 0.35) on tensile stress–strain curve, tangent modulus, interface debonding fraction and broken fiber fraction of SiC/SiC composite subjected to stochastic loading of σs = 200, 300 and 350 MPa.
| Vf = 0.3 | σs = 200 MPa | |||
| ε0/(%) | Ep/(GPa) | σtr/(MPa) | P/(%) | |
| 0.00161 | 268 | 79.2 | 0.005 | |
| σs = 300 MPa | ||||
| ε0/(%) | Ep/(GPa) | σtr/(MPa) | P/(%) | |
| 0.0098 | 229 | 178.2 | 0.028 | |
| σs = 350 MPa | ||||
| ε0/(%) | Ep/(GPa) | σtr/(MPa) | P/(%) | |
| 0.023 | 228 | 231 | 0.060 | |
| Vf = 0.35 | σs = 200 MPa | |||
| ε0/(%) | Ep/(GPa) | σtr/(MPa) | P/(%) | |
| 0.0009 | 281 | 55 | 0.0027 | |
| σs = 300 MPa | ||||
| ε0/(%) | Ep/(GPa) | σtr/(MPa) | P/(%) | |
| 0.0047 | 249 | 156.2 | 0.014 | |
| σs = 350 MPa | ||||
| ε0/(%) | Ep/(GPa) | σtr/(MPa) | P/(%) | |
| 0.0095 | 248 | 206.8 | 0.028 | |
Table 2.
The effect of interface shear stress (τi = 15 and 20 MPa) on tensile stress–strain curve, tangent modulus, interface debonding fraction and broken fiber fraction of SiC/SiC composite subjected to stochastic loading of σs = 200, 230 and 250 MPa.
Table 2.
The effect of interface shear stress (τi = 15 and 20 MPa) on tensile stress–strain curve, tangent modulus, interface debonding fraction and broken fiber fraction of SiC/SiC composite subjected to stochastic loading of σs = 200, 230 and 250 MPa.
| τi = 15 MPa | σs = 200 MPa | |||
| ε0/(%) | Ep/(GPa) | σtr/(MPa) | P/(%) | |
| 0.00943 | 195.6 | 125.4 | 0.028 | |
| σs = 230 MPa | ||||
| ε0/(%) | Ep/(GPa) | σtr/(MPa) | P/(%) | |
| 0.021 | 163 | 154 | 0.056 | |
| σs = 250 MPa | ||||
| ε0/(%) | Ep/(GPa) | σtr/(MPa) | P/(%) | |
| 0.038 | 149.5 | 173.8 | 0.092 | |
| τi = 20 MPa | σs = 200 MPa | |||
| ε0/(%) | Ep/(GPa) | σtr/(MPa) | P/(%) | |
| 0.00943 | 215 | 125.4 | 0.028 | |
| σs = 230 MPa | ||||
| ε0/(%) | Ep/(GPa) | σtr/(MPa) | P/(%) | |
| 0.021 | 185 | 154 | 0.056 | |
| σs = 250 MPa | ||||
| ε0/(%) | Ep/(GPa) | σtr/(MPa) | P/(%) | |
| 0.038 | 171.7 | 173.8 | 0.092 | |
Table 3.
The effect of interface debonding energy (ζd = 0.1 and 0.3 J/m2) on tensile stress–strain curve, tangent modulus, interface debonding fraction and broken fiber fraction of SiC/SiC composite subjected to stochastic loading of σs = 180, 220 and 250 MPa.
Table 3.
The effect of interface debonding energy (ζd = 0.1 and 0.3 J/m2) on tensile stress–strain curve, tangent modulus, interface debonding fraction and broken fiber fraction of SiC/SiC composite subjected to stochastic loading of σs = 180, 220 and 250 MPa.
| ζd = 0.1 J/m2 | σs = 180 MPa | |||
| ε0/(%) | Ep/(GPa) | σtr/(MPa) | P/(%) | |
| 0.00537 | 251.5 | 140.8 | 0.018 | |
| σs = 220 MPa | ||||
| ε0/(%) | Ep/(GPa) | σtr/(MPa) | P/(%) | |
| 0.0161 | 209 | 182.6 | 0.045 | |
| σs = 250 MPa | ||||
| ε0/(%) | Ep/(GPa) | σtr/(MPa) | P/(%) | |
| 0.038 | 188.5 | 211.2 | 0.092 | |
| ζd = 0.3 J/m2 | σs = 180 MPa | |||
| ε0/(%) | Ep/(GPa) | σtr/(MPa) | P/(%) | |
| 0.00537 | 251.5 | 118.8 | 0.018 | |
| σs = 220 MPa | ||||
| ε0/(%) | Ep/(GPa) | σtr/(MPa) | P/(%) | |
| 0.0161 | 209 | 158.4 | 0.045 | |
| σs = 250 MPa | ||||
| ε0/(%) | Ep/(GPa) | σtr/(MPa) | P/(%) | |
| 0.038 | 188.5 | 189.2 | 0.092 | |
Table 4.
The effect of the saturation matrix crack spacing (ls = 200 and 250 μm) on tensile stress–strain curve, tangent modulus, interface debonding fraction and broken fiber fraction of SiC/SiC composite subjected to stochastic loading of σs = 180, 220 and 250 MPa.
Table 4.
The effect of the saturation matrix crack spacing (ls = 200 and 250 μm) on tensile stress–strain curve, tangent modulus, interface debonding fraction and broken fiber fraction of SiC/SiC composite subjected to stochastic loading of σs = 180, 220 and 250 MPa.
| ls = 200 μm | σs = 180 MPa | |||
| ε0/(%) | Ep/(GPa) | σtr/(MPa) | P/(%) | |
| 0.00567 | 229.8 | 103.4 | 0.018 | |
| σs = 220 MPa | ||||
| ε0/(%) | Ep/(GPa) | σtr/(MPa) | P/(%) | |
| 0.0168 | 180.3 | 143 | 0.045 | |
| σs = 250 MPa | ||||
| ε0/(%) | Ep/(GPa) | σtr/(MPa) | P/(%) | |
| 0.038 | 157.7 | 173.8 | 0.092 | |
| ls = 250 μm | σs = 180 MPa | |||
| ε0/(%) | Ep/(GPa) | σtr/(MPa) | P/(%) | |
| 0.00549 | 242.3 | 103.4 | 0.018 | |
| σs = 220 MPa | ||||
| ε0/(%) | Ep/(GPa) | σtr/(MPa) | P/(%) | |
| 0.0164 | 196.8 | 143 | 0.045 | |
| σs = 250 MPa | ||||
| ε0/(%) | Ep/(GPa) | σtr/(MPa) | P/(%) | |
| 0.038 | 174.8 | 173.8 | 0.092 | |
Table 5.
The effect of the fiber strength (σc = 2.0 and 2.5 GPa) on tensile stress–strain curve, tangent modulus, interface debonding fraction and broken fiber fraction of SiC/SiC composite subjected to stochastic loading of σs = 180, 220 and 250 MPa.
Table 5.
The effect of the fiber strength (σc = 2.0 and 2.5 GPa) on tensile stress–strain curve, tangent modulus, interface debonding fraction and broken fiber fraction of SiC/SiC composite subjected to stochastic loading of σs = 180, 220 and 250 MPa.
| σc = 2.0 GPa | σs = 180 MPa | |||
| ε0/(%) | Ep/(GPa) | σtr/(MPa) | P/(%) | |
| 0.0065 | 251.5 | 103.4 | 0.022 | |
| σs = 220 MPa | ||||
| ε0/(%) | Ep/(GPa) | σtr/(MPa) | P/(%) | |
| 0.02 | 209.6 | 143 | 0.058 | |
| σs = 250 MPa | ||||
| ε0/(%) | Ep/(GPa) | σtr/(MPa) | P/(%) | |
| 0.059 | 188.5 | 173.8 | 0.138 | |
| σc = 2.5 GPa | σs = 180 MPa | |||
| ε0/(%) | Ep/(GPa) | σtr/(MPa) | P/(%) | |
| 0.028 | 251.5 | 103.4 | 0.0087 | |
| σs = 220 MPa | ||||
| ε0/(%) | Ep/(GPa) | σtr/(MPa) | P/(%) | |
| 0.007 | 209.6 | 143 | 0.02 | |
| σs = 250 MPa | ||||
| ε0/(%) | Ep/(GPa) | σtr/(MPa) | P/(%) | |
| 0.015 | 188.5 | 173.8 | 0.036 | |
Table 6.
The tensile stress–strain curve, tangent modulus, interface debonding fraction and broken fiber fraction of 2D SiC/SiC composite subjected to stochastic loading of σs = 140, 180, 200 and 240 MPa.
Table 6.
The tensile stress–strain curve, tangent modulus, interface debonding fraction and broken fiber fraction of 2D SiC/SiC composite subjected to stochastic loading of σs = 140, 180, 200 and 240 MPa.
| σs = 140 MPa. | |||
| ε0/(%) | Ep/(GPa) | σtr/(MPa) | P |
| 0.001 | 288 | 63.8 | 0.006 |
| σs = 180 MPa | |||
| ε0/(%) | Ep/(GPa) | σtr/(MPa) | P |
| 0.005 | 251 | 103.4 | 0.018 |
| σs = 180 MPa | |||
| ε0/(%) | Ep/(GPa) | σtr/(MPa) | P |
| 0.009 | 229.5 | 123.2 | 0.028 |
| σs = 180 MPa | |||
| ε0/(%) | Ep/(GPa) | σtr/(MPa) | P |
| 0.028 | 194.2 | 162.8 | 0.078 |
Table 7.
The tensile stress–strain curve, tangent modulus, interface debonding fraction and broken fiber fraction of unidirectional SiC/SiC composite subjected to stochastic loading of σs = 140, 180, 200 and 220 MPa.
Table 7.
The tensile stress–strain curve, tangent modulus, interface debonding fraction and broken fiber fraction of unidirectional SiC/SiC composite subjected to stochastic loading of σs = 140, 180, 200 and 220 MPa.
| σs = 140 MPa | |||
| ε0/(%) | Ep/(GPa) | σtr/(MPa) | P |
| 0.002 | 235.9 | 58.8 | 0.01 |
| σs = 180 MPa | |||
| ε0/(%) | Ep/(GPa) | σtr/(MPa) | P |
| 0.009 | 234 | 98.4 | 0.03 |
| σs = 200 MPa | |||
| ε0/(%) | Ep/(GPa) | σtr/(MPa) | P |
| 0.017 | 229.6 | 118.8 | 0.048 |
| σs = 220 MPa | |||
| ε0/(%) | Ep/(GPa) | σtr/(MPa) | P |
| 0.033 | 220.1 | 139 | 0.082 |
Table 8.
The tensile stress–strain curve, tangent modulus, interface debonding fraction and broken fiber fraction of 2D SiC/SiC composite subjected to stochastic loading of σs = 80, 100 and 120 MPa.
Table 8.
The tensile stress–strain curve, tangent modulus, interface debonding fraction and broken fiber fraction of 2D SiC/SiC composite subjected to stochastic loading of σs = 80, 100 and 120 MPa.
| σs = 80 MPa | |||
| ε0/(%) | Ep/(GPa) | σtr/(MPa) | P |
| 0.002 | 138.3 | 13.2 | 0.01 |
| σs = 100 MPa | |||
| ε0/(%) | Ep/(GPa) | σtr/(MPa) | P |
| 0.008 | 135.6 | 32.4 | 0.027 |
| σs = 120 MPa | |||
| ε0/(%) | Ep/(GPa) | σtr/(MPa) | P |
| 0.025 | 131.9 | 52.8 | 0.068 |
Table 9.
The tensile stress–strain curve, tangent modulus, interface debonding fraction and broken fiber fraction of 2D SiC/SiC composite subjected to stochastic loading of σs = 80, 100 and 120 MPa.
Table 9.
The tensile stress–strain curve, tangent modulus, interface debonding fraction and broken fiber fraction of 2D SiC/SiC composite subjected to stochastic loading of σs = 80, 100 and 120 MPa.
| σs = 80 MPa | |||
| ε0/(%) | Ep/(GPa) | σtr/(MPa) | P |
| 0.005 | 56 | 33.6 | 0.01 |
| σs = 100 MPa | |||
| ε0/(%) | Ep/(GPa) | σtr/(MPa) | P |
| 0.016 | 53.5 | 52.8 | 0.027 |
| σs = 120 MPa | |||
| ε0/(%) | Ep/(GPa) | σtr/(MPa) | P |
| 0.046 | 51 | 73.2 | 0.068 |
Table 10.
The tensile stress–strain curve, tangent modulus, interface debonding fraction and broken fiber fraction of 2D SiC/SiC composite subjected to stochastic loading of σs = 180, 220, 260 and 300 MPa.
Table 10.
The tensile stress–strain curve, tangent modulus, interface debonding fraction and broken fiber fraction of 2D SiC/SiC composite subjected to stochastic loading of σs = 180, 220, 260 and 300 MPa.
| σs = 180 MPa | |||
| ε0/(%) | Ep/(GPa) | σtr/(MPa) | P |
| 0.003 | 142.3 | 122 | 0.004 |
| σs = 220 MPa | |||
| ε0/(%) | Ep/(GPa) | σtr/(MPa) | P |
| 0.007 | 131.4 | 162 | 0.01 |
| σs = 260 MPa | |||
| ε0/(%) | Ep/(GPa) | σtr/(MPa) | P |
| 0.014 | 128.7 | 150 | 0.021 |
| σs = 300 MPa | |||
| ε0/(%) | Ep/(GPa) | σtr/(MPa) | P |
| 0.029 | 128.3 | 148 | 0.04 |
© 2020 by the author. Licensee MDPI, Basel, Switzerland. This article is an open access article distributed under the terms and conditions of the Creative Commons Attribution (CC BY) license (http://creativecommons.org/licenses/by/4.0/).
Share and Cite
MDPI and ACS Style
Li, L. Effect of Stochastic Loading on Tensile Damage and Fracture of Fiber-Reinforced Ceramic-Matrix Composites. Materials 2020, 13, 2469. https://doi.org/10.3390/ma13112469
AMA Style
Li L. Effect of Stochastic Loading on Tensile Damage and Fracture of Fiber-Reinforced Ceramic-Matrix Composites. Materials. 2020; 13(11):2469. https://doi.org/10.3390/ma13112469
Chicago/Turabian StyleLi, Longbiao. 2020. "Effect of Stochastic Loading on Tensile Damage and Fracture of Fiber-Reinforced Ceramic-Matrix Composites" Materials 13, no. 11: 2469. https://doi.org/10.3390/ma13112469
Note that from the first issue of 2016, this journal uses article numbers instead of page numbers. See further details here.