1. Introduction
With the development of technology, day by day, advanced and functional materials are being developed by researchers [
1]. The biomaterials are used to create artificial organs for orthopaedic applications such as knee replacements, hip replacements, and orthopaedic accessories [
2]. Total knee replacement (TKR) is a remarkable achievement in biomedical science to improve the length of human life [
3,
4,
5]. The knee joint consists of four types of cruciate ligaments [
6,
7,
8]. These cruciate ligaments act as a four-bar linkage mechanism in a parasagittal plane, and their functionality information is discussed briefly [
9,
10]. The knee mainly consists of three bone structures, namely, the femur, patella, tibia, and fibula [
11,
12,
13,
14]. TKRs mainly have three components: the femoral component, the tibial component, and the patellar component, i.e., the knee cap [
8,
15,
16]. Biomaterials chosen must have some basic requirements for a femoral component of a TKR prosthesis, and these requirements may vary from one to another. The required properties for a femoral component of TKR are discussed here [
1,
5].
The success of TKR implantation depends upon the selection of optimal biomaterial. The commonly used biomaterials are cobalt-chromium (Co-Cr), SS 316L, NiTi alloy, and titanium (Ti) and its alloys [
17,
18,
19,
20]. All these materials possess different properties, which are discussed below.
Adequate strength: In a prosthetic knee joint, material strength plays a vital role in avoiding joint fracture. Under a loading condition, a malfunction of bone-implant articulation leads to the development of soft fibrous tissue that further results in more significant relative motion. After a while, the TKR components may have to be replaced by an artificial organ in revision surgery to eliminate pain and other inconvenience [
1,
5,
17]. The weight and density of biological material for a knee implant need to be equivalent to that of bone. So, most of the time, specific strength can be utilized as the main parameter [
1,
5,
18].
Elastic modulus: Stress shielding is the major problem occurred in the joint replacements, which depends upon the biomaterial elastic modulus. Due to this reason, the bone may get weak and degenerates the articulation of the knee implant and bone, which further results in the loosening and failure of the Knee implant [
1,
17]. The biomaterials must possess the low elastic modulus near to bone (15–30 GPa) to overcome the stress-shielding [
1,
5,
18,
19,
20].
Ductility: Mechanical property can be utilized to express the extent to which material deformation is plastic in nature and devoid of any fracture known as ductility. It is essential to evade any brittle failure [
1].
Corrosion resistance: In metallic biomaterials, corrosion is an inevitable concern because of corrosive body fluid. The leading cause of revision surgery in the case of TKR is corrosion, and it also leads to the reduction of implant life. The implants generally emit unwanted metallic ions, which are not biocompatible to the human body. These unwanted metal ions may dissolve in the human body’s transporting medium, which helps them either cumulate in tissues situated near the implant or move to the human body’s other organs. This may lead to a severe ailment, such as cancer, and may reduce human life [
21]. Corrosion resistance must be considered while selecting the material for TKR.
Wear resistance: The leading cause of implant loosening is lower wear resistance or higher friction coefficients [
1,
22]. Moreover, the biological activeness of wear debris generates an unadorned inflammatory retort. All of this may cause damage to the healthy bone reinforcing the actual implant. Moreover, the friction creates corrosion, which is one of the substantial issues talked about earlier.
Biocompatibility: It is the function properties and characteristics of a substance being compatible with living tissue in specific situation is referred to as biocompatibility. When exposed to the body or bodily fluids, biocompatible materials do not create a toxic or immunological response. Cytotoxicity (cell-culture), sensitization assays, irritation tests, subchronic toxicity, genotoxicity, implantation tests, and hemocompatibility test has been most widely used to assess the biocompatibility of biomaterial through the use of cell lines in-vitro [
1,
23,
24]. Cell culture assays determine the quantitative and qualitative-MTT assay cytotoxicity of biomaterials. Sensitization test determine the effect of chemical elements contained in biomaterials allergic or hypersensitivity reactions. The irritation tests measure the risk of local discomfort as a result of chemicals derived from a biomaterial. The Acute Systemic Toxicity test looks for leachable that cause systemic (rather than local) toxicity. The Subchronic toxicity tests are used to assess the potential for long-term or multiple exposures to biomaterials to cause harmful effects. Genotoxicity tests detect compounds that can cause irreversible and heritable genetic changes directly or indirectly through a range of mechanisms, using a set of in vitro and in vivo tests. Implantation study is used to determine the biocompatibility of biomaterials that directly contact host location.
Osseointegration: It is a fundamental requirement in orthopaedic, which is related to bone healing. Osseointegration refers to the structural and functional bonding between the living bone and the load-bearing implant’s surface without intervening soft tissue [
17,
25]. The biocompatibility of the implant material, the surface topography of the implant, the surgical procedure used, and the loading of the implants are all factors that affect the osseointegration process. In the over, the stability of implant is determined in terms of osseointegration, which can be measured in two stages. Mechanical contact with cortical bone provides primary stability. Biological stability is provided by secondary stability, which is accomplished by bone regeneration and remodelling. There are many approaches for determining implant stability. Invasive/destructive methods and non-invasive/non-destructive methods may be distinguished. A number of tests has been reported to test the osteointegration around the implantation [
26,
27]. Apart from this finite element analysis is also used to determine the osteointegration, which is measured in terms of micro-motion between implant and bone, and bone density regeneration around implants surface.
Cost: This is an essential factor in selecting the appropriate material for knee replacement because the cost of the material depends on its availability, machining, and transportation. The consideration of cost along with material properties is essential because of affordability factors among customers.
Despite the high range of biomaterials, human beings are still suffering from knee-joint-related problems due to the inappropriate selection of TKR material. Initially, stainless steel has been used as a potential biomaterial for the orthopaedic applications, but low corrosion resistance restricted its use for implant application. After that, researchers acknowledge the use of cobalt-based biomaterials for orthopaedic application especially for knee joint replacements [
28]. The major drawback of Co-based alloy has high elastic modulus (220 GPa) as compared to bone (15–30 GPa), which leads to stress-shielding and results in implantation failed. After that researcher identified the commercially pure titanium-based (CP-Ti) biomaterial for orthopaedic application. But CP-Ti possessed elastic modulus (165 GPa) more than bone and high content impurity makes the alloy unsuitable for knee implantation. Most widely used Ti-based alloy was Ti-6L-4V, which is also have several drawbacks such as low hardness, poor wear resistance, and Al/V ions releases in the host body that creates allergic reaction [
29]. A number of high strength and low elastic Ti-based alloys has been developed by researchers for knee and orthopaedic application, which have own advantages and disadvantages. To overcome this problem, the optimum material selection for a knee prosthesis becomes vital [
30]. Therefore, because of these properties possessed by different biomaterials, eleven different materials were chosen according to their availability.
Various MCDM methods are utilized to select different materials for different applications. The VIKOR and TOPSIS techniques were applied to pick gate dielectric material [
31]. Different techniques of MCDM were used to select the best penstock material for hydropower plants, where four alternatives, namely, polyvinyl chloride (PVC), high-density polyethylene (HDPE), glass-reinforced polymer (GRP) and mild steel (MS), were considered, along with five attributes (yield strength, life, thickness, cost of material and maintenance cost), in the study. The result showed that TOPSIS and modified TOPSIS methods are best suited for penstock material selection, and mild steel is the best material compared to other materials [
32]. The TOPSIS method, combined with the entropy technique, was used to pick freight transportation, as research showed primary transport logistics attributes and the order preference by similarity ideal solution (TOPSIS) algorithm were the preferred MCMO model for comparatively ranking alternative freights. The entropy weight technique minimizes the subjectivity in the selection of the weight of the attribute. This study combined the entropy weight technique with TOPSIS to improve freight selection decisions [
33]. A conveyor selection problem was solved with six conflicting criteria and eight alternatives using WASPAS, MOORA, CODAS, and EDAS methods, and the results were validated with the Spearman coefficient. The study showed that CODAS, EDAS and WASPAS were in amicable agreement [
34]. The factor relationship technique was introduced to assign weights, and the hard-magnetic material selection problem was solved by the WASPAS method [
35]. The EDAS method is a newly established MCDM technique by Keshavarz Ghorabaee [
36]; it is steady in diverse weights and reliable with other procedures such as VIKOR, TOPSIS, SAW, and COPRAS. EDAS has been applied in various construction and industrial applications. An extended EDAS method was utilized for supplier selection [
37]. EDAS and TOPSIS were used to select biomass material while assigning weights of significance with fuzzy analytical hierarchy process (AHP) with seven biomass alternatives and seven conflicting criteria. Out of these, sugarcane bagasse ranked at the top of all other options [
38]. The TOPSIS method was applied to choose a vacuum cleaner, considering twenty-six different models of eight brands. Karcher WD 3.200 came out as the first choice, followed by Karcher WD 4.200 and Eureka Forbes Sensi. Additionally, the study proved the benefits of MCDM according to customer, retailer and wholesaler points of view [
39]. The WASPAS method was used to select a portable hard disk drive from five different brands available on the Indian market, with twenty-four alternatives, which shows the robustness of MCDM methodologies in a wide range of other option weightage environments, from the equal weight method to the standard deviation method. The results showed that Western Digital was the best brand out of the other four, as the top three models were from this brand in both weightage criteria [
40]. The EDAS method was applied to select an inverter technology air conditioner from 11 different brands, and cost, power input, number of convenience features, airflow, annual energy consumption, and ISEER were the conflicting attributes [
41]. WSM and WPM techniques were utilized to choose a mobile phone [
42]. The turning variables were optimized concurrently using VIKOR, AHP and multi-attribute decision-making techniques [
43,
44]. A review of the literature reveals that MCDM methods are frequently used for selection purposes. A femoral component of TKR was selected using the VIKOR technique, considering 10 alternate materials, and, reportedly, porous and dense NiTi shape memory alloys were ranked first and second, respectively [
1]. The fuzzy analytical hierarchy process (FAHP), with the preference ranking organization method for enrichment evaluations (PROMETHEE), was applied to select a femoral component for TKR [
4].
A number of methods exist, based on MCDM, to assign ranks to various alternatives. These methods find the ranks of the options based on different computational principles. Hence, it becomes tricky for the end-user to choose an MCDM method. There is a need to inspect the procedure that can cartel the diverse MCDM methods’ ranks. The paper’s main objective is to explore and develop an MCDM hybrid approach for selecting the best femoral component of TKR and sensitivity analysis while varying weights of significance with objective preference using entropy and standard deviation weight methods.
2. Hybrid Decision-Making Methodology with Objective Preferences and Degree of Membership (DoM)
The proposed MCDM, using a hybrid approach, is shown in
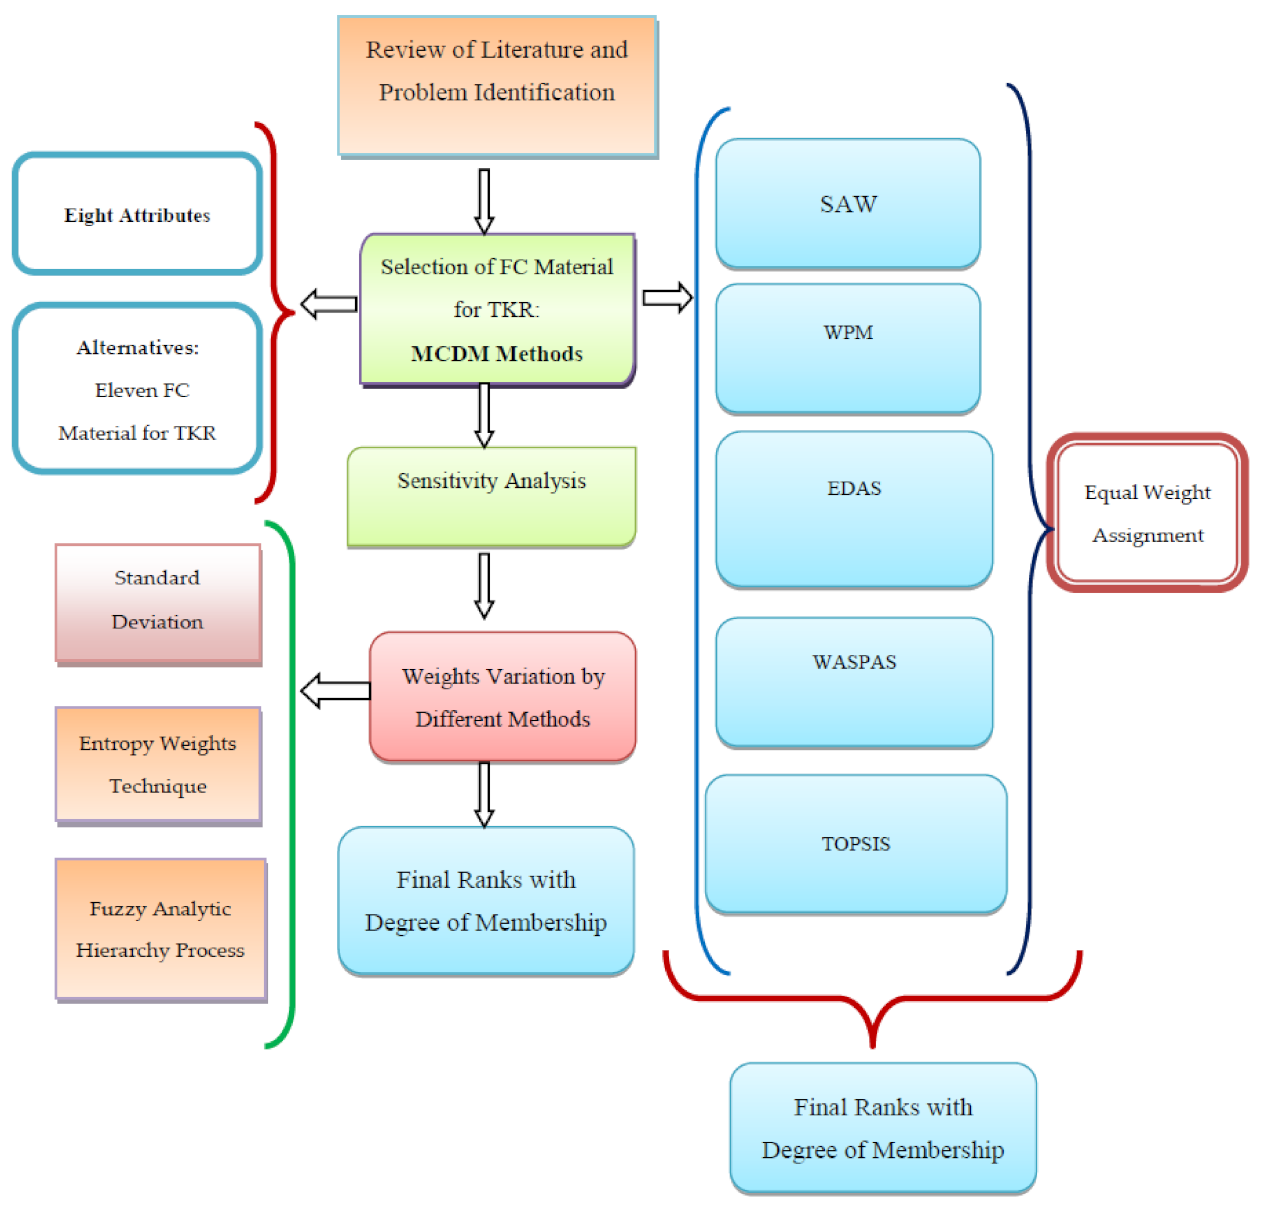
Figure 1. First of all, the literature is reviewed after assessing a problem. This approach consists of five different MCDM methods, and these methods compute the final composite score based upon different principles. The ranks of alternatives are calculated with the equal weight method. The degree of membership (DoM) technique combines the ranks of FC of TKR alternatives. The working principle of the applied MCDM method is very clear from their names.
The weighted sum method computes a preference score by taking an average of a normalized weighted matrix.
The weighted product method is based on a geometric mean. The weighted aggregated sum product assessment method combines the results of WSM and WPM.
The EDAS method computes a preference score using an evaluation based on distance from the average solution.
The TOPSIS method is based upon a technique for order of preference by similarity to the ideal solution.
The ranks obtained by the different MCDM methods are combined by DoM [
45].
Furthermore, the sensitivity analysis is executed by considering objective weights.
Standard deviation method.
Entropy weight technique.
The steps of multicriteria decision-making using the hybrid approach are as follows:
Step 1:
Identification of study objectives, alternatives, and attributes/criteria. The decision matrix ‘
’ is considered, as per Equation (1). Every row of the decision matrix (
) is assigned to each alternative (material) and each column to one attribute/criteria viz. cost, density, modulus of elasticity, tensile strength, elongation, corrosion resistance, wear resistance, and osseointegration.
ij is an element of the decision matrix ‘
’ [
ij;
= 1, 2, …, a number of alternatives (n),
= 1, 2, …, number of attribute/criteria (m)], which are inputs [
46,
47].
The detailed process involved in the calculation of ranks is shown in
Figure 2. This involves literature review and problem identification at an early stage and the estimation of different ranks using Step 3 and Step 4, taking into consideration 8 attributes and 11 materials. The ranks are combined using Step 5. Finally, sensitivity analysis is done using three different weights according to Step 3, and a comparison is made using a graphical method.
Step 2:
The normalization of the decision matrix ‘
’ is performed by different methods. The vector normalization technique is utilized by the ‘TOPSIS method’ and is shown in Equation (2). The linear-ratio-based normalization method is used by the ‘SAW method’, the ‘WPM method’, and the ‘WASPAS method’. It is shown in Equation (3) for beneficial attributes; nonbeneficial attributes are represented by Equation (4).
Step 3:
There are various methods of assigning weights (wj) of significance to the attributes/criteria, (wj; = 1, 2…… m, such that = 1), such as equal, objective, and subjective preferences.
Equal Weights Method (EWM)
Equal weights are obtained by Equation (5).
where
m is the number of attributes.
Standard Deviation Method (SDM)
The SDM weights of the criteria are assessed by Equation (6) without taking into consideration the decision-maker’s subjective liking [
48].
where
is the standard deviation of the dimensionless criteria.
Entropy Weights Technique (EWT)
The probability of the response
happening, be computed by Equations (7) and (8), is utilized to attain the entropy (
of the jth response [
46,
49].
where
is a stable expression, n belongs to the number of experiments and the value of
lies between zero and one.
Equation (9) is utilized to compute the degrees of divergence (Div
j), and Equation (10) obtains the entropy weight (E
w) of the j
th response.
Step 4:
Different types of methods have been used to find out the ranks of given alternatives. The techniques used in the present work are as follows:
SAW (Simple Additive Weighted Method)
The weighted normalized matrix (ŴŻ
ij) is obtained by multiplying the columns of M
ij with their respective assigned weight,
j. Subsequently, ŴŻ
ij is attained by Equation (11).
The criteria of optimality are applied based upon simple additive weighting (SAW), as shown in Equation (12).
WPM (Weighted Product Method)
The optimality criteria are applied based upon the weighted product method (WPM), as shown in Equation (13).
WASPAS (Weighted Aggregated Sum Product Assessment)
The dual comparative significance of the alternatives, i.e., performance index (
Qi) based upon SAW and WPM techniques, is calculated, as shown in Equation (14) [
50].
and Equation (15) is used to locate the optimal assessment of ƛ for a specified decision-making problem.
EDAS (Evaluation Based on Distance from Average Solution)
Determine the average solution (AV
ij) according to all the criteria, as shown in Equation (16). The positive–negative-distance-based normalization is utilized in the EDAS method. The positive distance from average (
) is shown in Equation (17) for beneficial attributes and in Equation (18) for nonbeneficial attributes. The negative distance from average
is shown in Equation (19) for beneficial attributes and in Equation (20) for nonbeneficial attributes [
36].
The weighted sum of
𝒜 and
𝒜 is obtained from the average matrix from Equations (21) and (22).
The normalized values of
are obtained from Equation (23) and
from Equation (24) for all alternatives:
where
and
denote the normalized weighted sum of
𝒜 and
𝒜, respectively.
The appraisal score
ASi for all alternatives is obtained by Equation (25):
where 0 ≤
ASi ≤ 1.
TOPSIS (Technique for Order Preference by Similarity to Ideal Solution)
The weighted normalized matrix (ŴŻ
ij) is obtained by multiplying the columns of M
ij with their particular allocated weight,
j. Subsequently, ŴŻ
ij is attained by Equation (26) [
47,
48].
The ideal best (
+) and ideal worst (
−) solutions are computed by Equations (27) and (28), respectively. Here,
+ and
− solutions are the highest and least values amid all attribute values, respectively.
where j and j′ are concerned with the beneficial (m) and nonbeneficial attributes (m′), respectively.
Prepare separation measures (Sep) with the assist of Euclidean distance (refer to Equations (29) and (30)).
Compute the relative closeness or multiple composite score ‘MCS’ of all options, i.e., alternatives representing the equation’s ideal resolution refer to Equation (31).
The relative closeness or ‘MCS’ achieved is then ordered into descending order for the ranking of alternatives.
Step 5:
This is the method to select optimal total knee replacement material using the final ranks of alternatives based on individual results from different MCDM methods [
46].
Let be the rank matrix of the alternative using the MCDM method ( = 1, 2, …, k, = 1, 2, ……, t), where k is the number of MCDM methods and t is the number of alternatives.
Step 5.1: Constitute the rank matrix = () k × t.
Step 5.2: Estimate the values of the rank variables;
= 1, 2, …,
k,
= 1, 2, …,
t,
= 1, 2, ……,
t from the rank matrix
= (
)
k ×
t, as shown in Equation (32).
Step 5.3: Constitute rank frequency number matrix F = (
) txt, where
is the rank frequency number so that the rank of the
alternative is
place by different MCDM methods, and
is calculated as per Equation (33).
Step 5.4: Constitute membership degree matrix
= (
) txt, where
is the membership degree that the rank of the
alternative belongs to
place by different MCDM methods, and
is as per Equation (34).
The
row (
,
, …,
) of the membership degree matrix
= (
) txt represents the degree that the rank of the
alternative belongs to k as shown in Equation (35).
Step 5.5: Calculate the final rank index
of the
alternative (
), where
is calculated as per Equation (36).
Step 5.6: Determine final ranks (with minimum final rank index) r01, r02, …, r0t of the alternatives of TKR material in the ascending order based on the values of
3. Selection of Femoral Component (FC) Material for Total Knee Replacement (TKR)
The various attributes considered in the decision-making, such as cost, density and modulus of elasticity, are tabulated in
Table 1 from 1
ps to 8
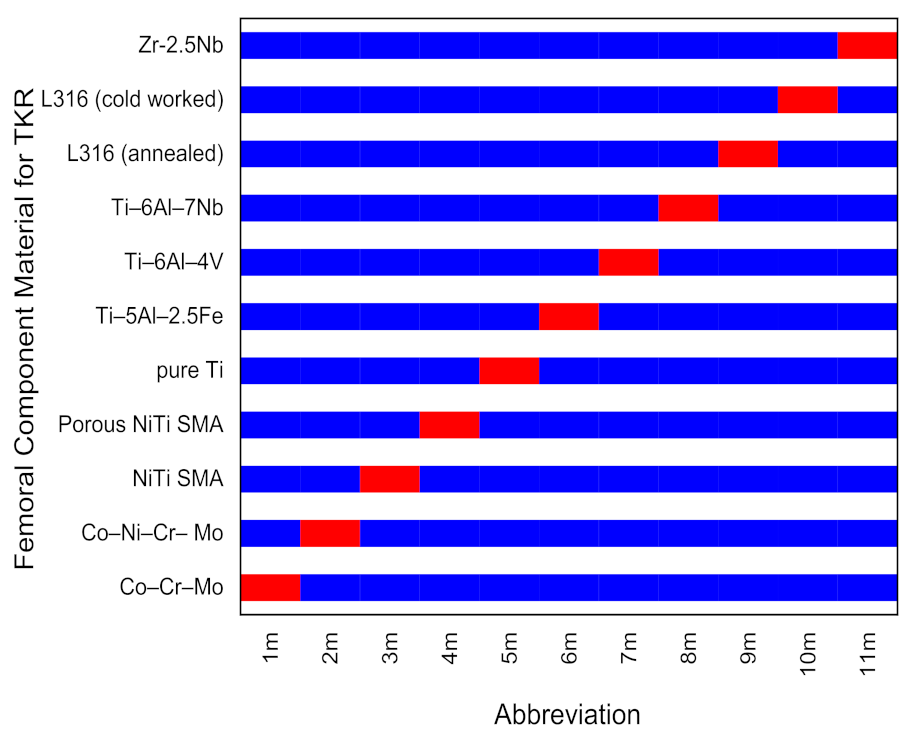
ps. The eleven alternatives of FC material for TKR from 1
m to 11
m are shown in
Figure 2.
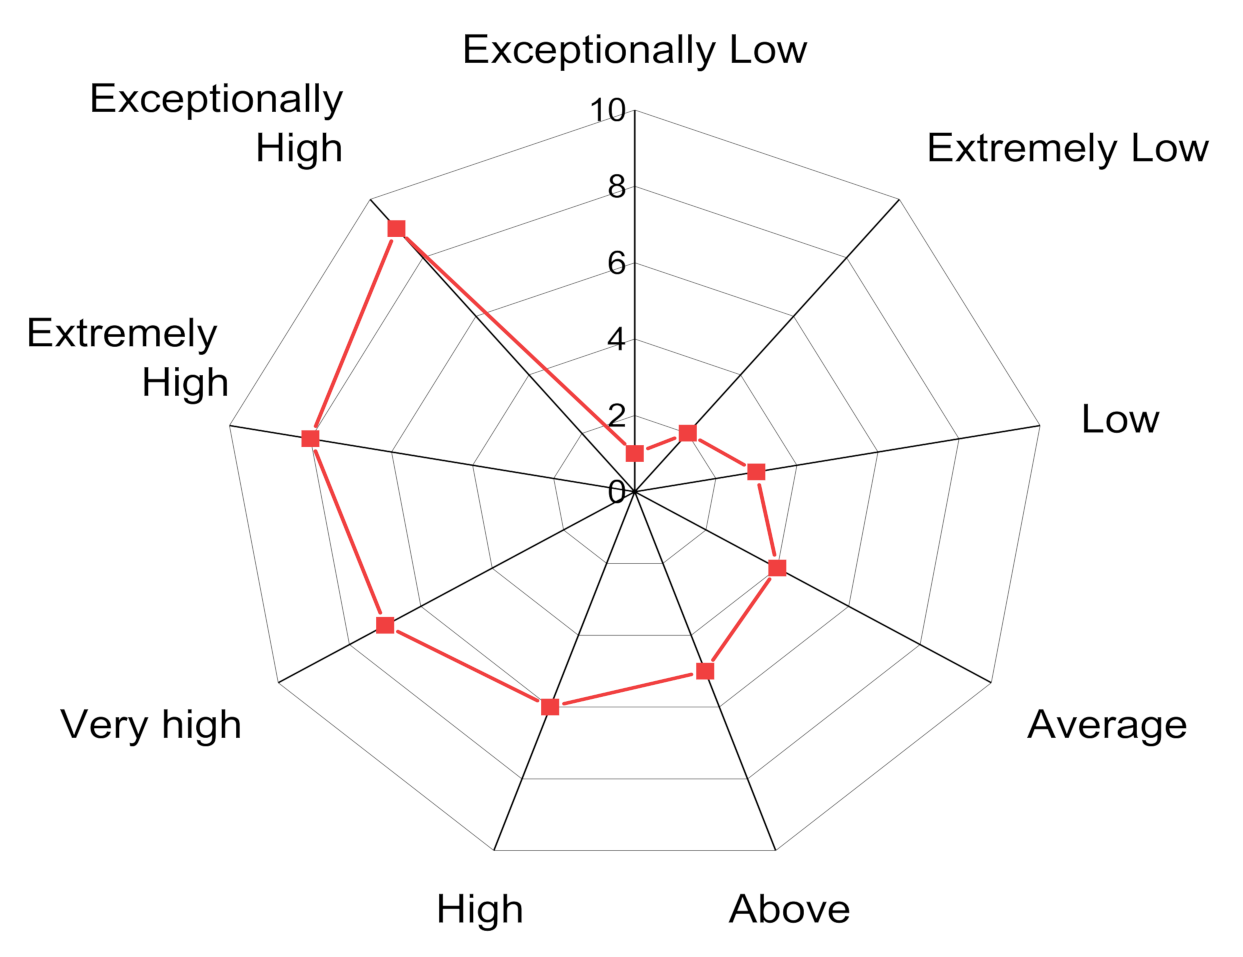
Figure 3 represents a qualitative degree of FC material of TKR attribute in a 9-point scale format.
Table 2 is a decision matrix as per Equation (1). All the calculations were completed on Excel (MS Office) for up to four decimal places.
The equal weight method was used to attain the weights of importance, according to Step 3. The weights of each attribute are represented in
Table 3.
The ranks of each alternative were computed using different methods, according to Step 4. Firstly, the SAW method was executed using Equation (11). The weighted sum for each alternative was calculated using each attribute’s optimal weight, as shown in
Table 4. Similarly, the WPM method was executed using Equation (13), and the results are shown in
Table 5.
The dual comparative significance of the alternative, i.e., performance index (Q
i) based upon SAW and WPM techniques, was calculated, as shown in Equation (14). The final optimal assessment was executed using Equation (15), and the performance index of each alternative is shown in
Table 6.
According to all the criteria, the average solution (AV
ij) of each attribute, 1
ps to 8
ps, was calculated per Equation (16). Positive–negative-distance-based normalization was utilized in the EDAS. The positive distance from average (
) was executed using Equation (17) for beneficial attributes and Equation (18) for nonbeneficial attributes and shown in
Table 7. The negative distance from average
was executed using Equation (19) for beneficial attributes and Equation (20) for nonbeneficial attributes. The weighted sum of
𝒜 and
𝒜 is obtained from the average matrix from Equations (21) and (22). The normalized values of
are obtained from Equation (23) and
from Equation (24) for all alternatives. The appraisal score index AS
i for all alternatives was obtained by Equation (25) and is shown in
Table 7. Finally, the optimal results from the TOPSIS method were obtained by calculating the ideal best (Z
+) and ideal worst (Z
−) solutions with the help of Equations (27) and (28), respectively. Here, Z
+ and Z
− solutions are the utmost and least values amongst all response values. The final ranks, obtained using the different methods, are shown in
Table 8.
The combined results of all the methods, including WSM, WPM, WASPAS, EDAS, and TOPSIS, are represented in
Table 9.
The constitute rank frequency number of each alternative was calculated using Equation (33) and Step 5.3., and they are represented in
Table 10. A membership degree is constituted using Equation (34) and Step 5.4. The final rank index of each alternative was obtained using Equation (36) and Step 5.5 from the DoM technique. The final ranks of each alternative were calculated accordingly and are represented in
Figure 3. The ranks of FC material of TKR, assigned by different MCDM methods, and final ranks with DoM can be seen in
Table 11. The first rank goes to 4
m Porous NiTi shape memory alloy, followed by 7
m Ti alloys (Ti–6Al–4V).
When considering EWM, femoral component material 4
m came out in first place, followed by 7
m and 10
m, as shown in
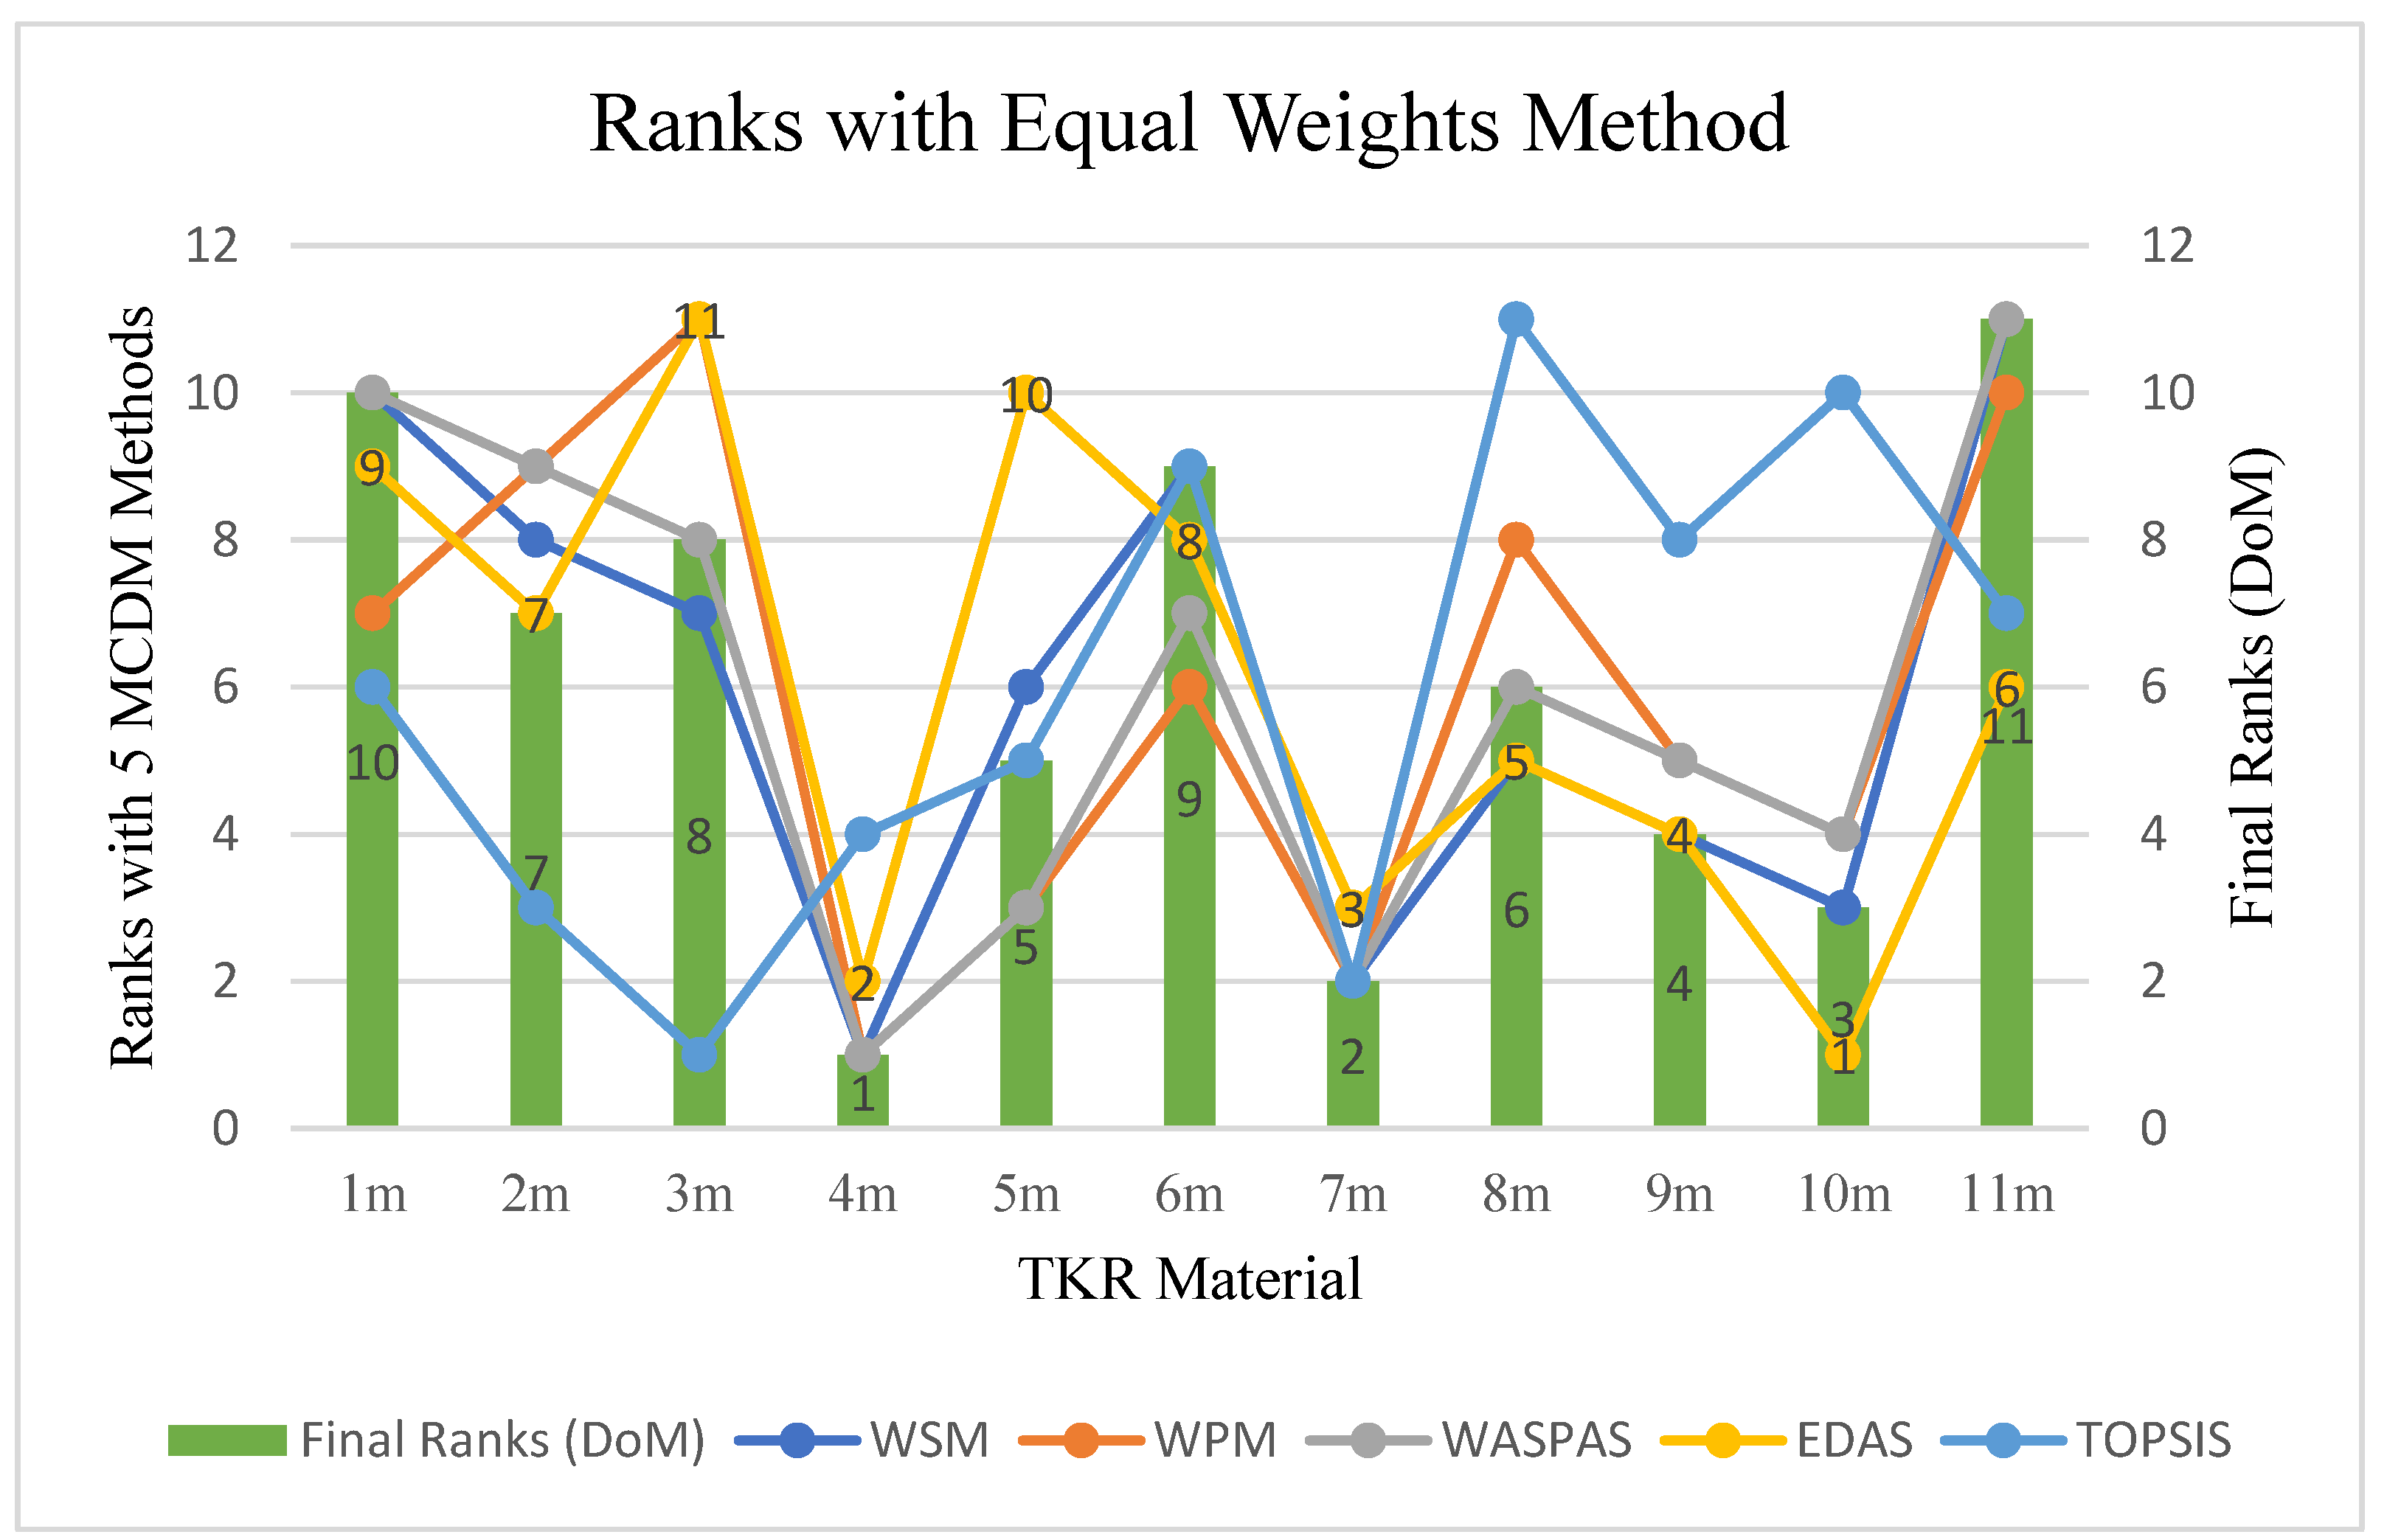
Table 11, as different MCDM methodologies have their own features. Thus, the variation of ranks with the variation in methods is presented in
Figure 4. The coloured lines represent different methodologies, while the bars represent the final ranks calculated using the DoM technique.
4. Sensitivity Analysis
Sensitivity analysis is the review of the uncertainty in the output of a mathematical decision-making model or system to various risks and changes in its inputs. This analysis helps check the results’ consistency as to whether the model or system works in most conditions, favourable or unfavourable. The positive results obtained from the sensitivity analysis indicates the durability and robustness of the solution. The present study’s sensitivity analysis was executed by considering objective weights with the standard deviation method ‘SDM’, the entropy weights technique ‘EWT’, and the subjective weights with fuzzy analytical hierarchy process (FAHP) considered from the research [
4]. The ranks by different MCDM methods, with SDM, EWT and Fuzzy AHP, are shown in
Appendix A (
Table A1,
Table A3 and
Table A5). The final rank index achieved with DoM, with SDM, EWT and Fuzzy AHP, is shown in
Appendix A (
Table A2,
Table A4 and
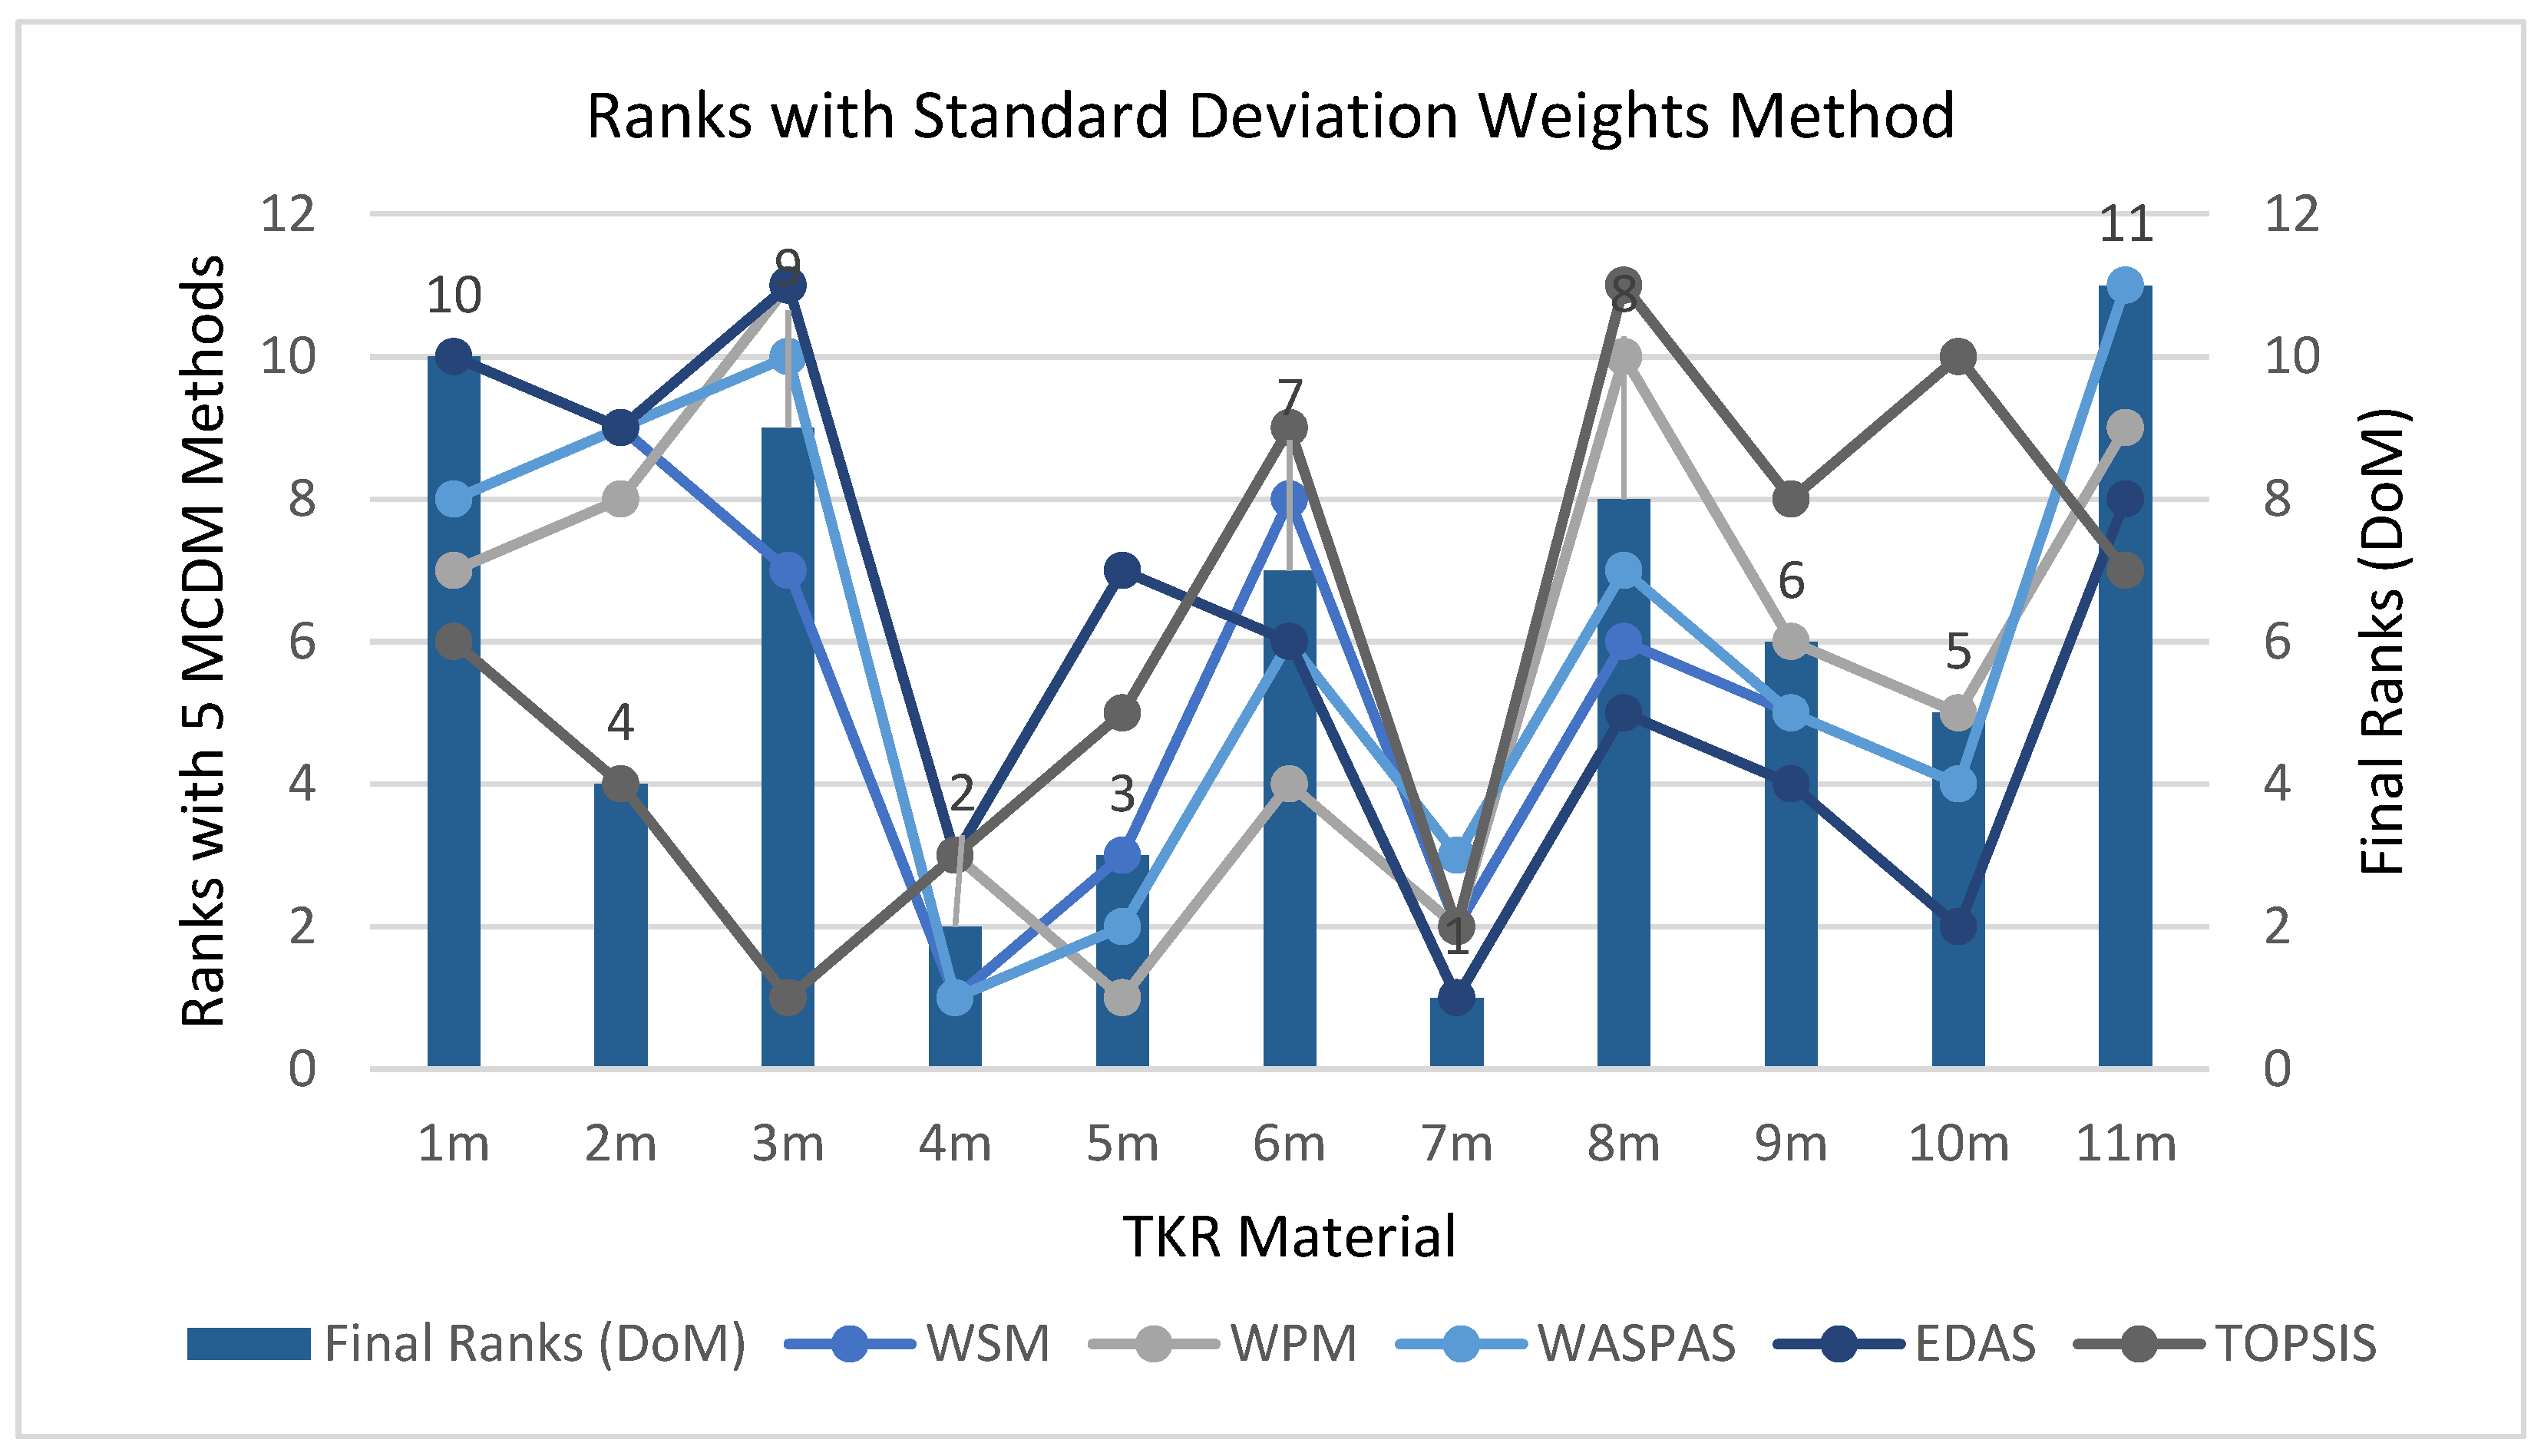
Table A6, respectively). The calculations were completed in a similar manner to those done for EWM, from Step 1 to Step 5.6. The ranks of FC material for TKR by different MCDM methods and DoM with SDM, EWT and fuzzy AHP are shown in 5–6, respectively.
A similar analysis was done by changing weightage, as done before in
Figure 4, but with SDM as the weightage. A high variation can be seen in 2
m and 5
m, as in
Figure 4, 2
m attains rank 7, but in
Figure 5, it rises three ranks to rank 4; similarly, 5
m attains rank 5 in 4. but improves two ranks to rank 3 in
Figure 5.
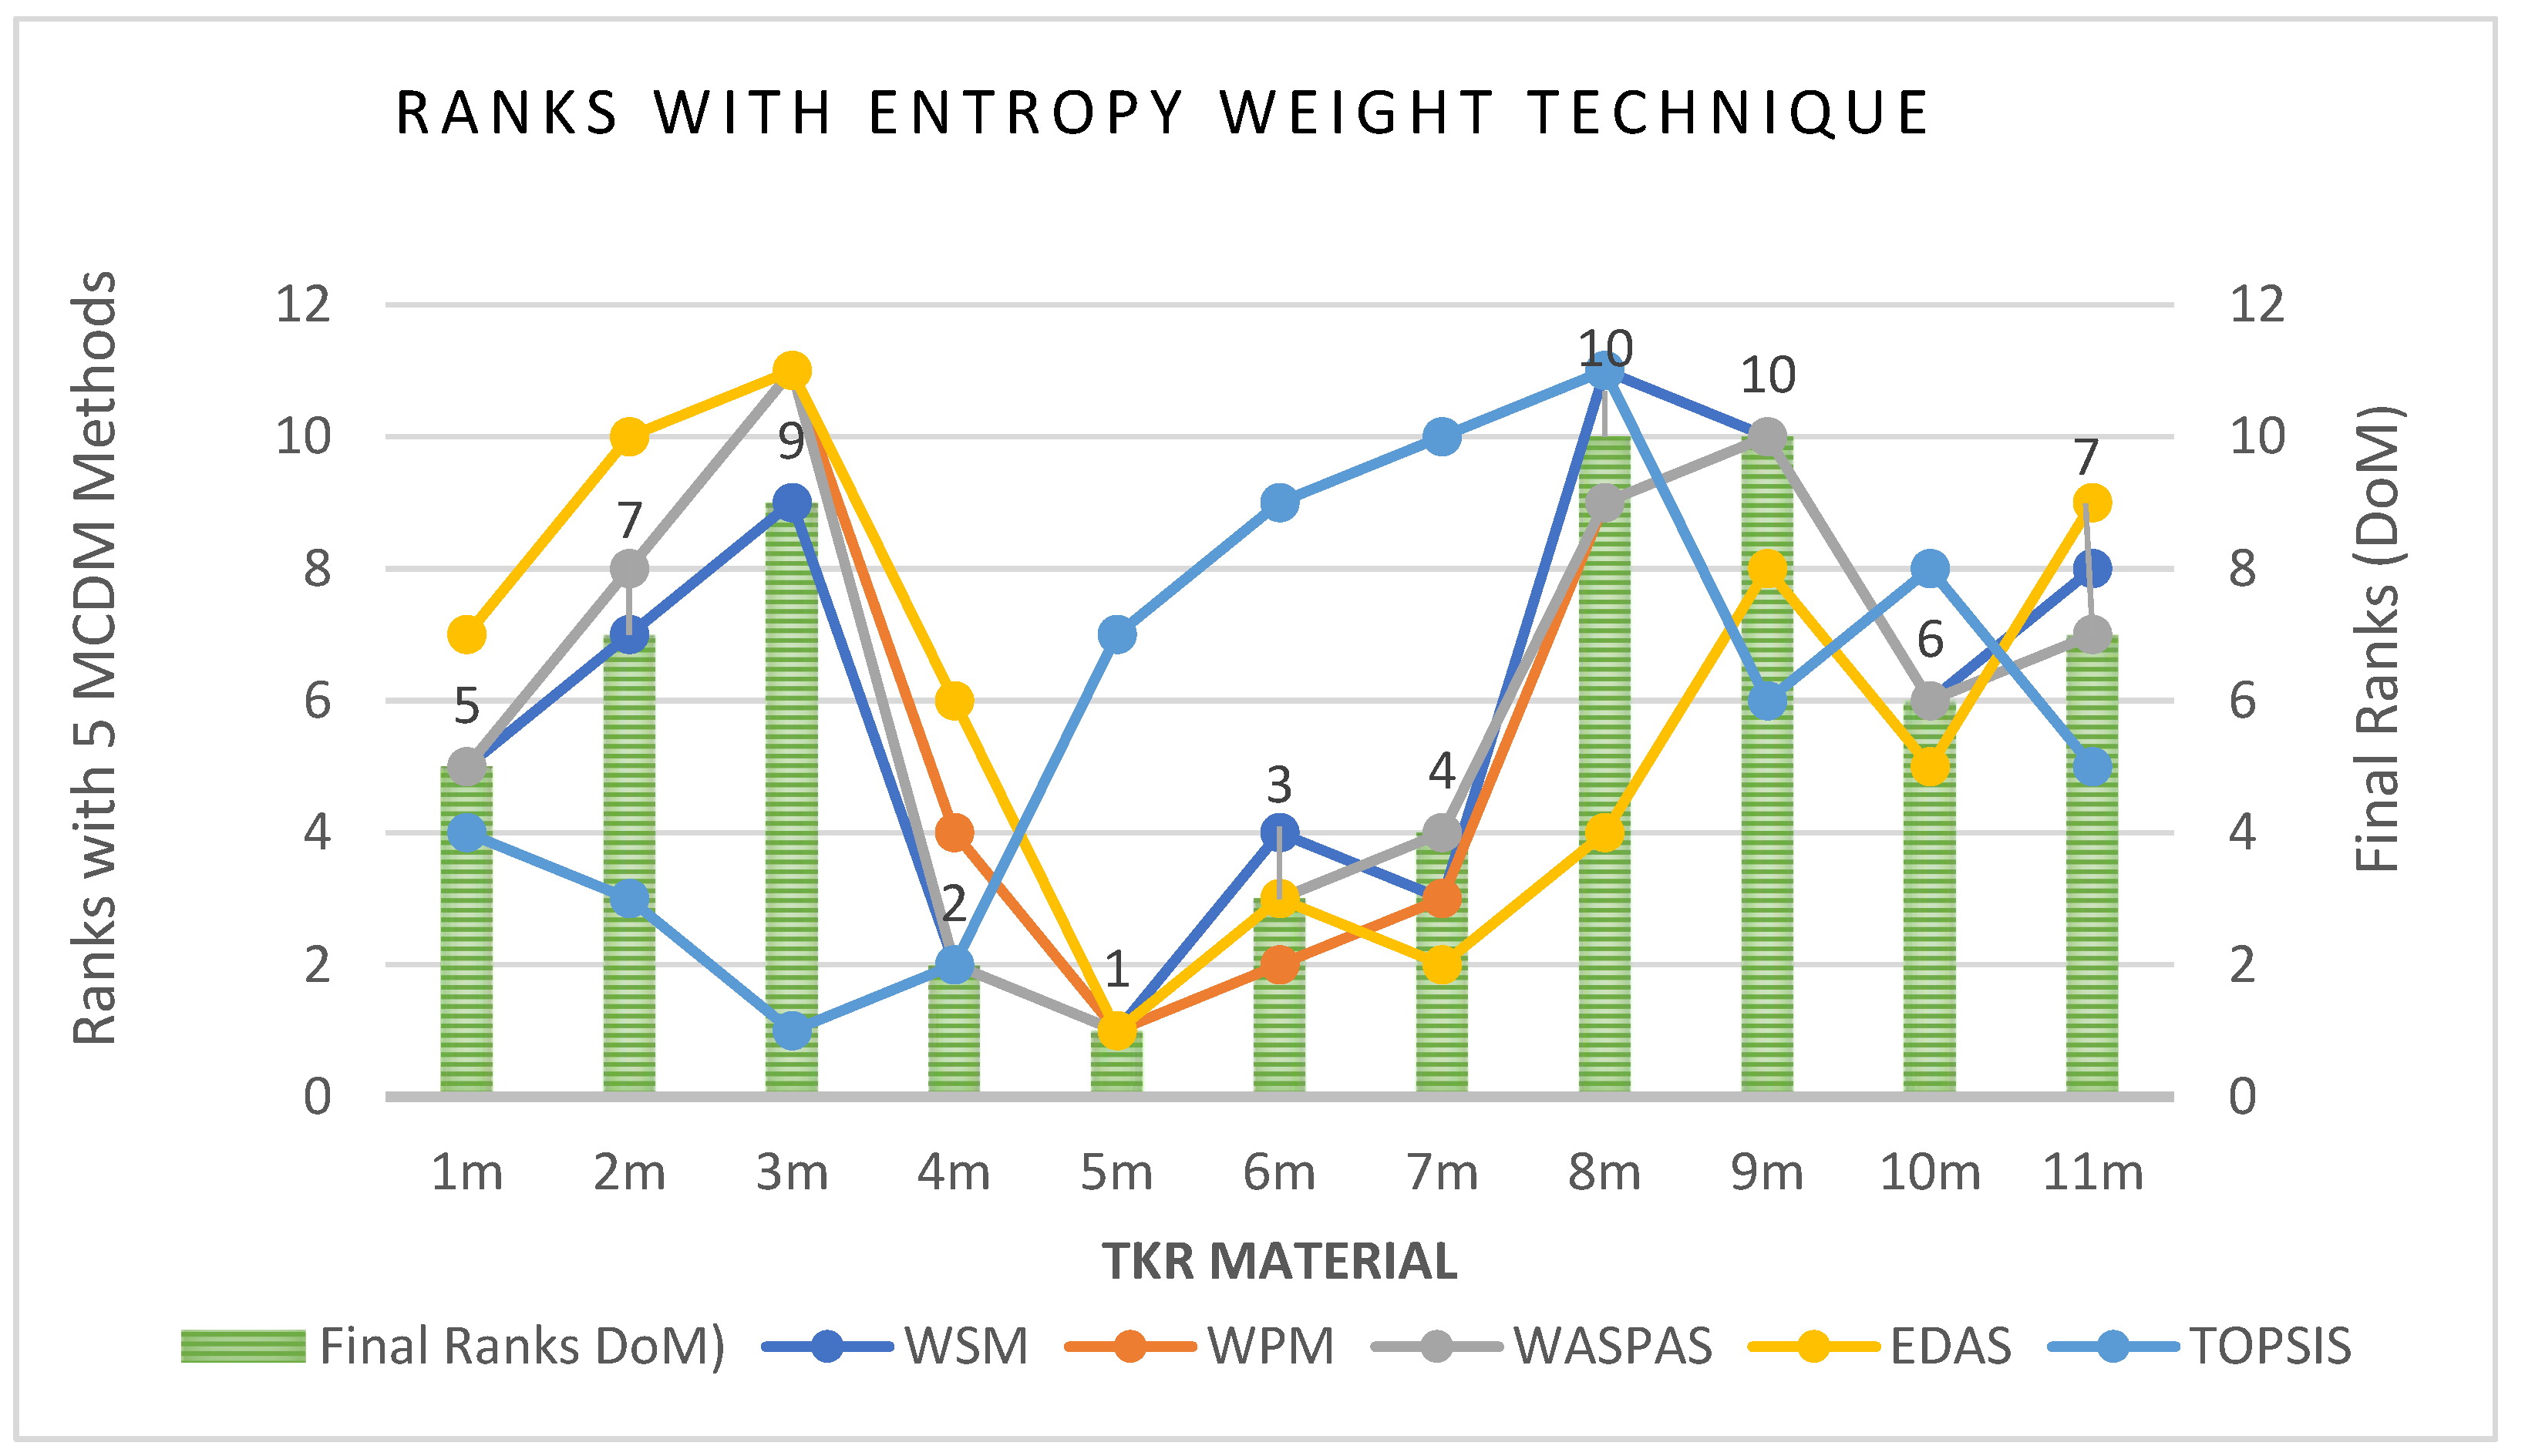
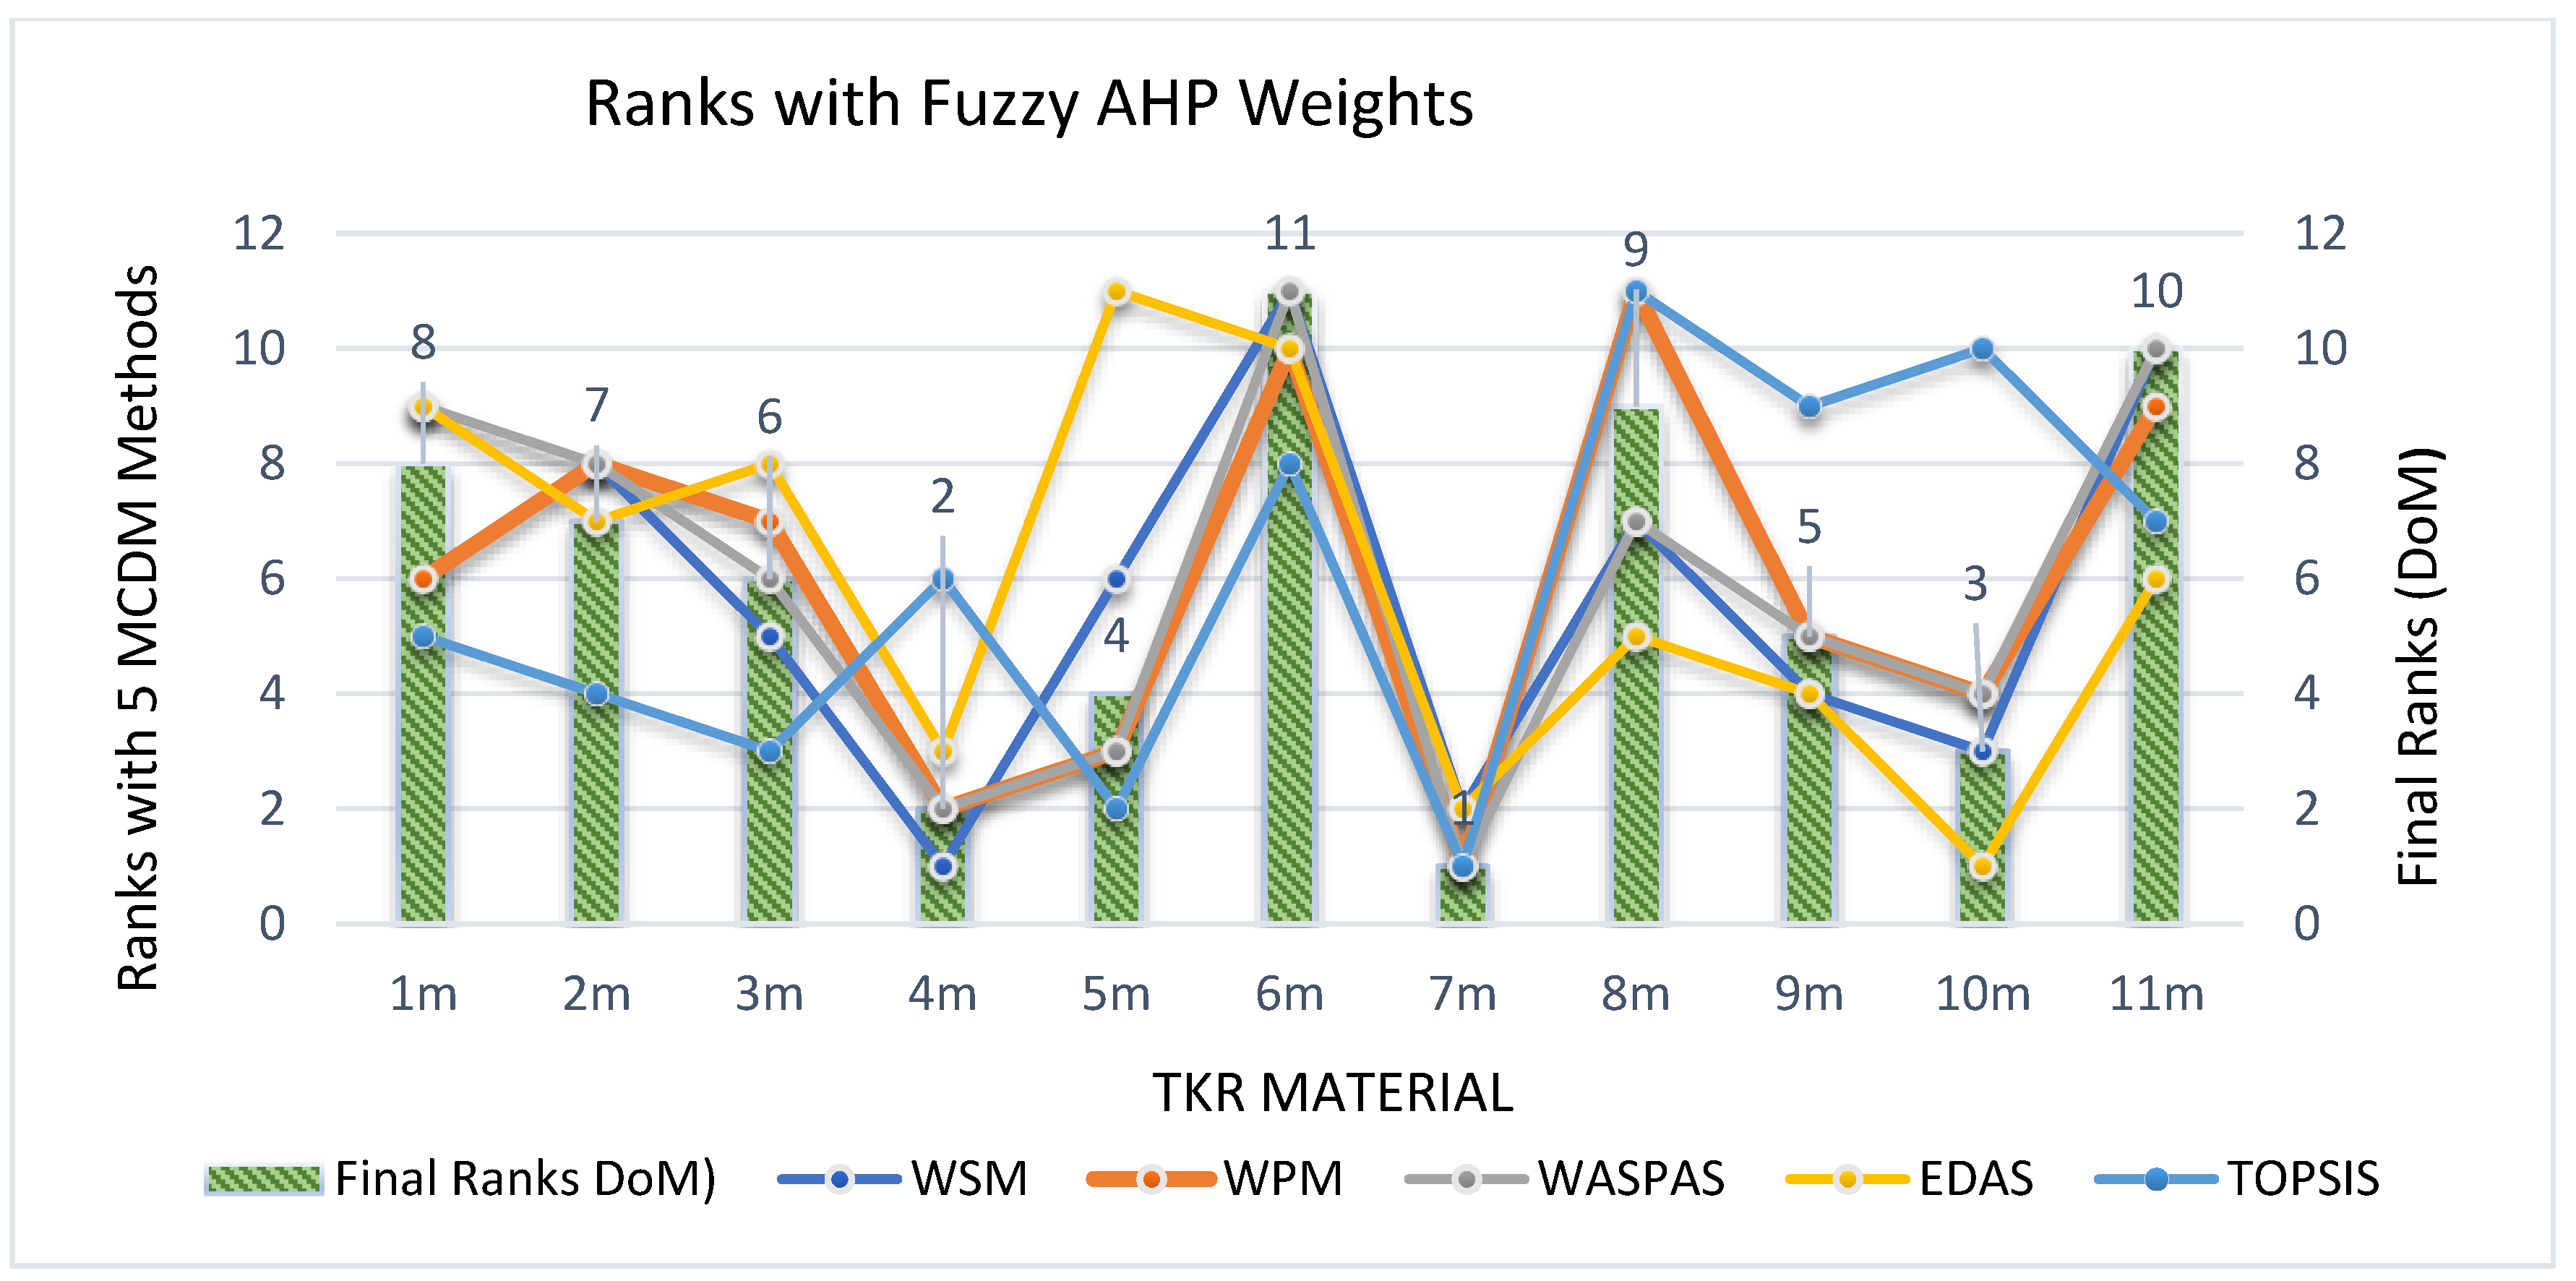
Correspondingly, with EWT and FAHP, the materials 6
m and 9
m show a sharp change as 6
m attains rank 3 in
Figure 6, but falls to rank 11 in
Figure 7. Similarly, 9
m in
Figure 6 shows as rank 10, but it improves to rank 5 in
Figure 7. Likewise, considering 1
m, there is a drastic change in rank as it attains rank 5 with EWT, as shown in
Figure 6 but slips to rank 8 when taking FAHP as weightage in
Figure 7.
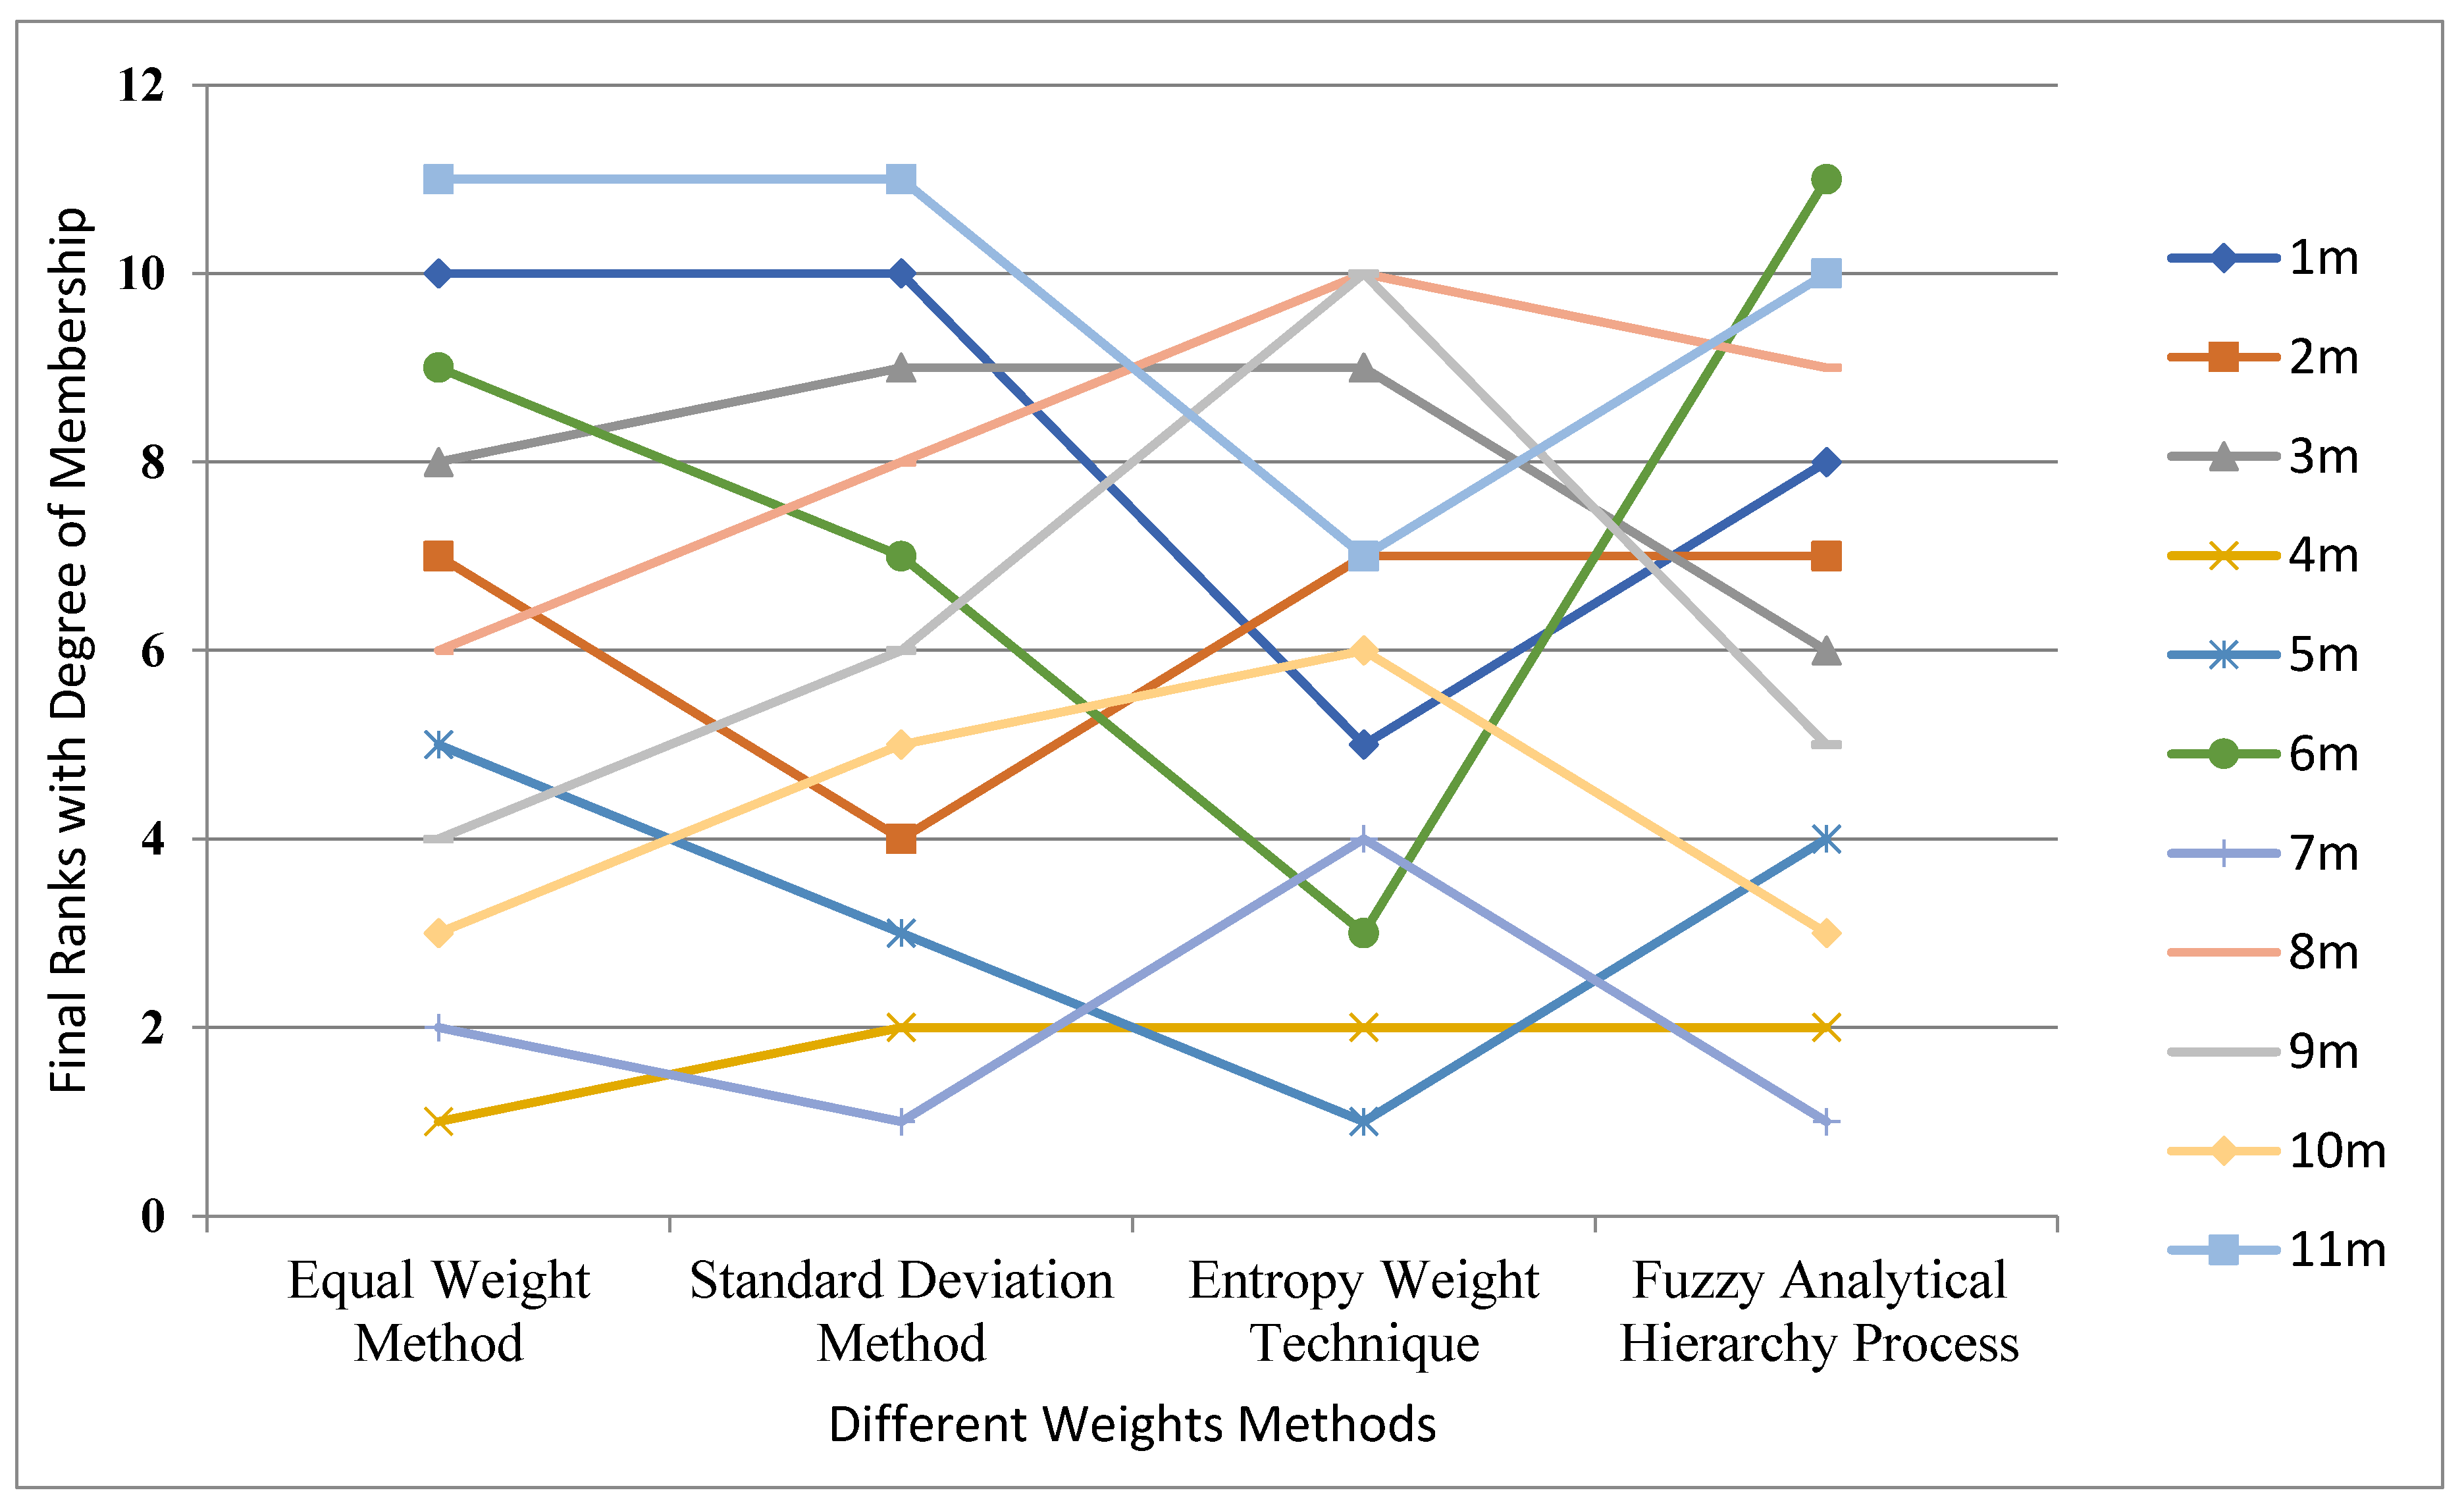
The final ranks with DoM, with all weighting criteria viz. EWM, SDM, EWT and fuzzy AHP, are shown in
Figure 8. The FC material for TKR 4
m Porous NiTi shape memory alloy is ranked first with EWM and at the second rank with SDM, EWT and fuzzy AHP weight methods. The 4
m Porous NiTi shape memory alloy was also assigned rank 1 by [
4,
45]. For FC material for TKR, 7
m Ti alloys (Ti–6Al–4V) are at rank 1 with SDM and fuzzy AHP weight methods, rank 2 by EWM, and rank 4 by EWT. High consistency can be seen in 8. Although 4
m shifts to the second rank by changing the weightage, it remains at the second position, proving the top-ranked material performs extraordinarily in different circumstances.


 ,
, 


