
Influence of Texture on the Mechanical Properties of a Mg-6Al-1Zn-0.9Sn Alloy Processed by ECAP

Key Laboratory of Automobile Materials of Ministry of Education, School of Materials Science and Engineering, Nanling Campus, Jilin University, No. 5988 Renmin Street, Changchun 130025, China
*
Author to whom correspondence should be addressed.
Materials 2021, 14(10), 2664; https://doi.org/10.3390/ma14102664
Submission received: 12 April 2021
/
Revised: 6 May 2021
/
Accepted: 11 May 2021
/
Published: 19 May 2021
(This article belongs to the Collection Materials Investigations in Mechanical Systems)
Abstract
:The microstructure and mechanical properties of a Mg-6Al-1Zn-0.9Sn alloy processed by equal channel angular pressing (ECAP) at temperatures of 250 °C and 300 °C were investigated. It was found that the refinement of the microstructure was very dependent on the processing temperature. The main reason for the difference in grain refinement was the precipitation of secondary-phase particles. Texture information obtained by electron back-scatter diffraction (EBSD) showed the gradual formation of a 45° texture during the ECAP process, while the maximum intensity was different for processing temperatures at 250 °C and 300 °C. By calculating the contribution from different strengthening mechanisms, it was found that a 45° texture had a huge influence on grain boundary strengthening and thus the yield strength.
1. Introduction
The advantages of their high specific strength give magnesium (Mg) alloys wide prospects for lightweight applications in the aerospace, automotive, and electronic fields [1,2]. However, the low formability and strong plastic anisotropy of Mg alloys limit the development of their wider industrial applications [3,4]. Now, some new types of Mg alloys have been developed based on the common Mg-Al-Zn system, which is by adding extra rare earth elements [5,6]. The rare earth elements (such as Nd and Ce [5,6]) can effectively ameliorate the formability of Mg alloys at room temperature (RT). Compared with expensive rare earth elements, adding the inexpensive Sn element to Mg alloys can improve not only their creep resistance, but also the mechanical strength and toughness at RT [7,8].
As is well known, microstructure refinement is also one of effective ways of improving the mechanical properties of alloys [9]. Thus, many research works have been devoted to achieving microstructure refinement by thermo-mechanical processes, such as extrusion and rolling [10,11]. Nevertheless, the microstructure refinement obtained by this processing is not enough to greatly improve the mechanical properties of magnesium alloys. Therefore, obtaining better microstructure refinement by proper processing is still the research focus of Mg alloys [12,13,14].
Severe plastic deformation (SPD) techniques have been proven to be effective in producing an ultra-fine microstructure, such as high-pressure torsion (HPT), asymmetric rolling (ASR), and ECAP [15,16,17,18,19,20]. In recent years, some research has been carried out on processing Mg alloys by ECAP [15,17,19]. Overall, the researches on Mg alloy ECAP include two aspects: microstructure refinement and texture modification [21,22,23,24]. Although ECAP can refine grains, the high strength and toughness may not be necessarily achieved. The yield strength of Mg alloys may be reduced after ECAP, especially those with strong basal textures [17,25,26,27,28,29]. How to ensure the reasonable match between microstructure refinement and texture modification during ECAP is the critical point to improve strength and toughness. Therefore, exploring the influence of microstructure refinement and texture modification on the mechanical properties of ECAP-processed Mg alloys is essential.
Although many research works on ECAP-processed Mg alloys have been reported, few studies have systematically analyzed the relationship among their microstructure, texture, and mechanical properties. Thus, the present work studied how the deformation temperatures (250 °C and 300 °C) affect the grain refinement, precipitation, texture evolution, and mechanical properties of an ECAP-processed Mg-6Al-1Zn-0.9Sn alloy.
2. Experimental Procedure
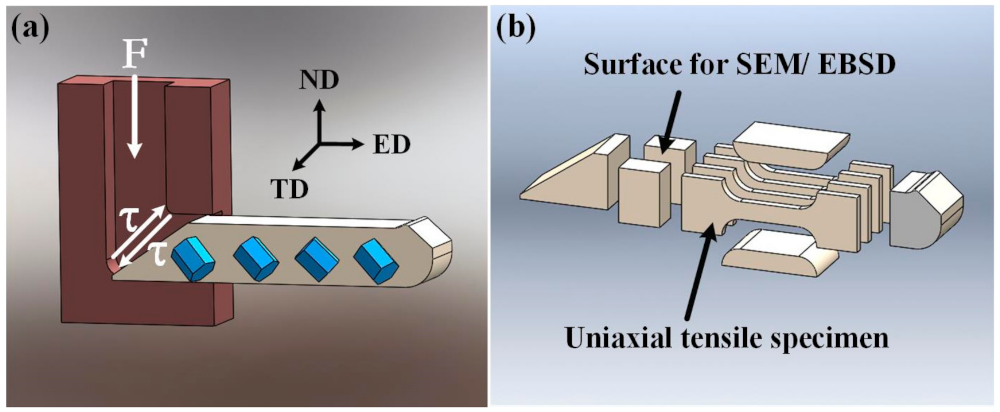
The 10 mm thickness extruded Mg-6Al-1Zn-0.9Sn (wt. %, ATZ611) plate was used in this work. Before EACP, the extruded ATZ611 plate was solutionized at 420 °C for 20 h, then quenched. The as-solutionized ATZ611 plate was cut into 10 mm × 10 mm × 80 mm bar-shaped ECAP samples along the extrusion direction. The ECAP samples were deformed through a 90° ECAP die using route Bc. Route Bc is when the next pass is rotated 90° in the same direction relative to the previous pass. When ECAP processed by this die, the single-pass strain ε =1.1. Considering that when the deformation temperature is lower than 250 °C, the samples will be broken in the ECAP process and the deformation temperature is too high to achieve the purpose of grain refinement, the deformation temperature of ECAP in this paper was selected as follows: 250 °C and 350 °C. Before ECAP, the temperature of the ECAP die was heated to the desired temperatures (250 °C and 350 °C) and maintained for 30 min. Then, the ECAP sample was placed in the ECAP die for 15 min to reach the deformation temperatures (250 °C and 350 °C) as well. A self-made temperature control system was used to control the temperature. For convenience, the deformed samples after X passes are referred to as the XP samples. The schematic of the ECAP process is shown in Figure 1a, where the ECAP sample was extruded from the vertical channel into the horizontal channel under the action of the punch rod.
Microstructure characterization was conducted by scanning electron microscopy (SEM: ZEISS EVO18, Oberkochen, Germany) and electron backscatter diffraction (EBSD: Oxford NordlysNano, Oxford, UK.). Phase analysis was performed by an X-ray diffractometer (XRD: D/Max 2500PC Rigaku, Tokyo, Japan), using a Cu target Kα-ray (λ = 1.5406Å). RT tensile tests were implemented using a SHIMADZU AGS–100kN machine (Tokyo, Japan), with a stain rate of 1 × 10⁻³ s−1. The 10 mm × 4 mm × 1.5 mm tensile samples were cut along the ED (Figure 1b).
3. Results and Discussion
3.1. Microstructure Evolution During ECAP
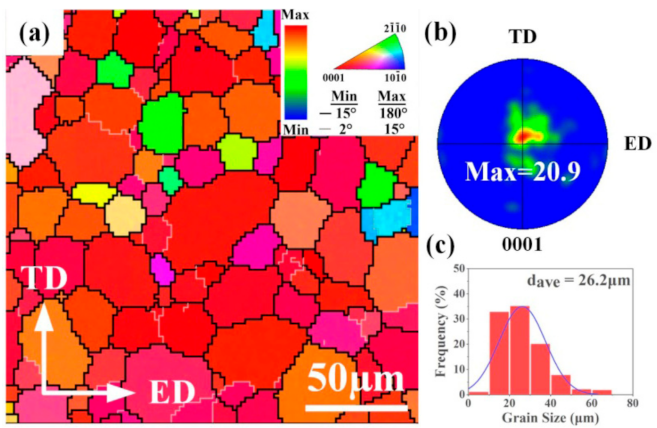
IPF maps and a {0001} pole figure of the as-solutionized ATZ611 alloy are shown in Figure 2. The as-solutionized ATZ611 alloy exhibited a uniform equiaxed grain structure delineated by well-defined boundaries, with dave of ~26.2 μm. The {0001} pole figure indicated a strong basal texture (Figure 2b) with a maximum intensity of 20.9 mr, which was analogous to the typical basal textures of extrusion plates reported in previous studies [30,31].
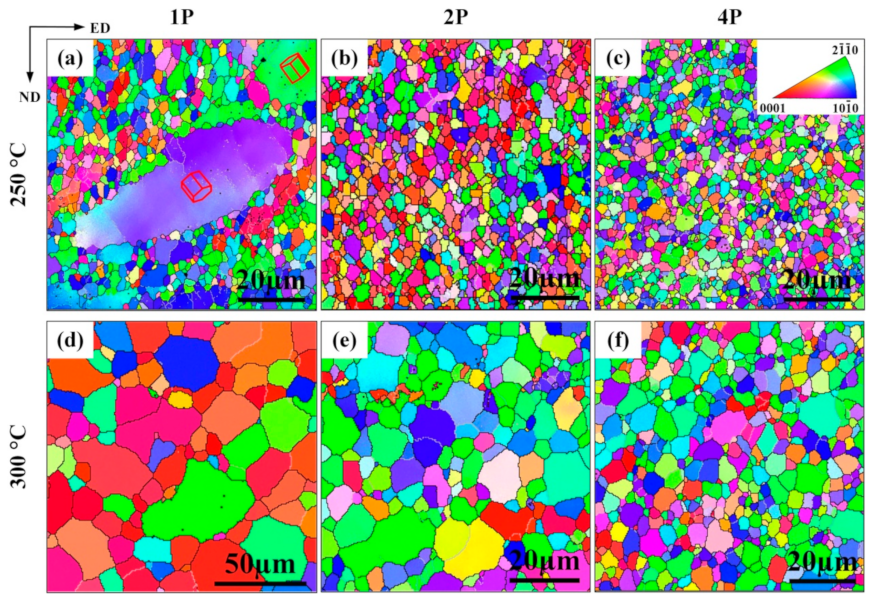
Figure 3 shows IPF maps of 250 °C–ECAP samples and 300 °C–ECAP samples. Their corresponding dave are shown in Table 1. After one pass (Figure 3a), a heterogeneous grain structure was formed in the 250 °C–1P sample, with the dave decreased to 6.2 μm compared to the as-solutionized ATZ611 alloy. Nearly 70% of the grains had sizes less than 5 μm. The formation of heterogeneous grain structures at 1PECAP of the ATZ611 alloys agreed with the results of Figueiredo et al. [17]. If the dave before ECAP were higher than a critical size, the refinement would start inhomogeneously with fine grains forming at the original grain boundaries for a few ECAP passes. For the ECAP-processed AZ31 alloy, the critical size for the formation of a bimodal size distribution was between 3 and 9 μm. Therefore, the formation of bimodal microstructures after one pass of ECAP in Figure 3a was because of the initial large grain size (~26 μm). As shown in Figure 3b, the size distribution of 250 °C-2P samples became more homogeneous, and dave was measured to be ∼3.6 μm (Figure 3e). After four passes of ECAP, grains became further refined, with dave being ~1.9 μm.
Compared with the 250 °C sample, it was clear that there were no elongated coarse grains in the 300 °C–1P sample (Figure 3d). The dave is ~16.5 μm, which was larger than that of the 250 °C–1P sample. With further increasing the ECAP passes, the grain structure became more uniform. However, it was quite clear that higher deformation temperature led to slow grain refinement during ECAP, resulting in larger grains.
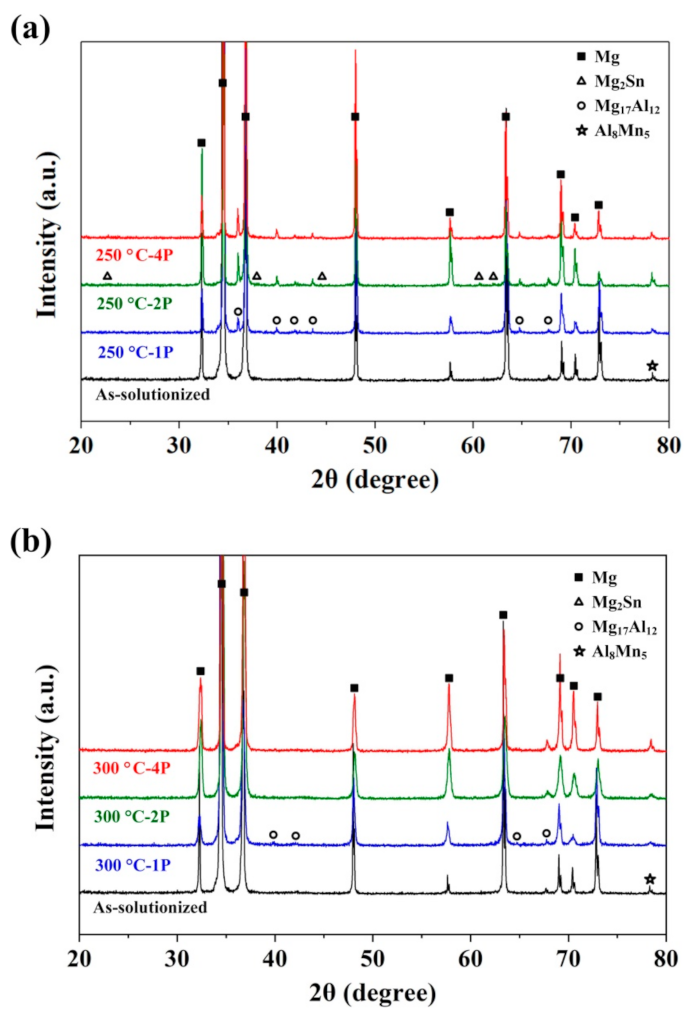
XRD photos of the as-solutionized sample and ECAPed samples deformed at 250 °C and 300 °C are shown in Figure 4. It indicates that after the solution’s heat treatment, nearly all the secondary phase particles in the ATZ611 alloy dissolved into the α-Mg matrix, while a few Al8Mn5 phases remained. After one pass of ECAP at 250 °C, the diffraction peaks of the Mg17Al12 phase appeared, with the highest peak intensity at 2θ = 36.74°. During ECAP, dynamic precipitation of the Mg17Al12 phase was due to the increasing dislocations, and vacancies could accelerate the diffusion of alloying elements [32,33]. For the 250 °C–2P samples, the intensity of the Mg17Al12 diffraction peaks increased, and the diffraction peaks of the Mg2Sn phase appeared.
In contrast, for the 300 °C–1P sample, the peak intensities of the Mg17Al12 phase were lower, which may be due to the faster recover of dislocations and vacancies. Moreover, obvious diffraction peaks of the Mg2Sn phase could not be seen for the 300 °C–2P sample. It was proven that the precipitation of the Mg2Sn phase could nucleate at the edge-tip of the Mg17Al12 phase [34]. If the precipitated amount of the Mg17Al12 phase were small, then the precipitation of Mg2Sn would be small as well.
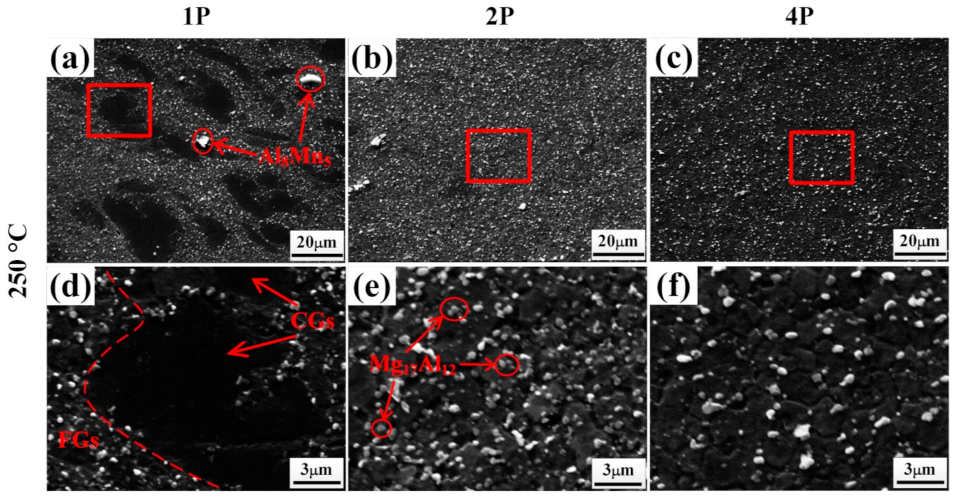
Figure 5 shows SEM images of samples deformed at 250 °C, with the dp and fp of the secondary-phase partials summarized in Table 1. Combined with the XRD in Figure 4, Al8Mn5 particles with sizes of 5–10 μm could be observed in the 250 °C–1P sample (Figure 5a). Many ~400 nm spot-shaped Mg17Al12 phases precipitated in the area of fine grains, while almost no phase particles were inside the elongated deformed grains. Upon increasing the ECAP passes to two, the particle distribution became more uniform, and many Mg17Al12 particles were located at the grain boundaries, while large Al8Mn5 particles were broken (Figure 5b). After four passes, no large Al8Mn5 particles remained (Figure 5c). During ECAP deformation, fine fragmented Al8Mn5 and sub-micron Mg17Al12 particles could pin the boundaries and hinder the growth of recrystallized grains effectively [35,36].
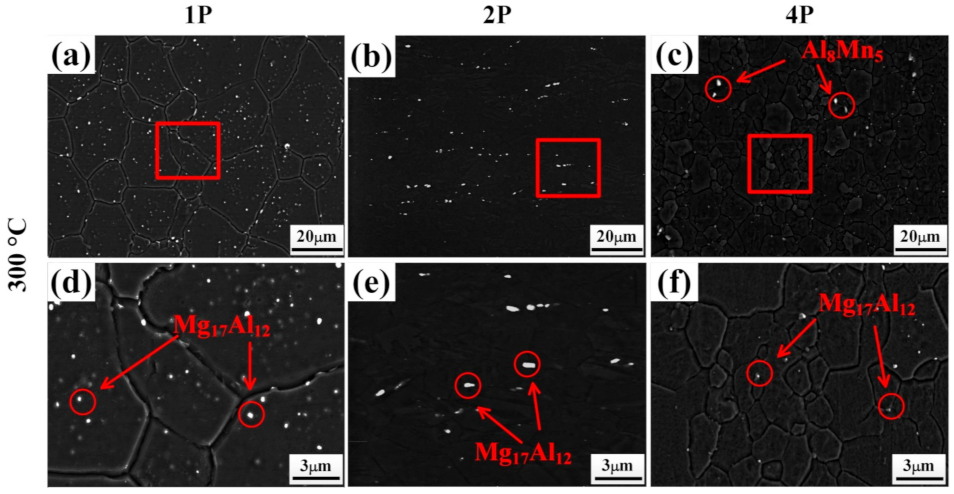
Similarly, Figure 6 shows the SEM images of samples deformed at 300 °C. For the 300 °C–1P sample, secondary-phase particles with fp of 5% precipitated. With the ECAP passes increasing, the fp of the secondary-phase particles decreased gradually. As shown in Figure 6c, a few Mg17Al12 phases with a dp of 350 nm precipitated at the grain boundaries in the 300 °C–4P sample. Compared with the 250 °C samples, less particles precipitated (Figure 6a–c), which led to a larger grain size for the samples deformed at 300 °C.
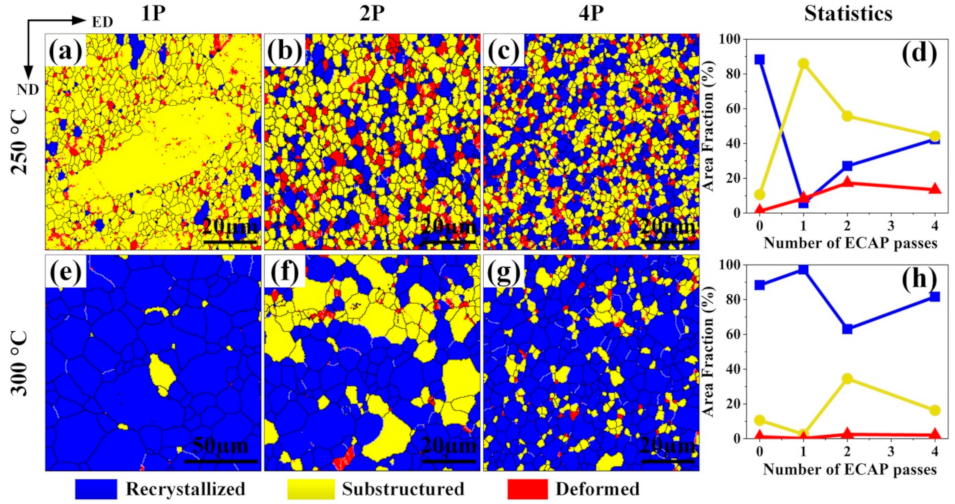
Fractions of recrystallized grains in ECAP-processed samples were evaluated from the EBSD results (Figure 7), in which grains with misorientation angles less than 2°, between 2° and 15°, and above 15° were defined as deformed grains, substructured grains, and recrystallized grains, respectively. In the 250 °C–1P sample, most grains were substructured grains (Figure 7a). Upon increasing the ECAP passes to two and four, more fully recrystallized grains formed. For samples deformed by ECAP at 300 °C, the fractions of recrystallized grains were much higher compared to the 250 °C samples. Normally, the values of critical resolved shear stress (CRSS) for the activation of non-basal slip at RT are much larger than those for basal slip. It was found that upon increasing the temperature over 200 °C, the non-basal dislocation was energetically more favorable to move. In addition, adding the Sn element to Mg alloys can also promote the activity of non-basal slip [7]. Furthermore, compared to basal dislocations, the non-basal dislocations have a higher probability to lock with each other and then form dislocation tangles [37]. Thus, at the early stage of 250 °C–CAP, more sub-grain boundaries formed. At the same time, due to the pinning of precipitated particles, sub-grain boundaries were hindered from migrating, leading to more sub-grain structures in the 250 °C–ECAP samples.
For samples deformed at 300 °C, although dislocation slip was promoted, annihilation of dislocations was also accelerated, leading to fewer dislocation tangles and fewer nucleation sites for the secondary phase particles. Therefore, sub-grain boundaries can migrate easily due to fewer precipitated particles, resulting in larger grain sizes compared to the 250 °C–ECAP samples.
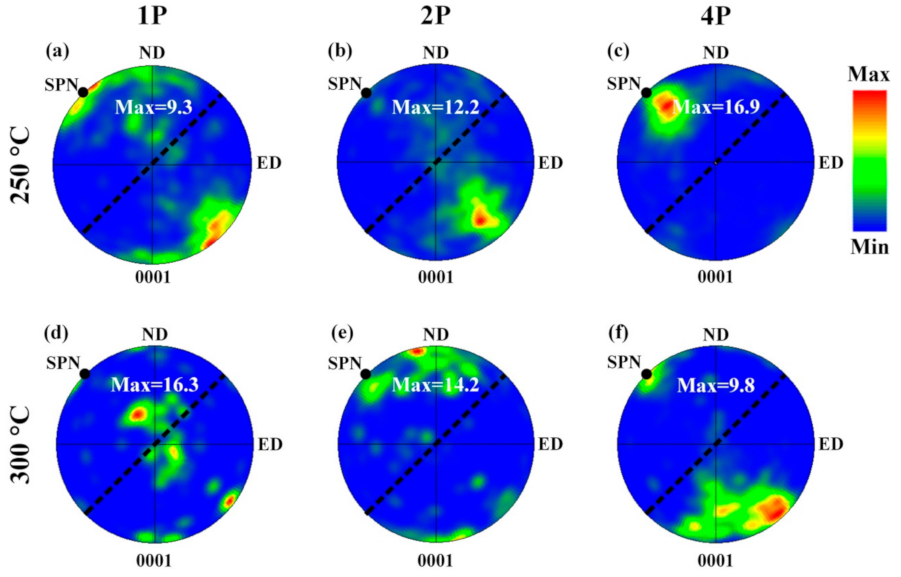
Figure 8 shows the {0001} pole figures of the 250 °C ECAP samples and 300 °C ECAP samples. In contrast with the intensive basal texture formed during extrusion, ECAP deformation generated non-basal texture components. After 1P–ECAP at 250 °C, the basal planes of most grains moved towards the shear plane (Figure 3a), which was consistent with the results of [38]. Therefore, the c-axes of these grains were approximately parallel to the normal direction of the shear plane, which caused the poles in the {0001} pole figure to rotate to a position at 45° with ND and ED, that is a 45° texture. The reason for the formation of the 45° texture may relate to slip planes of prevailing slip systems rotating towards the shear planes (SP) during ECAP [37].
Upon increasing the ECAP passes to two, the maximum intensity of the 45° texture decreased. Coarse grains with the 45° texture evolved into fine recrystallized grains with random orientations, leading to a decrease of the maximum intensity of the 45° texture. For the 250 °C–4P sample, the intensity of the 45° texture increased, mainly because basal slip was more active.
Compared with the 250°C–1P sample, the distribution of grain orientations of the 300 °C–1P sample was quite different (Figure 8d). It can be seen that the c-axes of some grains rotated towards TD, which was due to the preferred growth of grains with a TD orientation. After two passes at 300 °C, the concentration of the c-axes at ND may be related to the pyramidal slip [39]. Upon further increasing the ECAP passes to four at 300 °C, the maximum intensity was located nearly at 45° as a result of the basal slip of most grains.
3.2. Mechanical Properties of ECAP Samples
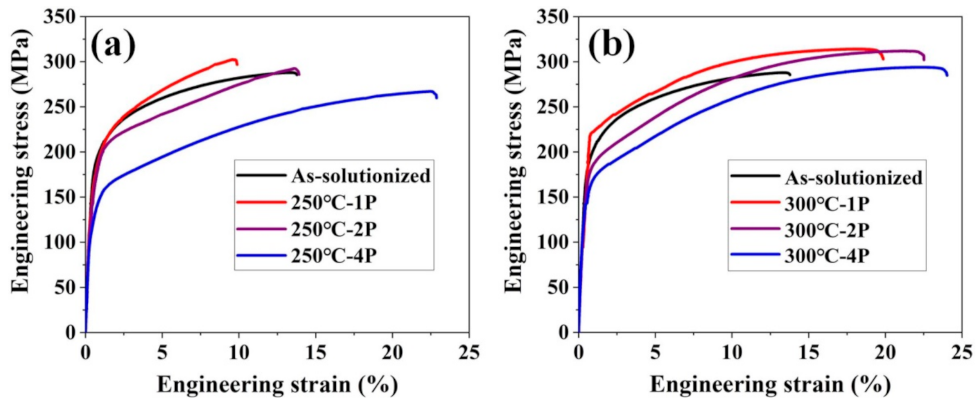
Figure 9 shows the tensile test results of the 1P, 2P, and 4P ECAP samples, and the corresponding values are shown in Table 2. For the 250 °C and 300 °C–ECAP samples, although the dave decreased, the corresponding yield strengths decreased. Thus, we needed to consider the change of other strengthening mechanisms that influence the yield strength, i.e., precipitation strengthening Δσp, solution strengthening Δσp, and dislocation strengthening Δσp.
Precipitation strengthening (Δσp) can be calculated through the Orowan equation [40]:
where M is the Taylor factor (2.5 [41] ), G is the shear modulus (1.66 × 10⁴ MPa for Mg [41]), b is the Burgers vector (3.2 × 10⁻¹⁰ m for Mg [41]), v is Poisson’s ratio (0.35 for Mg [41]), and dp and fp are the average phase particles’ size and the volume fraction of particles, respectively.
Solution strengthening for the ATZ611 alloy was mainly caused by Al, Zn, and Sn solute atoms. Solution strengthening (Δσs) was calculated by Equation (2) according to the Deruyttere and Gypen theoretical model [42]:
where kAl is 196 MPa (at.)−2/3 [43], kZn is 905 MPa (at.)−2/3 [43], kSn is 52 MPa (at.)−2/3 [42], and n is constant as 2/3 [44]. In this work, we assumed that ~6 wt.% Al, ~1 wt.% Zn, and ~0.9 wt.% Sn atoms were in a solid solution for the as-solutionized samples. Because of the precipitation of the secondary phase during ECAP deformation at 250 °C and 300 °C, approximately 3 wt.% Al and ~1 wt.% Zn atoms were assumed to be in the solid solution for the 250 °C sample, while ~6 wt.% Al, ~1 wt.% Zn, and ~0.9 wt.% Sn were assumed to be in the solid solution for the 300 °C sample. The values of solution strengthening were estimated to be ~31 MPa for 250 °C samples and ~40 MPa for 300 °C samples
The dislocation strengthening was calculated according to the Taylor formula:
where ρ is the dislocation density. The parameter α was 0.6 for basal–basal dislocation interaction. The dislocation density ρ of each sample was the geometric necessary dislocation density, which was obtained from the EBSD results, as shown in Table 1.
The strength increase caused by secondary-phase particles, dislocations, and solution atoms were subtracted from the measured yield strength (Table 3), and σ0.2 − (Δσp + Δσs + Δσd) should be mainly attributed to grain boundary strengthening. From 3.1, it was found that dave decreased with the increase of ECAP passes, which should lead to an increase of grain boundary strengthening, i.e., σ0.2 − (Δσp + Δσs + Δσd). However, as shown in Table 3, the calculated σ0.2 − (Δσp + Δσs + Δσd) values showed a different trend, which could be related to the change of the H-P coefficient k caused by textures [45]. Texture affects k mainly by changing the proportion of different slip modes [45]. If the basal planes of most grains were parallel to the theoretical shear plane and the tensile force was along ED at the same time, it would be easier to activate basal slip, which would result in a smaller k value. Thus, the decrease in σ0.2 − (Δσp + Δσs + Δσd) was a result of the reduction of k. Moreover, for the 300 °C-1P sample, in addition to the 45° texture, concentrated poles around TD could be observed. Basal slips were less easy for these “TD”-orientation grains during tension along the ED, resulting in a higher k value and thus the larger value of σ0.2 − (Δσp + Δσs + Δσd).
4. Conclusions
The influence of ECAP deformation temperatures (250 °C and 300 °C) on the microstructure, texture, and mechanical properties of a Mg-6Al-1Zn-0.9Sn alloy was studied. The main conclusions are as follows:
1. The smallest dave of ~1.9 μm was obtained after 4P ECAP at 250 °C. Different rates of grain refinement at 250 °C and 300 °C were caused by the different amounts of precipitated secondary-phase particles.
2. The strong basal texture in as-solutionized alloy transformed to a non-basal texture during ECAP, with {0001} planes inclined ~45° to ED. Compared to the 250 °C sample, c-axes of grains in the 300 °C sample rotated to 45° at a slower rate.
3. The yield strength of the as-ECAPed alloys was significantly lower than that of the as-solutionized alloy. The formation of 45° textures facilitated the activation of basal slips, which resulted in a low value of H-P coefficient k. The yield strength of the as-ECAPed alloys decreased greatly as the K value became smaller.
Author Contributions
Each author equally contributed to the paper. Conceptualization, H.X., Z.-P.G., P.-Y.Z. and P.-K.M.; data curation, Z.-P.G., Y.Z. and P.-Y.Z.; formal analysis, H.X., Z.-P.G. and P.-Y.Z.; funding acquisition, H.X.; investigation, Z.-P.G., Y.Z. and P.-Y.Z.; methodology, H.X., Z.-P.G., P.-Y.Z. and P.-K.M.; project administration, H.X.; resources, Y.Z. and P.-Y.Z.; supervision, H.X. and P.-K.M.; validation, Z.-P.G. and P.-Y.Z.; visualization, Z.-P.G. and P.-Y.Z.; writing—original draft preparation, Z.-P.G. and P.-Y.Z.; writing—review and editing, H.X., Z.-P.G., P.-Y.Z. and P.-K.M. All authors read and agreed to the published version of the manuscript.
Funding
Acknowledgement is given to the financial support from the Science and Technology Development Program of Jilin Province (No. 20190302060GX).
Institutional Review Board Statement
Not applicable.
Informed Consent Statement
Not applicable.
Data Availability Statement
Data sharing not applicable. No new data were created or analyzed in this study. Data sharing is not applicable to this article.
Conflicts of Interest
The authors declare no conflict of interest.
Abbreviations
| dave | Average grain size |
| dp | Average grain size of secondary-phase particles |
| fp | Secondary-phase particle fraction |
| ρ | Dislocation density |
| σ0.2 | Yield strength |
| σb | Tensile strength |
| δp | Elongation |
| Δσp | Precipitation strengthening |
| Δσs | Solution strengthening |
| Δσd | Dislocation strengthening |
References
- Gautam, P.C.; Biswas, S. On the possibility to reduce ECAP deformation temperature in magnesium: Deformation behaviour, dynamic recrystallization and mechanical properties. Mater. Sci. Eng. A 2021, 812, 141103. [Google Scholar] [CrossRef]
- Pollock, T.M. Weight loss with magnesium alloys. Science 2010, 328, 986–987. [Google Scholar] [CrossRef] [PubMed]
- Minárik, P.; Zemková, M.; Veselý, J.; Bohlen, J.; Knapek, M.; Král, R. The effect of Zr on dynamic recrystallization during ECAP processing of Mg-Y-RE alloys. Mater. Charact. 2021, 174, 111033. [Google Scholar] [CrossRef]
- Zhang, S.H.; Zhang, K.; Xu, Y.C.; Wang, Z.T.; Xu, Y.; Wang, Z.G. Deep-drawing of magnesium alloy sheets at warm temperatures. J. Mater. Process. Technol. 2007, 185, 147–151. [Google Scholar] [CrossRef]
- Khomamizadeh, F.; Nami, B.; Khoshkhooei, S. Effect of rare-earth element additions on high-temperature mechanical properties of AZ91 magnesium alloy. Metall. Mater. Trans. A 2005, 36, 3489–3494. [Google Scholar] [CrossRef]
- Lü, Y.Z.; Wang, Q.D.; Zeng, X.Q.; Ding, W.J.; Zhai, C.Q.; Zhu, Y.P. Effects of rare earths on the microstructure, properties and fracture behavior of Mg-Al alloys. Metall. Mater. Trans. A 2000, 278, 66–76. [Google Scholar] [CrossRef]
- Wang, H.Y.; Zhang, N.; Wang, C.; Jiang, Q.C. First-principles study of the generalized stacking fault energy in Mg-3Al-3Sn alloy. Scr. Mater. 2011, 65, 723–726. [Google Scholar] [CrossRef]
- Kang, D.H.; Park, S.S.; Kim, N.J. Development of creep resistant die cast Mg-Sn-Al-Si alloy. Metall. Mater. Trans. A 2005, 413, 555–560. [Google Scholar] [CrossRef]
- Wang, Y.M.; Chen, M.W.; Zhou, F.H.; Ma, E. High tensile ductility in a nanostructured metal. Nature 2002, 419, 912–915. [Google Scholar] [CrossRef]
- Zhang, T.T.; Cui, H.W.; Cui, X.L.; Zhao, E.T.; Pan, Y.K.; Feng, R.; Jia, Q.R.; Zhao, J. Ductility enhancement in an as-extruded Mg-5.5Zn-0.8Zr alloy by Sm alloying. J. Alloy. Compd. 2019, 784, 1130–1138. [Google Scholar] [CrossRef]
- Sanyal, S.; Kanodia, S.; Saha, R.; Bandyopadhyay, T.K.; Mandal, S. Influence of hard plate hot forging temperature on the microstructure, texture and mechanical properties in a lean Mg-Zn-Al alloy. J. Alloy. Compd. 2019, 800, 343–354. [Google Scholar] [CrossRef]
- Hono, K.; Mendis, C.L.; Sasaki, T.T.; Ohishi, K. Towards the development of heat-treatable high-strength wrought Mg alloys. Scr. Mater. 2010, 63, 710–715. [Google Scholar] [CrossRef]
- Zhu, S.Q.; Yan, H.G.; Liao, X.Z.; Moody, S.J.; Sha, G.; Wu, Y.Z.; Ringer, S.P. Mechanisms for enhanced plasticity in magnesium alloys. Acta Mater. 2015, 82, 344–355. [Google Scholar] [CrossRef]
- Wang, X.J.; Xu, D.K.; Wu, R.Z.; Chen, X.B.; Peng, Q.M.; Jin, L.; Xin, Y.C.; Zhang, Z.Q.; Liu, Y.; Chen, X.H.; et al. What is going on in magnesium alloys? J. Mater. Sci. Technol. 2018, 34, 245–247. [Google Scholar] [CrossRef]
- Fu, Y.T.; Sun, J.P.; Yang, Z.Q.; Xu, B.Q.; Han, J.; Chen, Y.F.; Jiang, J.H.; Ma, A.B. Aging behavior of a fine-grained Mg-10.6Gd-2Ag alloy processed by ECAP. Mater. Charact. 2020, 165, 110398. [Google Scholar] [CrossRef]
- Manjunath, G.K.; Udaya Bhat, K.; Preetham Kumar, G.V.; Ramesh, M.R. Microstructure and Wear Performance of ECAP Processed Cast Al-Zn-Mg Alloys. Trans. Indian Inst. Met. 2018, 71, 1919–1931. [Google Scholar] [CrossRef]
- Figueiredo, R.B.; Langdon, T.G. Principles of grain refinement in magnesium alloys processed by equal-channel angular pressing. J. Mater. Sci. 2009, 44, 4758–4762. [Google Scholar] [CrossRef]
- Azushima, A.; Kopp, R.; Korhonen, A.; Yang, D.; Micari, F.; Lahoti, G.; Groche, P.; Yanagimoto, J.; Tsuji, N.; Rosochowski, A.; et al. Severe plastic deformation (SPD) processes for metals. CIRP Ann. 2008, 57, 716–735. [Google Scholar] [CrossRef]
- Gopi, K.R.; Nayaka, H.S.; Sahu, S. Corrosion Behavior of ECAP-Processed AM90 Magnesium Alloy. Arab. J. Sci. Eng. 2018, 43, 4871–4878. [Google Scholar] [CrossRef]
- Lei, W.; Zhang, H. Analysis of microstructural evolution and compressive properties for pure Mg after room-temperature ECAP. Mater. Lett. 2020, 271, 127781. [Google Scholar] [CrossRef]
- Shan, Z.; Yang, J.; Fan, J.; Zhang, H.; Zhang, Q.; Wu, Y.; Li, W.; Dong, H.; Xu, B. Extraordinary mechanical properties of AZ61 alloy processed by ECAP with 160° channel angle and EPT. J. Magnes. Alloys 2021, 9, 548–559. [Google Scholar] [CrossRef]
- Sun, J.; Xu, B.; Yang, Z.; Zhuo, X.; Han, J.; Wu, Y.; Song, D.; Liu, H.; Jiang, J.; Ma, A. Developing an industrial-scale ECAP Mg-Al-Zn alloy with multi-heterostructure for synchronously high strength and good ductility. Mater. Charact. 2020, 164, 110341. [Google Scholar] [CrossRef]
- Huang, H.; Liu, H.; Wang, C.; Sun, J.; Bai, J.; Xue, F.; Jiang, J.; Ma, A. Potential of multi-pass ECAP on improving the mechanical properties of a high-calcium-content Mg-Al-Ca-Mn alloy. J. Magnes. Alloys 2019, 7, 617–627. [Google Scholar] [CrossRef]
- Xu, B.; Sun, J.; Yang, Z.; Xiao, L.; Zhou, H.; Han, J.; Liu, H.; Wu, Y.; Yuan, Y.; Zhuo, X.; et al. Microstructure and anisotropic mechanical behavior of the high-strength and ductility AZ91 Mg alloy processed by hot extrusion and multi-pass RD-ECAP. Mater. Sci. Eng. A 2020, 780, 139191. [Google Scholar] [CrossRef]
- Xu, Q.; Ma, A.; Li, Y.; Saleh, B.; Yuan, Y.; Jiang, J.; Ni, C. Enhancement of Mechanical Properties and Rolling Formability in AZ91 Alloy by RD-ECAP Processing. Materials 2019, 12, 3503. [Google Scholar] [CrossRef] [Green Version]
- Gopi, K.R.; Shivananda Nayaka, H.; Sahu, S. Microstructural Evolution and Strengthening of AM90 Magnesium Alloy Pro-cessed by ECAP. Arab. J. Sci. Eng. 2017, 42, 4635–4647. [Google Scholar] [CrossRef]
- Sarebanzadeh, M.; Roumina, R.; Mahmudi, R.; Wu, G.H.; Jafari Nodooshan, H.R. Enhancement of superplasticity in a fi-ne-grained Mg-3Gd-1Zn alloy processed by equal-channel angular pressing. Mater. Sci. Eng. A 2015, 646, 249–253. [Google Scholar] [CrossRef]
- Mostaed, E.; Fabrizi, A.; Dellasega, D.; Bonollo, F.; Vedani, M. Grain size and texture dependence on mechanical properties, asymmetric behavior and low temperature superplasticity of ZK60 Mg alloy. Mater. Charact. 2015, 107, 70–78. [Google Scholar] [CrossRef]
- Mostaed, E.; Fabrizi, A.; Dellasega, D.; Bonollo, F.; Vedani, M. Microstructure, mechanical behavior and low temperature superplasticity of ECAP processed ZM21 Mg alloy. J. Alloys Compd. 2015, 638, 267–276. [Google Scholar] [CrossRef]
- Liao, Q.Y.; Hu, W.X.; Le, Q.C.; Chen, X.R.; Hu, K.; Cheng, C.L.; Hu, C.L. Microstructure, Mechanical Properties and Texture Evolution of Mg-Al-Zn-La-Gd-Y Magnesium Alloy by Hot Extrusion and Multi-Pass Rolling. Acta Metall. Sin. 2020, 33, 1359–1368. [Google Scholar] [CrossRef]
- Park, S.H.; Kim, S.-H.; Yu, H.; Kim, H.S.; You, B.S. Anisotropic compressive behavior of extruded Mg alloy plates with different width–thickness ratios. Mater. Sci. Eng. A 2016, 675, 11–18. [Google Scholar] [CrossRef]
- Dogan, E.; Wang, S.; Vaughan, M.W.; Karaman, I. Dynamic precipitation in Mg-3Al-1Zn alloy during different plastic de-formation modes. Acta Mater. 2016, 116, 1–13. [Google Scholar] [CrossRef]
- Guo, F.; Zhang, D.; Yang, X.; Jiang, L.; Pan, F. Strain-induced dynamic precipitation of Mg17Al12 phases in Mg–8Al alloys sheets rolled at 748 K. Mater. Sci. Eng. A 2015, 636, 516–521. [Google Scholar] [CrossRef]
- Jo, S.M.; Kim, S.D.; Kim, T.-H.; Go, Y.; Yang, C.-W.; You, B.S.; Kim, Y.M. Sequential precipitation behavior of Mg17Al12 and Mg2Sn in Mg-8Al-2Sn-1Zn alloys. J. Alloys Compd. 2018, 749, 794–802. [Google Scholar] [CrossRef]
- Robson, J.; Henry, D.; Davis, B. Particle effects on recrystallization in magnesium–manganese alloys: Particle-stimulated nucleation. Acta Mater. 2009, 57, 2739–2747. [Google Scholar] [CrossRef]
- Cheng, W.; Tian, L.; Wang, H.; Bian, L.; Yu, H. Improved tensile properties of an equal channel angular pressed (ECAPed) Mg-8Sn-6Zn-2Al alloy by prior aging treatment. Mater. Sci. Eng. A 2017, 687, 148–154. [Google Scholar] [CrossRef]
- Krajňák, T.; Minárik, P.; Gubicza, J.; Máthis, K.; Kužel, R.; Janeček, M. Influence of equal channel angular pressing routes on texture, microstructure and mechanical properties of extruded AX41 magnesium alloy. Mater. Charact. 2017, 123, 282–293. [Google Scholar] [CrossRef]
- Mukai, T.; Yamanoi, M.; Watanabe, H.; Higashi, K. Ductility enhancement in AZ31 magnesium alloy by controlling its grain structure. Scr. Mater. 2001, 45, 89–94. [Google Scholar] [CrossRef]
- Minárik, P.; Král, R.; Čížek, J.; Chmelík, F. Effect of different c/a ratio on the microstructure and mechanical properties in magnesium alloys processed by ECAP. Acta Mater. 2016, 107, 83–95. [Google Scholar] [CrossRef]
- Nie, J. Effects of precipitate shape and orientation on dispersion strengthening in magnesium alloys. Scr. Mater. 2003, 48, 1009–1015. [Google Scholar] [CrossRef]
- Kim, W.J.; Jeong, H.G.; Jeong, H.T. Achieving high strength and high ductility in magnesium alloys using severe plastic de-formation combined with low-temperature aging. Scr. Mater. 2009, 61, 1040–1043. [Google Scholar] [CrossRef]
- Shi, B.; Chen, R.; Ke, W. Solid solution strengthening in polycrystals of Mg–Sn binary alloys. J. Alloys Compd. 2011, 509, 3357–3362. [Google Scholar] [CrossRef]
- Gao, L.; Chen, R.; Han, E. Effects of rare-earth elements Gd and Y on the solid solution strengthening of Mg alloys. J. Alloys Compd. 2009, 481, 379–384. [Google Scholar] [CrossRef]
- Cheng, W.L.; Tian, Q.W.; Yu, H.; Zhang, H.; You, B.S. Strengthening mechanisms of indirect-extruded Mg–Sn based alloys at room temperature. J. Magnes. Alloys 2014, 2, 299–304. [Google Scholar] [CrossRef] [Green Version]
- Yu, H.; Xin, Y.; Wang, M.; Liu, Q. Hall-Petch relationship in Mg alloys: A review. J. Mater. Sci. Technol. 2018, 34, 248–256. [Google Scholar] [CrossRef]
Figure 1.
(a) Schematic of the ECAP process. (b) Samples for microstructure characterization and tensile tests.
Figure 1.
(a) Schematic of the ECAP process. (b) Samples for microstructure characterization and tensile tests.

Figure 2.
(a) IPF map, (b) {0001} pole figure, and (c) grain size distribution of the as-solutionized sample.
Figure 2.
(a) IPF map, (b) {0001} pole figure, and (c) grain size distribution of the as-solutionized sample.

Figure 3.
IPF maps of (a,b,c) 250 °C-ECAP samples and (d,e,f) 300 °C–ECAP samples. (a,d) 1 pass, (b,e) 2 passes, and (c,f) 4 passes.
Figure 3.
IPF maps of (a,b,c) 250 °C-ECAP samples and (d,e,f) 300 °C–ECAP samples. (a,d) 1 pass, (b,e) 2 passes, and (c,f) 4 passes.

Figure 4.
XRD results of the as-solutionized and the 250 °C and 300 °C ECAP samples. (a) 1 pass, 2 passes, 4 passes at 250 °C, (b) 1 pass, 2 passes, 4 passes at 300 °C.
Figure 4.
XRD results of the as-solutionized and the 250 °C and 300 °C ECAP samples. (a) 1 pass, 2 passes, 4 passes at 250 °C, (b) 1 pass, 2 passes, 4 passes at 300 °C.

Figure 5.
SEM images of ECAP samples deformed at 250 °C: (a,d) 1 pass, (b,e) 2 passes, and (c,f) 4 passes. (d–f) are the high-magnification images of (a–c), respectively.
Figure 5.
SEM images of ECAP samples deformed at 250 °C: (a,d) 1 pass, (b,e) 2 passes, and (c,f) 4 passes. (d–f) are the high-magnification images of (a–c), respectively.

Figure 6.
SEM images of ECAP samples at 300 °C: (a,d) 1 pass, (b,e) 2 passes, and (c,f) 4 passes. (d–f) are the high-magnification images of (a–c), respectively.
Figure 6.
SEM images of ECAP samples at 300 °C: (a,d) 1 pass, (b,e) 2 passes, and (c,f) 4 passes. (d–f) are the high-magnification images of (a–c), respectively.

Figure 7.
Recrystallization maps of 250 °C ECAP samples (a–d) and 300 °C ECAP samples (e–h). (a,e) One pass, (b,f) two passes, (c,g) four passes, and (d,h) the flow curves of recrystallization tendency.
Figure 7.
Recrystallization maps of 250 °C ECAP samples (a–d) and 300 °C ECAP samples (e–h). (a,e) One pass, (b,f) two passes, (c,g) four passes, and (d,h) the flow curves of recrystallization tendency.

Figure 8.
{0001} pole figure of the 250 °C–ECAP samples and (d–f) 300 °C–ECAP samples. (a,d) One pass, (b,e) two passes, and (c,f) four passes. SP, SPN are abbreviations for shear plane and shear plane normal, respectively.
Figure 8.
{0001} pole figure of the 250 °C–ECAP samples and (d–f) 300 °C–ECAP samples. (a,d) One pass, (b,e) two passes, and (c,f) four passes. SP, SPN are abbreviations for shear plane and shear plane normal, respectively.

Figure 9.
Tensile engineering stress–strain curves of as-solutionized samples and ECAPed samples. (a) 1 pass, 2 passes, 4 passes at 250 °C, (b) 1 pass, 2 passes, 4 passes at 300 °C.
Figure 9.
Tensile engineering stress–strain curves of as-solutionized samples and ECAPed samples. (a) 1 pass, 2 passes, 4 passes at 250 °C, (b) 1 pass, 2 passes, 4 passes at 300 °C.


Table 1.
Microstructure characteristics of the ECAP samples.
| Sample | dave (μm) | dp (nm) | fp (%) | ρ (1012m−2) |
|---|---|---|---|---|
| As-solutionized | 26.2 | - | - | - |
| 250 °C–1P | 6.2 | 400 | 17 | 6.05 |
| 250 °C–2P | 3.6 | 500 | 20 | 2.96 |
| 250 °C–4P | 1.9 | 580 | 12 | 6.13 |
| 300 °C–1P | 16.5 | 430 | 5 | 1.14 |
| 300 °C–2P | 8.6 | 430 | 3 | 2.86 |
| 300 °C–4P | 5.5 | 350 | 2 | 2.23 |
Table 2.
Room temperature tensile properties of samples deformed at 250 °C and 300 °C.
| Sample | σ0.2 (MPa) | σb (MPa) | δp (%) |
|---|---|---|---|
| As-solutionized | 185 | 288 | 13.4 |
| 250 °C-1P | 165 | 302 | 9.5 |
| 250 °C-2P | 160 | 293 | 13.4 |
| 250 °C-4P | 124 | 267 | 22.6 |
| 300 °C-1P | 211 | 314 | 19.4 |
| 300 °C-2P | 166 | 312 | 22.1 |
| 300 °C-4P | 142 | 294 | 23.6 |
Table 3.
Contribution of different strengthening mechanisms to the yield strength of samples deformed at 250 °C and 300 °C.
Table 3.
Contribution of different strengthening mechanisms to the yield strength of samples deformed at 250 °C and 300 °C.
| Sample | Δσp (MPa) | Δσs (MPa) | Δσd (MPa) | (Δσp + Δσs + Δσd) (MPa) | σ0.2 − (Δσp + Δσs + Δσd) (MPa) |
|---|---|---|---|---|---|
| As-solutionized | - | 40 | - | 40 | 145 |
| 250 °C-1P | 36.5 | 31 | 20 | 87.5 | 77.5 |
| 250 °C-2P | 34.9 | 31 | 14 | 79.9 | 80.1 |
| 250 °C-4P | 19.8 | 31 | 13.5 | 65.3 | 60.7 |
| 300 °C-1P | 14.1 | 40 | 7.8 | 61.9 | 149.1 |
| 300 °C-2P | 9.9 | 40 | 12.4 | 62.3 | 103.7 |
| 300 °C-4P | 9.3 | 40 | 10 | 58.3 | 82.7 |
Publisher’s Note: MDPI stays neutral with regard to jurisdictional claims in published maps and institutional affiliations. |
© 2021 by the authors. Licensee MDPI, Basel, Switzerland. This article is an open access article distributed under the terms and conditions of the Creative Commons Attribution (CC BY) license (https://creativecommons.org/licenses/by/4.0/).
Share and Cite
MDPI and ACS Style
Xu, H.; Guo, Z.-P.; Zhang, P.-Y.; Zhou, Y.; Ma, P.-K. Influence of Texture on the Mechanical Properties of a Mg-6Al-1Zn-0.9Sn Alloy Processed by ECAP. Materials 2021, 14, 2664. https://doi.org/10.3390/ma14102664
AMA Style
Xu H, Guo Z-P, Zhang P-Y, Zhou Y, Ma P-K. Influence of Texture on the Mechanical Properties of a Mg-6Al-1Zn-0.9Sn Alloy Processed by ECAP. Materials. 2021; 14(10):2664. https://doi.org/10.3390/ma14102664
Chicago/Turabian StyleXu, Hong, Zhi-Peng Guo, Ping-Yu Zhang, You Zhou, and Pin-Kui Ma. 2021. "Influence of Texture on the Mechanical Properties of a Mg-6Al-1Zn-0.9Sn Alloy Processed by ECAP" Materials 14, no. 10: 2664. https://doi.org/10.3390/ma14102664
Note that from the first issue of 2016, this journal uses article numbers instead of page numbers. See further details here.