
Influence of Layer Thickness and Raster Angle on the Mechanical Properties of 3D-Printed PEEK and a Comparative Mechanical Study between PEEK and ABS

Abstract
:1. Introduction
2. Experimental Section


| Control Factors | Fixed Factors | ||||
|---|---|---|---|---|---|
| Factor | Level | Unit | Factor | Value | Unit |
| Layer thickness | 200 | mm | Build orientation | Y-direction (Flat) | - |
| 300 | mm | Fill pattern | Line | - | |
| 400 | mm | Air gap | 0 | mm | |
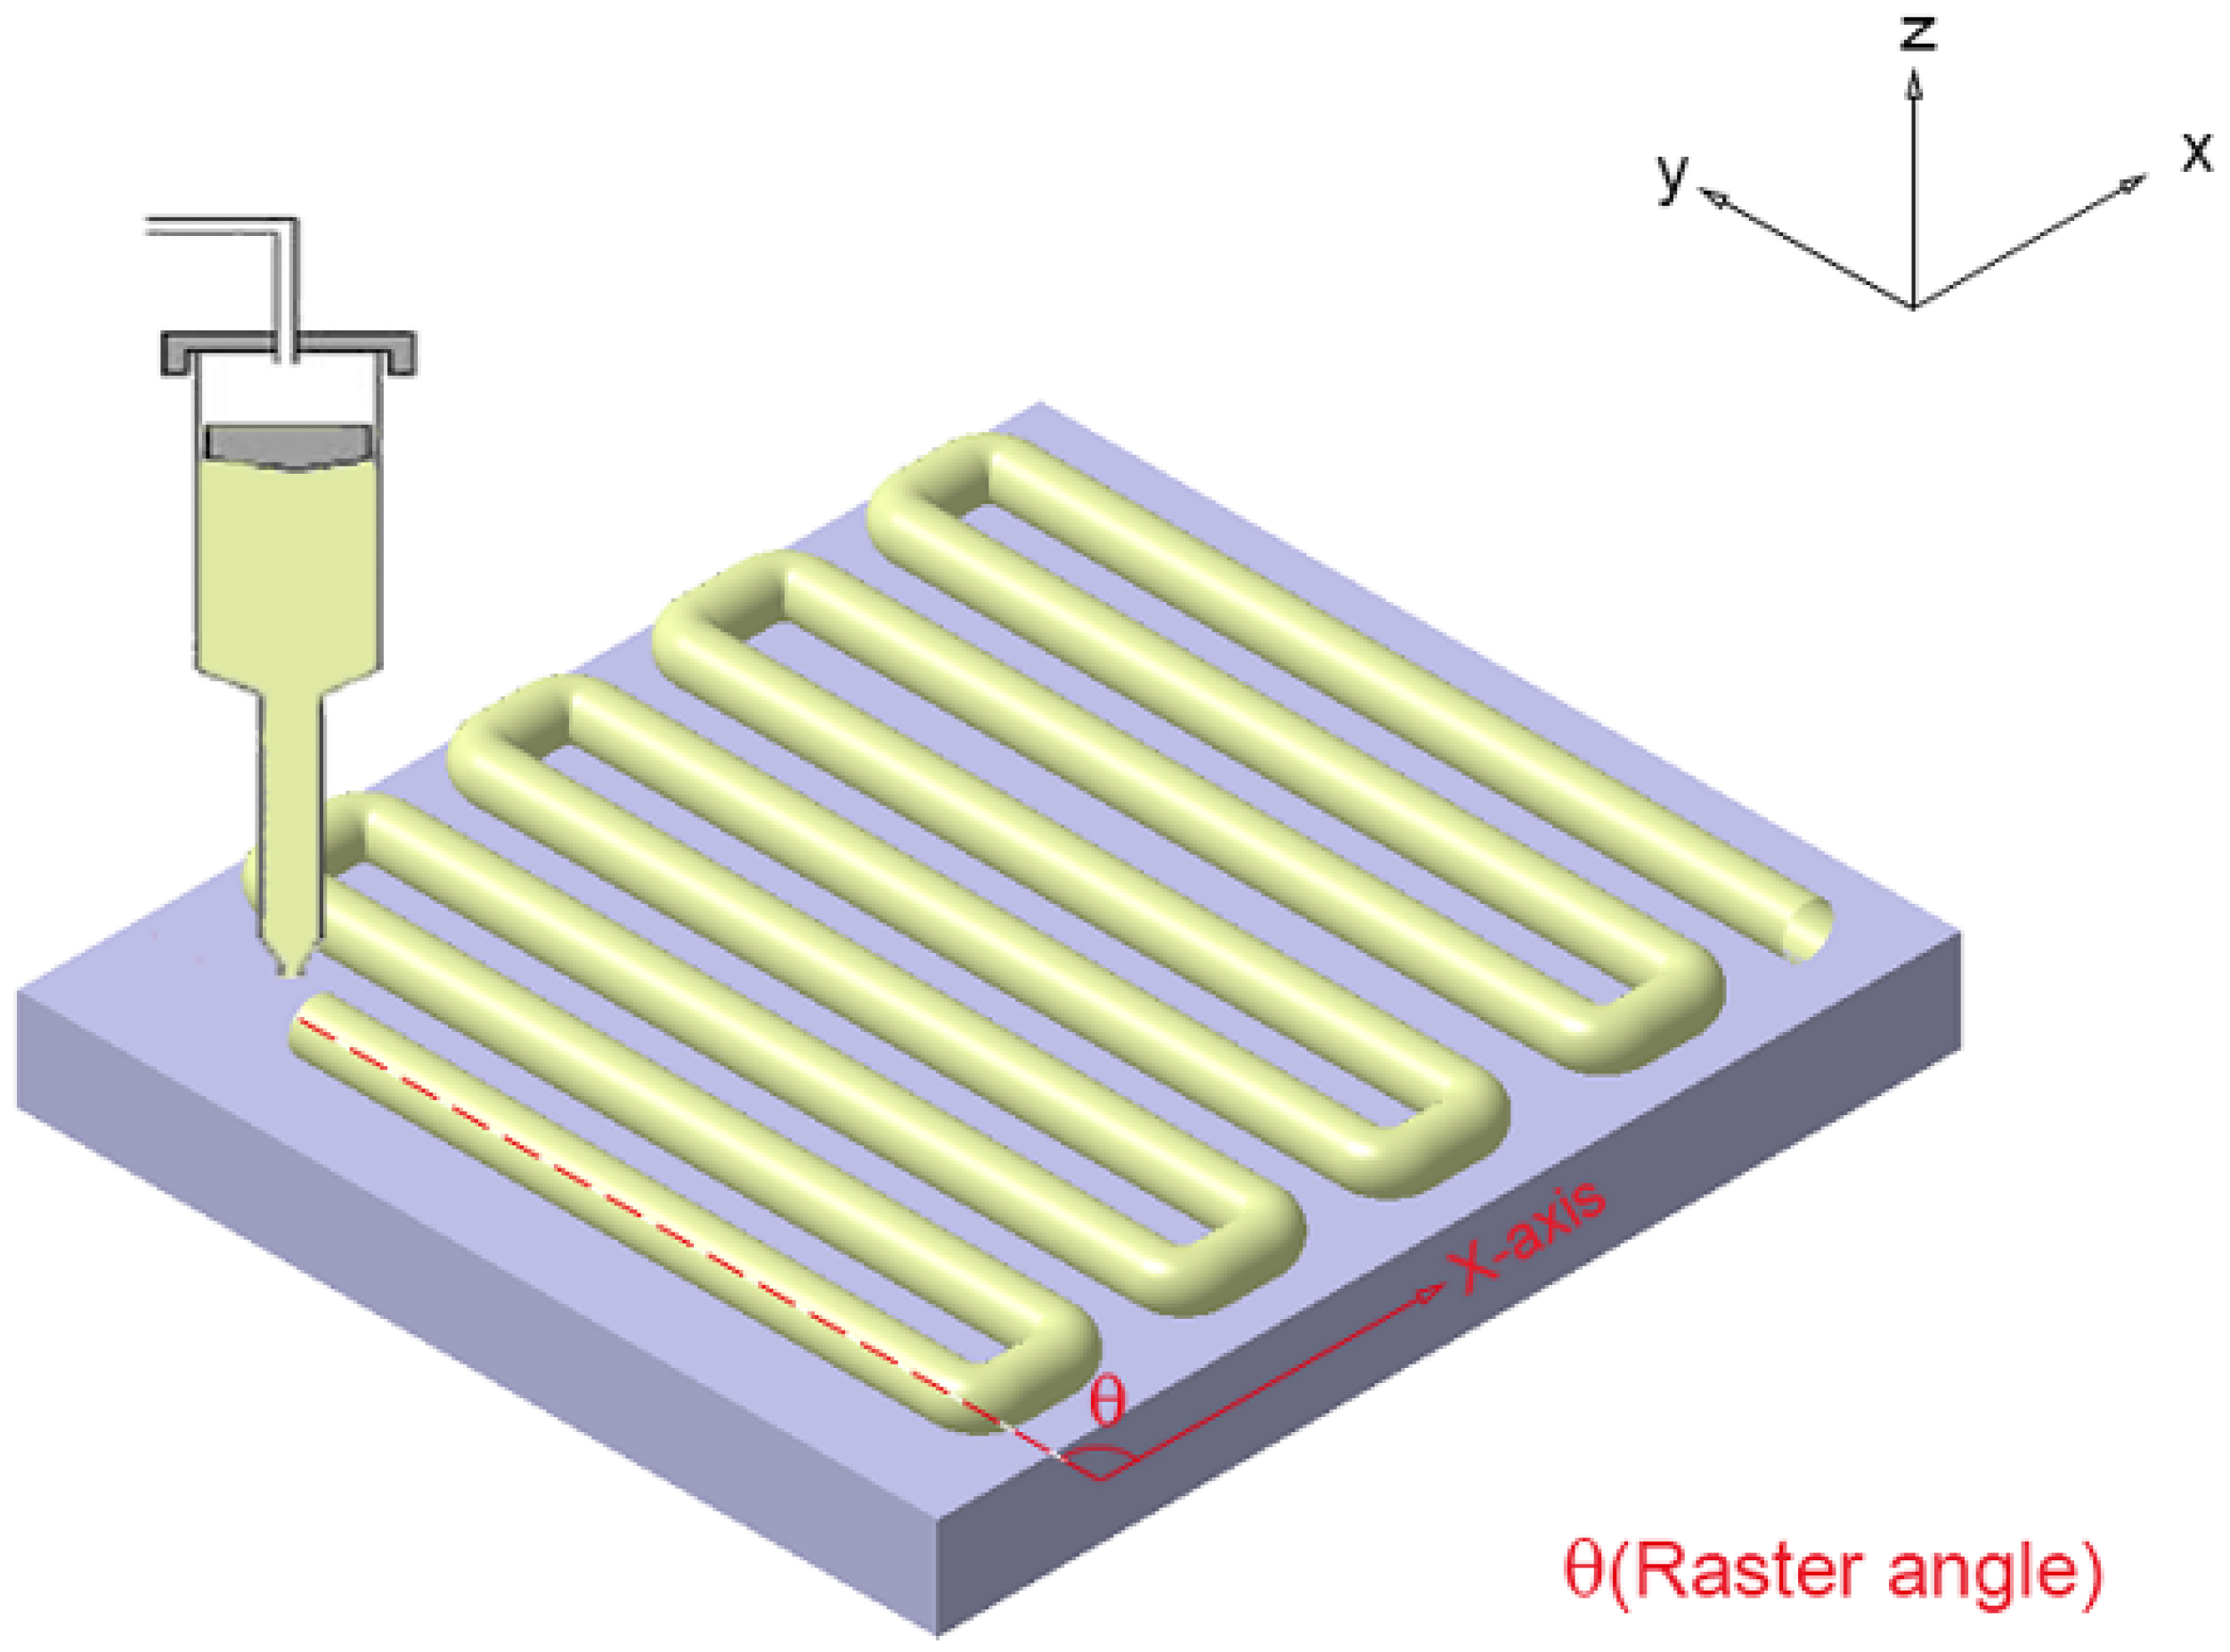
| Raster angle | 0 | ° | Number of contours | 2 | - |
| 30 | ° | Nozzle inner diameter | 0.4 | mm | |
| 45 | ° | ||||

| Factor | PEEK | ABS |
|---|---|---|
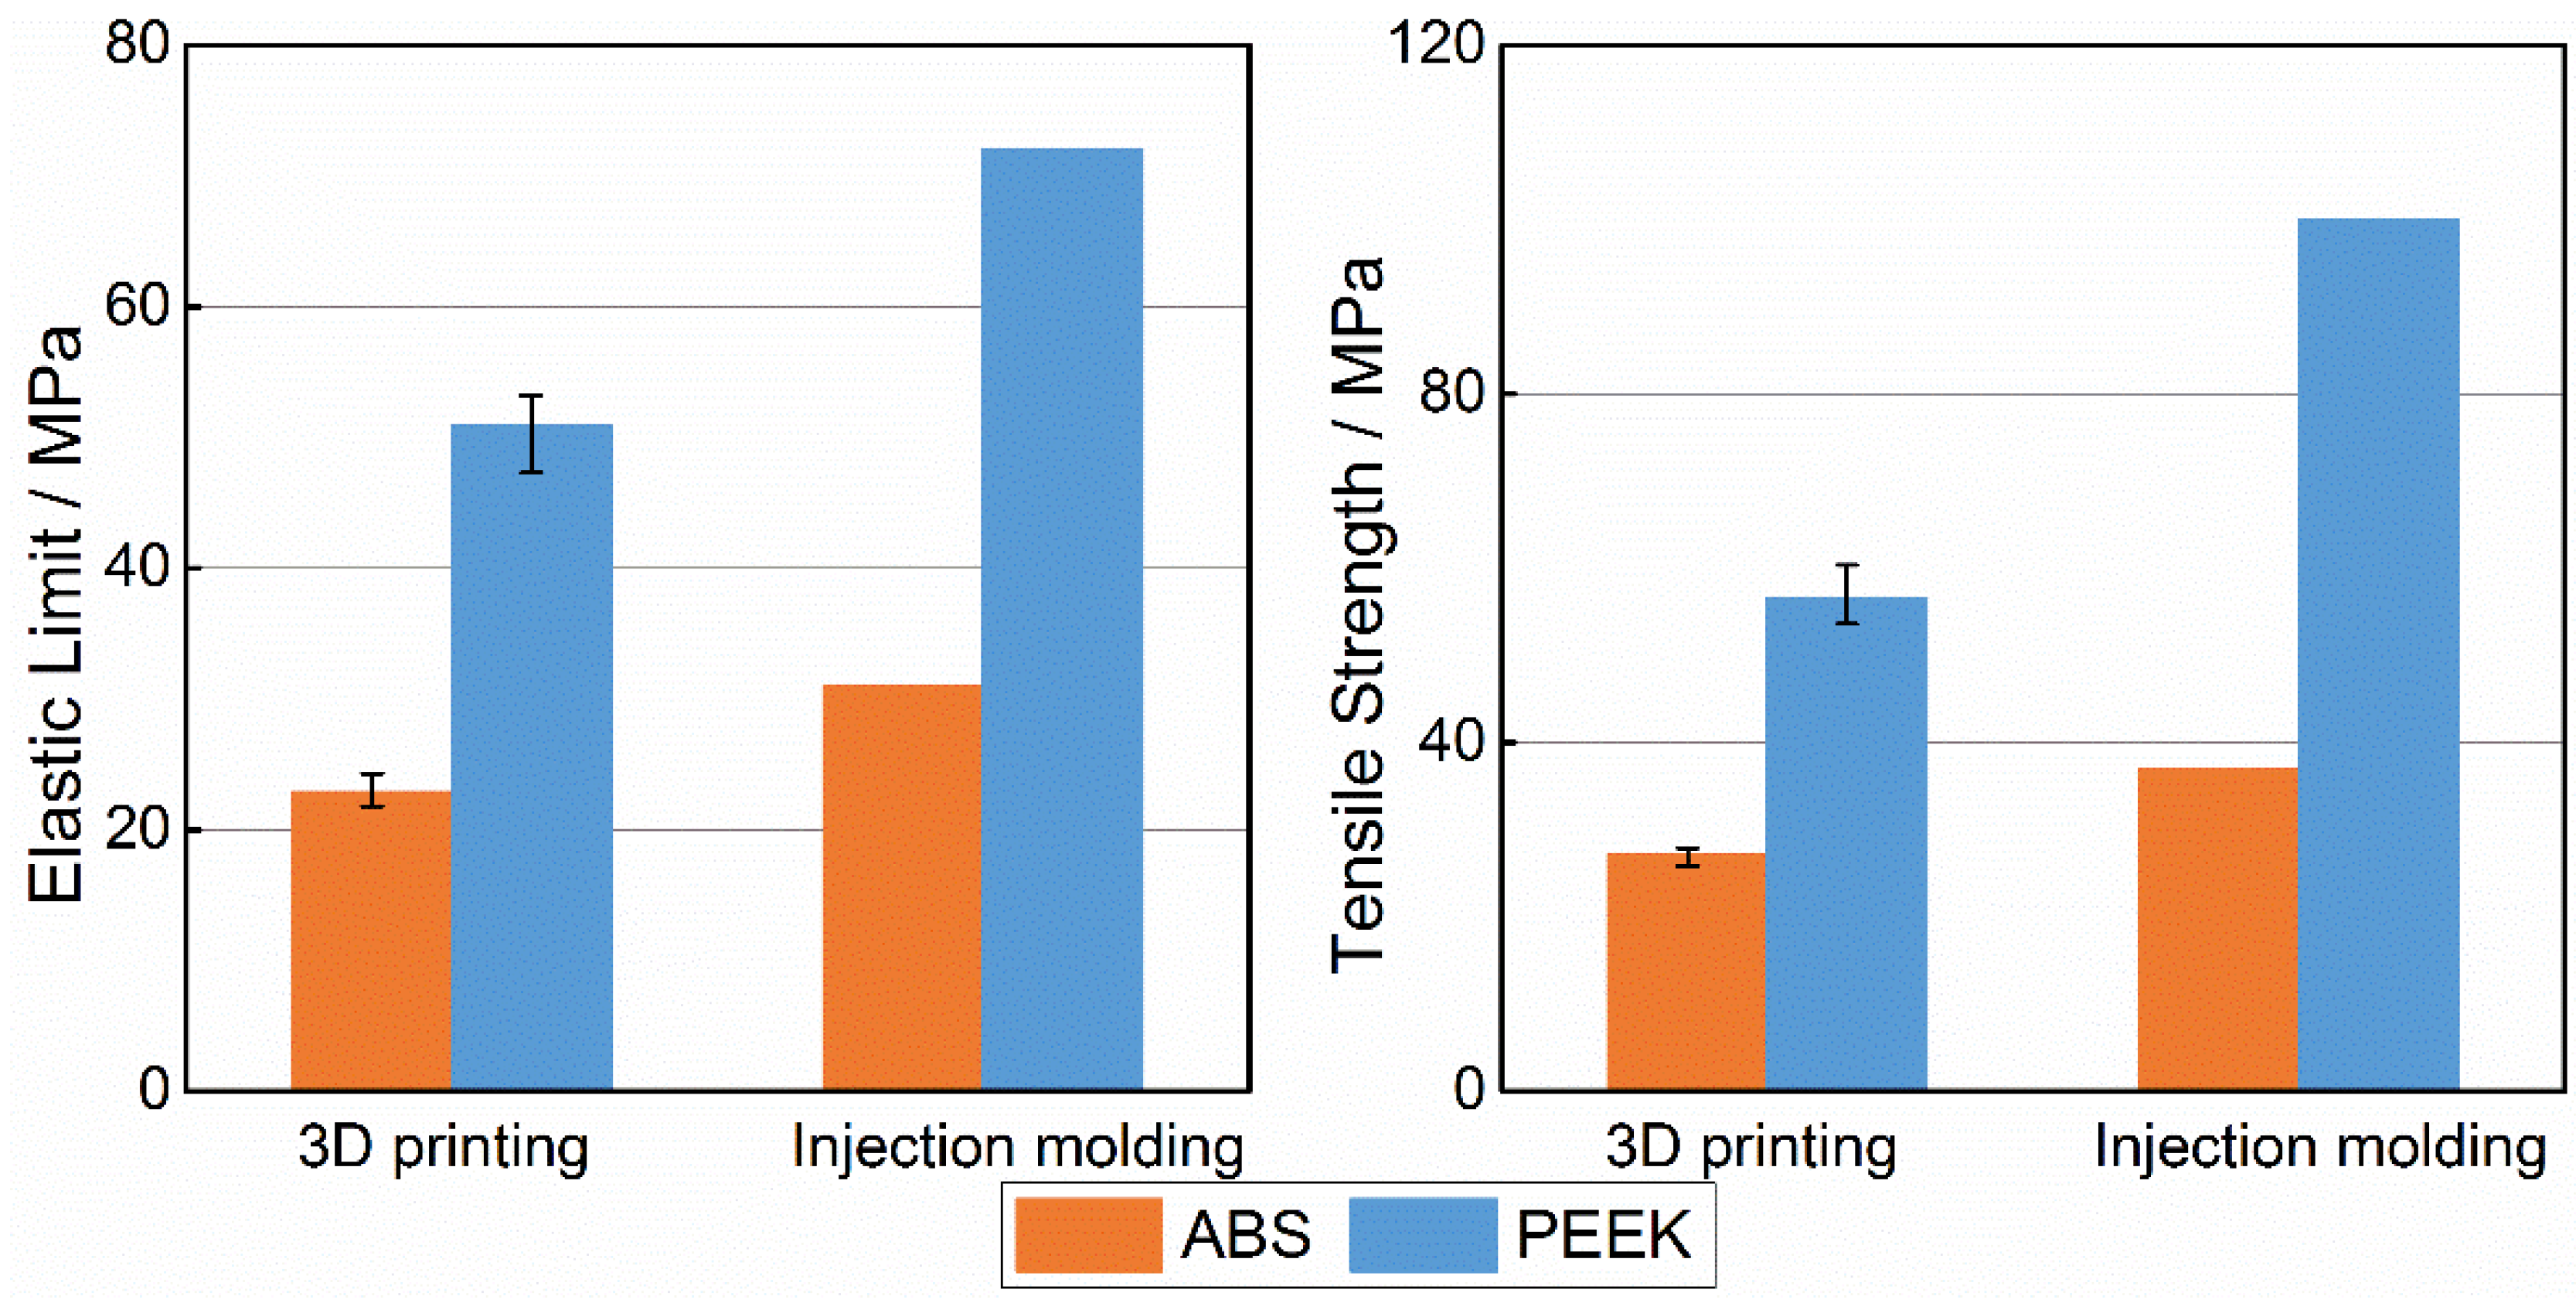
| Tensile Strength | 100.0 MPa | 37.0 MPa |
| Elastic Limit | 72.0 MPa | 31.0 MPa |
| Compressive Strength | 118.0 MPa | 37.0 MPa |
| Compressive Modulus | 3.8 GPa | 2.3 GPa |
| Bending Strength | 163.0 MPa | 53.0 MPa |
| Bending Modulus | 4.0 GPa | 2.2 GPa |
3. Results and Discussion
3.1. Influence of Layer Thickness and Raster Angle on Mechanical Properties of PEEK
| Factors | Tensile strength (MPa) | Bending strength (MPa) | Compressive strength (MPa) | |
|---|---|---|---|---|
| Layer Thickness (μm) | 200 | 40.1 | 52.1 | 53.6 |
| 300 | 56.6 | 56.1 | 60.9 | |
| 400 | 32.4 | 48.7 | 54.1 | |
| Raster Angle (°) | 0°/90° | 56.6 | 56.1 | - |
| 30°/−60° | 41.8 | 48.5 | - | |
| 45°/−45° | 43.3 | 43.2 | - | |
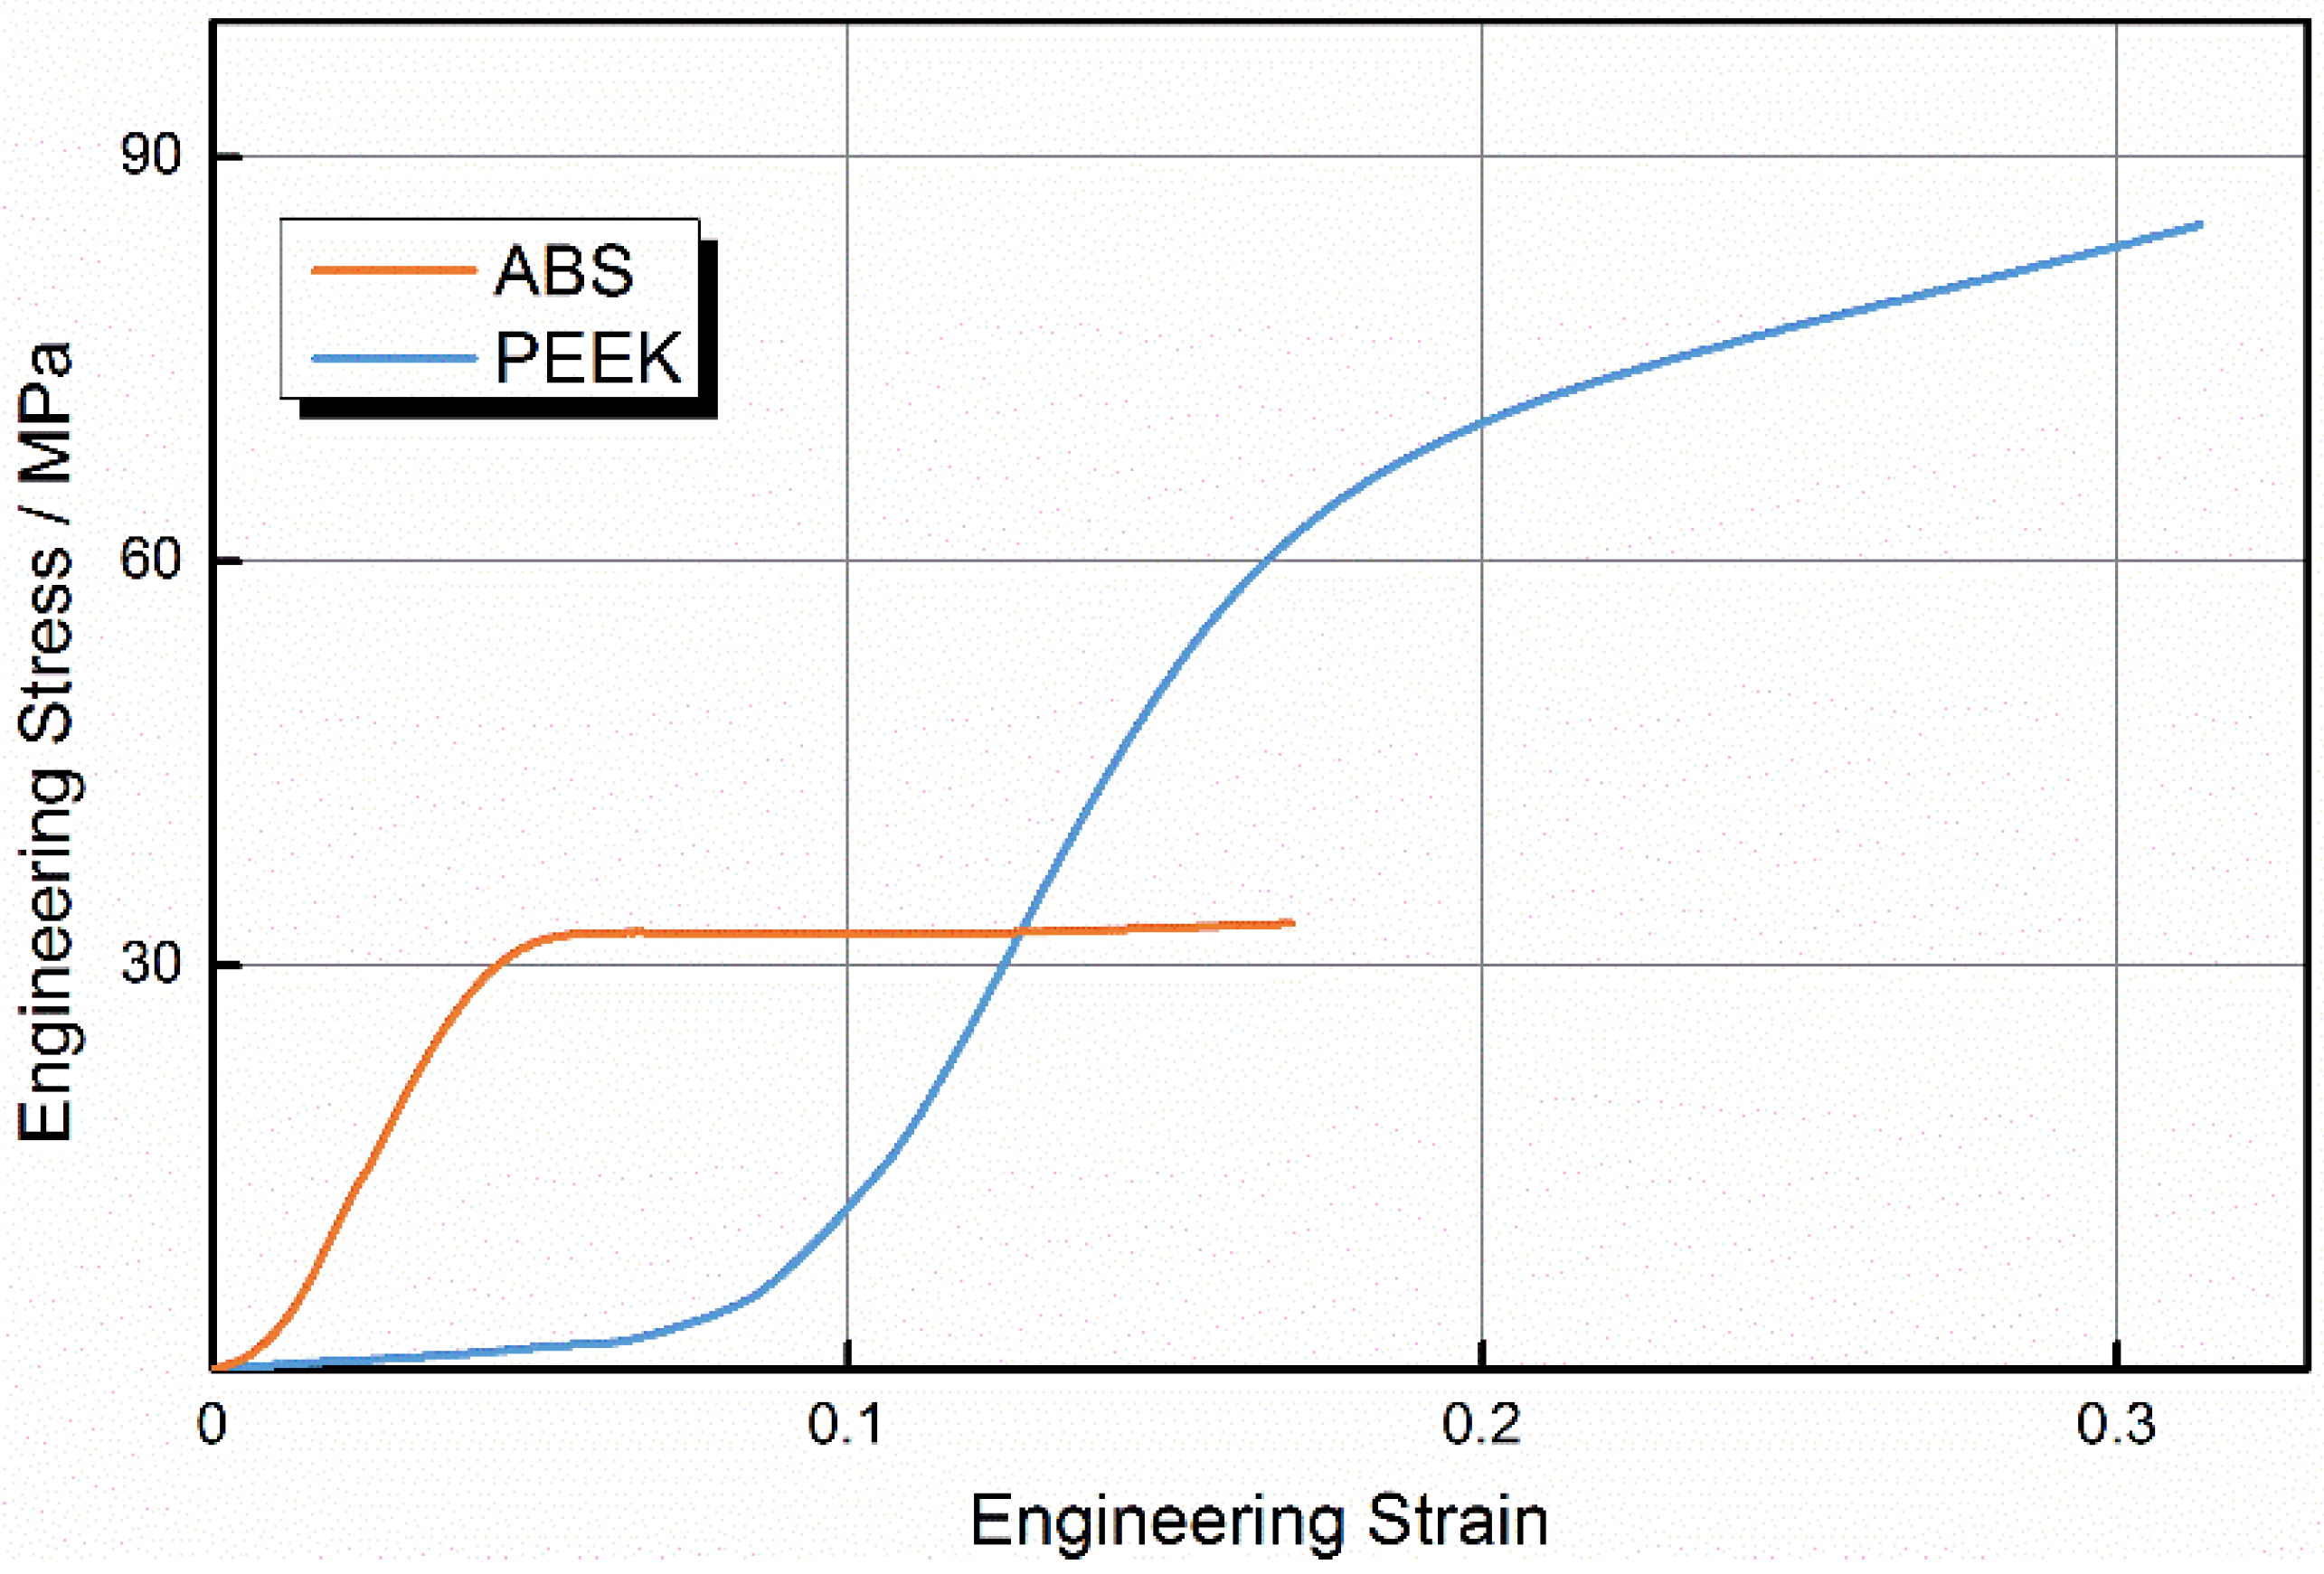
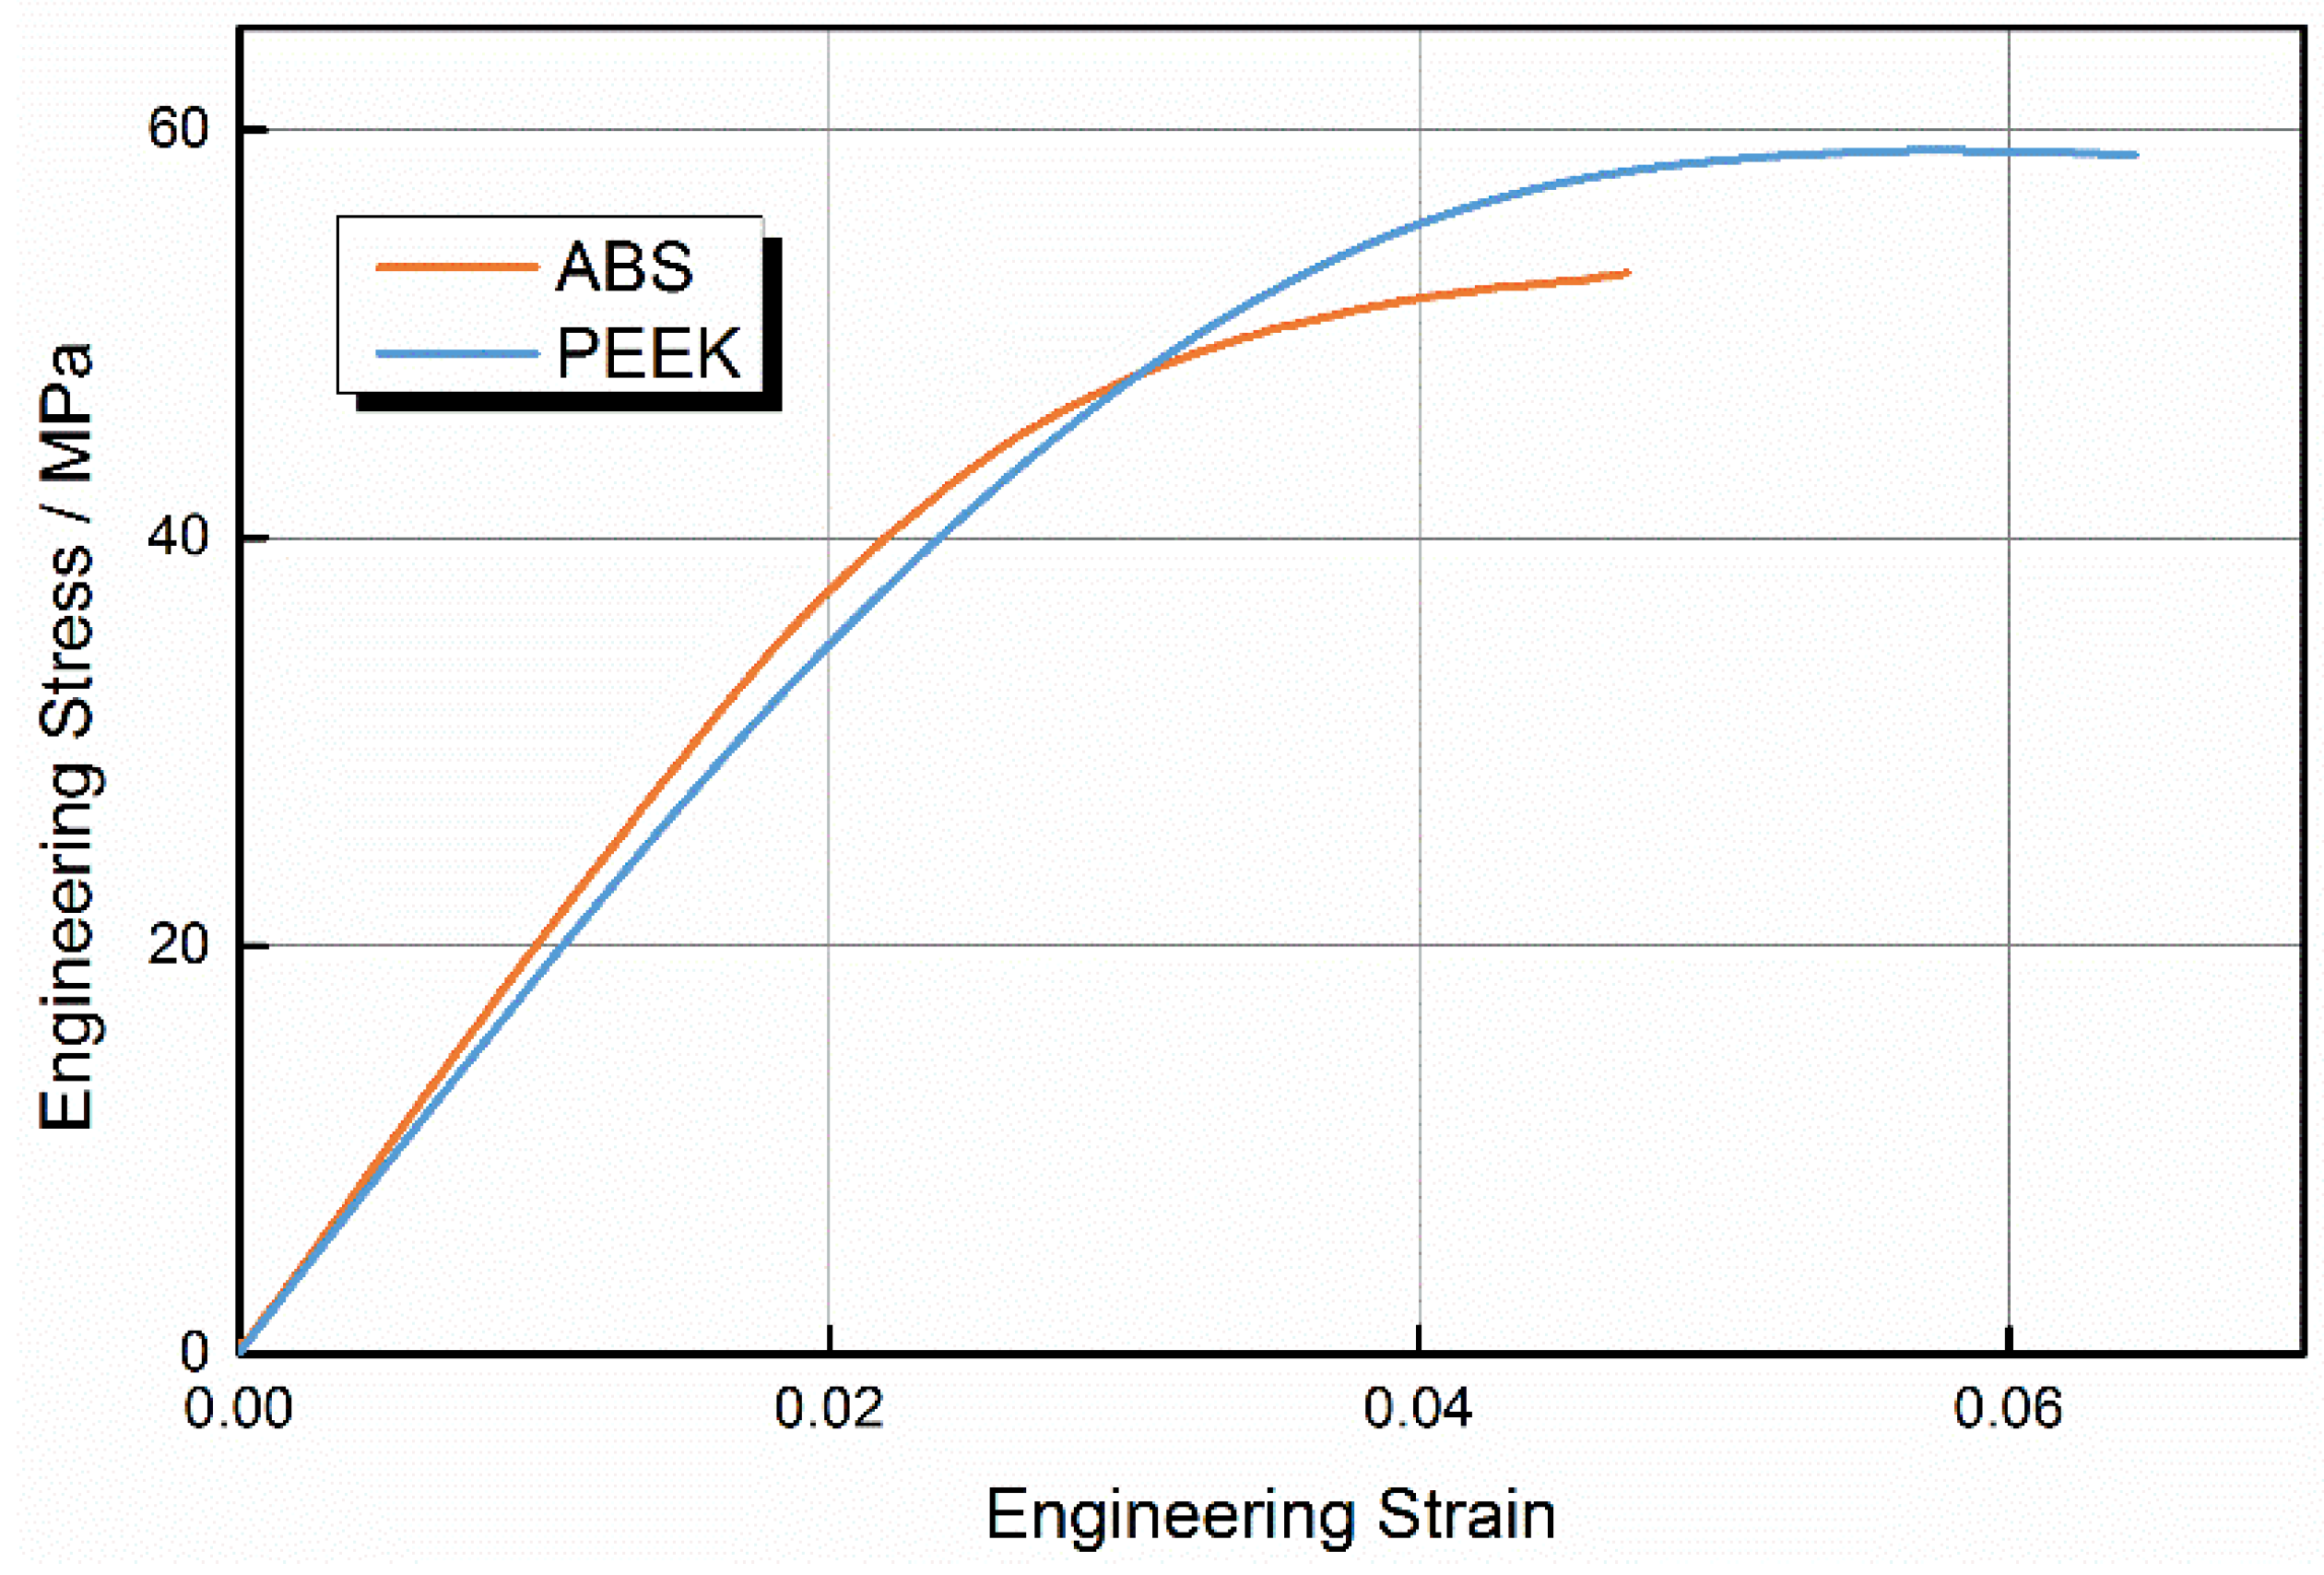
3.2. Comparison of ABS and PEEK Tensile Strengths


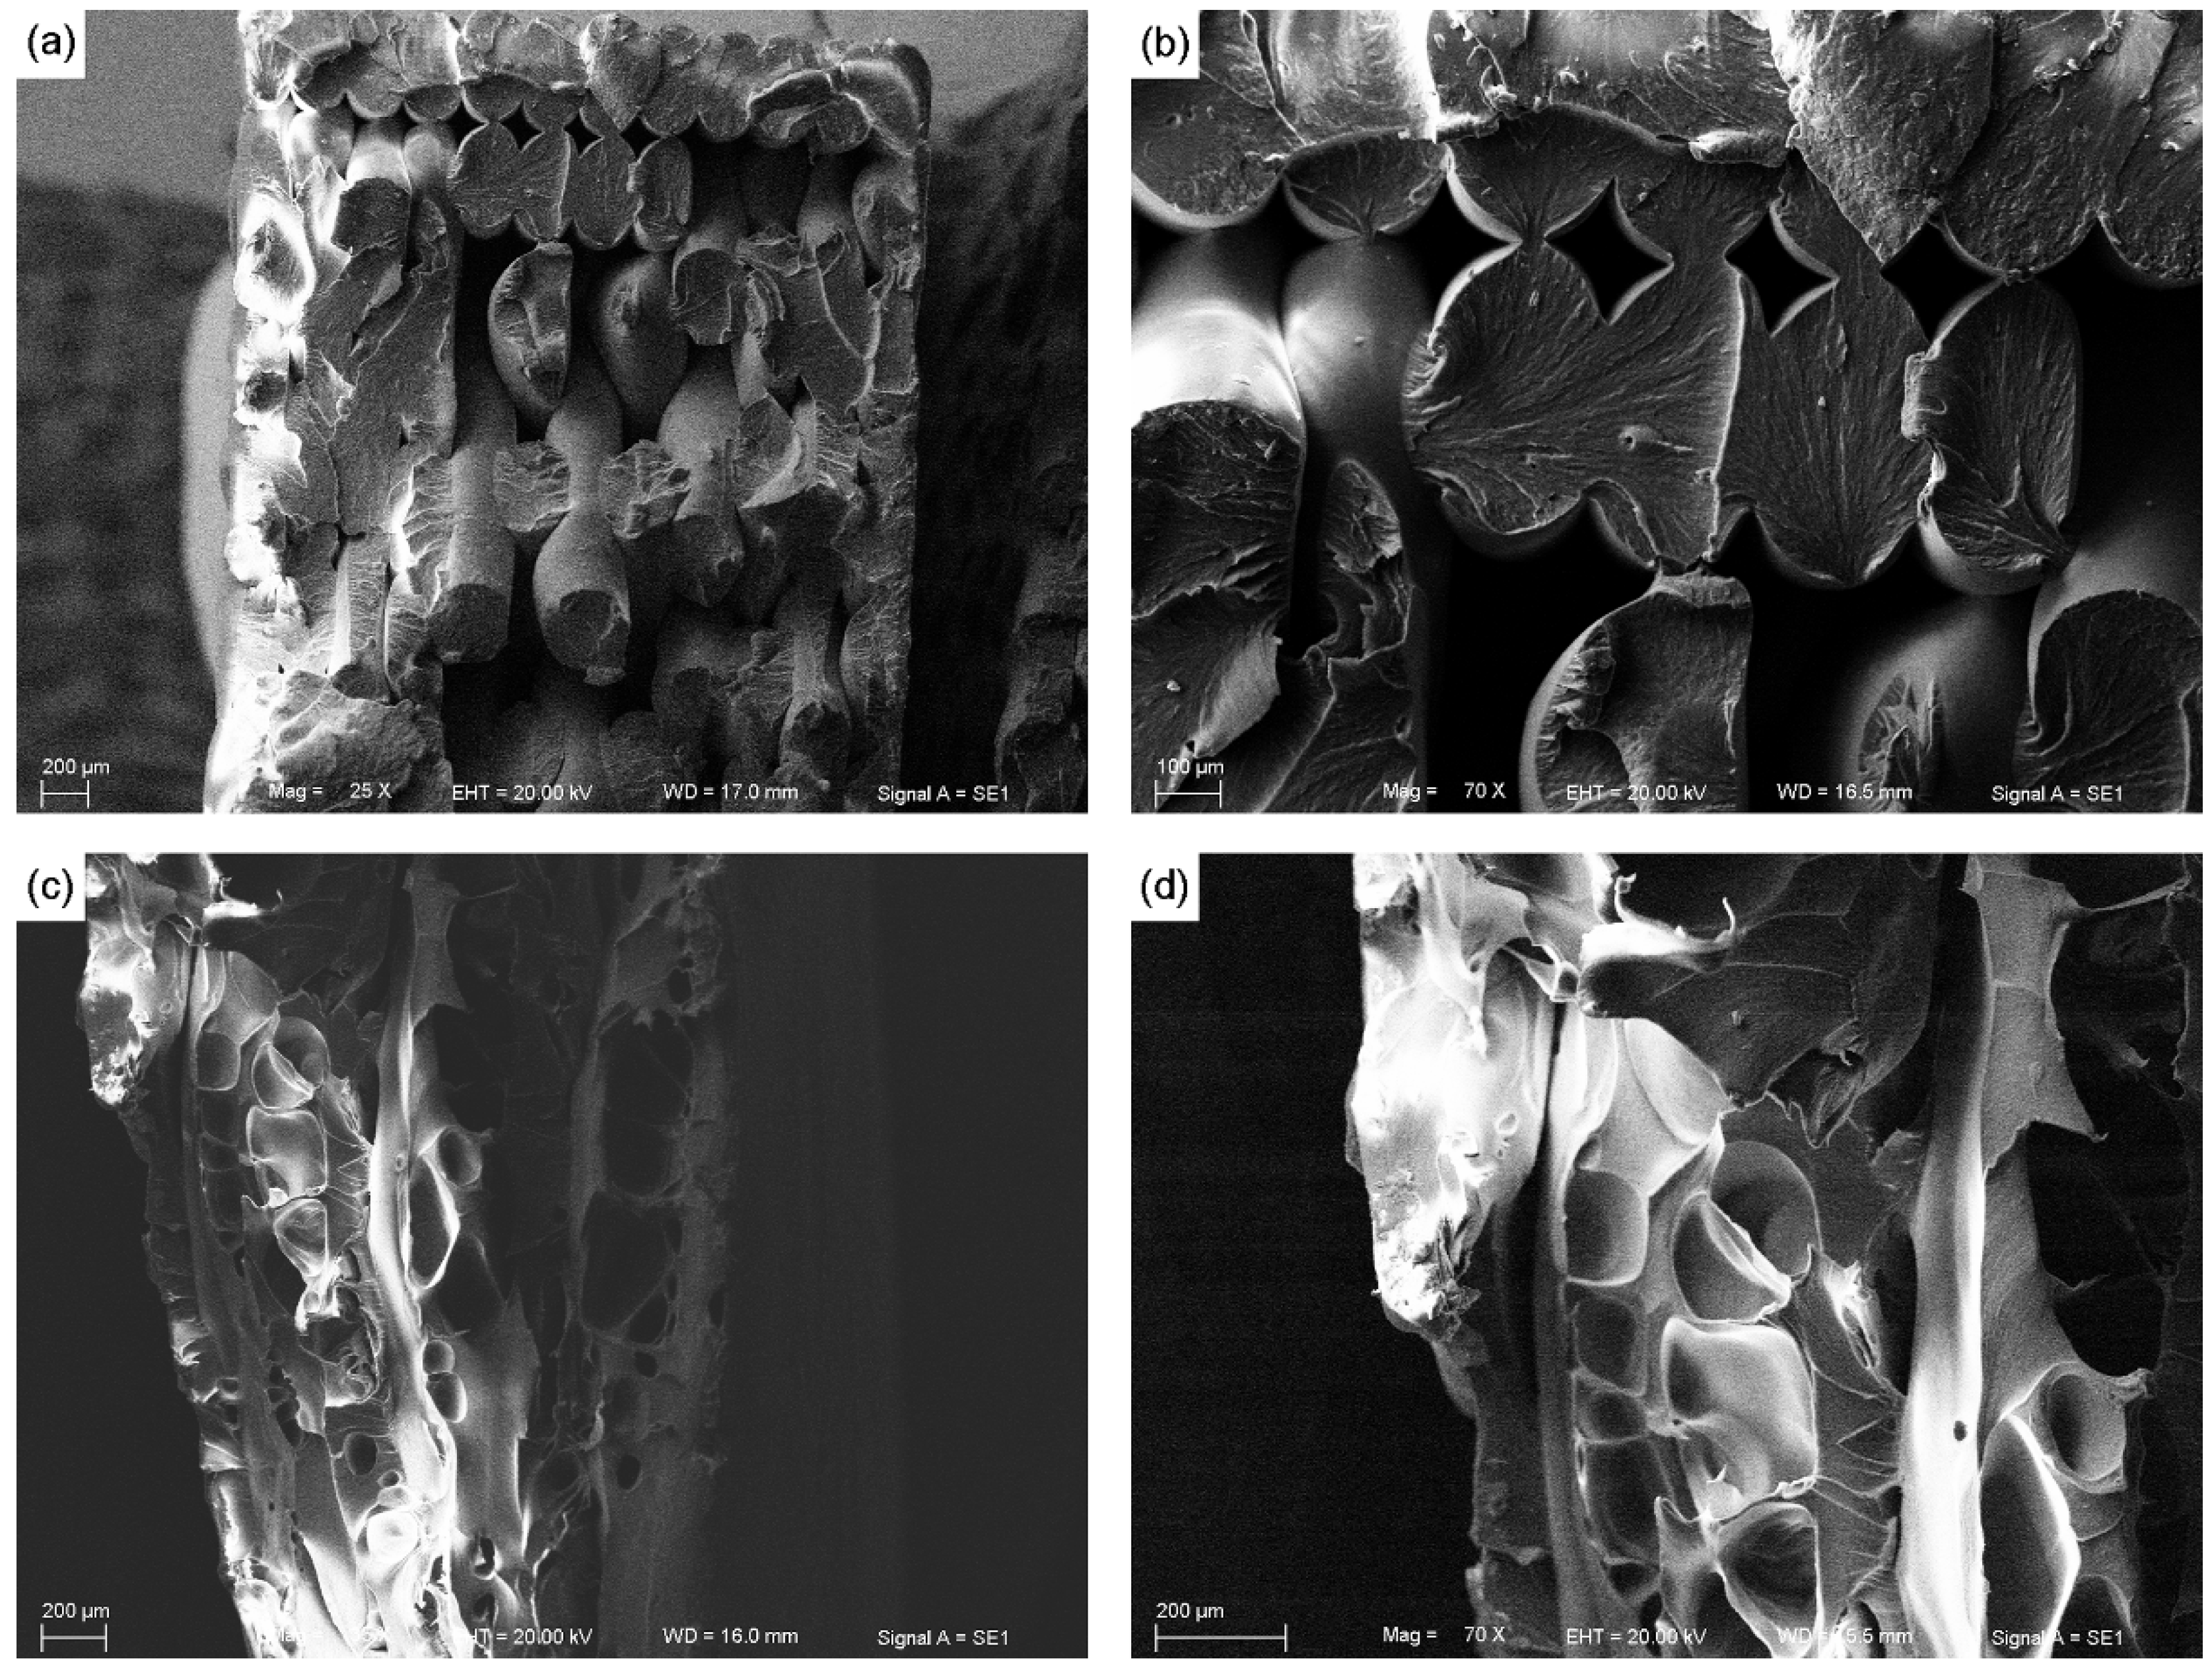
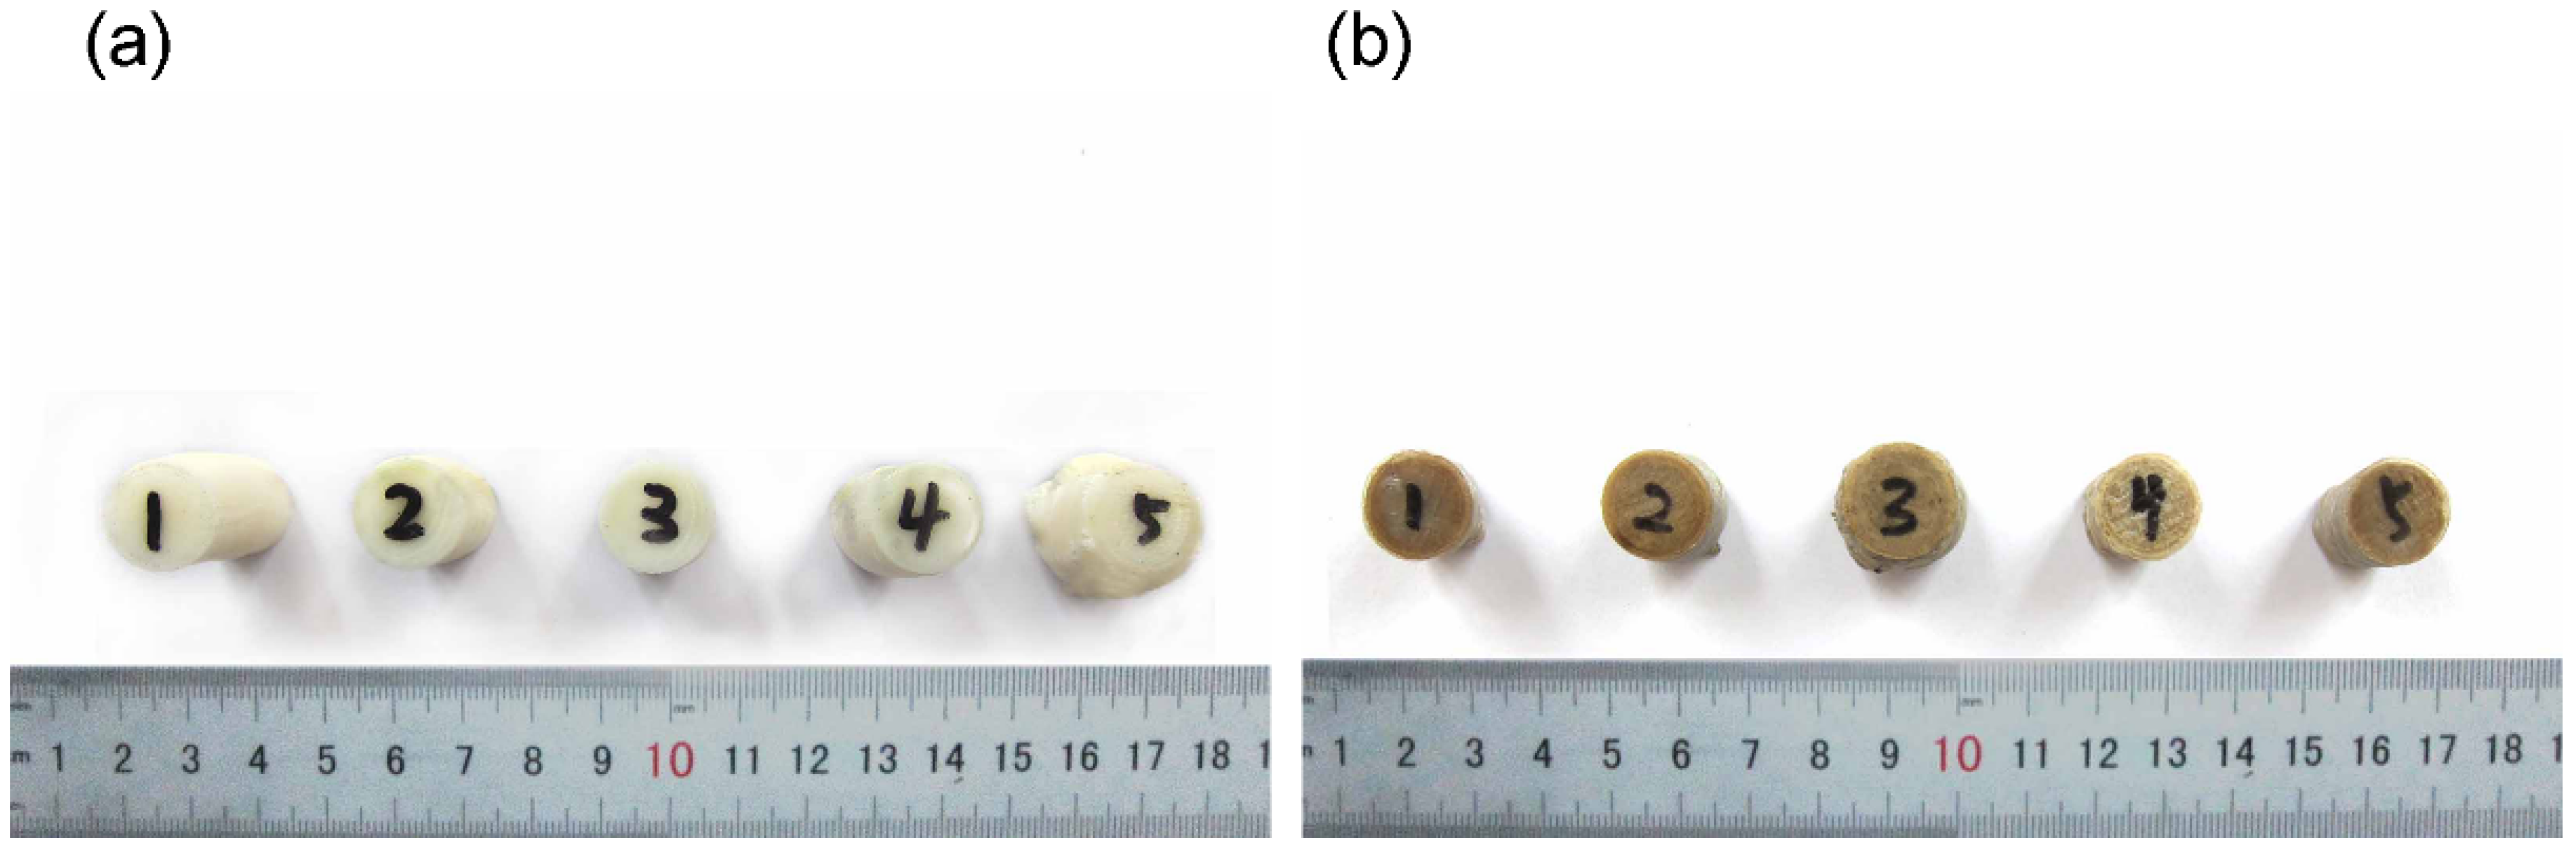
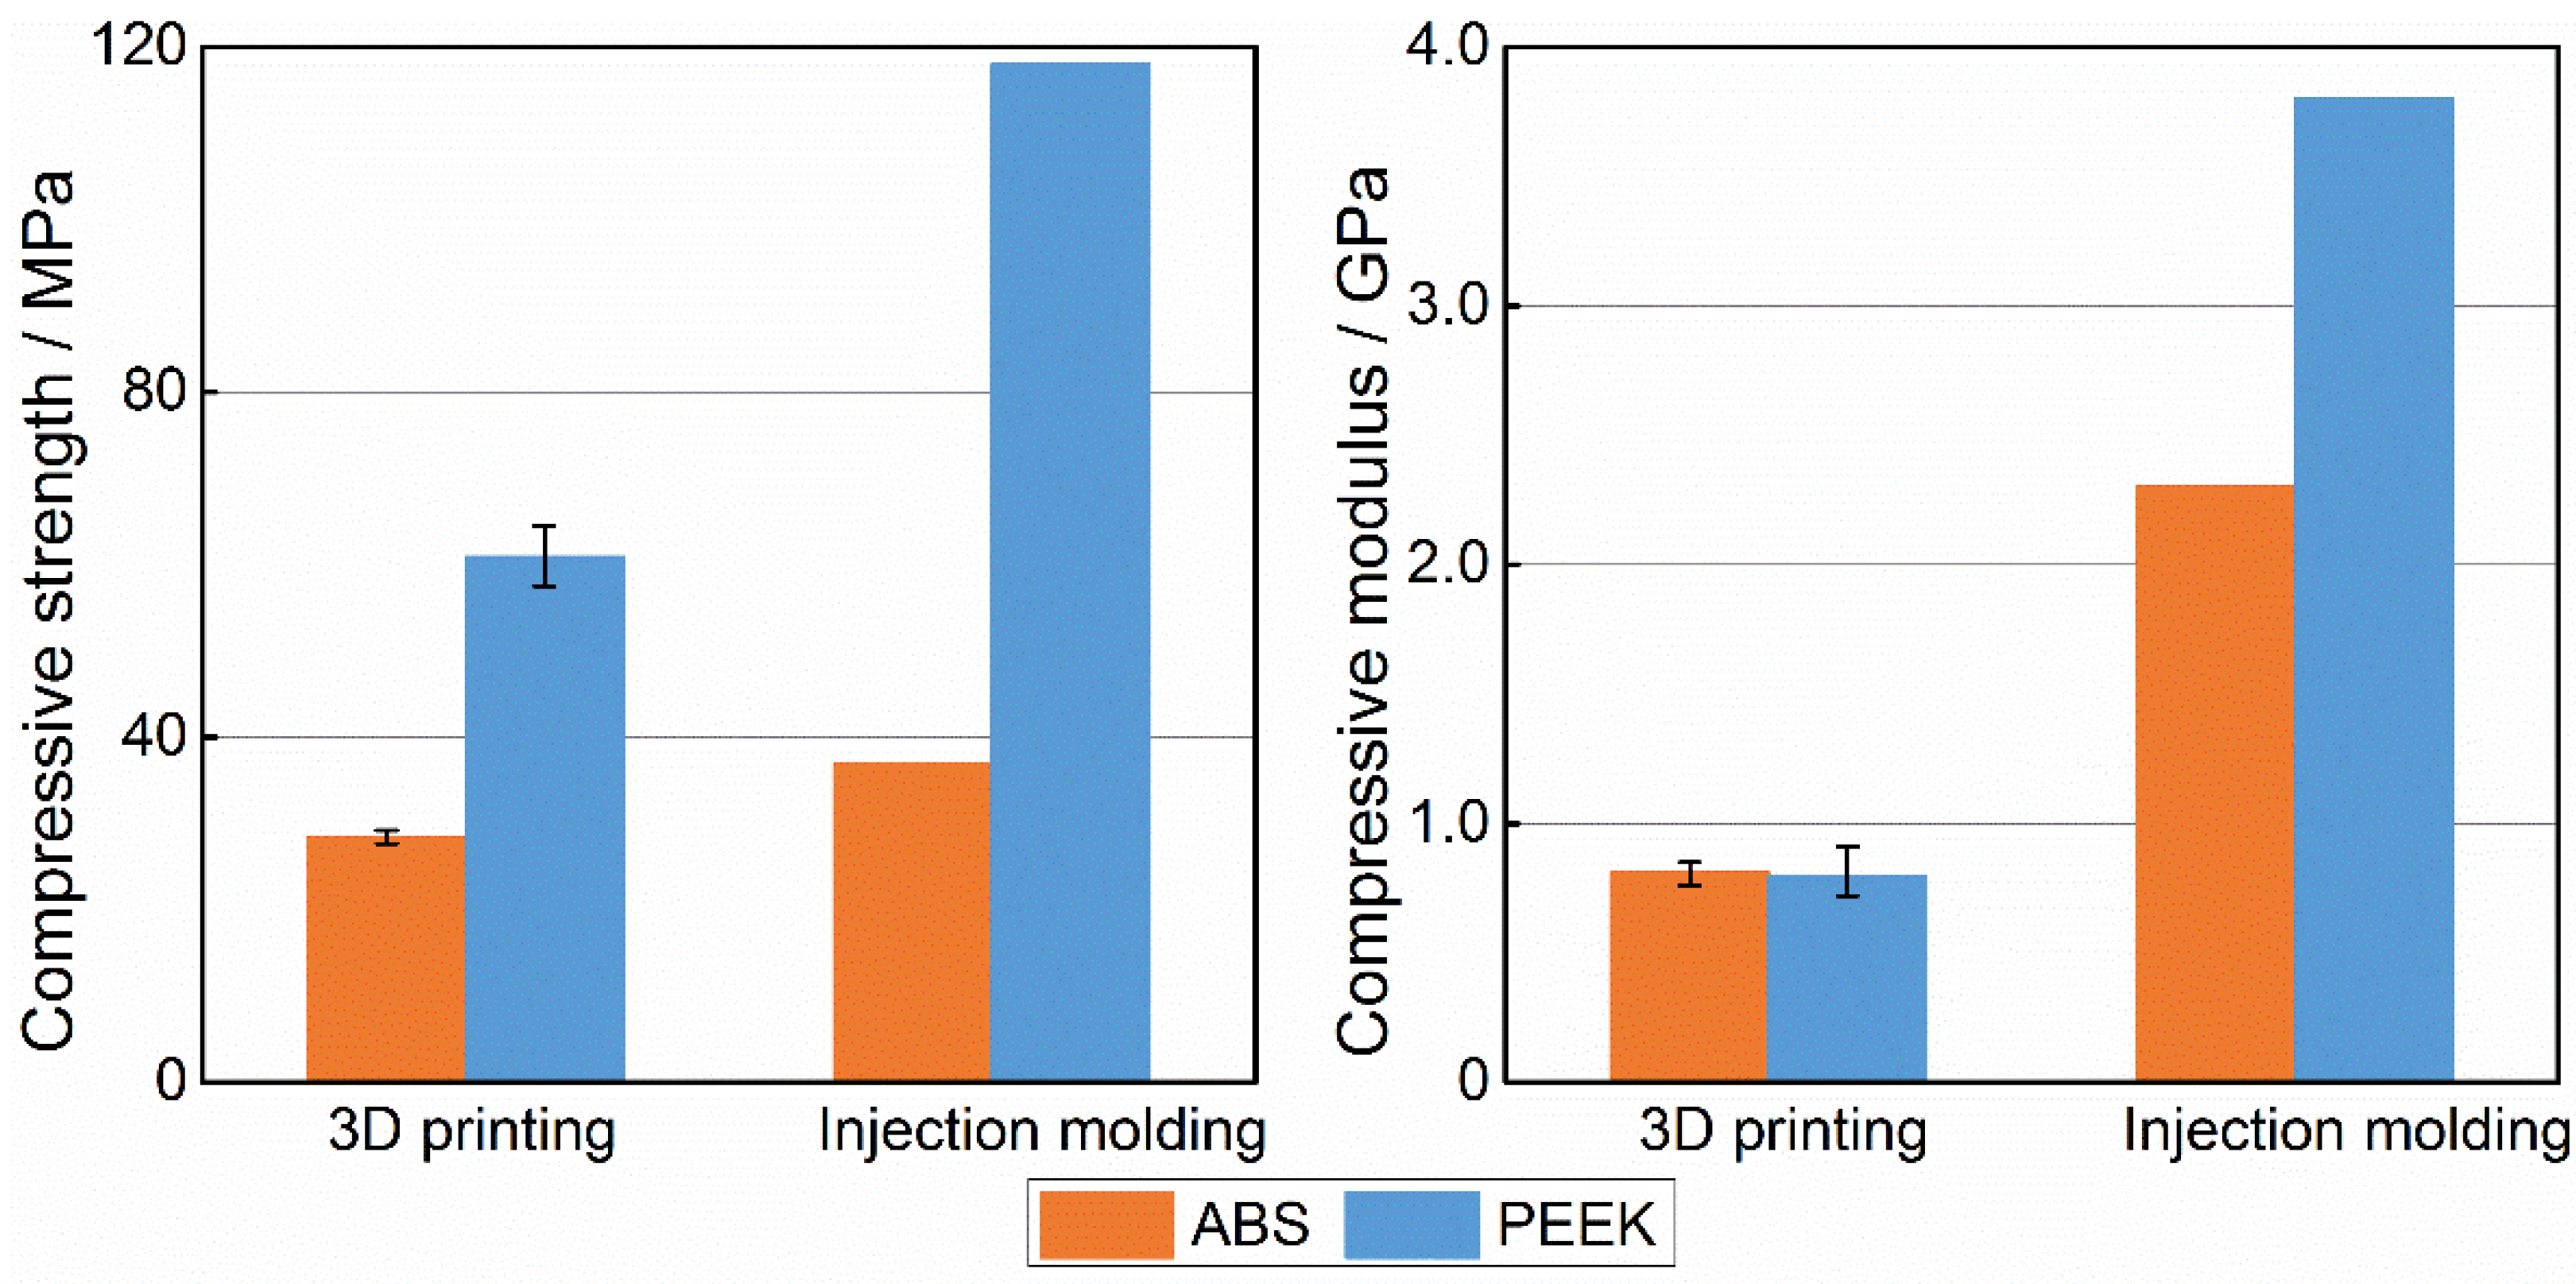
3.3. Comparison of ABS and PEEK Compressive Properties


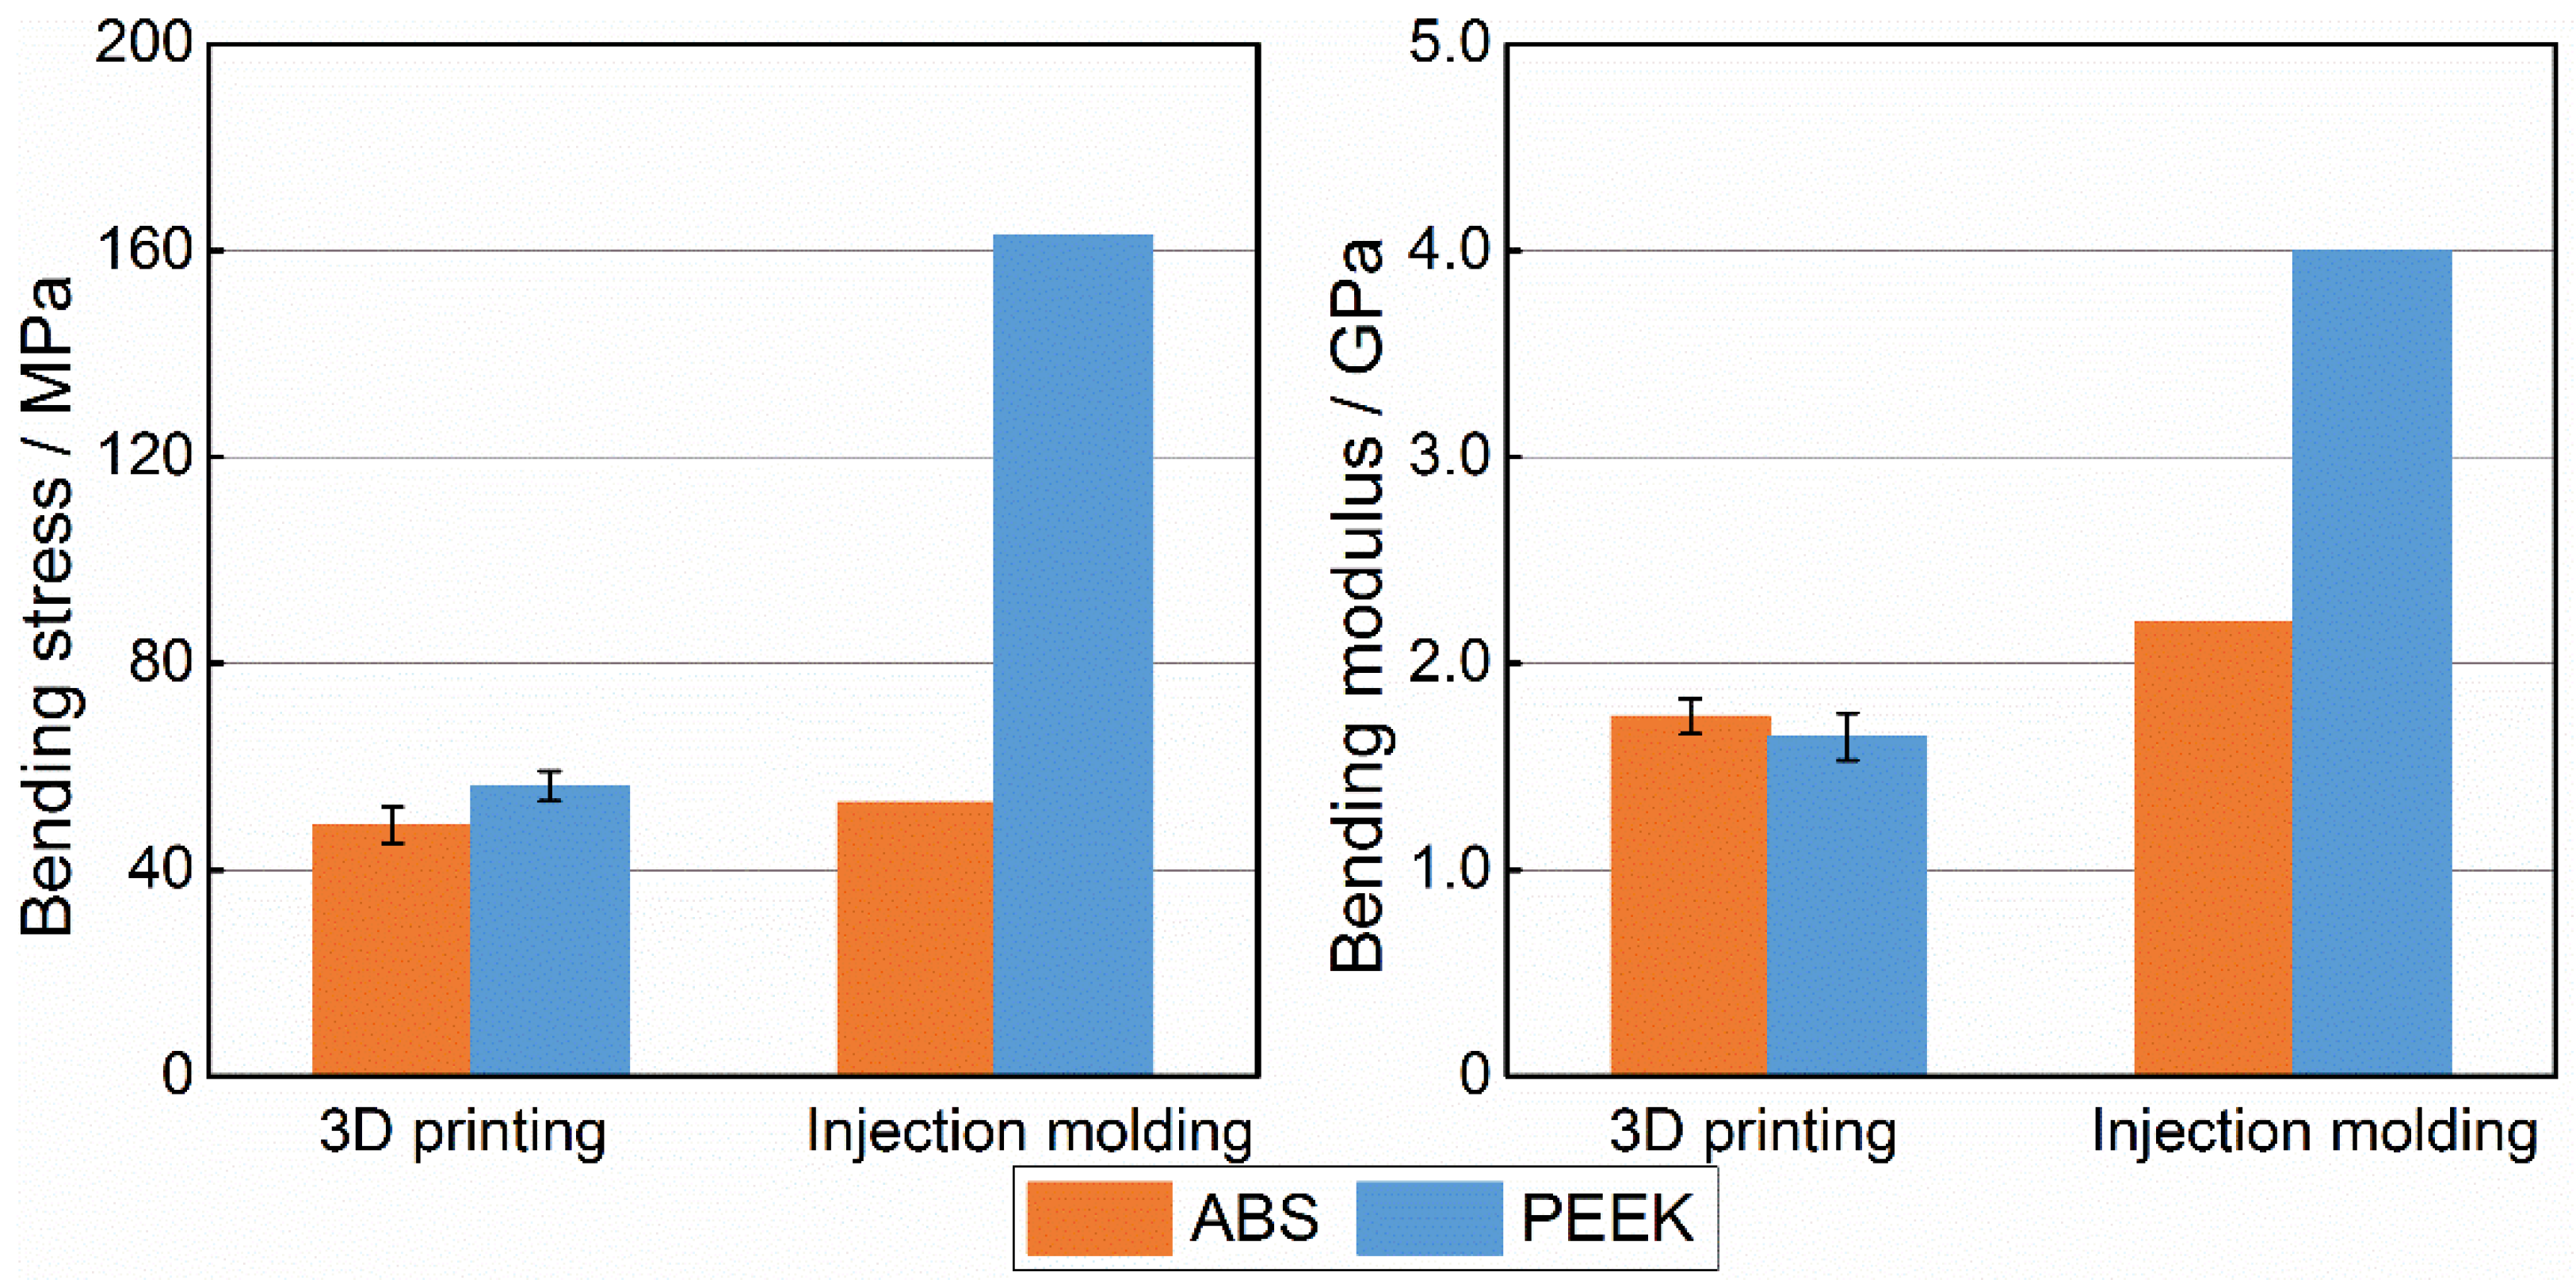
3.4. Comparison of ABS and PEEK Bending Properties


4. Conclusions
Acknowledgments
Author Contributions
Conflicts of Interest
References
- Ahn, S.; Montero, M.; Odell, D.; Roundy, S.; Wright, P.K. Anisotropic material properties of fused depositionmodeling ABS. Rapid Prototyp. J. 2003, 8, 248–257. [Google Scholar] [CrossRef]
- Sun, Q.; Rizvi, G.M.; Bellehumeur, C.T.; Gu, P. Effect of processing conditions on the bonding quality of FDM polymer filaments. Rapid Prototyp. J. 2008, 14, 72–80. [Google Scholar] [CrossRef]
- Upcraft, S.; Fletcher, R. The rapid prototyping technologies. Rapid Prototyp. J. 2003, 23, 318–330. [Google Scholar] [CrossRef]
- Martínez, J.; Diéguez, J.L.; Ares, E.; Pereira, A.; Hernández, P.; Pérez, J.A. Comparative between FEM models for FDM parts and their approach to a real mechanical behavior. Procedia Eng. 2013, 63, 878–884. [Google Scholar] [CrossRef]
- Es-Said, O.S.; Foyos, J.; Noorani, R.; Mendelson, M.; Marloth, R.; Pregger, B.A. Effect of layer orientation on mechanical properties of rapid prototyped samples. Mater. Manuf. Process. 2000, 15, 107–122. [Google Scholar] [CrossRef]
- Mota, C.; Puppi, D.; Dinucci, D.; Errico, C.; Bártolo, P.; Chiellini, F. Dual-Scale polymeric constructs as scaffolds for tissue engineering. Materials 2011, 4, 527–542. [Google Scholar] [CrossRef]
- Anitha, R.; Arunachalam, S.; Radhakrishnan, P. Critical parameters influencing the quality of prototypes in fused deposition modeling. J. Mater. Process. Technol. 2001, 118, 385–388. [Google Scholar] [CrossRef]
- Bernarand, A.; Fischer, A. New trends in rapid product development. CIRP Ann. Manuf. Technol. 2002, 51, 635–652. [Google Scholar] [CrossRef]
- Thrimurthulu, K.; Pandey, P.M.; Reddy, N.V. Optimum part deposition orientation in fused deposition modeling. Int. J. Mach. Tools Manuf. 2004, 44, 585–594. [Google Scholar] [CrossRef]
- Wu, G.; Langrana, N.A.; Sadanji, R.; Danforth, S. Solid freeform fabrication of metal components using fused deposition of metals. Mater. Des. 2002, 23, 97–105. [Google Scholar] [CrossRef]
- Nikzad, M.; Masood, S.H.; Sbarski, I. Thermo-mechanical properties of a highly filled polymeric composites for Fused Deposition Modeling. Mater. Des. 2011, 32, 3448–3456. [Google Scholar] [CrossRef]
- Lee, J.; Huang, A. Fatigue analysis of FDM materials. Rapid Prototyp. J. 2013, 19, 291–299. [Google Scholar] [CrossRef]
- Croccolo, D.; de Agostinis, M.; Olmi, G. Experimental characterization and analytical modelling of the mechanical behaviour of fused deposition processed parts made of ABS-M30. Comput. Mater. Sci. 2013, 79, 506–518. [Google Scholar] [CrossRef]
- Vigliotti, A.; Pasini, D. Stiffness and strength of tridimensional periodic lattices. Comput. Methods Appl. Mech. Eng. 2012, 229, 27–43. [Google Scholar] [CrossRef]
- Durgun, I.; Ertan, R. Experimental investigation of FDM process for improvement of mechanical properties and production cost. Rapid Prototyp. J. 2014, 20, 228–235. [Google Scholar] [CrossRef]
- Sood, A.K.; Ohdar, R.K.; Mahapatra, S.S. Experimental investigation and empirical modeling of FDM process for compressive strength improvement. J. Adv. Res. 2012, 32, 81–90. [Google Scholar] [CrossRef]
- Tymrak, B.M.; Kreiger, M.; Pearce, J.M. Mechanical properties of components fabricated with open-source 3-D printers under realistic environmental conditions. Mater. Des. 2014, 58, 242–246. [Google Scholar] [CrossRef]
- Sood, A.K.; Ohdar, R.K.; Mahapatra, S.S. Parametric appraisal of mechanical property of fused deposition modeling processed parts. Mater. Des. 2010, 31, 287–295. [Google Scholar] [CrossRef]
- Agarwala, M.K.; Jamalabad, V.R.; Langrana, N.A.; Safari, A.; Whalen, P.J.; Danforth, S.C. Structural quality of parts processed by fused deposition. Rapid Prototyp. J. 1996, 8, 248–257. [Google Scholar] [CrossRef]
- Kantaros, A.; Karalekas, A. Fiber Bragg grating based investigation of residual strains in ABS parts fabricated by fused deposition modeling process. Mater. Des. 2013, 50, 44–50. [Google Scholar] [CrossRef]
- Bigg, D.M. Mechanical, thermal, and electrical properties of metal fiber-filled polymer composites. Polym. Eng. Sci. 1979, 19, 1188–1192. [Google Scholar] [CrossRef]
- Bigg, D.M. Mechanical properties of particulate filled polymers. Polym. Compos. 1987, 8, 115–122. [Google Scholar] [CrossRef]
© 2015 by the authors; licensee MDPI, Basel, Switzerland. This article is an open access article distributed under the terms and conditions of the Creative Commons Attribution license (http://creativecommons.org/licenses/by/4.0/).
Share and Cite
Wu, W.; Geng, P.; Li, G.; Zhao, D.; Zhang, H.; Zhao, J. Influence of Layer Thickness and Raster Angle on the Mechanical Properties of 3D-Printed PEEK and a Comparative Mechanical Study between PEEK and ABS. Materials 2015, 8, 5834-5846. https://doi.org/10.3390/ma8095271
Wu W, Geng P, Li G, Zhao D, Zhang H, Zhao J. Influence of Layer Thickness and Raster Angle on the Mechanical Properties of 3D-Printed PEEK and a Comparative Mechanical Study between PEEK and ABS. Materials. 2015; 8(9):5834-5846. https://doi.org/10.3390/ma8095271
Chicago/Turabian StyleWu, Wenzheng, Peng Geng, Guiwei Li, Di Zhao, Haibo Zhang, and Ji Zhao. 2015. "Influence of Layer Thickness and Raster Angle on the Mechanical Properties of 3D-Printed PEEK and a Comparative Mechanical Study between PEEK and ABS" Materials 8, no. 9: 5834-5846. https://doi.org/10.3390/ma8095271