Article

Synthesis of Mixed Cu/Ce Oxide Nanoparticles by the Oil-in-Water Microemulsion Reaction Method

by
Kelly Pemartin-Biernath
1,2,
Andrea V. Vela-González
3,
Maira B. Moreno-Trejo
3,
César Leyva-Porras
3,
Iván E. Castañeda-Reyna
4,
Isaías Juárez-Ramírez
4,
Conxita Solans
1 and
Margarita Sánchez-Domínguez
3,*
1
Institut de Química Avançada de Catalunya (IQAC-CSIC) y CIBER en Biotecnología, Biomateriales y Nanomedicina (Ciber-BBN), Jordi Girona 18-26, Barcelona 08034, Spain
2
Mc Bride Chemolux S.A.R.L, Rue de I’Industrie, Foetz 3895, Luxembourg
3
Centro de Investigación en Materiales Avanzados, S. C. (CIMAV), Unidad Monterrey, Alianza Norte 202, Parque de Investigación e Innovación Tecnológica, Apodaca 66628, Mexico
4
Universidad Autónoma de Nuevo León, Facultad de Ingeniería Civil, Departamento de Ecomateriales y Energía. Cd. Universitaria, San Nicolás de los Garza 66455, Mexico
*
Author to whom correspondence should be addressed.
Materials 2016, 9(6), 480; https://doi.org/10.3390/ma9060480
Submission received: 25 April 2016 / Revised: 6 June 2016 / Accepted: 10 June 2016 / Published: 16 June 2016

Abstract

:
Cerium oxide and mixed Cu/Ce oxide nanoparticles were prepared by the oil-in-water (O/W) microemulsion reaction method in mild conditions. The Cu/Ce molar ratio was varied between 0/100 and 50/50. According to X-ray diffraction (XRD), below 30/70 Cu/Ce molar ratio, the materials presented a single phase consistent with cubic fluorite CeO2. However, above Cu/Ce molar ratio 30/70, an excess monoclinic CuO phase in coexistence with the predominant Cu/Ce mixed oxide was detected by XRD and High-Resolution Transmission Electron Microscopy (HRTEM). Raman spectroscopy showed that oxygen vacancies increased significantly as the Cu content was increased. Band gap (Eg) was investigated as a function of the Cu/Ce molar ratio, resulting in values from 2.91 eV for CeO2 to 2.32 eV for the mixed oxide with 30/70 Cu/Ce molar ratio. These results indicate that below 30/70 Cu/Ce molar ratio, Cu2+ is at least partially incorporated into the ceria lattice and very well dispersed in general. In addition, the photodegradation of Indigo Carmine dye under visible light irradiation was explored for selected samples; it was shown that these materials can remove such contaminants, either by adsorption and/or photodegradation. The results obtained will encourage investigation into the optical and photocatalytic properties of these mixed oxides, for widening their potential applications.

1. Introduction

Ceria and ceria-based nanomaterials are well known for their efficiency in numerous applications, such as solid-state electrolytes for electrochemical devices [1], ultraviolet absorbents for sunscreens [2], oxygen storage [3], hybrid solar cells [4], and luminescent materials for violet/blue fluorescence [5]. Moreover, due to the excellent oxygen buffering property of ceria, they present also a high interest for heterogeneous catalysis. The most important catalytic reactions using ceria-based nanomaterials are reduction of NO [6,7], CO oxidation [8], and Water Gas Shift [9] reactions.
In many cases, the redox properties and chemical activity of pure ceria can be enhanced by introducing different types of metals (e.g., Zr, Ca, Cu, Tb, Mn, etc.) into the oxide [10,11,12]. At a structural level, a dopant or second metal can introduce stress into the lattice of an oxide host, inducing the formation of defects with a high chemical activity. On the other hand, the lattice of the oxide host can impose non-typical coordination modes on the dopant element with a subsequent perturbation in the dopant chemical properties. Finally, metal-metal or metal-oxygen-metal interactions in mixed-metal oxides can lead to electronic properties not seen in single-metal oxides [13]. Also, according to the dopant nature a different effect on the formation of oxygen vacancies in ceria occurs which may lead to tunable performance of the final mixed oxide.
With the challenge of replacing the expensive and scarcely available noble metal catalysts, scientists have been encouraged to use transition metal oxide nanoparticles. Recently, it has been shown that CeO2-CuO mixed oxide nanomaterials were promising nanocatalysts for the preferential oxidation of CO [14]. Copper oxide nanomaterials are applied in various areas: gas sensors [15], biosensors [16], batteries [17], high temperature superconductors [18], solar energy conversion [19], field emission emitters [20], and catalysis [21]. It has been reported that the efficiency of CeO2-CuO nanocatalysts could be related to synergetic interactions between CeO2 and CuO promoting special redox properties at their interface [22]. However, it is worth noting that the redox properties of the obtained mixed oxides depend on the preparation methods promoting different catalytic performance due to the various states of dispersion of copper [23].
CeO2-CuO nanoparticles have been prepared by several methods. For example, the material synthesized by the hydrothermal method presented a high performance for selective oxidation of CO in excess H2 [24]. In addition, Szabova et al. reported another method that consists of the deposition of metallic Cu onto a previously prepared CeO2 surface in 12 consecutive steps [25]. Gurbani et al. reviewed other methods to prepare Cu-Ce mixed oxides, such as co-precipitation, sol-gel, and urea-nitrate combustion [26]. The main disadvantages of the cited methods are the requirements of high temperature (min. 80 °C) for several hours, involving high energy input and/or sophisticated techniques or equipment. In order to overcome this environmental impact, a new promising method for the synthesis of metal and metal oxide nanoparticles was recently developed, based on the use of oil-in-water (O/W) microemulsions as confined reaction media [27]. In addition to the advantages of the traditional water-in-oil (W/O) microemulsion method [28,29,30], namely, a high control of particle size, a high purity, and good chemical homogeneity under mild conditions, the O/W microemulsion method has the advantage of requiring lower organic solvent concentrations, as the predominant component is aqueous [27,31]. The O/W microemulsion reaction method, firstly reported by our research group in 2009 [27] for the preparation of metal and metal oxide nanoparticles, consists of the use of organometallic precursors, dissolved within nanometer scale oil droplets (stabilized by surfactant), and dispersed in a continuous aqueous phase. The thermodynamic stability of microemulsions maintains the oil phase (carrying the metal precursors) and the aqueous phase (containing the precipitating agent) intimately mixed leading to an increased oil-water interface. The confined media at the nanometer level created by the microemulsion environment may lead to an increased synergy between oxides at their interface which may result in better properties and improved performance.
The present work reports on the synthesis of mixed Cu/Ce oxide nanoparticles using the mild oil-in-water microemulsion reaction method. Characteristics of the as-obtained and calcined nanomaterials were compared as a function of Cu/Ce molar ratio in order to determine the maximum Cu content that could be incorporated into the CeO2 crystal lattice with a good Cu dispersion, which is a relevant characteristic in catalytic applications. Magnetic, optical (Eg as a function of Cu content), and photocatalytic properties are presented.

2. Results

2.1. Microemulsion Formulation and Synthesis of Cu/Ce Nanoparticles

Phase behavior of the Water/Synperonic® 91/5/Isooctane system was investigated in order to define the compositions and temperatures at which microemulsions were formed, as detected by their transparency, low viscosity and optical isotropy (lack of birefringence) and high water content. The results obtained together with previous studies [27,31,32], allowed the selection of a specific composition with a water/surfactant/oil (W/S/O) weight ratio of 64.5/21.5/14 forming O/W microemulsions near room temperature. Copper (II) and cerium (III) 2-ethylhexanoate precursors were dissolved in isooctane forming the oil phase. Thus, the strategy was to vary the ratio of Cu (II) and Ce (III) 2-ethylhexanoate precursors dissolved in the oil phase, in order to have Cu/Ce molar ratios from 0/100 to 50/50. Then, the interval of temperature at which microemulsions with precursors were formed was investigated. The obtained O/W microemulsions were transparent and fluid, with bluish-green color due to the presence of copper precursor at various concentrations. Incorporation of the metal precursors promoted a shift in the temperature range at which O/W microemulsions were formed. The microemulsion without precursor was formed at a temperature range of 24–26 °C; whereas, when precursors where incorporated into the oil phase, the temperature needed for microemulsion formation was higher. Furthermore, as the content of copper precursor was increased, a higher temperature was needed for the formation of O/W microemulsions (Table 1).
In order to form the Cu/Ce mixed oxide nanoparticles, NaOH (2.5 M) was added, leading to the precipitation of Cu/Ce mixed oxide nanoparticles.

2.2. Characterization of Cu/Ce Oxide NPs

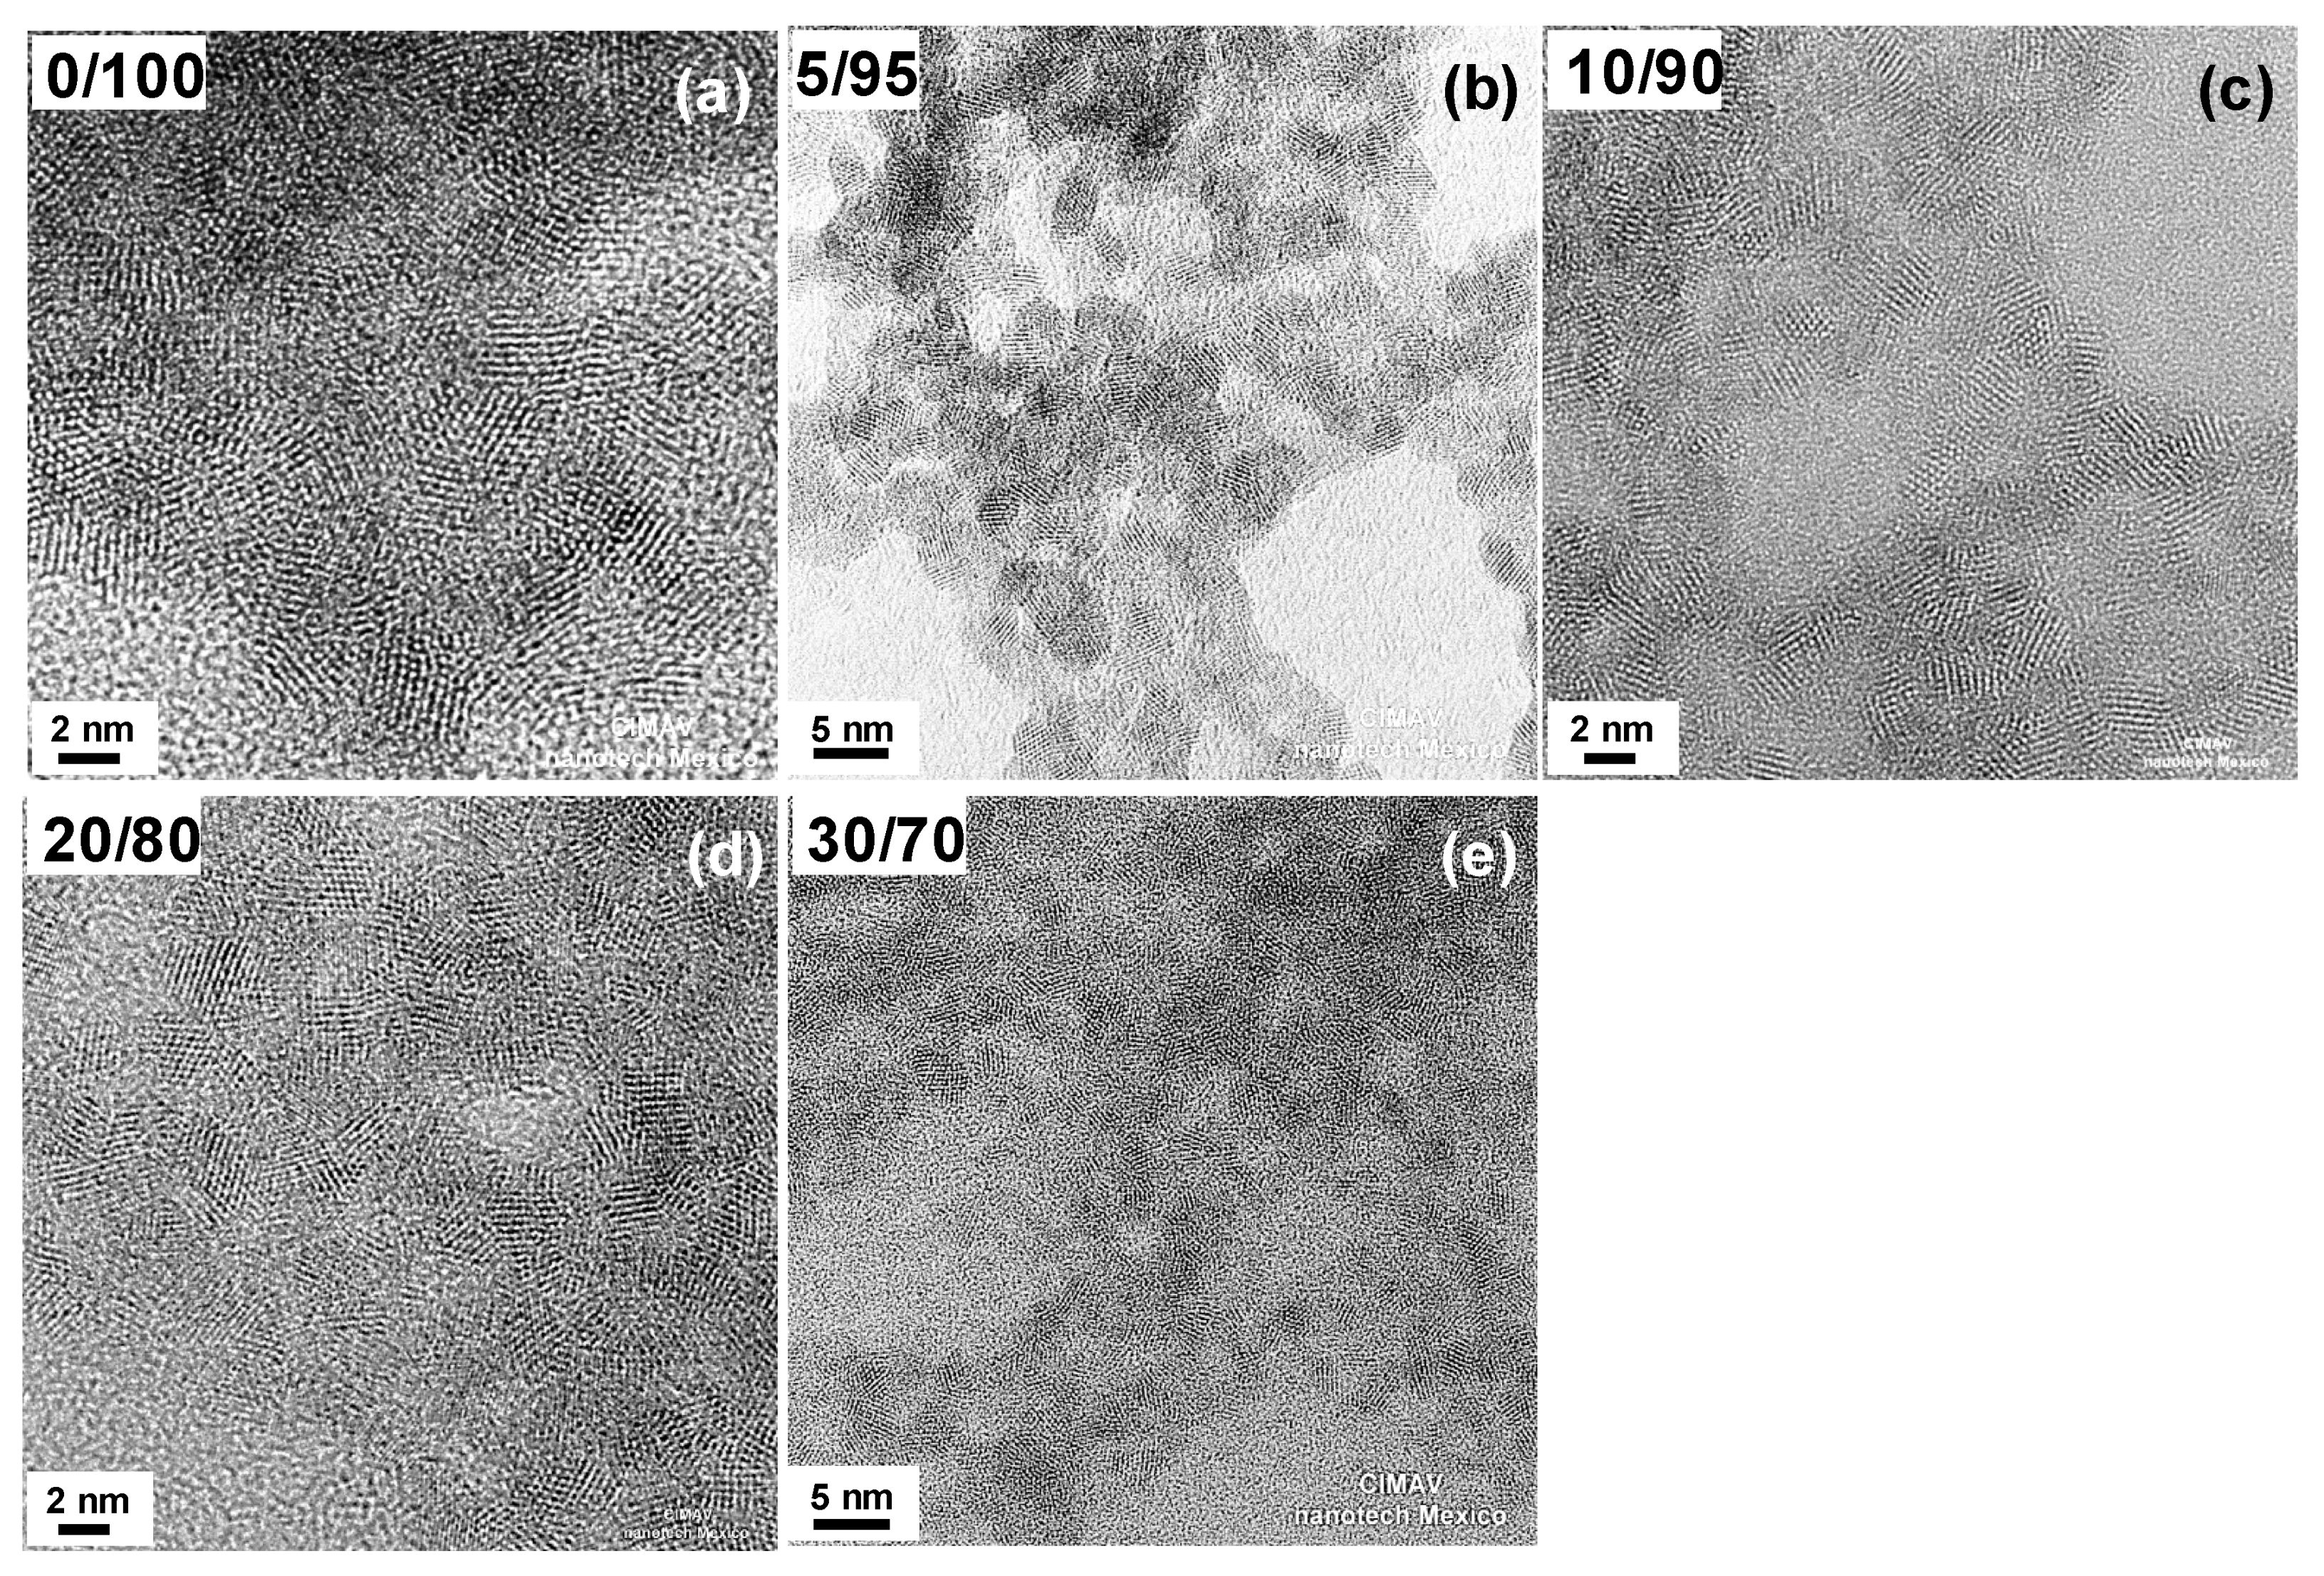
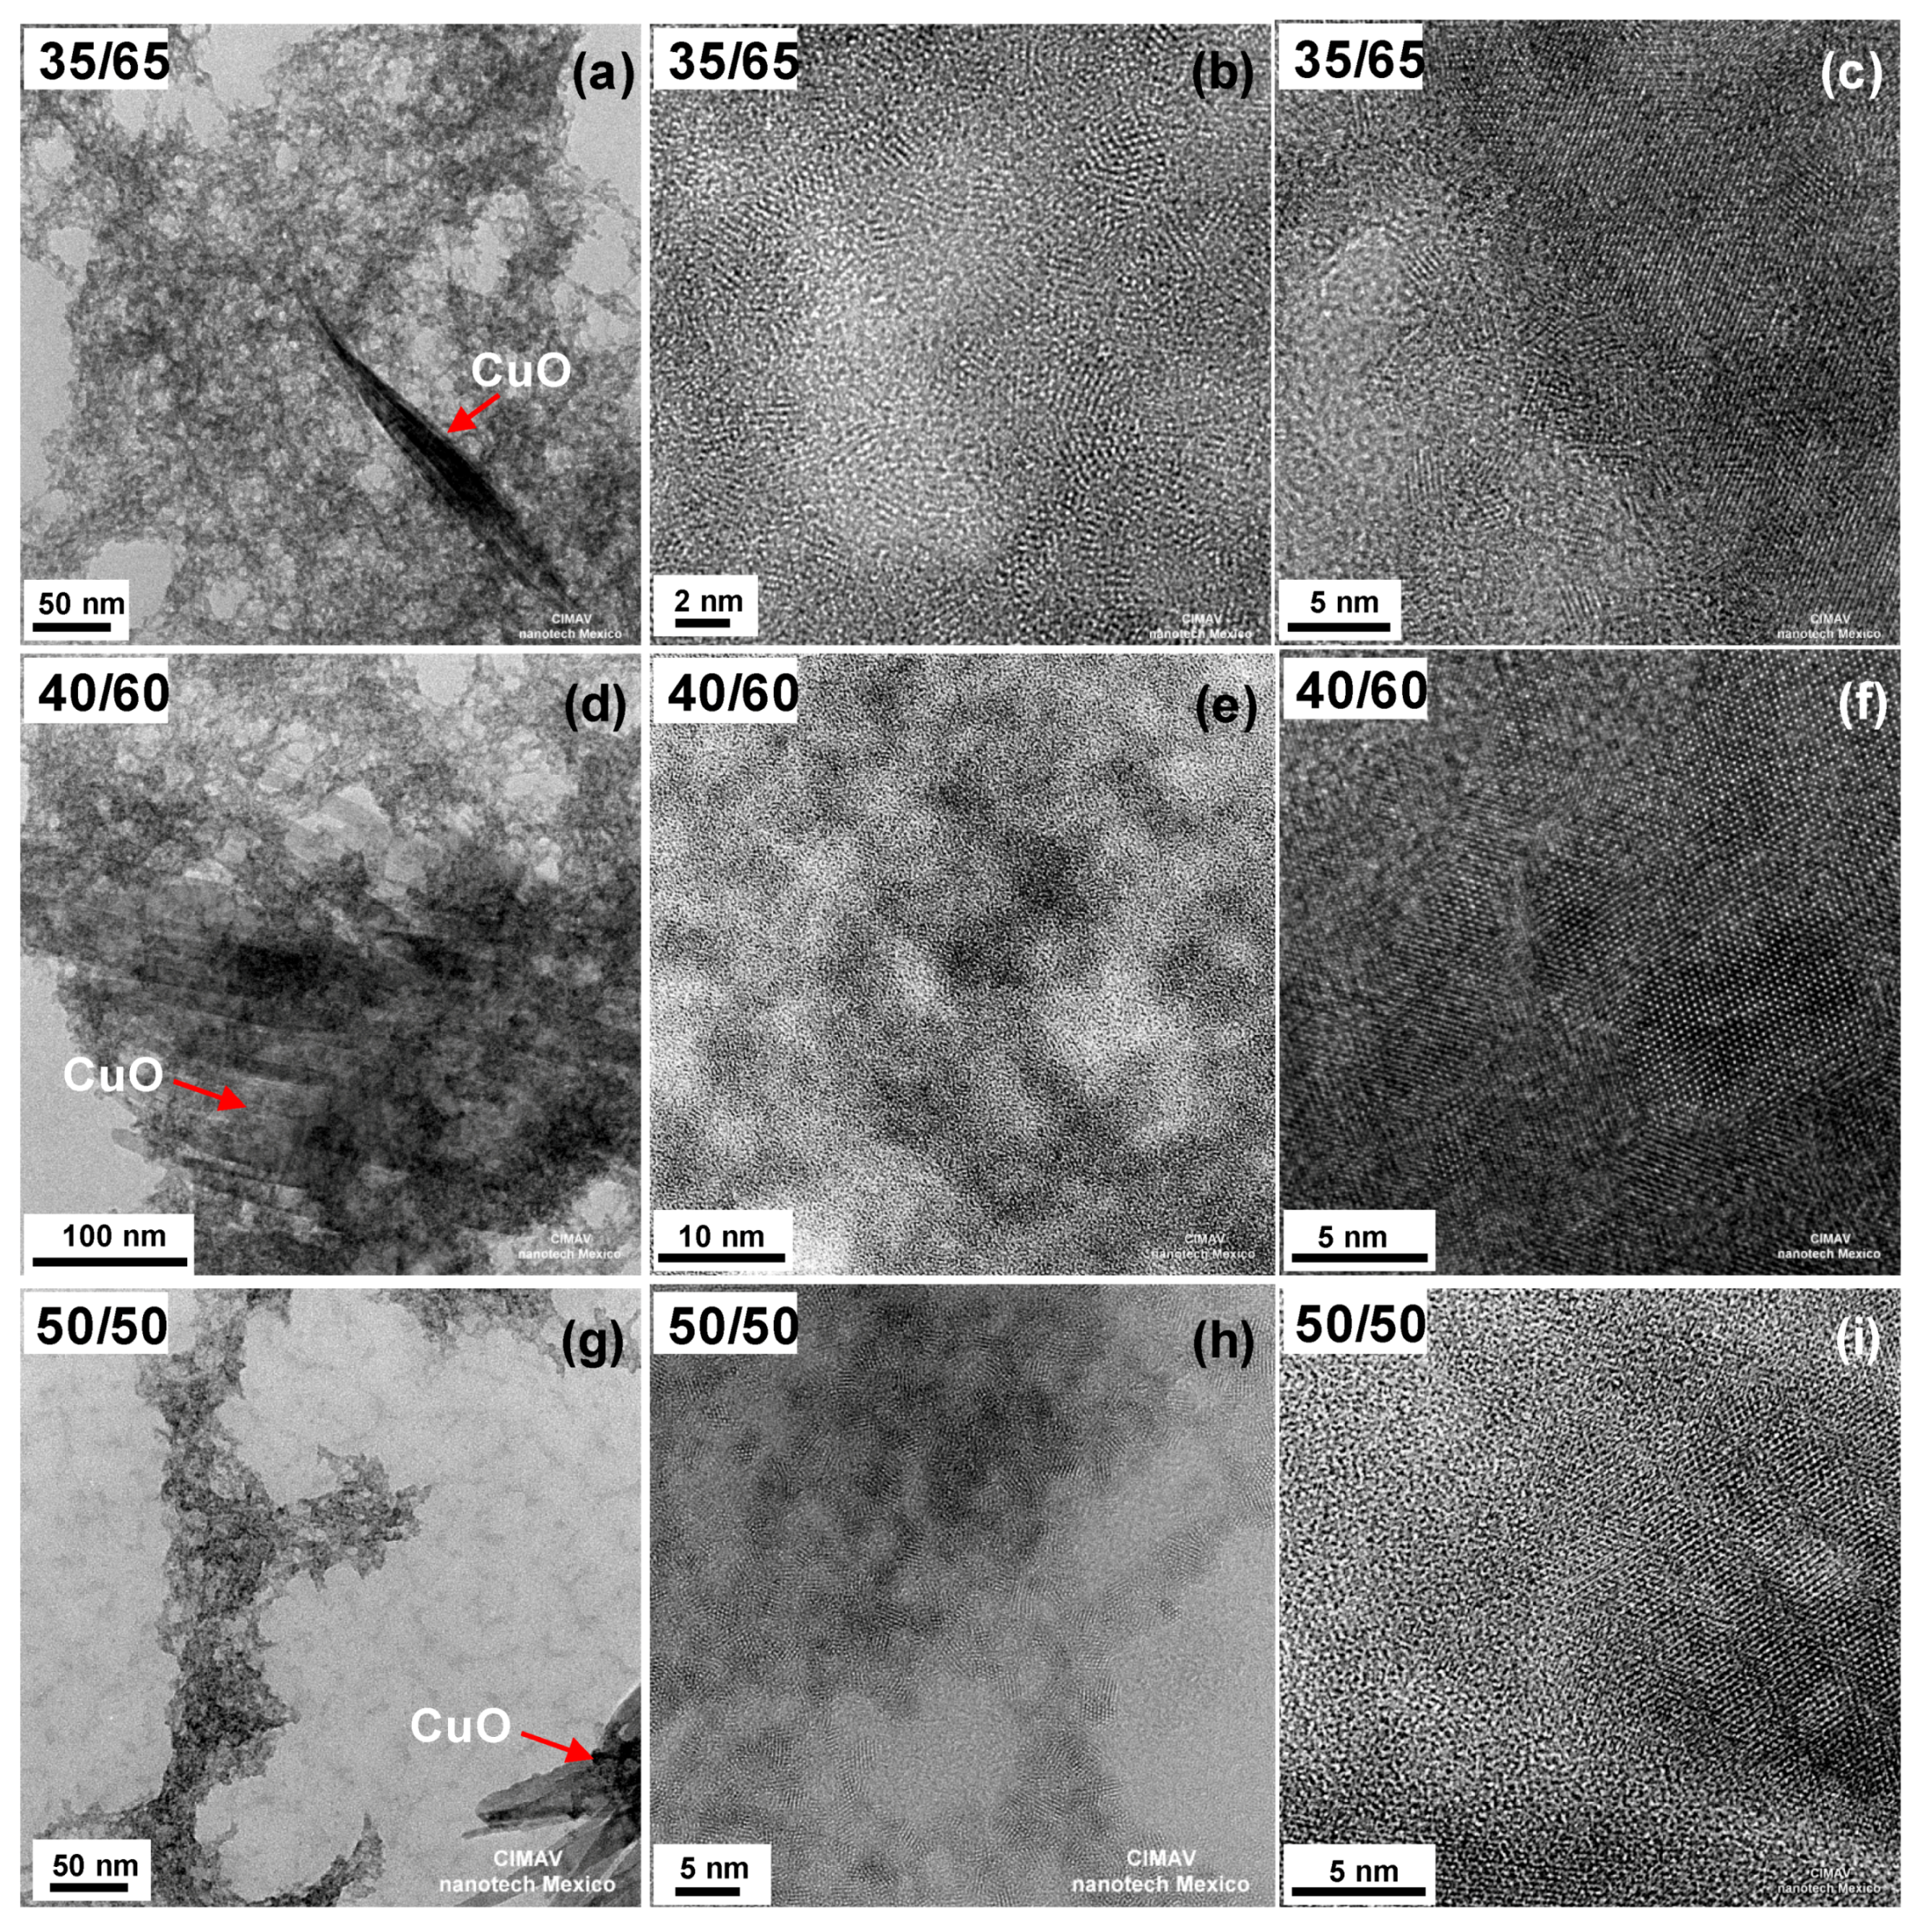
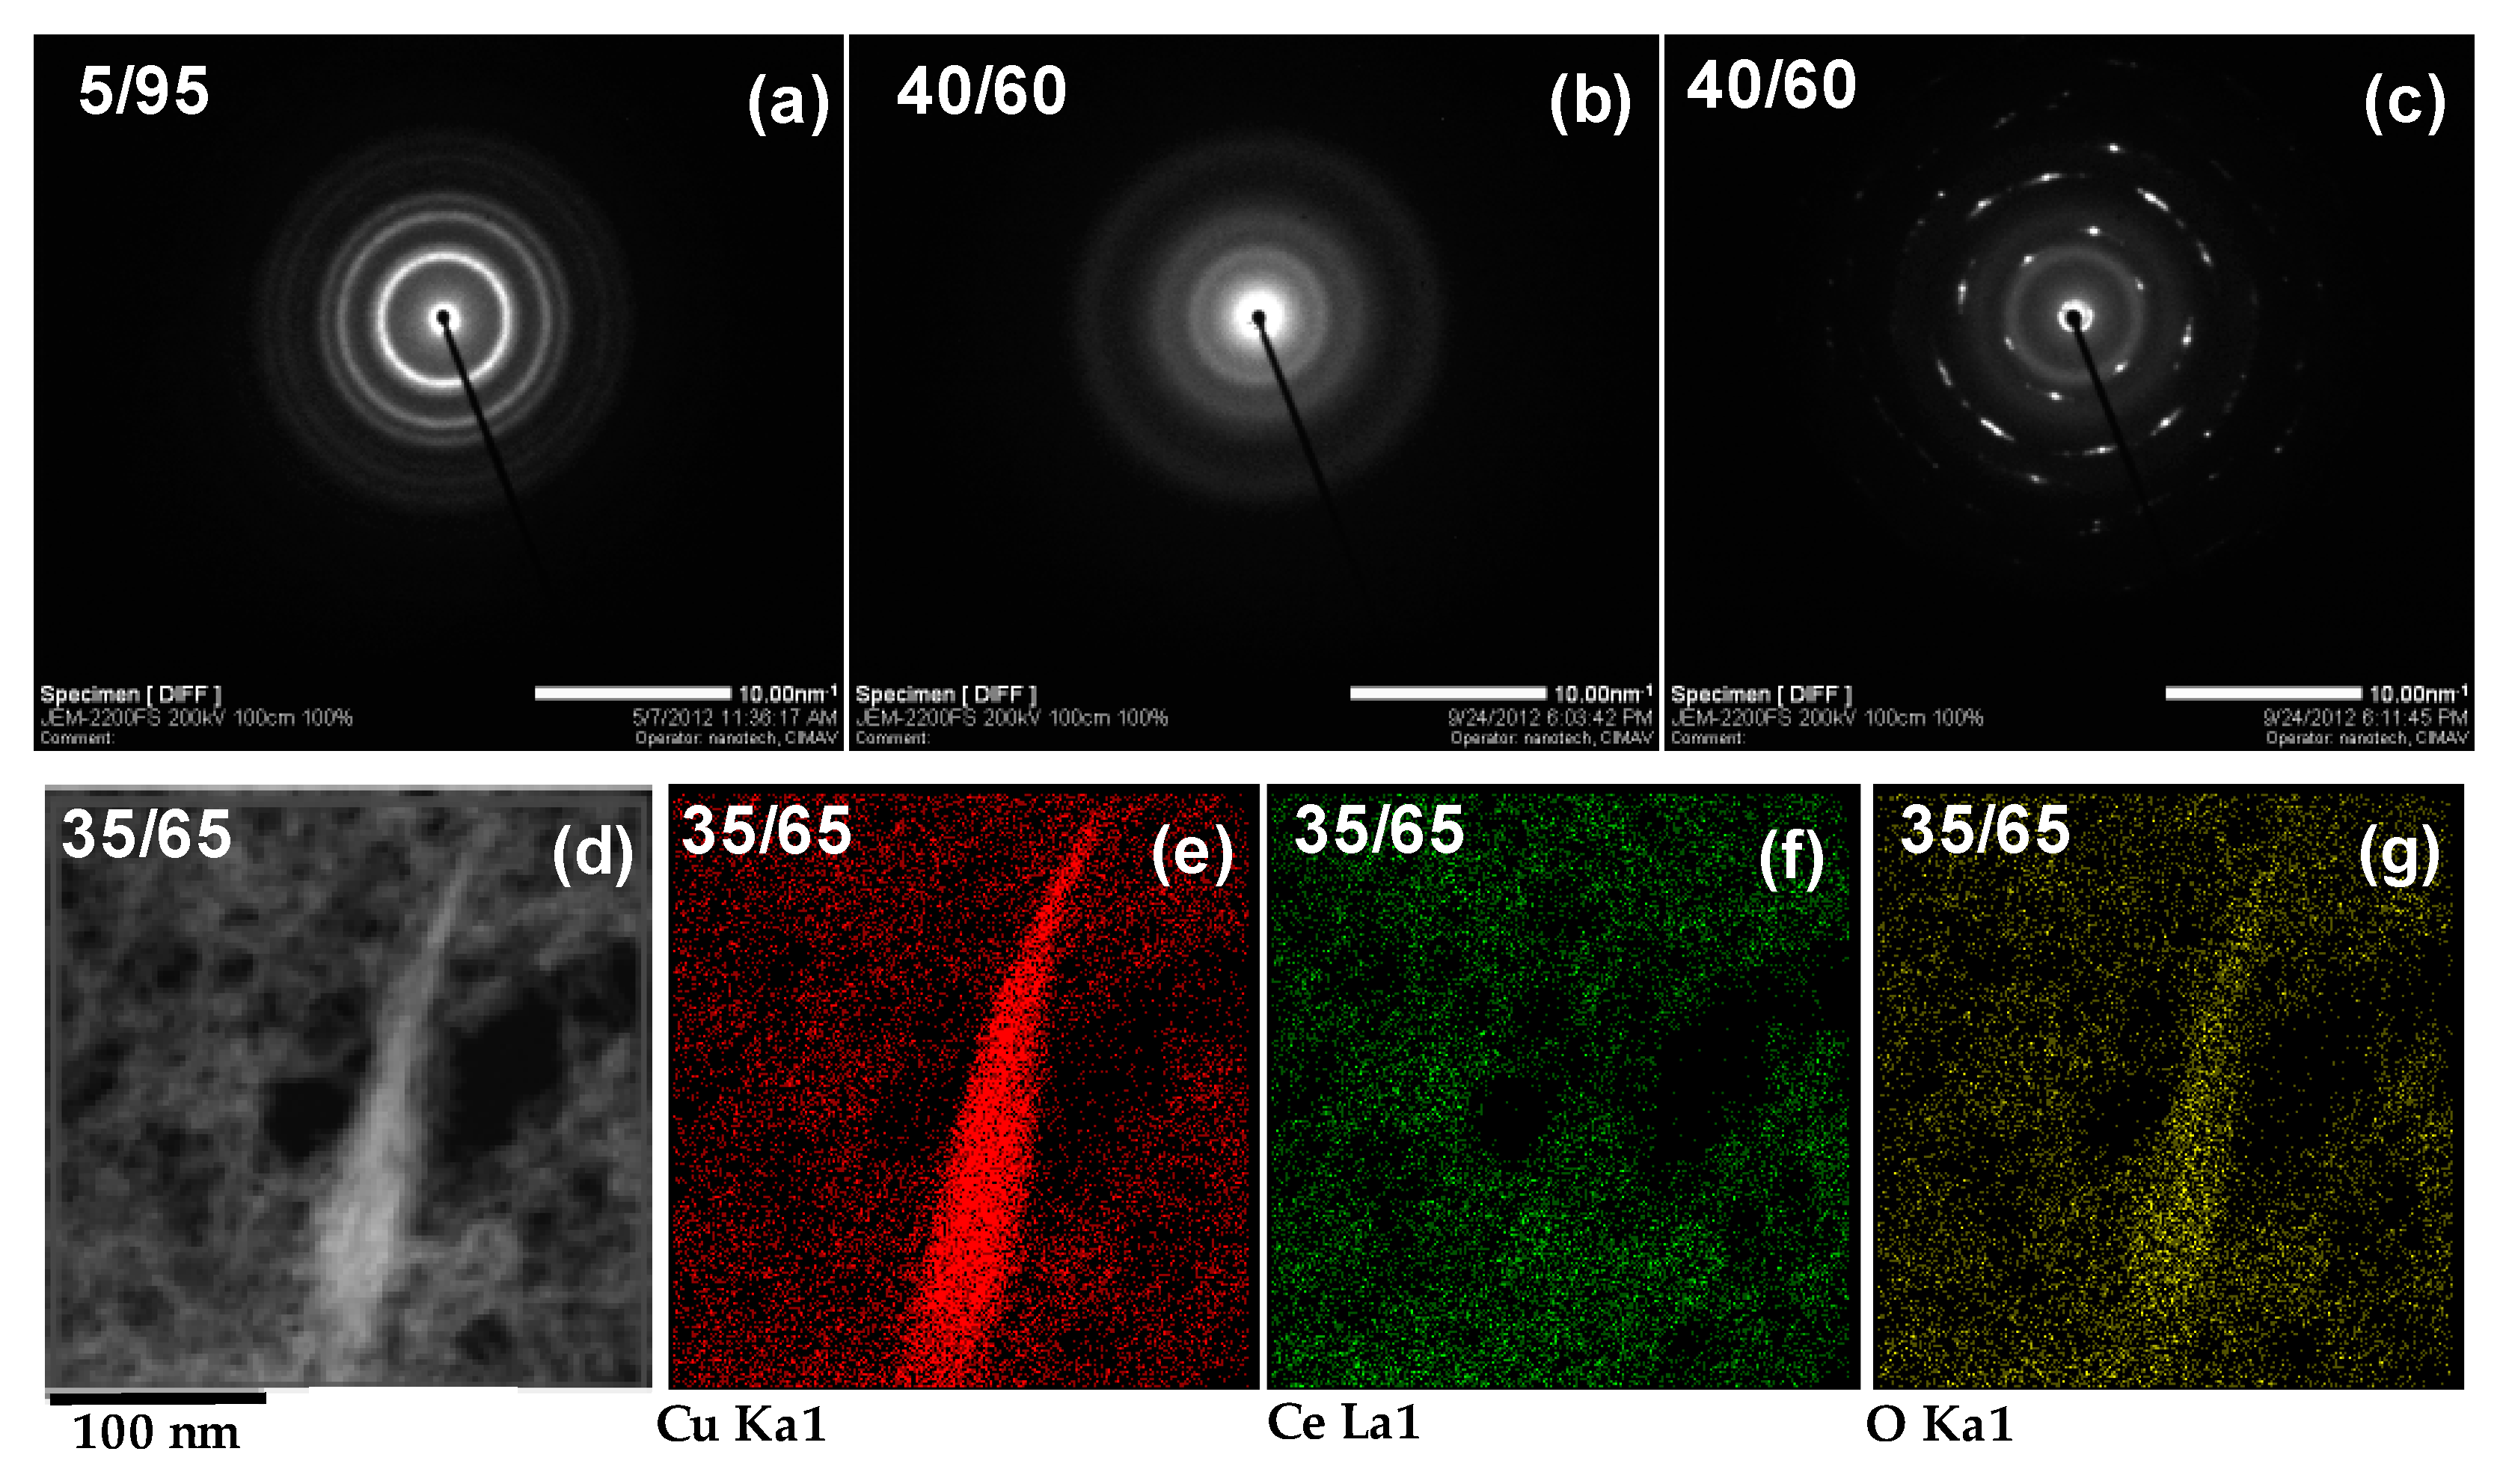
2.2.1. High Resolution Transmission Electron Microscopy (HRTEM)

Assessment of crystallinity and particle size was carried out by HRTEM (JEOL-2200FS, Tokyo, Japan). Figure 1 shows high resolution TEM images of non-calcined (as prepared) mixed oxide nanoparticles with different Cu/Ce molar ratio (from 0/100 to 30/70). In all cases, the particles formed agglomerates of different sizes. These agglomerates are comprised of many nanoparticles with a diameter in the order of 2–3 nm. This homogeneous morphology and size was observed in samples containing Cu/Ce molar ratio from 0/100 to 30/70, as observed in Figure 1a–e, which are representative images of these samples. Crystalline features can be observed in these samples, indicating that the agglomerates were made up of small nanocrystals, and the size of the nanocrystals as well as the agglomeration decreased as the Cu content was increased (this can be seen in Figure 1 as well as in Figure S1, which shows a general low magnification view of all samples). Analysis of the Fast Fourier Transform (FFT) images of several crystals for samples with Cu/Ce molar ratio up to 20/80, indicated the presence of the {111} plane of cubic CeO2 (d-spacing of 0.3125 nm, ICDD PDF No. 98-001-1731; examples of analyzed crystals of all samples are shown in Supplementary Materials, insets to Figure S1 and in more detail Figure S2). For these samples, only small crystals corresponding to the CeO2 cubic fluorite phase were identified. For the sample with Cu/Ce molar ratio 30/70, the crystalline features were more disordered.
Figure 2a–i shows TEM micrographs for samples with Cu/Ce molar ratio 35/65, 40/60 and 50/50. For these samples, two morphologies were identified. At Cu/Ce molar ratio 35/65, a minor population of thin nanotapes of ~10–20 nm width in coexistence with the small nanoparticles was also found (Figure 2a–c). For samples with Cu/Ce molar ratio 40/60 and 50/50, the nanotapes were more abundant with a greater tendency to self-assemble (Figure 2d–i). These observations indicate that above Cu/Ce molar ratio 30/70, Cu atoms are no longer incorporated into the CeO2 matrix (or its concentration is too high to remain well-dispersed), promoting their growth into thin CuO nanotapes.
As the Cu/Ce molar ratio was increased above 30/70, the size of the nanocrystalline domains decreased for the small nanoparticles morphology (Figure 2b,e,h). In fact, for the samples with Cu/Ce molar ratio 40/60 and 50/50, the crystalline features of the mixed oxide nanoparticles were scarce, thus this component of the material was practically amorphous, as shown in Figure 2e,h. On the other hand, Figure 2c,f,i show representative high-resolution images of the thin nanotapes. FFT analysis of the nanotape in Figure 2c indicates the presence of planes {111}, {−112}, {020}, {022}, {220}, {311} and {−131} of monoclinic CuO (corresponding to d-spacings of 0.232 nm, 0.196 nm, 0.171 nm, 0.142 nm, 0.138 nm, 0.130 nm and 0.109 nm, respectively; ICDD PDF No. 98-000-6038). Similar results were obtained with the FFT analysis of the nanotapes in Figure 2f,i. It was observed that the continuity of the crystalline planes of the monoclinic CuO nanotapes has a long range. The dimensions of these particles was about 10–20 nm in width and several hundred nanometers in length. Similar results were obtained for nanotapes of the samples with Cu/Ce molar ratio 35/65 and 50/50. Thus, at Cu/Ce molar ratio ≥35/65 crystalline, monoclinic CuO nanotapes were formed under mild conditions, in addition to the mixed Cu/Ce oxide small nanoparticles.
Evolution of the phases was confirmed by acquiring selected area electron diffraction patterns (SAED). Examples of diffraction patterns of samples synthesized with Cu/Ce molar ratio 5/95 and 40/60 are shown in Figure 3a–c. The pattern in Figure 3a show the faint rings characteristic of polycrystalline materials for the sample with Cu/Ce molar ratio 5/95; similar results were obtained up to Cu/Ce molar ratio 30/70, although as the Cu/Ce molar ratio was increased, the rings became less defined, in agreement with the observations from HRTEM images. These rings were indexed by comparing with the corresponding powder diffraction file (PDF) from the International Centre for Diffraction Data (ICDD): face centered cubic Cerium Oxide (CeO2 ICDD PDF No. 98-001-1731). For the sample with Cu/Ce molar ratio 40/60, no defined rings were observed in the material with small nanoparticle morphology, as shown in Figure 3b, confirming the amorphous nature of these particles; similar SAED patterns were obtained for the nanoparticle morphology of samples with Cu/Ce molar ratios 35/65 and 50/50. In contrast, the diffraction spots shown in Figure 3c correspond to a nanotape crystal of the sample with Cu/Ce molar ratio 40/60, which were indexed as the diffraction planes {111}, {110}, {200}, {020}, {-311}, {022}, {113}, {400}, {−131}, and {220} corresponding to the monoclinic CuO phase (ICDD PDF No. 98-000-6038). Similar results were obtained for the nanotape morphology of samples with Cu/Ce molar ratio 35/65 and 50/50.
In order to analyze the chemical element distribution and clearly relate it with the different morphologies and phases found by HRTEM analysis for certain samples, Energy Dispersive X-ray Spectroscopy (EDX) elemental mapping of the sample containing Cu/Ce molar ratio 35/65 was carried out and the results are displayed in Figure 3d–g. This sample was deposited onto an Au TEM grid in order to avoid contribution from the conventional Cu grid. The elements detected were Cu, Ce, and O. A Cu signal was detected in both the nanoparticles and the nanotapes. A cerium signal was observed in the nanoparticles, whilst an oxygen signal was found homogeneously distributed in the entire sample. This information corroborates the aforementioned assignment of phases: in the small nanoparticles with cubic CeO2 structure, Cu and Ce are homogeneously distributed suggesting the formation of a mixed Cu-Ce oxide or an excellent dispersion of Cu onto CeO2, whilst the thin nanotapes are composed only by CuO.

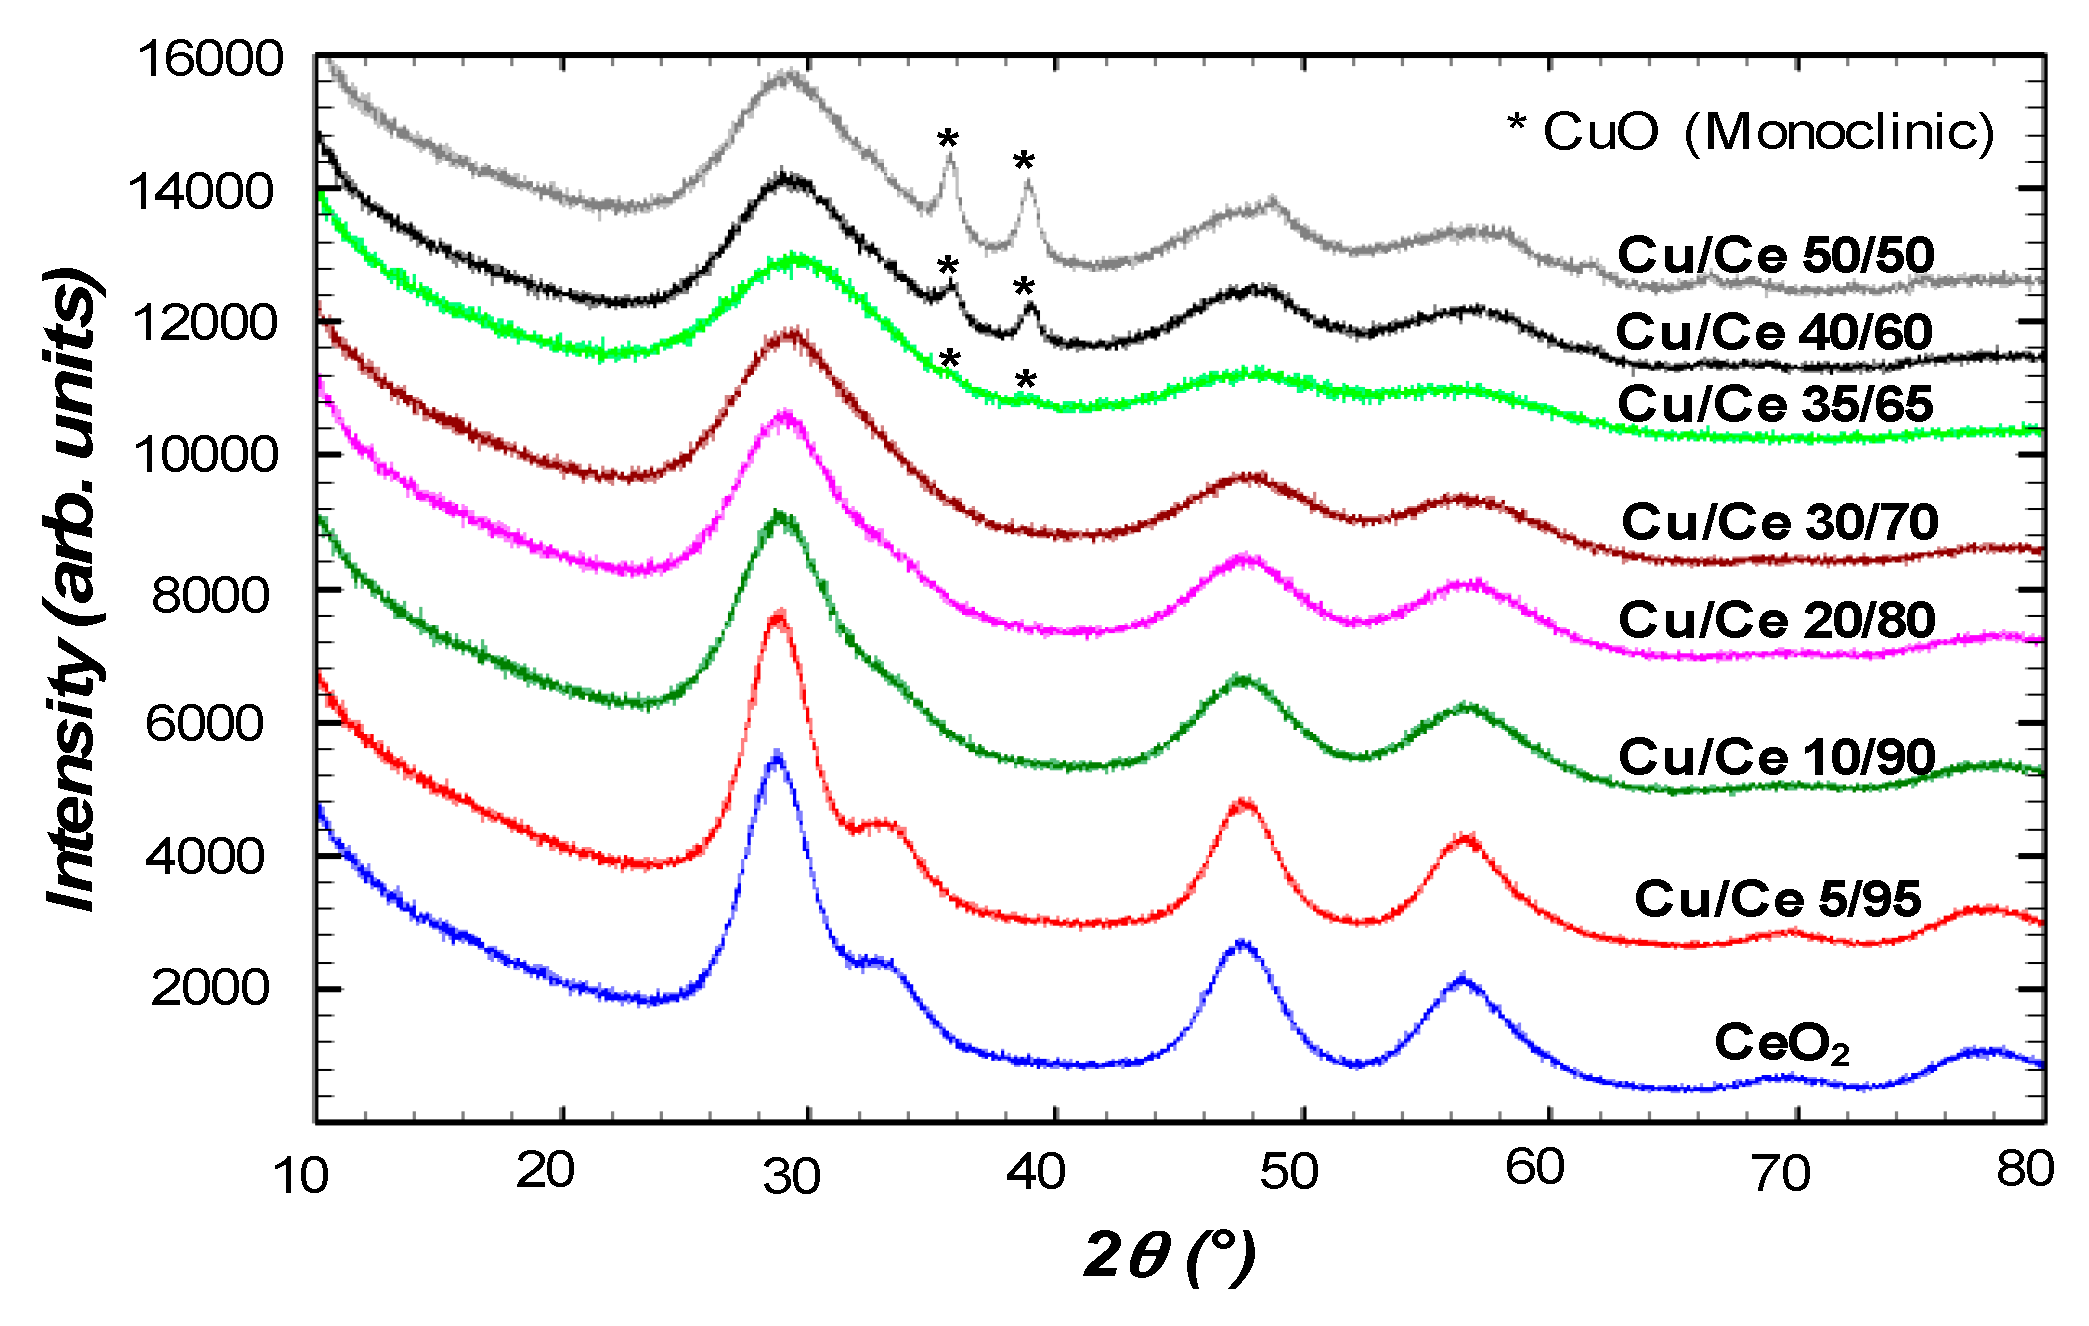
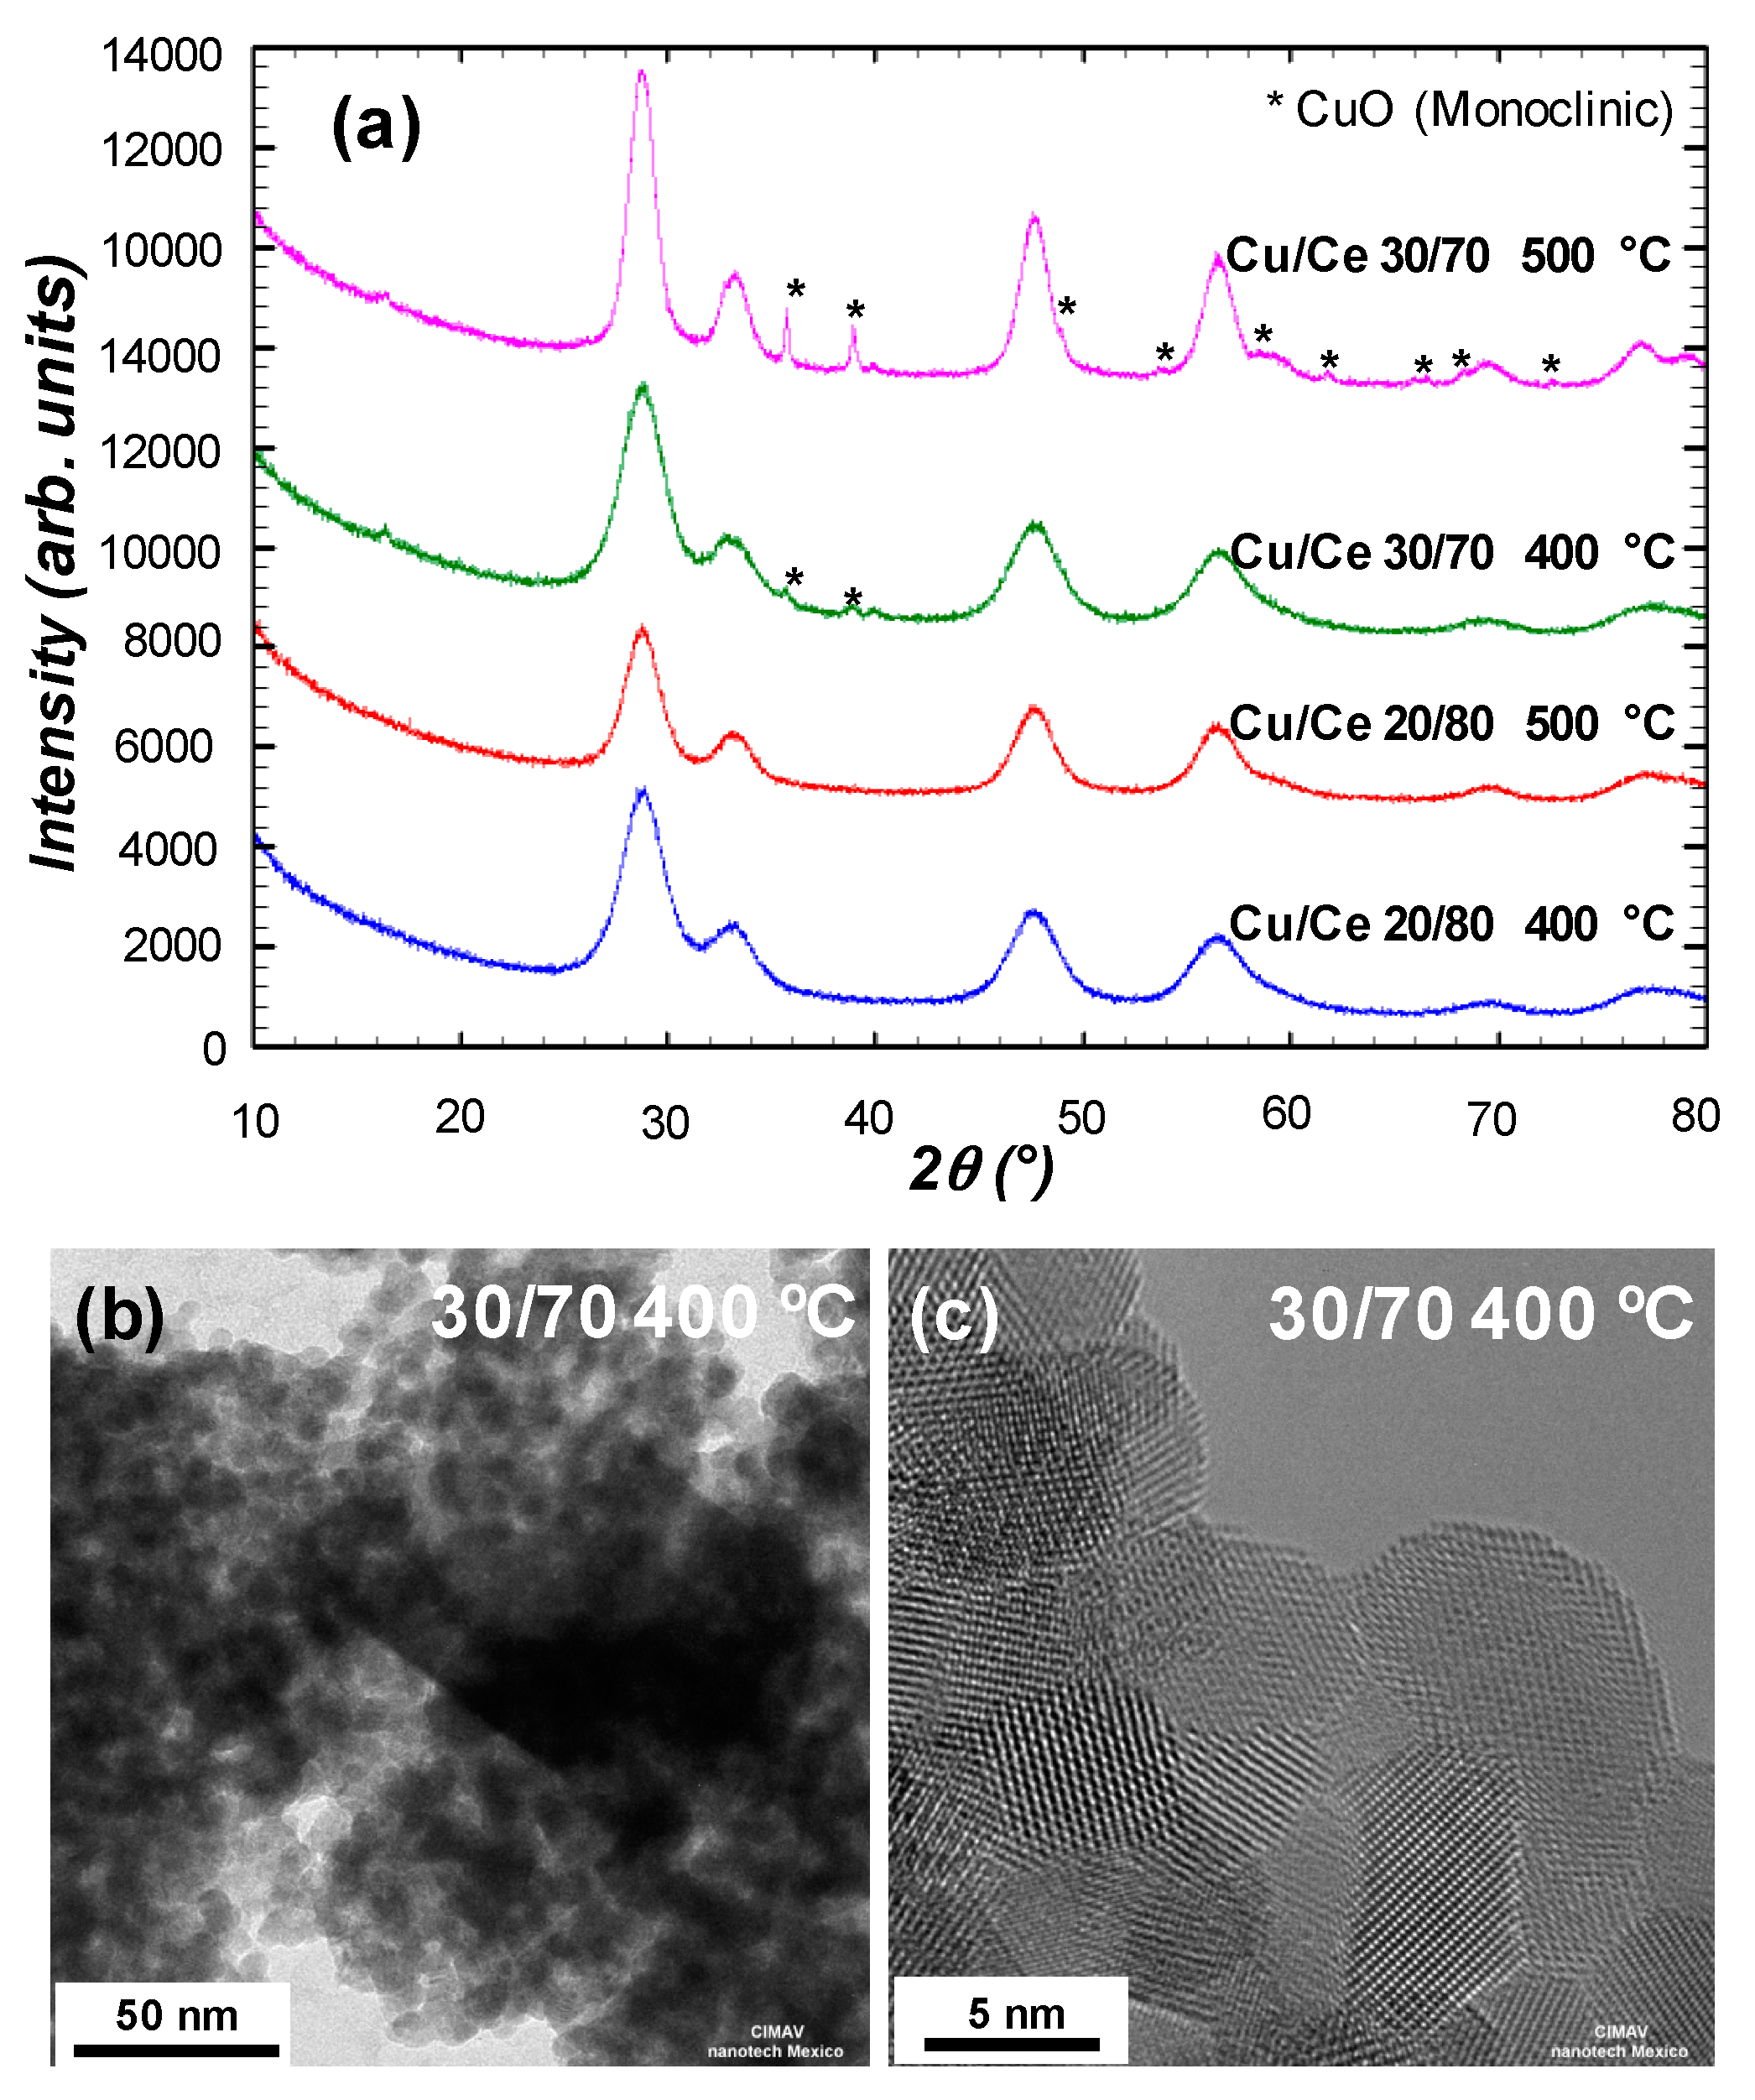
2.2.2. X-ray Diffraction

The overall crystallinity of the non-calcined (as obtained) samples was further studied by XRD and results are presented in Figure 4. Below Cu/Ce molar ratio 35/65, the crystal structure of mixed Cu/Ce oxide nanoparticles (CuxCe1-xO2-δ) was identified with the characteristic reflections of the fluorite-type face-centered cubic ceria (CeO2) phase (ICDD PDF No. 98-001-1731). As the content of Cu increased, the characteristic reflections became wider, indicating lower crystallinity, in agreement with the results from HRTEM, which showed smaller and less defined crystalline domains. As shown in Table 2, the position of the main reflection was shifted from 28.71° (CeO2) to 29.35° (Cu/Ce molar ratio 35/65), which may suggest the incorporation of Cu into the CeO2 FCC lattice, since a shift of 2θ to larger values is an indication of smaller characteristic lattice dimensions, which is in agreement with the smaller size of Cu2+ as compared to Ce3+ or Ce4+ ions. However, due to the large broadening of the reflections of the as-obtained samples, this shift may be overestimated. On the other hand, for the sample with Cu/Ce molar ratio 35/65, additional reflections were detected and confirmed the presence of CuO monoclinic phase (ICDD PDF No. 98-000-6038). Thus, at Cu/Ce molar ratios 35/65, 40/60, and 50/50, samples were composed of a mixture of oxides with a main phase of Cu/Ce mixed oxide and an excess of monoclinic CuO phase. In addition, in agreement with HRTEM results at the compositions with Cu ≥35%, although the characteristic reflections for cubic ceria were observed, these reflections were very wide, indicating that crystallinity was rather poor. The crystallite size (dXRD) of the Cu/Ce mixed oxide nanoparticles was estimated using the Scherrer equation as a function of Cu/Ce molar ratio. The dXRD and the corresponding 2θ for all samples are collected in Table 2.
Samples containing Cu/Ce molar ratios 20/80 and 30/70 were calcined at 400 °C and 500 °C so that the incorporation of Cu into the CeO2 crystal lattice could be investigated with consistence. The characteristic reflections of the fluorite-type cubic crystal structure were still observed for both calcined materials except that their reflections were much more defined than before calcination (Figure 5a). This observation can be explained by the increase of crystallite size as approximated by the Scherrer equation and values are presented in Table 3. The main reflection presented a much lower shift in the calcined samples, remaining close to 28.7° (28.74°–28.77°), in contrast to the corresponding non-calcined samples (28.93°–29.12°). The nanomaterial containing Cu/Ce molar ratio 20/80 presented no additional reflections after calcination. However, the sample with Cu/Ce molar ratio 30/70 presented additional reflections, characteristic of monoclinic CuO. HRTEM images in Figure 5b,c confirmed the formation of the CuO phase in the form of elongated structures upon calcination as well as the increased crystallinity of the Cu/Ce mixed oxide nanoparticles.

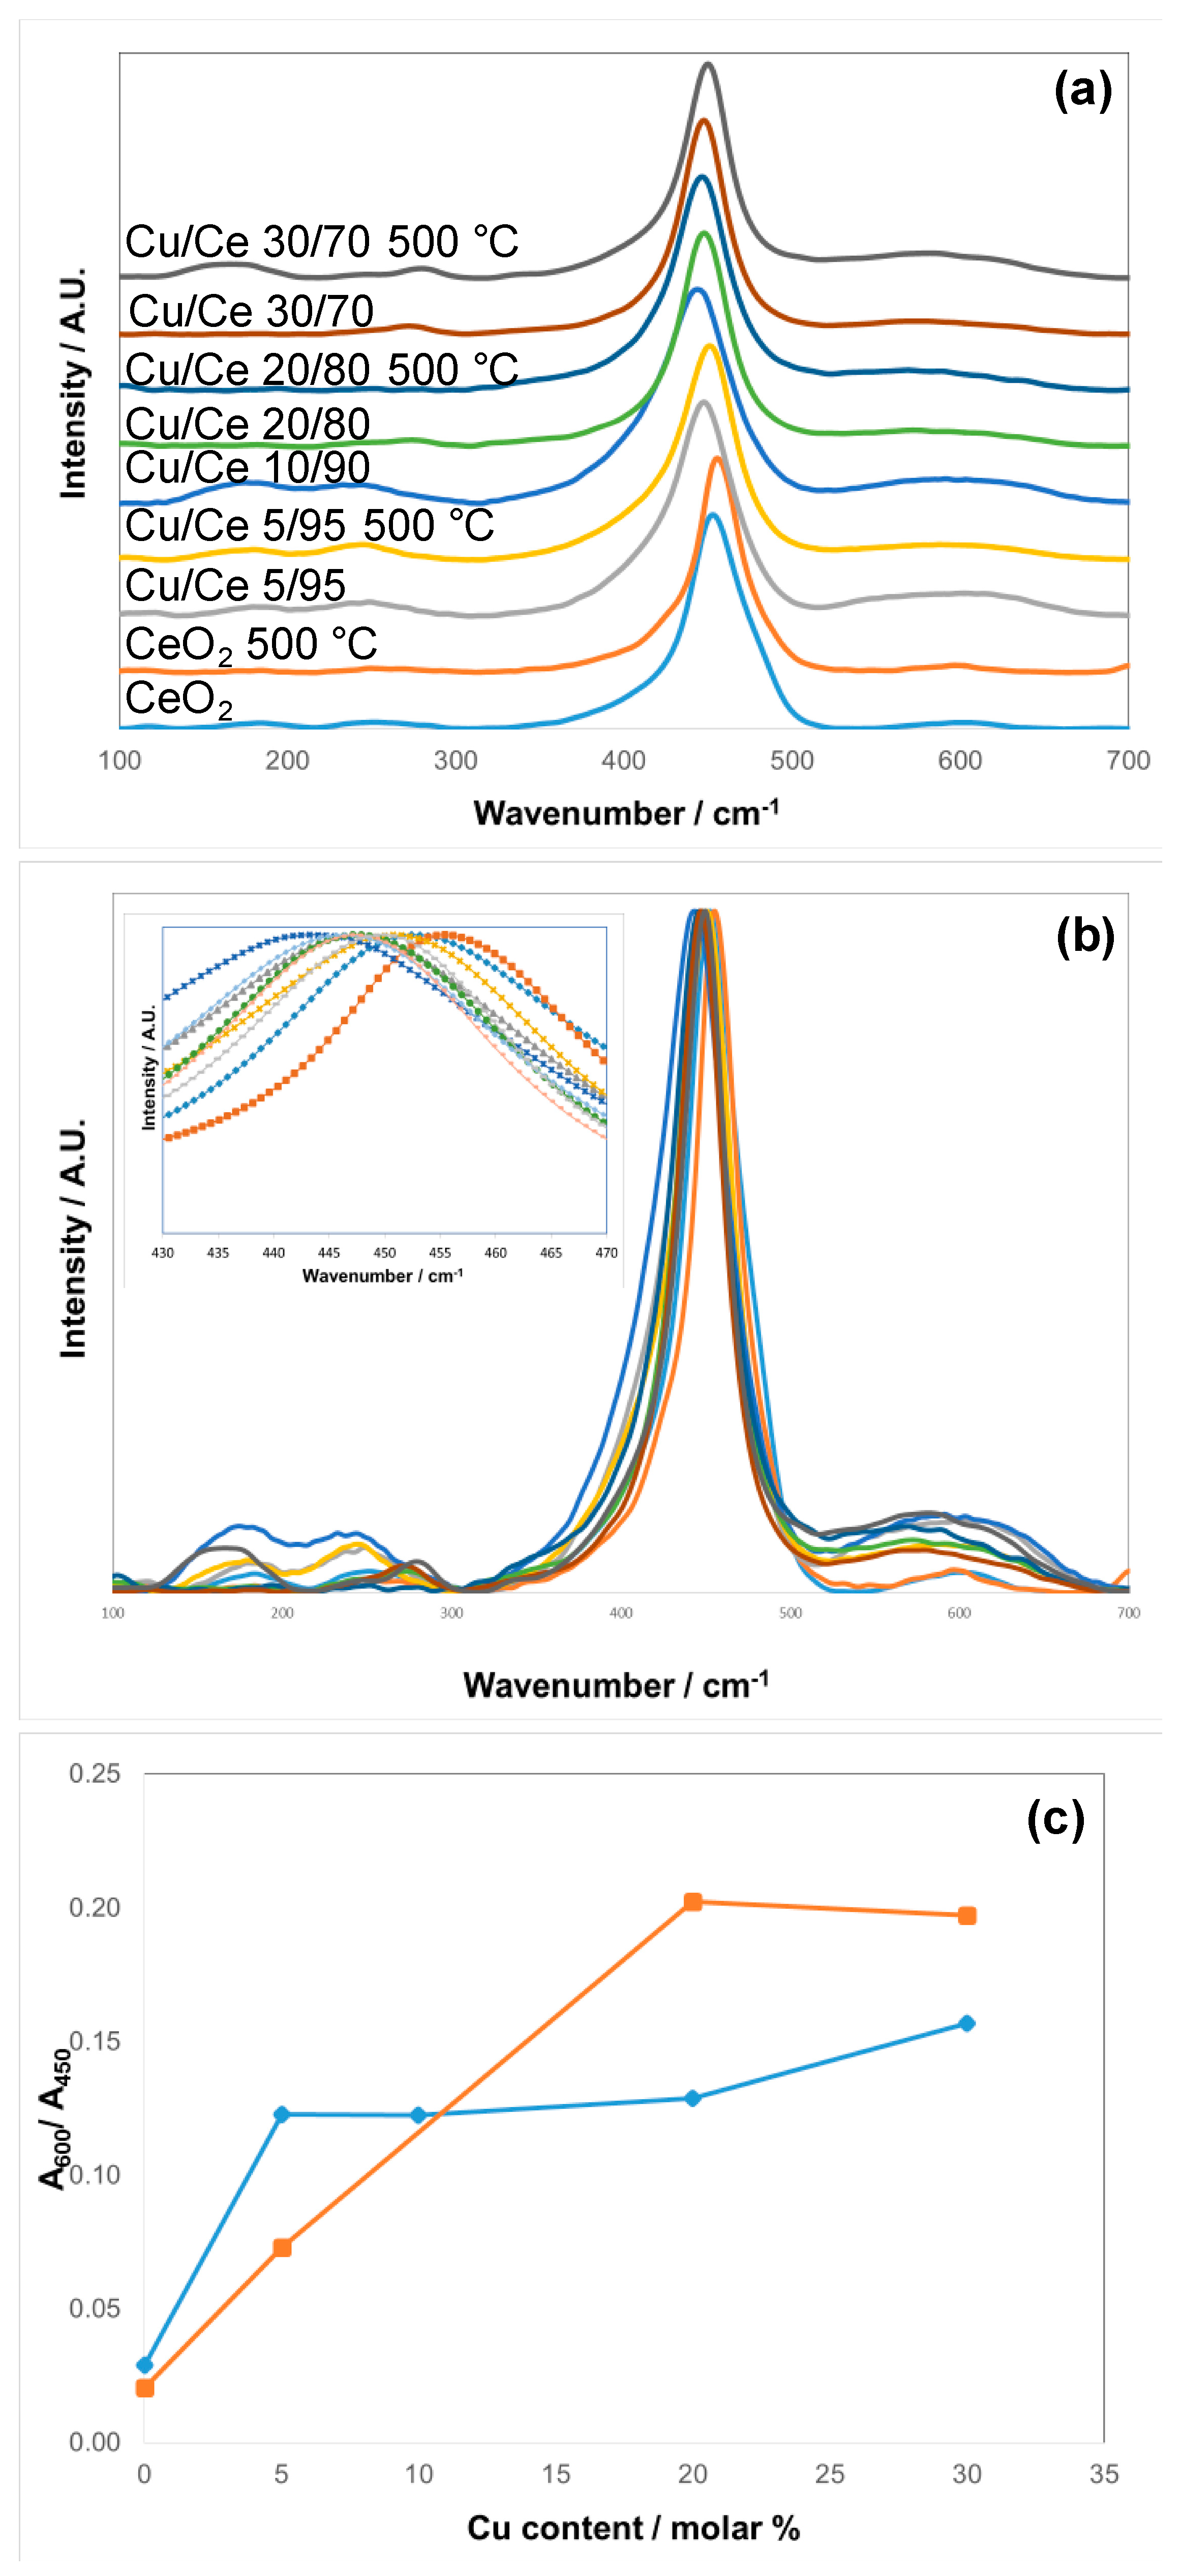
2.2.3. Raman Spectroscopy

Raman Spectroscopy was used for further investigation of the structure of selected non-calcined (as prepared) and calcined samples. The main feature of such CeO2 based materials is the F2g Raman active mode of the CeO2 fluorite phase, which for bulk CeO2 it is located at 465 cm−1 [33], whereas for nanosized CeO2 materials it has been reported in the range of 460–466 cm−1 [34]. The Raman spectra for these fluorite-type oxide structures are dominated by oxygen lattice vibrations and are sensitive to crystalline symmetry [35]. Figure 6a,b shows the Raman spectra; for comparison purposes, the intensities have been normalized. The samples display the characteristic and relatively intense F2g band, centered at 452 and 455 cm−1 for CeO2 as-obtained and calcined at 500 °C (CeO2 and CeO2 500 °C); 447 and 451 cm−1 for Cu/Ce 5/95 and Cu/Ce 5/95 500 °C; 443 cm−1 for Cu/Ce 10/90; 446 and 447 cm−1 for Cu/Ce 20/80 and Cu/Ce 20/80 500 °C; and 447 and 449 cm−1 for Cu/Ce 30/70 and Cu/Ce 30/70 500 °C (see shift in the inset of Figure 6b). The other important feature of the Raman spectra is the band extending from 500 to 650 cm−1 (Figure 6c); this band has been assigned to oxygen vacancies [36]. Other bands were observed between 100 and 300 cm−1.

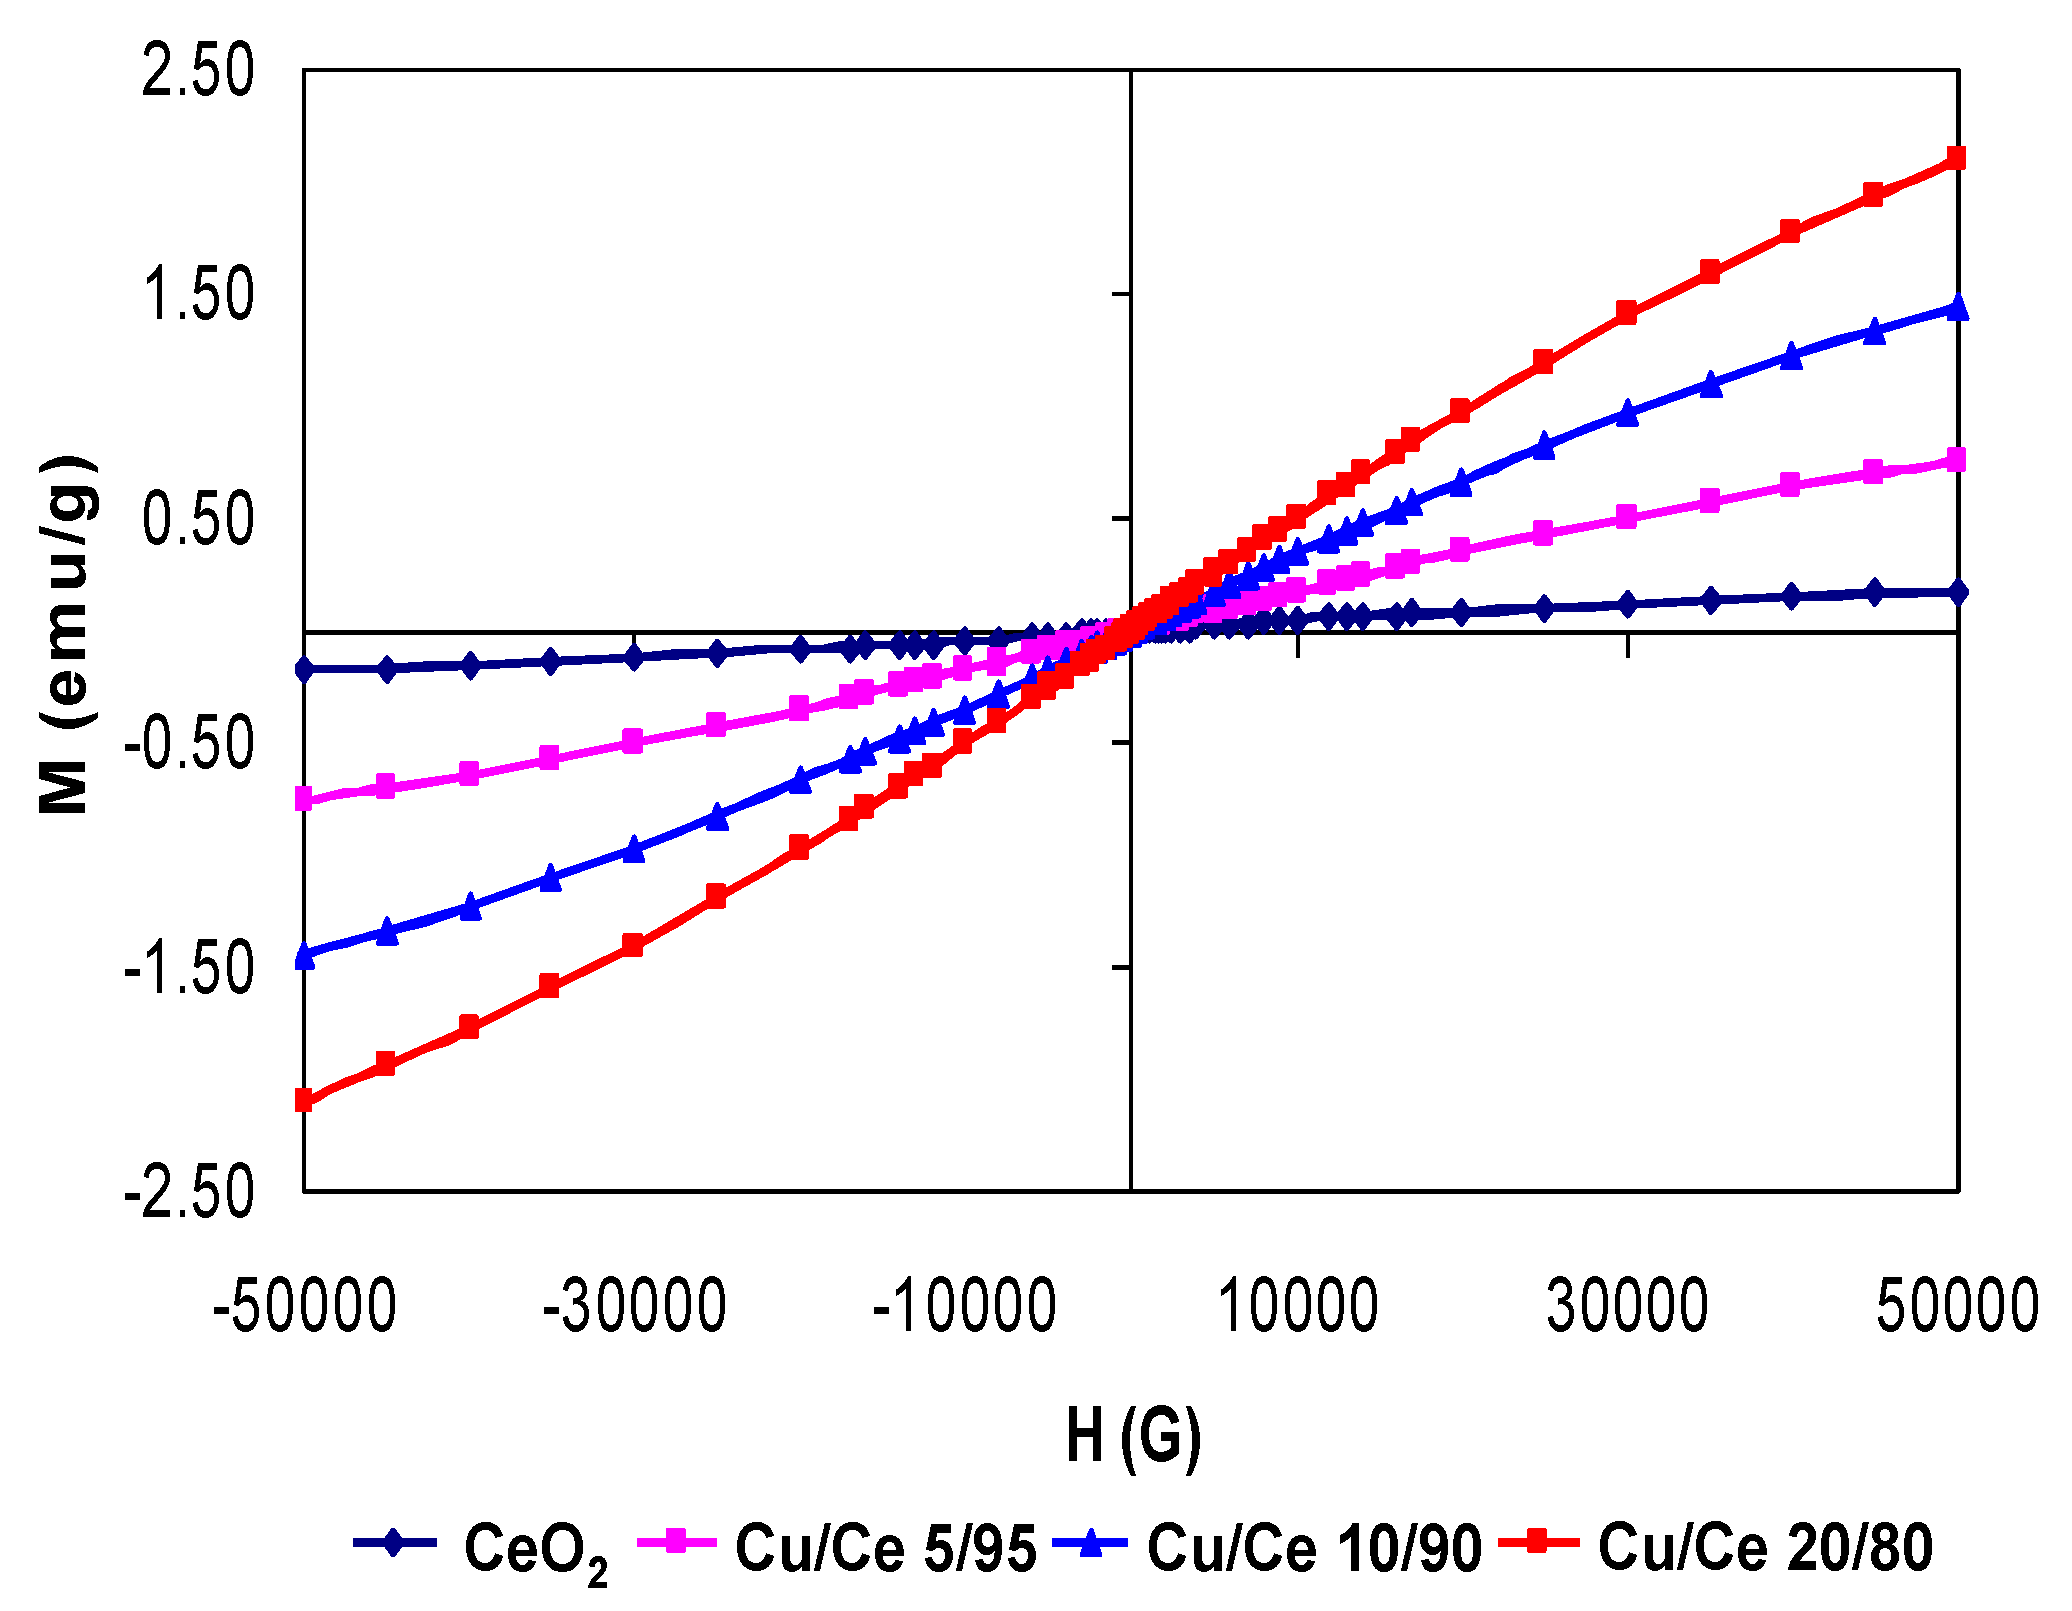
2.3. Magnetic Properties

Assessment of the magnetic properties of selected samples was carried out at 5 K (−268.15 °C) in order to find out the influence of incorporating Cu into CeO2 (Figure 7). At 300 K the magnetic response of CeO2 nanoparticles was very small upon applying a magnetic field up to 50 kG whereas at 5 K, a certain magnetic response was noticed. This magnetic behavior may be explained by the surface defects of CeO2 nanoparticles. A comparison of the magnetic properties of two Cu/Ce mixed oxides was also carried out (Figure 7). At a higher amount of Cu in the CeO2 lattice, a higher magnetization response is achieved. Indeed, for pure CeO2 the maximum magnetization response at H = 5 kG is ~0.25 emu/g whereas for Cu/Ce 20/80, the maximum magnetization response is ~2.1 emu/g. It should be noted that by applying a magnetic field up to 50 kG the magnetization saturation was not achieved which means that all the spins were not yet aligned at lower magnetic fields. Therefore, by doping CeO2 lattice with Cu, the magnetic properties could be tuned from diamagnetic to paramagnetic behavior since no hysteresis could be detected.

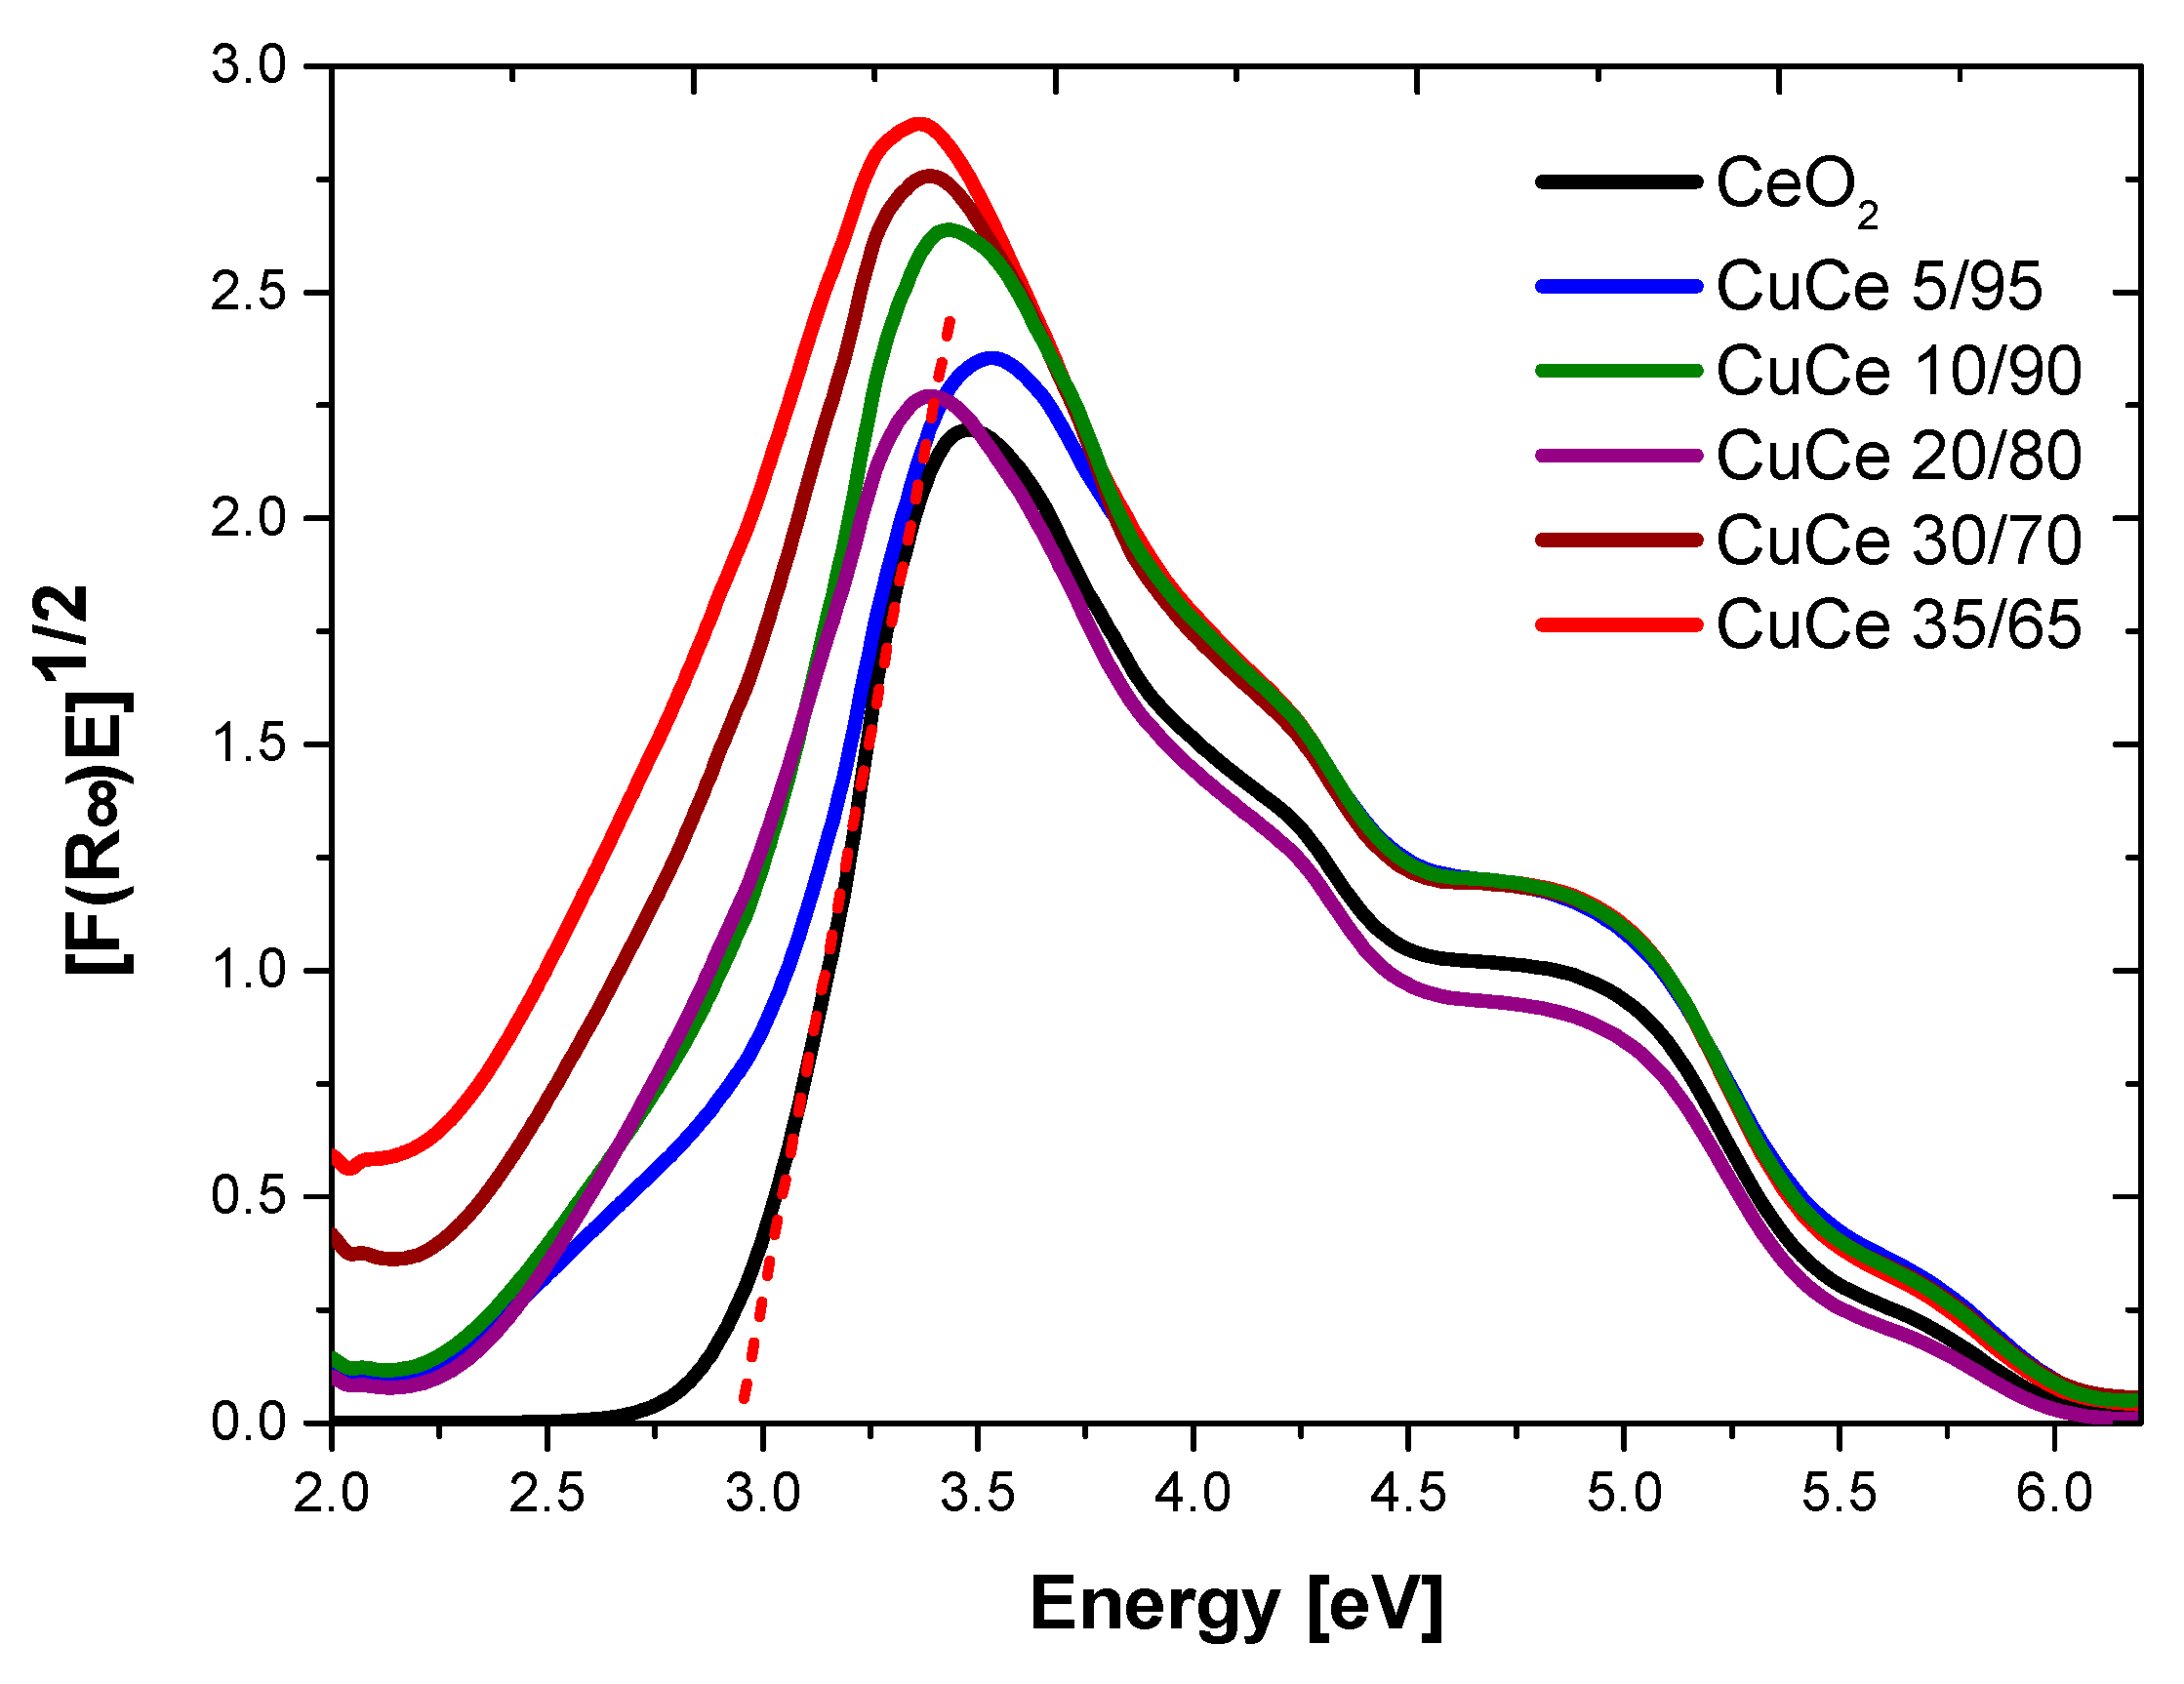
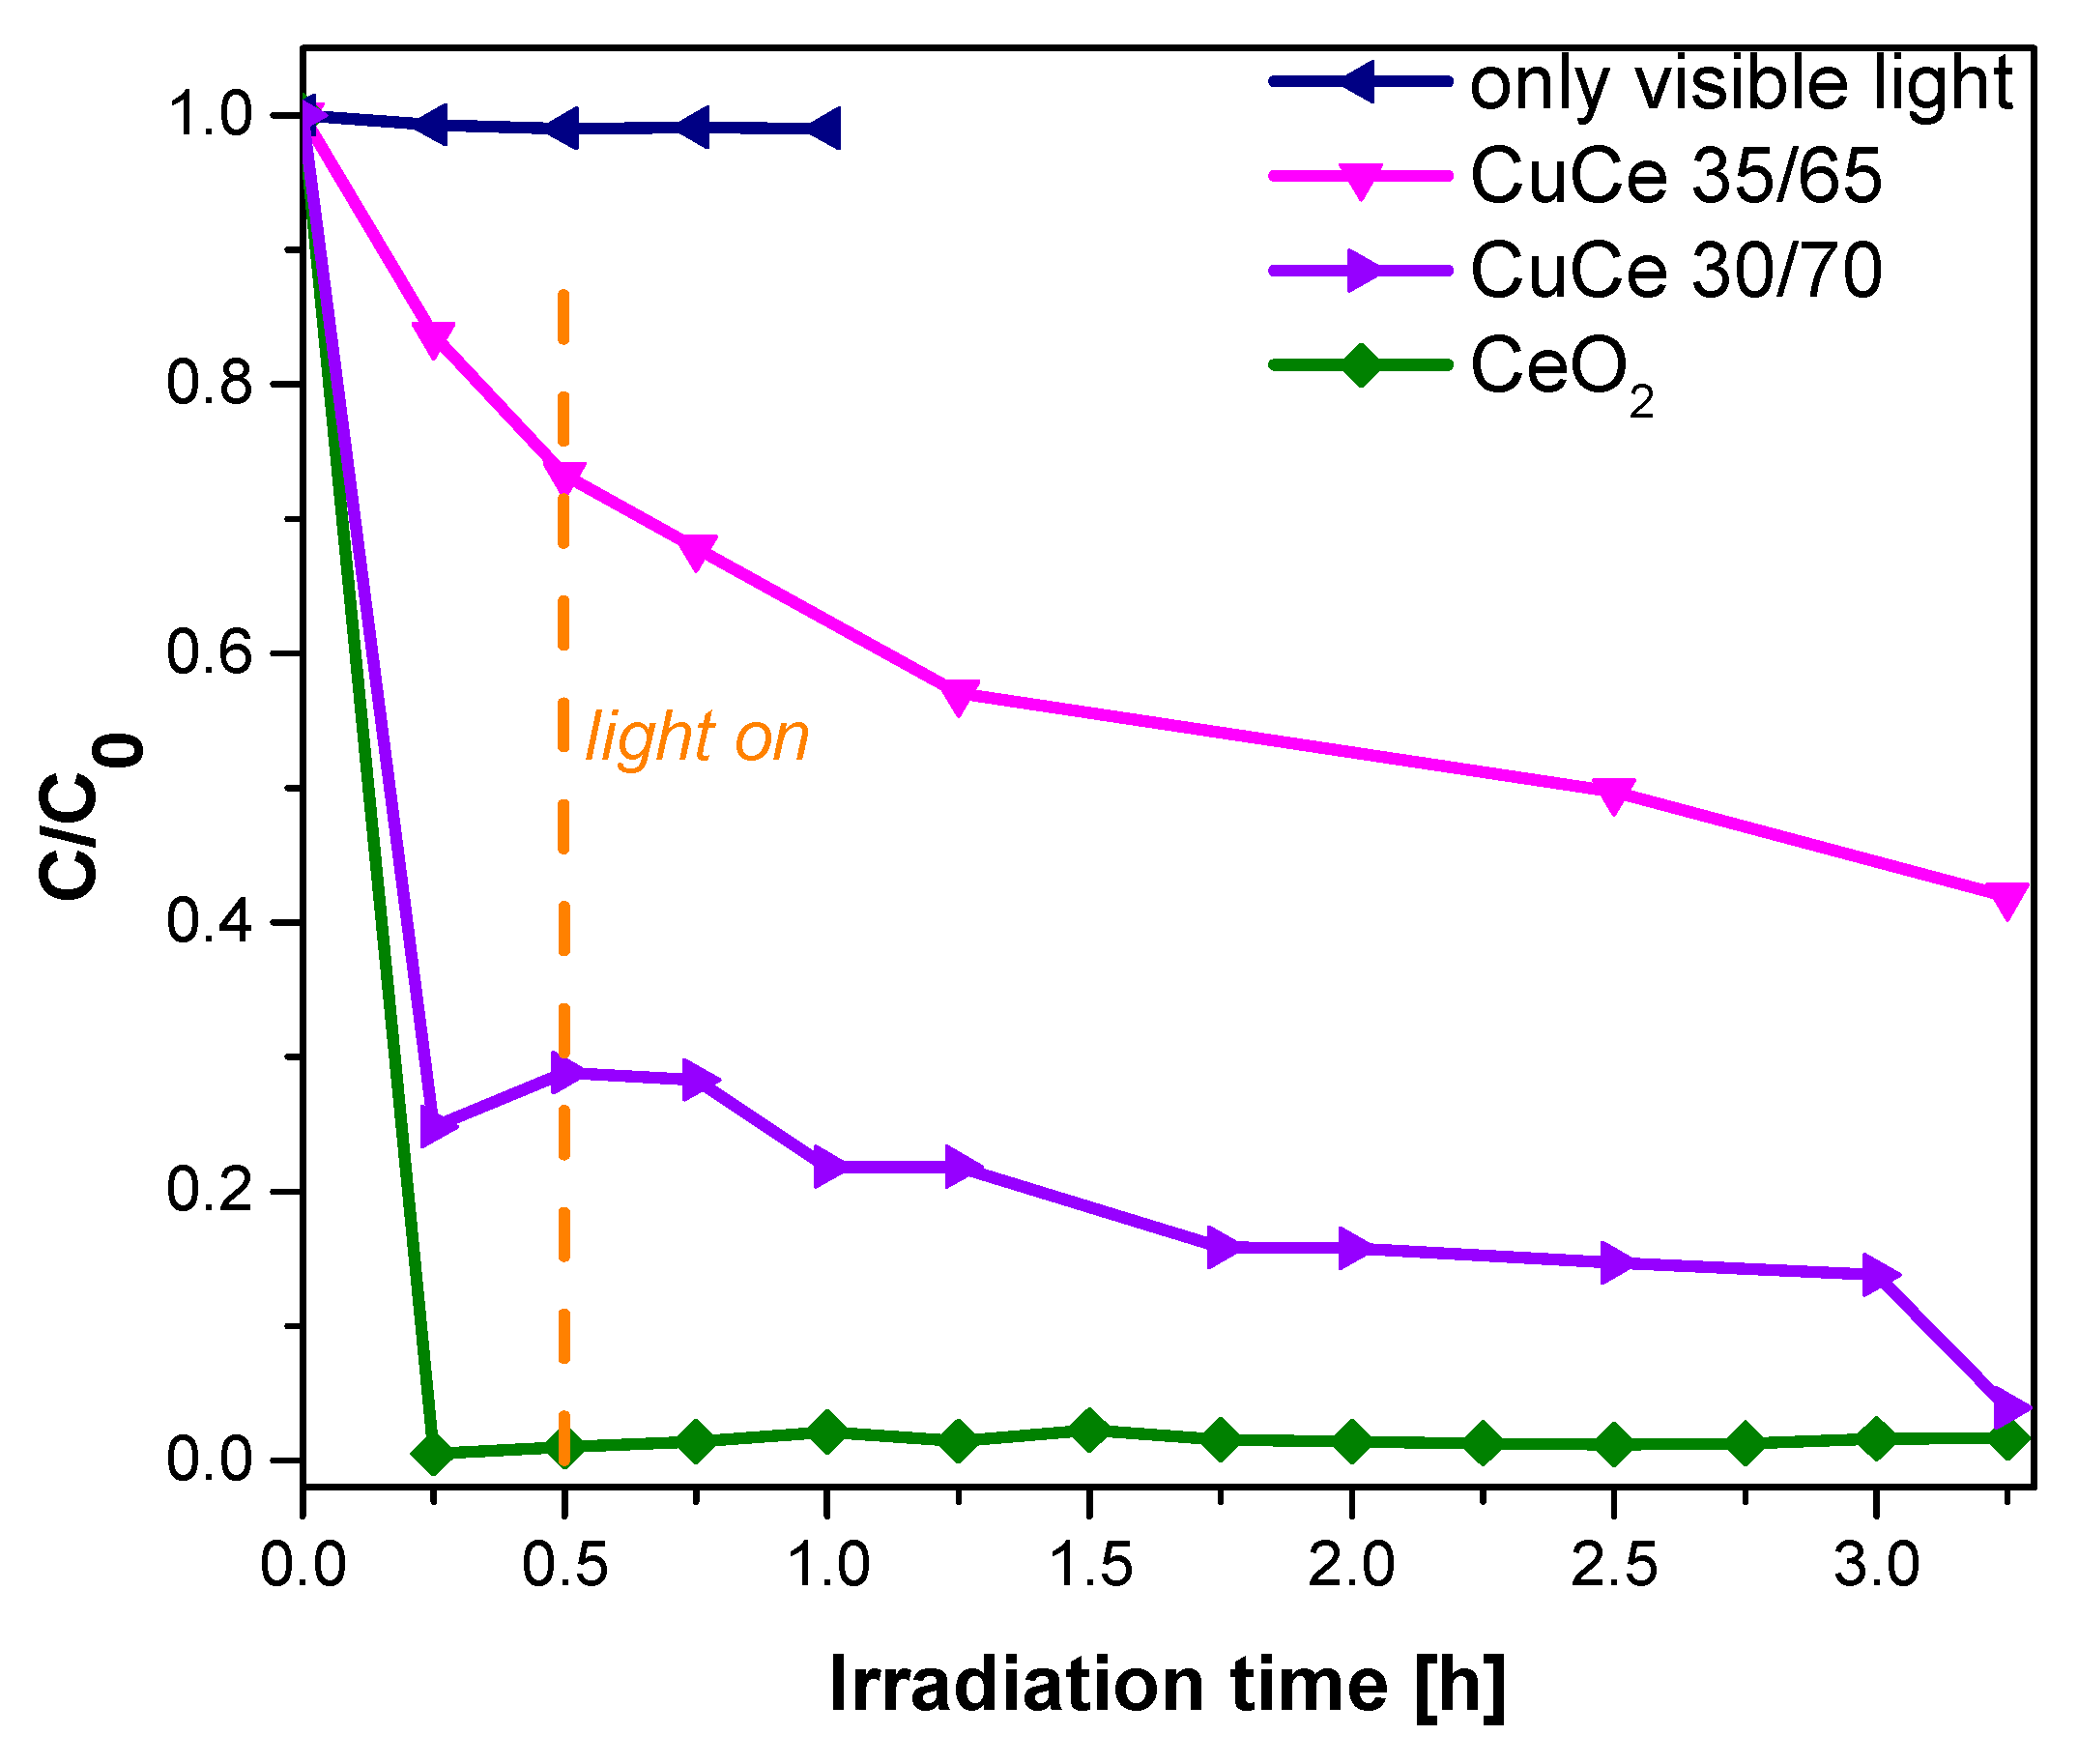
2.4. Optical Properties and Photocatalytic Degradation of Indigo Carmine

The bandgap energy (Eg) of Cu/Ce samples was calculated by Kubelka-Munk function [37] as shown in Figure 8. It is clearly observed that all samples exhibited absorption in the visible light interval, and the Eg values are lower than 3.0 eV, calculated Eg are shown in Table 4. The Eg value of CeO2 nanoparticles was 2.91 eV, whereas samples containing different Cu/Ce molar ratio resulted in Eg values in the order of 2.85–2.27 eV.
The photodegradation of Indigo Carmine using Cu/Ce (30/70 and 35/65) oxides as photocatalyst was explored under visible light. Figure 9 shows the evolution of C/C0 including the curve obtained from the photolysis and the use of the CeO2 sample as photocatalyst for comparison purposes. Accordingly, it is observed that CeO2 immediately adsorbs the dye completely, whereas samples containing copper show less dye adsorption, increasing the photodegradation of the dye. In this case, the use of Cu/Ce samples as photocatalyst allow the photodegradation of about 60% of the initial dye concentration after 3 h for sample Cu/Ce 35/65; whereas sample Cu/Ce 30/70 reached almost 100% removal in the same time, but this sample is still experiencing rather strong dye adsorption. In conclusion, the increment of Cu in the Cu/Ce samples diminishes the absorption and enhances the photodegradation of the Indigo Carmine.

3. Discussion

3.1. Microemulsion Formation and Particle Synthesis

The slight variation of temperature at which microemulsions were formed when the Cu/Ce ratio was increased may be explained by a different interfacial activity of the Cu (II) and Ce (III) 2-ethylhexanoate precursors, affecting the hydrophilic-lipophilic balance of the surfactant placed at the O/W interface to a different extent. This suggestion is in agreement with the findings of Oliveira et al. In their study, spectroscopic analysis was used to demonstrate that a similar precursor, cobalt (II) 2-ethylhexanoate doped in water/AOT/heptane W/O microemulsions, resides at the O/W interface [38]. In addition, our research group investigated the phase behavior of a water/surfactant/oil system very similar to the system used in the present study, in which cerium (III) 2-ethylhexanoate precursor was incorporated in the oil phase [31]. It was demonstrated that the presence of this precursor resulted in the modification of the O/W microemulsion region in pseudo-ternary phase diagrams. The fact that higher temperature was needed for microemulsion formation as the concentration of Copper (II) precursor was increased may be explained as follows. Ce (III) precursor has three units of 2-ethylhexanoate complexing agent, whereas Cu (II) precursor has two units. Thus, it can be assumed that the steric effect is reduced with Cu (II) precursor leading to better packing at the oil/water interface (in a similar manner as Cobalt (II) 2-ethylhexanoate), as compared to the bulkier Ce (III) precursor. Thus, the hydrophilic-lipophilic balance is affected to a greater extent when the concentration of Cu (II) precursor is increased.
In any case, it was possible to carry out the reactions close to room temperature (27–30 °C). A simple process approach such as the one presented in this investigation can be applied to further studies such as scaling up. Furthermore, the nonionic surfactant used is a low cost technical grade material which is biodegradable, and given that its solubility depends greatly on temperature further studies may permit its reuse.
Regarding the formation of Cu/Ce mixed oxide nanoparticles in the O/W microemulsions, due to the fact that the metal-organic precursors are dissolved in the oil phase, and the precipitating agent is soluble in the aqueous phase, the reaction should start at the oil/water interface, forming the first nuclei. Considering the small size of microemulsion droplets (in the order of 5 nm, as characterized by dynamic light scattering), and the huge oil/water interfacial area, there is a great level of confinement for the reaction to occur, resulting in the formation of small nanoparticles with a great level of interaction at the nanoscale level between the two precursors, leading to highly homogeneous materials up to Cu/Ce molar ratio 30/70, as demonstrated by the different characterization techniques.

3.2. Characterization of Cu/Ce Oxide Nanoparticles

HRTEM studies showed that rather small NPs were obtained: about 2–3 nm for non-calcined samples and about 5–7 nm for calcined samples. Homogeneity of materials below Cu/Ce molar ratio 30/70 as shown by HRTEM, EDX, and XRD spectra may be attributed to the fact that the precursors are confined inside the microemulsion droplets at the nanometer level, leading to an increased synergy between the oxides. Furthermore, the increase of Cu/Ce molar ratio promoted a decrease of crystallite size, which may suggest that either enrichment of Cu2+ on the surface of CeO2 or Cu2+ incorporated into the CeO2 lattice, inhibited the crystal growth of ceria. The ionic radius of Cu2+ (0.072 nm) is smaller than Ce4+ (0.097 nm) and Ce3+ (0.1143 nm), thus, an increasing amount of Cu into the CeO2 lattice can lead to a reduction of its cell size [25]. However, incorporation of Cu into the cubic CeO2 lattice would also imply a shift in the position of the main reflection to higher 2θ values. Indeed, for non-calcined samples there appears to be a shift in the position of the main reflection to higher values; in contrast, for the calcined samples, this shift is rather small with respect to CeO2 (2θ = 28.7° for CeO2 versus 28.74°–28.77° for calcined samples). Thus, the apparent larger shift in the non-calcined samples is more likely to be attributed to the large broadening of the reflections caused by the small size of the domains, which prevents an accurate positioning of the maximum. Furthermore, the fact that the agglomeration of the nanoparticles decreases as the Cu content increases (Figure 1), supports a change in the surface free energy of the nanoparticles, which could be ascribed to enrichment of Cu2+ on the surface, e.g., a good dispersion of Cu2+ ions onto CeO2 [7,39]. Although, partial substitution of Ce4+/Ce3+ by Cu2+ in the ceria lattice cannot be ruled out.
Even though in the Cu/Ce 30/70 non-calcined sample only small particles were observed by HRTEM and CuO phase was not detected by XRD, after calcination at 400 and 500 °C some excess monoclinic CuO phase was indeed detected by both techniques (Figure 5). Thus, it is inferred that CuO was formed initially as a very well dispersed secondary amorphous phase. Calcination caused phase segregation and crystallization of monoclinic CuO for this sample, whereas for the sample with Cu/Ce molar ratio 20/80 no phase segregation of monoclinic CuO was observed even after calcination at 500 °C. On the contrary, for the samples with Cu/Ce molar ratio 35/65, 40/60, and 50/50, Cu2+ ions concentration was too high to remain completely well dispersed, and it partially segregated as CuO in the as-obtained samples. The fact that this segregated CuO was monoclinic even without calcination, evidences the strong interaction between Cu2+ ions and ceria in the mixed oxide synthesized by this method, that prevents its segregation as monoclinic CuO up to Cu/Ce molar ratio 20/80 even after thermal treatment.
The Raman spectra indicated a slight shift towards lower wavenumber for the F2g Raman active mode of the CeO2 fluorite phase as the concentration of Cu was increased (Figure 6b), illustrating that the CeO2 fluorite-type lattice was distorted with the incorporation of Cu2+ ions into CeO2. On the other hand, the widths of the F2g bands are similar, due to very small and similar crystallite size obtained in all cases. For CeO2 in the present study, the characteristic and relatively intense F2g band, was centered at 452 and 455 cm−1 (non-calcined and calcined at 500 °C, respectively). This is in agreement with the work by Spanier et al., who reported a Raman shift of 458 cm−1 for CeO2 nanoparticles of 6.1 nm, and a general shift towards lower wavenumber as the particle size of CeO2 is decreased [40]. Thus, it is expected that smaller particles have a Raman shift towards lower wavenumber. According to Wang et al., the F2g band of a sample with 20 molar% of Cu prepared using W/O microemulsions was centered at 457 cm−1, as compared to CeO2 synthesized by the same method which was centered at 463.5 cm−1 [41]. Thus, a shift of about 6 cm−1 was observed when the Cu/Ce molar ratio was 20/80. In the present study, Cu/Ce with molar ratio 20/80 was shifted to 446 and 447 cm−1 (as-obtained and calcined at 500 °C, respectively). Thus, the shift was in the order of 6–8 cm−1. A similar shift was obtained for the sample with Cu/Ce molar ratio 30/70. Therefore, the shift is comparable to the shift obtained in the investigation reported by Wang et al. [41], who interpreted this outcome to the incorporation of Cu into the CeO2 cubic lattice. Although, as mentioned previously, this should be accompanied by Cu2+ surface enrichment, since the XRD reflections presented a rather small shift [42]. In any case, given the small size of the Cu/Ce mixed oxide nanoparticles, a very large percentage of the atoms must reside at these surface/subsurface locations.
As mentioned previously, the band at 500–650 cm−1 can be assigned to oxygen vacancies [36]. For CeO2, this is in agreement with the presence of an important amount of Ce3+, as already reported for CeO2 synthesized by the O/W microemulsion method [43]. On the other hand, the increase in the intensity of this band in the Cu/Ce mixed oxides may be attributed to the incorporation of Cu2+ ions into the ceria lattice, which must be accompanied by the generation of oxygen vacancies in order to keep the charge balance. A way to assess the relative oxygen vacancies in a comparative manner is to express the ratio of the area of the vacancies band (A600) with respect to the area of the F2g band (A450) [44]. For the samples calcined at 500 °C, there was a steady increase in the A600/A450 ratio up to Cu/Ce molar ratio 20/80, after which it leveled off (Figure 6c). This could be explained by the fact that for the Cu/Ce 30/70 sample calcined at 500 °C an important amount of CuO had phase-separated, leaving the Cu/Ce mixed oxide with a composition similar to the Cu/Ce 20/80 sample. On the other hand, the as-obtained samples presented a rapid increase at Cu/Ce 5/95 as compared to CeO2, with little increase above this Cu/Ce molar ratio. Thus, calcination induced an increase of oxygen vacancies as a function of Cu concentration, as compared to the as-obtained samples; this can be ascribed to the increased crystallinity, allowing for a better incorporation of Cu2+ into the CeO2 lattice.
Between 100–300 cm−1 there are some other bands which have not been usually reported in these Cu/Ce mixed oxides. Samples Cu/Ce 30/70 (as-obtained and calcined at 500 °C ) present a small band centered at 272 and 280 cm−1 (respectively) which could be attributed to the one-phonon A1g mode of CuO [45]. This is in agreement with the results from XRD for the calcined sample; for the as-obtained sample CuO was not detected, so probably it was very well dispersed and/or in a concentration below the limits of the technique. The other small bands at around 180 and 250 cm−1, are probably also related to the oxygen vacancies, since these are also present in the CeO2 samples, and they follow the trends of the bands at 500–650 cm−1 [44].
A systematic study on the preparation of Cu/Ce oxide nanoparticles at various Cu/Ce molar ratios using the flame method was previously reported by Pati et al. [46]. They found that below 40/60 Cu/Ce molar ratio, crystalline CuO could not be detected by XRD, however it was demonstrated by HRTEM that a core-shell structure was obtained, in which fluorite-type CeO2 formed the core and amorphous CuO formed the shell. Thus, even though the temperature of synthesis reached 1500 °C in the flame method, a mixed Cu/Ce oxide phase was not obtained and the CuO phase was amorphous. In the present study, no clear evidence for a core-shell configuration was found by HRTEM, however the surface may be enriched with a thin layer of Cu2+ ions. For the higher concentrations of Cu (Cu/Ce molar ratios 35/65, 40/60, and 50/50) HRTEM showed amorphous zones. Nonetheless, in our investigation it has been shown that if the Cu/Ce ratio is high enough (35/65 and above), monoclinic CuO is formed, even at mild reaction conditions. Thus, the amorphous zones for samples with Cu/Ce molar ratios 35/65, 40/60, and 50/50 are more likely to be formed by the mixed Cu/Ce oxide.
It is worth noting that various configurations of Cu/Ce oxide materials have been obtained depending on the preparation method, such as the core-CeO2/shell-CuO mentioned above, as well as nanoparticles or films of mixed Cu/Ce oxide in which Cu is either very well dispersed or incorporated into the CeO2 lattice [39,41,47,48,49,50,51]. However, the limit of Cu content that can be incorporated without forming an excess separate CuO phase depends strongly on the preparation method and reaction conditions. With the impregnation method, it was reported by Yang et al. that excess monoclinic CuO phase can be detected by XRD at Cu/Ce molar ratio 5/95 [47]. In a similar investigation by Zheng et al., monoclinic CuO phase was detected from 10/90 Cu/Ce molar ratio by the impregnation method [48], although Tian et al. reported the incorporation of Cu up to a 15/85 Cu/Ce molar ratio using the same preparation method [49]. Using the urea precipitation-gelation method, it was possible to incorporate Cu up to a 15/85 Cu/Ce molar ratio, according to Kobayashi et al. [39]. Slusser et al. reported the formation of epitaxial films by the pulsed laser deposition technique, in which Cu was incorporated into the CeO2 lattice up to a 15/85 Cu/Ce molar ratio; higher Cu content was not reported [52]. By a modified citrate sol-gel method, monoclinic CuO phase was detected by XRD at 20/80 Cu/Ce molar ratio [50]. Fotopoulus et al. reported the synthesis of mixed Cu/Ce oxide in which Cu was incorporated into the CeO2 lattice up to a 23/77 Cu/Ce molar ratio, or it was very well dispersed; the synthesis was carried out by a solvothermal method using oleylamine/TOPO mixtures at 350 °C [51]. Wang et al. reported that by the reverse microemulsion reaction method, only cubic fluorite-type ceria structure was observed for samples with up to 20/80 Cu/Ce molar ratio [41].
The experimental advantages of preparing mixed Cu/Ce oxide nanoparticles by the O/W microemulsion reaction method are the use of mild conditions (room temperature), lower concentration of solvents as compared to the solvothermal or W/O microemulsion methods, and the use of simple and inexpensive equipment. In addition, the homogeneity and confinement of the molecular mixture of Cu/Ce precursors inside the microemulsion droplets during synthesis, and the narrow size distribution (low polydispersity) obtained, may promote a stronger synergistic effect between copper and ceria leading to an improved performance in catalysis such as in the Water-Gas Shift reaction and other catalytic processes [53].

3.3. Magnetic Properties

It was reported recently that certain transition metal-doped rare earth oxides such as CeO2 led to room temperature ferromagnetism [54,55,56]. Tiwari et al. reported that incorporation of cobalt into the CeO2 lattice resulted in room temperature ferromagnetism and high Curie Temperature [54]. Ferromagnetic behavior was also reported in Ni- and Fe-doped CeO2 [55,56]. A significant debate exists about whether the observed properties are an intrinsic property of the material or an extrinsic property due to the preparation method, presence of impurities and so on. This controversy still remains intense since all the materials prepared as transition metal-doped CeO2 are magnetic even though a very small amount of the dopant is used [54,55,56]. In the present investigation, it was clearly observed that by incorporating non-magnetic Cu2+ ions into CeO2, the magnetization response was enhanced.
Slusser et al. [52] found unexpected ferromagnetic behavior in Cu-doped CeO2 films prepared by a pulse laser deposition technique at room temperature. This magnetic behavior could not be detected for the same materials prepared in the O/W microemulsion method. This difference in magnetic behavior may be related to the nanoparticle size difference or cation partition in the sample. Indeed, in the present study the nanoparticle size was ~2–3 nm whereas in the study by Slusser et al., although no size detail was given, based on the resolution of XRD reflections, it can be inferred that the characteristic crystallite size was much larger.

3.4. Optical Properties and Photocatalytic Activity

In the literature, various values of Eg have been reported for CeO2 nanostructures, depending on the preparation method. Ho et al. [57] reported Eg values from 3.36 to 3.62 for mesoporous CeO2 nanostructures with different morpohologies (rod shape and spindle-like), synthesized by polyol method. In contrast, by the precipitation method higher Eg (3.56 to 3.71 eV) were reported for CeO2 [58]. Masui et al. reported slightly lower Eg values (3.38 and 3.44 eV) when CeO2 NPs with sizes between 2.6 and 3.4 nm were prepared in reverse micelles [59]. It was reported by Patsalas et al. that the the red shifting in the band gap of CeO2 is due to an increase in the concentration of Ce3+ on the grain boundaries; the reduction of the band gap increases with increasing Ce3+ concentration and its corresponding increase in oxygen vacancies [60]. Thus, the relatively low Eg value obtained for CeO2 in the present study of 2.9 eV could be related to an important contribution from oxygen vacancies (as indicated from the Raman results), which is accompanied by a high concentration of Ce3+ as previously reported for CeO2 obtained in O/W microemulsions [43].
On the other hand, reports on the Eg values of Cu/Ce oxides are rare. In our study, it was shown by XRD and HRTEM techniques that the obtained Cu/Ce mixed oxide nanoparticles had a slightly smaller size as the concentration of Cu was increased. According to the study by Tsunekawa et al., the Eg values of CeO2 nanoparticles should increase as the particle size is decreased, due to the electron confinement effect [61]. However, in this investigation, the incorporation of Cu into the cubic CeO2 lattice promoted a general decrease of Eg of Cu/Ce mixed oxide nanoparticles compared to CeO2 nanoparticles. Slusser et al. reported that the Eg values decreased as the concentration of Cu was increased for Cu/Ce nanostructured films [52]. However, the values in that study were 3.45, 3.43, and 3.39 eV for samples containing 0, 3 and 15 atomic% of Cu. The synthesis of CeO2 and Cu/Ce mixed oxide NPs using Oil-in-Water microemulsions as confined reaction media led to NPs possessing even lower Eg values which may be of high interest in optoelectronics, photovoltaic, and photocatalytic applications, since Eg values lower than 3 eV implies that the material may be photoactive under visible light irradiation.
The photocatalytic activity was confirmed in this investigation for the photodegradation of Indigo Carmine, which reached 60% after 3 h of irradiation with visible light for sample Cu/Ce (35/65) and almost 100% of photodegradation was reached when sample Cu/Ce (30/70) was used as photocatalyst. However, in this last case the dye is at least partially adsorbed by the sample due to the high amount of Ce. On the other hand, Indigo Carmine degradation is commonly due to the formation of several intermediates as reported in other works; it means that the formation of intermediates and the degradation of the chromophore group is a common step in the photodegradation process of this dye [62]. Therefore, in our case, the degradation of Indigo Carmine by using Cu/Ce with molar ratios 30/70 and 35/65 could be due to the sulphate ion separation and bonds breaking and arranging to form compounds with nitro groups and finally obtain carboxylic acids [62]. In any case, it was demonstrated that both CeO2 and the mixed Cu/Ce oxides synthesized in O/W microemulsions, can be used for the remediation of water to remove contaminants such as certain dyes, either by photocatalytic degradation or by adsorption, or both.
It is worth mentioning that a previous report from Torres-Martinez on the photodegradation of Indigo Carmine using Sm2FeTaO7 photocatalyst under solar light resulted in better performance when using CuO as cocatalyst, which was ascribed to CuO acting as an electron trap, decreasing electron-hole pair recombination rates [63]. This suggests a double advantage of having a well dispersed CuO phase as in the Cu/Ce oxide system reported in this investigation, or even an excess monoclinic CuO phase, for improving the photocatalytic performance of CeO2. On one hand, the red shift of the Eg value permits its photocatalytic activation under visible or solar light radiation, and on the other hand, the presence of CuO as cocatalyst acts as an electron trap.

4. Materials and Methods

4.1. Materials

Synperonic® 91/5 (Polyoxyethylene (5) C9-C11 alcohol, HLB = 12, Cloud point T = 36 °C) was kindly obtained from Croda. Cerium (III) 2-ethylhexanoate (Ce-2EH, solid) was purchased from Sigma Aldrich, Copper (II) 2-ethylhexanoate (Cu-2EH, ca 98%) was purchased from Alfa Aesar. Isooctane (Suprasolv, for gas chromatography, 99% min) was from Honeywell Burdick & Jackson. Isopropanol (99.5%) and sodium hydroxide (NaOH, pellets, 98.4%) were purchased from J.T. Baker. Ethanol (99%) was purchased from CTR Scientific. Deionized water with a resistivity of 18.2 MΩ cm−1 was obtained from a Millipore system.

4.2. Preparation of NPs by the O/W Microemulsion Reaction Method

Microemulsions are well known as thermodynamic stable systems containing water, oil and surfactant leading to a transparent and fluid isotropic solution. The organometallic precursors (Ce-2EH and Cu-2EH were dissolved in isooctane composing the oil phase (which had a total metal concentration of 0.105 mol per kg of solution). Then, deionized water, Synperonic® 91/5 and the oil phase (containing the precursors) were mixed. The composition of the microemulsion selected was: 64.5 wt % water, 21.5 wt % Synperonic® 91/5, and 14 wt % oil. The mixture was magnetically stirred at the appropriate microemulsion temperature (Table 1) until a homogeneous, transparent and fluid isotropic single phase was obtained. In order to form the mixed oxide nanoparticles, an aqueous solution of NaOH (2.5 M) was added under vigorous stirring until pH 12 was reached, whilst the microemulsion temperature was kept constant. The reaction mixture was kept overnight at constant stirring, followed by centrifugation. The nanoparticles were washed with ethanol and water (v/v = 1/1) until a neutral pH was reached in the washing liquors. The solids were dried at 70 °C over 2 days, and ground using an agate pestle and mortar. The synthesized materials were CeO2 and CuxCe1-xO2-δ (x = 0.05, 0.10, 0.20, 0.30, 0.35, 0.40, 0.50). Some materials were calcined with a temperature ramp of 5 °C/min and a dwelling time of 2 h; the calcination temperatures were 400 °C or 500 °C.

4.3. Characterization of NPs

Particle size and morphology were investigated using a High-Resolution Transmission Electron Microscope (HRTEM) JEOL JEM-2200FS, operated at 200 kV, and point resolution of 0.1 nm in TEM mode. Preparation of TEM grids was carried out by mixing a small amount of powder with isopropanol (2 mL) followed by sonication, and depositing a drop of this dispersion onto a formvar/carbon copper grid. The crystal structure was analyzed by X-ray diffraction (XRD (PANalytical, Almelo, The Netherlands)) using a PANalytical Empyrean diffractometer with CuKα radiation in continuous scan mode from 10° to 80° of 2θ with 0.001 step size. Fullprof Suite software (2007, Grenoble, France) was used for data treatment. The crystallite size was estimated by X-ray Diffraction with the Scherrer equation using the broadening of the reflection with the highest intensity (2θ = 28.7°). Raman spectroscopy was carried out using a micro-Raman LabRAM HR Evolution from Horiba (Kyoto, Japan), coupled to an Olympus BX-4 microscope. The wavelength used to excite the sample was 632.8 nm, which was provided with a He-Ne laser, the power was kept at 17 mW, the resolution was 1 cm−1 and the diffraction grating was 600 L/mm; all measurements were performed at room temperature. The power of the laser was varied between 5% and 10%, depending on the sample.

4.4. Magnetic Properties, Optical Properties and Photocatalytic Performance

The magnetic properties of the obtained nanomaterials were assessed using superconducting quantum interface device (SQUID) magnetometer Quantum Design MPMS XL. The energy band gap (Eg) of the powders was determined by the Kubelka–Munk function using a UV–vis spectrophotometer (Lambda 35 Perkin Elmer Corporation) coupled with an integrating sphere. The photocatalytic degradation of Indigo Carmine was carry out using 200 mL of a 20 ppm solution of the dye; 0.2 g of the photocatalyst were used for each experiment. Irradiation was carried out with a visible light lamp (Xenon lamp HID, 3200 Lumen, 6000 K Onof, Guangzhou, China). The development of the photocatalytic reaction was conducted by UV-vis analysis using a Lambda 35 Perkin Elmer Corporation spectrophotometer; samples were taken every 15 min during 180 min. Before turning on the Xenon lamp, 30 min in the dark were allowed for adsorption equilibria. The photolysis experiment was carried out in the same way, except that no photocatalyst was added.

5. Conclusions

Mixed Cu/Ce oxide nanoparticles (below Cu/Ce molar ratio 30/70) and mixtures of oxides (above this content) were prepared using the oil-in-water microemulsion reaction method under mild conditions. Nanoparticle size of mixed Cu/Ce oxide was in the order of 2–3 nm with a low polydispersity. However, calcination above 400 °C showed clearly the presence of a minor CuO phase for samples with Cu content equal or larger than 30%, evidencing the formation of mixed Cu/Ce oxide as a major phase and a minor phase of CuO nanotapes with a monoclinic crystal structure. Evidence from characterization suggests a contribution from Cu2+ surface enrichment, ascribed to the lack of a significant shift in the XRD reflections and lower agglomeration in the mixed oxide; however, the shift in the signal corresponding to the F2g Raman active mode of the CeO2 fluorite phase and the increase of the Raman band ascribed to oxygen vacancies, suggest at least partial incorporation of Cu2+ into the CeO2 lattice. Nanoparticle characteristics were modulated by the variation of Cu/Ce molar ratio in the O/W microemulsion system. By incorporating Cu into CeO2, the magnetic properties could be tuned from diamagnetic to paramagnetic behavior. Moreover, the band gap (Eg) values of these nanomaterials were tuned and decreased as a function of Cu/Ce ratio. These results are also consistent with at least partial incorporation of Cu2+ into the CeO2 lattice. CeO2 NPs prepared in O/W microemulsions possessed a lower Eg (2.9 eV) than those prepared using other methods as reported in literature. The obtained Eg values imply that both CeO2 and Cu/Ce oxides may be photoactive under visible light. Indeed, it was shown for the first time that Cu/Ce oxide nanoparticles are active as photocatalyst for the degradation of Indigo Carmine dye using visible light irradiation. These properties may promote their use as promising materials in photocatalytic, optoelectronic, photovoltaic, and fuel cells applications, in addition to their more common use as catalysts in the Water Gas Shift reaction. The usefulness of the O/W microemulsion reaction method for the synthesis of homogeneous mixed oxides has been demonstrated.

Supplementary Materials

The following are available online at www.mdpi.com/1996-1944/9/6/480/s1.

Acknowledgments

C.S. and K.P.B. acknowledge financial support from MINECO (grant number CTQ2011-29336-C03-01), Generalitat de Catalunya (AGAUR, grant number 2009SGR-961). M.S.D. is grateful to CONACYT (CB project grant number CB2011/166649). M.S.D. and I.J.R. are grateful to CONACYT (Proyecto Redes Temáticas No. 194451). We acknowledge NaNoTeCh, the National Nanotechnology Laboratory of Mexico, for HRTEM/STEM measurements; Francisco Enrique Longoria (CIMAV, S.C.) for XRD and Raman measurements and assistance.

Author Contributions

Kelly Pemartin-Biernath and Andrea V. Vela-González carried out synthesis of the materials and characterizations. Maira B. Moreno-Trejo and Iván E. Castañeda-Reyna carried out photocatalysis and diffuse reflectance. César Leyva-Porras performed HRTEM characterization. Margarita Sánchez-Domínguez, Conxita Solans and Isaías Juárez-Ramírez conceived and designed the experiments, and wrote the paper.

Conflicts of Interest

The authors declare no conflict of interest.

References

  1. Mogensen, M.; Sammes, N.M.; Tompsett, G.A. Physical, chemical and electrochemical properties of pure and doped ceria. Solid State Ion. 2000, 129, 63–94. [Google Scholar] [CrossRef]
  2. Imanaka, N.; Masui, T.; Hirai, H.; Adachi, G. Amorphous cerium-titanium solid solution phosphate as a novel family of band gap tunable sunscreen materials. Chem. Mater. 2003, 15, 2289–2291. [Google Scholar] [CrossRef]
  3. Kakuta, N.; Morishima, N.; Kotobuki, M.; Iwase, T.; Mizushima, T.; Sato, Y.; Matsuura, S. Oxygen storage capacity (OSC) of aged Pt/CeO2/Al2O3 catalysts: Roles of Pt and CeO2 supported on Al2O3. Appl. Surf. Sci. 1997, 121, 408–412. [Google Scholar] [CrossRef]
  4. Lira-Cantu, M.; Krebs, F.C. Hybrid solar cells based on MEH-PPV and thin film semiconductor oxides (TiO2, Nb2O5, ZnO, CeO2 and CeO2–TiO2): Performance improvement during long-time irradiation. Sol. Energy Mater. Sol. Cells 2006, 90, 2076–2086. [Google Scholar] [CrossRef]
  5. Morshed, A.; Moussa, M.E.; Bedair, S.M.; Leonard, R.; Liu, S.X.; El-Masry, N. Violet/blue emission from epitaxial cerium oxide films on silicon substrates. Appl. Phys. Lett. 1997, 70, 1647–1649. [Google Scholar] [CrossRef]
  6. Wen, B.; He, M. Study of the Cu-Ce Synergism for NO Reduction with CO in the Presence of O2, H2O and SO2 in FCC Operation. Appl. Catal. B Environ. 2002, 37, 75–82. [Google Scholar] [CrossRef]
  7. Bera, P.; Aruna, S.T.; Patil, K.C.; Hegde, M.S. Studies on Cu/CeO2: A new NO reduction catalyst. J. Catal. 1999, 186, 36–44. [Google Scholar] [CrossRef]
  8. Liu, W.; Flytzani-Stephanopoulos, M. Transition metal-promoted oxidation catalysis by fluorite oxides: A study of CO oxidation over Cu CeO2. Chem. Eng. J. Biochem. Eng. J. 1996, 64, 283–294. [Google Scholar] [CrossRef]
  9. Pradhan, S.; Reddy, A.S.; Devi, R.N.; Chilukuri, S. Copper-based catalysts for water gas shift reaction: Influence of support on their catalytic activity. Catal. Today 2009, 141, 72–76. [Google Scholar] [CrossRef]
  10. Liu, G.; Rodriguez, J.A.; Chang, Z.; Hrbek, J. Adsorption and reaction of SO2 on model Ce1-x Zr x O2 (111) catalysts. J. Phys. Chem. B 2004, 108, 2931–2938. [Google Scholar] [CrossRef]
  11. Overbury, S.H.; Mullins, D.R.; Trovarelli, A. Ceria surfaces and films for model catalytic studies using surface analysis techniques. Catal. Sci. Ser. 2002, 2, 311–337. [Google Scholar]
  12. Fornasiero, P.; Balducci, G.; Di Monte, R.; Kaspar, J.; Sergo, V.; Gubitosa, G.; Ferrero, A.; Graziani, M. Modification of the redox behaviour of CeO 2 induced by structural doping with ZrO2. J. Catal. 1996, 164, 173–183. [Google Scholar] [CrossRef]
  13. Rodriguez, J.A. Electronic and chemical properties of mixed-metal oxides: Basic principles for the design of DeNO x and DeSO x catalysts. Catal. Today 2003, 85, 177–192. [Google Scholar] [CrossRef]
  14. Mariño, F.; Baronetti, G.; Laborde, M.; Bion, N.; Le Valant, A.; Epron, F.; Duprez, D. Optimized CuO–CeO2 catalysts for COPROX reaction. Int. J. Hydrog. Energy 2008, 33, 1345–1353. [Google Scholar] [CrossRef]
  15. Chowdhuri, A.; Gupta, V.; Sreenivas, K.; Kumar, R.; Mozumdar, S.; Patanjali, P.K. Response speed of SnO2-based H2S gas sensors with CuO nanoparticles. Appl. Phys. Lett. 2004, 84, 1180–1182. [Google Scholar] [CrossRef]
  16. Uzunoglu, A.; Stanciu, L.A. Novel CeO2-CuO-decorated Enzymatic Lactate Biosensors Operating in Low Oxygen Environments. Anal. Chim. Acta 2016, 909, 121–128. [Google Scholar] [CrossRef] [PubMed]
  17. Zhang, D.-W.; Yi, T.-H.; Chen, C.-H. Cu nanoparticles derived from CuO electrodes in lithium cells. Nanotechnology 2005, 16, 2338. [Google Scholar] [CrossRef] [PubMed]
  18. Lake, B.; Rønnow, H.M.; Christensen, N.B.; Aeppli, G.; Lefmann, K.; McMorrow, D.F.; Vorderwisch, P.; Smeibidl, P.; Mangkorntong, N.; Sasagawa, T.; et al. Antiferromagnetic order induced by an applied magnetic field in a high-temperature superconductor. Nature 2002, 415, 299–302. [Google Scholar] [CrossRef] [PubMed]
  19. Kumar, S.K.; Murugesa, S.; Suresh, S.; Raj, S.P. Nanostructured CuO thin films prepared through sputtering for solar selective absorbers. J. Sol. Energy 2013, 2013, 147270. [Google Scholar]
  20. Hsieh, C.-T.; Chen, J.-M.; Lin, H.-H.; Shih, H.-C. Field emission from various CuO nanostructures. Appl. Phys. Lett. 2003, 83, 3383–3385. [Google Scholar] [CrossRef]
  21. Jammi, S.; Sakthivel, S.; Rout, L.; Mukherjee, T.; Mandal, S.; Mitra, R.; Saha, P.; Punniyamurthy, T. CuO nanoparticles catalyzed C−N, C−O, and C−S cross-coupling reactions: Scope and mechanism. J. Org. Chem. 2009, 74, 1971–1976. [Google Scholar] [CrossRef] [PubMed]
  22. Caputo, T.; Lisi, L.; Pirone, R.; Russo, G. On the role of redox properties of CuO/CeO2 catalysts in the preferential oxidation of CO in H 2-rich gases. Appl. Catal. A Gen. 2008, 348, 42–53. [Google Scholar] [CrossRef]
  23. Martínez-Arias, A.; Fernández-García, M.; Gálvez, O.; Coronado, J.M.; Anderson, J.A.; Conesa, J.C.; Soria, J.; Munuera, G. Comparative study on redox properties and catalytic behavior for CO oxidation of CuO/CeO2 and CuO/ZrCeO4 catalysts. J. Catal. 2000, 195, 207–216. [Google Scholar] [CrossRef]
  24. Zhu, P.; Li, J.; Huang, Q.; Yan, S.; Liu, M.; Zhou, R. High performance CuO-CeO2 catalysts for selective oxidation of CO in excess hydrogen: Effect of hydrothermal preparation conditions. J. Nat. Gas Chem. 2009, 18, 346–353. [Google Scholar] [CrossRef]
  25. Szabová, L.; Skála, T.; Matolínová, I.; Fabris, S.; Camellone, M.F.; Matolín, V. Copper-ceria interaction: A combined photoemission and DFT study. Appl. Surf. Sci. 2013, 267, 12–16. [Google Scholar] [CrossRef]
  26. Gurbani, A.; Ayastuy, J.L.; González-Marcos, M.P.; Gutiérrez-Ortiz, M.A. CuO–CeO2 catalysts synthesized by various methods: Comparative study of redox properties. Int. J. Hydrog. Energy 2010, 35, 11582–11590. [Google Scholar] [CrossRef]
  27. Sanchez-Dominguez, M.; Boutonnet, M.; Solans, C. A novel approach to metal and metal oxide nanoparticle synthesis: The oil-in-water microemulsion reaction method. J. Nanopart. Res. 2009, 11, 1823–1829. [Google Scholar] [CrossRef]
  28. Boutonnet, M.; Kizling, J.; Stenius, P.; Maire, G. The preparation of monodisperse colloidal metal particles from microemulsions. Colloids Surf. 1982, 5, 209–225. [Google Scholar] [CrossRef]
  29. Lopez-Quintela, M.A. Synthesis of nanomaterials in microemulsions: Formation mechanisms and growth control. Curr. Opin. Colloid Interface Sci. 2003, 8, 137–144. [Google Scholar] [CrossRef]
  30. López-Quintela, M.A.; Tojo, C.; Blanco, M.C.; García Rio, L.; Leis, J.R. Microemulsion dynamics and reactions in microemulsions. Curr. Opin. Colloid Interface Sci. 2004, 9, 264–278. [Google Scholar] [CrossRef]
  31. Sanchez-Dominguez, M.; Pemartin, K.; Boutonnet, M. Preparation of inorganic nanoparticles in oil-in-water microemulsions: A soft and versatile approach. Curr. Opin. Colloid Interface Sci. 2012, 17, 297–305. [Google Scholar] [CrossRef]
  32. Margarita, S.-D.; Pemartin, K.; Solans, C.; Boutonnet, M. Oil-in-Water Microemulsions for the Synthesis of Nanocrystalline, Mesoporous and Ultrafine CeO2 Powders. In Colloid and Interface Chemistry for Nanotechnology; CRC Press: Boca Raton, FL, USA, 2013; pp. 177–197. [Google Scholar]
  33. Keramidas, V.G.; White, W.B. Raman spectra of oxides with the fluorite structure. J. Chem. Phys. 1973, 59, 1561–1562. [Google Scholar] [CrossRef]
  34. Reddy, B.M.; Khan, A.; Lakshmanan, P.; Aouine, M.; Loridant, S.; Volta, J.-C. Structural characterization of nanosized CeO2-SiO2, CeO2-TiO2, and CeO2-ZrO2 catalysts by XRD, Raman, and HREM techniques. J. Phys. Chem. B 2005, 109, 3355–3363. [Google Scholar] [CrossRef] [PubMed]
  35. Reddy, B.M.; Khan, A.; Yamada, Y.; Kobayashi, T.; Loridant, S.; Volta, J.-C. Structural characterization of CeO2-MO2 (M = Si4+, Ti4+, and Zr4+) mixed oxides by Raman spectroscopy, X-ray photoelectron spectroscopy, and other techniques. J. Phys. Chem. B 2003, 107, 11475–11484. [Google Scholar] [CrossRef]
  36. McBride, J.; Hass, K.C.; Poindexter, B.D.; Weber, W.H. Raman and X-ray studies of Ce1−xRExO2−y, where RE = La, Pr, Nd, Eu, Gd, and Tb. J. Appl. Phys. 1994, 76, 2435–2441. [Google Scholar] [CrossRef]
  37. Kubelka, P. Ein beitrag zur optik der farban striche. Z Tech. Phys. 1931, 12, 593–603. [Google Scholar]
  38. De Oliveira, R.J.; Brown, P.; Correia, G.B.; Rogers, S.E.; Heenan, R.; Grillo, I.; Galembeck, A.; Eastoe, J. Photoreactive surfactants: A facile and clean route to oxide and metal nanoparticles in reverse micelles. Langmuir 2011, 27, 9277–9284. [Google Scholar] [CrossRef] [PubMed]
  39. Kobayashi, M.; Flytzani-Stephanopoulos, M. Reduction and sulfidation kinetics of cerium oxide and Cu-modified cerium oxide. Ind. Eng. Chem. Res. 2002, 41, 3115–3123. [Google Scholar] [CrossRef]
  40. Spanier, J.E.; Robinson, R.D.; Zhang, F.; Chan, S.-W.; Herman, I.P. Size-dependent properties of CeO2−y nanoparticles as studied by Raman scattering. Phys. Rev. B 2001, 64, 245407. [Google Scholar] [CrossRef]
  41. Wang, X.; Rodriguez, J.A.; Hanson, J.C.; Gamarra, D.; Martínez-Arias, A.; Ferández-García, M. Unusual Physical and Chemical Properties of Cu in Ce1-xCuxO2 Oxides. J. Phys. Chem. B 2005, 109, 19595–19603. [Google Scholar] [CrossRef] [PubMed]
  42. Martínez-Arias, A.; Hungría, A.B.; Fernández-García, M.; Conesa, J.C.; Munuera, G. Interfacial redox processes under CO/O2 in a nanoceria-supported copper oxide catalyst. J. Phys. Chem. B 2004, 108, 17983–17991. [Google Scholar] [CrossRef]
  43. Sanchez-Dominguez, M.; Liotta, L.F.; Di Carlo, G.; Pantaleo, G.; Venezia, A.M.; Solans, C.; Boutonnet, M. Synthesis of CeO2, ZrO2, Ce 0.5 Zr 0.5 O2, and TiO2 nanoparticles by a novel oil-in-water microemulsion reaction method and their use as catalyst support for CO oxidation. Catal. Today 2010, 158, 35–43. [Google Scholar] [CrossRef]
  44. Pu, Z.-Y.; Lu, J.-Q.; Luo, M.F.; Xie, Y.L. Study of oxygen vacancies in Ce0. 9Pr0. 1O2-δ solid solution by in situ X-ray diffraction and in situ Raman spectroscopy. J. Phys. Chem. C 2007, 111, 18695–18702. [Google Scholar] [CrossRef]
  45. Wang, W.; Zhou, Q.; Fei, X.; He, Y.; Zhang, P.; Zhang, G.; Peng, L.; Xie, W. Synthesis of CuO nano-and micro-structures and their Raman spectroscopic studies. CrystEngComm 2010, 12, 2232–2237. [Google Scholar] [CrossRef]
  46. Pati, R.K.; Lee, I.C.; Hou, S.; Akhuemonkhan, O.; Gaskell, K.J.; Wang, Q.; Frenkel, Al.; Chu, D.; Salamanca-Riba, L.G.; Ehrman, S.H. Flame Synthesis of Nanosized Cu−Ce−O, Ni−Ce−O, and Fe−Ce−O Catalysts for the Water-Gas Shift (WGS) Reaction. ACS Appl. Mater. Interfaces 2009, 1, 2624–2635. [Google Scholar] [CrossRef] [PubMed]
  47. Yang, W.; Li, D.; Xu, D.; Wang, X. Effect of CeO2 preparation method and Cu loading on CuO/CeO2 catalysts for methane combustion. J. Nat. Gas Chem. 2009, 18, 458–466. [Google Scholar] [CrossRef]
  48. Zheng, X.-C.; Wu, S.-H.; Wang, S.-P.; Wang, S.-R.; Zhang, S.-M.; Huang, W.-P. The preparation and catalytic behavior of copper–cerium oxide catalysts for low-temperature carbon monoxide oxidation. Appl. Catal. A Gen. 2005, 283, 217–223. [Google Scholar] [CrossRef]
  49. Tian, J.-J.; Na, W.; Wang, H.; Gao, W.-G. Preparation and characterization of Cu-doped mesoporous CeO2 for CO oxidation. J. Cent. South Univ. 2014, 21, 482–486. [Google Scholar] [CrossRef]
  50. Luo, M.-F.; Song, Y.-P.; Lu, J.-Q.; Wang, X.-Y.; Pu, Z.-Y. Identification of CuO species in high surface area CuO-CeO2 catalysts and their catalytic activities for CO oxidation. J. Phys. Chem. C 2007, 111, 12686–12692. [Google Scholar] [CrossRef]
  51. Fotopoulos, A.; Arvanitidis, J.; Christofilos, D.; Papaggelis, K.; Kalyva, M.; Triantafyllidis, K.; Niarchos, D.; Boukos, N.; Basina, G.; Tzitzios, V. One pot synthesis and characterization of ultra fine CeO2 and Cu/CeO2 nanoparticles. Application for low temperature CO oxidation. J. Nanosci. Nanotechnol. 2011, 11, 8593–8598. [Google Scholar] [CrossRef] [PubMed]
  52. Slusser, P.; Kumar, D.; Tiwari, A. Unexpected magnetic behavior of Cu-doped CeO2. Appl. Phys. Lett. 2010, 96, 2506. [Google Scholar] [CrossRef]
  53. She, Y.; Zheng, Q.; Li, L.; Zhang, Y.; Chen, C.; Zheng, Y.; Lin, X. Rare earth oxide modified CuO/CeO2 catalysts for the water–gas shift reaction. Int. J. Hydrog Energy 2009, 34, 8929–8936. [Google Scholar] [CrossRef]
  54. Tiwari, A.; Bhosle, V.M.; Ramachandran, S.; Sudhakar, N.; Narayan, J.; Budak, S.; Gupta, A. Ferromagnetism in Co doped CeO2: Observation of a giant magnetic moment with a high Curie temperature. Appl. Phys. Lett. 2006, 88, 142511. [Google Scholar] [CrossRef]
  55. Thurber, A.; Reddy, K.M.; Shutthanandan, V.; Engelhard, M.H.; Wang, C.; Hays, J.; Punnoose, A. Ferromagnetism in chemically synthesized CeO2 nanoparticles by Ni doping. Phys. Rev. B 2007, 76, 165206. [Google Scholar] [CrossRef]
  56. Sharma, S.; Thakur, P.; Kumar, S.; Shukla, D.K.; Brookes, N.B.; Lee, C.G.; Pirota, K.R.; Koo, B.H.; Knobel, M. Room temperature ferromagnetism in Fe-doped CeO2 thin films grown on LaAlO3 (001). Thin Solid Films 2010, 519, 410–413. [Google Scholar] [CrossRef]
  57. Ho, C.; Yu, J.C.; Kwong, T.; Mak, A.C.; Lai, S. Morphology-controllable synthesis of mesoporous CeO2 nano-and microstructures. Chem. Mater. 2005, 17, 4514–4522. [Google Scholar] [CrossRef]
  58. Chen, H.-I.; Chang, H.-Y. Synthesis of nanocrystalline cerium oxide particles by the precipitation method. Ceram. Int. 2005, 31, 795–802. [Google Scholar] [CrossRef]
  59. Masui, T.; Fujiwara, K.; Machida, K.-I.; Adachi, G.-Y.; Sakata, T.; Mori, H. Characterization of cerium (IV) oxide ultrafine particles prepared using reversed micelles. Chem. Mater. 1997, 9, 2197–2204. [Google Scholar] [CrossRef]
  60. Patsalas, P.; Logothetidis, S.; Sygellou, L.; Kennou, S. Structure-dependent electronic properties of nanocrystalline cerium oxide films. Phys. Rev. B 2003, 68, 035104. [Google Scholar] [CrossRef]
  61. Tsunekawa, S.; Sahara, R.; Kawazoe, Y.; Kasuya, A. Blueshifts in the ultraviolet absorption spectra of cerium oxide nanocrystallites. J. Appl. Phys. 2003, 94, 3654–3656. [Google Scholar] [CrossRef]
  62. Vinu, R.; Akki, S.U.; Madras, G. Investigation of dye functional group on the photocatalytic degradation of dyes by nano-TiO2. J. Hazard. Mater. 2010, 176, 765–773. [Google Scholar] [CrossRef] [PubMed]
  63. Torres-Martínez, L.M.; Ruiz-Gómez, M.A.; Figueroa-Torres, M.Z.; Juárez-Ramírez, I.; Moctezuma, E. Sm2FeTaO7 photocatalyst for degradation of indigo carmine dye under solar light irradiation. Int. J. Photoenergy 2012, 2012, 939608. [Google Scholar] [CrossRef]
Figure 1. TEM micrographs of the synthesized nanomaterials (as obtained): (a) CeO2; (b) Cu0.05Ce0.95O2-δ; (c) Cu0.10Ce0.90O2-δ; (d) Cu0.20Ce0.80O2-δ; (e) Cu0.30Ce0.70O2-δ.
Materials 09 00480 g001
Figure 2. TEM micrographs of the synthesized nanomaterials (as obtained): Cu0.35Ce0.65O2-δ (a) NPs and nanotape morphology; (b) NPs morphology and (c) nanotape morphology; Cu0.40Ce0.60O2-δ (d) NPs and nanotape morphology; (e) NPs morphology and (f) nanotape morphology; Cu0.50Ce0.50O2-δ (g) NPs and nanotape morphology; (h) NPs morphology and (i) nanotape morphology. Red arrows indicate CuO nanotapes (or nanotapes assemblies).
Materials 09 00480 g002
Figure 3. Electron diffraction patterns of the selected samples (as obtained): (a) Cu0.05Ce0.95O2-δ; (b) Cu0.40Ce0.60O2-δ (corresponding to nanoparticle morphology); (c) Cu0.50Ce0.50O2-δ (corresponding to nanotape morphology); EDX elemental mapping for the Cu0.35Ce0.65O2-δ sample (as obtained): (d) bright field image; (e) Cu mapping; (f) Ce mapping; (g) O mapping.
Materials 09 00480 g003
Figure 4. X-ray diffraction (XRD) patterns of samples (non-calcined) as a function of Cu/Ce molar ratio. The reflections marked as (*) are consistent with monoclinic CuO; the rest of the reflections are consistent with cubic fluorite-type ceria.
Materials 09 00480 g004
Figure 5. (a) XRD patterns of samples with Cu/Ce molar ratio 20/80 and 30/70, calcined at 400 °C and 500 °C. High-resolution transmission electron microscope (HRTEM) images of Cu/Ce 30/70 calcined at 500 °C; (b) showing a mixture of Cu/Ce mixed oxide nanoparticles and elongated CuO; and (c) atomic resolution of Cu/Ce mixed oxide nanoparticles.
Materials 09 00480 g005
Figure 6. (a) Raman spectra of CeO2 and Cu/Ce mixed oxides (as-obtained and calcined at 500 °C); (b) Same data without offset for comparison of relative intensity of the different bands; inset: zoom into the F2g Raman active mode; (c) A600/A450 for assessment of relative oxygen vacancies as a function of Cu content: (♦) as-obtained and (■) calcined samples. Symbols (inset (b)): (■) CeO2; (♦) CeO2 500 °C; (▲) Cu/Ce 5/95; (×) Cu/Ce 5/95 500 °C; ( * ) Cu/Ce 10/90; (●) Cu/Ce 20/80; (+) Cu/Ce 20/80 500 °C; (-) Cu/Ce 30/70; () Cu/Ce 30/70 500 °C.
Materials 09 00480 g006
Figure 7. Magnetization as a function of the magnetic field at 5 K of nanoparticles (CeO2, Cu0.05Ce0.95O2-δ (Cu/Ce 5/95), Cu0.10Ce0.90O2-δ (Cu/Ce 10/90), Cu0.20Ce0.80O2-δ (Cu/Ce 20/80).
Materials 09 00480 g007
Figure 8. Kubelka Munk absorption spectra of non-calcined nanomaterials at different Cu/Ce molar ratio.
Materials 09 00480 g008
Figure 9. C/C0 versus irradiation time for the degradation of indigo carmine using CeO2, Cu/Ce (30/70 and 35/65)) under visible light irradiation.
Materials 09 00480 g009
Table 1. Temperature range of microemulsion formation and temperature used for reactions, as a function of Cu/Ce molar ratio. The surfactant/oil (S/O) weight ratio was kept constant at 25/75 and the oil phase concentration was 14 wt % (solution of isooctane and metal precursor)—ME: Microemulsion.
Molar Ratio Cu/CeME Temperature Range (°C)Reaction Temperature (°C)
0/024–26-
0/10026–2827
5/9526–2927.5
10/9026–2927.5
20/8027–2928
30/7028–3029
35/6528–3029
40/6029–3130
50/5029–3130
Table 2. Crystallite size of Cu/Ce mixed oxide nanoparticles estimated using the Scherrer equation as a function of Cu/Ce molar ratio (as obtained samples).
Sample Cu/Ce Molar RatioCrystallite Size (dXRD in nm)2θ (°)
CeO23.128.71
Cu/Ce 5/952.928.73
Cu/Ce 10/902.528.88
Cu/Ce 20/802.428.93
Cu/Ce 30/702.129.12
Cu/Ce 35/651.829.35
Cu/Ce 40/602.129.30
Cu/Ce 50/502.129.30
Table 3. Crystallite size of the calcined nanomaterials calculated by Scherrer equation as a function of Cu/Ce molar ratio.
Cu/Ce Molar Ratio Calcination TemperatureCrystallite Size (dXRD in nm)2θ (°)
Cu/Ce 20/80 500 °C5.228.76
Cu/Ce 30/70 500 °C6.928.74
Cu/Ce 20/80 400 °C4.428.77
Cu/Ce 30/70 400 °C4.328.75
Table 4. Eg values for Cu/Ce samples obtained by Kubelka Munk function.
MaterialBand Gap (eV)
CeO22.91
CuCe 5/952.85
CuCe 10/902.75
CuCe 20/802.67
CuCe 30/702.65
CuCe 35/652.27

