Experimental Testing and Analytical Modeling of Asymmetric End-Notched Flexure Tests on Glass-Fiber Metal Laminates


1
Faculty of Mechanical Engineering, Lublin University of Technology, Nadbystrzycka 36, 20-618 Lublin, Poland
2
Department of Civil and Industrial Engineering, University of Pisa, Largo Lucio Lazzarino, I-56122 Pisa, Italy
*
Author to whom correspondence should be addressed.
Metals 2020, 10(1), 56; https://doi.org/10.3390/met10010056
Submission received: 7 December 2019
/
Revised: 23 December 2019
/
Accepted: 25 December 2019
/
Published: 28 December 2019
(This article belongs to the Special Issue Recent Advances in Fibre Metal Laminates)
Abstract
:An experimental campaign on glass-fiber/aluminum laminated specimens was conducted to assess the interlaminar fracture toughness of the metal/composite interface. Asymmetric end-notched flexure tests were conducted on specimens with different fiber orientation angles. The tests were also modeled by using two different analytical solutions: a rigid interface model and an elastic interface model. Experimental results and theoretical predictions for the specimen compliance and energy release rate are compared and discussed.
1. Introduction
Fiber metal laminates (FMLs) are hybrid composite materials made of adhesively bonded layers of metal alloys and fiber-reinforced laminates. Examples include carbon/aluminum (CARALL) and glass/aluminum reinforced (GLARE) laminates [1]. Like fiber-reinforced polymers (FRPs), FMLs are characterized by high tensile strength and low density [2,3]. However, thanks to the properties of the metallic layers, FMLs feature improved resistance to impact [4], higher buckling loads [5], and lesser sensitivity to environmental effects [6,7] with respect to FRPs. During the last decades, an increasing number of FML applications have been developed, particularly in the aerospace sector [8].
Despite the very good damage tolerance features of FMLs, fatigue and fracture phenomena may still strongly limit the service life of FML components [9]. In particular, delamination—i.e., interfacial fracture between the constituting layers—is a major failure mode for FMLs, as well as for composite laminates in general [10]. Experimental assessment and theoretical modeling of fatigue and fracture phenomena in FMLs are complicated by the inhomogeneous internal structure of this class of hybrid composite materials. For instance, structural models have to consider the strong elastic couplings arising—e.g., between bending and extension, bending and twisting, etc.—because of the general asymmetric stacking sequences [11]. Moreover, delamination analysis should account for the mixed-mode fracture conditions typical of asymmetrically located delamination cracks [12].
In the literature, only a few theoretical models for the study of delamination take into account elastic couplings [13,14,15,16,17,18]. Amongst these, Schapery and Davidson developed a method based on classical laminated plate theory and calculated the mode mixity as a function of a numerical parameter [13]. Xie et al. obtained closed-form solutions for the cohesive zone model of several delamination toughness test specimens with bending-extension coupling [14]. Dimitri et al. presented a general formulation of the elastic interface model including bending-extension and shear deformability [15]. Valvo analyzed the delamination of shear-deformable laminated beams with bending-extension coupling based on a rigid interface model [16]. Tsokanas and Loutas extended the above-mentioned analysis to include the effects of crack-tip rotations and hygrothermal stresses [17]. Bennati et al. furnished a complete analytical solution for a crack-tip element made of two multidirectional laminated beams connected by an elastic-brittle interface [18].
Moreover, many experimental investigations have been carried out to characterize the delamination behavior of FMLs [19,20,21,22]. Cortés and Cantwell conducted single cantilever beam (SCB) tests on magnesium alloy based FMLs [19]. Abdullah et al. carried out similar tests on glass fiber-reinforced polypropylene (GFPP) based FMLs [20]. Bieniaś et al. conducted end-notched flexure (ENF) tests on CARALL and GLARE laminated specimens and used Valvo’s rigid interface model to interpret their results [21]. Bieniaś and Dadej extended the previous research to investigate fatigue delamination growth [22].
However, it is long known that a rigid interface model, which neglects the relative rotation and deflection between sublaminates in the neighborhood of the crack-tip, may underestimate the ENF specimen compliance with respect to experimental tests and therefore lead to a wrong evaluation of the energy release rate [23]. To overcome this drawback, Sundararaman and Davidson introduced rotational springs at the crack-tip in a theoretical model of bi-material ENF test specimens [24]. Yang and Sun tested and modeled multidirectional laminated asymmetric end-notched flexure (AENF) test specimens accounting for bending-extension coupling, but did not partition the energy release rate into its mode I and mode II contributions [25]. To the best of our knowledge, in the available literature, there are no specific analytical solutions for multidirectional laminated asymmetric ENF tests that fully account for the bending-extension coupling and mixed-mode fracture conditions.
In this paper, we present the results of AENF tests on multidirectional glass fiber-reinforced polymer/aluminum (GFRP/Al) specimens and show how these can be interpreted based on both the rigid [16] and elastic [18] interface models. Section 2 describes the geometry and material properties of the tested specimens. Section 3 presents the experimental methods and the theoretical models adopted for test interpretation. Novel analytical expressions are given for the AENF test specimen compliance and mixed-mode energy release rate. Experimental and analytical results are presented in Section 4 and further discussed in Section 5, also with respect to past studies of the literature. Conclusions and suggestions about possible future developments are given in Section 6.
2. Materials
To a possible extent, the preparation of test specimens followed the ASTM standard for the end-notched flexure test [26]. It should be considered, however, that the standard test method strictly refers to symmetric, unidirectional fiber-reinforced composite laminates, while current tests were carried out on asymmetric, multidirectional fiber metal laminates.
Laminated plates with the desired stacking sequences were manufactured by GFRP composite plies—made of M12 epoxy resin (Hexcel, Stamford, CT, USA) and R-type high-strength glass fibers and a sheet of 2024-T3 aluminum alloy. Before laminating, the surfaces of the aluminum alloy sheet were anodized in chromic acid and an adhesive primer type EC3924B (3M, St. Paul, MN, USA) was applied thereafter to improve bonding with GFRP. The laminated plates were produced by the autoclave method (Scholz Maschinenbau, Dusseldorf, Germany) in the Department of Materials Engineering at Lublin University of Technology, Poland. The following process parameters were employed: curing temperature, 135 °C; curing time, 2 h; heating and cooling gradient, 2 °C/min; pressure, 4.5 bar; vacuum pressure, 0.8 bar. Specimens with specified size were cut from the larger laminated plates with initial delaminations placed at the interface between the aluminum alloy sheets and a composite ply. Three different fiber orientation angles were considered for the interface ply, ϕ = 0°, 45°, and 90°, with respect to the specimen longitudinal direction. The delamination interface is henceforth specified as Al // ϕ. For each delamination interface, three specimens were tested.
Table 1 describes the lay-ups of the tested specimens. The thickness values correspond to an average of three measures taken at different places along the specimen length after the manufacturing process in the autoclave. A caliper with an accuracy of 0.01 mm was used. This explains the presence of three decimal digits in some cases. Moreover, some minor differences in the laminate thickness were observed with respect to design values. Such geometrical imperfections may be related to the use of the vacuum bag, additional layers of release peel-ply, or fabric draining the resin during the curing process. Nevertheless, to increase the accuracy of the modeling, the real measured sizes were adopted in the calculations.
3. Methods
3.1. Experimental Testing
Asymmetric end-notched flexure tests were carried out by loading the specimens in a three-point bending configuration (Figure 1). As a first step, compliance calibration tests were performed to determine the specimen compliance as a function of crack length by loading and unloading the specimens within the elastic range of behavior. Subsequently, tests to failure were conducted to determine the interlaminar fracture toughness of the investigated metal/composite interfaces in terms of critical energy release rate. The tests were carried out on a Shimadzu AG-X Plus mechanical testing machine (Shimadzu, Kyoto, Japan) equipped with a load cell of capacity 20 kN.
3.1.1. Compliance Calibration Tests
By suitably adjusting the specimen position on the supports, tests were conducted in the elastic range of behavior for three values of crack lengths: = 15, 30, and 45 mm. From the measures of applied load, , and corresponding deflection, , the specimen compliance was determined:
According to the compliance calibration (CC) method, as described by the ASTM standard [26], the compliance is assumed to be a cubic function of delamination length:
where and respectively are the intercept and slope of the compliance-calibration line, vs. , to be determined through fitting of experimental results.
3.1.2. Interlaminar Fracture Toughness Tests
The energy release rate during a test can be evaluated through the Irwin-Kies relationship [27]:
where is the specimen width. By substituting Equation (2) into (3), we obtain
It should be observed that—as will be discussed in the following—the validity of Equation (2) is partly contradicted by the available theoretical models. In any case, if is evaluated through fitting of experimental results, then Equation (4) yields an acceptable evaluation of the energy release rate. In particular, for the load corresponding to crack onset, , an estimate of the critical energy release rate, , is obtained. This method is however unable to evaluate the mode mixity, i.e., to assess the contributions, and , related to fracture modes I and II. To this aim, the use of a theoretical model is required.
3.2. Analytical Modeling
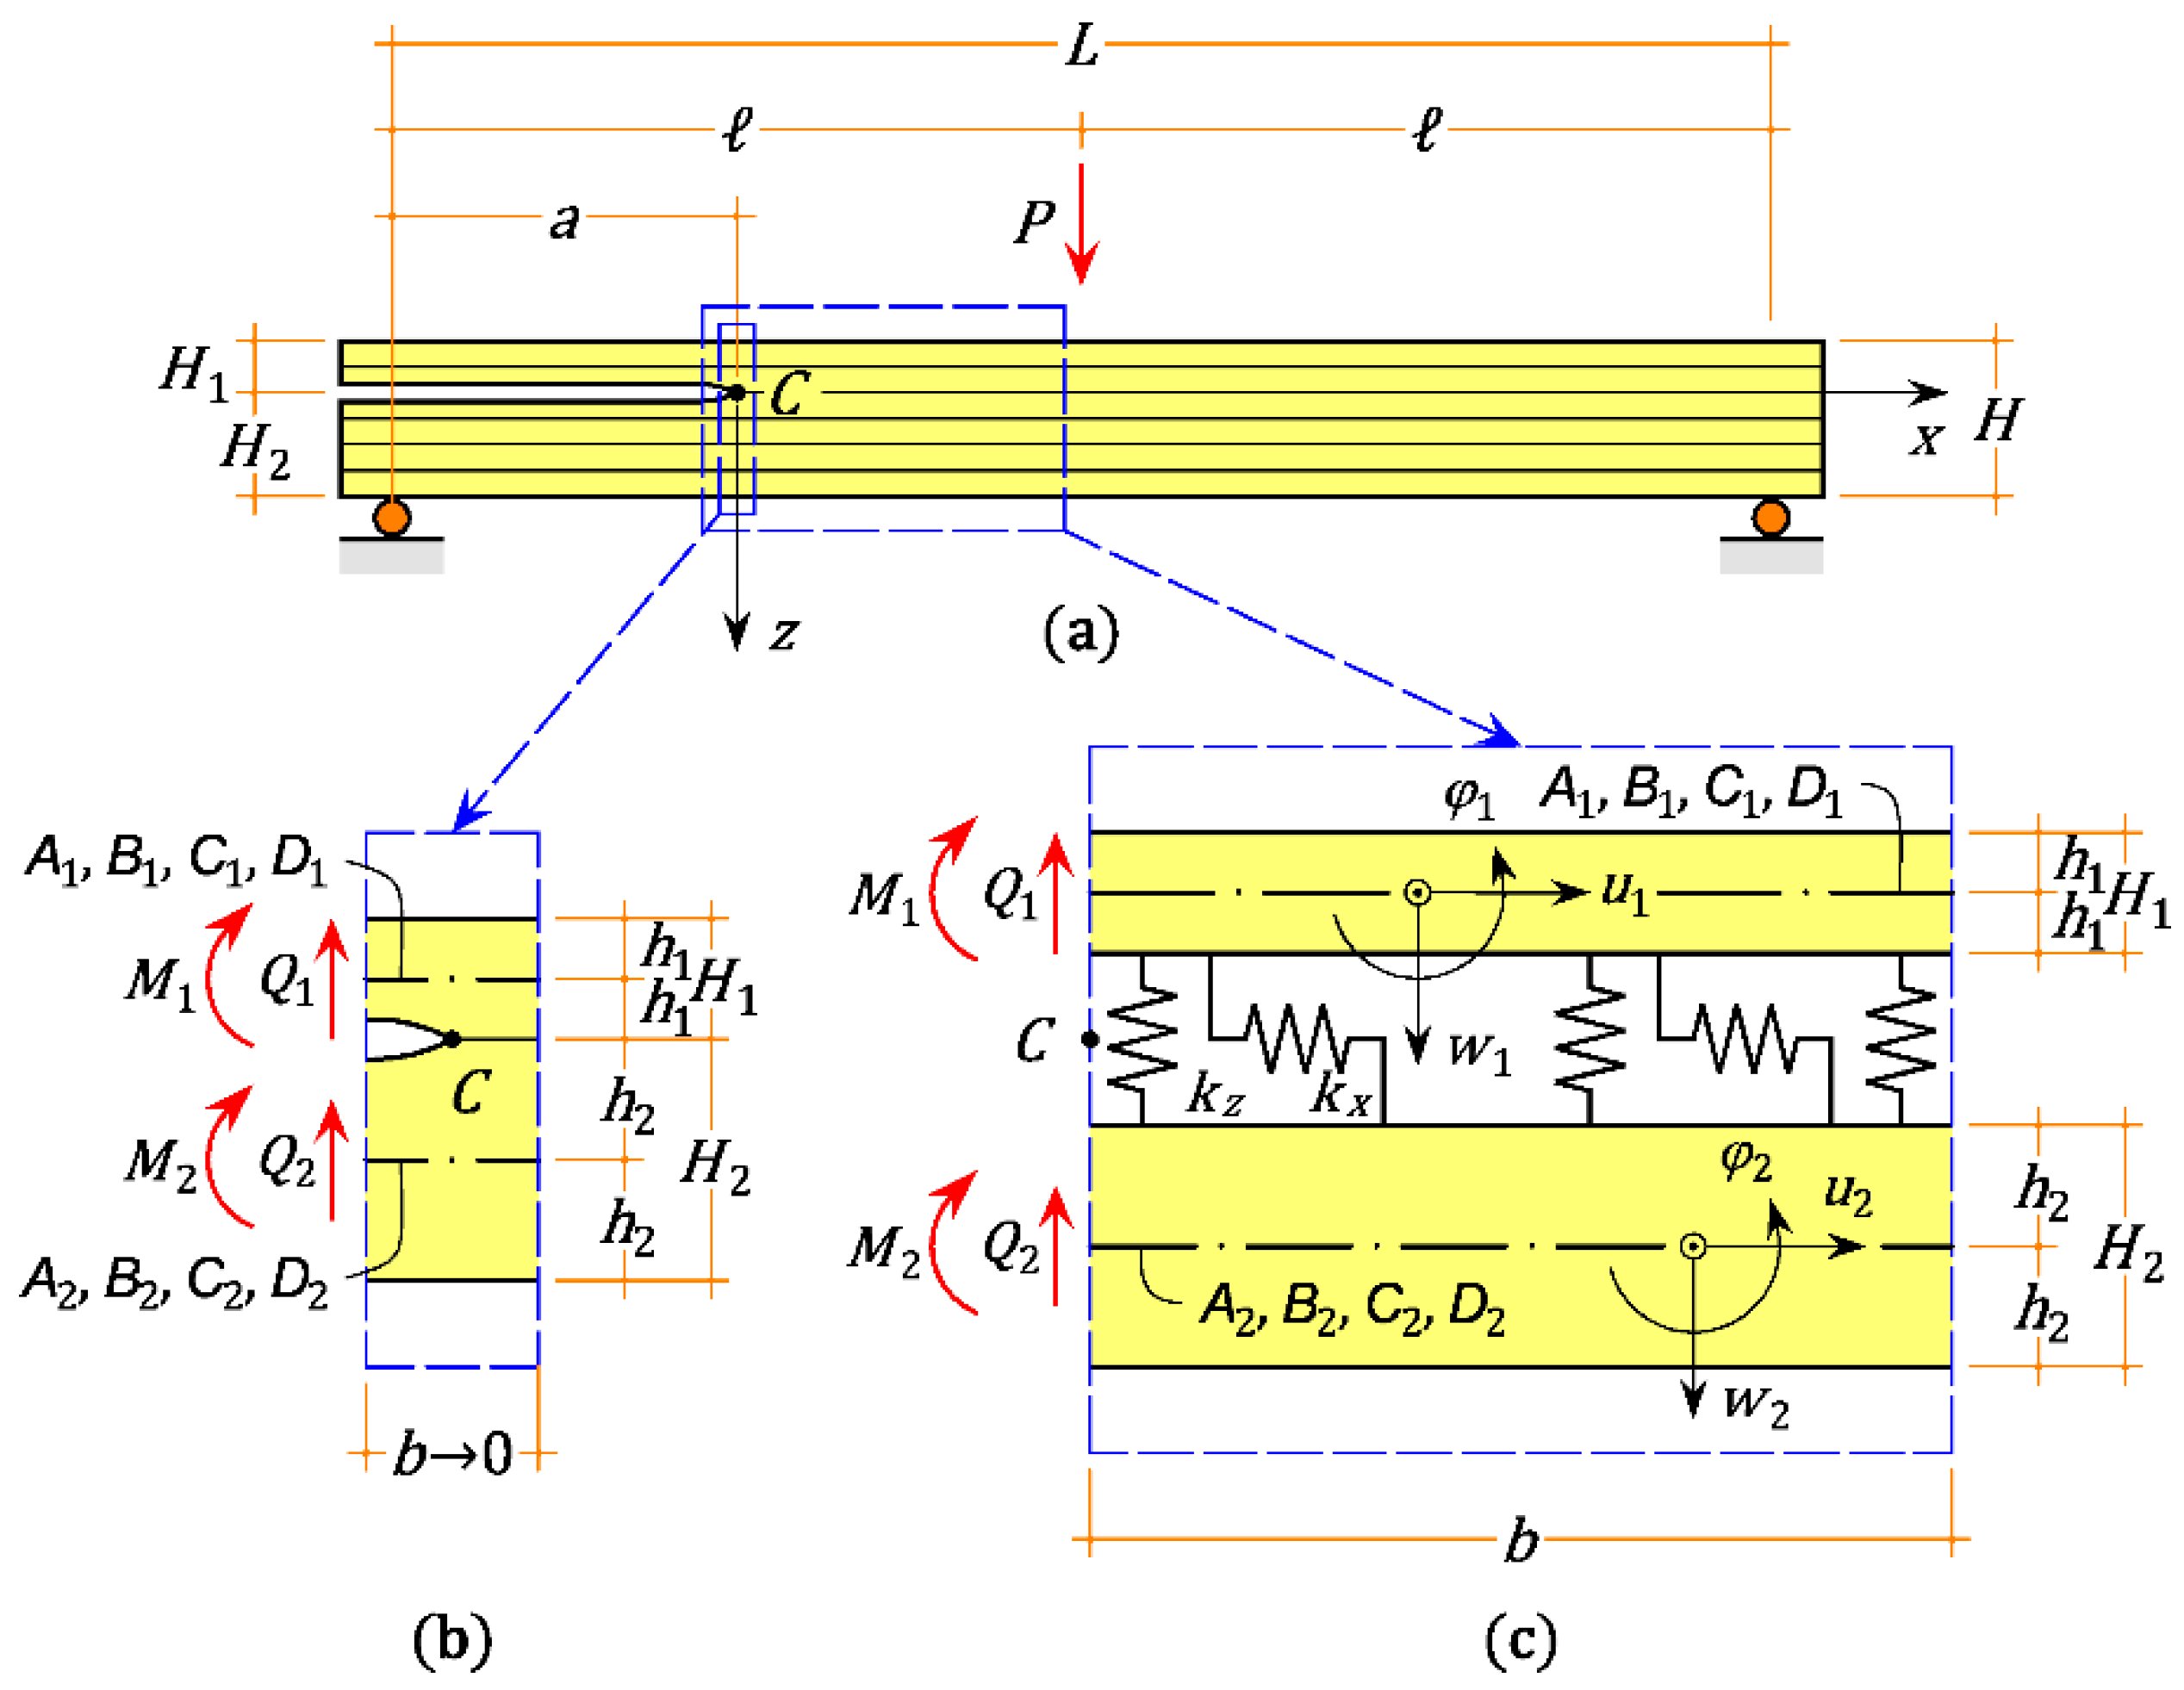
Let us consider a laminated specimen with a constant rectangular cross section of width and thickness . The specimen is affected at one end by an initial through-the-width delamination, which divides the laminate into two sublaminates of thicknesses and (generally different from each other). In the AENF test, the specimen is loaded by a force P in a three-point bending configuration. We denote with and the nominal—i.e., referred to the supports—specimen length and delamination length, respectively (Figure 2a).
Two theoretical models will be comparatively used to interpret the experimental test results:
(i) The rigid interface model proposed by Valvo [16], which assumes that the upper and lower sublaminates are rigidly connected to each other at the crack-tip cross section; accordingly, a crack-tip segment of vanishing length, , is considered (Figure 2b);
(ii) The elastic interface model developed by Bennati et al. [18], which assumes that the sublaminates are connected by a continuous distribution of normal and tangential springs with elastic constants and , respectively; accordingly, a crack-tip element of finite length, , is considered (Figure 2c).
Both models consider the sublaminates as extensible, shear-deformable, and flexible laminated beams with possible bending-extension coupling. Let , , , and respectively denote the sublaminate extension stiffness, bending-extension coupling stiffness, shear stiffness, and bending stiffness (with for the upper sublaminate and for the lower sublaminate). Such stiffnesses should be calculated in line with classical laminated plate theory [11] accounting for the beam-like behavior of specimens. Further details can be found in Bennati et al. [18].
Next, it is also useful to introduce the sublaminate compliances:
At the crack-tip cross section, the sublaminates are subjected to shear forces,
and bending moments,
where is a shearing force distribution factor. The factor is determined from the following equation by imposing that the sublaminates have equal deflections at the support cross section:
where and respectively are the relative rotation and transverse deflection at the crack-tip cross section. For the rigid interface model, such quantities are simply null; for the elastic interface model, the expressions are given in Appendix A.
Both theoretical models furnish the energy release rate as the sum of two modal contributions:
Hence, we calculate the mode mixity angle , which ranges from 0° (pure mode I) to ±90° (pure mode II), giving a conventional measure of the amount of mode II with respect to mode I [12]:
The specimen compliance can be evaluated by inverting the Irwin-Kies relationship Equation (3) and integrating with respect to crack length:
where
is the compliance of a laminated specimen with no delamination (); and respectively denote the shear and bending compliances of the unbroken part of the laminate.
3.2.1. Rigid Interface Model
Based on the rigid interface model [16], the modal contributions to the energy release rate can be calculated as follows:
where
are the crack-tip flexibility coefficients and
are the crack-tip forces, in turn computed as functions of the crack-tip displacement rates:
By substituting Equation (13) into (9) and (11), the specimen compliance is determined as:
It should be noted that the conditional statements in Equations (13) and (17) are introduced to exclude compressive stresses at the crack-tip (arising from local contact between sublaminates) from contributing to the energy release rate. Furthermore, Equation (17) shows that, according to the rigid interface model, the assumption behind the experimental compliance calibration method, Equation (2), does not hold in general because of an additional term linear with . This linear term vanishes only in special cases, e.g., in the event of crack-tip compression (), or for symmetric specimens ( and ), or if shear deformability can be neglected ().
3.2.2. Elastic Interface Model
Bennati et al. [18] modeled a crack-tip element of finite length (Figure 2c) and deduced a complete analytical solution in terms of the interfacial stresses, and , internal forces, , , and , and generalized displacements, , , and , in the upper and lower sublaminates as functions of the x-coordinate. The solution distinguishes between a balanced case (typical of symmetric specimens) and an unbalanced case (which applies to the present case, where specimens have asymmetric lay-ups and delaminations). For the sake of brevity, the complete expressions of the analytical solution are omitted here, except for the internal forces reported in Appendix A. The solution for the interfacial stresses and internal forces depends on nine integration constants, , , …, , whose values for the AENF test specimen are determined by imposing the following boundary conditions:
the last three of which impose a behavior similar to a monolithic beam to the unbroken part of the laminate.
The modal contributions to the energy release rate turn out to be
where denotes the Heaviside step function and , , …, are the roots of the following characteristic equation:
with
By substituting Equation (19) into (9) and (11), the specimen compliance is obtained as
where is given by Equation (12),
with
In Equation (24), and are the integration constants obtained by solving Equation (18) with and and , respectively.
In Equations (19) and (24), the Heaviside step function is introduced to exclude any contributions from compressive normal interfacial stresses at the crack-tip. Furthermore, it is worth noting that, according to the elastic interface model, the specimen compliance, Equation (22), is given by a complete cubic polynomial in the delamination length. Hence, the assumption behind the experimental compliance calibration method, Equation (2), is not generally fulfilled.
4. Results
4.1. Interlaminar Fracture Toughness Tests
4.1.1. Compliance Calibration
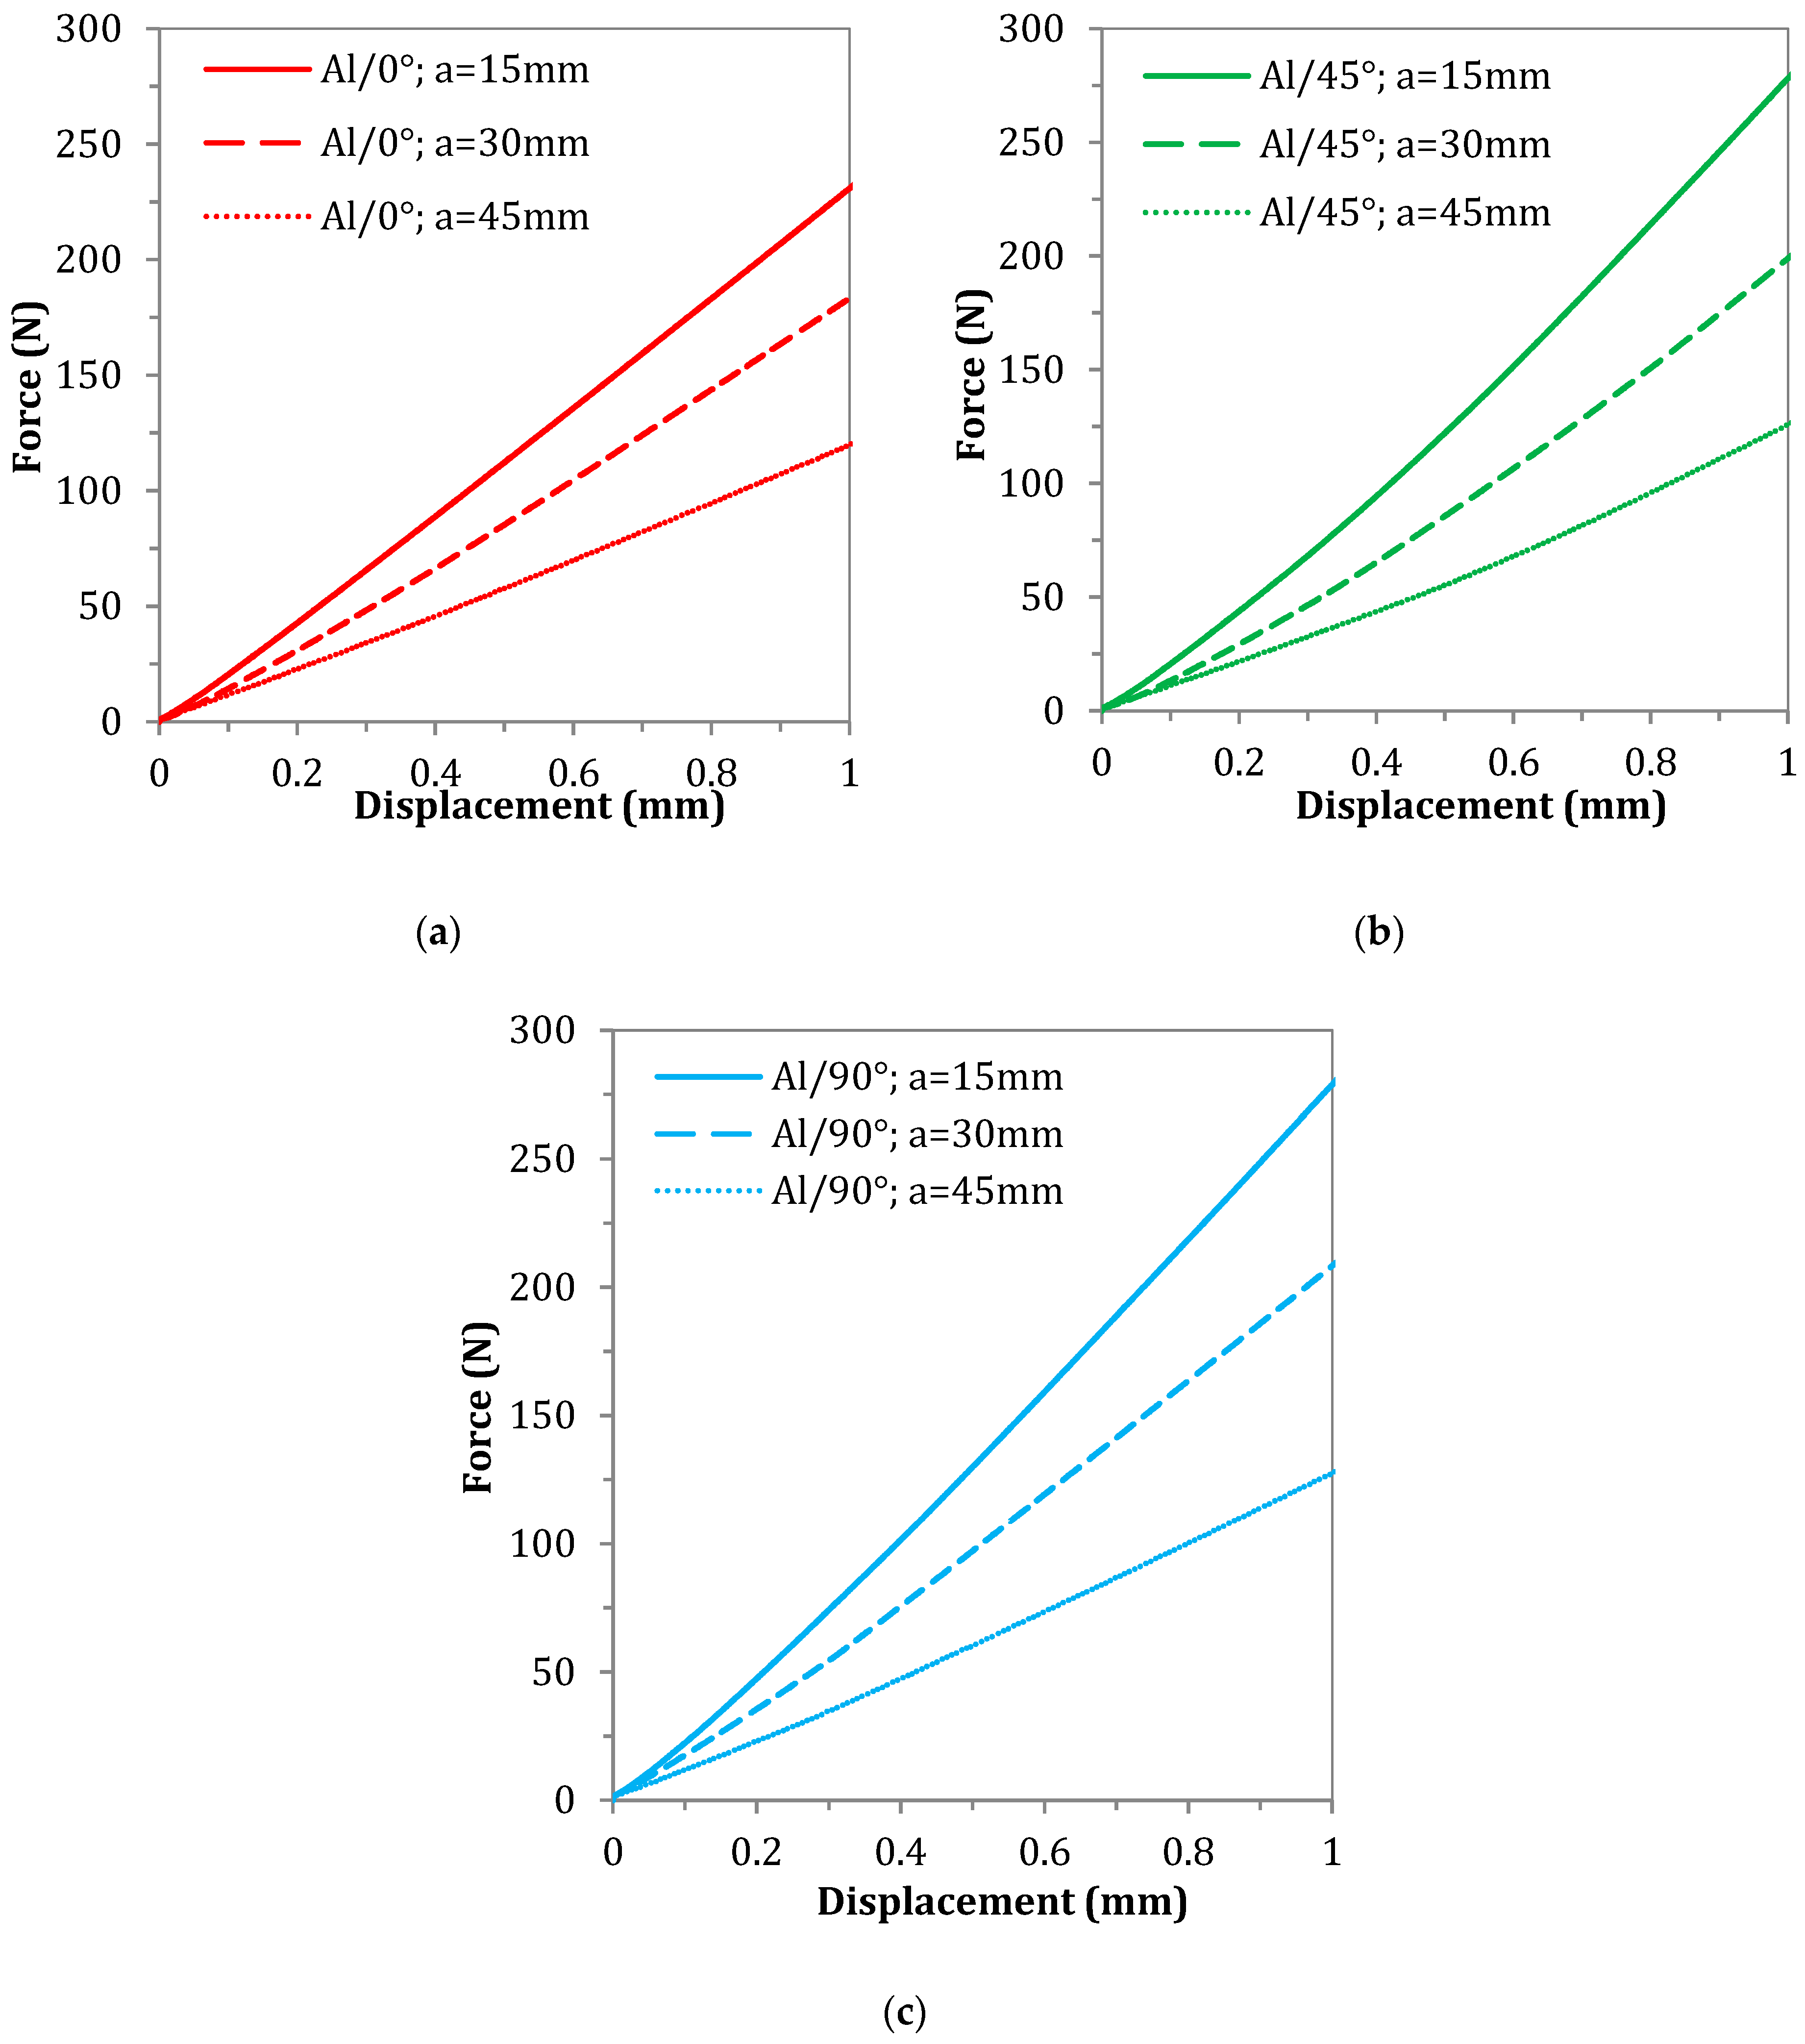
To experimentally determine the critical energy release rate of the investigated metal/composite adhesive joints, as a first step, compliance-calibration tests were performed. Within these tests, the AENF specimen compliance was measured and referenced to the known crack length. Figure 3 presents the load vs. deflection curves obtained for different crack lengths and different orientations of the interface layer.
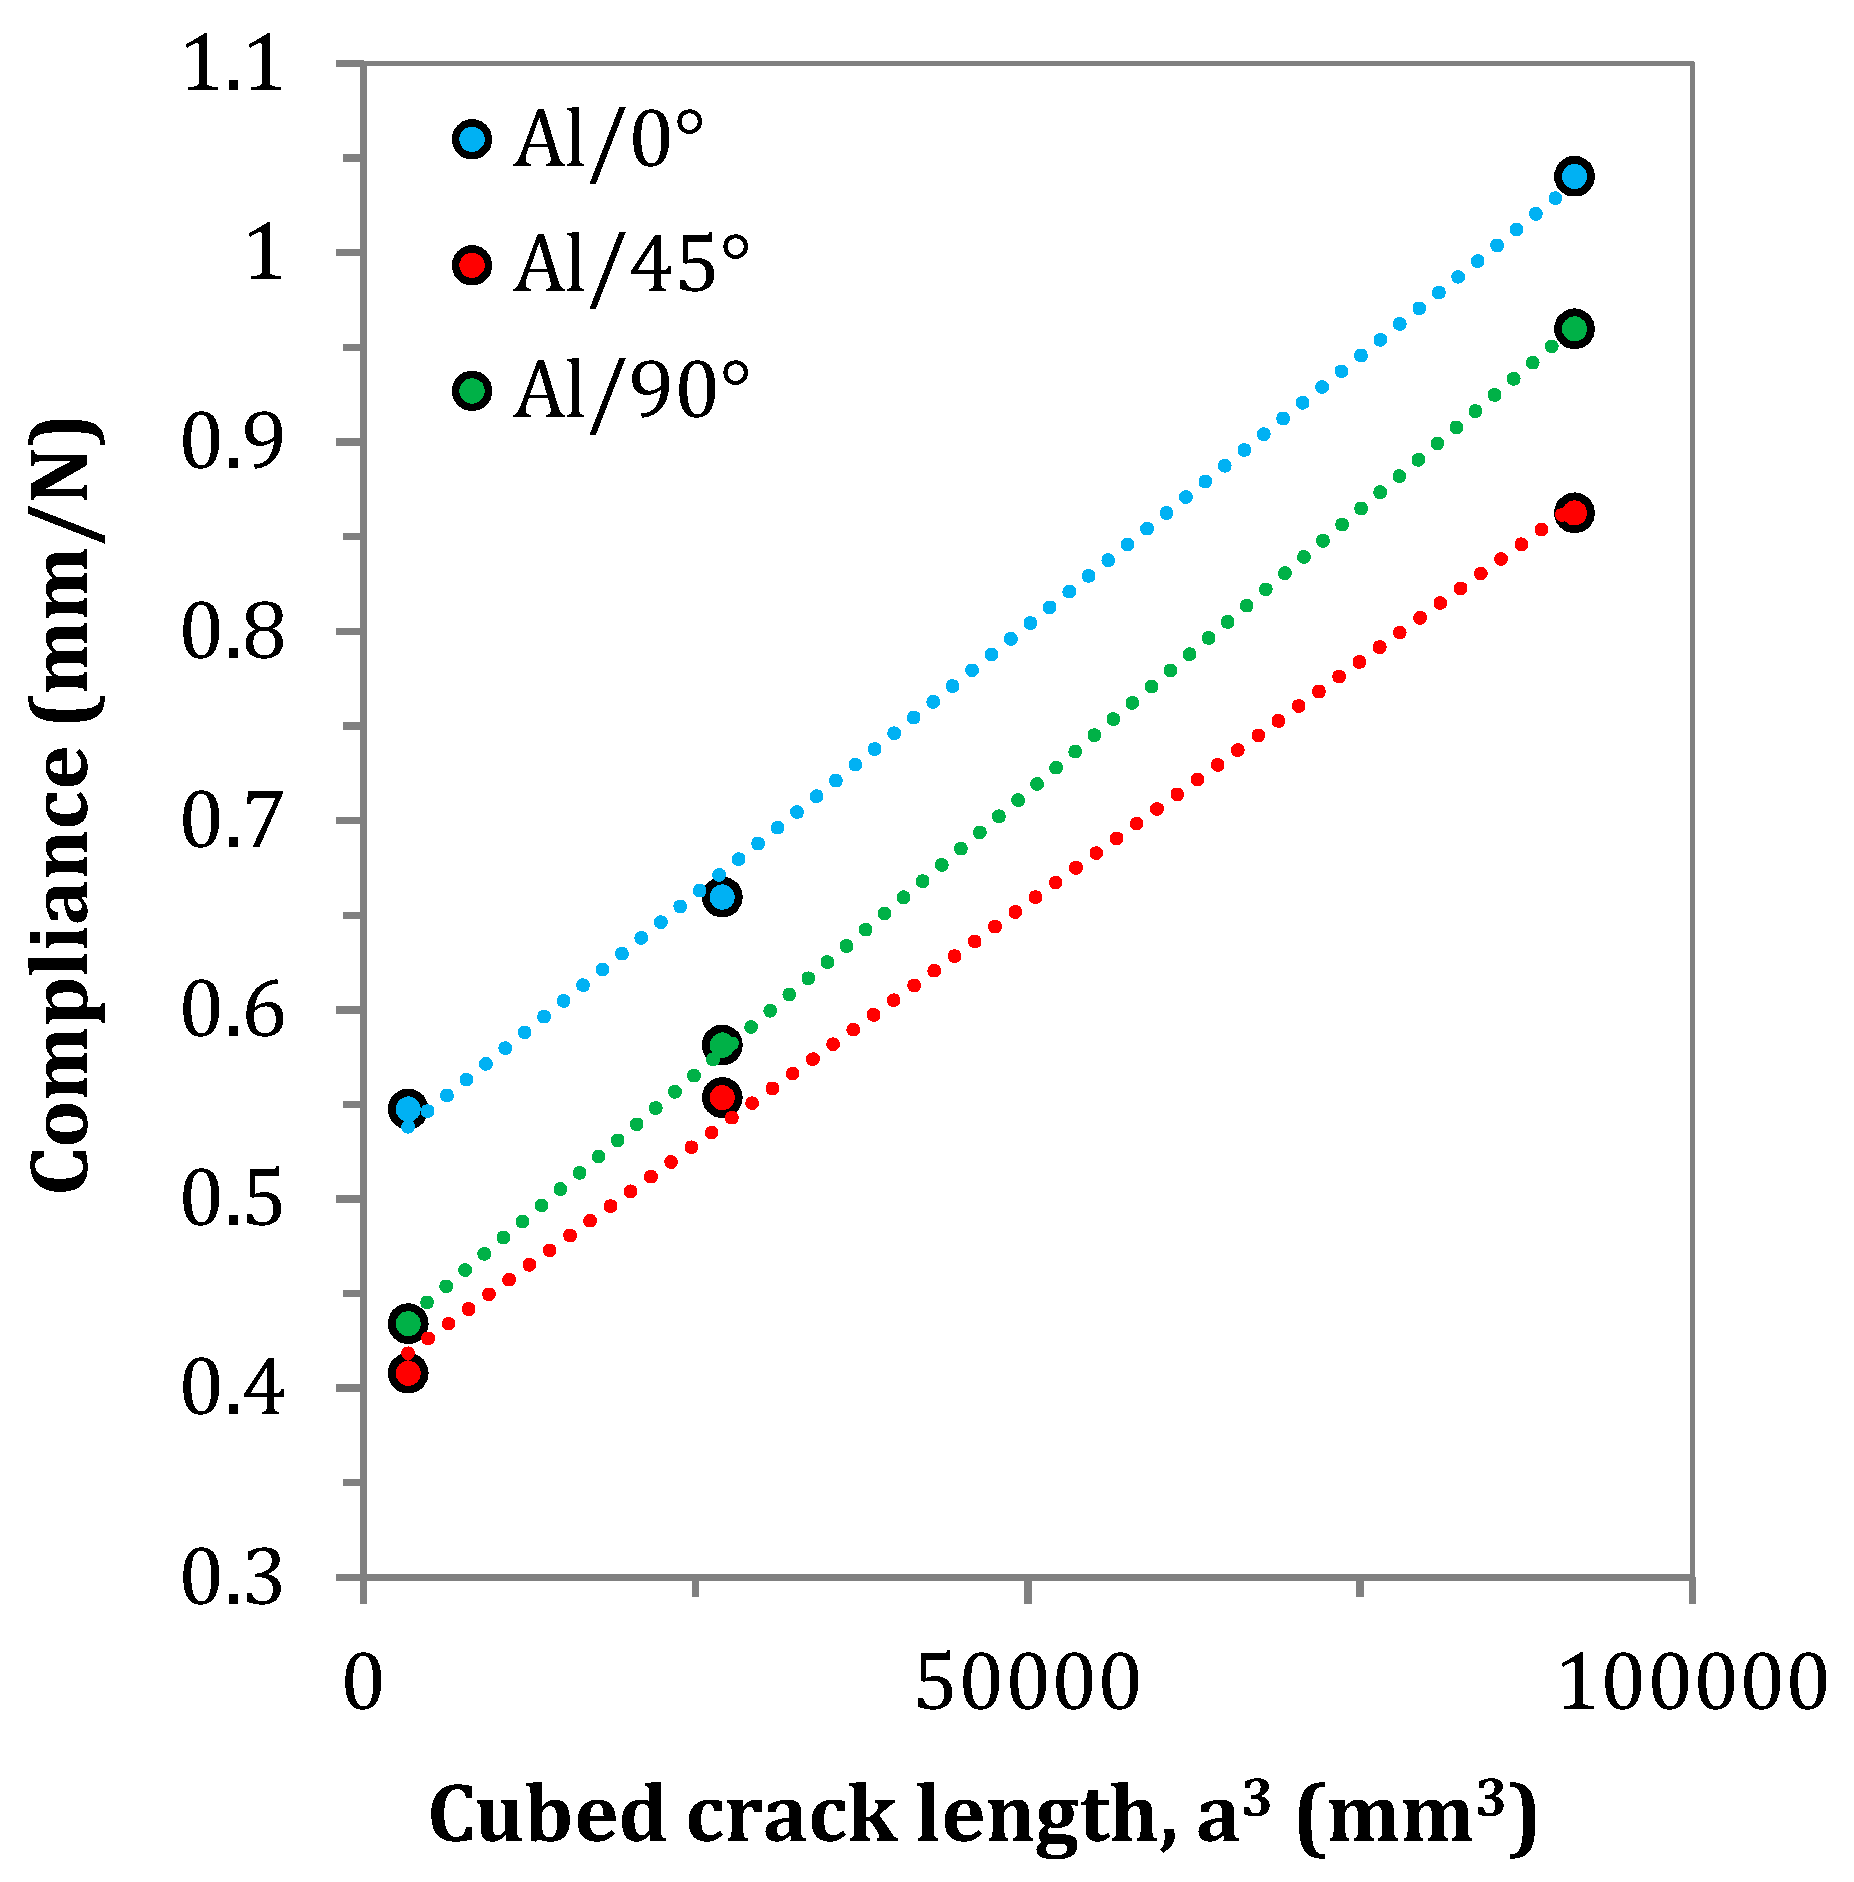
In Figure 3, the raw load vs. deflection curves are presented. However, such raw curves include also an initial region of nonlinear response. According to the ASTM standard [26], the possible initial nonlinearity due to fixture must be excluded from regression analysis and the specimen compliance should be calculated from the linear part of the curves. In this study, the experimental tests were performed on asymmetrical, unstandardized multidirectional fiber metal laminates, so the range of force for the compliance calculations were selected individually to be sure that the initial nonlinearity was excluded from the further calculations. Based on the above, the compliance vs. cubed crack length characteristics was determined as shown in Figure 4.
Table 3 shows the values of compliance obtained from the experiments, as well as the slope of the compliance vs. cubed crack length characteristics according to Equation (2). However, it should be noted that Table 3 contains experimentally determined deflections, which are actually calculated by the experimental CC method, with initial nonlinear region excluded, not directly read from the load vs. deflection plots, in order to avoid artificial mismatch caused by the possible initial nonlinearity due to fixture, as suggested in the ASTM standard [26]. For the comparison, a force of 130 N was chosen because that was the maximum value reached by each of the three tested cases of crack length (a = 15, 30, and 45 mm).
4.1.2. Critical Energy Release Rate
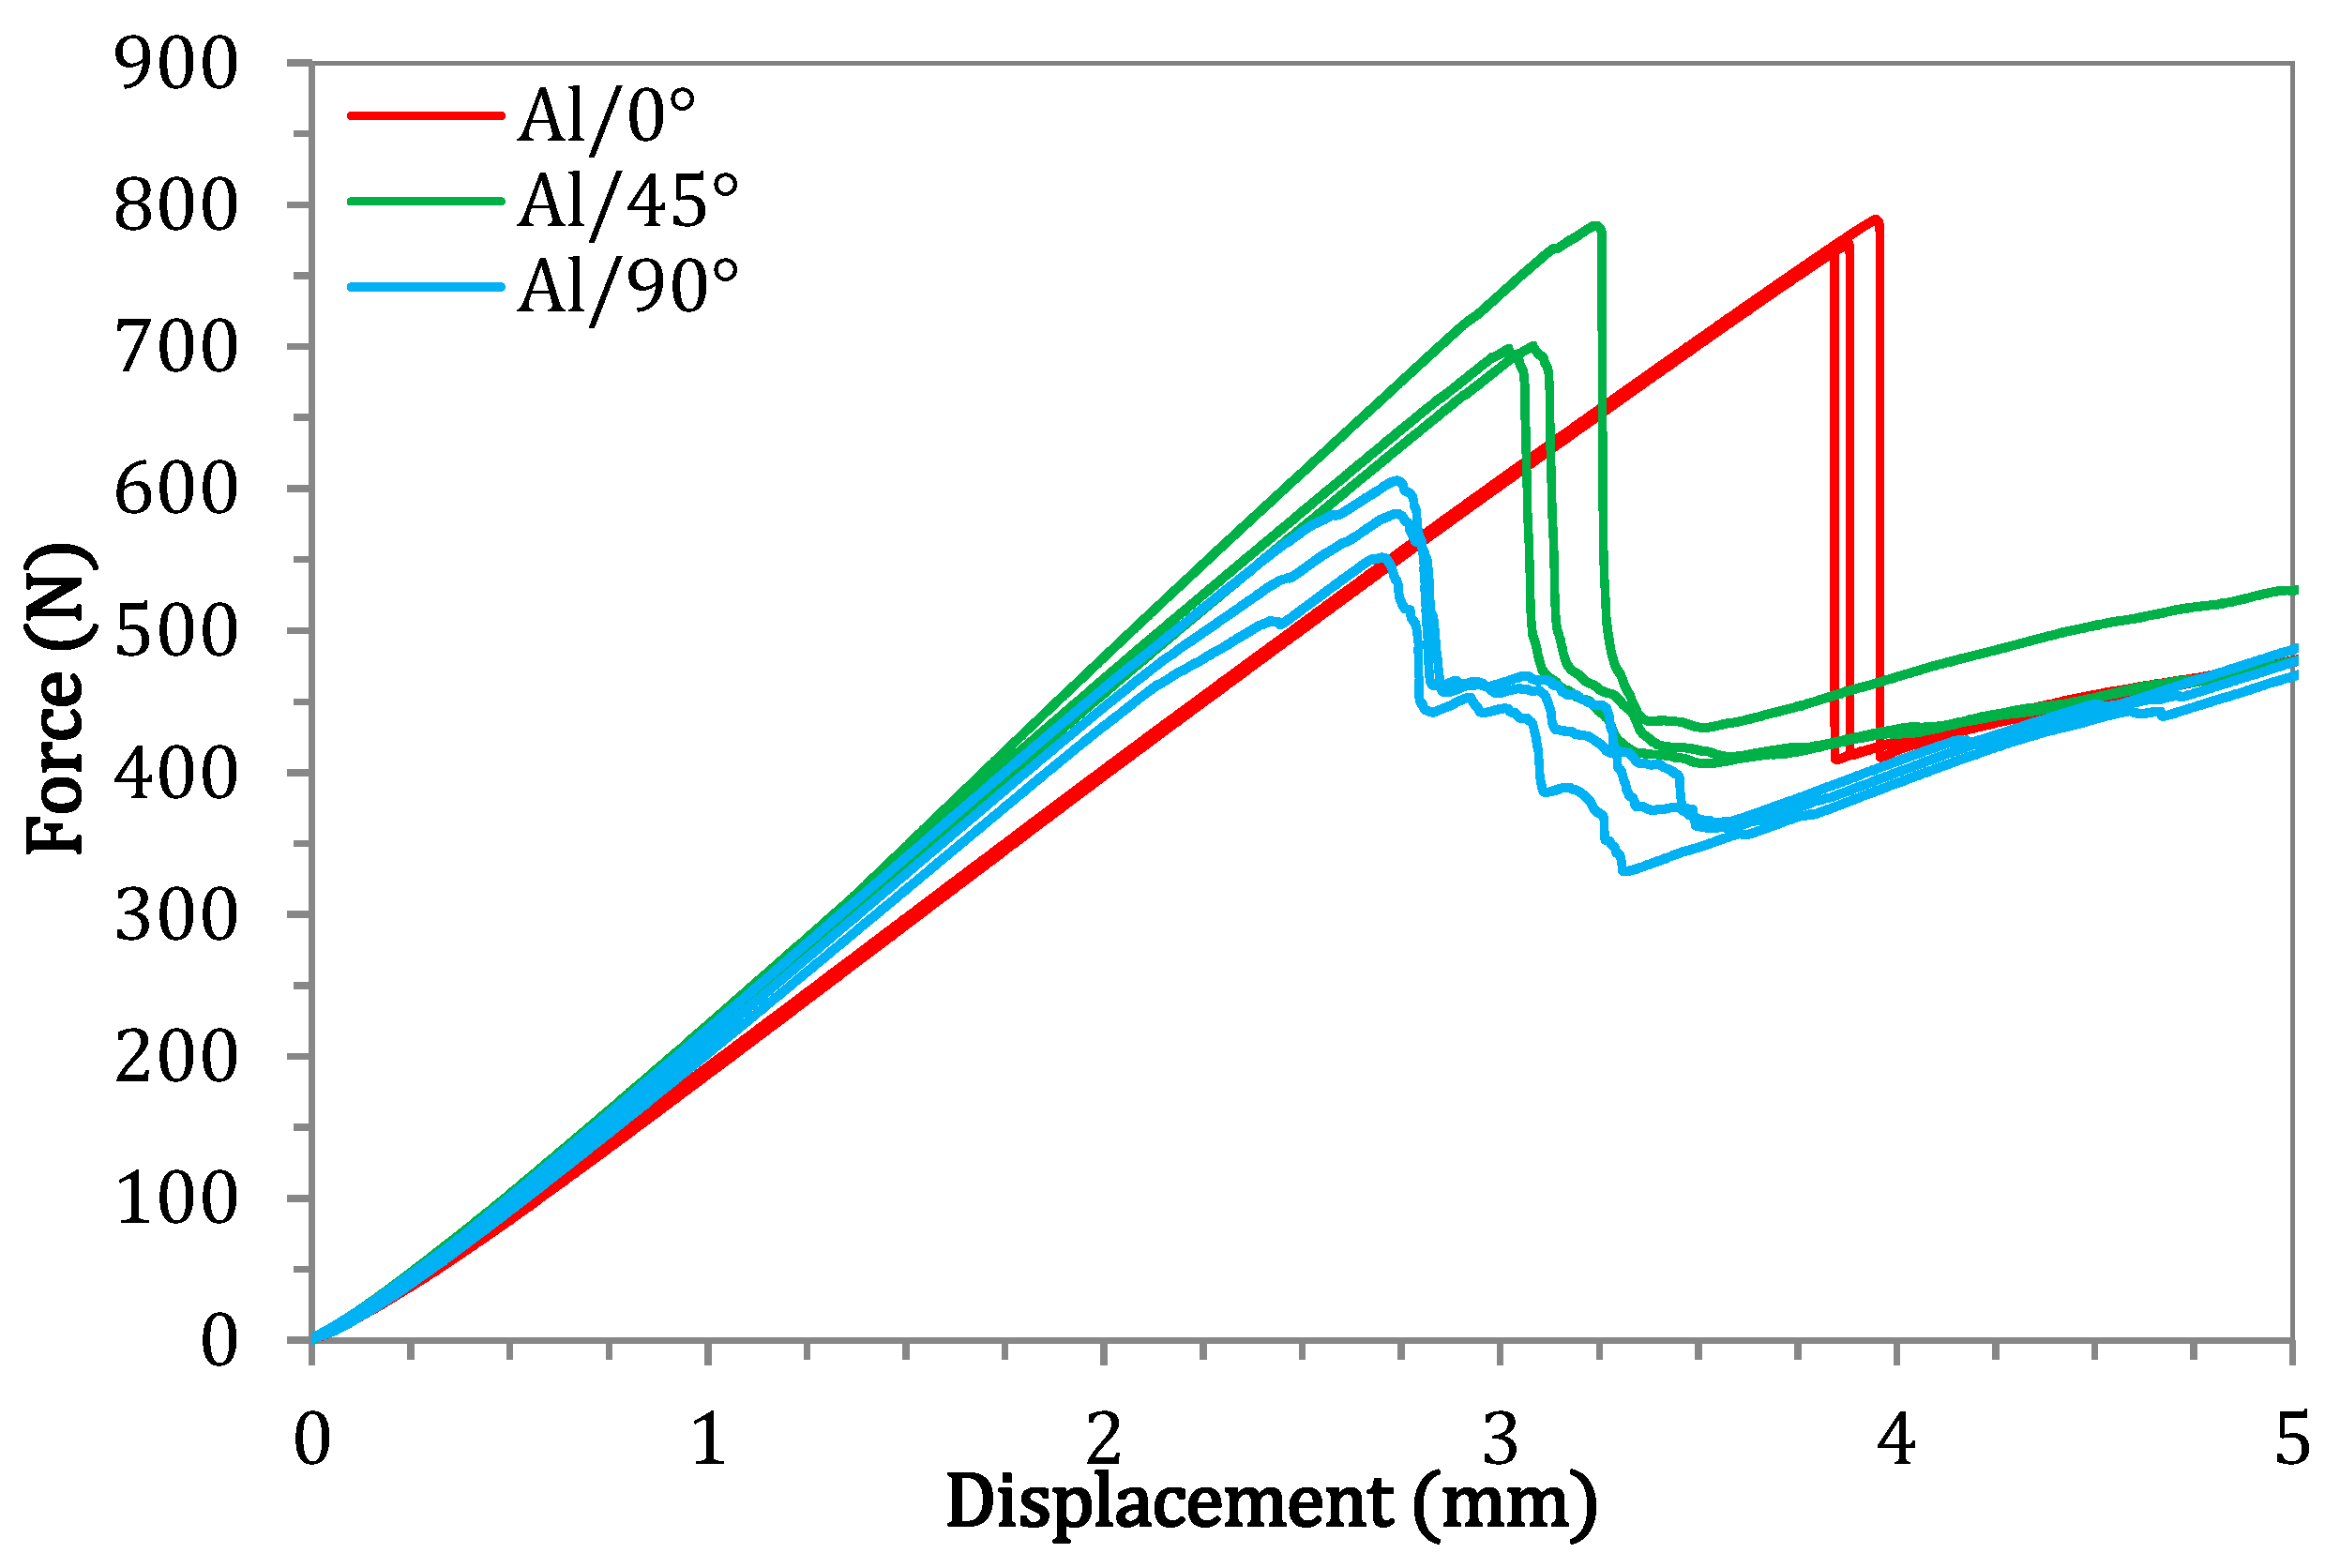
Figure 5 shows the load vs. deflection curves of the interlaminar fracture toughness (IFT) tests.
From the obtained load vs. deflection curves, the maximum registered force was used to calculate the critical strain energy release rate. The test results are summarized in Table 4.
4.1.3. Fractographic Analysis
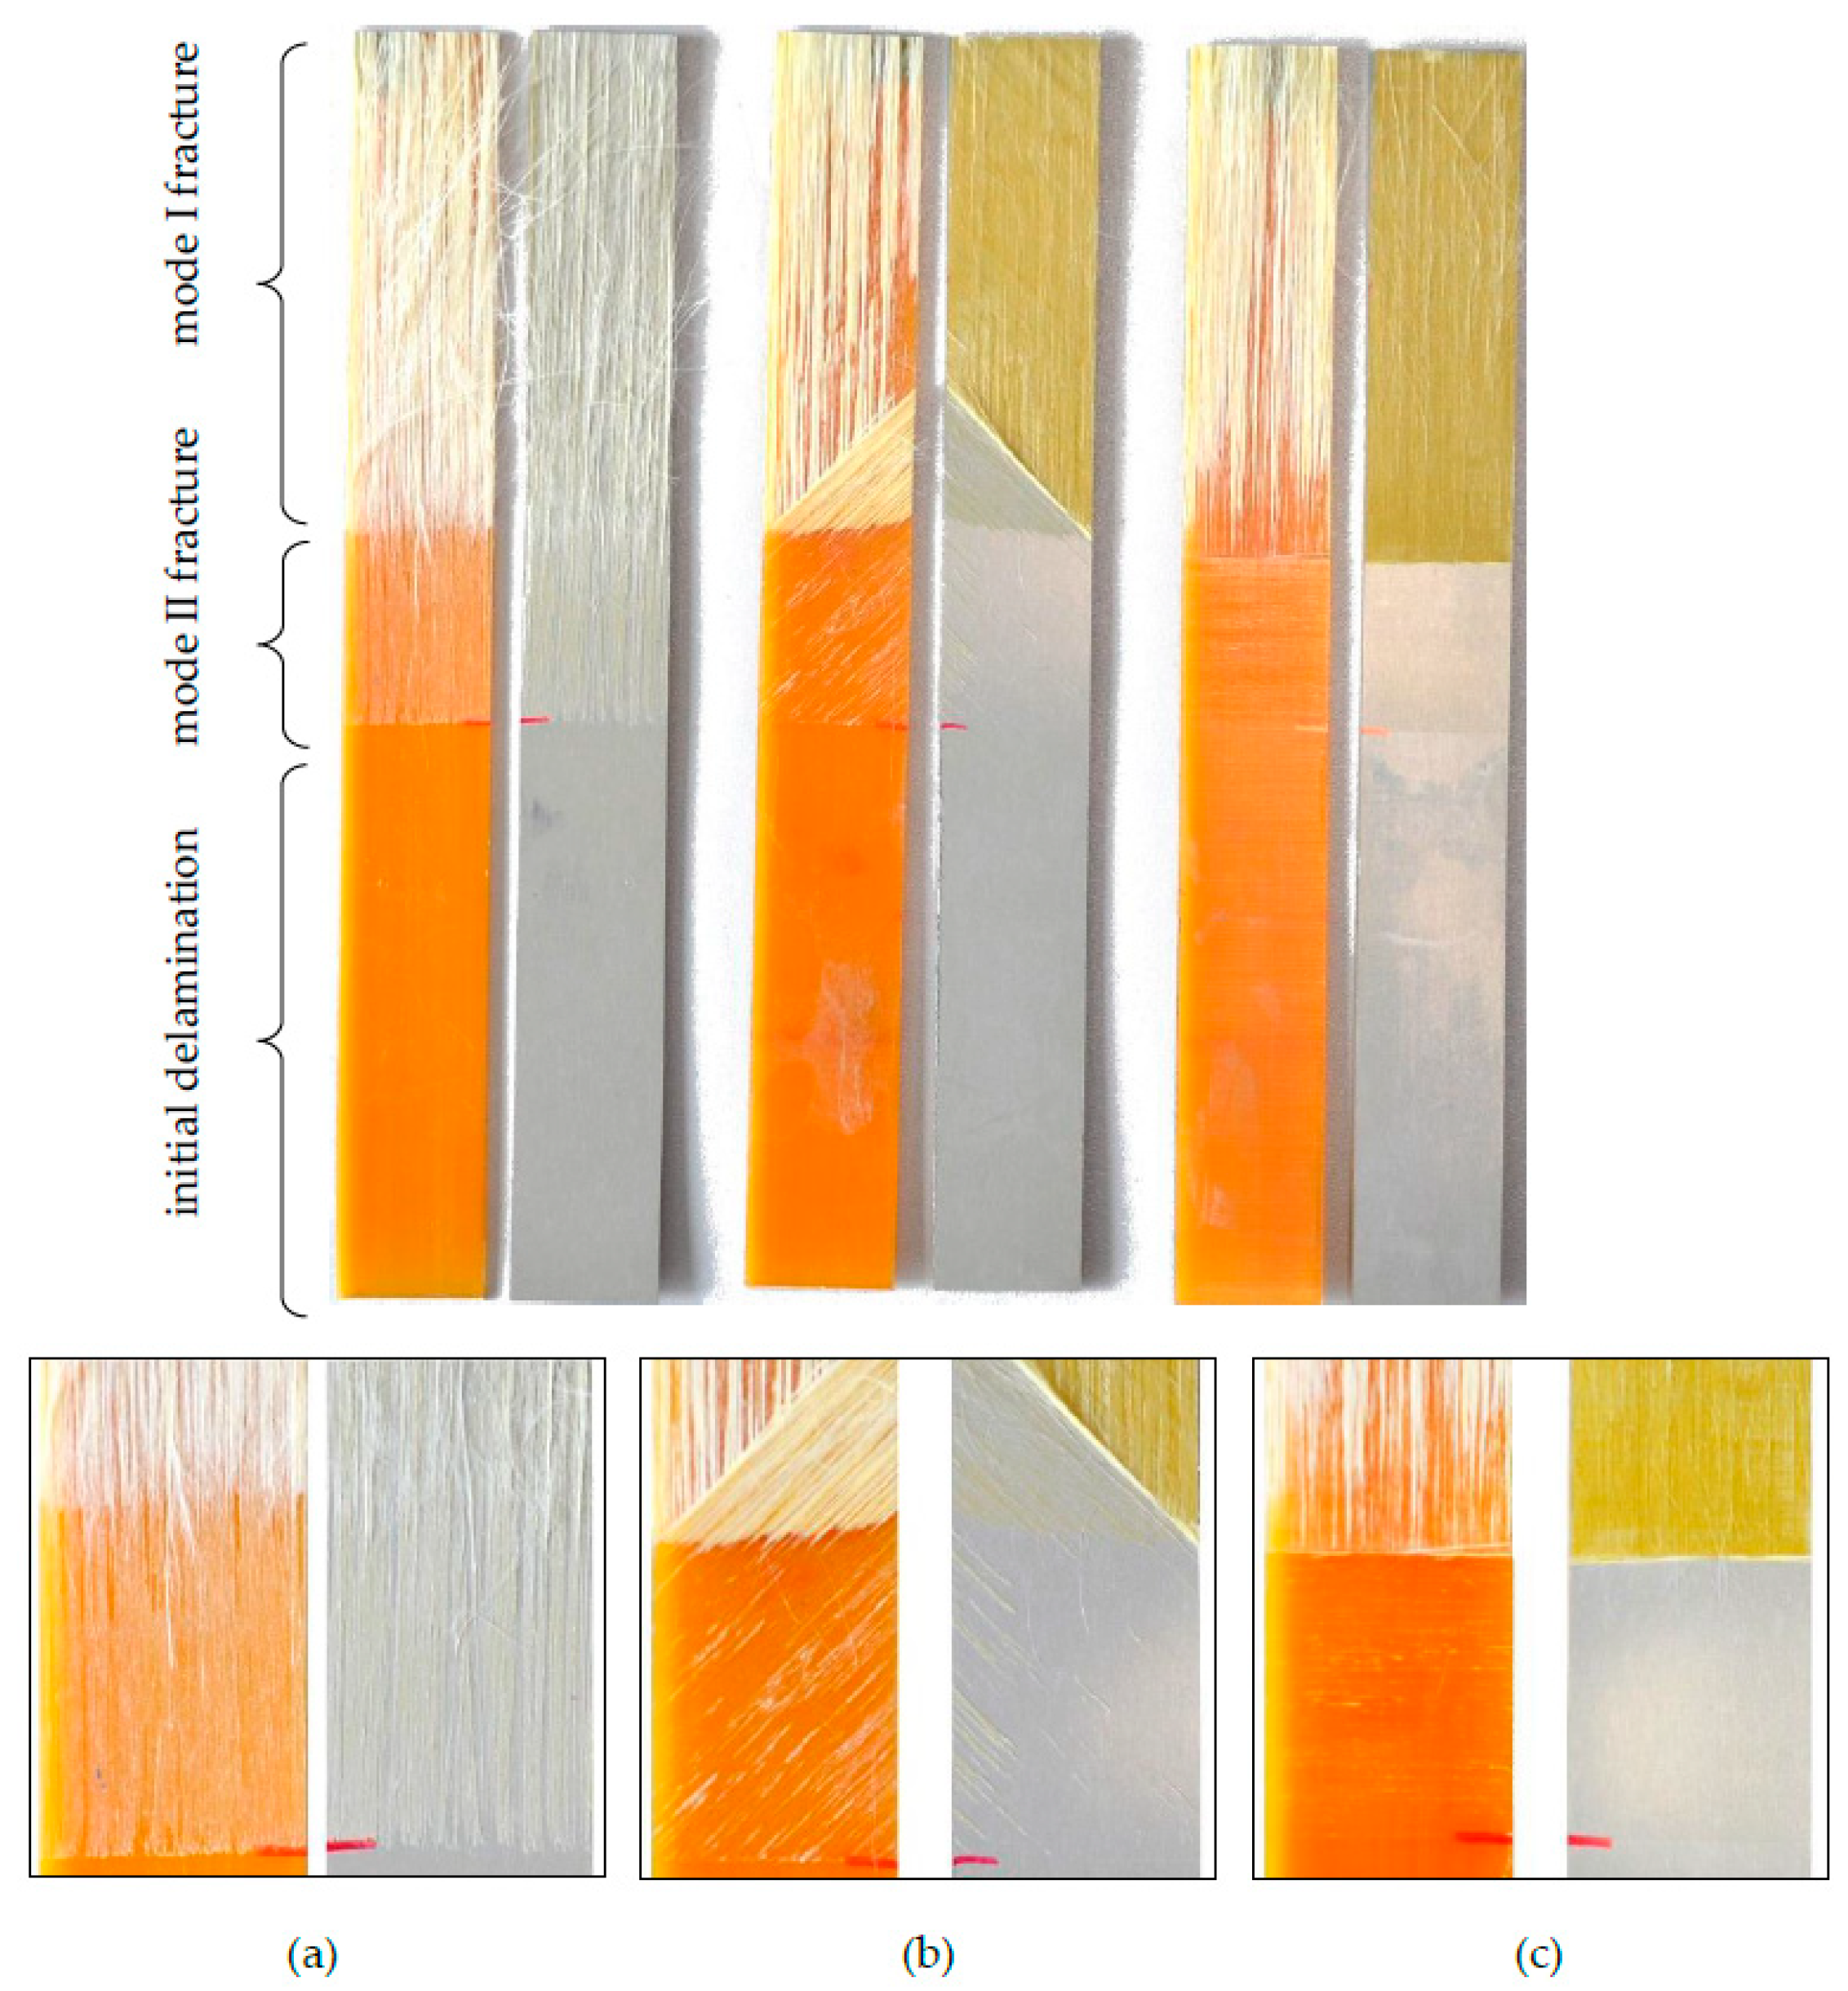
The fracture surface of tested laminates is presented in Figure 6. Usually, the crack extension forced by mode II dominant in AENF tests reaches the central point of the specimen and then stops. To perform macroscopic fractographic observations, the specimens were opened in dominant fracture mode I. As shown in Figure 6, the crack growth direction is strongly dependent on the fracture mode at the crack-tip. During the AENF tests, the crack propagates in the initial delamination plane on the metal/composite interface (in shearing mode), while in opening mode it tends to jump into a 0°/90° composite/composite interface. Moreover, the development of surface after fracture is strongly dependent on the fracture mode at the crack-tip, and as can be observed, the bridging fibers mechanism is negligible in the case of mode II fracture and significant in mode I domination fracture.
4.2. Analytical Calculations
4.2.1. Specimen Compliance
Table 5 shows the values of compliance calculated based on the rigid and elastic interface models described in Section 3.2. The values of the tangential and normal interface springs constants were determined through a nonlinear least squares fitting with the experimental values of compliance reported in Table 3.
4.2.2. Critical Energy Release Rate
The critical energy release rate corresponding to the maximum test loads was also calculated by using the theoretical model illustrated previously in Section 3. Such models enable not only evaluation of the total energy release rate, but also its mode I and II contribution. The results of analytical calculations for the tested specimens are summarized in Table 6 for the rigid interface model and in Table 7 for the elastic interface model. According to both models, delamination growth is expected to occur under I/II mixed-mode conditions, with a largely dominant mode II contribution.
5. Discussion
5.1. Experimental Tests
It can be observed in Figure 5 that the tested specimens featured different stiffnesses because of their slightly different thicknesses. The lowest stiffness was recorded for the Al // 0° specimens, which had minimal thickness. However, even in this case, the specimens with the Al // 0° interface were characterized by the highest values of failure load. Simultaneously, the Al // 0° interface stood out also by the highest value of critical energy release rate; instead, the lowest value was obtained for the Al // 90° interface, while the Al // 45° interface featured an intermediate value of fracture toughness. In connection with the above, the value of critical energy release rate in FMLs seems to be fiber-orientation dependent, similarly as for classical composite materials [28,29,30,31,32].
The macroscopic observations of the fracture surfaces were in line with the experimentally determined values of critical energy release rate. The fracture surface in the Al // 0° interface was the most developed with many glass fibers remaining and bonding to the aluminum alloy surface. The minimally developed surface was observed for the Al // 90° interface. An intermediate behavior was observed for the Al // 45° surface. In experimental tests with dominant shearing fracture mode, Andersons and König [28] observed that an increase in the off-axis angle in the interface plies caused an increase also in the portion of energy dissipated by the fracture of resin.
A similar research was performed previously by Bieniaś et al. [21] as well as by Bieniaś and Dadej [22], where slightly different values of critical energy release rate were obtained for the same type of material (2.3 N/mm and 1.388 N/mm, respectively). However, it should be noted that the geometry of the laminates was also different, which may lead to the conclusion that the interfacial fracture toughness of the metal/composite adhesive joints is strongly curing-stress dependent, as also postulated by Tsokonas and Loutas [17] and Tsokanas et al. [32]. The value of the coefficient of thermal expansion (CTE) of the used aluminum alloy is an order of magnitude higher than the CTE of GFRP. In this regard, it can be observed that the different values of critical energy release rate were obtained for the same type of interfaces, but with different thickness and lay-ups of the specimens. As a consequence, different values were present of laminate curing strain and resulting curing stresses in the laminate, leading to the generation of shearing stresses between the metal and composite layers in the vicinity of the crack-tip.
5.2. Analytical Modeling
Table 8 compares the values of specimen compliance obtained through the experimental tests described in Section 4.1.1 and the predictions of the analytical models illustrated in Section 4.2.1.
It can be observed that the rigid interface model generally underestimates the experimental measurements. Better agreement is obtained by the more refined elastic interface model. In this respect, it should be noted that the values of the elastic interface constants were estimated by a nonlinear least squares fitting with the experimental values of compliance. A similar calibration procedure was used by Bennati and Valvo for the mixed-mode bending test [33]. Furthermore, it is worth noting that the experimental compliance calibration method is based on the assumption of a cubic-law dependence of the compliance on the delamination crack length. Instead, the analytical solution illustrated in Section 3.2.2 includes additional linear and quadratic terms. Linear terms related to the specimen shear deformability were obtained also in the pioneering study by Bachrach et al. [34] and later considered, amongst others, by de Morais [35] and Pereira et al. [31,36]. Mollón et al. compared the standard CC method and an interpolation of experimental results based on complete cubic polynomial [37]. The latter method was found to be more accurate, and thus indirectly confirming the validity of the present modeling approach.
Table 9 compares the values of critical energy release rate obtained through the experimental tests described in Section 4.1.2 and the predictions of the analytical models of Section 4.2.2.
It can be observed that the experimental method overestimates the interlaminar fracture toughness with respect to both theoretical models. The latter furnish similar results for the critical energy release rate, despite the differences in the predictions of compliance. It would be interesting to investigate whether fitting the experimental compliance results with a complete cubic polynomial, and then using the Irwin-Kies relationship to obtain the critical energy release rate, would be more in line with the predictions of the elastic interface model.
6. Conclusions
The results of an experimental campaign on the interlaminar fracture toughness of multidirectional fiber metal laminates were presented. Asymmetric end-notched flexure tests were carried out on specimens with glass-fiber/aluminum delamination interfaces with different values of the fiber orientation angle at the interface ply. The tests were also modeled by using two different analytical solutions: the simpler rigid interface model and the more refined elastic interface model. Previously unavailable analytical expressions were given for the AENF test specimen compliance and mixed-mode energy release rate.
The elastic interface model almost perfectly matched the specimen compliance determined from the experiments, while the rigid interface model slightly underestimated the experimental results. However, for the relatively thin tested laminates, both the elastic and rigid interface models yielded very similar results. Moreover, it should be noted that the ASTM standard CC method [26] was applied here, albeit strictly recommended only for symmetric unidirectional laminated specimens. The CC method is based on a two-term cubic polynomial expression for the specimen compliance. Instead, from the elastic interface model of the AENF test, the specimen compliance turns out to be a complete cubic polynomial in the delamination length, including also linear and quadratic terms. Actually, Mollón et al. [37] obtained better agreement with experimental results on unidirectional carbon/epoxy AENF test specimens by using the full polynomial expression. Future investigations on FML laminates will be carried out by authors to understand if a better fitting with experimental data can be obtained based on a richer polynomial representation of compliance.
In regards to the critical energy release rate, the evaluation based on the experimental compliance calibration method furnishes higher values than the theoretical models. Again, it should be noted that the discrepancies may be ascribed to the poor polynomial representation of compliance of the standard CC method, dedicated for simple unidirectional and symmetrical laminates. Future research, e.g., through finite element simulations, will be useful to understand if the theoretical predictions should be considered more reliable.
Both the rigid and elastic interface models predict I/II mixed-mode fracture conditions with prevailing mode II contribution. Therefore, in any case, the values of interlaminar fracture toughness measured in AENF tests should not be considered as pure mode II values, as assumed by many studies especially in the early literature.
Author Contributions
Conceptualization, K.D., J.B., and P.S.V.; methodology, K.D., J.B., and P.S.V.; software, K.D. and P.S.V.; validation, K.D., J.B., and P.S.V.; formal analysis, P.S.V.; investigation, K.D.; resources, J.B.; data curation, K.D. and J.B.; writing—original draft preparation, K.D. and P.S.V.; writing—review and editing, J.B.; visualization, K.D.; supervision, J.B. and P.S.V.; project administration, J.B. and K.D.; funding acquisition, K.D. and J.B. All authors have read and agreed to the published version of the manuscript.
Funding
The project/research was financed in the framework of the project Lublin University of Technology-Regional Excellence Initiative, funded by the Polish Ministry of Science and Higher Education (contract no. 030/RID/2018/19).
Conflicts of Interest
The authors declare no conflict of interest.
Appendix A. Elastic Interface Model Solution
Appendix A.1. Internal Forces
According to the elastic interface model [18], in the unbalanced case (), the axial force, shear force, and bending moment, respectively, have the following expressions in the upper sublaminate:
and in the lower sublaminate:
with
and
Appendix A.2. Crack-Tip Relative Displacements
The relative rotation and deflection between the upper and lower sublaminates at the crack-tip cross section respectively turn out to be
References
- Vlot, A.; Gunnink, J.W. (Eds.) Fiber Metal Laminates—An Introduction; Kluwer Academic Publishers: Dordrecht, The Netherlands, 2001. [Google Scholar]
- Botelho, E.C.; Silva, R.A.; Pardini, L.C.; Rezende, M.C. A review on the development and properties of continuous fiber/epoxy/aluminum hybrid composites for aircraft structures. Mater. Res. 2006, 9, 247–256. [Google Scholar] [CrossRef]
- Sinmazçelik, T.; Avcu, E.; Bora, M.Ö.; Çoban, O. A review: Fibre metal laminates, background, bonding types and applied test methods. Mater. Des. 2011, 32, 3671–3685. [Google Scholar] [CrossRef]
- Jakubczak, P. The impact behaviour of hybrid titanium glass laminates—Experimental and numerical approach. Int. J. Mech. Sci. 2019, 159, 58–73. [Google Scholar] [CrossRef]
- Kubiak, T.; Mania, R.J. Hybrid versus FR laminate channel section columns—Buckling and postbuckling behaviour. Compos. Struct. 2016, 154, 142–149. [Google Scholar] [CrossRef]
- Chandrasekar, M.; Ishak, M.R.; Jawaid, M.; Leman, Z.; Sapuan, S.M. An experimental review on the mechanical properties and hygrothermal behaviour of fibre metal laminates. J. Reinf. Plast. Compos. 2017, 36, 72–82. [Google Scholar] [CrossRef]
- Majerski, K.; Surowska, B.; Bieniaś, J. The comparison of effects of hygrothermal conditioning on mechanical properties of fibre metal laminates and fibre reinforced polymers. Compos. Part B Eng. 2018, 142, 108–116. [Google Scholar] [CrossRef]
- Alderliesten, R.C. Designing for damage tolerance in aerospace: A hybrid material technology. Mater. Des. 2015, 66, 421–428. [Google Scholar] [CrossRef]
- Alderliesten, R. Fatigue and Fracture of Fibre Metal Laminates; Springer: Cham, Switzerland, 2017. [Google Scholar]
- Senthil, K.; Arockiarajan, A.; Palaninathan, R.; Santhosh, B.; Usha, K.M. Defects in composite structures: Its effects and prediction methods—A comprehensive review. Compos. Struct. 2013, 106, 139–149. [Google Scholar] [CrossRef]
- Jones, R.M. Mechanics of Composite Materials, 2nd ed.; Taylor & Francis: Philadelphia, PA, USA, 1999. [Google Scholar]
- Suo, Z.; Hutchinson, J.W. Interface crack between two elastic layers. Int. J. Fract. 1990, 43, 1–18. [Google Scholar] [CrossRef]
- Schapery, R.A.; Davidson, B.D. Prediction of energy release rate for mixed-mode delamination using classical plate theory. Appl. Mech. Rev. 1990, 43, S281–S287. [Google Scholar] [CrossRef]
- Xie, J.; Waas, A.; Rassaian, M. Closed-form solutions for cohesive zone modeling of delamination toughness tests. Int. J. Solids Struct. 2016, 88–89, 379–400. [Google Scholar] [CrossRef]
- Dimitri, R.; Tornabene, F.; Zavarise, G. Analytical and numerical modeling of the mixed-mode delamination process for composite moment-loaded double cantilever beams. Compos. Struct. 2018, 187, 535–553. [Google Scholar] [CrossRef]
- Valvo, P.S. On the calculation of energy release rate and mode mixity in delaminated laminated beams. Eng. Fract. Mech. 2016, 165, 114–139. [Google Scholar] [CrossRef]
- Tsokanas, P.; Loutas, T. Hygrothermal effect on the strain energy release rates and mode mixity of asymmetric delaminations in generally layered beams. Eng. Fract. Mech. 2019, 214, 390–409. [Google Scholar] [CrossRef]
- Bennati, S.; Fisicaro, P.; Taglialegne, L.; Valvo, P.S. An elastic-interface model for the delamination of bending-extension coupled laminates. Appl. Sci. 2019, 9, 3560. [Google Scholar] [CrossRef] [Green Version]
- Cortés, P.; Cantwell, W.J. The fracture properties of a fibre-metal laminate based on magnesium alloy. Compos. Part B Eng. 2005, 37, 163–170. [Google Scholar] [CrossRef]
- Abdullah, M.R.; Prawoto, Y.; Cantwell, W.J. Interfacial fracture of the fibre-metal laminates based on fibre reinforced thermoplastics. Mater. Des. 2015, 66, 446–452. [Google Scholar] [CrossRef]
- Bieniaś, J.; Dadej, K.; Surowska, B. Interlaminar fracture toughness of glass and carbon reinforced multidirectional fiber metal laminates. Eng. Fract. Mech. 2017, 175, 127–145. [Google Scholar] [CrossRef]
- Bieniaś, J.; Dadej, K. Fatigue delamination growth of carbon and glass reinforced fiber metal laminates in fracture mode II. Int. J. Fatigue 2020, 130, 105267. [Google Scholar] [CrossRef]
- Blackman, B.R.K.; Brunner, A.J.; Williams, J.G. Mode II fracture testing of composites: A new look at an old proble. Eng. Fract. Mech. 2006, 73, 2443–2455. [Google Scholar] [CrossRef]
- Sundararaman, V.; Davidson, B. An unsymmetric end-notched flexure test for interfacial fracture toughness determination. Eng. Fract. Mech. 1998, 60, 361–377. [Google Scholar] [CrossRef]
- Yang, Z.; Sun, C.T. Interlaminar Fracture Toughness of a Graphite/Epoxy Multidirectional Composite. J. Eng. Mater. Technol. 2000, 122, 428–433. [Google Scholar] [CrossRef]
- Standard Test Method for Determination of the Mode II Interlaminar Fracture Toughness of Unidirectional Fiber-Reinforced Polymer Matrix Composites; ASTM D7905/D7905M-19; ASTM International: West Conshohocken, PA, USA, 2019.
- Irwin, G.R.; Kies, J.A. Critical energy release rate analysis of fracture strength. Weld. J. Res. Suppl. 1954, 33, 193–198. [Google Scholar]
- Andersons, J.; König, M. Dependence of fracture toughness of composite laminates on interface ply orientations and delamination growth direction. Compos. Sci. Technol. 2004, 64, 2139–2152. [Google Scholar] [CrossRef]
- Hwang, J.H.; Lee, C.S.; Hwang, W. Effect of crack propagation directions on the interlaminar fracture toughness of carbon/epoxy composite materials. Appl. Compos. Mater. 2001, 8, 411–433. [Google Scholar] [CrossRef]
- Samborski, S. Analysis of the end-notched flexure test configuration applicability for mechanically coupled fiber reinforced composite laminates. Compos. Struct. 2017, 163, 342–349. [Google Scholar] [CrossRef]
- Pereira, A.B.; de Morais, A.B.; Marques, A.T.; de Castro, P.T. Mode II interlaminar fracture of carbon/epoxy multidirectional laminates. Compos. Sci. Technol. 2004, 64, 1653–1659. [Google Scholar] [CrossRef]
- Tsokanas, P.; Loutas, T.; Kostopoulos, V.; Essa, Y.; de la Escalera, M.F. On the design and analysis of interlaminar fracture toughness tests on dissimilar metal-composite adhesive joints with residual thermal stresses. In Proceedings of the ECCM18—18th European Conference on Composite Materials, Athens, Greece, 24–28 June 2018. [Google Scholar]
- Bennati, S.; Valvo, P.S. An experimental compliance calibration strategy for mixed-mode bending tests. Proc. Mater. Sci. 2014, 3, 1988–1993. [Google Scholar] [CrossRef]
- Bachrach, W.E.; Hicks, T.R.; Habas, Z.S.; Granata, D.M. Mixed experimental-structural model for interlaminar shear fracture toughness. J. Aerosp. Eng. 1991, 4, 108–125. [Google Scholar] [CrossRef]
- de Morais, A.B. Analysis of mode II interlaminar fracture of multidirectional laminates. Compos. Part A Appl. Sci. Manuf. 2004, 35, 51–57. [Google Scholar] [CrossRef]
- Pereira, A.B.; de Morais, A.B. Mode II interlaminar fracture of glass/epoxy multidirectional laminates. Compos. Part A Appl. Sci. Manuf. 2004, 35, 265–272. [Google Scholar] [CrossRef]
- Mollón, V.; Bonhomme, J.; Argüelles, A.; Viña, J. Influence of the crack plane asymmetry over GII results in carbon epoxy ENF specimens. Compos. Struct. 2012, 94, 1187–1191. [Google Scholar] [CrossRef]
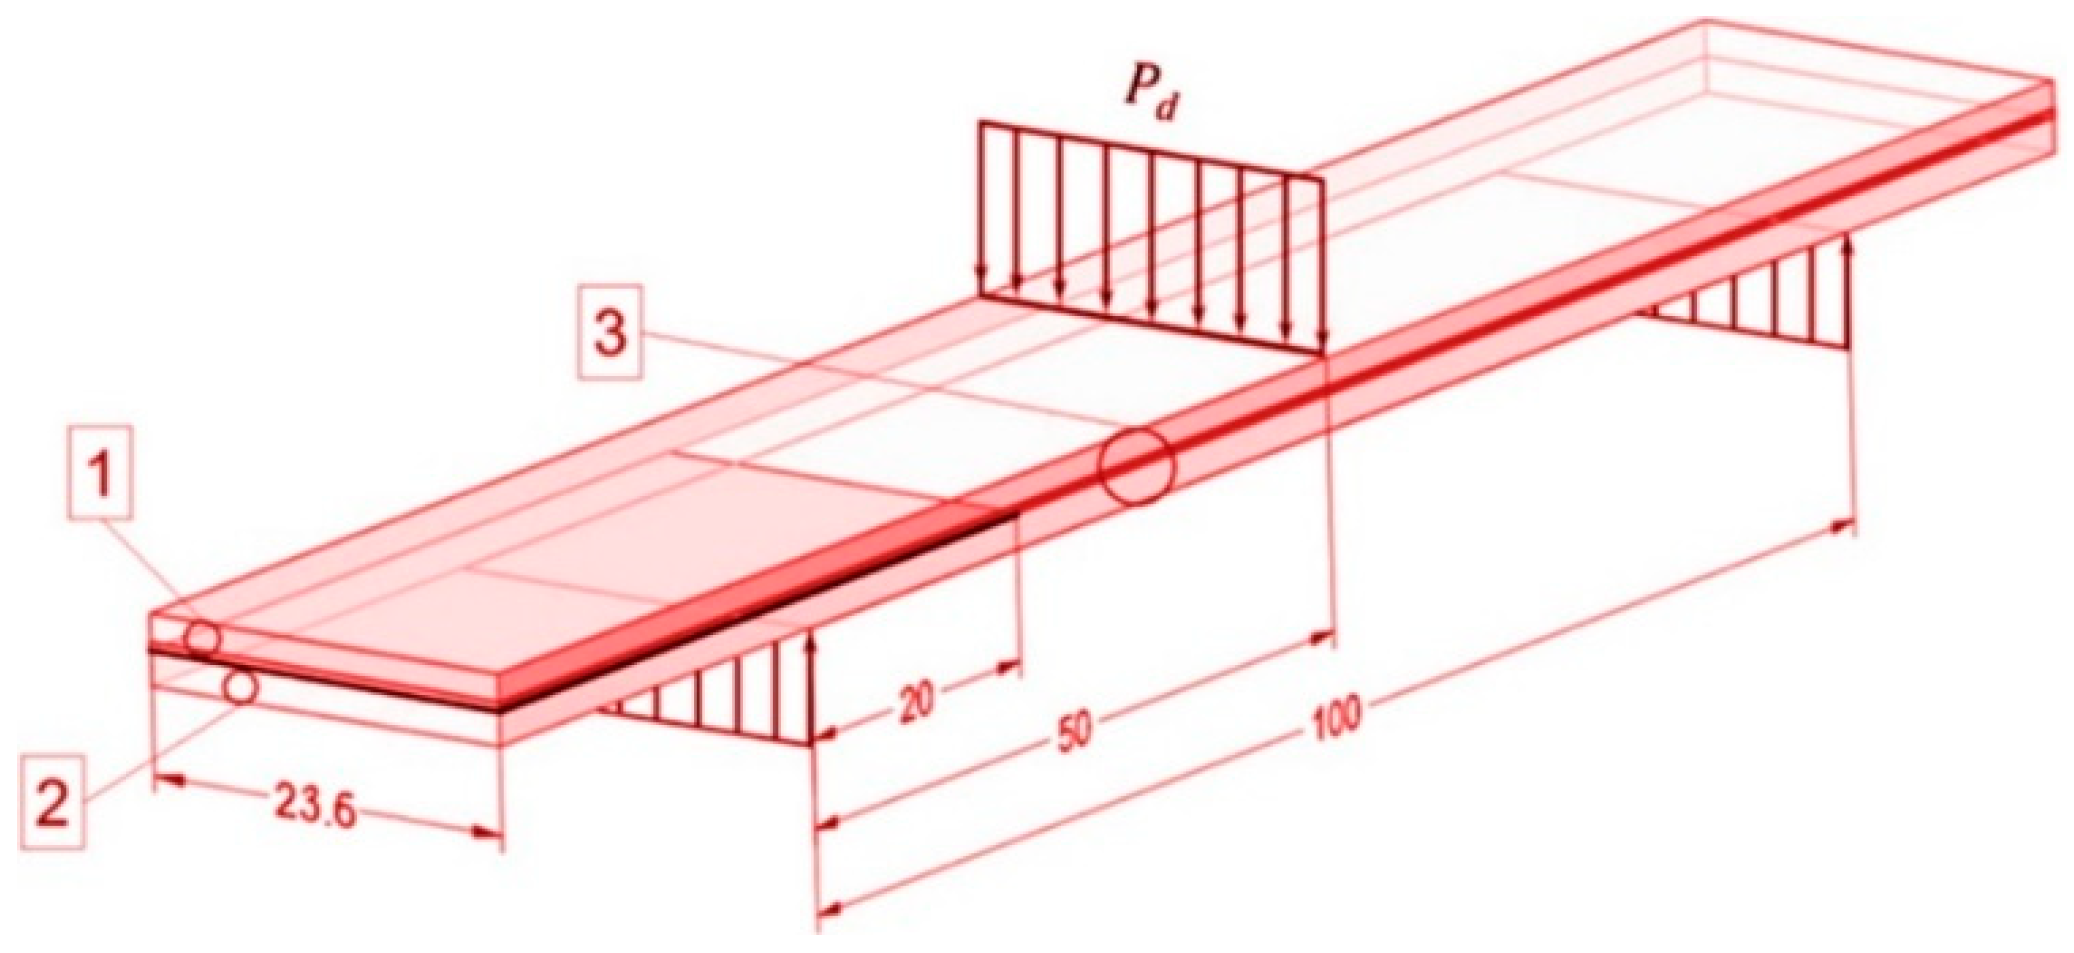
Figure 1.
Schematic of asymmetric end-notched flexure test on fiber metal laminates (FML) specimen: 1—upper sublaminate; 2—lower sublaminate; 3—overall laminate (length units: mm).
Figure 1.
Schematic of asymmetric end-notched flexure test on fiber metal laminates (FML) specimen: 1—upper sublaminate; 2—lower sublaminate; 3—overall laminate (length units: mm).

Figure 2.
Theoretical modeling of asymmetric end-notched flexure (AENF) test: (a) specimen; (b) elementary crack-tip segment according to the rigid interface model (c) crack-tip element according to the elastic interface model
Figure 2.
Theoretical modeling of asymmetric end-notched flexure (AENF) test: (a) specimen; (b) elementary crack-tip segment according to the rigid interface model (c) crack-tip element according to the elastic interface model

Figure 3.
Load vs. deflection curves for compliance calibration (CC) tests on AENF specimens: (a) Al // 0° interface; (b) Al // 45° interface; (c) Al // 90° interface.
Figure 3.
Load vs. deflection curves for compliance calibration (CC) tests on AENF specimens: (a) Al // 0° interface; (b) Al // 45° interface; (c) Al // 90° interface.

Figure 4.
Compliance calibration characteristics for tested AENF specimens.

Figure 5.
Load vs. deflection curves for interlaminar fracture toughness tests on AENF specimens.

Figure 6.
Fracture surfaces of tested AENF specimens: (a) Al // 0° interface; (b) Al // 45° interface; (c) Al // 90° interface.
Figure 6.
Fracture surfaces of tested AENF specimens: (a) Al // 0° interface; (b) Al // 45° interface; (c) Al // 90° interface.


Table 1.
Lay-ups of tested aluminum/composite specimens.
| Delamination Interface | Sublaminate No. α | Layer Material | Layer Thickness ti (mm) | Sublaminate Thickness Hα (mm) | Specimen Thickness H (mm) |
|---|---|---|---|---|---|
| Al // 0° | 1 | GFRP 0° | 1.790 | 2.090 | 3.87 |
| Aluminum | 0.300 | ||||
| Delamination | |||||
| 2 | GFRP 0° | 1.780 | 1.780 | ||
| Al // 45° | 1 | GFRP 0° | 1.780 | 2.080 | 4.20 |
| Aluminum | 0.300 | ||||
| Delamination | |||||
| 2 | GFRP 45° | 0.222 | 2.120 | ||
| GFRP 0° | 1.898 | ||||
| Al // 90° | 1 | GFRP 0° | 1.760 | 2.060 | 4.11 |
| Aluminum | 0.300 | ||||
| Delamination | |||||
| 2 | GFRP 90° | 0.222 | 2.050 | ||
| GFRP 0° | 1.828 | ||||
Table 2.
Elastic moduli of materials in principal material reference.
| Material | E1 (MPa) | E2 (MPa) | ν12 (-) | G12 = G31 (MPa) | G23 (MPa) |
|---|---|---|---|---|---|
| 2024-T3 | 70,041 | 70,041 | 0.33 | 26,331 | 26,331 |
| GFRP | 47,057 | 14,920 | 0.27 | 5233 | 4000 |
Table 3.
Results of compliance calibration experimental tests.
| Delamination Interface | Crack Length a (mm) | Deflection δ (mm) 1 | Compliance C (mm/N) | Range of Forces for Compliance Calculation (N) | Slope Parameter m (N/mm4) |
|---|---|---|---|---|---|
| Al // 0° | 15 | 0.547461 | 0.004211 | 136–296 | 4.323 × 10⁻⁷ |
| 30 | 0.659645 | 0.005074 | 105–214 | ||
| 45 | 1.040556 | 0.008004 | 70–133 | ||
| Al // 45° | 15 | 0.407859 | 0.003137 | 151–334 | 3.985 × 10⁻⁷ |
| 30 | 0.553647 | 0.004259 | 106–233 | ||
| 45 | 0.862485 | 0.006635 | 68–202 | ||
| Al // 90° | 15 | 0.434138 | 0.003340 | 159–297 | 4.608 × 10⁻⁷ |
| 30 | 0.581352 | 0.004472 | 119–244 | ||
| 45 | 0.959861 | 0.007384 | 74–148 |
1—Deflections were evaluated at a load P = 130 N.
Table 4.
Results of critical strain energy release rate determined by CC experimental method.
| Interface | Specimen | Pmax | Gc | Mean Gc | Standard |
|---|---|---|---|---|---|
| (N) | (N/mm) | (N/mm) | Deviation (N/mm) | ||
| Al // 0° | 1 | 766 | 1.4494 | 1.4888 | 0.0390 |
| 2 | 790 | 1.5420 | |||
| 3 | 772 | 1.4750 | |||
| Al // 45° | 1 | 785 | 1.4059 | 1.2127 | 0.1367 |
| 2 | 701 | 1.1192 | |||
| 3 | 699 | 1.1129 | |||
| Al // 90° | 1 | 606 | 0.9681 | 0.8885 | 0.0677 |
| 2 | 552 | 0.8026 | |||
| 3 | 583 | 0.8948 |
Table 5.
Theoretical predictions of specimen compliance.
| Delamination Interface | Crack Length a (mm) | Rigid Interface Compliance C (mm/N) | Elastic Interface Compliance C (mm/N) | Tangential Springs Constant kx (N/mm3) | Normal Springs Constant kz (N/mm3) |
|---|---|---|---|---|---|
| Al // 0° | 15 | 0.004069 | 0.004077 | 1955.6 | 5182.0 |
| 30 | 0.004980 | 0.005036 | |||
| 45 | 0.007450 | 0.008004 | |||
| Al // 45° | 15 | 0.003212 | 0.003217 | 4020.1 | 4990.7 |
| 30 | 0.004067 | 0.004103 | |||
| 45 | 0.006387 | 0.006579 | |||
| Al // 90° | 15 | 0.003428 | 0.003433 | 5023.2 | 5359.8 |
| 30 | 0.004339 | 0.004472 | |||
| 45 | 0.006811 | 0.007015 |
Table 6.
Results of analytical calculations according to the rigid interface model.
| Interface | Specimen | Pmax (N) | Gc (N/mm) | Mean Gc (N/mm) | ψ (°) |
|---|---|---|---|---|---|
| Al // 0° | 1 | 766 | 1.3561 | 1.3920 | 77.7 |
| 2 | 790 | 1.4424 | |||
| 3 | 772 | 1.3774 | |||
| Al // 45° | 1 | 785 | 1.3154 | 1.1358 | 80.0 |
| 2 | 701 | 1.0490 | |||
| 3 | 699 | 1.0430 | |||
| Al // 90° | 1 | 606 | 0.8386 | 0.7702 | 78.2 |
| 2 | 552 | 0.6958 | |||
| 3 | 583 | 0.7761 |
Table 7.
Results of analytical calculations according to the elastic interface model.
| Interface | Specimen | Pmax (N) | Gc (N/mm) | Mean Gc (N/mm) | ψ (°) |
|---|---|---|---|---|---|
| Al // 0° | 1 | 766 | 1.3603 | 1.3963 | 83.3 |
| 2 | 790 | 1.4469 | |||
| 3 | 772 | 1.3817 | |||
| Al // 45° | 1 | 785 | 1.3192 | 1.1391 | 83.6 |
| 2 | 701 | 1.0520 | |||
| 3 | 699 | 1.0460 | |||
| Al // 90° | 1 | 606 | 0.8420 | 0.7733 | 82.2 |
| 2 | 552 | 0.6986 | |||
| 3 | 583 | 0.7793 |
Table 8.
Comparison of experimental and theoretical values of specimen compliance.
| Delamination Interface | Crack Length a (mm) | Experimental Compliance C (mm/N) | Rigid Interface Compliance C (mm/N) | Elastic Interface Compliance C (mm/N) |
|---|---|---|---|---|
| Al // 0° | 15 | 0.004211 | 0.004069 | 0.004077 |
| 30 | 0.005074 | 0.004980 | 0.005036 | |
| 45 | 0.008004 | 0.007450 | 0.008004 | |
| Al // 45° | 15 | 0.003137 | 0.003212 | 0.003217 |
| 30 | 0.004259 | 0.004067 | 0.004103 | |
| 45 | 0.006635 | 0.006387 | 0.006579 | |
| Al // 90° | 15 | 0.003340 | 0.003428 | 0.003433 |
| 30 | 0.004472 | 0.004339 | 0.004472 | |
| 45 | 0.007384 | 0.006811 | 0.007015 |
Table 9.
Comparison of experimental and theoretical values of critical energy release rate.
| Delamination Interface | Experimental Gc (N/mm) | Rigid Interface Gc (N/mm) | Elastic Interface Gc (N/mm) |
|---|---|---|---|
| Al // 0° | 1.4888 | 1.3920 | 1.3963 |
| Al // 45° | 1.2127 | 1.1358 | 1.1391 |
| Al // 90° | 0.8885 | 0.7702 | 0.7733 |
© 2019 by the authors. Licensee MDPI, Basel, Switzerland. This article is an open access article distributed under the terms and conditions of the Creative Commons Attribution (CC BY) license (http://creativecommons.org/licenses/by/4.0/).
Share and Cite
MDPI and ACS Style
Dadej, K.; Bieniaś, J.; Valvo, P.S. Experimental Testing and Analytical Modeling of Asymmetric End-Notched Flexure Tests on Glass-Fiber Metal Laminates. Metals 2020, 10, 56. https://doi.org/10.3390/met10010056
AMA Style
Dadej K, Bieniaś J, Valvo PS. Experimental Testing and Analytical Modeling of Asymmetric End-Notched Flexure Tests on Glass-Fiber Metal Laminates. Metals. 2020; 10(1):56. https://doi.org/10.3390/met10010056
Chicago/Turabian StyleDadej, Konrad, Jarosław Bieniaś, and Paolo Sebastiano Valvo. 2020. "Experimental Testing and Analytical Modeling of Asymmetric End-Notched Flexure Tests on Glass-Fiber Metal Laminates" Metals 10, no. 1: 56. https://doi.org/10.3390/met10010056
Note that from the first issue of 2016, this journal uses article numbers instead of page numbers. See further details here.