Improved Tribocorrosion Resistance by Addition of Sn to CrFeCoNi High Entropy Alloy


1
Department of Materials Engineering, Faculty of Engineering, Rajamangala University of Technology Rattanakosin, 96 Phutthamonthon Sai 5 Rd., Salaya, Phutthamonthon, Nakhon Pathom 73170, Thailand
2
Department of Mechanical Engineering, Faculty of Engineering, Wasit University, Kut 52001, Iraq
3
Department of Materials Science and Engineering, Faculty of Engineering, The University of Sheffield, Sir Robert Hadfield Building, Mappin St, Sheffield S1 3JD, UK
*
Author to whom correspondence should be addressed.
Metals 2021, 11(1), 13; https://doi.org/10.3390/met11010013
Submission received: 9 December 2020
/
Revised: 18 December 2020
/
Accepted: 21 December 2020
/
Published: 24 December 2020
Abstract
:Among the high entropy or complex concentrated alloys (HEAs/CCAs), one type of system is commonly based on CoCrFeNi, which as an equiatomic quaternary alloy that forms a single phase FCC structure. In this work, the effect of Sn in an equiatomic quinary system with CoCrFeNi is shown to lead to a great improvement in hardness and resistance to tribocorrosion. The addition causes a phase transition from a single FCC phase in CoCrFeNi to dual phase in CoCrFeNiSn with an Ni-Sn intermetallic phase, and a CoCrFeNi FCC phase. The presence of both the hard intermetallic and this ductile phase helps to resist crack propagation, and consequent material removal during wear. In addition, the high polarization resistance of the passive film formed at the surface and the high corrosion potential of the Ni-Sn phase contribute to preventing chloride corrosion attack during corrosion testing. This film is tenacious enough for the effect to persist under tribocorrosion conditions.
1. Introduction
Development of the tribocorrosion properties of materials is essential to meet the needs of a number of advanced applications, for example, biodiesel engines, pipe conveyor, and marine energy devices [1,2,3,4,5]. The principal material requirements that apply in such areas are a high potential to resist both corrosion and wear [1,5], as under service materials will be frequently exposed to chemically corrosive fluids (possibly under flow) and the friction load from wear interaction. The action of this combination of conditions can lead to increased damage at the material surfaces compared to either effect alone, and can lead to critical risks to human life and economy [1,5].
Many kinds of alloys may be selected for use in general tribocorrosion conditions, including High-Strength Low-Alloy steels (HSLA), stainless steels, CoCrMo alloys, and Ti alloys [2,6,7,8]. Under seawater conditions (i.e., at high anodic potential), HSLA steels display reduced coefficient of friction owing to the formation of a passive film at the surface, rendering them suitable for low lubrication conditions in offshore applications [6]. Stainless steels with high Cr content are the conventional type of alloy used where corrosion resistance is needed, especially in chloride environments, stemming from the oxide films and high corrosion potential. Tribocorrosion tests on AISI 304 stainless steel in 0.5 M NaCl solution showed good correlation between the coefficient of friction and the total material loss, and the regrowth of the oxide film which takes place indicates it is feasible that such an alloy could also show a lubricating ability [7]. CoCrMo is widely used in, for example, biomaterial applications. In this alloy, there is the formation of a nanocrystalline surface layer, with an average crystal size of 5 nm, which can also act as a lubricating layer on the alloy surface under tribocorrosion; indeed, the alloy shows high tribocorrosion resistance [2]. Ti6Al4V is also of interest for marine infrastructure and aerospace applications. It has a lower rate of wear loss than AISI 316 stainless steel in both artificial seawater and pure water, with the same trend in the friction coefficient as these two alloys [8].
As well as these, new materials are of interest for enhancing the behaviour under tribocorrosion. In recent years, high entropy alloys (HEAs; also known as Complex Concentrated Alloys, CCAs, among other names) have been of extreme interest for the development of material properties, stemming from their capability to form unique phases and microstructures [9,10,11,12], and although not yet present in widespread commercial applications, there is a large amount of ongoing research. Such alloys consist of equiatomic and near-equiatomic ratios of multiple elements which form, in the ideal case, a single solid-solution phase or in other cases multiple phases [9,10,11,12,13,14,15]. As yet, these alloys have seen few reports of their tribocorrosion behaviour. An Al substrate coated with an equiatomic four component HEA, AlCoCrFe, with the coating thickness range of 350–392 μm was shown to have a higher hardness and better tribocorrosion resistance than pure Al, stemming from the formation of a BCC phase and an intermetallic phase in the HEA microstructure, and the consequent hardening effect [16], but other tribocorrosion investigations on HEAs and similar alloys are lacking. Therefore, this work explores the tribocorrosion resistance, corrosion properties, and hardness of a four component equiatomic HEA, CrFeCoNi, and also the same alloy with an addition of Sn to make the five component equiatomic HEA CrFeCoNiSn. Previous investigations on these alloys have shown that the former produces a single phase FCC solid solution structure, and the second produces a two phase structure consisting of an FCC solid solution and an intermetallic phase [17]. Both were also found to have good resistance to corrosion in a static NaCl solution, and to possess good hardness. This indicates that these alloys may be the basis of interesting alternative advanced materials for applications where wear is experienced under exposure to medium chloride conditions, and in this work, their response to tribocorrosion is investigated.
2. Materials and Methods
2.1. Materials
HEA samples were produced from four or five metallic elements at 99.95% purity; Co, Cr and Fe were supplied by Alfa Aesar, Lancashire, UK, while Ni and Sn were obtained from Advent Research Materials, Oxford, UK. Two HEA systems, CrFeCoNi and CrFeCoNiSn, were created at equiatomic ratios: CrFeCoNi (25:25:25:25) and CrFeCoNiSn (20:20:20:20:20). In this paper, these specific compositions are referred to as CrFeCoNi and CrFeCoNiSn.
2.2. Sample Preparation
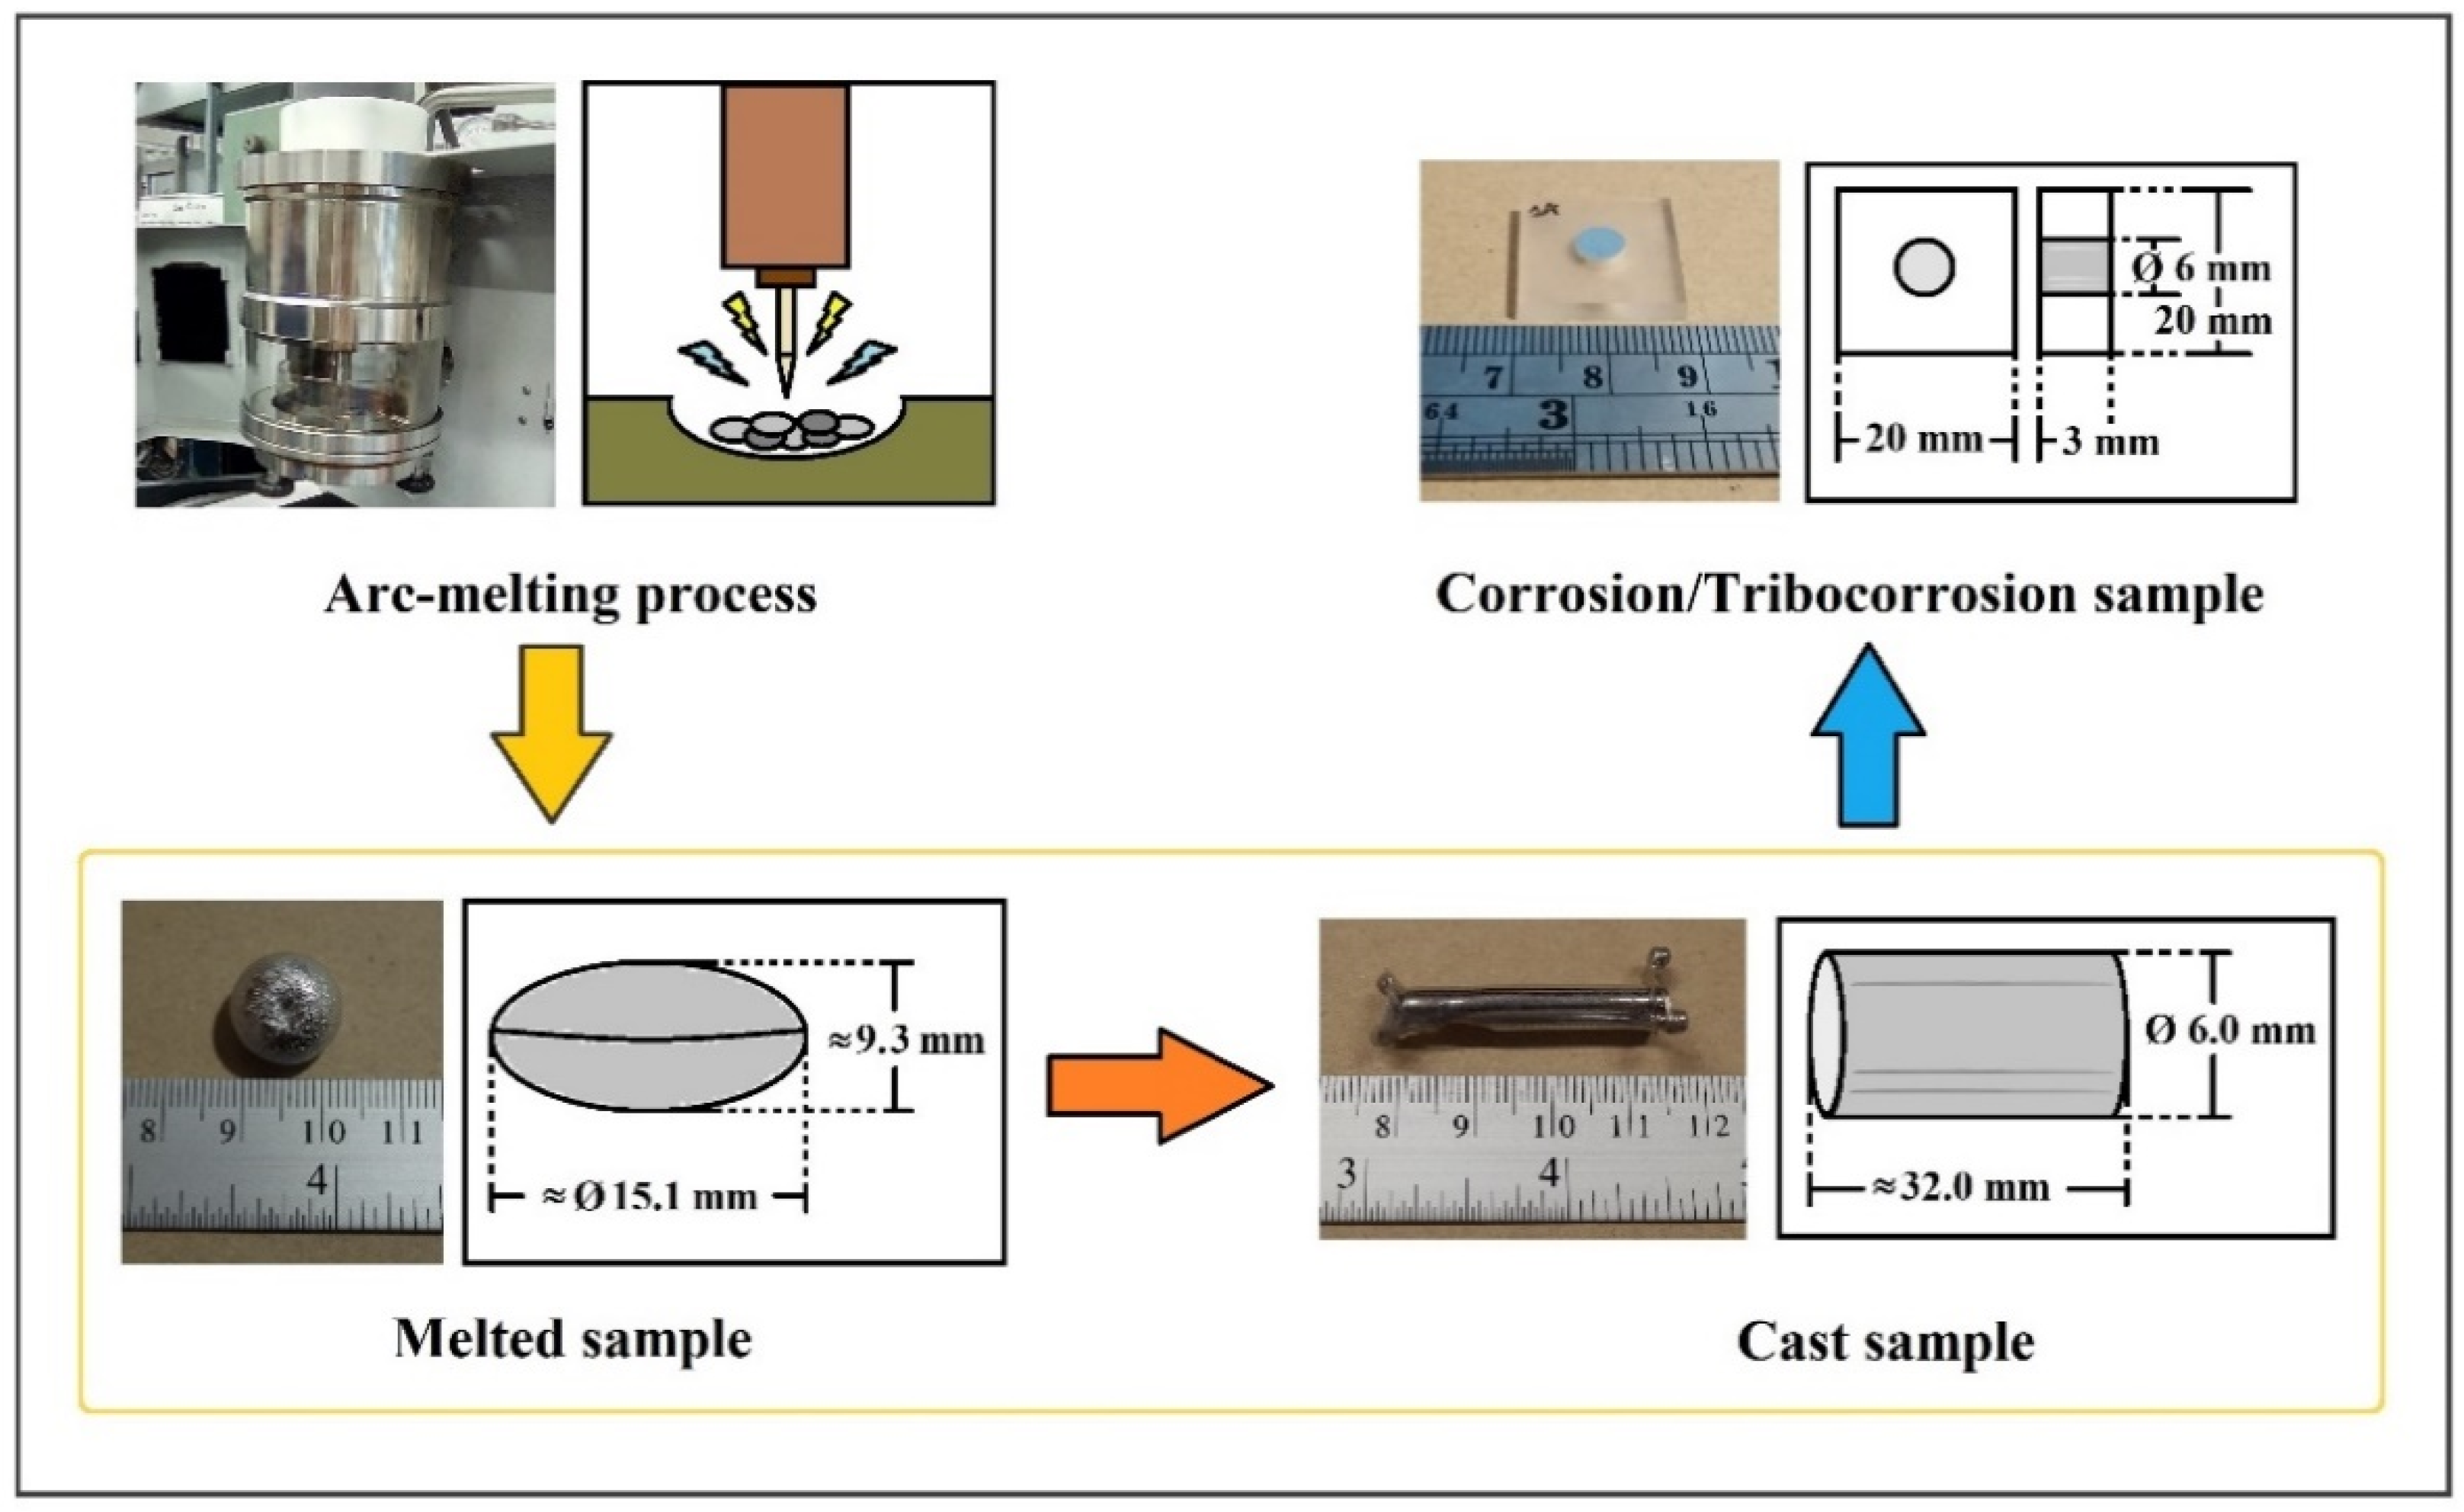
As presented in Figure 1, HEA samples were prepared by using a MAM-1 Compact arc melter (Edmund Buehler, Bodelshausen, Germany) to melt the metallic elements and mix them together. Oxidation was reduced to a minimal level by the use of high purity argon atmosphere and the melting of a pure titanium getter before the alloying process. The weighed out pieces of each alloy were melted, and each sample was re-melted five times to aid homogeneity [18,19]. Suction casting within the arc melter into a copper mould was used to cast cylindrical HEA samples with dimensions of 6 mm (diameter) × 32 mm (height). For tribocorrosion and corrosion testing, samples were mounted in epoxy resin (Struers Ltd., Ballerup, Denmark). Subsequently, the upper and lower sample surfaces were ground with grit papers from P280 to P4000 and finely polished by using 1 µm grain-size diamond suspension.
2.3. Hardness Testing
As-cast samples which passed through a polishing process were hardness tested by using a Struers DuraScan 70 Vickers micro-indentation hardness indenter (em-TEST, Salzburg, Austria). Indents were performed under HV0.5 (500 gf) for 15 s, and each sample was measured with at least 10 indents. Subsequently, the microstructures of both samples before and after hardness testing were analysed by SEM, while the chemical composition was confirmed using an EDS detector (Oxford Instruments, Abingdon, UK). BSE-SEM images of the surface of the initial HEA samples before testing were analysed using ImageJ software over an area of 99 µm × 86 µm.
2.4. Corrosion Testing
HEA samples were analysed for corrosion and tribocorrosion properties in freshly prepared 0.6 M NaCl solution, using a corrosion and tribocorrosion cell in a TriboLab (Bruker, Billerica, MA, USA) which controls the temperature and records the normal force (Fz), friction force (Fx) and the value of coefficient of friction (COF) in tribocorrosion testing, and a VersaSTAT 3F Potentiostat Galvanostat (Princeton Applied Research, Oak Ridge, TA, USA) to control the potential for corrosion testing. The cell uses three electrodes, with a Standard Calomel Electrode, SCE, as the reference electrode (RE) (with potential vs. a Standard Hydrogen Electrode (SHE) of 0.242 V), a platinum wire as a counter electrode (CE), and the sample being tested as the working electrode (WE). The volume of the cell is approximately 100 mL.
Potentiodynamic curves (PC) were measured (repeated twice) from −0.25 (measured vs. the Open Circuit Potential, OCP) to 0.6 V for CrFeCoNi and to 1.3 V vs. RE for CrFeCoNiSn at a scan rate of 0.5 mV/s. Corrosion current density (icorr), corrosion potential (Ecorr) and anodic and cathodic slopes (ba and bc, respectively) were calculated by using CView software. All curves showed good reproducibility. Electrochemical Impedance Spectroscopy (EIS) was employed to investigate the status of the oxide layer and the polarization resistance (Rp) of the sample surfaces. The frequency range was 100 to 15 mHz in perturbation amplitude 10 mV at 10 points per frequency decade. ZView software was used to model the data with an appropriate equivalent circuit.
2.5. Tribocorrosion Testing
Reciprocating sliding wear tests were carried out using a ball on plate configuration, which conformed to ASTM G133. The counterpart was an alumina ball (to have an inert counterface) with 4 mm diameter and 99% purity (Oakwase Ltd., Hartlepool, UK), loaded at 0.5 N. Tribocorrosion tests were carried out at room temperature with 5 Hz sliding speed and 2 mm stroke length, giving 20 mm/s linear sliding speed. The testing time was 3 h, to give in total 108,000 strokes and 216 m sliding distance. Tests further used either −0.9 V cathodic potential or OCP. In both conditions, 30 min was allowed in the solution under the test potential conditions before wear began, a time which was found to be sufficient to allow the OCP to stabilize. All tests were repeated twice and showed high reproducibility. The standard error of mean was used to calculate the error bars.
After testing, the wear volume was determined by using Stylus profilometry (Dektak 150, Veeco, Plainview, NY, USA). A series of cross section profiles along the wear track were taken and the cross section area was measured. The volume of the wear track was then calculated by multiplying the average cross section area by the stroke length. Tribocorrosion parameters were calculated using Equations (1)–(8):
where K [1,20] is the specific wear rate in mm3/N·m; V is the wear volume of material loss in mm3; L is normal load in N and d is the total sliding distance in m; T [21] is the total material loss rate in mm/year; Wc and Cw are the total material loss due to mechanical wear and the total material loss due to corrosion, respectively; W0 is the mechanical wear in absence of corrosion calculated from wear tests at cathodic potential; C0 is the corrosion material loss rate in the absence of wear, which is normally treated as being negligible for passive metals and alloys; ΔWc is the change in wear rate due to corrosion in mm/year, and ΔCw is the change in corrosion rate due to wear in mm/year. Thus, T in tribocorrosion can be expressed as in Equation (5).
where T, W0 [22] is the wear rate in mm/year; SA is the surface area of the wear track; t is the test time; k is a constant (3.27 × 10⁻³) in mm·g/µA.cm.year; iωt is the flowing current from wear track during abrasion in µA/cm2; M is the equivalent weight (22.55 g/mol for CrFeCoNi and 28.68 g/mol for CrFeCoNiSn) which was calculated according to the ASTM G102-89 standard [19], and ρ is the density (8.20 g/cm3 for CrFeCoNi and 8.44 g/cm3 for CrFeCoNiSn) measured using MS104S/01 NewClassic MF density balance equipment (Mettler Toledo, Greifensee, Switzerland). The driving force for this material loss is the galvanic couple that forms between the depassivated surface (wear track) and the still passivated one (the rest of the surface). Espallargas et al. [23] suggested a new experimental setup to calculate this effect using a zero-resistance ammeter (ZRA), though here we used the galvanic coupling model suggested by Vieira et al. [24], and applied to different materials by Papageorgiou and Mischler [25], to calculate iωt as follows:
where Eωt is sliding potential; ac, bc [26] are Tafel constants calculated from the cathodic branch of the potentiodynamic curve (−1.15, 0.28 for CrFeCoNi and −1.43, 0.29 for CrFeCoNiSn, respectively), and Awt and Ap are the surface area of the wear track and the passive surface, respectively. In addition, the general morphology of the wear track was characterised by SEM (FEI, Inspect F50, Eindhoven, The Netherlands).
3. Results and Discussion
3.1. Microstructure and Chemical Composition of As-Cast HEA Samples
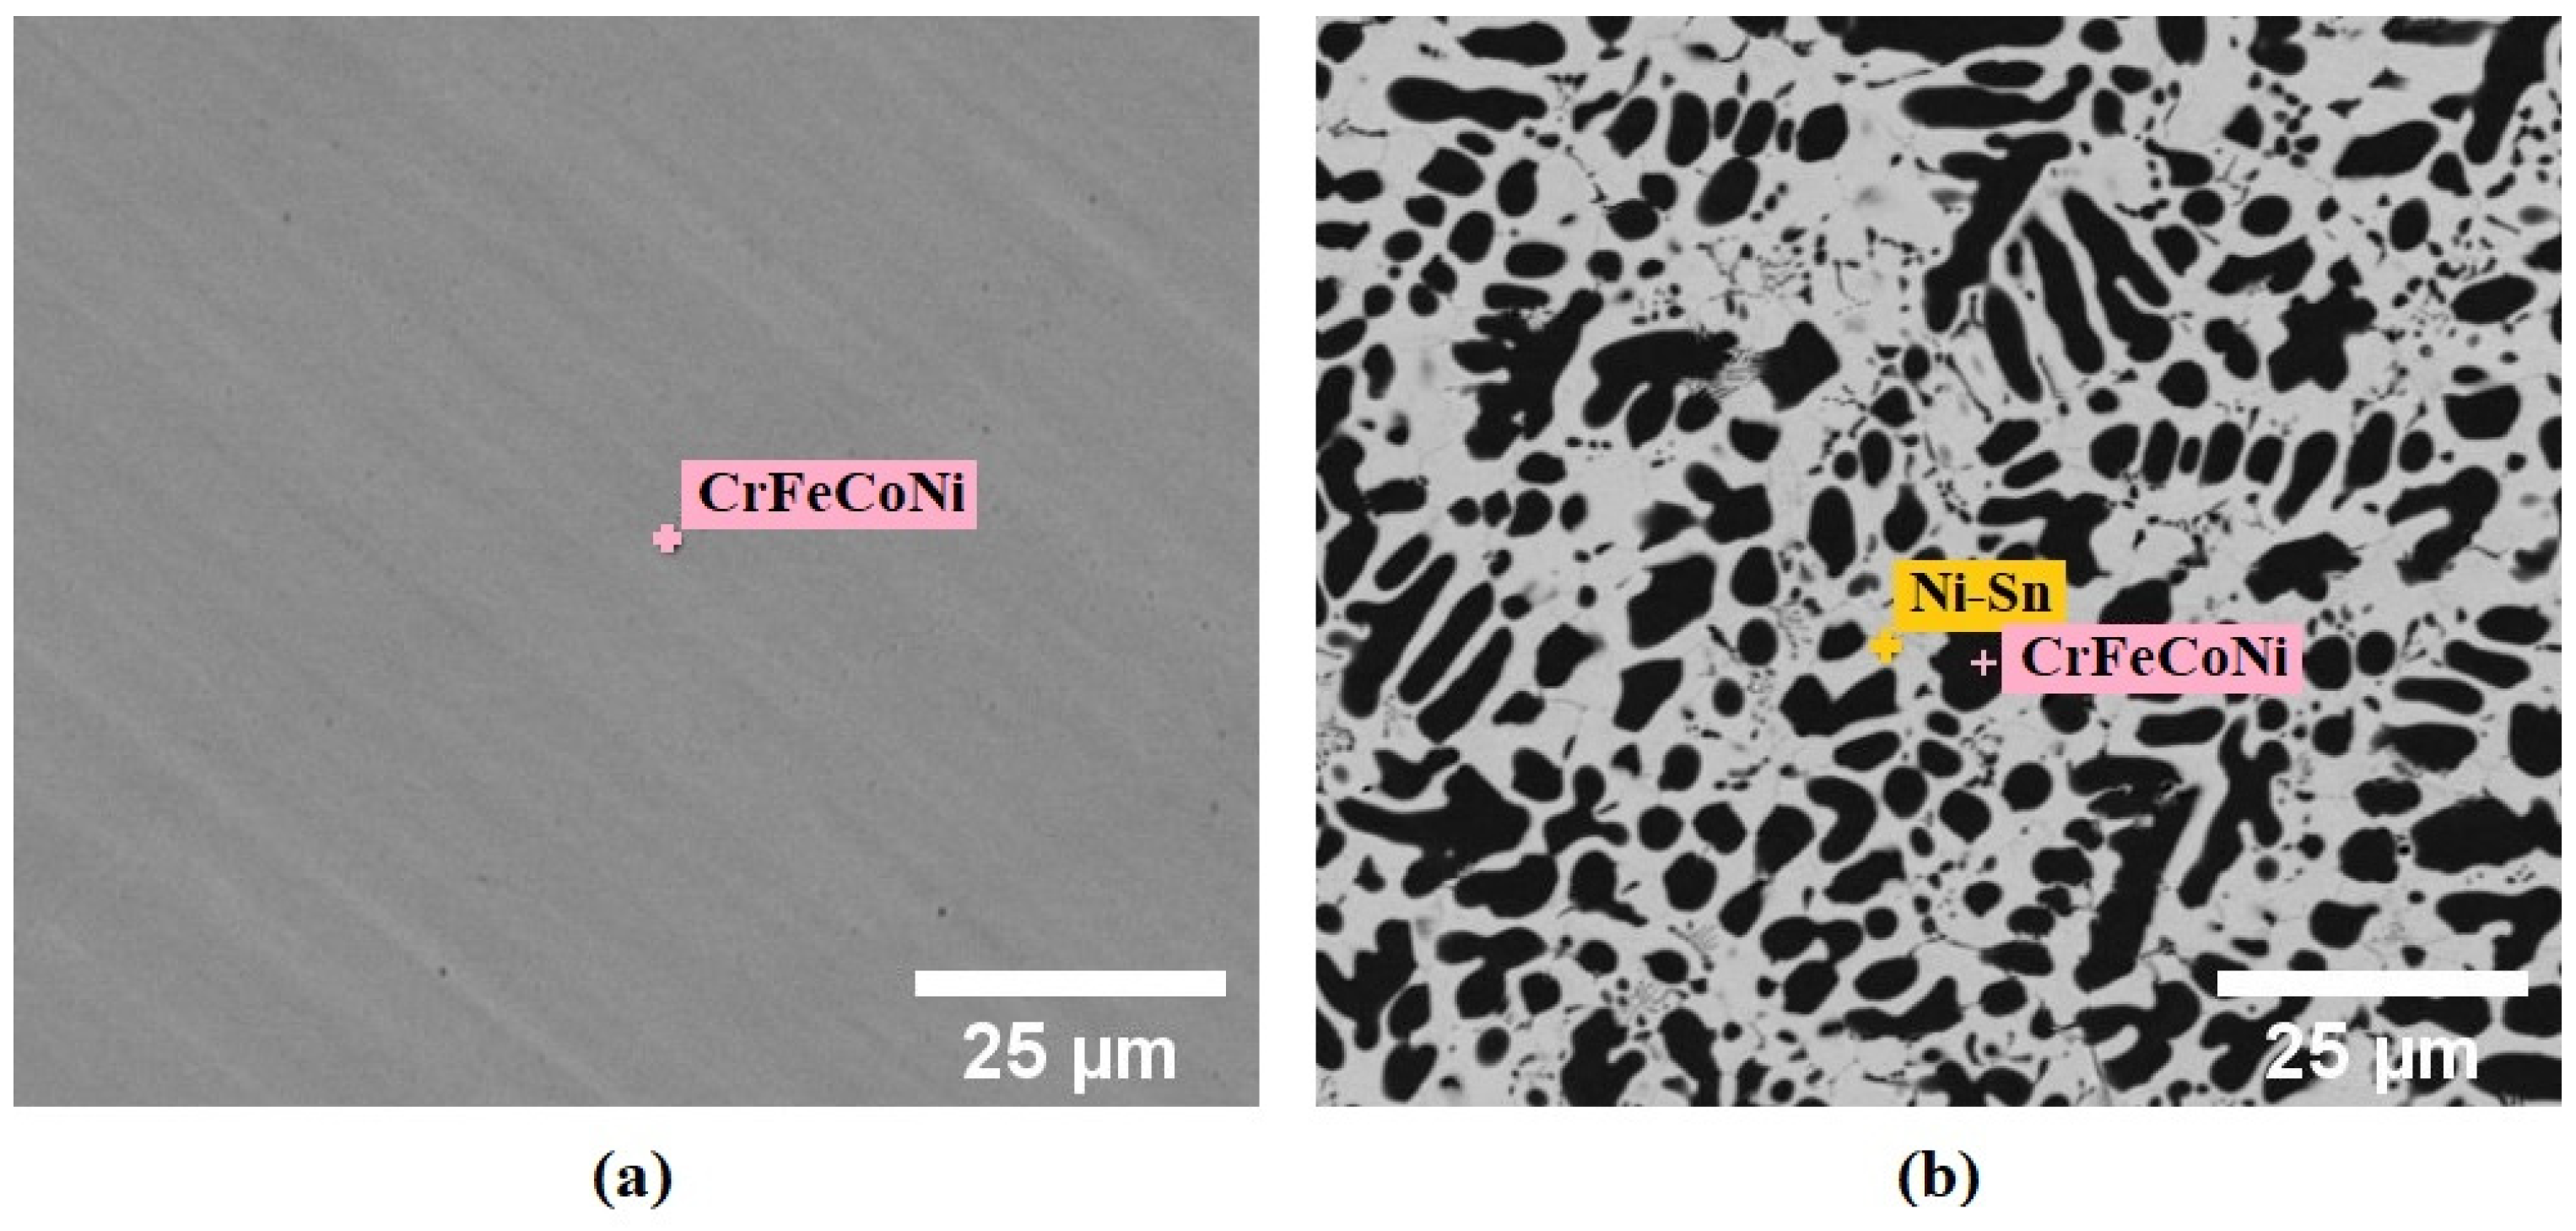
Table 1 shows the composition of distinguishable phases in CrFeCoNi and CrFeCoNiSn, determined by EDS. It reveals that CrFeCoNi contains (within an experimental error of ±1 at.%) the solid solution phase of Co0.25Cr0.25Fe0.25Ni0.25, which is known to adopt the FCC structure [17]. Conversely, CrFeCoNiSn forms a dual phase structure, shown previously by XRD to be CrFeCoNi FCC phase and Ni1.5–1.63Sn hexagonal phase [17]. The BSE micrographs of HEA samples gathered here (Figure 2) correspond with these earlier results. In the unetched condition under BSE imaging, the microstructure of CrFeCoNi presents only one phase and with no grain structure visible, with a relatively uniform distribution of the four elements: Co, Cr, Fe, and Ni, from 24 to 25 at.%. The morphology of CrFeCoNiSn is dual phase; one phase (present in slightly larger quantity, assessed as 56.7 vol%) of Ni-Sn with high Sn (38.26 at.%) and Ni (28.85 at.%), and a dendritic-structured phase of CrFeCoNi (making up 43.3 vol%) with high Fe (30.71 at.%), Co (28.49 at.%), Cr (26.18 at.%), and Ni (11.60 at.%), respectively.
As described in previous research by Muangtong et al. [17], the different phases make up the CrFeCoNiSn alloy stems from Sn, with positive mixing enthalpy values with Cr and Fe and a negative one with Ni, leading to a change from the single phase of CrFeCoNi to the dual phase of CrFeCoNiSn. From the data in Table 2, the negative ΔHmix,<ij> of the Ni-Sn couple leads to the formation of the Ni-Sn intermetallic compound [17,27,28,29]. On the other hand, other potential couples (Co, Cr, and Fe with Sn) have positive ΔHmix,<ij> values and do not interact with the Sn-rich phase. As well as this, the slightly negative ΔHmix,<ij> value of each other atomic couple (those involving Co, Cr, Fe, and Ni), except for the zero ΔHmix,<ij> value of the Co-Ni pair, contributes to generating the CrFeCoNi FCC phase [17,28,29].
3.2. Hardness Development
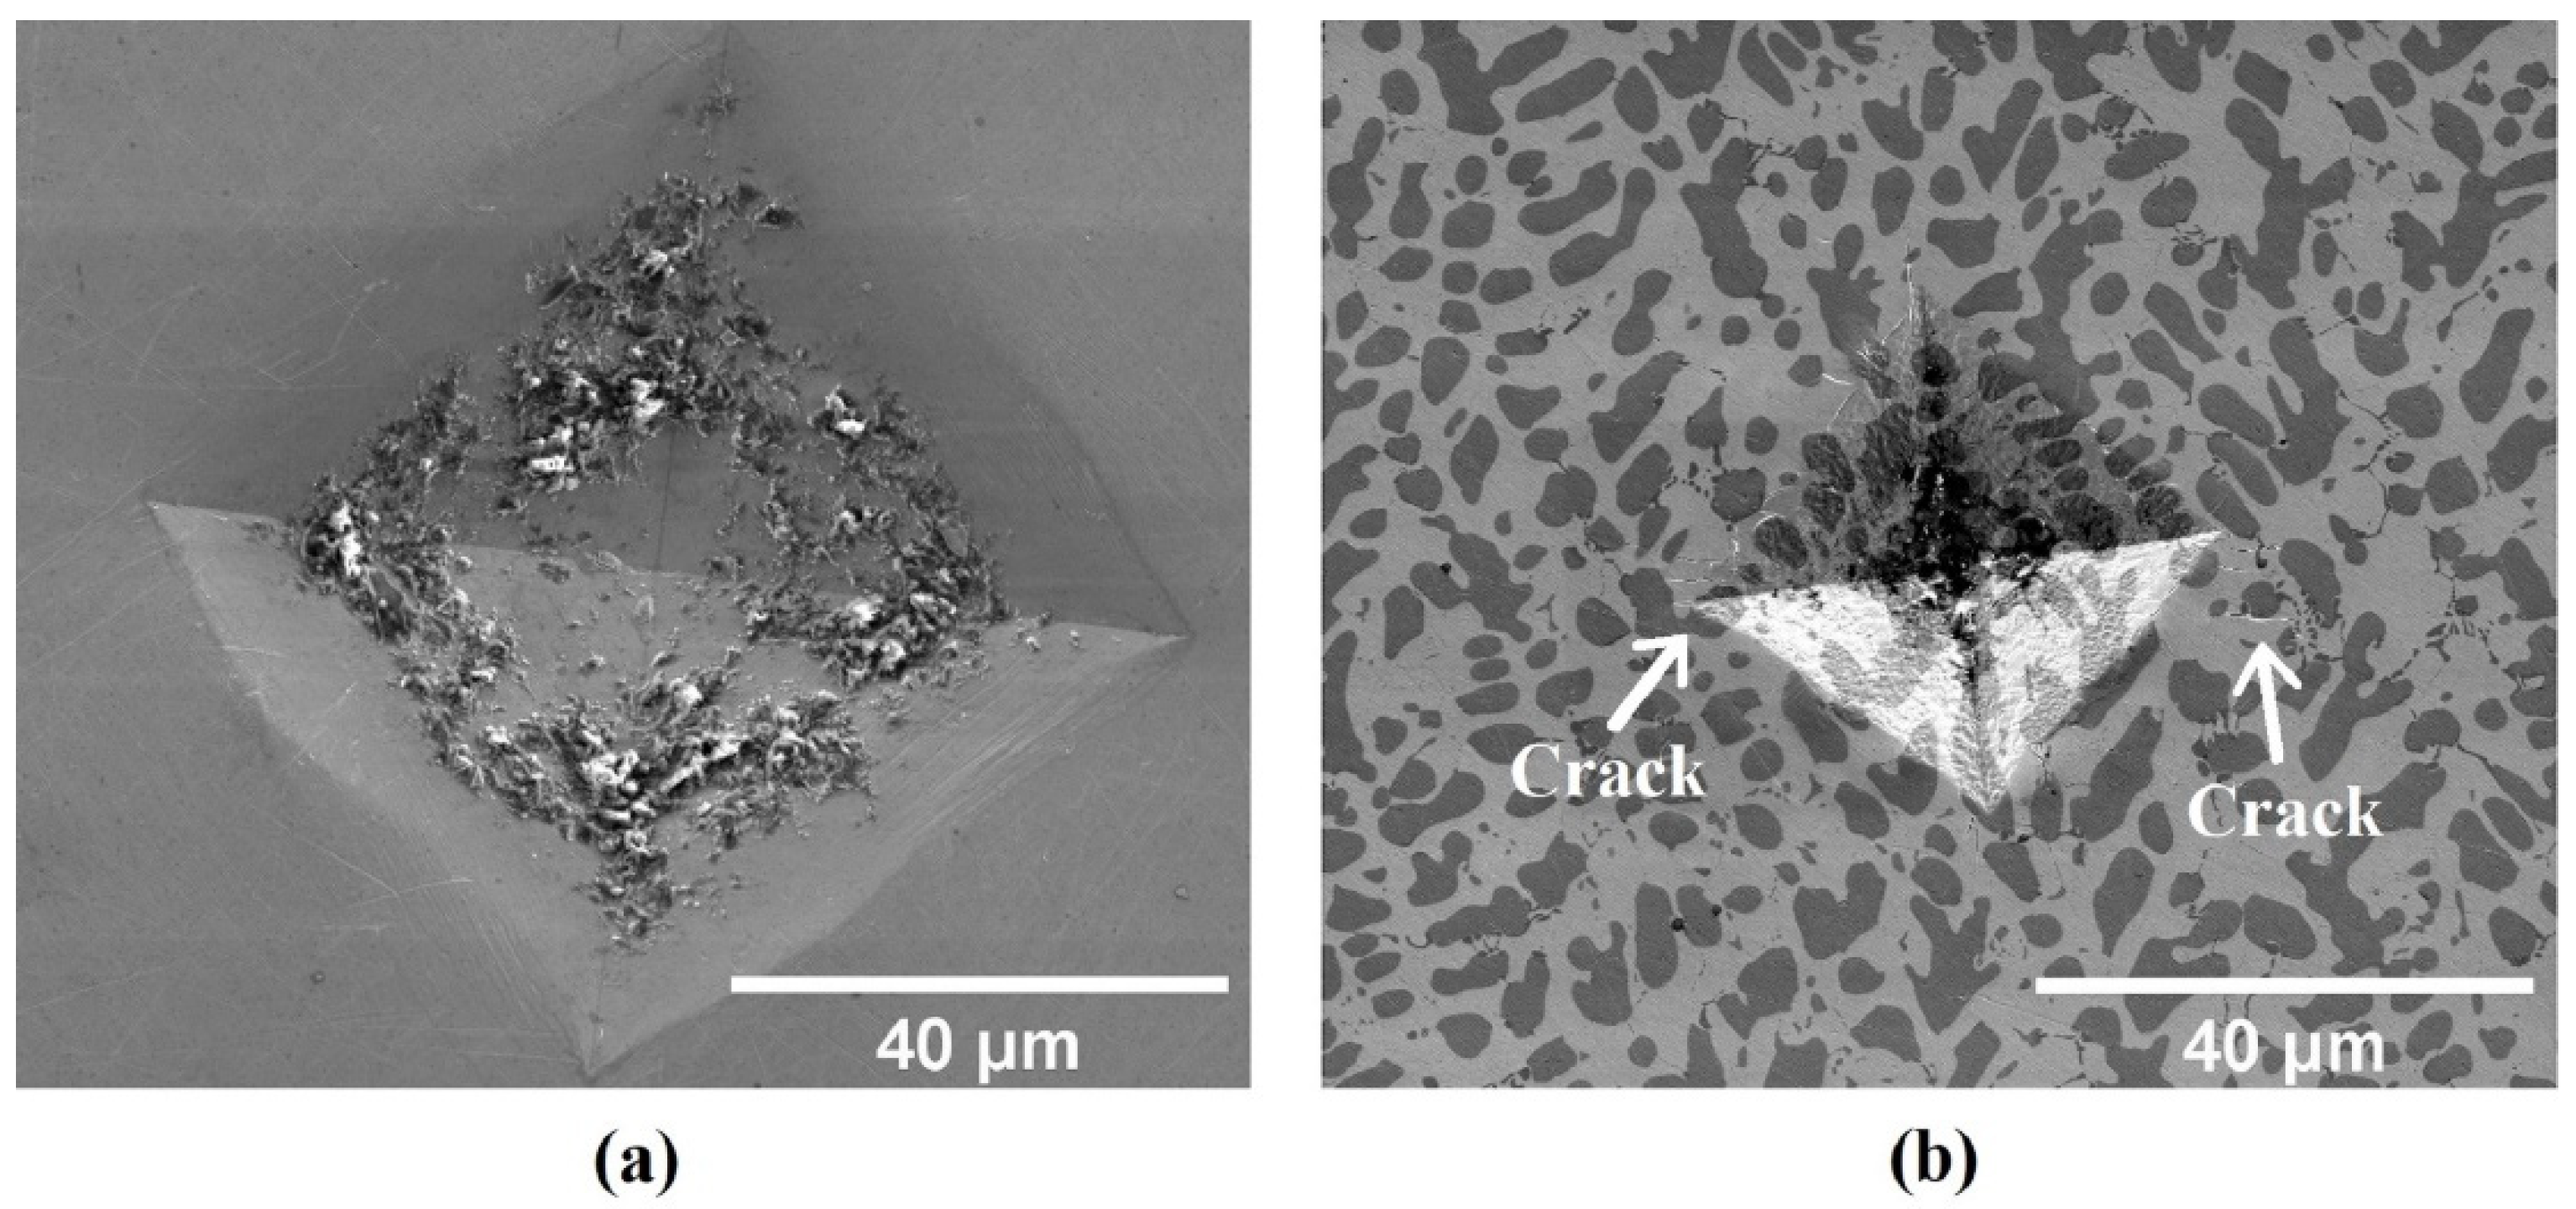
As shown in Figure 3, it was found that the hardness value of the CrFeCoNiSn alloy is significantly higher than that of the CrFeCoNi alloy: 517 HV0.5 (5.07 GPa) and 126 HV0.5 (1.24 GPa), respectively. SEM images of the indents in the two alloys after hardness testing are shown in Figure 4. As well as the difference in dimensions due to the change in hardness value, indents in CrFeCoNi show bowed edges with no observable cracks on the sample surface, suggesting ductility. Wang et al. [30] showed that CrFeCoNi can undergo plastic deformation to high strains, with deformation by dislocation motion, and the operation of work hardening mechanisms at a significant rate, stemming from the low stacking fault energy [31] (approximately 30 mJ/m2 despite the content of Ni [32]). In contrast, around indents in CrFeCoNiSn several cracks can apparently be observed, with it being particularly noteworthy that these seem to occur in the Ni-Sn phase (the lighter contrast phase in the image) only.
EDS analysis of the phases in Figure 4 confirms that the lighter phase is the Ni-Sn phase. Despite having high hardness [33,34], the Ni-Sn phase has lower toughness and is the phase where cracking occurs. Crack propagation appears to be resisted by the CrFeCoNi phase (which has an FCC structure and greater ductility), as many cracks terminate at the interface between the two phases. The microstructure of the CrFeCoNiSn alloy, therefore, has the potential to show improvements in hardness over CrFeCoNi, due to the presence of the high hardness Ni-Sn phase, and for improvements in toughness over the Ni-Sn phase alone, due to the presence of the ductile CrFeCoNi phase.
The volume fraction of the phases is important for both of these behaviours. As noted before, the amount of Ni-Sn phase (56.7%) is greater than the FCC phase (43.3%) (which is consistent with the much greater hardness of CrFeCoNiSn compared to CrFeCoNi). These volume fractions are at a level where each phase existing as a percolating, interconnected network is possible. This evidence shows that Sn has a transformative effect on the microstructure, and hence hardness, in the CrFeCoNiSn system. The formation of this apparently percolating network of Ni-Sn phase, which is an intermetallic compound, is the main factor is raising the hardness [33,34], while the minor phase FCC solid solution CrFeCoNi phase (which is still present in a large amount) introduces some crack propagation resistance.
3.3. Corrosion Performance
Figure 5 presents the potentiodynamic curves for the CrFeCoNi and CrFeCoNiSn alloys immersed in 0.6 M NaCl solution at ambient temperature. The passive region ΔEp, which is the difference between Ep and Ecorr, of CoCrFeNiSn is about twice as wide as that for CrFeCoNi. Adding Sn to CrFeCoNi has, therefore, significantly increased the passivation ability, possibly because of the formation of oxides based on SnO2 at the surface in addition to the main Cr2O3 and other oxide films [17], which appears to increase the protective oxide layer stability. However, there is only a relatively small enhancement in the corrosion parameters, shown in Table 3, for CrFeCoNiSn compared to the alloy without Sn. We find that icorr is decreased by approximately 20% and the linear polarization resistance Rp increased by approximately 21% for CrFeCoNiSn compared to CrFeCoNi.
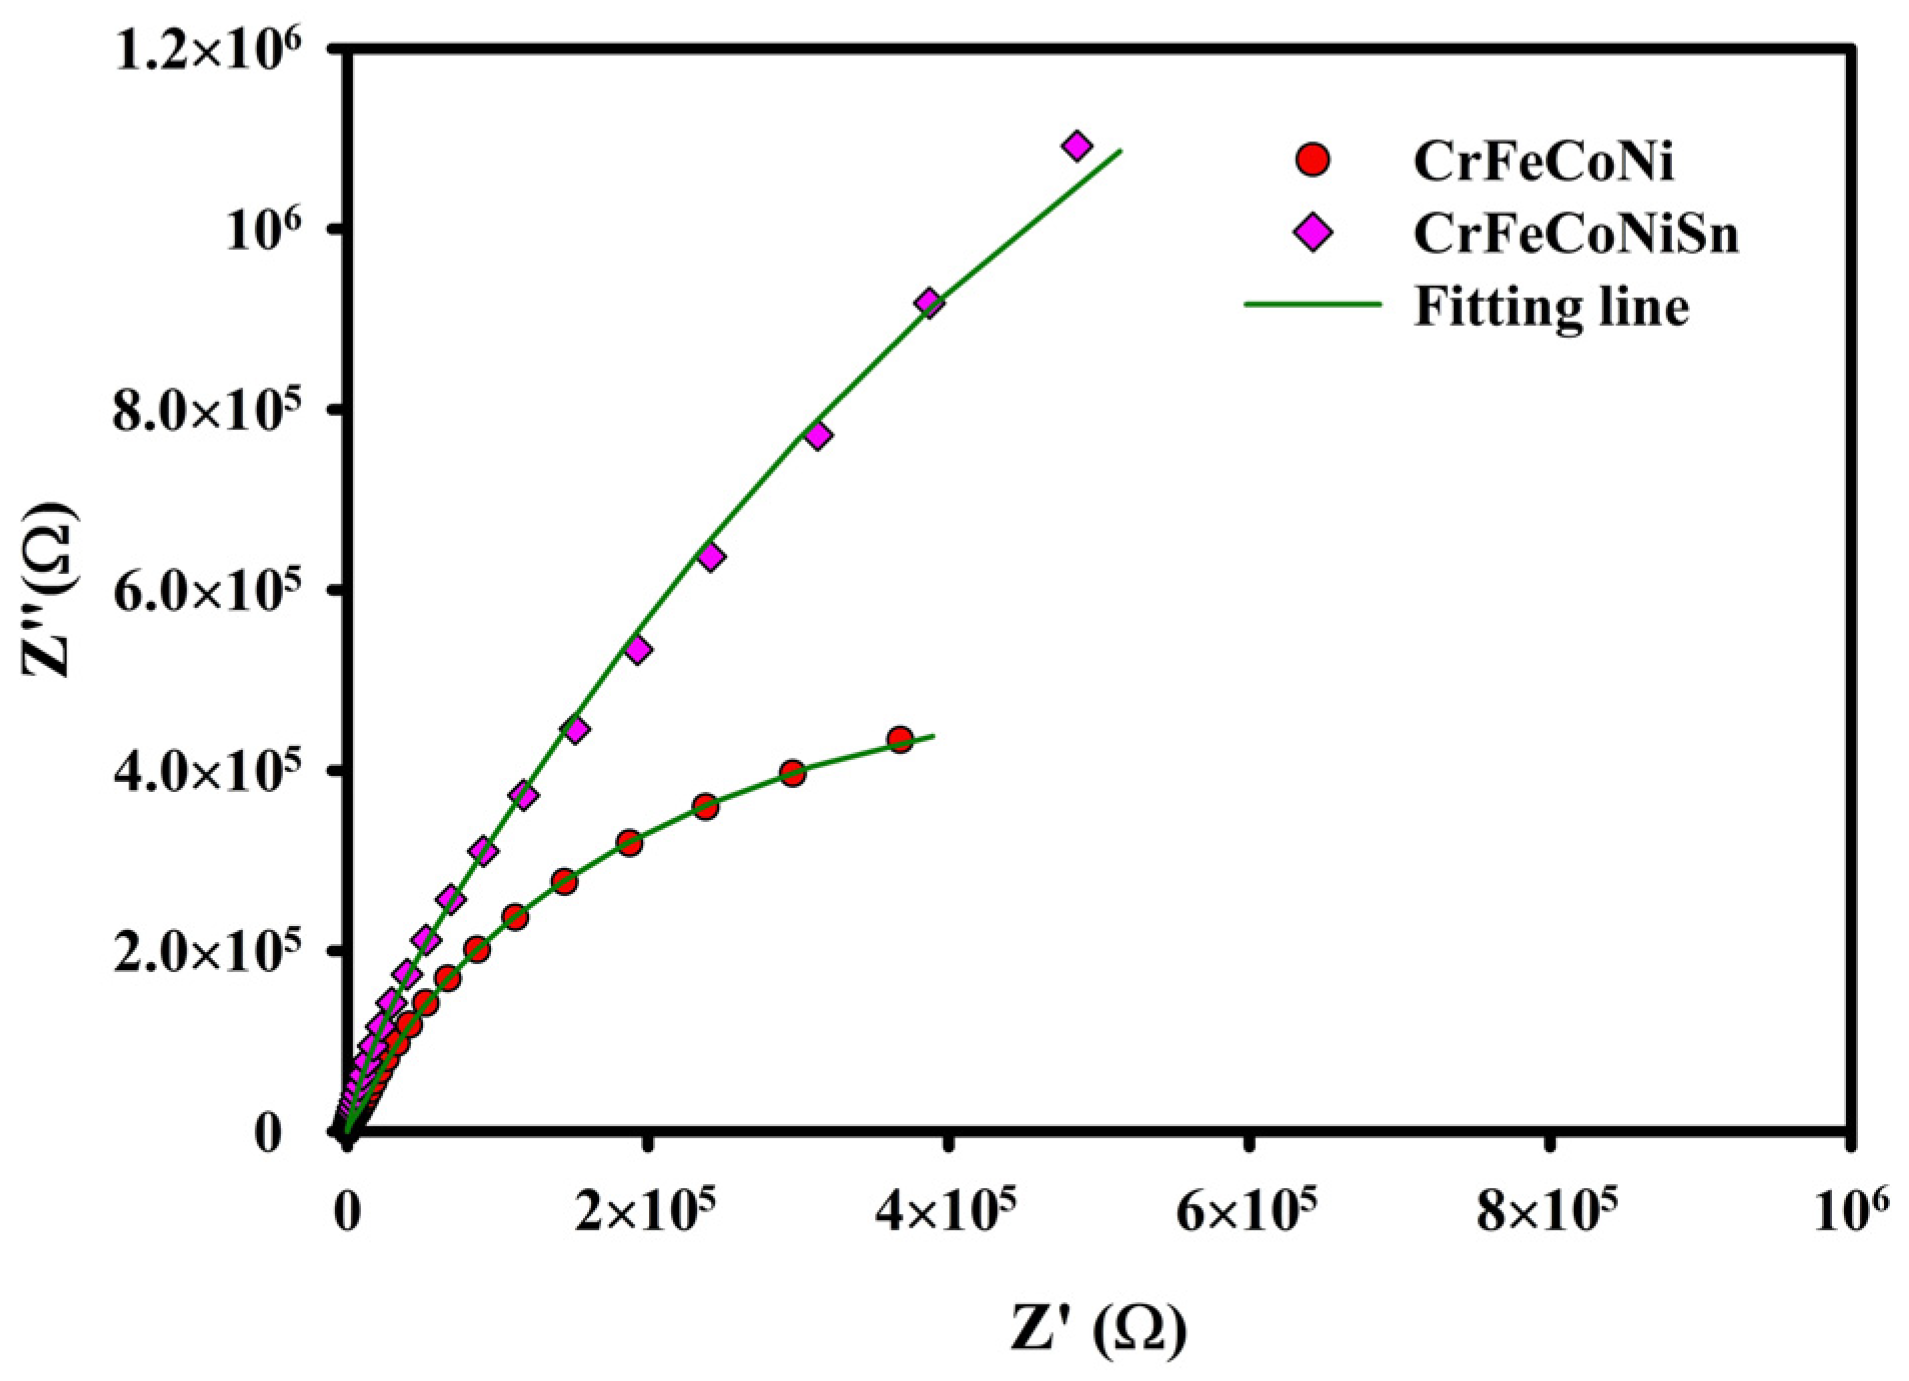
The EIS spectra for CrFeCoNi and CrFeCoNiSn samples immersed in chloride solution at room temperature in both Nyquist and Bode plots formats are shown in Figure 6 and Figure 7, respectively. For all tests, the Nyquist plots show a semicircle with the centre depressed below the x-axis, clearly revealing the non-perfect capacitive behaviour of the surface layer. The semicircles intersect the x-axis at high frequencies giving the solution resistance (Rs). At very low frequencies (which cannot be reached experimentally but can be extracted by using electric equivalent circuit modelling), the semicircle should intersect the x-axis again to give the solution resistance plus the total surface resistance (Rs + Rt). At intermediate frequencies, the imaginary part starts to increase, indicating the capacitive behaviour of the surface. A significant increase in the semicircle size can be observed due to the addition of Sn to CrFeCoNi.
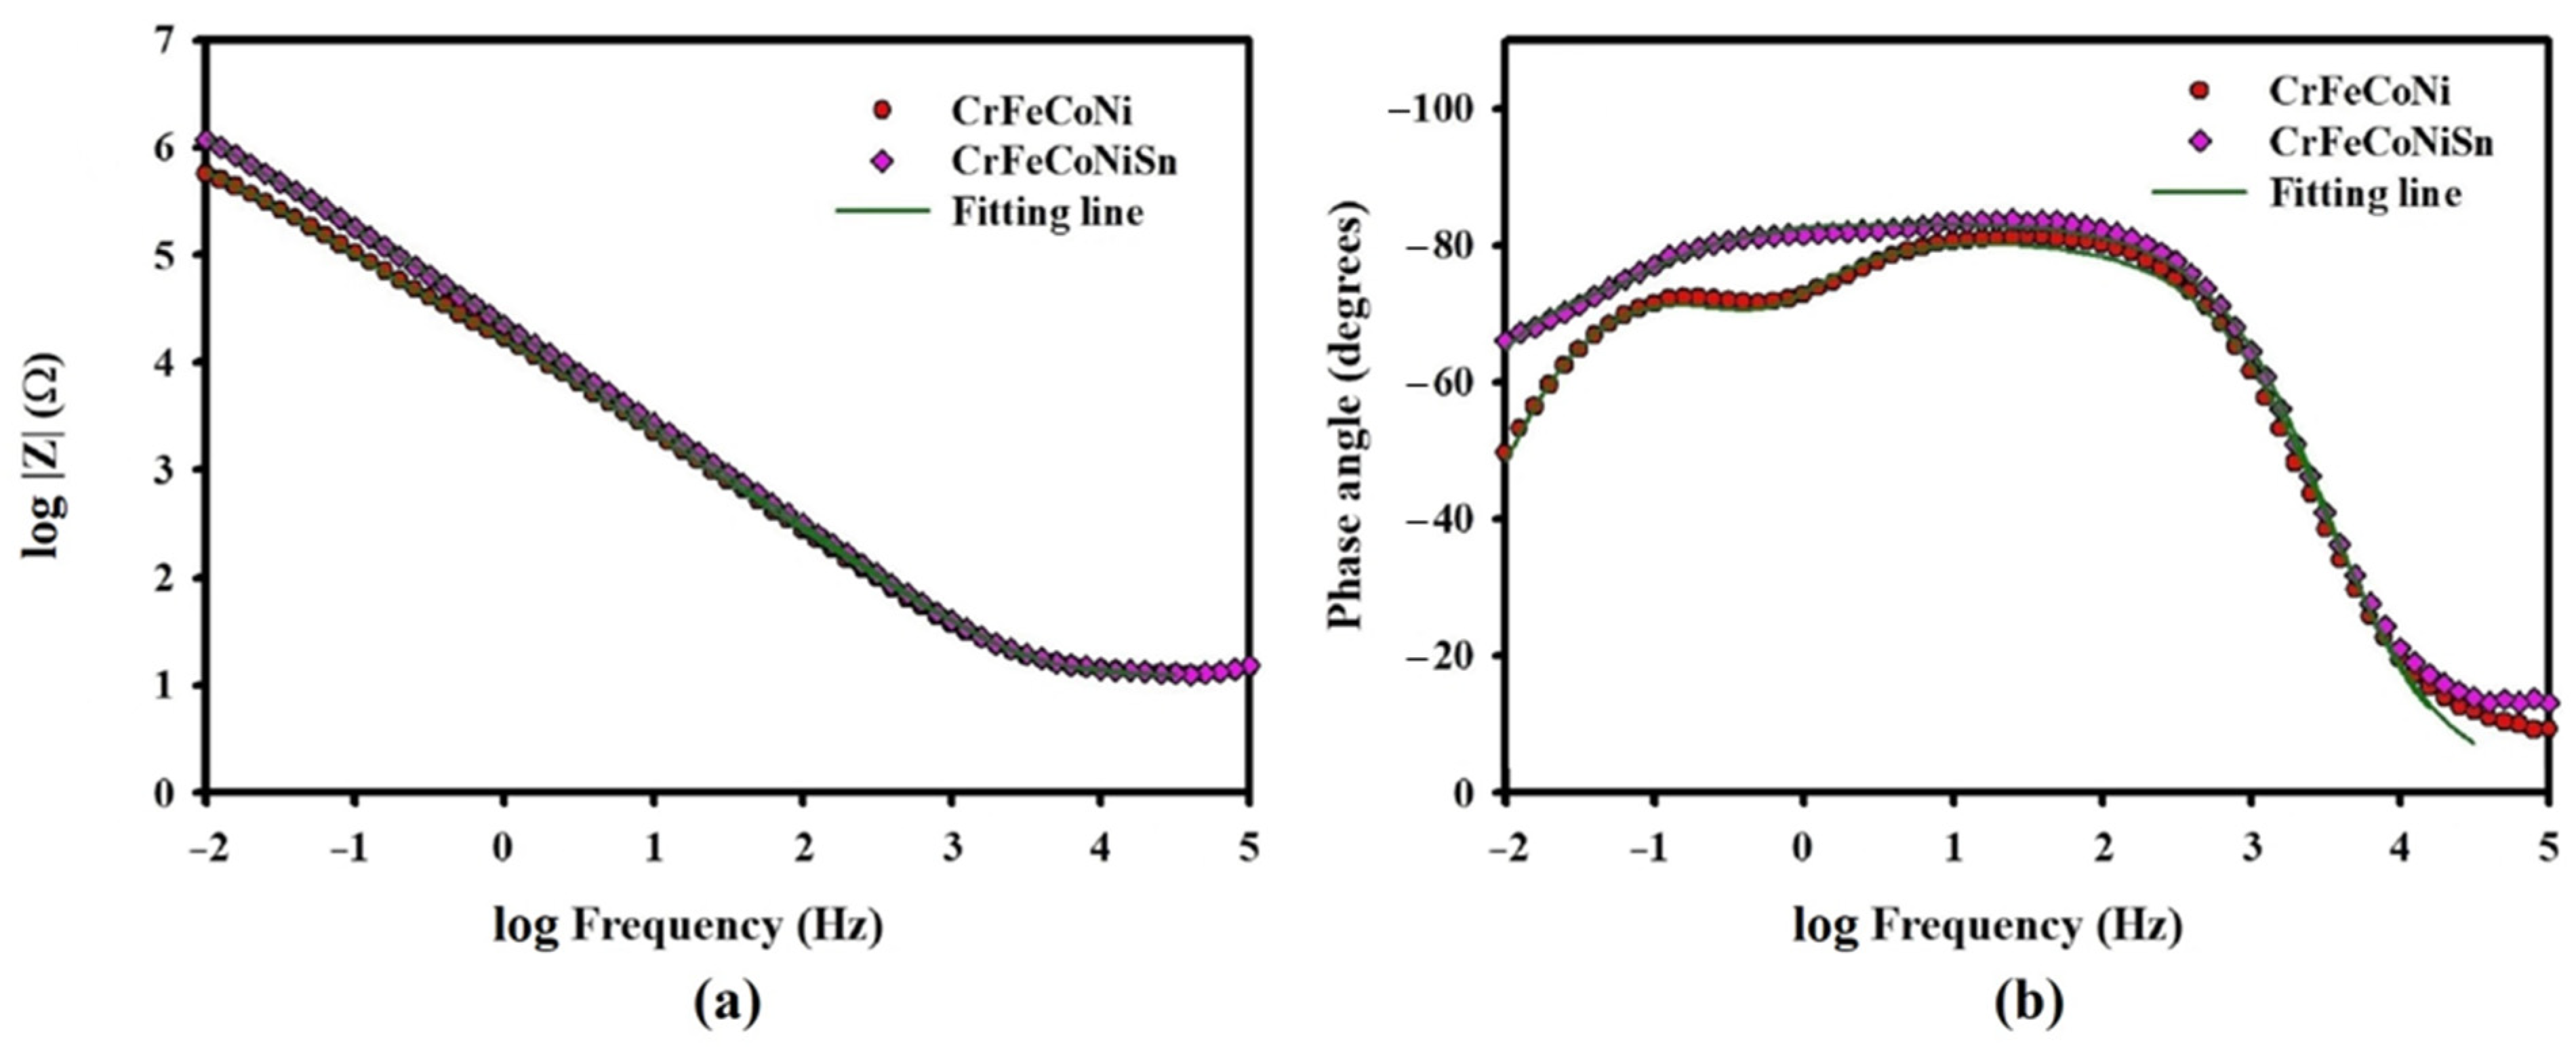
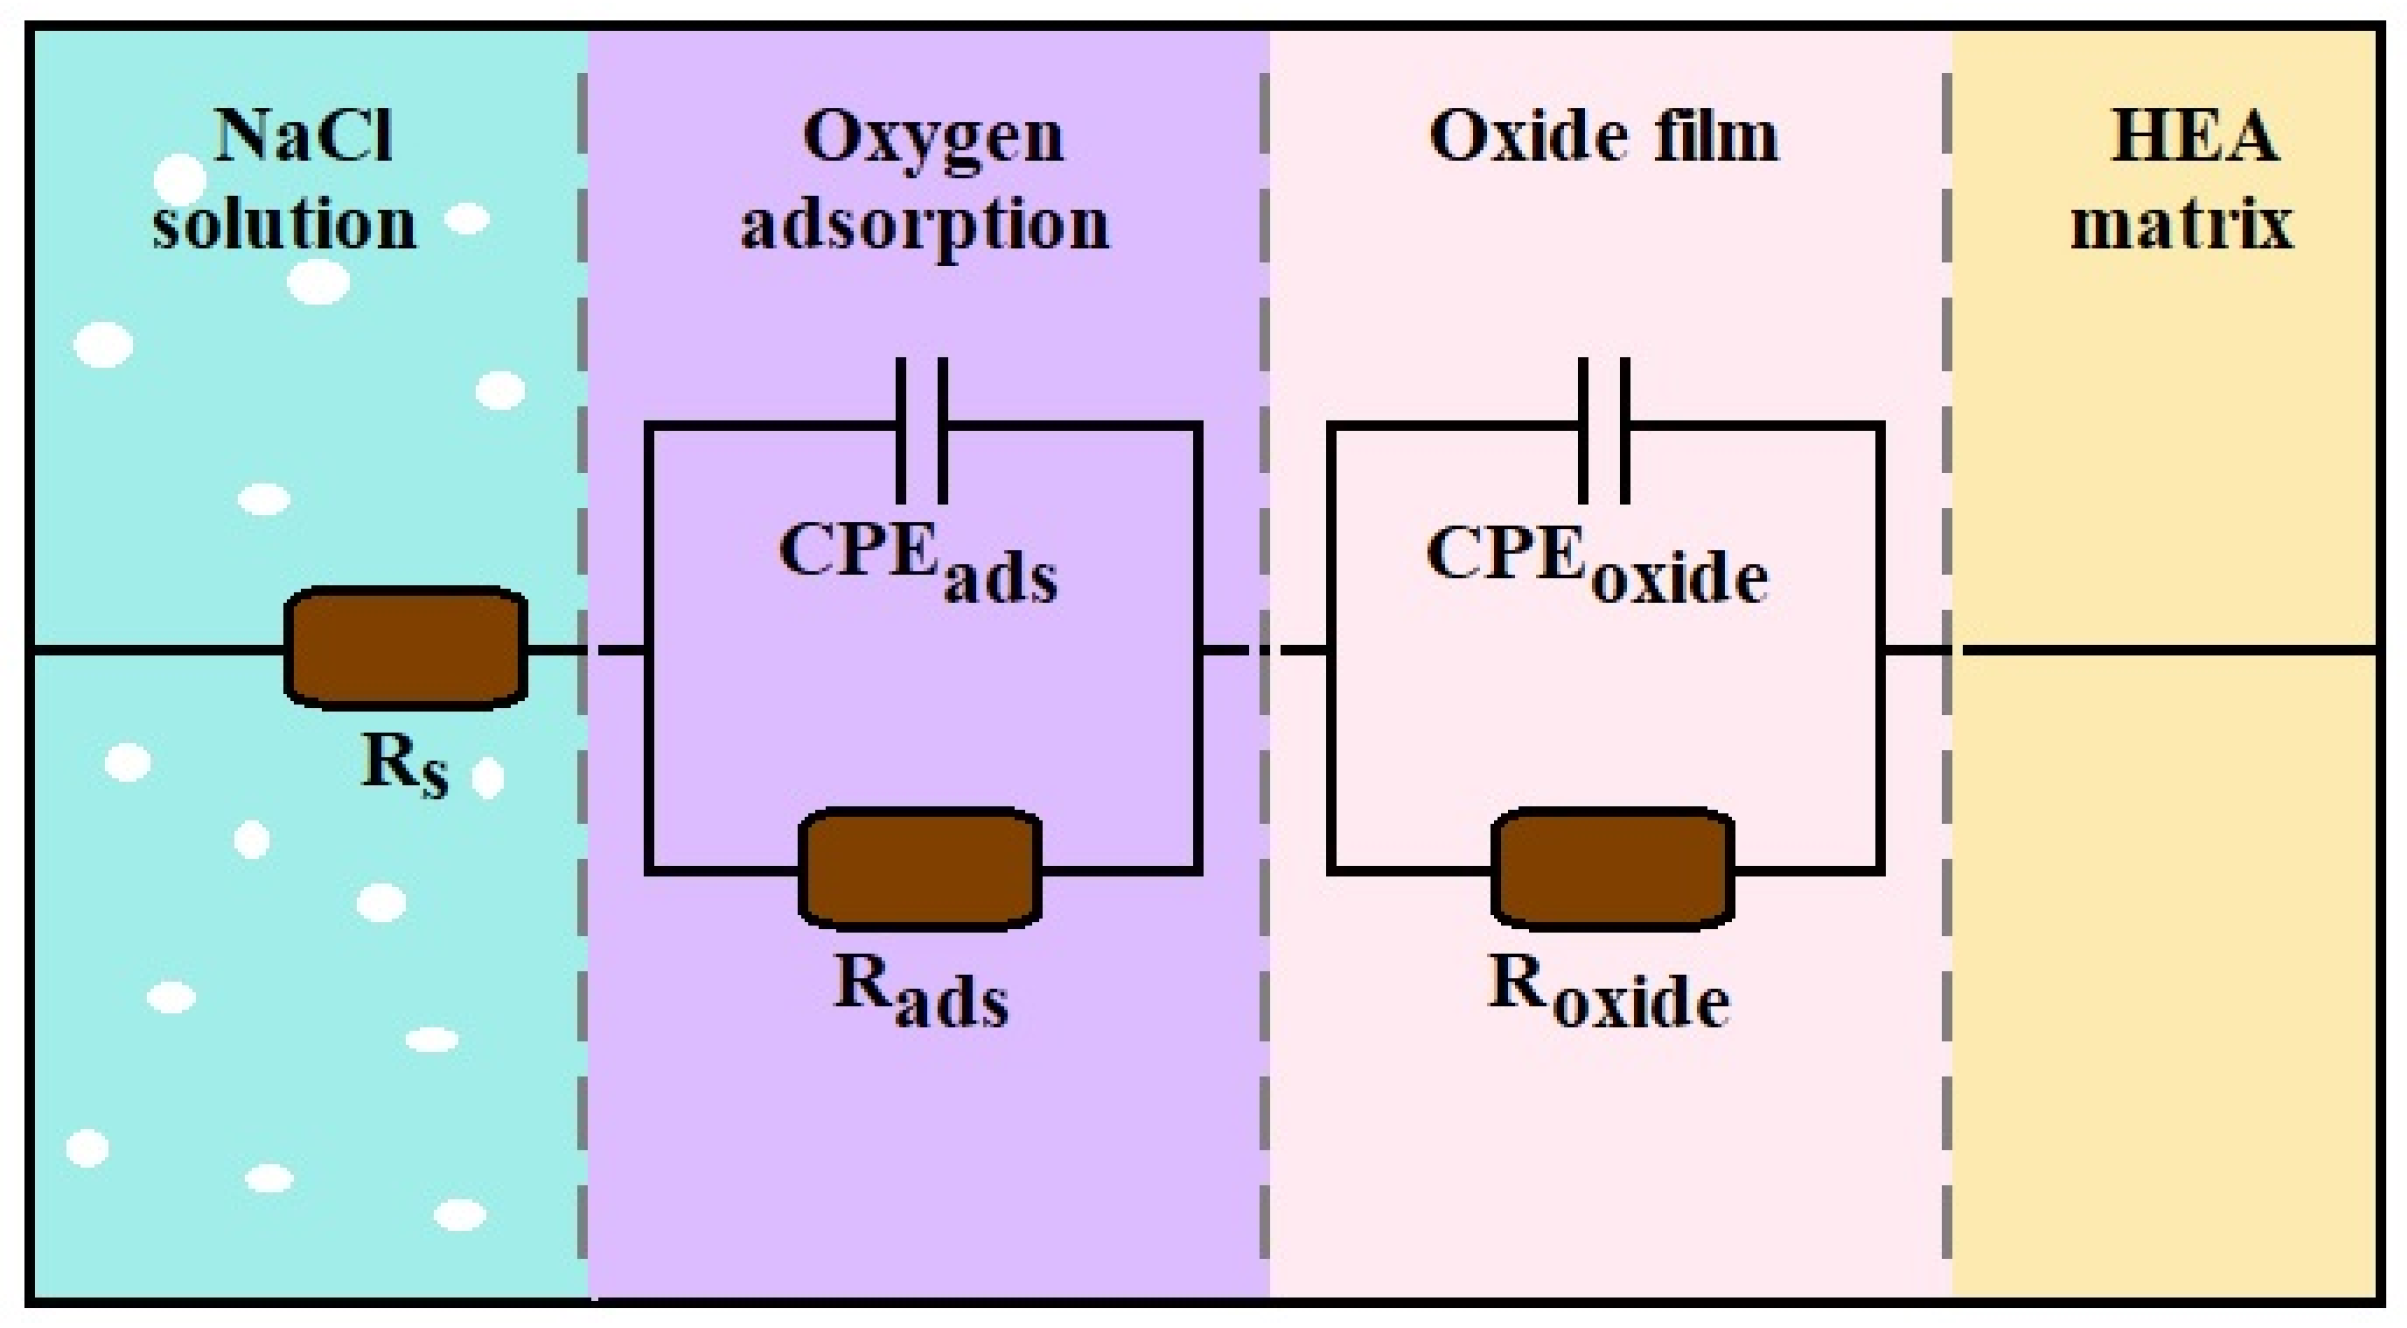
The Bode plot in Figure 7a, and the Bode phase plot in Figure 7b, show that the material exhibits a plateau at high and low frequencies, giving Rs and Rs + Rt, respectively. At intermediate frequencies, the curve is a straight line with a slope close to −1 in all cases. For the phase shift Bode plot, Figure 7b gives the same indication as the phase peaks at intermediate frequencies, due to the increase in the imaginary component of the impedance. Two time constants can be clearly distinguished from the figure for both tested HEAs. The first one at high frequencies, attributed to the oxide layer, and a second one at low frequencies, which is attributed to a surface adsorbed layer. Based on this hypothesis, the Electric Equivalent Circuit (EEC) shown in Figure 8 was used to model the EIS data. An EEC of this type has previously been used in modelling EIS data for passive metallic materials [35,36,37].
All the parameters resulting from the fitting to the EIS data are tabulated in Table 4. Adding Sn to CrFeCoNi has a significant impact on Roxide, which is possibly because of the formation of Ni-Sn phase with high passivation ability and the stable SnO2 films with dense structure [17]. Additionally, Rads exhibited an increase by more than an order of magnitude for CrFeCoNiSn compared to the alloy without Sn.
3.4. Tribocorrosion Resistance
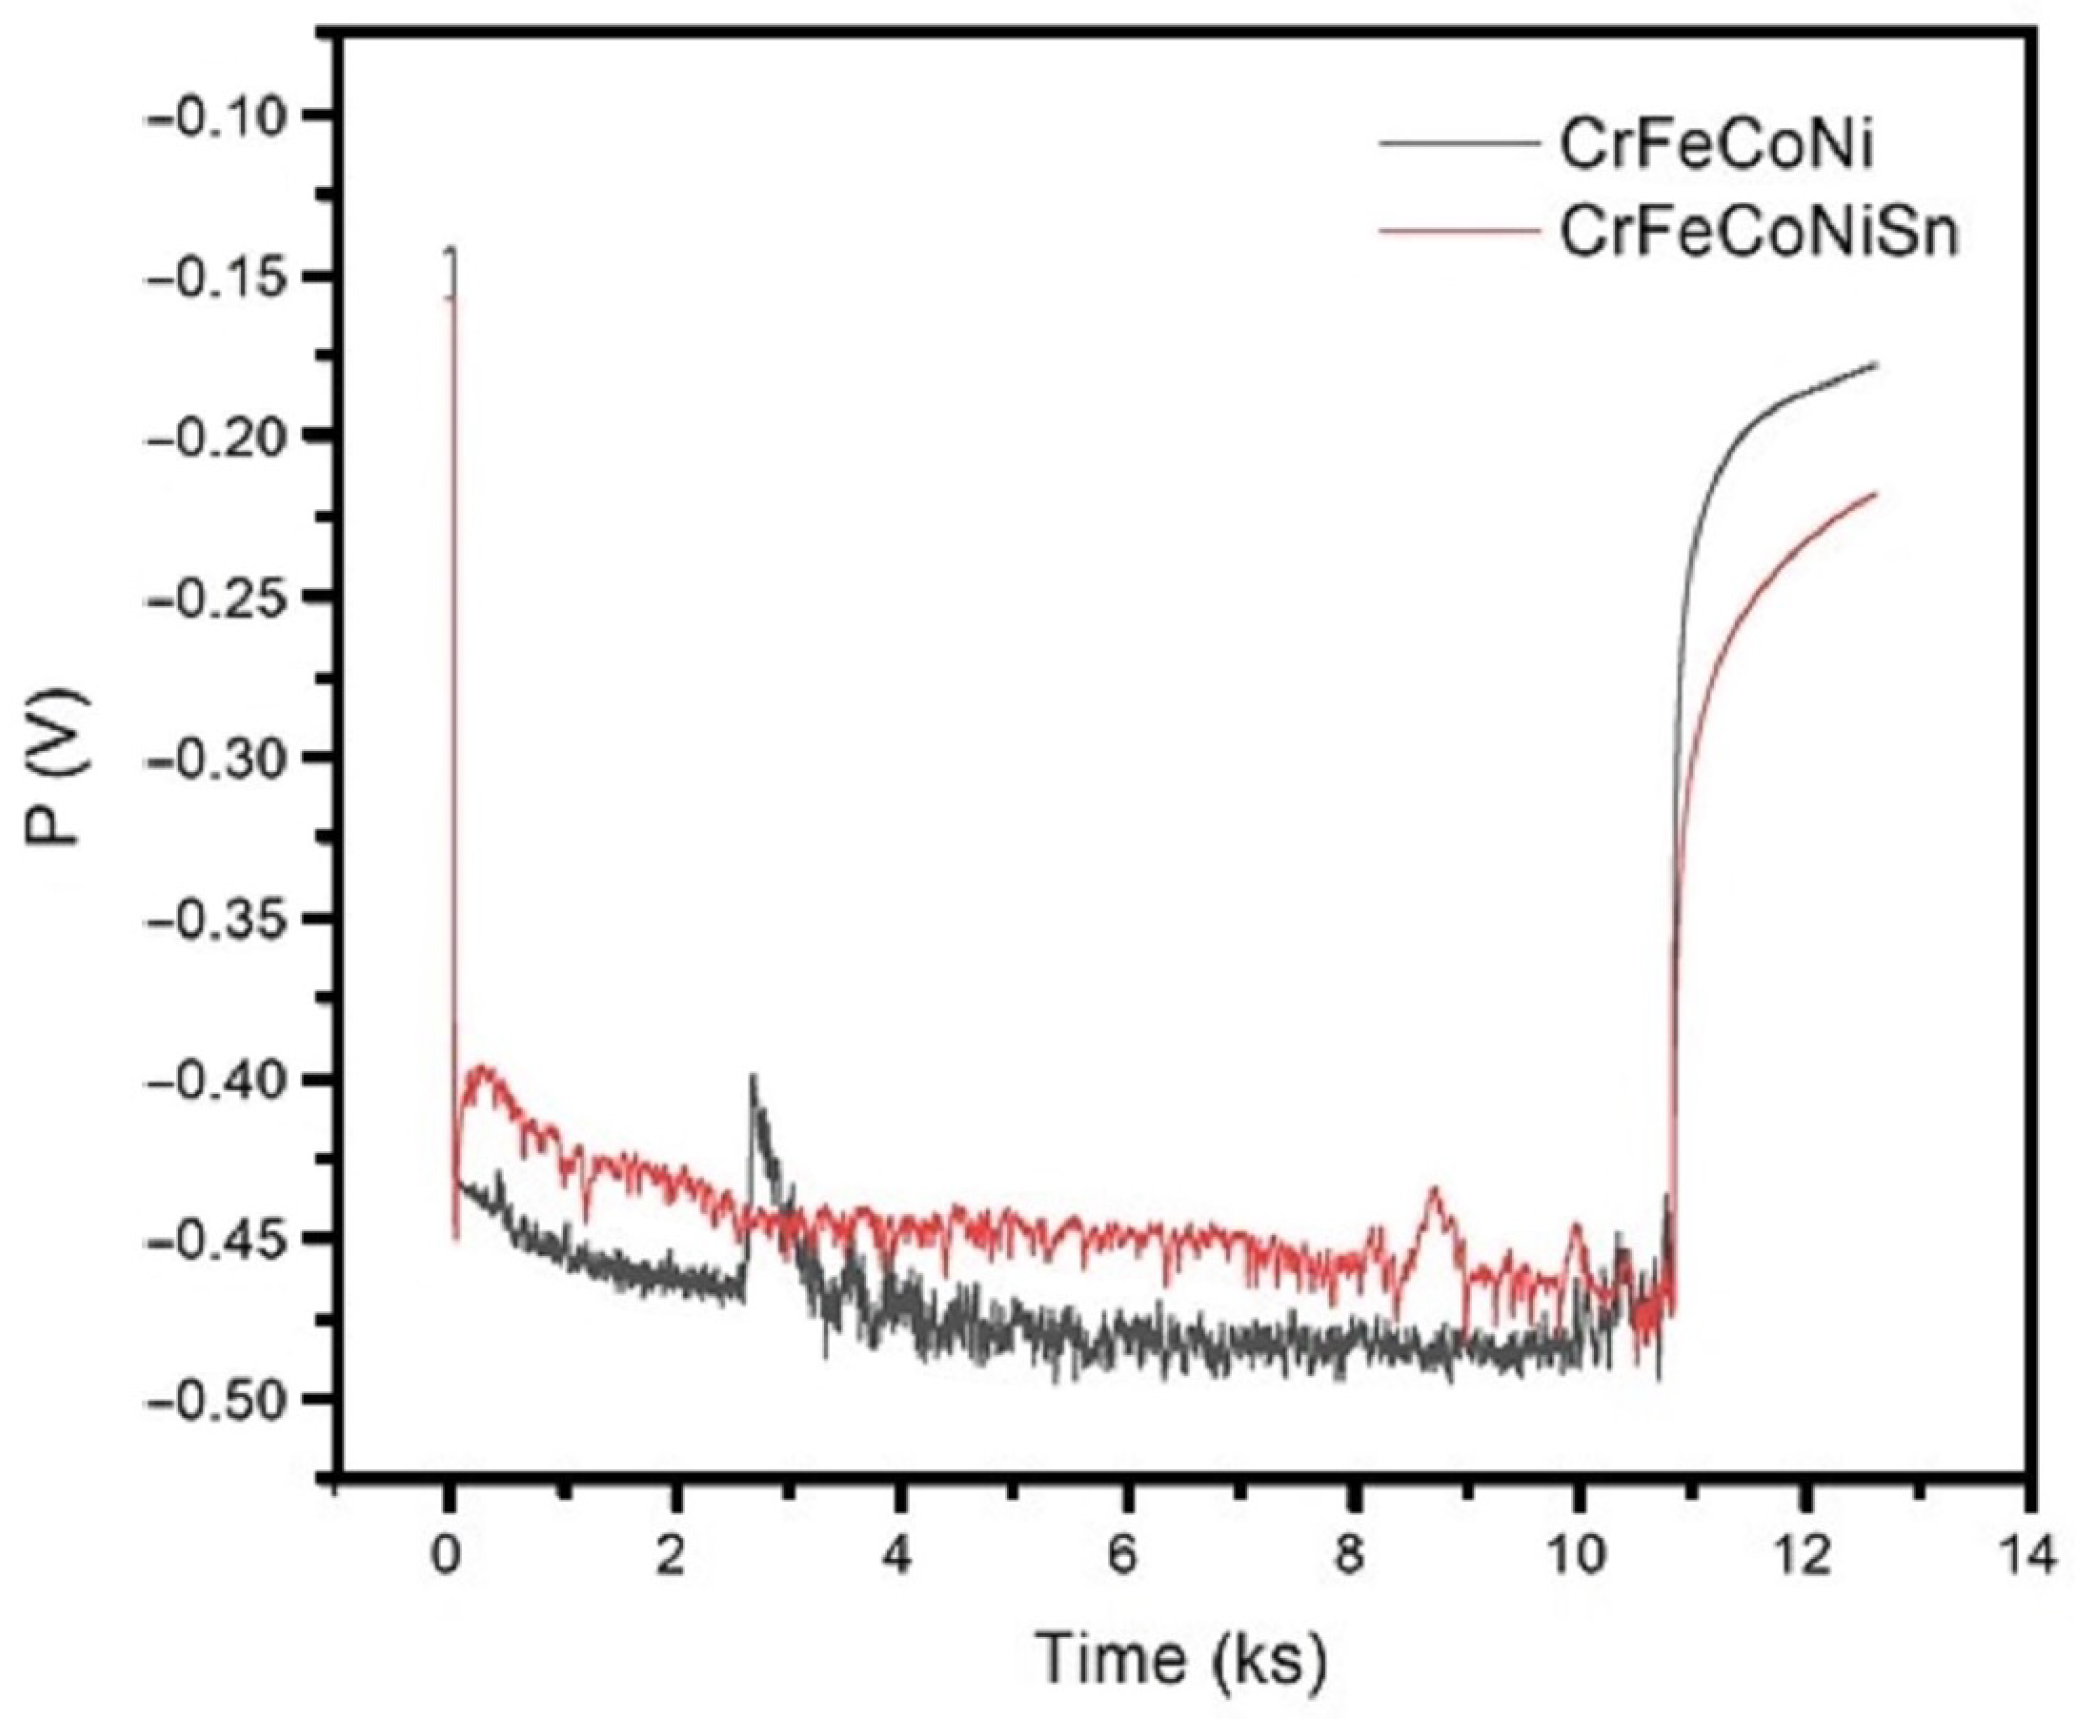
Figure 9 shows the sliding potential versus time for CrFeCoNi and CrFeCoNiSn alloys. Rubbing resulted in a drop of the potential by 150–200 mV for the two HEAs. This is the typical tribocorrosion behaviour shown by passive metals and alloys.
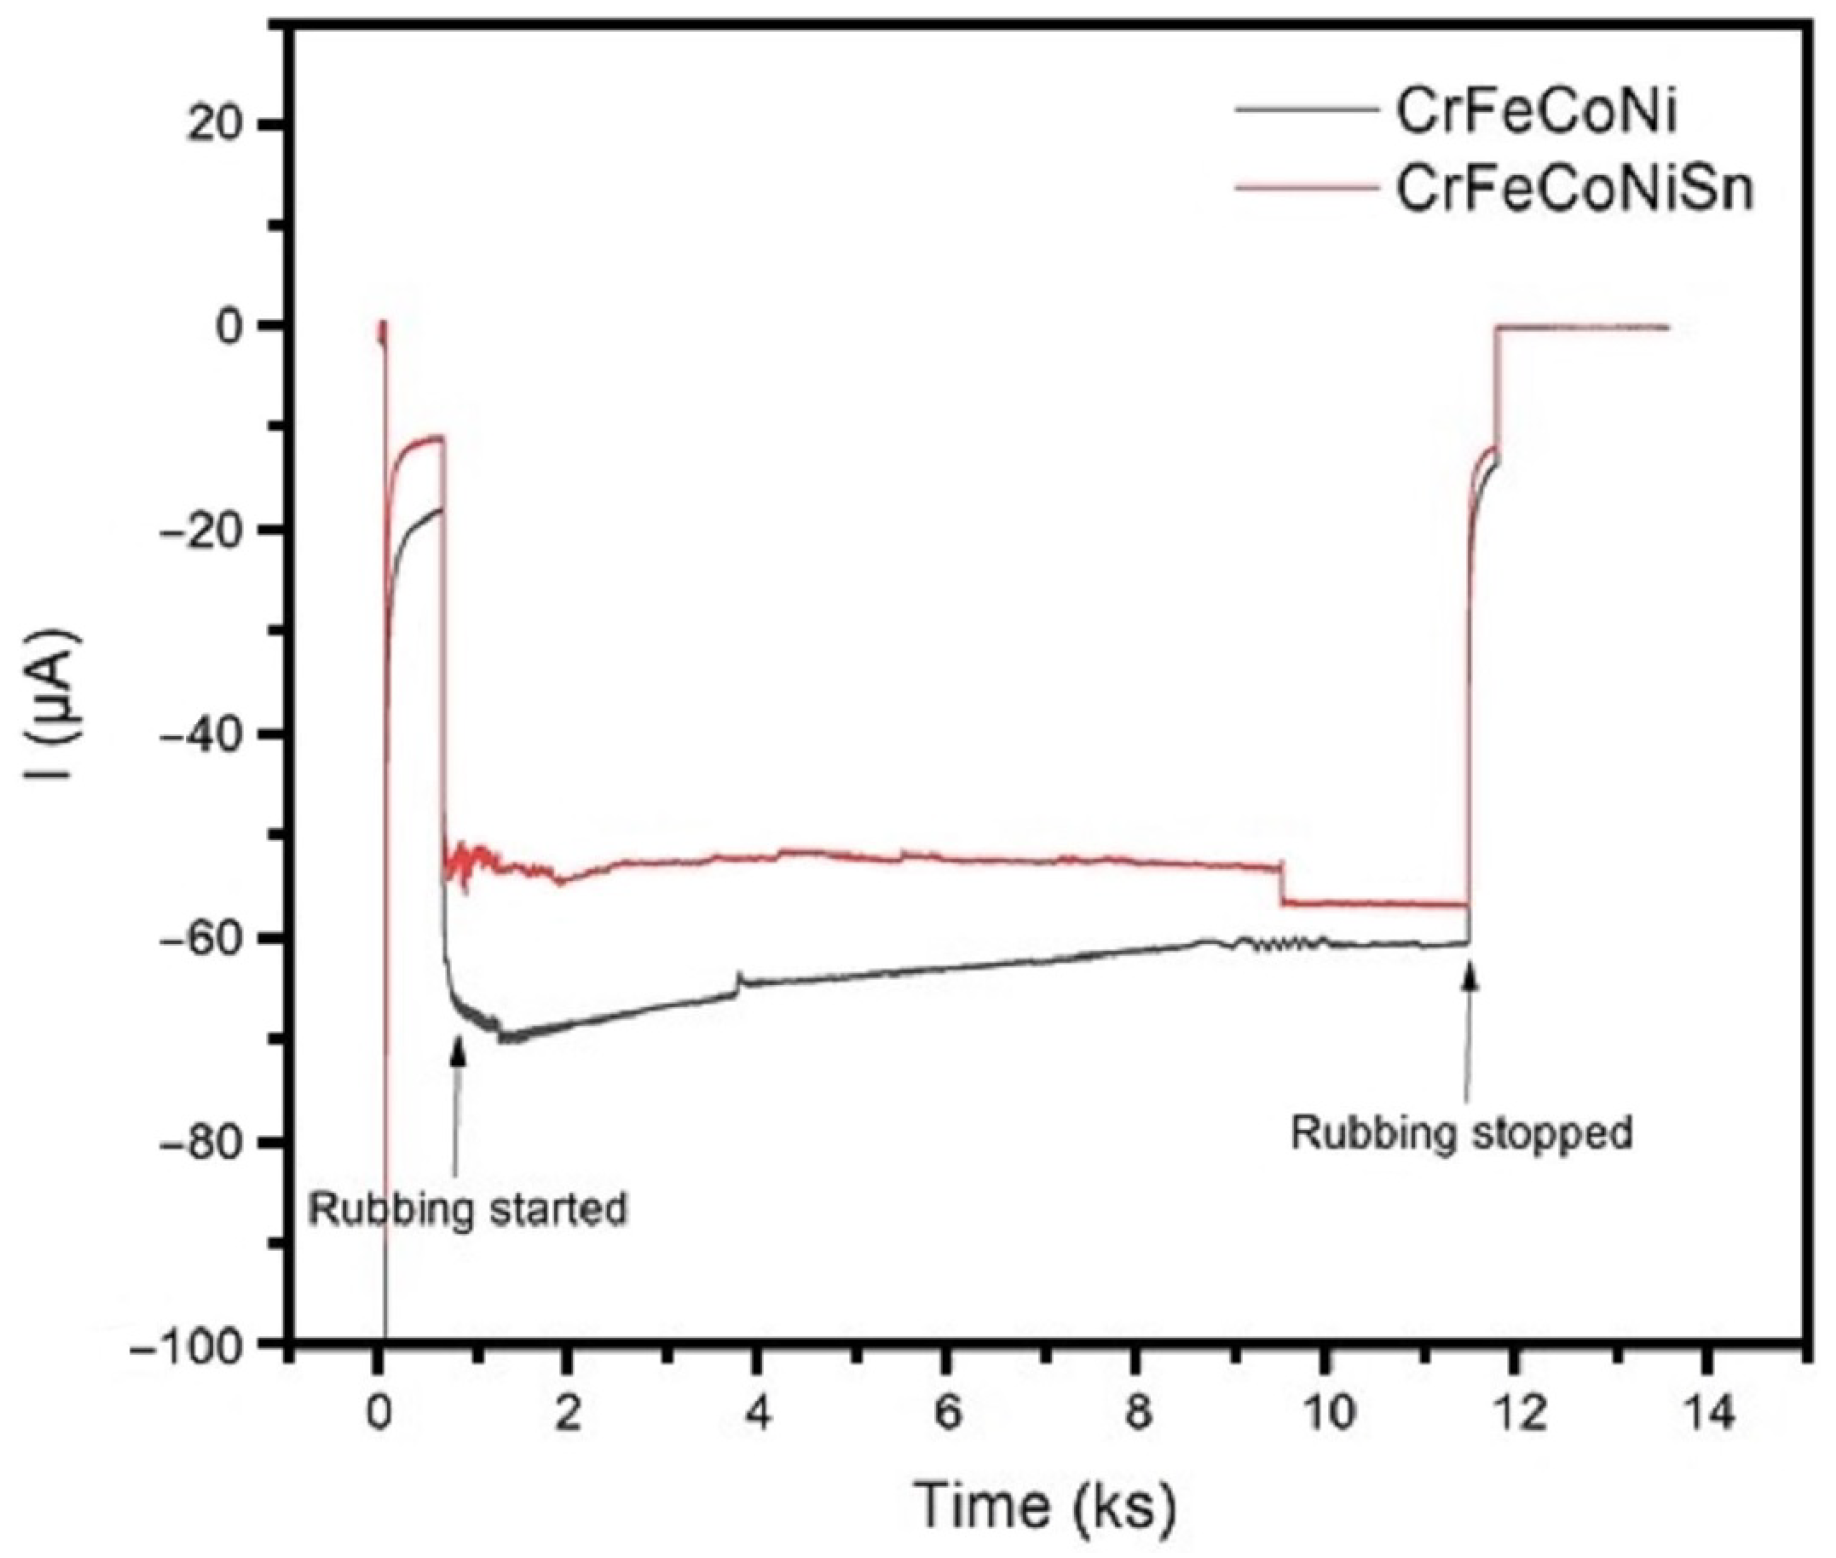
Figure 10 shows the measured current versus time for the two tested HEAs at cathodic potential. When the cathodic potential was first applied, the current exhibited a sudden cathodic drop, followed by stabilization over time to ≈ 19 μA for CrFeCoNi and ≈ 11 μA for CrFeCoNiSn. The current exhibited a cathodic shift of more than 60 μA when rubbing started on the CrFeCoNi surface. Slightly less cathodic shifting of the current was seen for CrFeCoNiSn. This is possibly because of the mechanical removal of the oxide layer due to abrasion of the surface and better mass transfer provided by agitation during rubbing.
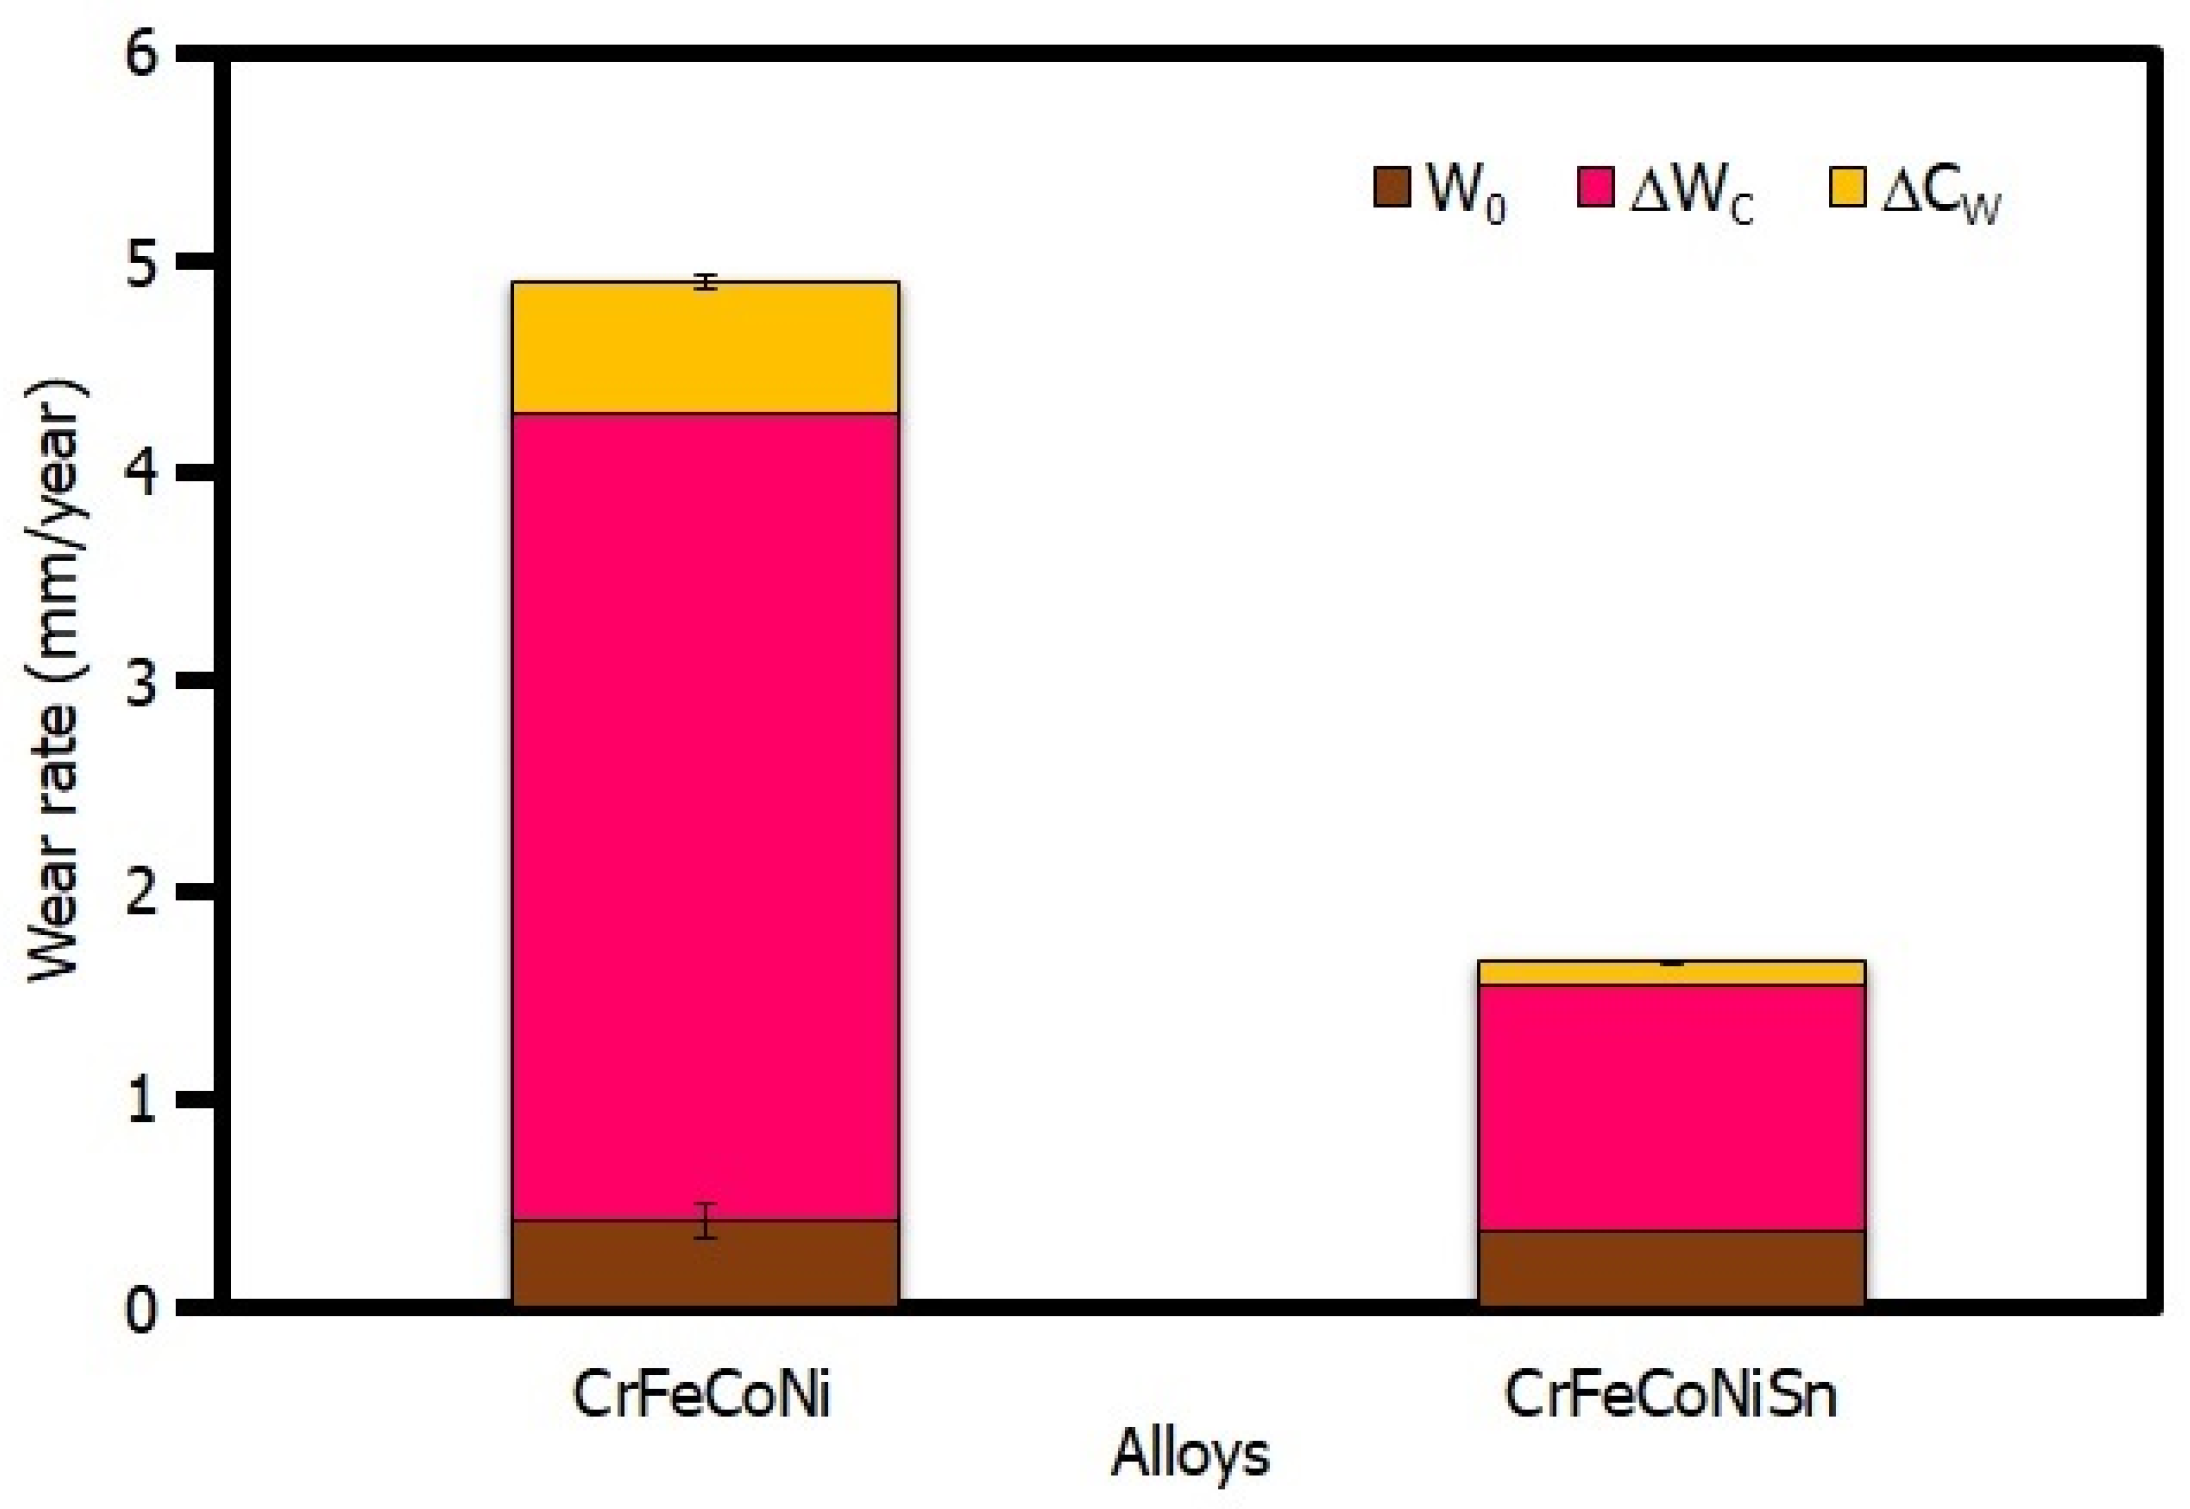
All the results of tribological and tribocorrosion tests are tabulated in Table 5. COF did not show any significant differences dependant on the HEA system being studied. A significant decrease in K was noticed as a result of the addition of Sn to the CrFeCoNi alloy under OCP and cathodic conditions. Figure 11 shows the tribocorrosion parameters: W0, ΔWC, and ΔCW. W0 exhibited a slight decrease for CrFeCoNiSn compared to CrFeCoNi by about 12%. However, adding Sn to CrFeCoNi caused a reduction in ΔCW to less than one fifth of the original value and ΔWC to about one third. As a result, the total material loss T measured for CrFeCoNiSn was one third of that for CrFeCoNi, as in Table 5.
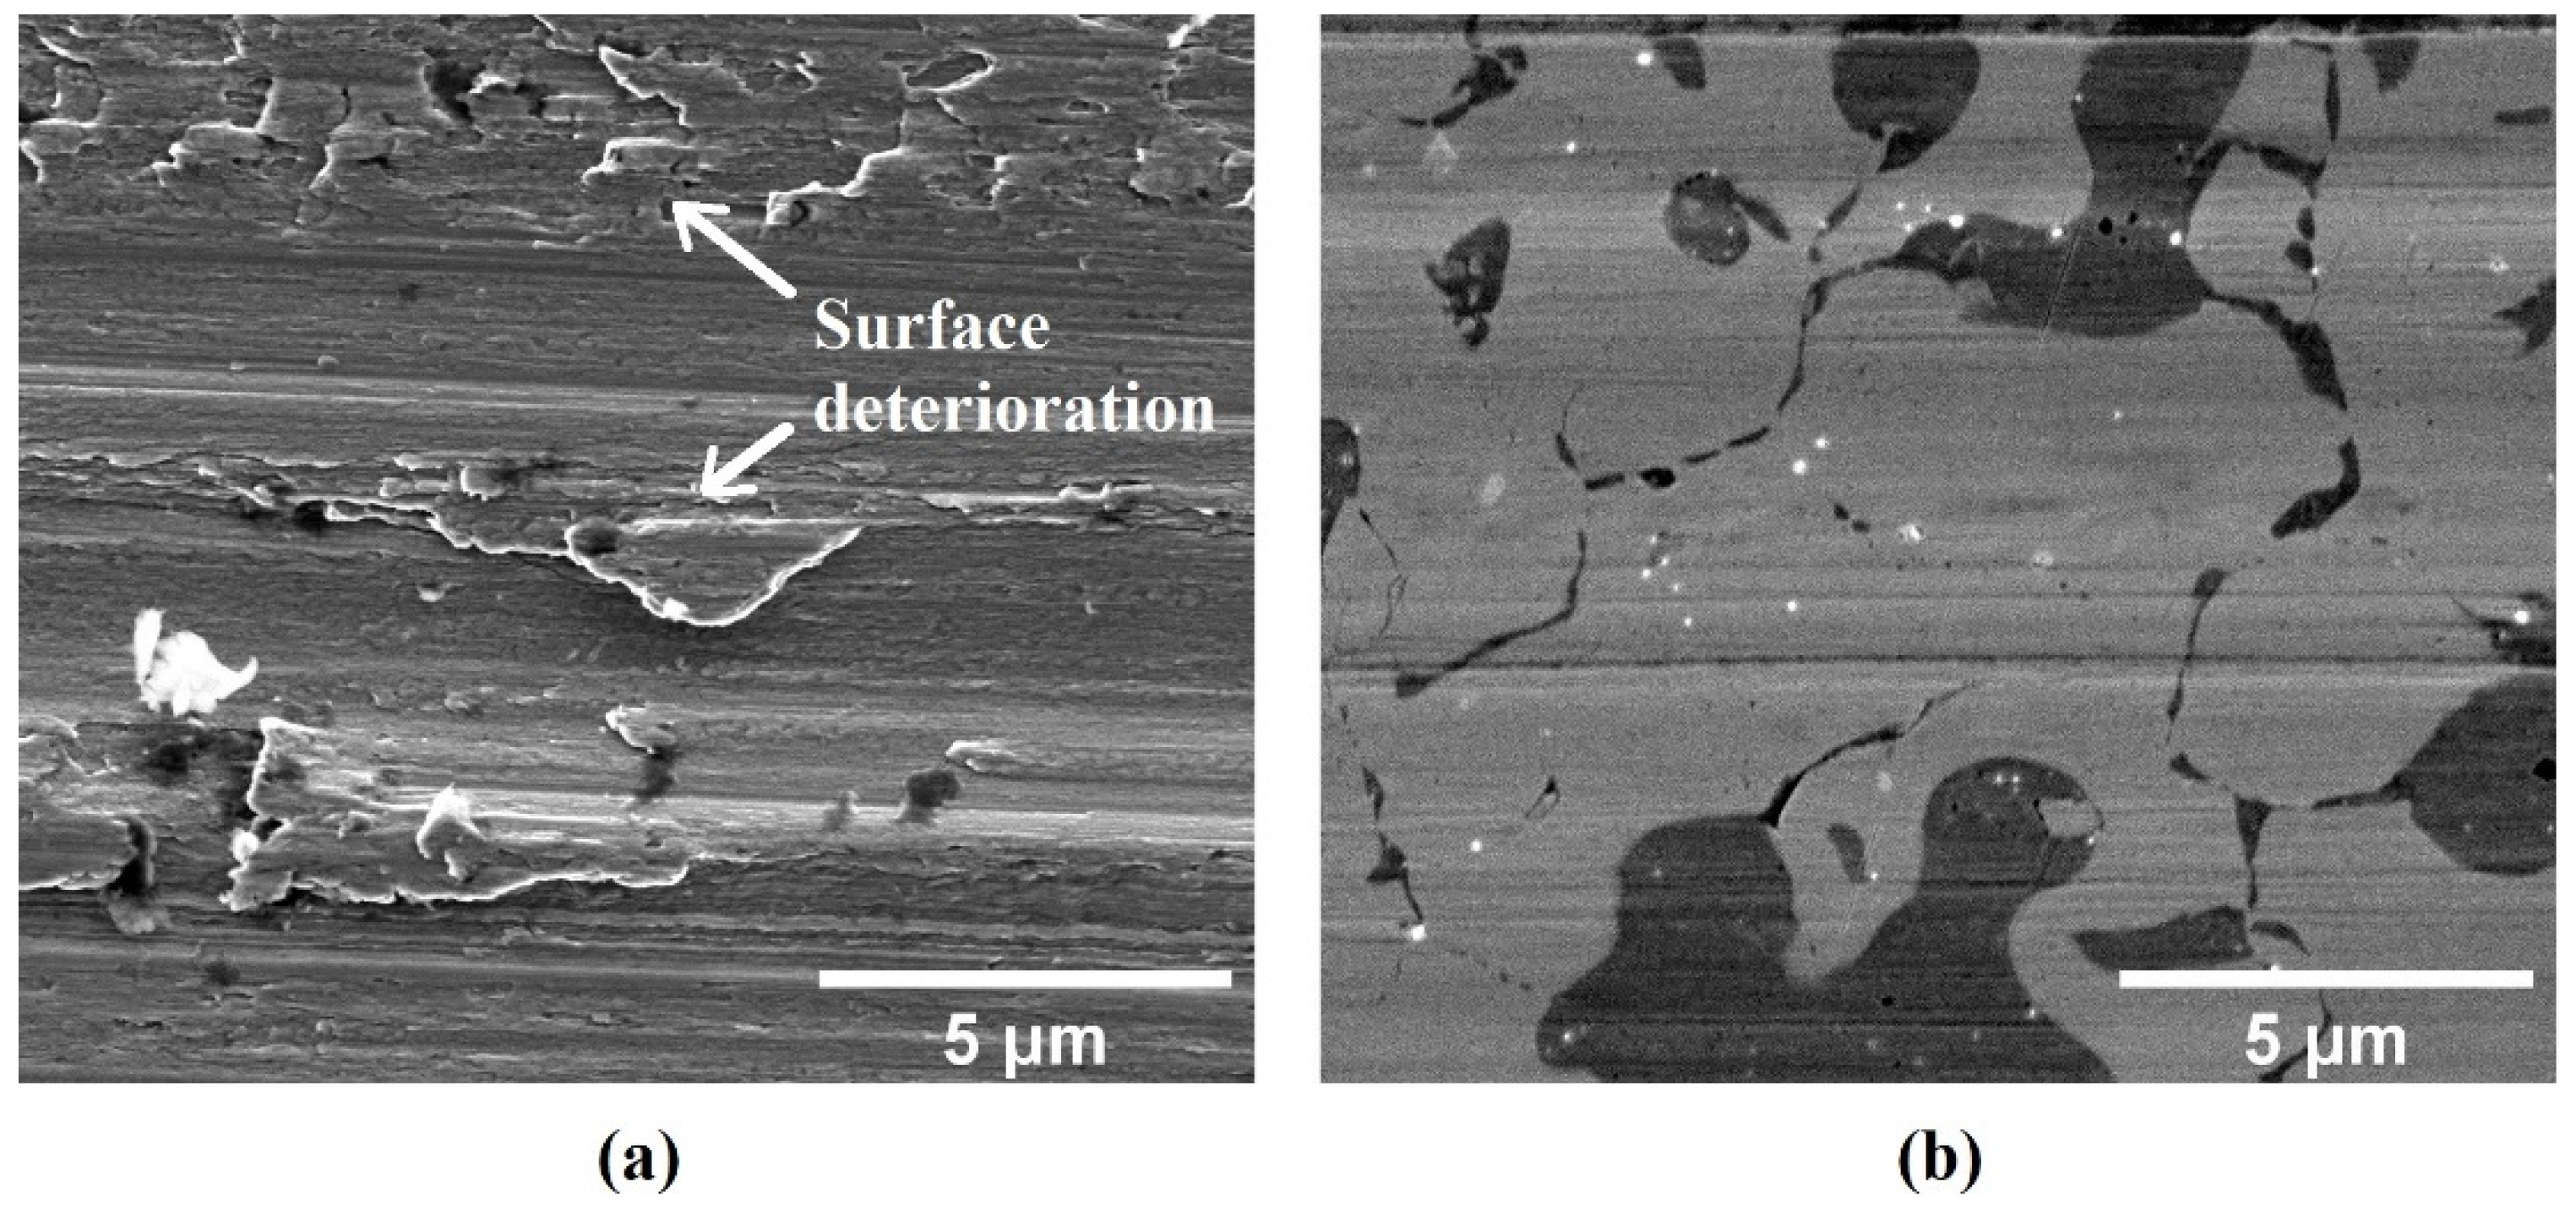
SEM images, as in Figure 12, reveal the wear morphology of the HEA samples. It was observed that the CrFeCoNi surface experiences high damage, and there are many cracks or tear features along the direction of the wear tracks in Figure 12a. On the other hand, Figure 12b shows the wear morphology of CrFeCoNiSn alloy, with no apparent sign of damage or cracks on the sample surface. Thus, this evidence helps to confirm that the CrFeCoNiSn alloy has higher tribocorrosion resistance than CrFeCoNi alloy, and it also corresponds with the data analysis in Table 5.
In sum, this research indicates that Sn addition to the main CrFeCoNi alloy has a vital role in raising the tribocorrosion properties, due to the formation of two phases, a major phase of Ni-Sn intermetallic with high strength and a minor phase of FCC CrFeCoNi which shows greater ductility and imparts an increased degree of toughness.
4. Conclusions
It has been shown here that an equiatomic addition of Sn to equiatomic CrFeCoNi leads to significant enhancement of tribocorrosion resistance, corrosion properties, and hardness. We have found that:
The addition of Sn can significantly affect the tribocorrosion properties in CrFeCoNiSn, with a good performance which derives from the two phase structure: high strength due to the Ni-Sn phase and ductility from the FCC CrFeCoNi phase. Because of this, the CrFeCoNiSn alloy has higher tribocorrosion resistance than the CrFeCoNi alloy.
The Ni-Sn phase, formed when Sn is added to the alloy, is the dominant factor for the improvement of corrosion behaviour in CrFeCoNiSn. This is likely to be as a consequence of the oxide film produced having good stability, leading to both higher polarization resistance and corrosion potential for this alloy than the main CrFeCoNi system.
The dual phase structure also leads to higher hardness in the CrFeCoNiSn alloy.
Author Contributions
Conceptualization, P.M. and R.G.; methodology, P.M. and R.M.N.; validation, R.M.N.; formal analysis, P.M.; investigation, P.M.; resources, R.M.N.; data curation, P.M.; writing—original draft preparation, P.M.; writing—review and editing, R.G. and R.M.N.; supervision, R.G. All authors have read and agreed to the published version of the manuscript.
Funding
P.M. would like to acknowledge the Royal Thai Government and Rajamangala University of Technology Rattanakosin for the financial support.
Institutional Review Board Statement
Not relevant.
Informed Consent Statement
Not applicable.
Data Availability Statement
Some data in the article are contained within reference [17]. Other date are available on request, due to their use in ongoing research.
Acknowledgments
The authors would like to acknowledge the Henry Royce Institute, Department of Materials Science and Engineering, the University of Sheffield for the instrumental support in tribocorrosion tests.
Conflicts of Interest
The authors declare no conflict of interest.
References
- López-Ortega, A.; Bayón, R.; Arana, J.L. Evaluation of protective coatings for offshore applications. Corrosion and tribocorrosion behavior in synthetic seawater. Surf. Coat. Technol. 2018, 349, 1083–1097. [Google Scholar] [CrossRef]
- Wang, Z.W.; Yan, Y.; Qiao, L.J. Nanocrystalline layer on the bearing surfaces of artificial hip implants induced by biotribocorrosion processes. Biosurface Biotribol. 2015, 1, 130–134. [Google Scholar] [CrossRef] [Green Version]
- Maleque, A.; Abdulmumin, A.A. Tribocorrosion behaviour of biodiesel—A review. Tribol. Online 2014, 9, 10–20. [Google Scholar] [CrossRef] [Green Version]
- Wood, R.J.K.; Bahaj, A.S.; Turnock, S.R.; Wang, L.; Evans, M. Tribological design constraints of marine renewable energy systems. Philos. Trans. R. Soc. A 2010, 368, 4807–4827. [Google Scholar] [CrossRef] [PubMed]
- López-Ortega, A.; Arana, J.L.; Bayón, R. Tribocorrosion of passive materials: A review on test procedures and standards. Int. J. Corros. 2018, 1, 1–24. [Google Scholar] [CrossRef]
- López-Ortega, A.; Bayón, R.; Pagano, F.; Igartua, A.; Arredondo, A.; Arana, J.L.; González, J.J. Tribocorrosion behaviour of mooring high strength low alloy steels in synthetic seawater. Wear 2015, 338–339, 1–10. [Google Scholar] [CrossRef]
- Sun, Y.; Rana, V. Tribocorrosion behaviour of AISI 304 stainless steel in 0.5 M NaCl solution. Mater. Chem. Phys. 2011, 129, 138–147. [Google Scholar] [CrossRef]
- Chen, J.; Zhang, Q.; Li, Q.-A.; Fu, S.-L.; Wang, J.-Z. Corrosion and tribocorrosion behaviors of AISI 316 stainless steel and Ti6Al4V alloys in artificial seawater. Trans. Nonferrous Met. Soc. China 2014, 24, 1022–1031. [Google Scholar] [CrossRef]
- Ng, C.; Guo, S.; Luan, J.; Wang, Q.; Lu, J.; Shi, S.; Liu, C.T. Phase stability and tensile properties of Co-free Al0.5CrCuFeNi2 high-entropy alloys. J. Alloys Compd. 2014, 584, 530–537. [Google Scholar] [CrossRef]
- Gorr, B.; Azim, M.; Christ, H.-J.; Mueller, T.; Schliephake, D.; Heilmaier, M. Phase equilibria, microstructure, and high temperature oxidation resistance of novel refractory high-entropy alloys. J. Alloys Compd. 2015, 624, 270–278. [Google Scholar] [CrossRef]
- Kao, Y.-F.; Chen, S.-K.; Chen, T.-J.; Chu, P.-C.; Yeh, J.-W.; Lin, S.-J. Electrical, magnetic, and Hall properties of AlxCoCrFeNi high-entropy alloys. J. Alloys Compd. 2011, 509, 1607–1614. [Google Scholar] [CrossRef]
- Wu, C.L.; Zhang, S.; Zhang, C.H.; Zhang, H.; Dong, S.Y. Phase evolution and cavitation erosion-corrosion behavior of FeCoCrAlNiTix high entropy alloy coatings on 304 stainless steel by laser surface alloying. J. Alloys Compd. 2017, 698, 761–770. [Google Scholar] [CrossRef]
- Yeh, J.-W.; Chen, S.-K.; Lin, S.-J.; Gan, J.-Y.; Chin, T.-S.; Shun, T.-T.; Tsau, C.-H.; Chang, S.-Y. Nanostructured high-entropy alloys with multiple principal elements: Novel alloy design concepts and outcomes. Adv. Eng. Mater. 2004, 6, 299–303. [Google Scholar] [CrossRef]
- Yeh, J.-W.; Lin, S.-J.; Chin, T.-S.; Gan, J.-Y.; Chen, S.-K.; Shun, T.-T.; Tsau, C.-H.; Chou, S.-Y. Formation of simple crystal structures in Cu-Co-Ni-Cr-Al-Fe-Ti-V alloys with multiprincipal metallic elements. Metall. Mater. Trans. A 2004, 35, 2533–2536. [Google Scholar] [CrossRef]
- Jiang, S.; Lin, Z.; Xu, H.; Sun, Y. Studies on the microstructure and properties of AlxCoCrFeNiTi1−x high entropy alloys. J. Alloys Compd. 2018, 741, 826–833. [Google Scholar] [CrossRef]
- Argade, G.R.; Joshi, S.S.; Ayyagari, A.V.; Mukherjee, S.; Mishra, R.S.; Dahotre, N.B. Tribocorrosion performance of laser additively processed high-entropy alloy coatings on aluminium. Appl. Phys. A 2019, 125, 1–9. [Google Scholar] [CrossRef]
- Muangtong, P.; Rodchanarowan, A.; Chaysuwan, D.; Chanlek, N.; Goodall, R. The corrosion behaviour of CoCrFeNi-x (x = Cu, Al, Sn) high entropy alloy systems in chloride solution. Corros. Sci. 2020, 172, 1–11. [Google Scholar] [CrossRef]
- Butler, T.M.; Weaver, M.L. Oxidation behavior of arc melted AlCoCrFeNi multi-component high-entropy alloys. J. Alloys Compd. 2016, 674, 229–244. [Google Scholar] [CrossRef]
- Munitz, A.; Salhov, S.; Hayun, S.; Frage, N. Heat treatment impacts the micro-structure and mechanical properties of AlCoCrFeNi high entropy alloy. J. Alloys Compd. 2016, 683, 221–230. [Google Scholar] [CrossRef]
- Hutchings, I.; Shipway, P. Tribology: Friction and Wear of Engineering Materials, 2nd ed.; ButterWorth-Heinemann: Oxford, UK, 1992; pp. 114–118. [Google Scholar]
- Muñoz, A.I.; Espallargas, N. 5—Tribocorrosion mechanisms in sliding contacts. In Tribocorrosion of Passive Metals and Coatings, 1st ed.; Landolt, D., Mischler, S., Eds.; Woodhead Publishing: Cambridge, UK, 2011; pp. 118–152. [Google Scholar] [CrossRef]
- Namus, R.; Rainforth, W.M. Influence of protein adsorption on tribocorrosion behaviour of CoCrMo biomedical-grade alloys. Tribol. Int. 2020, 150, 1–9. [Google Scholar] [CrossRef]
- Espallargas, N.; Johnsen, R.; Torres, C.; Muñoz, A.I. A new experimental technique for quantifying the galvanic coupling effects on stainless steel during tribocorrosion under equilibrium conditions. Wear 2013, 307, 190–197. [Google Scholar] [CrossRef] [Green Version]
- Vieira, A.C.; Rocha, L.A.; Papageorgiou, N.; Mischler, S. Mechanical and electrochemical deterioration mechanisms in the tribocorrosion of Al alloys in NaCl and in NaNO3 solutions. Corros. Sci. 2012, 54, 26–35. [Google Scholar] [CrossRef] [Green Version]
- Papageorgiou, N.; Mischler, S. Electrochemical simulation of the current and potential response in sliding tribocorrosion. Tribol. Lett. 2012, 48, 271–283. [Google Scholar] [CrossRef]
- Mischler, S. Sliding tribo-corrosion of passive metals: Mechanisms and modeling. In Tribo-Corrosion: Research, Testing, and Applications; Blau, P., Celis, J., Drees, D., Franek, F., Eds.; ASTM International: West Conshohocken, PA, USA, 2013; pp. 1–18. [Google Scholar]
- Takeuchi, A.; Inoue, A. Classification of bulk metallic glasses by atomic size difference, heat of mixing and period of constituent elements and its application to characterization of the main alloying element. Mater. Trans. 2005, 46, 2817–2829. [Google Scholar] [CrossRef] [Green Version]
- Cornide, J.; Calvo-Dahlborg, M.; Chambreland, S.; Asensio Dominguez, L.; Leong, Z.; Dahlborg, U.; Cunliffe, A.; Goodall, R.; Todd, I. Combined atom probe tomography and TEM investigations of CoCrFeNi, CoCrFeNi-Pdx (x = 0.5, 1.0, 1.5) and CoCrFeNi-Sn. Acta Phys. Pol. A 2015, 128, 557–560. [Google Scholar] [CrossRef]
- Liu, L.; Zhu, J.B.; Zhang, C.; Li, J.C.; Jiang, Q. Microstructure and the properties of FeCoCuNiSnx high entropy alloys. Mater. Sci. Eng. A 2012, 548, 64–68. [Google Scholar] [CrossRef]
- Wang, B.; He, H.; Naeem, M.; Lan, S.; Harjo, S.; Kawasaki, T.; Nie, Y.; Kui, H.W.; Ungár, T.; Ma, D.; et al. Deformation of CoCrFeNi high entropy alloy at large strain. Scr. Mater. 2018, 155, 54–57. [Google Scholar] [CrossRef]
- Zaddach, A.J.; Niu, C.; Koch, C.C.; Irving, D.L. Mechanical properties and stacking fault energies of NiFeCrCoMn high-entropy alloy. JOM 2013, 65, 1780–1789. [Google Scholar] [CrossRef]
- He, F.; Wang, Z.; Han, B.; Wu, Q.; Chen, D.; Li, J.; Wang, J.; Liu, C.T.; Kai, J.J. Solid solubility, precipitates, and stacking fault energy of microalloyed CoCrFeNi high entropy alloys. J. Alloys Compd. 2018, 769, 490–502. [Google Scholar] [CrossRef]
- Rosoiu, S.P.; Pantazi, A.G.; Petica, A.; Cojocaru, A.; Costovici, S.; Zanella, C.; Visan, T.; Anicai, L.; Enachescu, M. Comparative study of Ni-Sn alloys electrodeposited from choline chloride-based ionic liquids in direct and pulsed current. Coatings 2019, 9, 801. [Google Scholar] [CrossRef] [Green Version]
- Chen, Z.; He, M.; Balakrisnan, B.; Chum, C.C. Elasticity modulus, hardness and fracture toughness of Ni3Sn4 intermetallic thin films. Mater. Sci. Eng. A 2006, 423, 107–110. [Google Scholar] [CrossRef]
- Kocijan, A.; Milošev, I.; Merl, D.K.; Pihlar, B. Electrochemical study of Co-based alloys in simulated physiological solution. J. Appl. Electrochem. 2004, 34, 517–524. [Google Scholar] [CrossRef]
- Vidal, C.V.; Muñoz, A.I. Effect of thermal treatment and applied potential on the electrochemical behaviour of CoCrMo biomedical alloy. Electrochim. Acta 2009, 54, 1798–1809. [Google Scholar] [CrossRef]
- Namus, R.; Nutter, J.; Qi, J.; Rainforth, W.M. The influence of protein concentration, temperature and cathodic polarization on the surface status of CoCrMo biomedical grade alloys. Appl. Surf. Sci. 2020, 499, 1–13. [Google Scholar] [CrossRef]
Figure 1.
High entropy alloys (HEA) sample preparation for corrosion and tribocorrosion analysis.

Figure 2.
BSE-SEM micrographs showing EDS spots of as-cast HEA samples; (a) CrFeCoNi and (b) CrFeCoNiSn.
Figure 2.
BSE-SEM micrographs showing EDS spots of as-cast HEA samples; (a) CrFeCoNi and (b) CrFeCoNiSn.

Figure 3.
Hardness of CrFeCoNi and CrFeCoNiSn alloys at HV0.5.

Figure 4.
SE-SEM micrographs of HEA indents; (a) CrFeCoNi and (b) CrFeCoNiSn alloys.

Figure 5.
The potentiodynamic curves of CrFeCoNi and CrFeCoNiSn alloys in 0.6 M NaCl solution at ambient temperature.
Figure 5.
The potentiodynamic curves of CrFeCoNi and CrFeCoNiSn alloys in 0.6 M NaCl solution at ambient temperature.

Figure 6.
The Nyquist plots of CrFeCoNi and CrFeCoNiSn alloys in 0.6 M NaCl solution at ambient temperature.
Figure 6.
The Nyquist plots of CrFeCoNi and CrFeCoNiSn alloys in 0.6 M NaCl solution at ambient temperature.

Figure 7.
(a) The Bode plots and (b) Bode phase plots of CrFeCoNi and CrFeCoNiSn alloys in 0.6 M NaCl solution at ambient temperature.
Figure 7.
(a) The Bode plots and (b) Bode phase plots of CrFeCoNi and CrFeCoNiSn alloys in 0.6 M NaCl solution at ambient temperature.

Figure 8.
The equivalent circuit model of HEAs for fitting in 0.6 M NaCl solution at ambient temperature.
Figure 8.
The equivalent circuit model of HEAs for fitting in 0.6 M NaCl solution at ambient temperature.

Figure 9.
Sliding potential for CrFeCoNi and CrFeCoNiSn alloys tested in 0.6 M NaCl solution at ambient temperature.
Figure 9.
Sliding potential for CrFeCoNi and CrFeCoNiSn alloys tested in 0.6 M NaCl solution at ambient temperature.

Figure 10.
Cathodic current flowing in tribocorrosion testing for CrFeCoNi and CrFeCoNiSn alloys tested in 0.6 M NaCl solution at ambient temperature.
Figure 10.
Cathodic current flowing in tribocorrosion testing for CrFeCoNi and CrFeCoNiSn alloys tested in 0.6 M NaCl solution at ambient temperature.

Figure 11.
Tribocorrosion testing parameters for CrFeCoNi and CrFeCoNiSn tested in 0.6 M NaCl solution at ambient temperature.
Figure 11.
Tribocorrosion testing parameters for CrFeCoNi and CrFeCoNiSn tested in 0.6 M NaCl solution at ambient temperature.

Figure 12.
SEM micrographs showing the wear morphology after tribocorrosion testing of (a) CrFeCoNi and (b) CrFeCoNiSn.
Figure 12.
SEM micrographs showing the wear morphology after tribocorrosion testing of (a) CrFeCoNi and (b) CrFeCoNiSn.


Table 1.
The chemical compositions in atomic percent (at.%) of CrFeCoNi and CrFeCoNiSn alloys via EDS analysis determined here, and the phase composition (phase composition identification from previous research [17]).
Table 1.
The chemical compositions in atomic percent (at.%) of CrFeCoNi and CrFeCoNiSn alloys via EDS analysis determined here, and the phase composition (phase composition identification from previous research [17]).
| HEA System | Phase Composition | Chemical Composition (at.%) | ||||
|---|---|---|---|---|---|---|
| Co | Cr | Fe | Ni | Sn | ||
| CrFeCoNi | CrFeCoNi FCC | 25.4 | 25.1 | 25.2 | 24.3 | - |
| CrFeCoNiSn | Ni-Sn Hexagonal | 14.1 | 8.5 | 10.3 | 28.8 | 38.3 |
| CrFeCoNi FCC | 28.5 | 26.2 | 30.7 | 11.6 | 3.0 | |
Table 2.
The ΔHmix,<ij> values (kJ/mol) of CrFeCoNi and CrFeCoNiSn alloys data from [27].
Table 2.
The ΔHmix,<ij> values (kJ/mol) of CrFeCoNi and CrFeCoNiSn alloys data from [27].
| Elements | Co | Cr | Fe | Ni | Sn |
|---|---|---|---|---|---|
| Co | −4 | −1 | 0 | 0 | |
| Cr | −1 | −7 | 10 | ||
| Fe | −2 | 11 | |||
| Ni | −4 | ||||
| Sn |
Table 3.
The corrosion parameters, obtained via PC analysis of CrFeCoNi and CrFeCoNiSn alloys in 0.6 M NaCl solution at ambient temperature.
Table 3.
The corrosion parameters, obtained via PC analysis of CrFeCoNi and CrFeCoNiSn alloys in 0.6 M NaCl solution at ambient temperature.
| HEA System | icorr (µA/cm2) | Ecorr (mVSCE) | Ep (mVSCE) | ΔEp (mVSCE) | Rp (Ω·cm2) × 106 |
|---|---|---|---|---|---|
| CrFeCoNi | 0.05 ± 0.01 | −170.59 ± 2.35 | 320.07 ± 3.67 | 490.66 ± 6.02 | 0.53 ± 0.01 |
| CrFeCoNiSn | 0.04 ± 0.003 | −140.16 ± 43.71 | 887.47 ± 192.13 | 1027.63 ± 235.83 | 0.64 ± 0.05 |
Table 4.
EIS model parameters for CrFeCoNi and CrFeCoNiSn alloys in 0.6 M NaCl solution at ambient temperature.
Table 4.
EIS model parameters for CrFeCoNi and CrFeCoNiSn alloys in 0.6 M NaCl solution at ambient temperature.
| HEA System | Rs (Ω·cm2) | Rads (kΩ·cm2) | Qads (µF·cm−1sα − 1) | nads | Roxide (MΩ·cm2) | Qoxide (µF·cm−1sα − 1) | noxide | Chi-Sqr | Sum-Sqr |
|---|---|---|---|---|---|---|---|---|---|
| CoCrFeNi | 3.90 ± 0.45 | 1.70 ± 0.10 | 160.33 ± 36.24 | 0.98 | 0.36 ± 0.04 | 49.21 ± 4.03 | 0.89 | 0.0014 | 0.18 |
| CoCrFeNiSn | 3.35 ± 0.26 | 18.10 ± 12.36 | 126.26 ± 20.45 | 0.88 | 1.35 ± 0.18 | 37.13 ± 1.98 | 0.95 | 0.0019 | 0.23 |
Table 5.
Tribological and tribocorrosion parameters for CrFeCoNi and CrFeCoNiSn alloys tested in 0.6 M NaCl solution at ambient temperature.
Table 5.
Tribological and tribocorrosion parameters for CrFeCoNi and CrFeCoNiSn alloys tested in 0.6 M NaCl solution at ambient temperature.
| HEA System | Condition | Averaged COF | V (mm3) × 10−4 | SA (mm2) | K (mm3/N m) × 10−6 | Esliding (V) | iωt (mA/cm2) × 10−2 | W0 (mm/y) | ΔWC (mm/y) | ΔCW (mm/y) | T (mm/y) |
|---|---|---|---|---|---|---|---|---|---|---|---|
| CrFeCoNi | OCP | 0.34 ± 0.02 | 8.18 ± 0.5 | 0.48 ± 0.04 | 7.57 ± 0.4 | −0.47 | 5.6 | 0.42 ± 0.08 | 3.86 | 0.62 ± 0.03 | 4.91 ± 0.05 |
| Cathodic | 0.43 ± 0.01 | 0.26 ± 0.04 | 0.17 ± 0.02 | 0.24 ± 0.03 | |||||||
| CrFeCoNiSn | OCP | 0.31 ± 0.02 | 1.92 ± 0.1 | 0.34 ± 0.002 | 1.77 ± 0.1 | −0.46 | 1 | 0.37 ± 0.001 | 1.17 | 0.11 ± 0.01 | 1.66 ± 0.09 |
| Cathodic | 0.38 ± 0.02 | 0.16 ± 0.02 | 0.13 ± 0.01 | 0.14 ± 0.02 |
Publisher’s Note: MDPI stays neutral with regard to jurisdictional claims in published maps and institutional affiliations. |
© 2020 by the authors. Licensee MDPI, Basel, Switzerland. This article is an open access article distributed under the terms and conditions of the Creative Commons Attribution (CC BY) license (http://creativecommons.org/licenses/by/4.0/).
Share and Cite
MDPI and ACS Style
Muangtong, P.; Namus, R.M.; Goodall, R. Improved Tribocorrosion Resistance by Addition of Sn to CrFeCoNi High Entropy Alloy. Metals 2021, 11, 13. https://doi.org/10.3390/met11010013
AMA Style
Muangtong P, Namus RM, Goodall R. Improved Tribocorrosion Resistance by Addition of Sn to CrFeCoNi High Entropy Alloy. Metals. 2021; 11(1):13. https://doi.org/10.3390/met11010013
Chicago/Turabian StyleMuangtong, Piyanut, Righdan Mohsen Namus, and Russell Goodall. 2021. "Improved Tribocorrosion Resistance by Addition of Sn to CrFeCoNi High Entropy Alloy" Metals 11, no. 1: 13. https://doi.org/10.3390/met11010013
Note that from the first issue of 2016, this journal uses article numbers instead of page numbers. See further details here.