Modeling Air Aspiration in Steel Continuous Casting Slide-Gate Nozzles


1
Metallurgy Department, Swerim AB, 974 32 Luleå, Sweden
2
Department of Mechanical Engineering, Colorado School of Mines, 1610 Illinois Street, Golden, CO 80401, USA
*
Author to whom correspondence should be addressed.
Metals 2021, 11(1), 116; https://doi.org/10.3390/met11010116
Submission received: 12 December 2020
/
Revised: 2 January 2021
/
Accepted: 3 January 2021
/
Published: 8 January 2021
(This article belongs to the Special Issue Mold and Tundish Metallurgy)
Abstract
:Air aspiration is an important cause of nozzle clogging and inclusions in final products of continuous casting of steel due to the presence of metal oxides (such as alumina) which occur through the reoxidation of molten steel. This problem is most likely to occur when the flow control system (slide-gate or stopper rod) causes the pressure inside the nozzle to drop below atmospheric pressure, drawing gas into the system through possible cracks or gaps in the refractory walls. In this work, a 1-D pressure-energy model of the complete metal delivery system from the tundish to the mold is developed to predict the pressure distribution and throughput under dynamic operating conditions and varying clogging conditions. The energy balance approach includes pressure losses in the slide-gate, wall friction, and nozzle geometry variations, including the effects of multiphase flow due to argon gas injection. The model also predicts air aspiration, oxide inclusion formation, and the time for clogging shutdown. The predicted pressure distribution is verified with a three-dimensional numerical simulation of multiphase turbulent flow, and is validated with plant measurements. Parametric studies with different submerged entry nozzle (SEN) designs revealed that a smaller SEN diameter may lessen negative pressure by redistributing the pressure loss from the slide-gate to the entire nozzle through increased friction losses. Under negative pressure, a submillimeter-thin gap was shown to cause considerable air aspiration. Clogging shutdown times were evaluated for several scenarios under static and dynamic operating conditions.
1. Introduction
Air aspiration during continuous casting is very detrimental, because it generates nonmetallic inclusions through reoxidation [1,2,3]. Air aspiration is caused by negative pressure (i.e., lower than atmospheric pressure) developing near the narrow opening regulated by the flow control system (slide-gate or stopper rod system) [2,4]. A huge pressure drop occurs across the narrow opening through two mechanisms: flow acceleration and pressure loss. The flow passing through the narrow opening area of a slide-gate or stopper rod must accelerate to keep the same flow rate with a smaller cross-section area. According to Bernoulli’s principle, the accelerated flow drops in pressure as its pressure energy transforms into kinetic energy. In addition, a pressure loss occurs due to the sudden contraction and expansion of the flow control system. As the accelerated flow cannot adjust to the sudden changes of cross-section geometry due to its inertia, it causes flow separation and pressure loss by viscous dissipation of the separated flow. The total pressure drop is greatly affected by the opening area of the flow control system and other process conditions. When the pressure drop is severe, i.e., so that the gage pressure becomes negative, air aspiration may occur through any gaps or cracks in the refractory components due to the pressure difference. Naturally, the penetrated oxygen in aspirated air reacts with dissolved deoxidation elements (Al, Si, and Mn) and generates nonmetallic oxide inclusion particles such as alumina and silica [5].
The generated oxide particles either attach to the nozzle walls to cause clogging or are carried into the molten steel pool in the mold, where they may become entrapped in the solidifying steel shell as nonmetallic inclusions in the final product. The high contact angle between liquid steel and oxide particles enhances their attachment to the refractory walls, as well as agglomeration onto other oxides [6]. Recirculation zones generated by flow separation in the nozzle facilitate the deposition of oxides by offering deposit sites at the edge of the zones where velocity is lowest [7]. Recirculation zones typically form just below the slide-gate, near the aperture between stopper and nozzle wall, and at the top of the port outlet [8].
As stated, oxide particles formed due to air aspiration can lead to nozzle clogging, which is detrimental in many ways. Clogging changes the interior shape of the submerged entry nozzle (SEN) that is carefully designed to control the flow pattern in the liquid steel pool [9], so may activate various defect mechanisms [10,11]. The pressure changes which accompany clog shape changes cause throughput variations which lead to increased mold level fluctuations and surface defects [3,12]. Of course, nozzle clogging also shortens the replacement period, which increases production costs. The sudden release of clogs may cause further throughput and level fluctuation problems, and may contaminate the surface slag layer. Even worse, the released clog material may become entrapped in the solidified shell as large nonmetallic inclusions, which negatively affects the mechanical properties of the steel (i.e., strength and toughness) by causing defects such as slivers [13,14,15].
Therefore, several methods have been proposed to minimize air aspiration into the continuous casting nozzle and the accompanying reoxidation and clogging problems. One method is to surround the slide-gate region with argon gas, to be aspirated instead of air in a passive manner [16,17]. Another common method is to inject argon gas actively, typically ranging from 0–10 SLPM, (0–30% gas volume fraction), which can act in several ways. First, argon can fill recirculation zones where clogs tend to form and generate turbulence that disrupts particle adherence to the nozzle walls [1]. Argon injection may also lead to increased pressure inside the nozzle by causing the slide-gate to open further for a given molten steel throughput [3]. However, a previous model study [3] showed that the minimum argon gas flow rate needed to avoid negative pressure and aspiration in the SEN is typically very large, and excessive argon flow rates can be harmful [1,8,18,19,20]. Several patents have been proposed [21,22] to apply a sealed vacuum chamber around the slide-gate to lower the external pressure. This expensive method also needs accurate estimates of the necessary vacuum pressure to avoid aspiration, which is difficult for industrial casters. An inexpensive way to minimize air aspiration is to modify the nozzle geometry. For example, a step between the slide gate and SEN increased the minimum pressure at the recirculation zone via stagnation [2]. A better understanding of nozzle pressure distribution is needed to find and evaluate solutions to this important problem.
2. Previous Models
Several modeling efforts have been undertaken to understand the mechanism of throughput and the overall pressure distribution of continuous casting systems using computational flow models [3,8] or the Bernoulli energy-balance approach [1,4,23]. They have revealed that the inter-related effects of slide-gate opening or stopper position, throughput, tundish level, argon gas injection and nozzle geometric parameters such as the nozzle diameter are important to the pressure distribution, but more study is needed.
Previous models of air aspiration and inclusion formation are few. One model of air entrainment during open stream pouring estimated the formation of oxide inclusions based on the predicted volume of entrained air [24]. Another model used a Smoothed Particle Hydrodynamics (SPH) method to predict the amount of oxides in cast ingots during filling, based on the surface area of metal exposed to the air [25]. A study of reoxidation due to air permeation through the SEN refractory wall [26] concluded that this source of oxides is not enough to be fully responsible for nozzle clogging. However, the contribution of aspirated air through possible cracks or gaps in the refractory was not considered.
In the current article, a new 1-D pressure-energy model is developed to estimate the complete pressure distribution from the tundish to the submerged entry nozzle (SEN) in a typical slide-gate system. The model includes multiphase flow effects due to argon gas injection which have not been considered in previous 1-D models. The predicted pressure distribution is verified with results from a 3-D numerical model, and is then validated with plant measurements. This new 1-D model also predicts the flow rate of aspirated gas, the resulting reoxidation, and the time before shutdown due to the evolving nozzle clogging. Parametric studies are conducted to investigate how to minimize air aspiration and feature improved design of nozzle diameter.
3. New 1-D Pressure Energy Model
The flow in continuous casting systems is driven by gravity. The system throughput () depends on how much of the potential energy associated with the height difference between the liquid levels in the tundish and the mold level is converted into kinetic energy exiting the nozzle port outlets, relative to the pressure losses experienced during the journey. Pressure losses are governed by turbulent flow through the slide-gate opening, the nozzle design, and uncontrollable factors such as clogging. The throughput governs the casting speed for a given mold size ().
To avoid excessive throughput, most of the potential energy is consumed by pressure losses through a flow control system (slide-gate, stopper rod). However, this often creates a significant negative pressure below the flow control, where the local pressure drops below atmospheric pressure. This detrimental negative pressure enables air to aspirate through any cracks or gaps in the refractories where it combines with reactive alloying elements in the steel to form inclusions, causing clogging that limits the casting time or contaminates the steel product. In addition to quantifying how pressure losses lead to a specific throughput, it is important to understand how to combine the required pressure losses to avoid negative pressure in the system. The model presented in this work calculates the pressure distribution for a given system geometry and casting conditions based on the estimated pressure losses to achieve a targeted throughput. Then, the air aspiration rate, inclusion formation rate, and clogging rates are quantified.
3.1. Model Geometry: Slide-Gate System
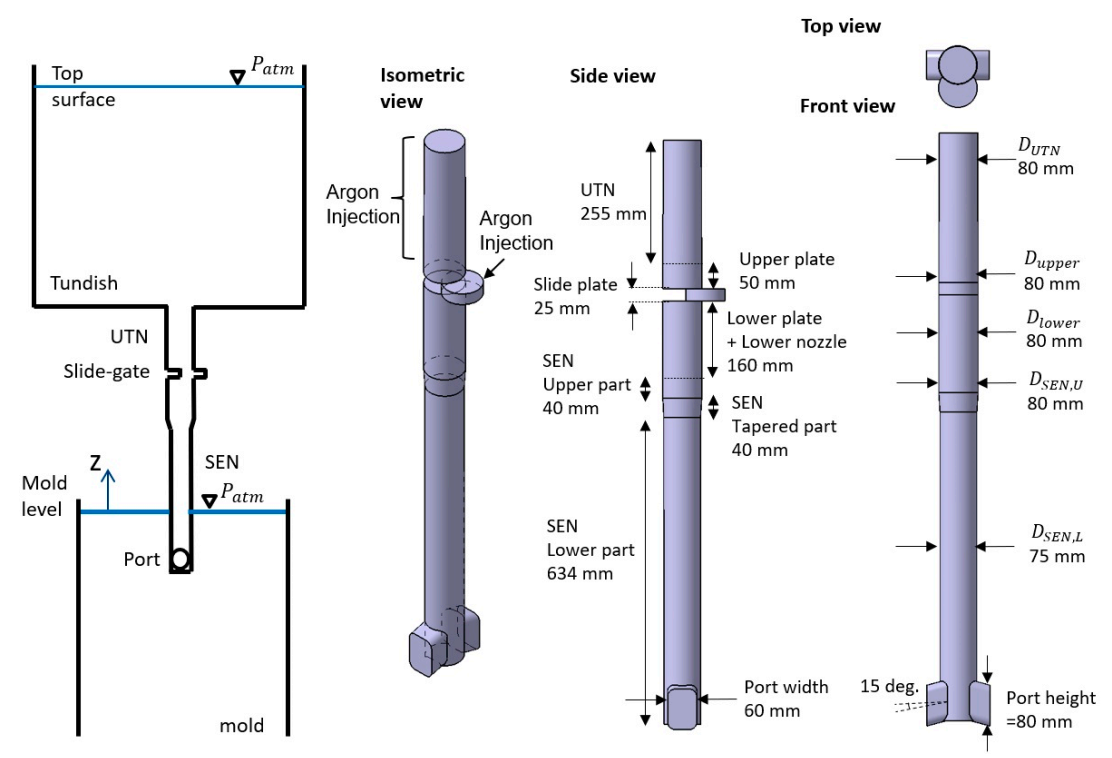
The new 1-D pressure-energy model was developed for typical continuous casting systems with a slide-gate. The model was demonstrated using the example geometry shown in Figure 1 (Baosteel 3CCM, Shanghai, China). This commercial flow-control system is composed of the tundish, Upper Tundish Nozzle (UTN), slide-gate (upper plate, slide plate, lower plate, and the lower nozzle), and SEN, with geometric details shown in Table 1. The tundish feeds two strands, so only half of its volume is considered in this work. The diameter of the UTN and lower nozzle is 80 mm, which decreases to 75 mm in the SEN through a tapered section. The SEN has a flat bottom and rectangle port outlets (60 mm by 80 mm) with 15° downward angle.
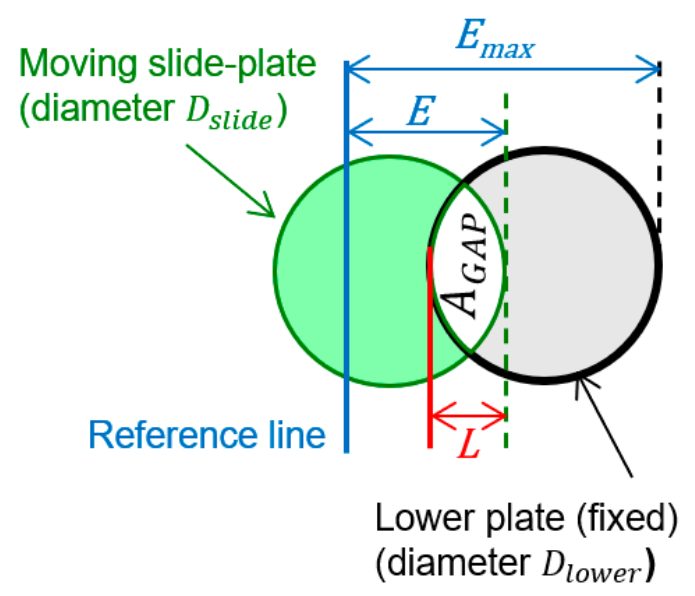
One important use of this new model is to calculate the slide-gate opening needed to achieve a given throughput in the caster. The slide-gate opening fraction, shown in Figure 2, can be defined in different ways. These include distance ratios, and , and the area fraction, which are defined as follows:
The relation between the two measures used in this work, the area-fraction, and the linear-distance-fraction, , is:
A slide-gate opening measure commonly used in the plant, , in Equation (1) is defined relative to an arbitrary reference line attached on the moving slide-plate, according to offset distances, and . This “plant opening” measure is related to the linear-distance measure of slide-gate opening by:
3.2. Model Methodology: 1-D Pressure Energy Model for Multiphase Flow
The following energy balance is applied to relate pressure energy, potential energy, kinetic energy, and pressure loss changes between any two selected points, and , located along a streamline of the flow through the tundish, nozzle and mold, as shown in Figure 3:
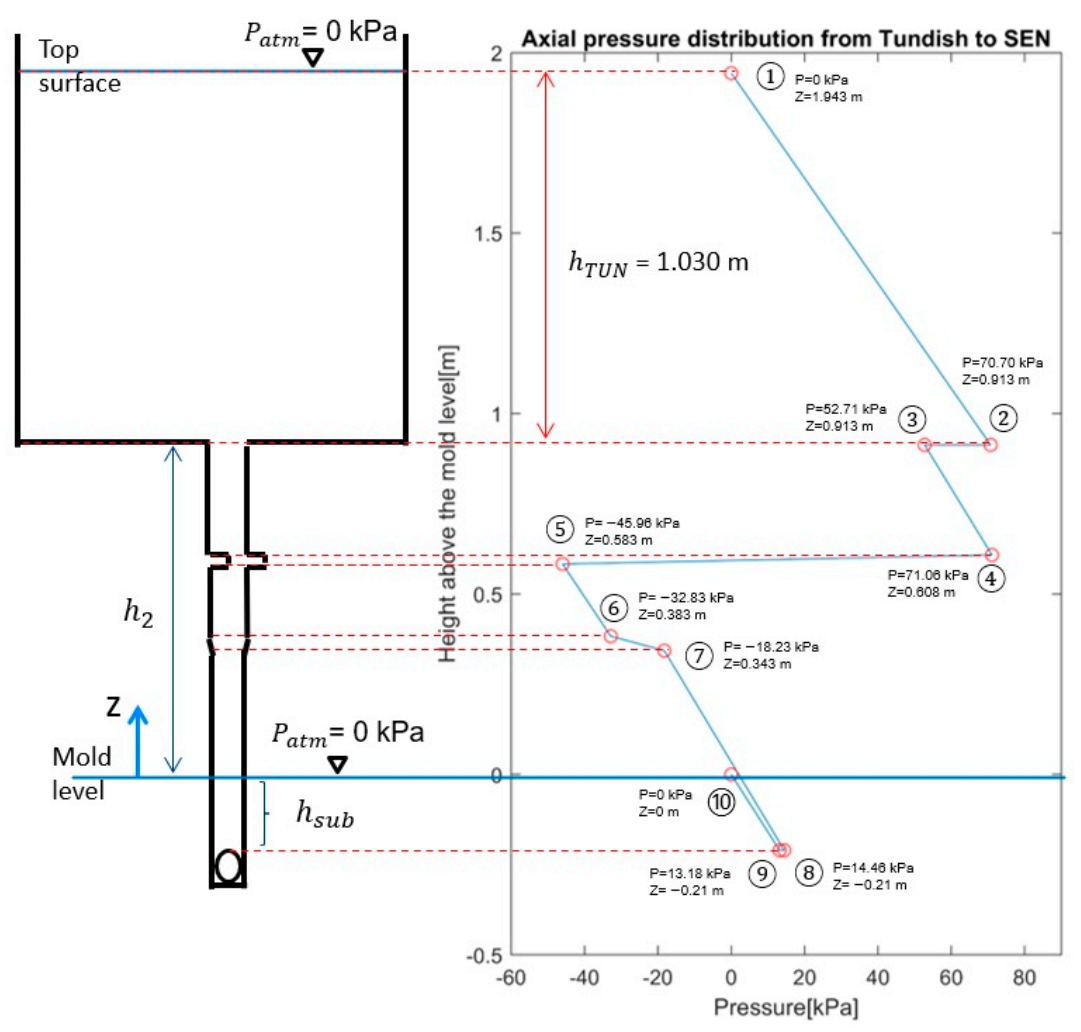
Here, the flow properties, including pressure, density and velocity, are area-averaged over the cross section, making the model one dimensional. Starting at the mold level, , where pressure is known to be 0 gauge, (1atm absolute), each successive point upstream along the streamline connecting the ten points in Figure 3 is calculated from the previous point.
In this model, the surface flow velocities at the mold level () and at the tundish surface level () are assumed to be negligible. The kinetic energy of the discharged jet from nozzle port is assumed to be dissipated in the liquid pool in the mold. The height difference between points , is easily obtained from the geometry and casting conditions. The density is a mixture density based on the volume fractions of argon and steel which is simply that of liquid steel above the argon injection point. The pressure losses are found using empirical models as discussed in Section 3.3. Molten steel velocity at point x is calculated from the throughput and effective cross-section area assuming fully developed turbulent flow (i.e., plug flow).
Further details of the effective cross-section area, throughput, and velocity calculation are discussed in Section 3.4. At several points (5, 6, and 8 in Figure 3), fully developed turbulent flow is not applicable due to flow separation that accompanies sudden expansion/contraction or change in flow direction. Velocity drop constants ( are introduced to calculate representative velocities at these points, as discussed in Section 3.4.
Applying the pressure-energy equation (Equation (4)) to the ten points in the continuous casting system shown in Figure 3 gives the following ten equations:
| Point ⑩ (mold level) | (6) | |
| Point (top of port outlet) | (7) | |
| Point (SEN, same height to Point 9) | (8) | |
| Point (SEN, outlet of tapered part) | (9) | |
| Point (SEN, inlet of tapered part) | (10) | |
| Point (just below slide-gate) | (11) | |
| Point (just above slide-gate) | (12) | |
| Point (inlet of UTN) | (13) | |
| Point (bottom of tundish) | (14) | |
| Point (tundish level) | (15) |
where:
| (16) | |
| (17) | |
| (18) | |
| (19) | |
| (20) | |
| (21) | |
| (22) | |
| (23) | |
| (24) | |
| (25) | |
| (26) | |
| (27) |
In these equations, is the pressure at point x (Pa), is the atmospheric pressure (0 Pa gauge), is the gravitational acceleration (, is the submergence depth (m), is a height difference || (m), is the liquid steel density (), is the mixture density (), is the velocity in the port (m/s), is the velocity in the submerged entry nozzle (m/s), is the pressure loss due to the change of cross-section area from SEN to port (Pa), is the pressure loss caused by the change of flow direction in the port (Pa), is the friction loss in the SEN, is the velocity at the slide-gate opening (m/s), is the friction loss in the tapered part of the nozzle (Pa), is the pressure loss caused by the contraction of nozzle cross-section area (Pa), is the friction loss in the lower nozzle (Pa), is the velocity in the upper tundish nozzle (m/s), is the friction loss in slide-gate, is the pressure loss caused by the partly open slide-gate (Pa), is the friction loss in UTN, is the pressure loss caused by the contraction of cross-section area from tundish bottom to UTN [Pa], is the pressure drop due to argon gas injection (Pa), is the throughput of liquid steel (), is the argon gas volume fraction, is the cross-section area of the SEN (m2), is the slide-gate opening area (m2), is the cross-section area of the UTN (m2), is the cross-section area of the lower nozzle (m2), is the cross-section area of the slide-gate (m2), is the cross-section area of the port outlet (m2), is the minor loss constant for the change of flow direction, is the wall friction factor at point x, is the diameter at point x, is the cross-section area of SEN (m2), is the tundish bottom area (m2), and is the loss coefficient by argon gas injection.
The calculated pressures at these ten points can be visualized as a line graph, as shown in Figure 3. Physically, the pressure at the tundish surface level (Point 1 in Figure 3) must return to atmospheric pressure (0 Pa gauge). Thus, the calculated pressure at Point 1 by Equation (15) can be used as an indicator to assess the validity of the model calculation. The minimum pressure is typically expected near the slide-gate (at Point 5, in Figure 3) due to the significant pressure drop caused by the partially opened slide-gate.
3.3. Pressure Loss Calculation
Three types of pressure loss are considered in this 1-D model: wall friction loss, minor loss, and pressure loss due to argon gas. For the wall friction loss (Equations (19), (20), (22), (23) and (25), the Darcy-Weisbach equation is applied as follows:
where is the density of the fluid, is the cross-section averaged velocity of the fluid, is the friction factor that depends on Reynolds number and relative roughness () of the wall, is the length of pipe, is the pipe diameter. The gas effect on friction losses is included by multiplying viscosity ratio by the single phase friction factor , which is obtained from the Moody diagram [27], expressed for convenience by the following expression [28]:
where is the single-phase friction factor, is the average absolute roughness (mm), is the pipe diameter (mm), and is the Reynolds number. This formula is an explicit expression of the Colebrook equation [29], which is applicable for . The should be measured from the real SEN refractory surface. This work assumes for a typical nozzle wall. Single phase friction factors for nozzle walls () are obtained with relative roughness calculations (, ) and Reynolds number (). With the , the friction factor for multiphase flow is obtained as follows [30]:
where is the multiphase friction factor, is the mixture viscosity, is the liquid steel viscosity, is the argon gas viscosity, is the gas mass fraction, is the argon gas density, is the liquid steel density, is the argon gas flow rate, is the liquid steel throughput. The viscosity ratio becomes almost 1 in low gas volume fraction conditions such as the cases considered in this study. Thus, the multiphase friction factor approximately equals the single-phase friction factor () in low gas volume fraction conditions ().
For minor losses, the pressure loss caused by change of cross-section area [31,32] ( in Equation (21) and in Equation (26)) or flow direction [33,34] ( in Equation (18)) is considered through an empirical loss coefficient . The important pressure loss caused by flow contraction at the UTN inlet (from tundish bottom to UTN top in Equation (26)) and smaller loss at the tapered part of the SEN (Equation (21)) are estimated using an empirical formula for sudden contraction from to as follows [32]:
For the most important pressure loss caused by contraction and expansion through the slide-gate, an empirical formula for a sharped edge orifice is applied [31], owing to the similar shape of the opening.
For the change of flow direction at the port outlet from 90 degrees (vertical) to −15 degrees (down), is chosen [32]. There is an additional pressure required to make argon gas flow against buoyancy when the argon gas is injected from the UTN wall. This additional pressure is modeled as a pressure loss between Points 2 and 3 with an empirical loss coefficient T. This coefficient is calculated based on the buoyancy force from injected argon.
3.4. Throughput and Velocity Calculation
Throughput of the liquid steel, , and gas volume fraction, , of the system are used to calculate the velocity at each point in the system, as given in Equations (6)–(27). Rearranging the energy conservation (Equation (4)) between Points 1 to 8, the throughput is derived as:
where is the tundish height, is the height from mold top to tundish bottom, and C is the clogging constant. Other variables were introduced in Section 3.2. The accuracy of Equation (36) is verified in Section 5 and validated in Section 6. Practically, a desired throughput is given from casting conditions in most of the cases casting speed mold outlet cross-section area). Thus, the throughput equation (Equation (36)) is usually used to obtain the required slide-gate opening for that throughput.
For accurate calculation of the gas volume fraction, it is important to consider volumetric expansion of argon gas due to pressure and temperature changes from Standard Temperature and Pressure (STP) to the conditions inside the UTN. The argon gas expansion ratio is calculated in the model based on the ideal gas law [35]:
where is the gas volume at STP, is the temperature inside the UTN, is room temperature, is the pressure inside the UTN, and is atmospheric pressure. Using this expansion ratio, the argon gas flow rate given in Standard Liter Per Minute (SLPM) is converted to the hot gas flow rate entering the UTN as follows:
Then, the average gas volume fraction is calculated by:
The calculated volume fraction is used to estimate the effective cross-section area for liquid steel flow in the nozzle, as done in a previous analytical model relating slide-gate position and throughput [36]. As the argon gas volume fraction increases, the liquid steel velocity becomes faster, because argon takes up more space in the nozzle. Thus, the area-averaged liquid steel velocity is calculated by dividing the liquid steel throughput by the effective cross-section area which is obtained by multiplying the liquid steel volume fraction by the local cross-section area, .
where and are the velocity and cross-section area at any point x.
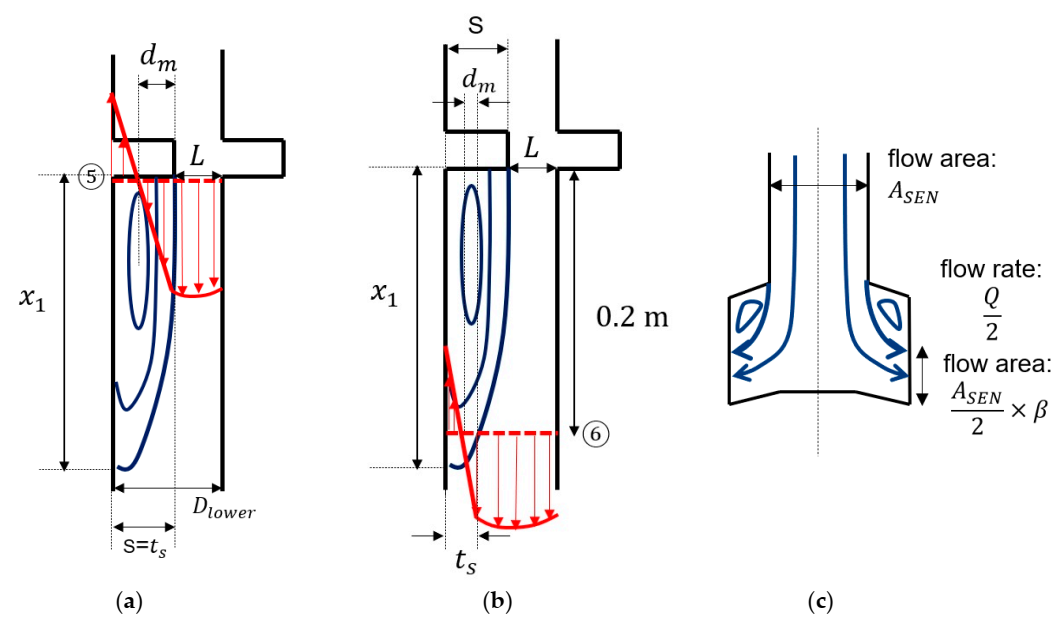
Flow velocities at most of the points are calculated by the area-averaged velocity equation (Equation (40)) except at Points 5 and 6, where flow separation is expected by sudden expansion, and at Point 8, where the flow direction changes. In the flow separation regions, the velocity field is divided into two zones: the zone with recirculating flow and the downward jet flow zone (Figure 4a).
The flow in the jet zone has a simple downward velocity profile that matches the throughput, and grows in cross-section due to momentum diffusion as it moves downstream (red arrows in the recirculation zone, Figure 4a,b). The flow in the recirculation zone has an upward component and carries no net flow. The jet penetrates into the recirculation zone as it flows downward, and ultimately consumes the recirculation zone, returning to plug flow. The new 1-D pressure-energy model considers these effects by introducing velocity drop constants and to modify the jet velocity (Equations (10)–(12)), which are explained in the next paragraphs.
The calculation of velocity drop constants and requires a momentum diffusion depth (see Figure 4a,b). This requires estimating the size of the recirculation zone below the slide-gate (length and thickness in Figure 4), which may be done by correlating experiment data for the similar system of backward-facing step flows in expanding pipes [37,38,39]. According to these measurements, the recirculation zone length in Figure 4a is independent of the Reynolds number, when the flow is turbulent and the Reynolds number exceeds 6600.
The aspect ratio of the recirculation zone ( in Figure 4a) for different expansion ratios, ER, (ratio of outlet and inlet heights, in Figure 4) was investigated in previous experiments [37]. Since the UTN diameter, the slide-gate diameter and the UTN lower diameter are the same in the given geometry (Figure 1), the expansion ratio can be expressed by ER = . Through a least square fit of experimental measurements from Armaly [37], a simple correlation between recirculation zone length , expansion step size s and slide-gate opening is obtained:
This correlation shows that the recirculation zone length increases as the slide-gate opening decreases. The momentum diffusion depth is estimated, assuming that the center of recirculation is located in the middle of the recirculation zone thickness (i.e., ). This means that half of the recirculation zone thickness has downward flow. To calculate the velocity drop constant at Point 5 (just below the slide-gate, red dot line in Figure 4a), is taken to be s, which is . Thus, the velocity drop constant is calculated from , which is based roughly on volume conservation (. Using this estimate of , the flow velocity at Point 5 becomes . Similarly, at Point 6 (in the upper SEN in Figure 4b) is calculated as , and the velocity at Point 6 becomes .
The velocity drop constant is used to consider the flow separation at the port outlet (Figure 4c). However, the momentum diffusion is very small in the given geometry (Figure 1) due to the short port length compared to port diameter. Thus, is assumed to be equal to 1 in this work, meaning that the flow velocity at the port outlet is simply equal to the velocity in the SEN, as shown in Equation (16) with .
3.5. Gas Aspiration Model
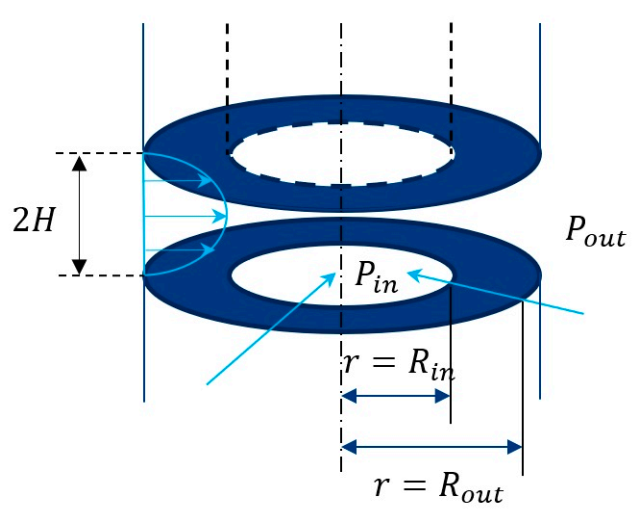
A simple model for the flow rate of gas aspired into the nozzle by the negative pressure just below the slide-gate is derived in this work by considering radial flow through the gap between two concentric disks, as shown in Figure 5.
This represents the ideal average gap between the refractory plates, and the SEN that comprises the slide-gate system. The velocity and flow rate of gas penetrating through a gap of thickness 2H due to the pressure difference is:
Details of the derivation of this analytical solution are provided in the Appendix A.
3.6. Inclusion Formation Model
Using the calculated rate of air aspiration, the reaction rate of alumina inclusion formation, is estimated. The model assumes that the aspirated gas is air containing 21% oxygen, and that all of the oxygen reacts with dissolved aluminum in the liquid steel ( according to:
The volume of clogged material is then calculated according to the fraction of inclusions entering the clog, the density of alumina and the packing factor of oxides particles in the clog [1]. This work assumes that: (1) half of the generated oxides are deposited as a clog [40], (2) the clog has a typical composition of 50% steel and 50% alumina [41]. The current model considers a typical Aluminum-killed steel, where alumina is the detrimental inclusion type found in the plant, to enable comparison with available plant measurements. Other inclusion types are easily modeled, according to the steel grade, by adjusting the coefficient according to the corresponding chemical reaction.
3.7. Dynamic Clogging Model
The models of 1-D pressure distribution, aspirated gas flow rate, and oxide reaction rate are coupled together in a transient manner to emulate the casting sequence and to predict the casting time before shutdown due to clogging under dynamic conditions. The calculation proceeds as follows:
- (1)
- calculate the required slide-gate opening to achieve a target throughput.
- (2)
- estimate the pressure distribution for these conditions.
- (3)
- calculate the air aspirated based on the local pressure difference between inside and outside of the refractory wall, (), and the thickness of a postulated gap.
- (4)
- calculate the mass of oxides formed based on the reaction rate of alumina with the aspirated oxygen.
- (5)
- deposit the alumina at the selected site of the clog and update the additional pressure loss for the new clogged geometry.
- (6)
- move to the next time step and repeat steps 1 to 5 until the slide-gate opening reaches 100% or the deposit size is fully-clogged.
This transient clogging model enables the simulation of a wide variety of realistic casting scenarios, such as increasing slide-gate opening to maintain throughput during the evolution of clogging, decreasing tundish level during a ladle exchange, and so on.
4. 3-D Computational Model of Nozzle Flow and Pressure
A 3-D numerical model of multiphase turbulent flow is developed to verify the new 1-D pressure-energy model. The computational model solves the 3-D Navier-Stokes equations for mass and momentum conservation, using the standard model [42] for turbulent flow. A modified wall function is applied to model the roughness of the nozzle wall, assuming a typical average absolute roughness height . Wall friction increases greatly if the roughness height is greater than the viscous sublayer [43]. Flow experiments [44] revealed that the viscous sublayer becomes negligible on rough walls due to interference by the rough surface. Therefore, the intercept of the log relation in the standard wall function is adjusted via a term in the model based on the roughness . The corrected flow velocity in the boundary layer is calculated as follows [43]:
where is the nondimensional velocity (), is Karman’s constant (), [45], is the friction velocity, is the kinematic viscosity, and is the nondimensional average roughness height ().
An Eulerian-Eulerian model is applied to model the multiphase flow due to argon gas injection into the molten steel. This model solves a separate continuity equation (Equations (47) and (48)) and set of momentum equations (Equations (49)–(51)) for each of these phases:
where is the volume fraction, subscript is the liquid phase, subscript is the gas phase, is time, is density, is the fluid velocity vector field, is the pressure field, is viscosity, is gravity, is the drag force, is the drag coefficient, and is the average bubble diameter. The drag coefficient depends on the bubble characteristics and flow regime. Here, a bubbly flow is assumed with a bubble diameter . The same geometry shown in Figure 1 is considered for the 3-D numerical simulation. A constant mass flow rate boundary condition is applied at the inlet of the UTN and where the argon gas is injected in two places: the UTN side wall and upper plate of the slide-gate. A no-slip boundary condition with the modified wall function (Equations (45) and (46)) is applied to simulate the friction loss at the nozzle wall. A constant pressure boundary condition is applied at the nozzle ports, according to the ferrostatic pressure at the given submergence depth. The equations are solved using ANSYS-Fluent (version 14.5) with a mesh of 0.23 million hexahedral cells (2.5 mm cubic cells) for the 3D model calculation.
5. 1-D Model Verification with 3-D Computational Model
The 1-D pressure-energy model is applied to simulate a commercial slide-gate flow-control system without clogging and compared with results of the 3-D numerical simulation in order to verify the new model. Details of the system geometry are given in Table 1. Operating conditions and material properties are provided in Table 2, based on plant measurements discussed in the next section.
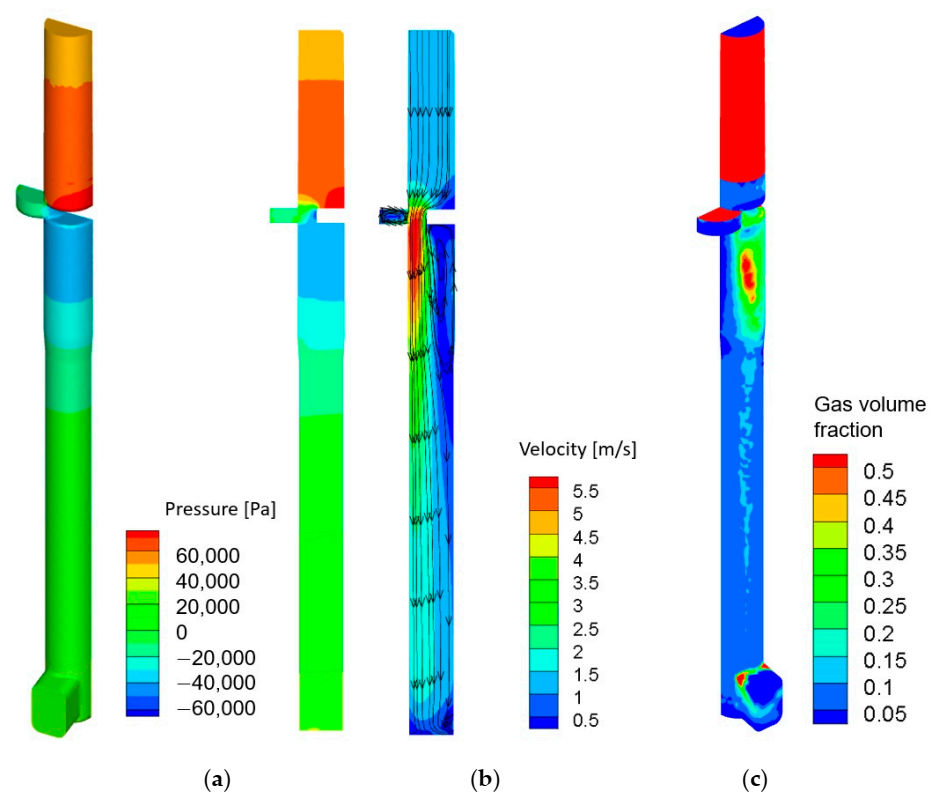
Figure 6 shows the distributions of pressure, velocity, and gas volume fraction in the nozzle from the 3-D numerical simulation of this case. As expected, a huge pressure drop occurs just below the slide-gate, as shown in Figure 6a, as pressure decreases from the maximum to minimum. Also, a large recirculation zone develops below the closed side of slide-gate, as shown in Figure 6b. The thickness of the recirculation zone decreases with distance below the slide-gate, due to momentum diffusion, as discussed previously regarding Figure 4. The gas volume fraction in the nozzle (Figure 6c) shows that the injected argon gas from the UTN wall and the upper plate of slide-gate accumulates in the recirculation zone developed below the slide-gate where the minimum pressure is observed.
To compare the 1-D and 3-D models, both models are run for the same throughput. For the 1-D model, the slide-gate opening is output, given all other conditions, including the tundish height. For the 3-D model, flow in the tundish is not included, so the slide-gate opening is fixed and the tundish level is estimated from the calculated pressure result at the UTN inlet by:
This relation is found by rearranging Equations (14) and (15) based on the ferrostatic pressure between the tundish top and bottom (Points 1 and 2), and the pressure loss between Points 2 and 3, taken from the 1-D model ( and ). From the calculated inlet pressure ( kPa) and velocity () by the 3-D model, the calculated tundish height is 995 mm, which has only 3.4% of error compared to the plant data (1030 mm).
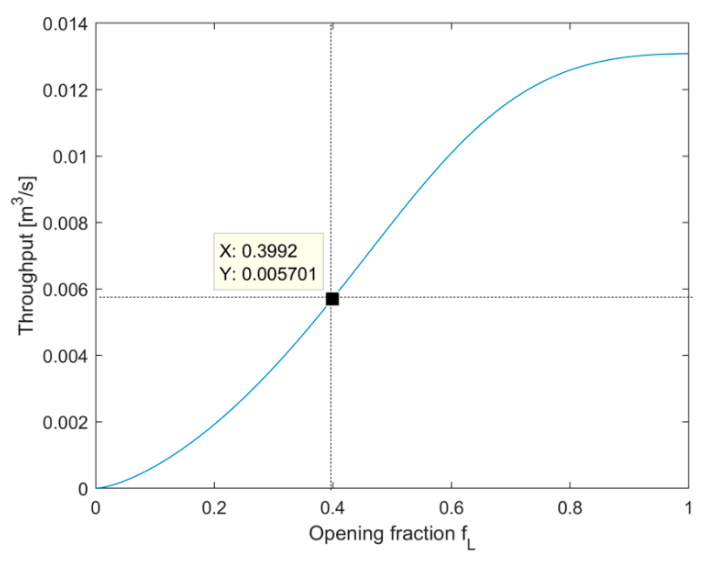
The results from the 1-D pressure-energy model in Figure 7 show the predicted relation between throughput Q and slide-gate opening for this case. A classic S-shape curve is predicted. This curve includes the throughput for this case of , where the predicted slide-gate opening is , which agrees well with the slide-gate opening from the 3-D simulation and from the plant data of %.
The predicted pressure distribution from the 1-D model for this case () is shown in Figure 8. The calculated points are connected by straight lines. The tundish and mold liquid levels, Points 1 and 10, are at atmospheric pressure of zero. Pressure increases linearly, going down from Point 1 to the tundish bottom (Point 2) due to the ferrostatic pressure. At the UTN inlet (Point 3), pressure drops for two reasons: the sudden decrease of cross-section area from the half of tundish bottom area to the UTN cross-section area, and the pressure loss caused by argon gas injection. Moving down the UTN to Point 4, the pressure drops due to wall friction losses, but the increase due to ferostatic pressure is larger, so the combined effect is a linear increase in pressure. Across the partly-open slide-gate (Points 4 to 5), the huge pressure losses of the complex flow path cause a drop into negative pressure. This may cause air aspiration if there is a gap or crack near Point 5. As flow separation arises in the lower nozzle and upper part of the SEN due to the sudden expansion from the slide-gate opening, pressure increases to Point 6 according to the velocity drop, governed by constants and with ferrostatic pressure build-up.
The pressure increases even more through the contracted joint region to Point 7, due to the velocity drop from to and the continuing growth of ferrostatic pressure. The pressure loss due to the geometry contraction is small compared to these two effects. The pressure continues to increase down the lower part of the SEN to Point 8, because the pressure build-up by ferrostatic pressure exceeds the pressure loss by wall friction. Friction loss in this region is slightly larger than inside the UTN because downward velocity through the SEN () is higher according to the smaller cross-section area. Across the nozzle ports (Points 8–9), a small pressure drop occurs, due to the change of flow direction. Point 9 is at ferrostatic pressure based on the submergence depth. From there, the pressure increases back to zero, i.e., atmospheric pressure, at the mold level (Point 10).
Table 3 compares results from the 1-D model, the 3-D model, and the plant data. Recall that the slide-gate opening is the output from the 1-D model, but the tundish level is a calculated result from the 3-D model. The results in Table 3 show that both models agree reasonably with each other. They also match with the plant data, as shown in the next section.
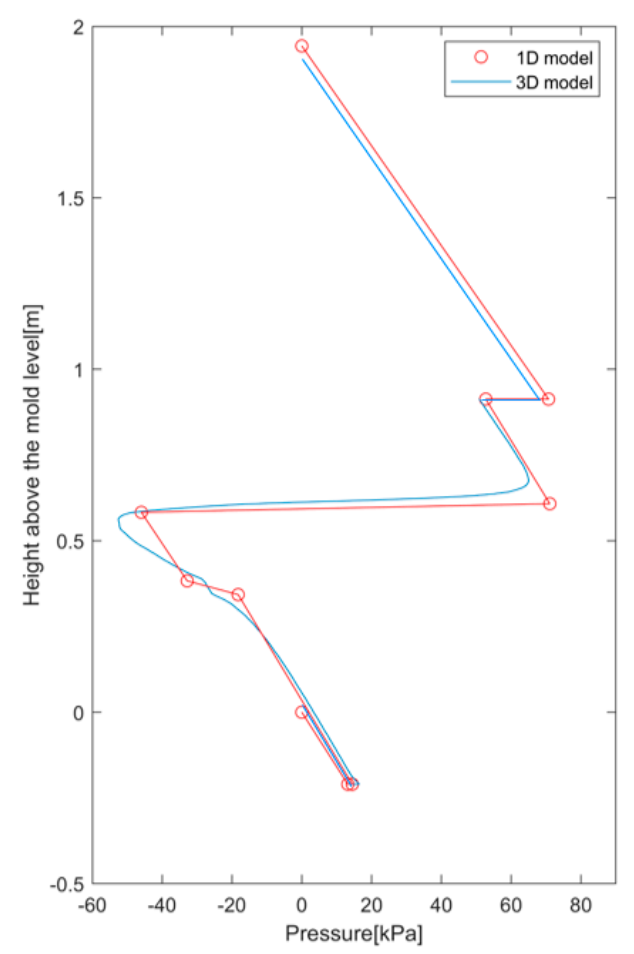
The pressure distributions from the 1-D and 3-D models are compared in Figure 9.
The straight lines connecting 10 pressure points from the 1-D model reasonably approximate the continuous pressure distribution curve from the 3-D model. This demonstrates that the 1-D pressure-energy model is reasonably accurate and can be used as an alternative to the full 3-D computational model for pressure. These results also confirm that the casting conditions in this case are likely to induce air aspiration, due to the negative pressure just below the slide-gate.
6. Model Validation with Plant Measurements
The verified 1-D pressure-energy model was applied to simulate 12 different sets of casting conditions where plant measurements were available. These conditions included the verification case presented in the previous section as Case 1. The throughput equation (Equation (36)) was used to estimate the slide-gate opening .
Table 4 presents the casting conditions and the predicted slide-gate opening fractions, for the 12 cases. The last two columns of this table show the actual slide-gate opening and the qualitative condition of nozzle clogging observed after casting. The predicted opening fraction compares reasonably with the actual plant gate opening, if the clogging condition is considered. Agreement is expected to be best without clogging because the model assumes no clogging (i.e., C = 0 in Equation (36)). The predictions match the plant measurements within ~2% for all of the nonclogged cases, except for Case 6. The predictions match exactly for Cases 1 and 2.
For the cases where clogging was observed, the plant gate opening was consistently larger than the prediction, as expected to accommodate the clogging while maintaining the casting speed. The difference was naturally greatest for the three cases with severe clogging, where the measured gate opening was about 25% larger than predicted. For the three cases with nonsevere clogging (Cases 7–9), the results were inconsistent, with one case having larger opening, one case having smaller opening, and one case the same. This is consistent with previous results that mild clogging may either accelerate or decrease the throughput, depending on the shape of the clog [3].
These results suggest that the new model can reasonably predict the throughput and pressure relation in real commercial operations. Moreover, the model can predict severe clogging by monitoring the value of C, thereby enabling the model prediction to match the measured slide-gate opening. Caution is required for conditions with mild clogging, however, where data is limited, as the effect is not consistent and further study is needed.
7. Parametric Studies
The verified and validated 1-D pressure-energy model is applied in this section to investigate the effects of lower SEN diameter, overall nozzle diameter, SEN submergence depth, and tundish level on pressure distribution in the system. Attention is focused on negative pressure just below the slide-gate that could lead to air aspiration, reoxidation, and nozzle clogging, which is predicted in the following section.
7.1. Effect of SEN Lower Diameter
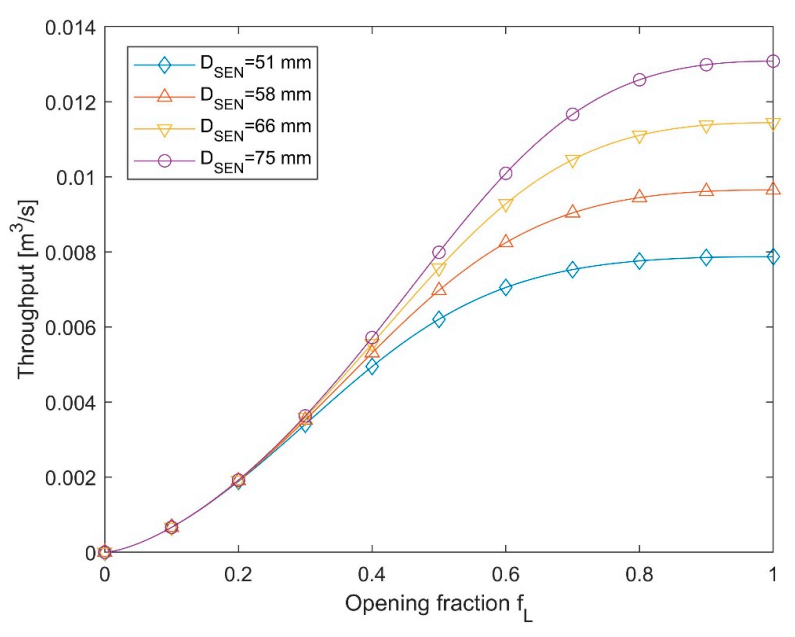
In the first parametric study, four different SEN lower part diameters are tested ( 51, 58, 66 and 75 mm) to understand the effect of SEN diameter on the pressure distribution. All other geometry and operating conditions are from the original case (Case 1 where 75 mm). First, a new slide-gate opening is calculated for each case using the throughput equation (Equation (36)), to keep the same throughput Q = 0.0057 . Figure 10 shows the relationship between throughput and slide-gate opening for each lower-SEN diameter.
Naturally, a larger slide-gate opening is required to maintain throughput as the diameter decreases. The difference between curves increases as the slide-gate opens. The maximum throughput achievable drops greatly as lower-SEN diameter decreases.
Table 5 gives the calculated slide-gate opening and friction factor for each case in this study. Decreasing is seen to increase the slide-gate opening for the same throughput Q as expected; In addition, the flow velocity increases, which increases the wall friction loss in SEN (i.e., ). Because the total pressure loss required for the same throughput does not change regardless of , the increase of wall friction loss leads to less pressure loss through the slide-gate. Thus, the slide-gate opens more, and the pressure loss is distributed as wall friction loss in the entire SEN.
The calculated pressure distributions in Figure 11 clearly show this redistribution of pressure loss.
Specifically, as decreases, the slope of the line for the lower SEN portion of the graph becomes steeper due to the increase of wall friction loss. More importantly, the negative pressure just below the slide-gate increases as decreases. Case C ( mm) does not show negative pressure anymore in the system. Thus, decreasing SEN diameter should be beneficial to mitigate negative pressure at the slide-gate by increasing the slide-gate opening and redistributing the pressure drop into the wall friction loss in the lower SEN.
7.2. Effect of Overall Nozzle Diameter
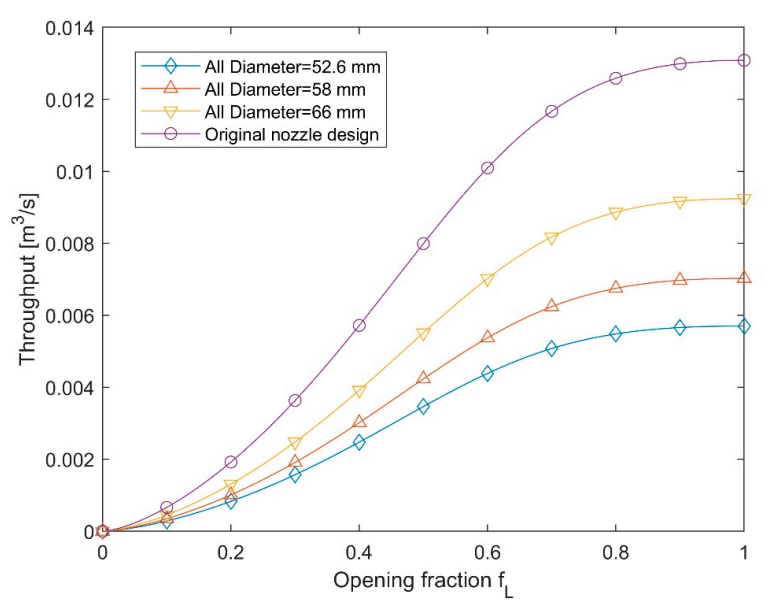
In the second parametric study, all diameters in the nozzle are fixed to be the same and changed together (i.e., a straight vertical pipe). Four different diameters (52.6, 58, 66, 75 mm) are evaluated, based on Case 1. Again, the first step is to calculate the slide-gate opening for each case using the throughput equation (Equation (36)) to maintain constant throughput. Figure 12 shows the relationship between throughput and slide-gate opening for each nozzle diameter. Table 6 gives the calculated slide-gate opening and friction factor for each case. The same trends found in the first parametric study were observed, i.e., decreasing the nozzle diameter increases the slide-gate opening. However, the difference between cases is much greater.
The pressure distributions for each case are shown in Figure 13. As in the first study, decreasing nozzle diameter decreases the pressure drop in the slide-gate and increases the slopes of the pressure plot inside the nozzles. Differing from the first study, decreasing all nozzle diameters together causes the pressure loss at the UTN inlet (, Equation (26)) to dominate the total pressure loss. As the pressure loss by the sudden contraction between the tundish and the UTN increases with decreasing diameter, the minor loss at the UTN inlet increases, which enables increased slide-gate opening to alleviate the negative pressure at the slide-gate. However, the effect is not as large as in the first parametric study, in spite of the greater increase of slide-gate opening . Even with a fully-opened slide-gate, case F (), negative pressure still develops, inside the UTN in this case. Therefore, this parametric study shows that decreasing nozzle diameter does not always mitigate the negative pressure occurring near the slide-gate. Careful design of the different nozzle diameters is required to evenly distribute the pressure loss to the occurrence of avoid negative pressure in the system.
7.3. Effect of Submergence Depth and Tundish Level
In the third parametric study, the influence of submergence depth and tundish level on the pressure distribution was investigated. As discussed in Section 3, the potential energy generated by the height difference between tundish surface level and mold level is the driving force for flow in the system, which governs the total energy input. Therefore, the submergence depth and tundish level directly control the potential energy according to their height difference. Table 7 shows the predicted slide-gate opening for different submergence depths. As submergence depth increases, the tundish must be lowered, which decreases the potential energy of the height difference. Thus, less pressure loss is required to gain the same throughput. Consequently, the slide-gate opening increases with the deeper submergence depth.
Figure 14 shows the pressure distribution for the different submergence depths. Deeper submergence depth is shown to slightly alleviate the negative pressure in the nozzle. This is due to the smaller pressure loss at the slide-gate enabling a larger slide-gate opening at deeper submergence.
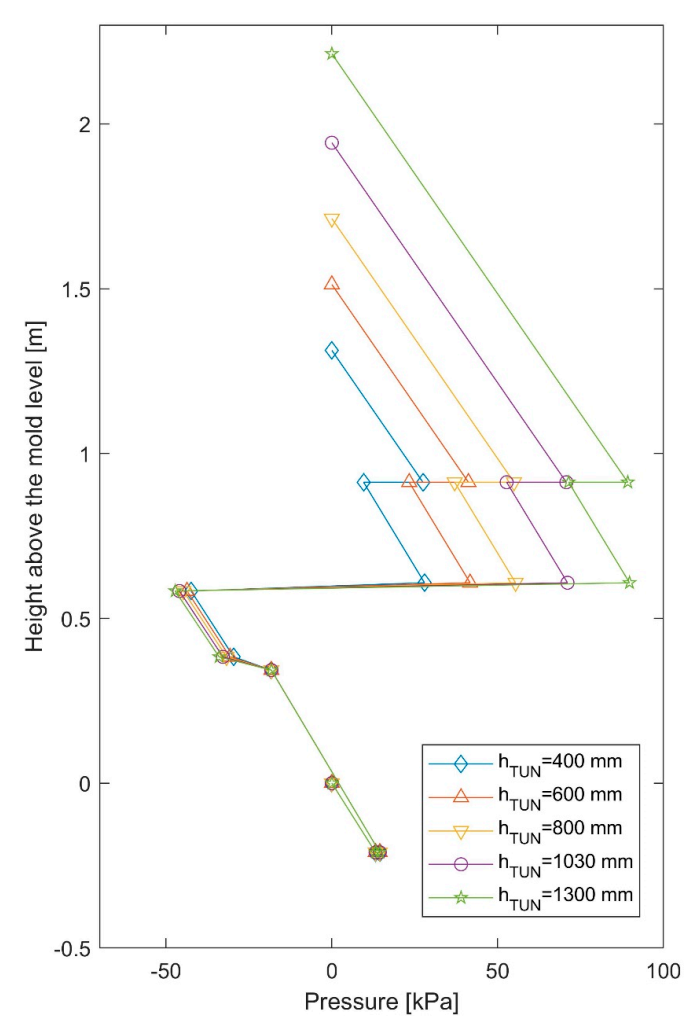
The tundish level has the same effect as submergence depth. The effect of tundish level on slide-gate opening is shown in Table 8, for a constant throughput. Lowering tundish level means less potential energy input, so less pressure loss is required to maintain the throughput. Therefore, the slide-gate opens more as the tundish level drops.
The calculated axial pressure distribution with the different tundish levels is shown in Figure 15.
Interestingly, the tundish level has little effect on the negative pressure near the slide-gate, relative to the submergence depth. The minimum pressure in the system, found just below the slide-gate, is about the same, regardless of slide-gate opening and tundish level. Clearly, the submergence depth has more influence than the tundish level on the negative pressure developing near the slide-gate although both affect the height difference that controls the potential energy driving force.
8. Estimation of Air Aspiration, Reoxidation, and Transient Clogging
8.1. Estimation of Aspirated Gas Flow Rate and Reaction Rate of Generated Alumina
The new 1-D pressure-energy is coupled with the analytical solution for aspirated air flow rate (Equation (43)) and generated oxides (Equation (44)), and applied to estimate the clogging shutdown time. The nozzle designs used in Parametric studies 1 and 2 are considered in the calculations. Also, it is assumed that the air aspiration is assumed to occur through a thin gap between the refractory plates just below the slide-gate. The calculated pressure at Point 5 (in Figure 11 and Figure 13) is used to calculate air flow through this gap ( in Equation (43)). Figure 16 shows the rates of aspirated gas flow and alumina formation reaction, for the different nozzle diameters investigated in the first two parametric studies (SEN lower diameter and overall diameter), for three gap sizes, of thickness 2H of 100, 150, and 180 microns.
All of the results show that even very thin, submillimeter sized gaps, such as those caused by sealing tolerance problems, are critical to the process because they cause huge aspiration problems. For example, a 150-micron gap causes ~17 SLPM of aspirated gas flow for Case 1 (Point 5), which has a pressure difference of ~46 kPa. The oxygen in the aspirated air will all react with the most reactive elements in the steel to form inclusions. For Al-killed steel, which contains available dissolved aluminum, this will generate ~10 grams of alumina per minute (or 0.6 kg/h). This rate will build up 1.1 mm thickness of clogging per hour on the entire SEN wall, assuming that 50% of the inclusions attach to the walls [40] and that the clog consists of 50% alumina and 50% steel [41]. This represents up to 30% of the typical clogging rate observed in commercial operations [26]. Note that the aspirated gas flow rate (Equation (42)) increases with the cube of the gap size, so large gaps will cause severe clogging and quality problems very quickly.
The results in Figure 16 also show that decreasing nozzle diameter below a threshold size can lessen the aspirated gas flow rate and corresponding alumina formation. In particular, decreasing the SEN lower diameter is a better solution than decreasing the overall nozzle diameter.
8.2. Static and Dynamic Estimation of Clogging Shutdown Time
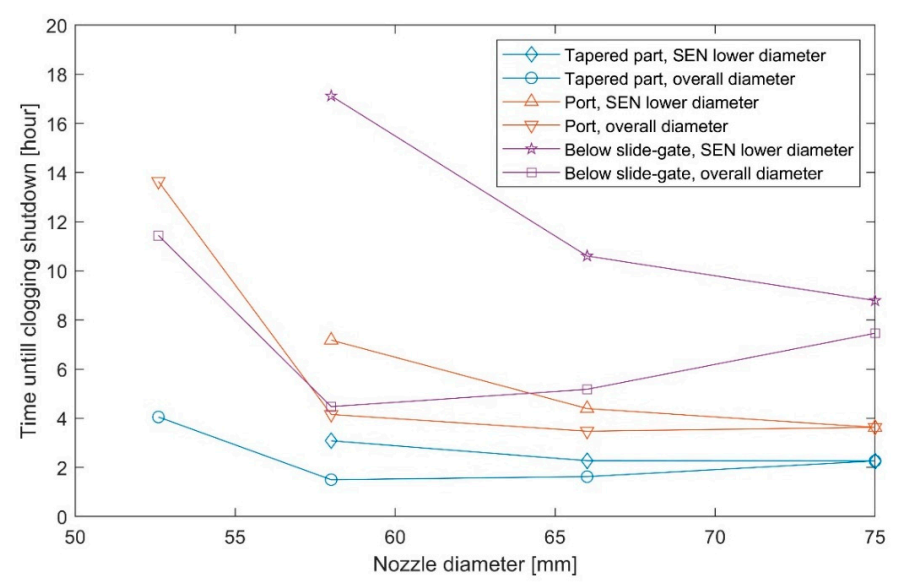
Based on the estimated inclusion buildup rate, the time before shutdown due to clogging is calculated to evaluate the lifespan of different SEN designs. For the growth mechanism of clogging, it is assumed that half of the generated oxides are deposited on the nozzle wall, and that the clog composition is half alumina and half steel. The time to fully-clog the nozzle (i.e., to fill the cross-section with oxides) is first estimated for the different nozzle diameters under constant operating conditions, based on the constant reaction rate for a 150 microns gap thickness.
The results for clogging time are presented in Figure 17 at three different locations down the nozzle (below the slide-gate [3], the tapered part [46], and the nozzle port [9]). The surface area of these deposit sites is based on the size of the recirculation zones, which the clog is assumed to gradually fill, except in the tapered part, where the surface area is taken as the nozzle wall area. Figure 17 shows that decreasing the nozzle diameter does not shorten the time to complete nozzle clogging if air aspiration is the only inclusion source. The clogging time is extended because the negative pressure decreases. Also, as expected, it is better to decrease only the lower-SEN diameter instead of the diameter of all nozzles in the system.
Finally, a transient model of clogging shutdown time (the smaller of time to fully-open slide-gate and time to fully-clogged cross-section area) is applied to simulate different nozzle diameters and deposit sites for realistic casting sequences which maintain constant throughput by continuously opening the slide-gate opens to compensate for the evolving increase of nozzle clogging. Details of the model are given in Section 3.7. The results in Figure 18 show the evolution of pressure distribution, slide-gate opening, and port outlet cross-section area when clogging occurs at the port outlets. Conditions are based on the original nozzle geometry and conditions given in Figure 1 and Table 1 for Case 1 with gap size of 150 microns, throughput Q = 0.0057 , and 100 s time step.
As inclusions form and the clog grows, the pressure loss at the port increases. This leads to an increase of slide-gate opening to keep the same throughput (Figure 18b). Effectively, the pressure loss that originally occurs mainly at the slide-gate is redistributed to the nozzle port by the port clogging as time progresses. Interestingly, this transient simulation converges to an equilibrium just short of a clogging shutdown (90% clogged area): the reoxidation rate decreases gradually as the slide-gate opens because the negative pressure is gradually mitigated by the evolving clogging at the ports, as shown in Figure 18a. The pressure at the slide-gate increases to nearly zero after 85 minutes of operation time, so clog growth drops accordingly (Figure 18b). This result shows that the growth of clogging helps to lessen air aspiration due to the increase of slide-gate opening that it causes. However, it should be cautioned again that this model considers only oxides formed by air aspiration as the clogging source. Any inclusions supplied from upstream will clog the nozzle continuously, leading to a clogging shutdown.
9. Discussion
As discussed in Section 3, the control of throughput can be explained as an energy balance between potential energy, kinetic energy, and pressure losses. The pressure distribution calculated by the 1-D pressure-energy model quantifies how most of the potential energy is dissipated by the slide-gate (e.g., Figure 8). These results reveal that this excessive pressure loss at one location causes negative pressure just below the slide-gate (Point 5 in Figure 8). The negative pressure can lead to air aspiration and significant detrimental reoxidation even with a very thin, submillimeter gap at the slide-gate.
Four ways to avoid the negative pressure and air aspiration problem are suggested in this study. The simplest method is to increase the throughput. With more kinetic energy and friction loss from the higher velocity distributed down the nozzle, less potential energy must be dissipated by the slide-gate. Thus, the slide-gate opening will increase and lessen the negative pressure problem.
A second method is to increase the submergence depth and to lower the height difference between the tundish and mold level. An upward-ports design could compensate for the deeper submergence depth to maintain optimal mold flow.
A third method is to redistribute the pressure losses by decreasing the nozzle diameter(s). The lower SEN diameter is the best diameter to lessen, because it tends to raise pressure in the system above it. In the commercial system studied in this work, decreasing the lower SEN diameter to 51 mm was predicted to avoid negative pressure completely. Plant trials with several changes in processing conditions, including a decreased lower SEN diameter, found significantly less nozzle clogging and strand defects.
Finally, it is important to avoid cracks and leaks in the refractory, where air aspiration occurs. As shown in Equation (43), the aspirated gas flow rate decreases with thicker refractory walls. The proposed 1-D pressure-energy model can be used to test these and other methods to find ways to lessen negative pressure, aspirated gas, oxides, and to increase time before clogging shutdown. This model also has great potential for a real-time monitoring system in the plant.
10. Conclusions
A new 1-D transient pressure-energy model is presented to calculate steel throughput, pressure distribution from the tundish top to the mold top surface, air aspiration, generated oxides, and clogging shutdown time. General expressions for pressure at selected points in the continuous casting system were derived based on Bernoulli-type energy balances. The new model was verified with a 3-D CFD computational model simulation and validated with plant measurements. The results from parametric studies suggested several ways to mitigate problems with negative pressure just below the slide-gate, air aspiration, reoxidation, and clogging. Decreasing the lower-SEN nozzle diameter was predicted to be the easiest and the most effective way to avoid negative pressure and associated production and quality problems. Negative pressure was avoided for the geometry and conditions of the standard commercial operation in this study by decreasing the lower SEN diameter to 51 mm. The analytical model to estimate the rates of gas aspiration and inclusion formation showed that only a 150-micron gap or crack in the nozzle refractory walls was sufficient to produce excessive aspiration, inclusions, clogging, and multiphase flow in the mold.
Author Contributions
H.Y. conducted the development of the model and wrote the article. H.O. checked the equations and developed a user-interface of the model called PFSG. B.G.T. supervised the research and paper preparation as a Ph.D. supervisor and corresponding author. All authors have read and agreed to the published version of the manuscript.
Funding
Support from the Continuous Casting Consortium at University of Illinois at Urbana-Champaign, and the National Science Foundation GOALI grant (Grant No. CMMI 18-08731) are gratefully acknowledged.
Acknowledgments
Thanks are given to Xiaoming Ruan at Baosteel, Shanghai, China, for providing the casting conditions and measurements.
Conflicts of Interest
The authors declare no conflict of interest.
Appendix A
For the geometry given in Figure 5 for air flow through a thin radial gap, the continuity and Navier-Stokes equations can be simplified to Equations (A1) and (A2), assuming steady-state, incompressible, axi-symmetric, radial, and Newtonian flow.
where is the radial coordinate (m), is the radial gas velocity (m/s), z is the axial coordinate (m), is an arbitrary function of z, is the gas density (), is the gas pressure (Pa), is the gas viscosity (Pas). Equation (A2) is a nonlinear partial differential equation which has no analytical solution. However, it can be simplified further by scaling:
Considering that the gap is very thin (2H) (Figure 17), the gas flow falls into the Stokes flow regime, , and the nonlinear term in the left-hand side can be neglected. Equation (A2) then simplifies to:
Inserting the continuity equation (Equation (A1)), Equation (A4) becomes
Since , the left-hand size of the equation becomes only a function of r, but the right-hand size is only a function of z. Therefore, both terms must be a constant C to satisfy Equation (A5).
By integrating these two ordinary differential equations, the velocity and flow rate of the aspirated air are obtained in Equations (42) and (43).
References
- Rackers, K.; Thomas, B. Clogging in continuous casting nozzles. In Proceedings of the 78th Steelmaking Conference, Nashville, TN, USA, 2–5 April 1995; Volume 78, pp. 723–734. [Google Scholar]
- Yokoya, S.; Takagi, S.; Souma, H.; Iguchi, M.; Asako, Y.; Hara, S. Prevention of air suction from the contact-part between sliding gate and immersion nozzle. ISIJ Int. 1998, 38, 1346–1352. [Google Scholar] [CrossRef]
- Bai, H.; Thomas, B.G. Effects of clogging, argon injection, and continuous casting conditions on flow and air aspiration in submerged entry nozzles. Metall. Mater. Trans. B 2001, 32, 707–722. [Google Scholar] [CrossRef]
- Savolainen, J.; Rousu, A.; Fabritius, T.; Mattila, O.; Sulasalmi, P. Modelling of Pressure Distribution inside the SEN in a Stopper-rod controlled System. Steel Res. Int. 2010, 81, 980–986. [Google Scholar] [CrossRef]
- Zhang, L.; Thomas, B.G. Inclusions in continuous casting of steel. In Proceedings of the XXIV National Steelmaking Symposium, Morelia, Mich, Mexico, 26–28 November 2003; pp. 138–183. [Google Scholar]
- Janis, D.; Karasev, A.; Inoue, R.; Jönsson, P.G. A Study of Cluster Characteristics in Liquid Stainless Steel and in a Clogged Nozzle. Steel Res. Int. 2015, 86, 1271–1278. [Google Scholar] [CrossRef]
- Mohammadi-Ghaleni, M.; Asle Zaeem, M.; Smith, J.D.; O’Malley, R. Comparison of CFD Simulations with Experimental Measurements of Nozzle Clogging in Continuous Casting of Steels. Metall. Mater. Trans. B 2016, 47, 3384–3393. [Google Scholar] [CrossRef]
- Yang, H.; Vanka, S.P.; Thomas, B.G. Modeling Argon Gas Behavior in Continuous Casting of Steel. JOM 2018, 70, 2148–2156. [Google Scholar] [CrossRef]
- Zhang, L.; Wang, Y.; Zuo, X. Flow Transport and Inclusion Motion in Steel Continuous-Casting Mold under Submerged Entry Nozzle Clogging Condition. Metall. Mater. Trans. B 2008, 39, 534–550. [Google Scholar] [CrossRef]
- Thomas, B.G. Modeling of continuous casting defects related to mold fluid flow. Iron Steel Technol. 2006, 3, 127. [Google Scholar]
- Hibbeler, L.C.; Thomas, B.G. Mold slag entrainment mechanisms in continuous casting molds. Iron Steel Technol. 2013, 10, 121–136. [Google Scholar]
- Cho, S.-M.; Kim, S.-H.; Chaudhary, R.; Thomas, G.B.; Shin, H.-J.; Choi, W.-R.; Kim, S.-K. Effect of Nozzle Clogging on Surface Flow and Vortex Formation in the Continuous Casting Mold. In Proceedings of the AISTech 2011, Indianapolis, IN, USA, 2–5 May 2011. [Google Scholar]
- Murakami, Y.; Kodama, S.; Konuma, S. Quantitative evaluation of effects of non-metallic inclusions on fatigue strength of high strength steels. I: Basic fatigue mechanism and evaluation of correlation between the fatigue fracture stress and the size and location of non-metallic inclusions. Int. J. Fatigue 1989, 11, 291–298. [Google Scholar] [CrossRef]
- Wilson, A.D. The Influence of Inclusions on the Toughness and Fatigue Properties of A516-70 Steel. J. Eng. Mater. Technol. 1979, 101, 265. [Google Scholar] [CrossRef]
- Zhang, L.; Aoki, J.; Thomas, B.G. Inclusion removal by bubble flotation in a continuous casting mold. Metall. Mater. Trans. B 2006, 37, 361–379. [Google Scholar] [CrossRef]
- Wang, L.; Lee, H.G.; Hayes, P. Modelling of air ingress and pressure distribution in ladle shroud system for continuous casting of steel. Steel Res. 1995, 66, 279–286. [Google Scholar] [CrossRef]
- Zhang, J.; Liu, Q.; Yang, S.; Chen, Z.; Li, J.; Jiang, Z. Advances in Ladle Shroud as A Functional Device in Tundish Metallurgy: A Review. ISIJ Int. 2019, 59, 1167–1177. [Google Scholar] [CrossRef] [Green Version]
- Ishiguro, K.; Iguchi, M. Model Experiment on the Behavior of Argon Gas in Immersion Nozzle. ISIJ Int. 2003, 43, 663–670. [Google Scholar] [CrossRef]
- Kato, T.; Hara, M.; Muto, A.; Hiraki, S.; Kawamoto, M. Fluid Flow Behavior in Submerged Entry Nozzle of Continuous Casting. ISIJ Int. 2007, 47, 840–846. [Google Scholar] [CrossRef] [Green Version]
- Timmel, K.; Shevchenko, N.; Röder, M.; Anderhuber, M.; Gardin, P.; Eckert, S.; Gerbeth, G. Visualization of Liquid Metal Two-phase Flows in a Physical Model of the Continuous Casting Process of Steel. Metall. Trans. B 2015, 46, 700–710. [Google Scholar] [CrossRef]
- POSCO. Method For Continuous Casting to Prevent AirAspiration in Slide Gate. Korea Patent KR 1020040039502, 2004. [Google Scholar]
- SMS Siemag LLC. Method and Apparatus for Testing the Integrity of A Shroud Seal on A Ladle for A Continuous Casting Installation. U.S. Patent US007628952B2, 4 May 2007. [Google Scholar]
- Liu, R.; Thomas, B.G.; Sengupta, J.; Chung, S.D.; Trinh, M. Measurements of Molten Steel Surface Velocity and Effect of Stopper-rod Movement on Transient Multiphase Fluid Flow in Continuous Casting. ISIJ Int. 2014, 54, 2314–2323. [Google Scholar] [CrossRef] [Green Version]
- Majidi, S.H.; Beckermann, C. Effect of pouring conditions and gating system design on air entrainment during mold filling. Int. J. Metalcast. 2019, 13, 255–272. [Google Scholar] [CrossRef]
- Prakash, M.; Cleary, P.W.; Grandfield, J.; Rohan, P.; Nguyen, V. Optimisation of ingot casting wheel design using SPH simulations. Prog. Comput. Fluid Dyn. 2007, 7, 101–110. [Google Scholar] [CrossRef]
- Suzuki, M.; Yamaoka, Y.; Kubo, N.; Suzuki, M. Oxidation of molten steel by the air permeated through a refractory tube. ISIJ Int. 2002, 42, 248–256. [Google Scholar] [CrossRef] [Green Version]
- Moody, L.F. Friction factors for pipe flow. Trans. ASME 1944, 66, 671–684. [Google Scholar]
- Churchill, S.W. Empirical expressions for the shear stress in turbulent flow in commercial pipe. AlChE J. 1973, 19, 375–376. [Google Scholar] [CrossRef]
- Colebrook, C.F.; Blench, T.; Chatley, H.; Essex, E.; Finniecome, J.; Lacey, G.; Williamson, J.; Macdonald, G. Turbulent flow in pipes, with particular reference to the transition region between the smooth and rough pipe laws. J. Inst. Civ. Eng. 1939, 12, 393–422. [Google Scholar] [CrossRef]
- Todreas, N.E.; Kazimi, M.S. Nuclear Systems: Thermal Hydraulic Fundamentals; CRC Press: Boca Raton, FL, USA, 2012; Volume 1. [Google Scholar]
- Erhard, P.; Etling, D.; Muller, U.; Riedel, U.; Sreenivasan, K.; Warnatz, J. Prandtl-Essentials of Fluid Mechanics; Springer Science & Business Media: Berlin/Heidelberg, Germany, 2010; Volume 158. [Google Scholar]
- White, F.M. Fluid Mechanics, 8th ed.; McGraw-Hill Education: New York, NY, USA, 2015. [Google Scholar]
- Brater, E.F.; King, H.W. Handbook of Hydraulics for the Solution of Hydraulic Engineering Problems; McGraw-Hill: New York, NY, USA, 1976. [Google Scholar]
- Valve, C. Flow of Fluids through Valves, Fittings and Pipe TP-410 Metric; Vervante: Lindon, UT, USA, 1999. [Google Scholar]
- Thomas, B.G.; Huang, X.; Sussman, R.C. Simulation of Argon Gas Flow Effects in a Continuous Slab Caster. Metall. Mater. Trans. B 1994, 25, 527–547. [Google Scholar] [CrossRef]
- Liu, R.; Thomas, B.G.; Forman, B.; Yin, H. Transient turbulent flow simulation with water model validation and application to slide gate dithering. In Proceedings of the AISTech 2012, Atlanta, GA, USA, 7–10 May 2012. [Google Scholar]
- Armaly, B.F.; Durst, F.; Pereira, J.; Schönung, B. Experimental and theoretical investigation of backward-facing step flow. J. Fluid Mech. 1983, 127, 473–496. [Google Scholar] [CrossRef]
- Biswas, G.; Breuer, M.; Durst, F. Backward-facing step flows for various expansion ratios at low and moderate Reynolds numbers. J. Fluids Eng. 2004, 126, 362–374. [Google Scholar] [CrossRef]
- Lima, R.C.; Andrade, C.R.; Zaparoli, E.L. Numerical study of three recirculation zones in the unilateral sudden expansion flow. Int. Commun. Heat Mass Transfer 2008, 35, 1053–1060. [Google Scholar] [CrossRef]
- Gutiérrez, E.; Barreto, J.d.J.; Garcia-Hernandez, S.; Morales, R.; González-Solorzano, M.G. Decrease of Nozzle Clogging through Fluid Flow Control. Metals 2020, 10, 1420. [Google Scholar] [CrossRef]
- Barati, H.; Wu, M.; Kharicha, A.; Ludwig, A. A transient model for nozzle clogging. Powder Technol. 2018, 329, 181–198. [Google Scholar] [CrossRef]
- Jones, W.P.; Launder, B.E. The prediction of laminarization with a two-equation model of turbulence. Int. J. Heat Mass Transf. 1972, 15, 301–314. [Google Scholar] [CrossRef]
- White, F.M.; Corfield, I. Viscous Fluid Flow; McGraw-Hill: New York, NY, USA, 2006; Volume 3. [Google Scholar]
- Clauser, F.H. Turbulent boundary layers in adverse pressure gradients. J. Aeronaut. Sci. 2012, 21, 91–108. [Google Scholar] [CrossRef]
- Nikuradse, J. Strömungsgesetze in Rauhen Rohren ForschHft. Ver. Dt. Ing 1933, 361. [Google Scholar]
- Kojola, N.; Ekerot, S.; Jönsson, P. Pilot plant study of clogging rates in low carbon and stainless steel grades. Ironmak. Steelmak. 2011, 38, 81–89. [Google Scholar] [CrossRef]
Figure 1.
Geometry of nozzle with slide-gate.

Figure 2.
Definitions of slide-gate opening.

Figure 3.
Example of pressure distribution from new 1-D model (Tundish level = 1430 mm, slide-gate opening , other casting conditions are the same as Case 1).
Figure 3.
Example of pressure distribution from new 1-D model (Tundish level = 1430 mm, slide-gate opening , other casting conditions are the same as Case 1).

Figure 4.
Schematic for calculation of velocity drop constant (a) , (b) and (c) .

Figure 5.
Schematic of aspirated air flow into gap.

Figure 6.
Distribution of (a) pressure, (b) velocity and (c) gas volume fraction from 3-D numerical model.
Figure 6.
Distribution of (a) pressure, (b) velocity and (c) gas volume fraction from 3-D numerical model.

Figure 7.
Relation between throughput Q and slide-gate opening for Case 1.

Figure 8.
Axial pressure distribution for Case 1.

Figure 9.
Comparison of pressure distribution between 1-D and 3-D model results.

Figure 10.
Effect of SEN diameter on relation between slide-gate opening and throughput .

Figure 11.
Effect of lower SEN diameter on pressure distribution.

Figure 12.
Effect of nozzle diameter on relation between slide-gate opening and throughput .

Figure 13.
Effect of nozzle diameter on pressure distribution.

Figure 14.
Effect of submergence depth on pressure distribution.

Figure 15.
Effect of tundish level on pressure distribution.

Figure 16.
Estimated flow rate of aspirated air and alumina generation rate with different nozzle diameter.
Figure 16.
Estimated flow rate of aspirated air and alumina generation rate with different nozzle diameter.

Figure 17.
Effect of nozzle diameter on clogging time for different clogging locations (150-micron gap).
Figure 17.
Effect of nozzle diameter on clogging time for different clogging locations (150-micron gap).

Figure 18.
Transient model of nozzle clogging showing evolution of (a) pressure distribution, (b) slide-gate opening and clogged port area.
Figure 18.
Transient model of nozzle clogging showing evolution of (a) pressure distribution, (b) slide-gate opening and clogged port area.


Table 1.
Nozzle and slide-gate system dimensions—standard conditions (Case 1).
| Dimension | Value |
|---|---|
| UTN bore diameter, (mm) | 80 |
| UTN length (mm) | 255 |
| Upper plate thickness (mm) | 50 |
| Upper plate bore diameter, (mm) | 80 |
| Slide-gate thickness (mm) | 25 |
| Slide-gate bore diameter, (mm) | 80 |
| Slide-gate orientation (deg.) | 90 |
| Lower plate & Lower nozzle bore diameter, (mm) | 80 |
| Lower plate thickness + Lower nozzle length (mm) | 160 |
| SEN whole length (mm) | 714 |
| SEN upper part bore diameter, (mm) | 80 |
| SEN upper part length (mm) | 40 |
| SEN tapered part length (mm) | 40 |
| SEN lower part bore diameter, (mm) | 75 |
| SEN lower part length (mm) | 634 |
| Port width × port height (mm × mm) | 60 × 80 |
| Port angle (down) (deg.) | 15 |
| Port thickness (mm) | 23.5 |
| Slab geometry: T (thickness) × W (width) (m) | 0.3 × 1.9 |
Table 2.
Operating conditions and material properties for Case 1.
| Operating Condition | Values |
|---|---|
| Slab size (m) | 1.9 |
| Slide-gate orientation (deg.) | 90 (orthogonal to mold width direction) |
| Slide-gate opening | 0.4 |
| Tundish depth (mm) | 1030 |
| Casting speed (m/min) | 0.60 |
| Argon gas flow rate (SLPM) | 3.8 (from UTN wall) 2.2 (from upper plate) |
| Submergence depth (m) | 0.21 |
| Absolute average roughness of nozzle wall (mm) | 1 (nonclogged condition) |
| Hot argon gas temperature (K) | 1823 |
| Hot argon gas pressure (kPa) | 70.7 (=) |
| Material Property | Values |
| Liquid steel density ( | 7000 |
| Liquid steel viscosity (Pas) | 0.006 |
| Argon gas density ( | 1.6228 |
| Argon gas viscosity (Pas) | 2.125 |
| Mixture density ( | 6580 |
Table 3.
Comparison of slide-gate opening, tundish level and throughput.
| Results | |||
|---|---|---|---|
| Plant data | 0.40 | 1030 | 0.0057 |
| 3-D model | 0.40 (input) | 995 (output) | 0.0057 (input) |
| 1-D model | 0.3992 (output) | 1030 (input) | 0.0057 (input) |
Table 4.
Comparison of slide-gate opening from the 1-D model to the plant data.
| No. | Slab Size (m) | (m/min) | (SLPM) | Tundish Depth (m) | Slide-Gate Opening, (%) 1-D Model | Slide-Gate Opening, (%) Plant Data | Clogging Condition |
| 1 | 1.9 | 0.60 | 6 | 1.03 | 40.0 | 40 | Nonclogged |
| 2 | 1.9 | 0.60 | 6 | 1.03 | 40.0 | 40 | Nonclogged |
| 3 | 2.1 | 0.66 | 4.3 | 1.08 | 44.4 | 43 | Nonclogged |
| 4 | 2.1 | 0.66 | 4 | 1.10 | 44.2 | 46 | Nonclogged |
| 5 | 2.1 | 0.66 | 8.2 | 1.02 | 46.1 | 45 | Nonclogged |
| 6 | 2.1 | 0.70 | 4.2 | 1.02 | 46.8 | 37 | Nonclogged |
| 7 | 1.7 | 0.80 | 7 | 1.02 | 45.1 | 45 | Clogged |
| 8 | 1.7 | 0.80 | 7 | 0.98 | 45.2 | 39 | Clogged |
| 9 | 1.7 | 0.74 | 6.5 | 1.02 | 42.8 | 49 | Clogged |
| 10 | 2.1 | 0.70 | 8.6 | 1.02 | 48.2 | 61 | Severely Clogged |
| 11 | 2.1 | 0.70 | 10.2 | 1.02 | 48.7 | 66 | Severely Clogged |
| 12 | 2.1 | 0.70 | 8.4 | 0.93 | 48.9 | 63 | Severely Clogged |
Table 5.
Calculated slide-gate opening and friction factor with different SEN lower part diameter .
| Cases | Liquid Steel | (Friction Factor) | (Slide-Gate Opening) | |
|---|---|---|---|---|
| Original (Case 1) | 75 | 0.0057 | 0.0424 | 0.400 |
| Parametric case A | 66 | 0.0057 | 0.0443 | 0.407 |
| Parametric case B | 58 | 0.0057 | 0.0463 | 0.428 |
| Parametric case C | 51 | 0.0057 | 0.0485 | 0.456 |
Table 6.
Calculated slide-gate opening and friction factor with different SEN lower part diameter.
| Cases | All (mm) | Liquid Steel Throughput Q | All (Friction Factor) | (Slide-Gate Opening) |
| Original (Case 1) | 75 | 0.0057 | 0.0424 | 0.400 |
| Parametric case D | 66 | 0.0057 | 0.0443 | 0.5118 |
| Parametric case E | 58 | 0.0057 | 0.0463 | 0.6334 |
| Parametric case F | 52.6 | 0.0057 | 0.0480 | 1.000 |
Table 7.
Calculated slide-gate opening and friction factor with different SEN lower part diameter.
| Cases | Submergence Depth (mm) | Liquid Steel | (Slide-Gate Opening) |
|---|---|---|---|
| Parametric case G | 100 | 0.0057 | 0.3936 |
| Original (Case 1) | 210 | 0.0057 | 0.4000 |
| Parametric case H | 350 | 0.0057 | 0.4072 |
| Parametric case I | 500 | 0.0057 | 0.4171 |
Table 8.
Calculated slide-gate opening with different tundish level.
| Cases | Tundish Level (mm) | Liquid Steel | (Slide-Gate Opening) |
|---|---|---|---|
| Parametric case J | 400 | 0.0057 | 0.4568 |
| Parametric case K | 600 | 0.0057 | 0.4345 |
| Parametric case L | 800 | 0.0057 | 0.4165 |
| Original (Case 1) | 1030 | 0.0057 | 0.4 |
| Parametric case M | 1300 | 0.0057 | 0.3820 |
Publisher’s Note: MDPI stays neutral with regard to jurisdictional claims in published maps and institutional affiliations. |
© 2021 by the authors. Licensee MDPI, Basel, Switzerland. This article is an open access article distributed under the terms and conditions of the Creative Commons Attribution (CC BY) license (http://creativecommons.org/licenses/by/4.0/).
Share and Cite
MDPI and ACS Style
Yang, H.; Olia, H.; Thomas, B.G. Modeling Air Aspiration in Steel Continuous Casting Slide-Gate Nozzles. Metals 2021, 11, 116. https://doi.org/10.3390/met11010116
AMA Style
Yang H, Olia H, Thomas BG. Modeling Air Aspiration in Steel Continuous Casting Slide-Gate Nozzles. Metals. 2021; 11(1):116. https://doi.org/10.3390/met11010116
Chicago/Turabian StyleYang, Hyunjin, Hamed Olia, and Brian G. Thomas. 2021. "Modeling Air Aspiration in Steel Continuous Casting Slide-Gate Nozzles" Metals 11, no. 1: 116. https://doi.org/10.3390/met11010116
Note that from the first issue of 2016, this journal uses article numbers instead of page numbers. See further details here.