
A Study of the Metallurgical and Mechanical Properties of Friction-Stir-Processed Cu


1
Department of Mechanical Engineering, ORT Braude College, P.O. Box 78, Karmiel 2161002, Israel
2
Dipartimento di Ingegneria Industriale e Scienze Matematiche - DIISM, Università Politecnica delle Marche, 60131 Ancona, Italy
*
Author to whom correspondence should be addressed.
Metals 2021, 11(4), 656; https://doi.org/10.3390/met11040656
Submission received: 17 March 2021
/
Revised: 1 April 2021
/
Accepted: 15 April 2021
/
Published: 17 April 2021
(This article belongs to the Special Issue Advances in Friction Stir Welding and Processing)
Abstract
:Friction stir processing (FSP), a severe plastic deformation process, was applied on pure Cu to obtain a stir zone with a very fine grain size. Yet, when FSP is used, the stir zone is as wide as the diameter of the shoulder at the upper surface of the weld and markedly narrower near its opposite surface. This property, as well as the differences between the advancing side and the retreating side, makes it impossible to obtain a uniform cross-section as far as the microstructure and mechanical properties are concerned. For these reasons, a new approach is proposed in which the material was processed on both sides, thus yielding a wider, rectangular and more homogenous stir zone from which all the specimens were machined out. Processing the material from both sides eliminated any microstructural difference between the upper and the lower side, at least within the gauge length’s cross-section of the creep specimens. Although grain refinement was detected, the mechanical properties of the friction-stir-processed (FSP’ed) material are inferior relative to those of the parent material. The TEM study reported in the current paper revealed the existence of nanosized grains in the FSP’ed material due to dynamic recrystallization (DRX) occurring during the processing stage. Because both X-ray inspection and fractography showed that the FSP’ed material was free of defects, the material may not comply with the Hall–Petch relation due to lower dislocation density caused by XRD occurring during FSP. The inverse Hall–Petch effect may also be considered as an assistive mechanism in mechanical property deterioration.
1. Introduction
Friction stir processing (FSP) was derived from friction stir welding (FSW) in 2000 and was first reported by Mishra et al. [1]. FSP is identical to FSW except that, in FSP, the rotating tool does not weld the parts to one another. Because it is a severe plastic deformation process, FSP aims to attain a stir zone with a very fine grain size and hence improve the mechanical properties of the material being processed.
Copper and its alloys are known for their high thermal and electrical conductivity. Yet, pure copper has the drawbacks of low strength and poor wear and fatigue resistance that limit its use. Applying severe plastic deformation processes such as FSP seems to be a promising way to improve the mechanical properties of the material. Several publications discuss FSP applied to pure Cu [2,3,4,5,6,7,8,9,10,11,12,13,14,15,16,17,18], as summarized in the following paragraph.
Cartigueyen and Mahadevan [2,9] studied the influence of process parameters and tool shape on the microstructure and mechanical properties of a 6 mm thick processed material. Relying on optical microscopy, they observed the existence of recrystallization grain refinement from 35 to 5–20 μm within the stir zone, together with an increase in hardness of up to 97 HV. However, the tensile properties were found to be inferior compared to the parent material. Barmouz et al. [3] studied the influence of multipass process parameters on the microstructure and the mechanical properties of 6 μm thick plates. Relying also on optical microscopy, they observed grain refinement from 50–60 to 0.7–0.8 μm. Yield strength and ultimate tensile strength increased from 145 and 150 MPa to 200 and 215 MPa, respectively, while fracture surface analysis yielded microvoid coalescence [3]. Xue et al. [4] applied water-cooling-assisted FSP on 5 mm thick plates. Optical microscopy revealed equiaxed grains of 730 nm. Hardness varied between 105 and 110 HV, while the yield strength and ultimate tensile strength obtained were 330 and 340 MPa, respectively. In another publication also dealing with water-cooling-assisted FSP [6], Xue et al. achieved an ultimate tensile strength of about 400 MPa. However, the tensile specimens used for this study were dog-bone-shaped 0.6 mm thick specimens machined from the stir zone. The TEM study reported in [6] also revealed submicron grains of 700 and 400 nm, depending on the process parameters. Surekha and Els-Botes [4] processed 3 mm thick plates and reported grain refinement down to 3 μm, compared to the 19 μm grain size of the base metal, as detected by optical metallography. They also observed an increase in hardness from 84.6 to 13.6 HV, together with an increase in yield strength and ultimate tensile strength from 209 and 270 MPa to 261 and 328 MPa, respectively. Galvao et al. [7] processed 1 and 3 mm thick plates under various parameters and observed grain refinement down to about 1 μm, as revealed by optical microscopy, together with a hardness increase of up to about 130 HV0.2 under certain parameters. Salahi and Rezazadeh [8] processed a 5 mm thick plate. They reported an increase in ultimate tensile strength of up to 271 MPa as well as grain refinement; however, they did not publish the grain size data. Barmouz et al. [10] reported the processing of a 4 mm thick plate and recorded a grain size of about 1 mm after a single pass of processing and 600 nm after a double pass. In another publication dealing with 6 mm thick plate optical microscopy and SEM, Barmouz et al. [12] observed grain refinement from 40 to 50 μm in the case of the parent material down to a few microns. Moreover, the hardness values of the stir zone reached 75 HV, while the yield and ultimate tensile strengths measured for the processed material were markedly lower than those of the parent metal. Leal et al. [11] reported hardness values of up to 130 HV0.2 and grain refinement down to submicron size, relying on optical microscopy and TEM. They also observed decreasing dislocation density when the tool rotation was increased to transverse speeds ratios (ω/v). Wang et al. [13,14] reported achieving an ultimate tensile strength of 550 MPa and the formation of nanosized grains, together with grain refinement during the cryogenic friction stir processing of 3 mm plates. They based their findings on a qualitative TEM study. They also reported dislocation cell structure and changes in the dislocation density as a function of the process parameters. In another publication focusing on processing 3 mm thick plates, Wang et al. [15] reported achieving an even higher ultimate tensile strength of ~570 MPa. A TEM study of the processed material yielded grain refinement to an average size of 109 nm, together with high- and low-angle grain boundaries as well as dislocation pile-ups in some grains. Wang et al. [16] processed 3 mm thick plates and reported an increase in hardness from 74.5 to 111.3 HV and an average grain size of ~710 nm, as revealed by TEM. Moaref and Rabiezadeh [17] studied the underwater FSP of 5 mm thick copper plates and obtained a hardness value of 103 HV.
It is well known that the stir zone of a friction-stir-processed material has a wedge shape. This shape is as wide as the diameter of the shoulder at the upper surface of the weld and markedly narrower near its opposite surface, not to mention the differences between the advancing side and the retreating surface. For these reasons, it is impossible to obtain a uniform cross-section as far as the microstructure and mechanical properties are concerned. Hence, the current paper offers a new approach that the authors have already applied on aluminum alloys [18]. In this approach, the material was processed on both sides, thus yielding a wider, rectangular and more homogenous stir zone. The mechanical properties, namely tension and hardness, were studied in both conditions as well. A quantitative TEM study compared the parent material and the stir zone of the FSP-processed material. Reports in the literature are ambiguous. Some researchers reported improved mechanical properties achieved by FSP [4,5,6,10,11,17], while others reported achieving either improvement or deterioration, depending on the process parameters [3,7,8] or on hardness improvement together with tensile deterioration [2,9,12]. The current paper offers a way to settle these discrepancies.
2. Materials and Methods
2.1. Material Processing
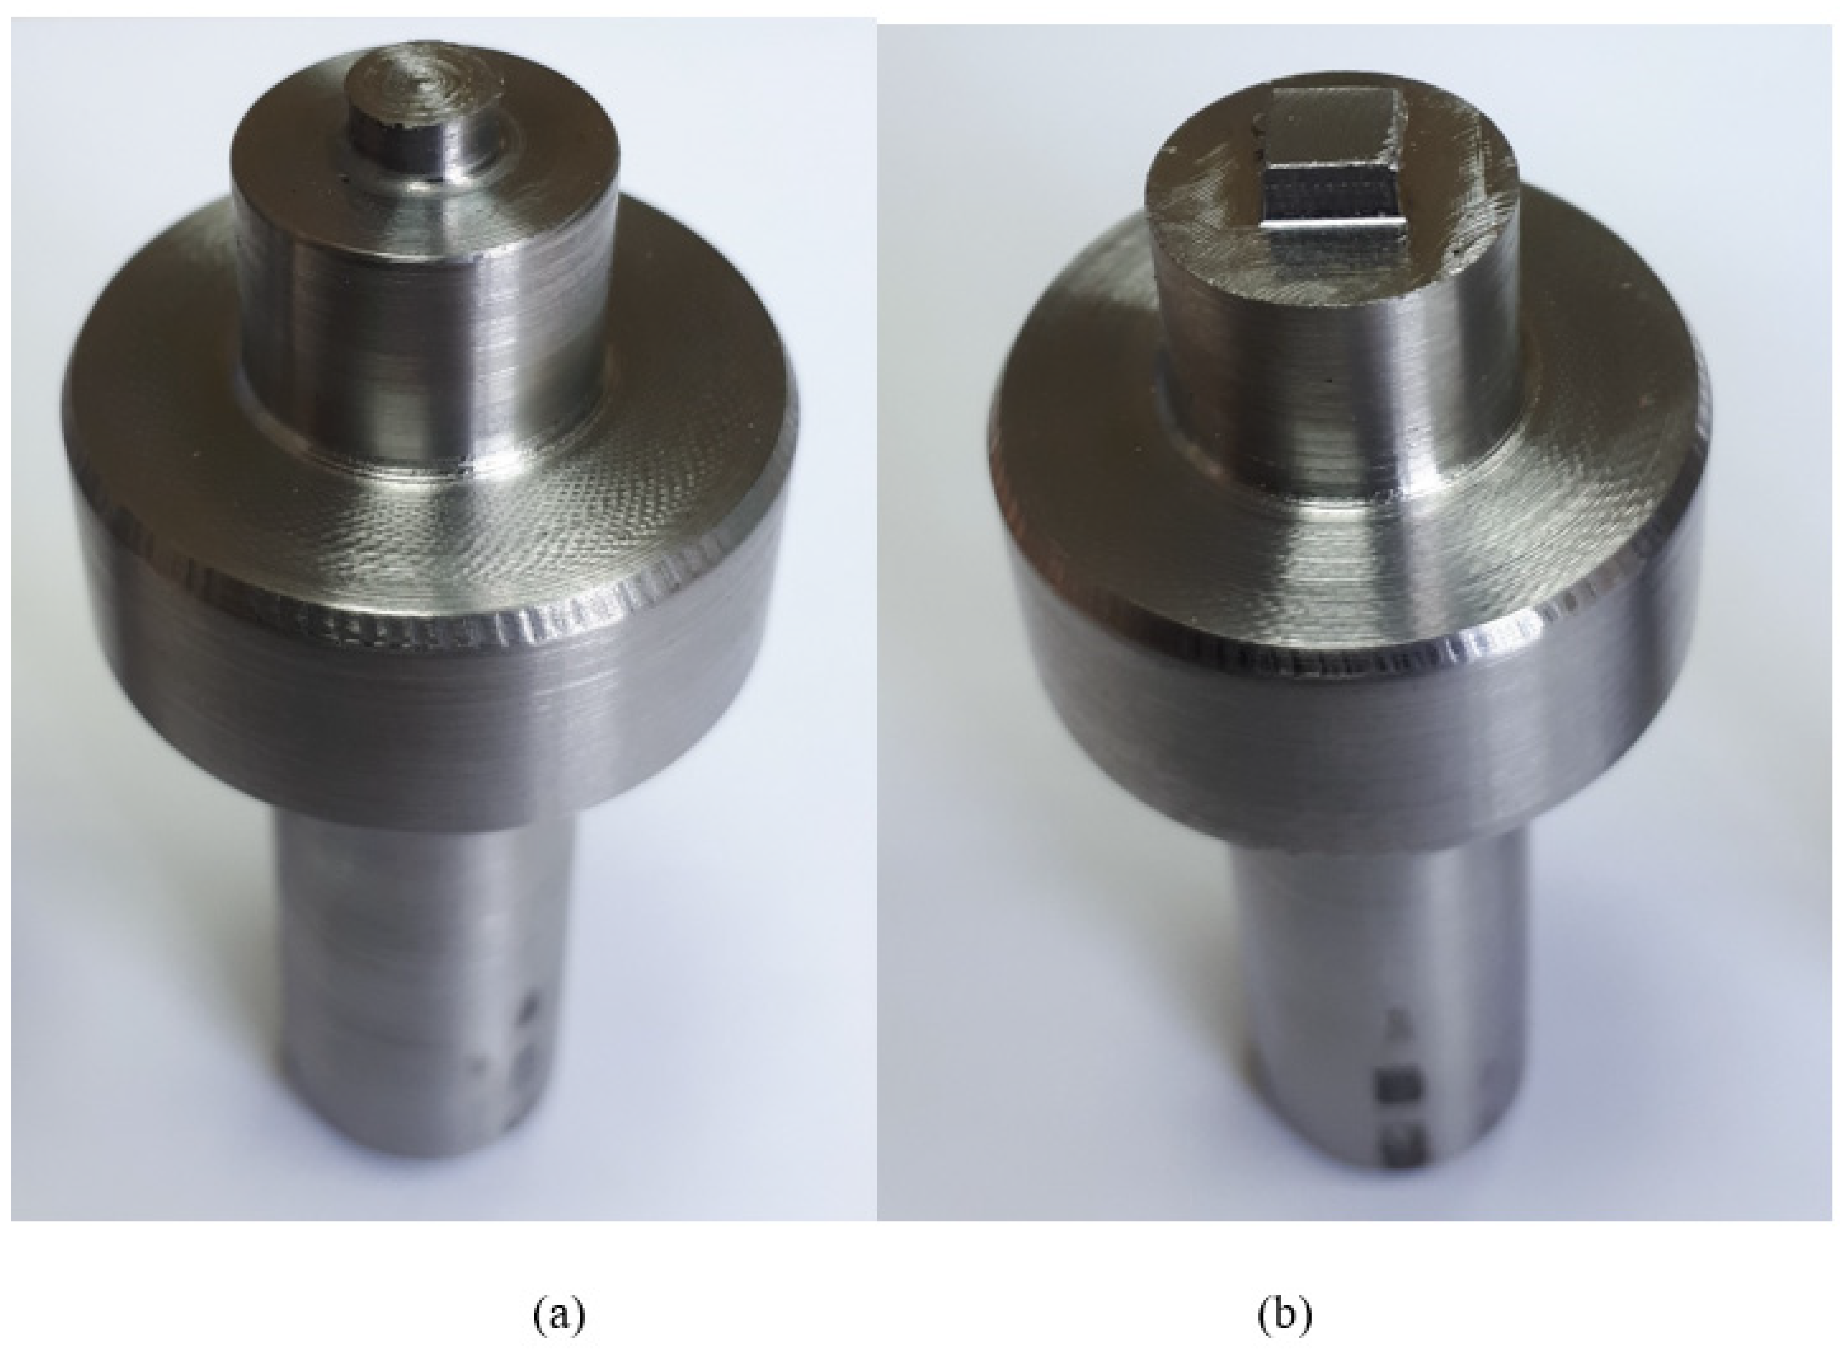
The material used for this study was commercially pure Cu in the form of 200 mm × 100 mm plates, 3.175 mm thick. The above plates were subjected to FSP using a SHARNOA CNC milling machine. Two H-13 steel processing tools were used, both with a 20 mm diameter shoulder and a 2.6 mm long pin. The first tool had a Ø5.5 mm cylindrical pin, while the second had a 5 mm × 5 mm square pin. The two processing tools are shown in Figure 1.
A single pass was made on one side of the plate. The plate was then flipped and processed once again right above the first pass, which was on the bottom side of the plate. The second pass was made so that the advancing side of the first pass became the retreating side of the second and vice versa. The motivation was to make the stir zone as symmetrical and uniform as possible while achieving an almost rectangular cross-section. The various FSP experiments are listed in Table 1. All the FSP’ed specimens were visually examined. Based on the better visual inspection results found in Experiments 1 through 6, it was decided to select the square pin and to test it under two additional sets of parameters (Experiments 7–8). The FSP’ed plates from Experiments 4, 6, 7 and 8 were then radiographically checked. Having analyzed the X-ray inspection results, it was found that rotational speed of ω = 900 rpm and a transverse speed of v = 50 mm/min yielded a defect-free stir zone and were chosen, therefore, as processing parameters.
2.2. Metallography
The metallographic study was conducted using a Zeiss AX10 optical microscope and an FEI Inspect SEM.
2.3. Mechanical Properties
Vickers microhardness measurements were taken using a Shimadzu microhardness tester under a load of 200 gf. Tensile specimens with a 3 mm × 3 mm square cross-section and a 25 mm gauge length were machined from the FSP region of the plates. The longitudinal axis of the samples was parallel to the FSP direction so that the entire body of the specimen was included in the stir zone.
2.4. TEM
The TEM investigation was conducted using an FEI Tecnai G2 T20 TEM. TEM specimens were prepared using an FEI Helios NanoLab G3 FIB (focused ion beam).
2.5. Fractography
The fractography study was conducted on broken friction-stir-processed creep specimens with the aid of an FEI Inspect SEM.
3. Results
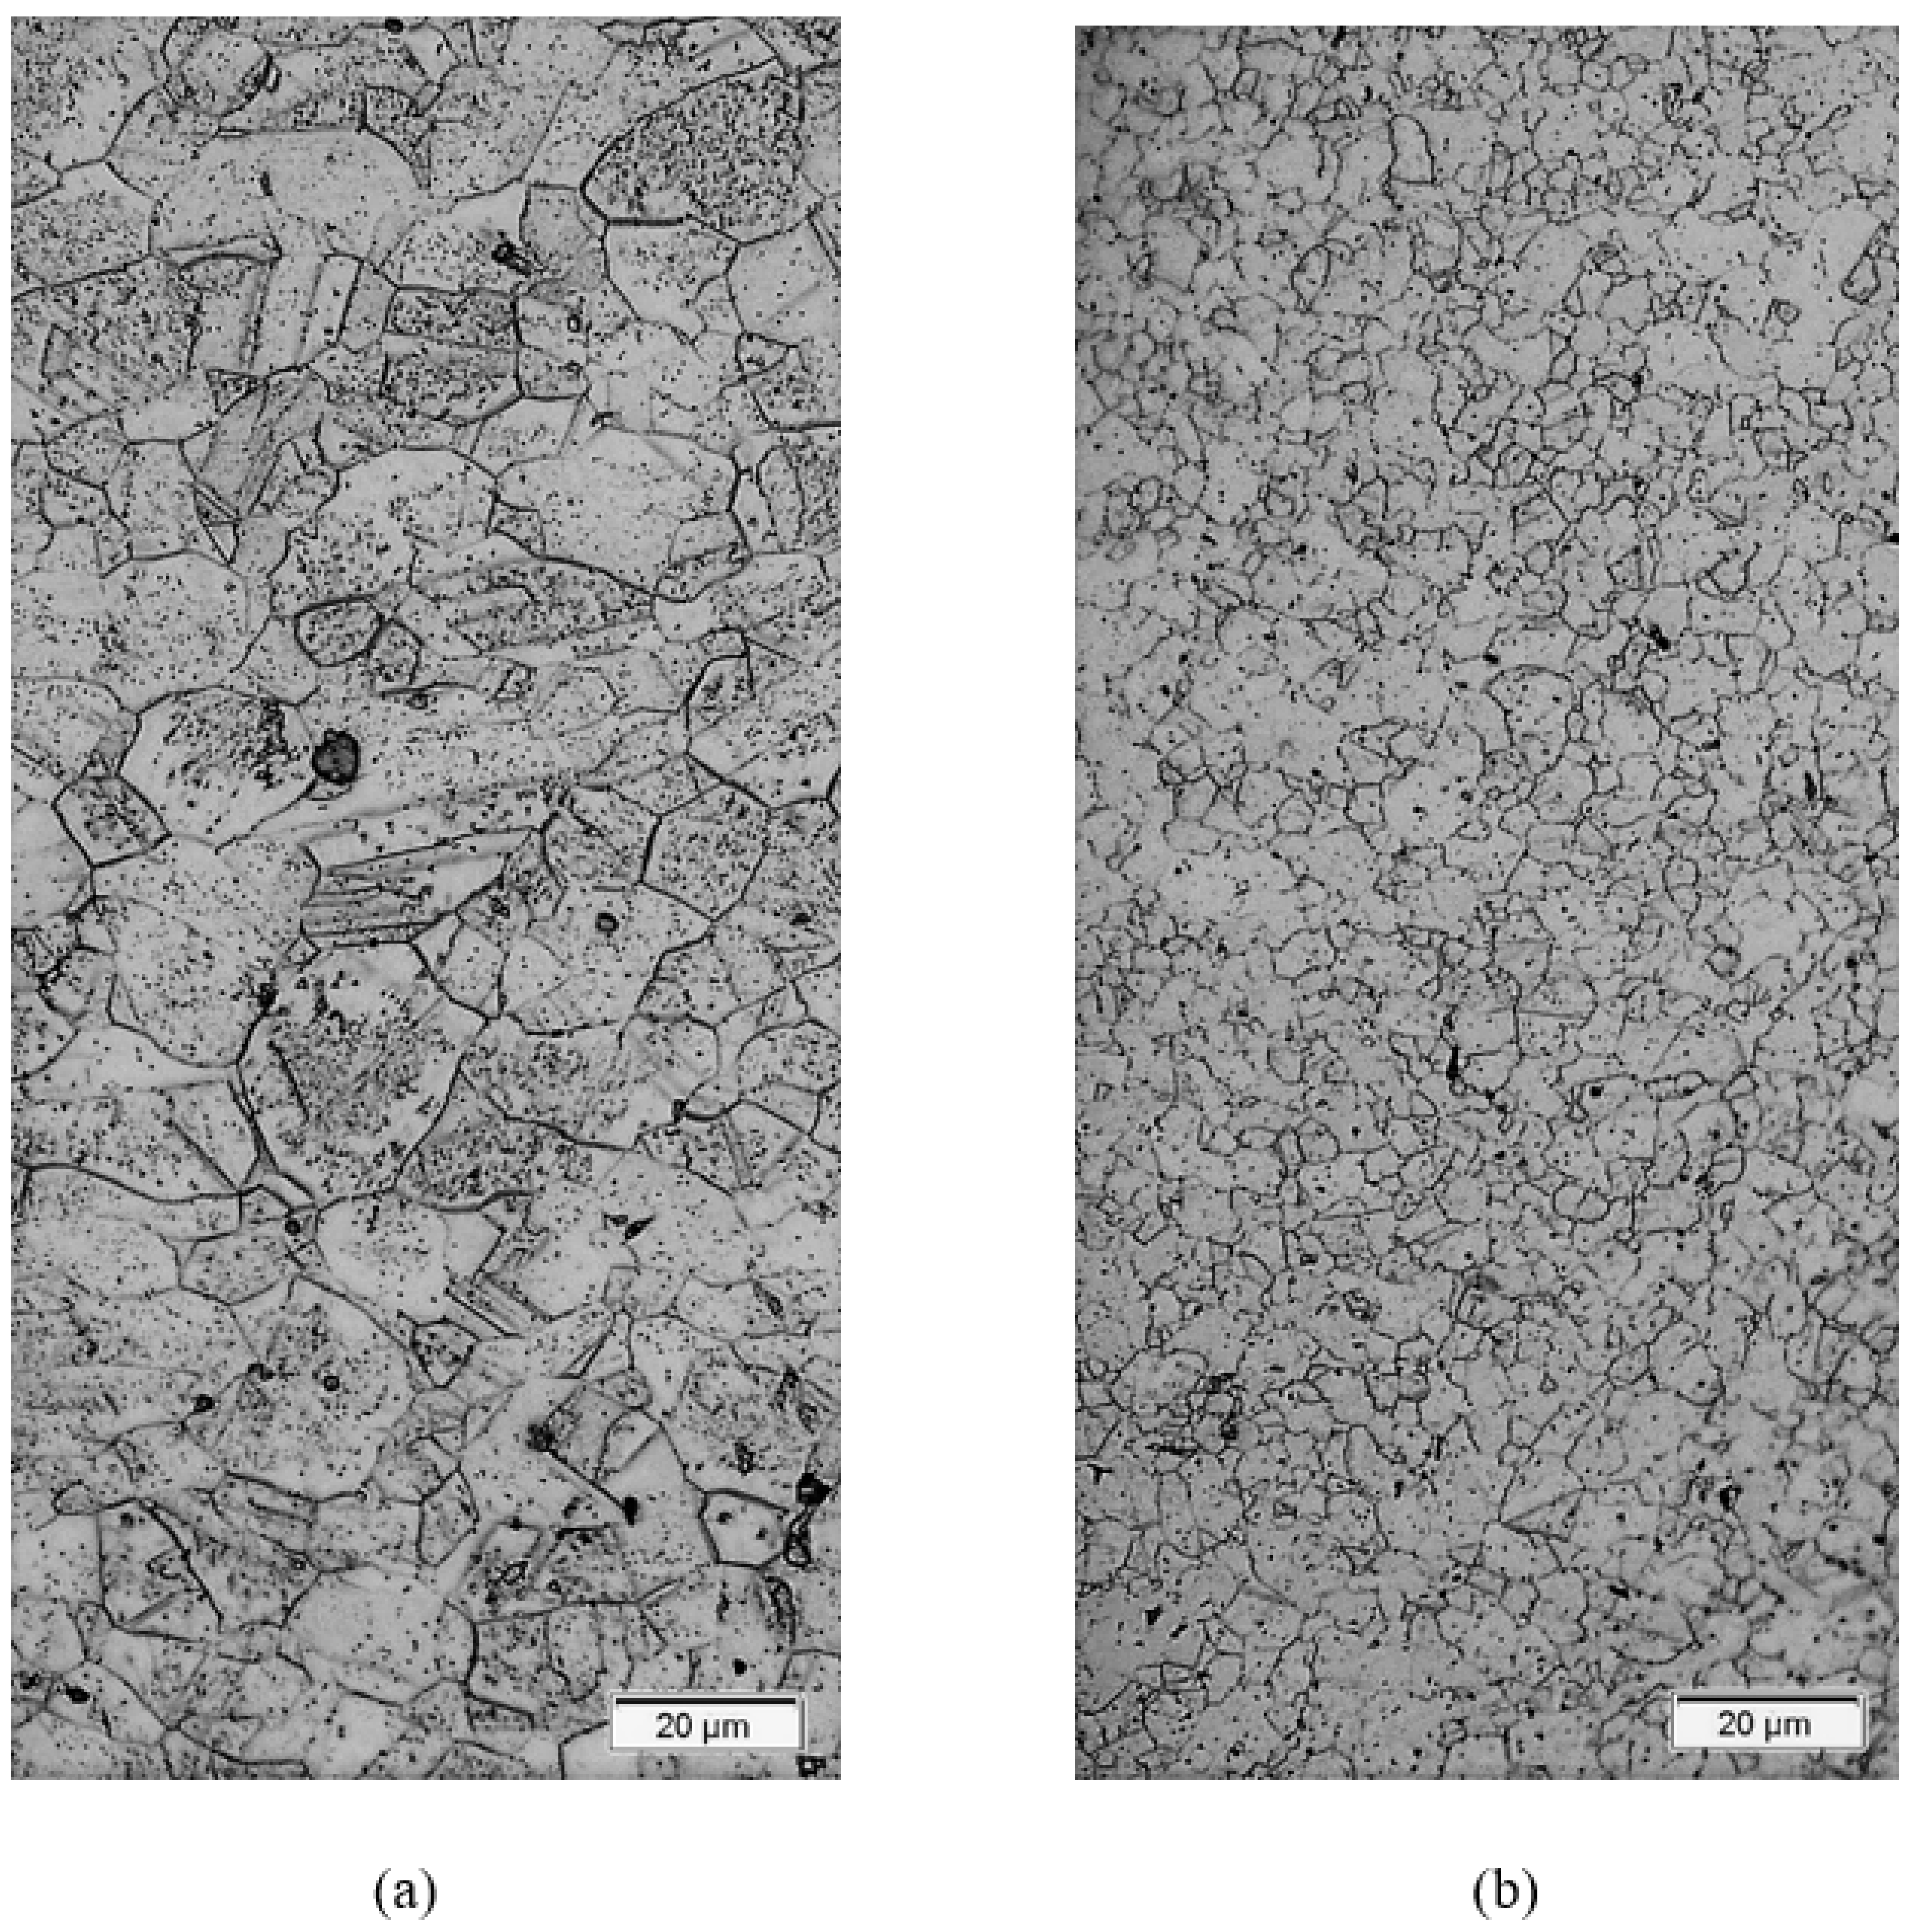
Figure 2a shows an optical micrograph of the parent metal, while Figure 2b was taken from the stir zone of the processed material.
Twinned grains having an average grain size of about 10–20 μm are discernible in the parent metal, while the processed material consists of nonuniform equiaxed grains whose size varies from about 1 μm up to about 20 μm.
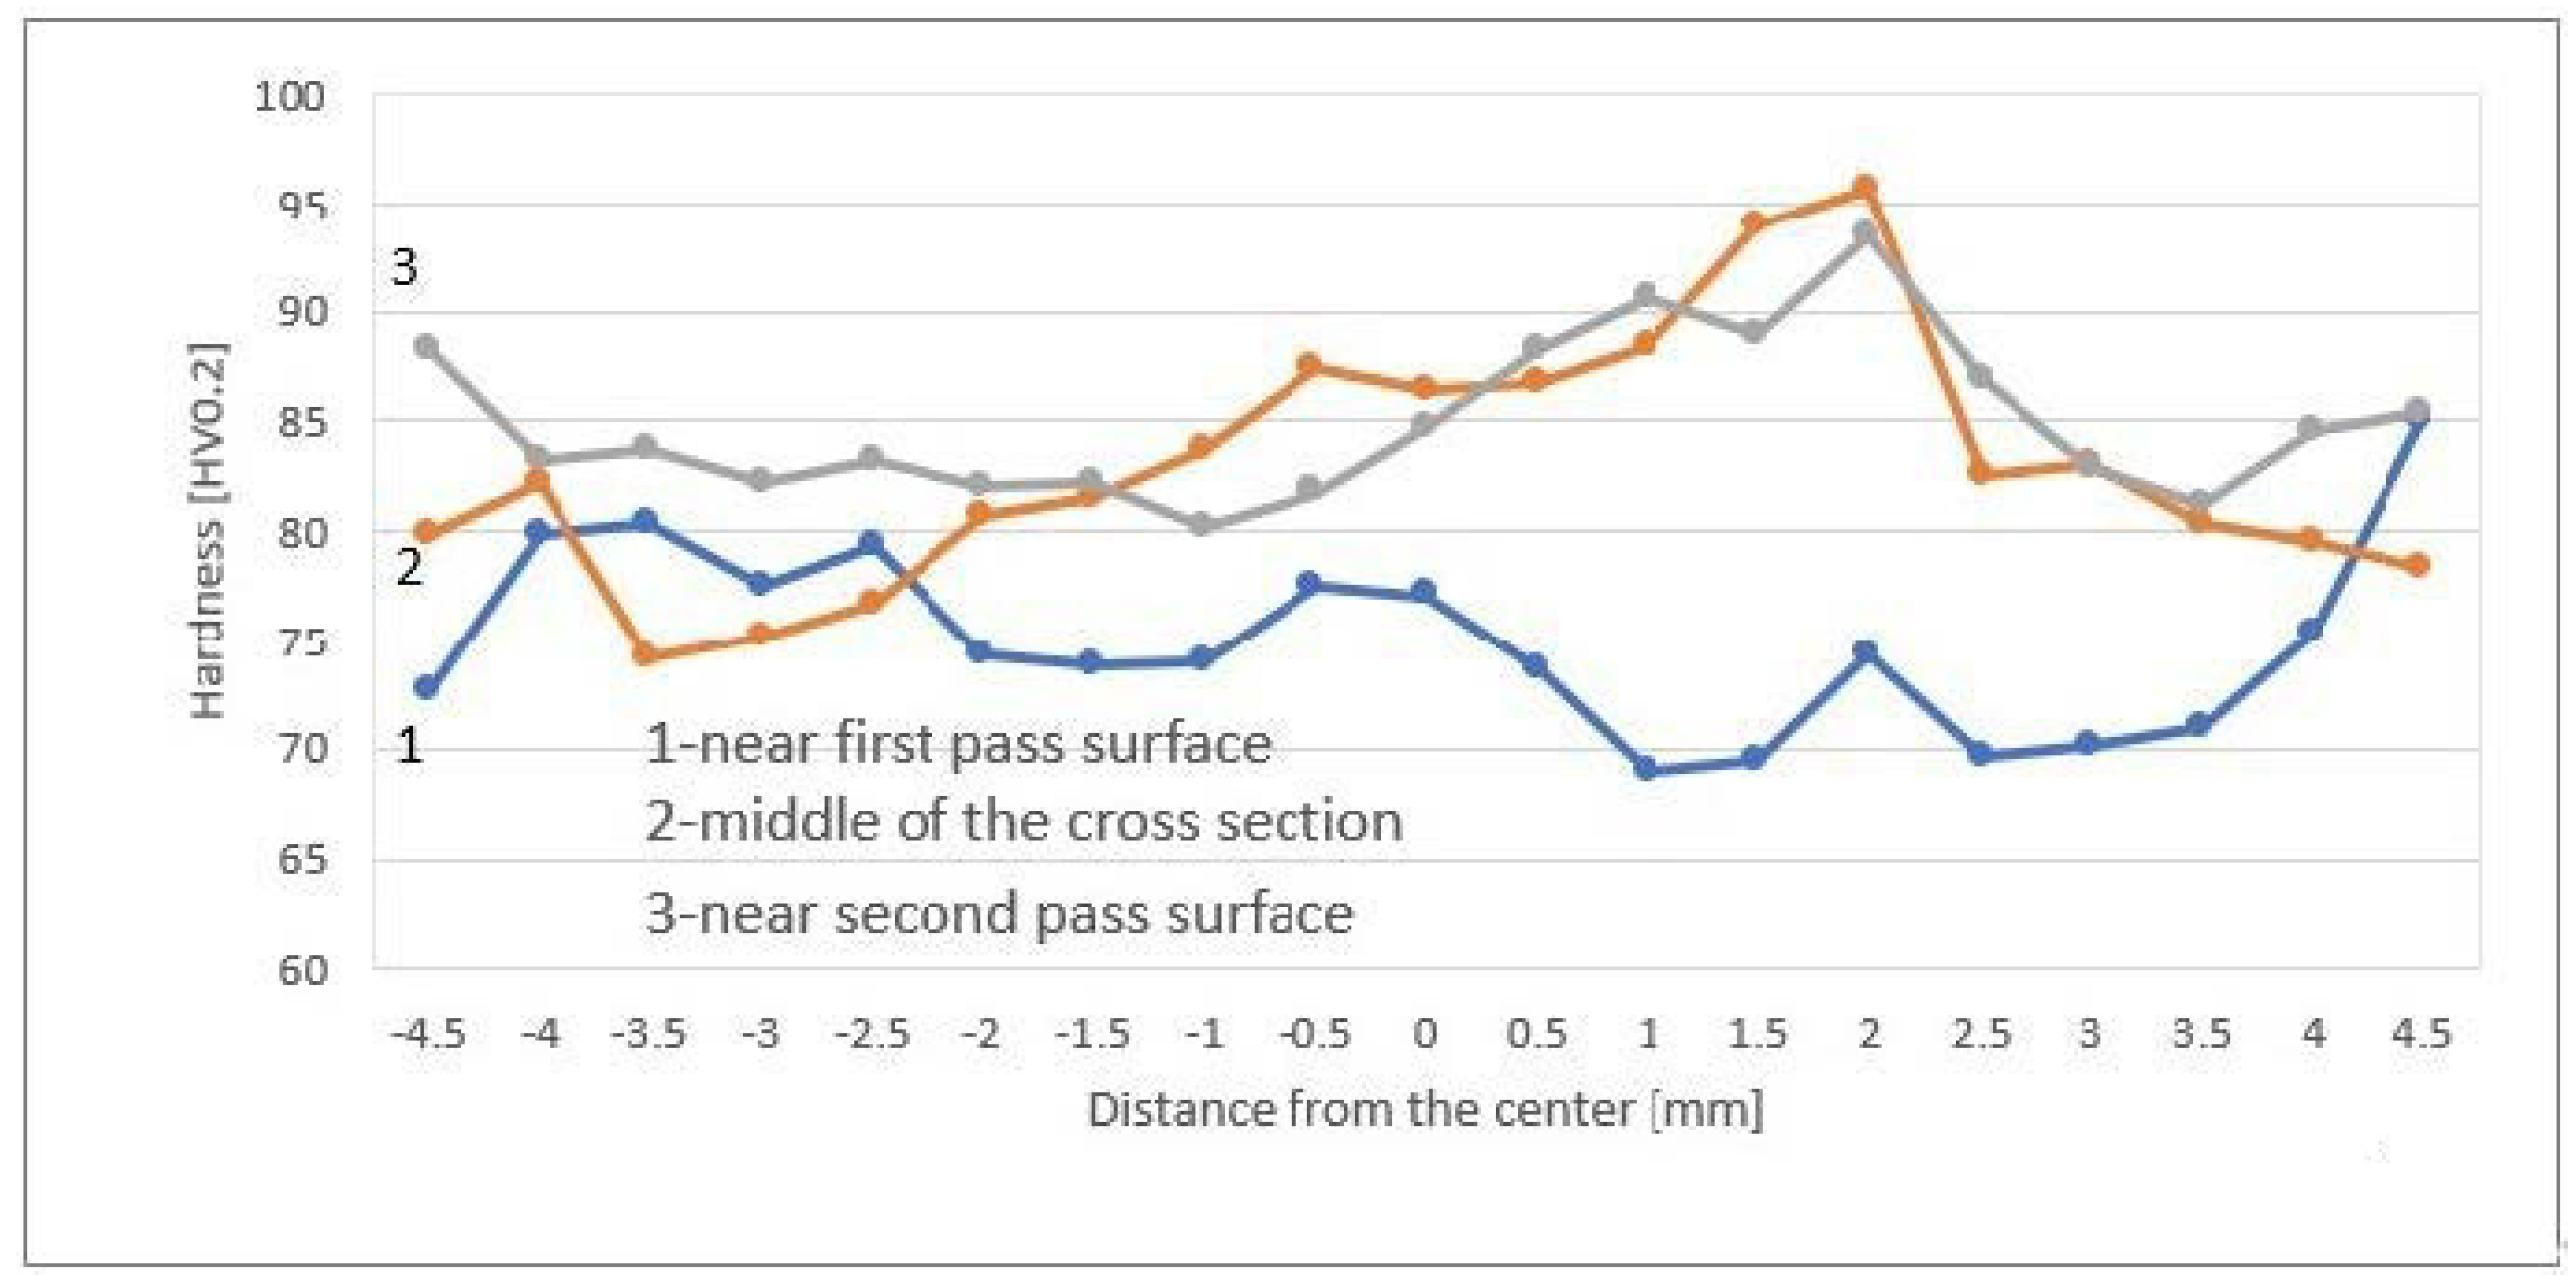
Figure 3 shows three microhardness profiles taken from the stir zone of the processed material. Profile 1 was taken as close as possible to the surface of the first pass, Profile 2 was taken at the middle of the cross-section and Profile 3 was taken near the surface of the second pass. All the measurements were taken across the stir zone, perpendicular to its longitudinal axis while maintaining a distance of 0.5 mm from one indentation to another. The hardness of the parent metal was found to be 89 ± 1.5 HV0.2. Keeping in mind that the gauge length of the tensile specimens was machined out from a ±1.5 mm wide strip with respect to the center of the stir zone, one can see that the hardness of the stir zone varies markedly with the location. While these variations reach almost 20 HV0.2, it may be claimed that the parent material is harder than the FSP’ed one.
Table 2 summarizes the tensile test results of the parent material (PM) as well as the FSP’ed material. As can be seen from Table 2, both the yield strength and the UTS of the FSP’ed material are lower than those of the parent material, while its elongation is higher.
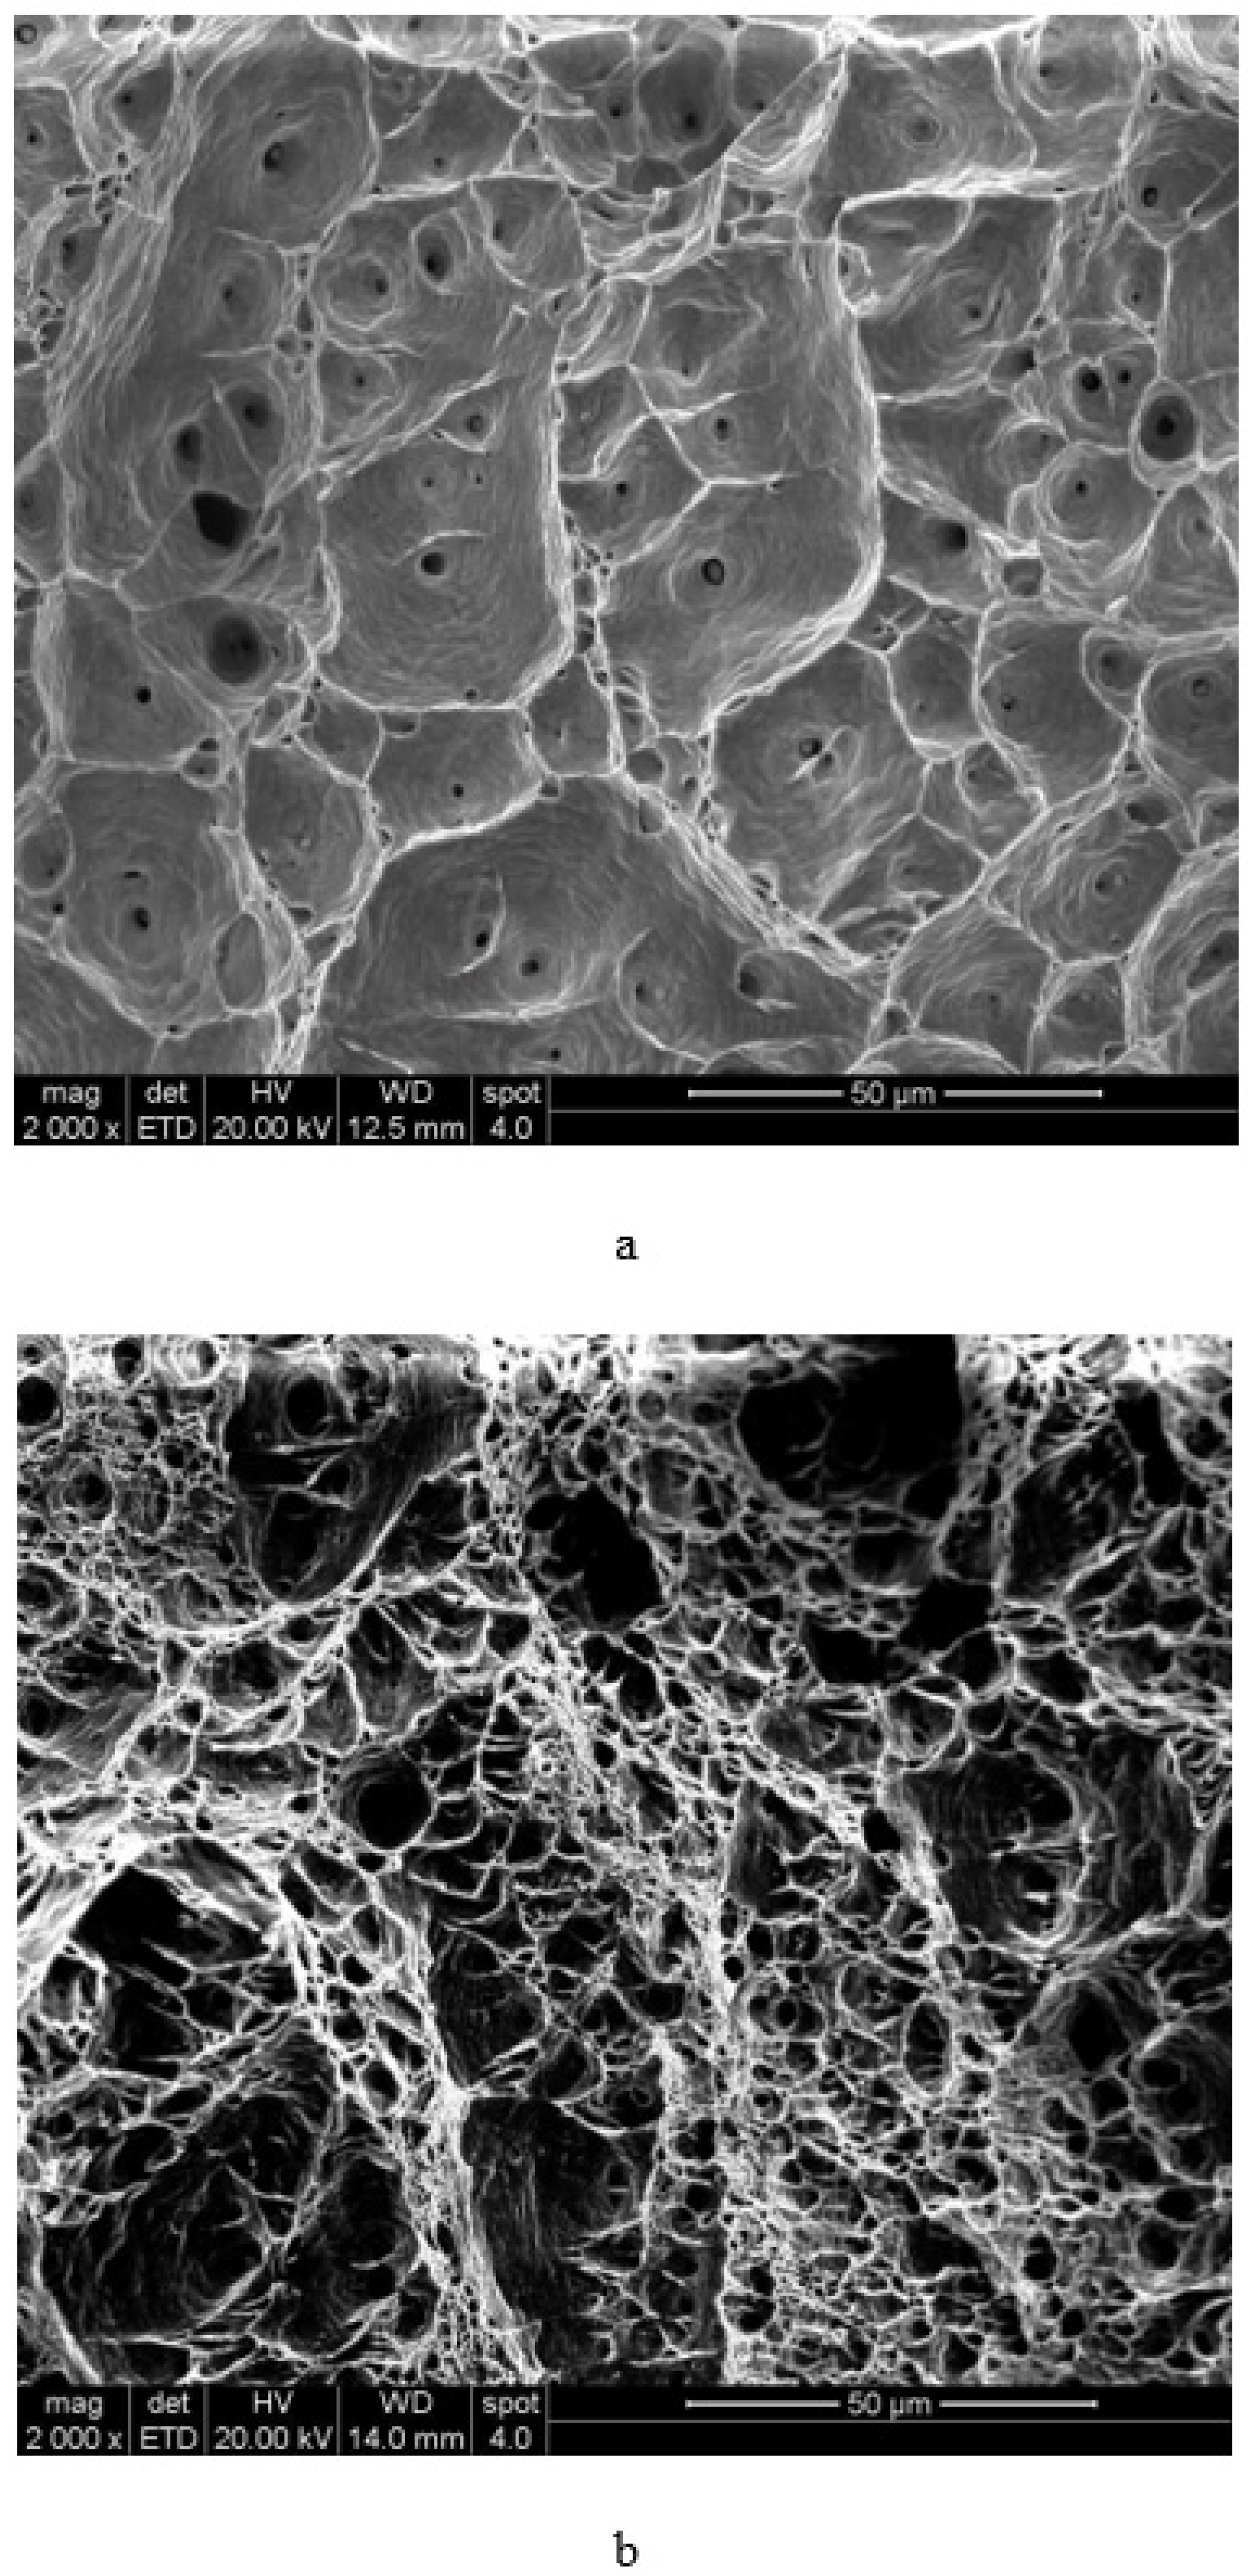
Figure 4a provides a general view of the fracture surface of a broken parent material tensile specimen, while Figure 4b shows the fracture surface of a broken FSP’ed specimen. Both micrographs were taken using an SEM under the same magnification. It is evident that both fracture surfaces have a ductile fracture character. In the case of the parent material, however, the sizes of the voids are uniform, while large variations are discernible in the case of the FSP’ed material. The fracture surface of the FSP’ed material is composed of coarse voids with a size of about 25 μm, which is close to the void size of the parent material together with ones that are finer by an order of magnitude. The surfaces of all the fracture specimens were observed, and none of them showed evidence of pre-existing cracks or other defects.
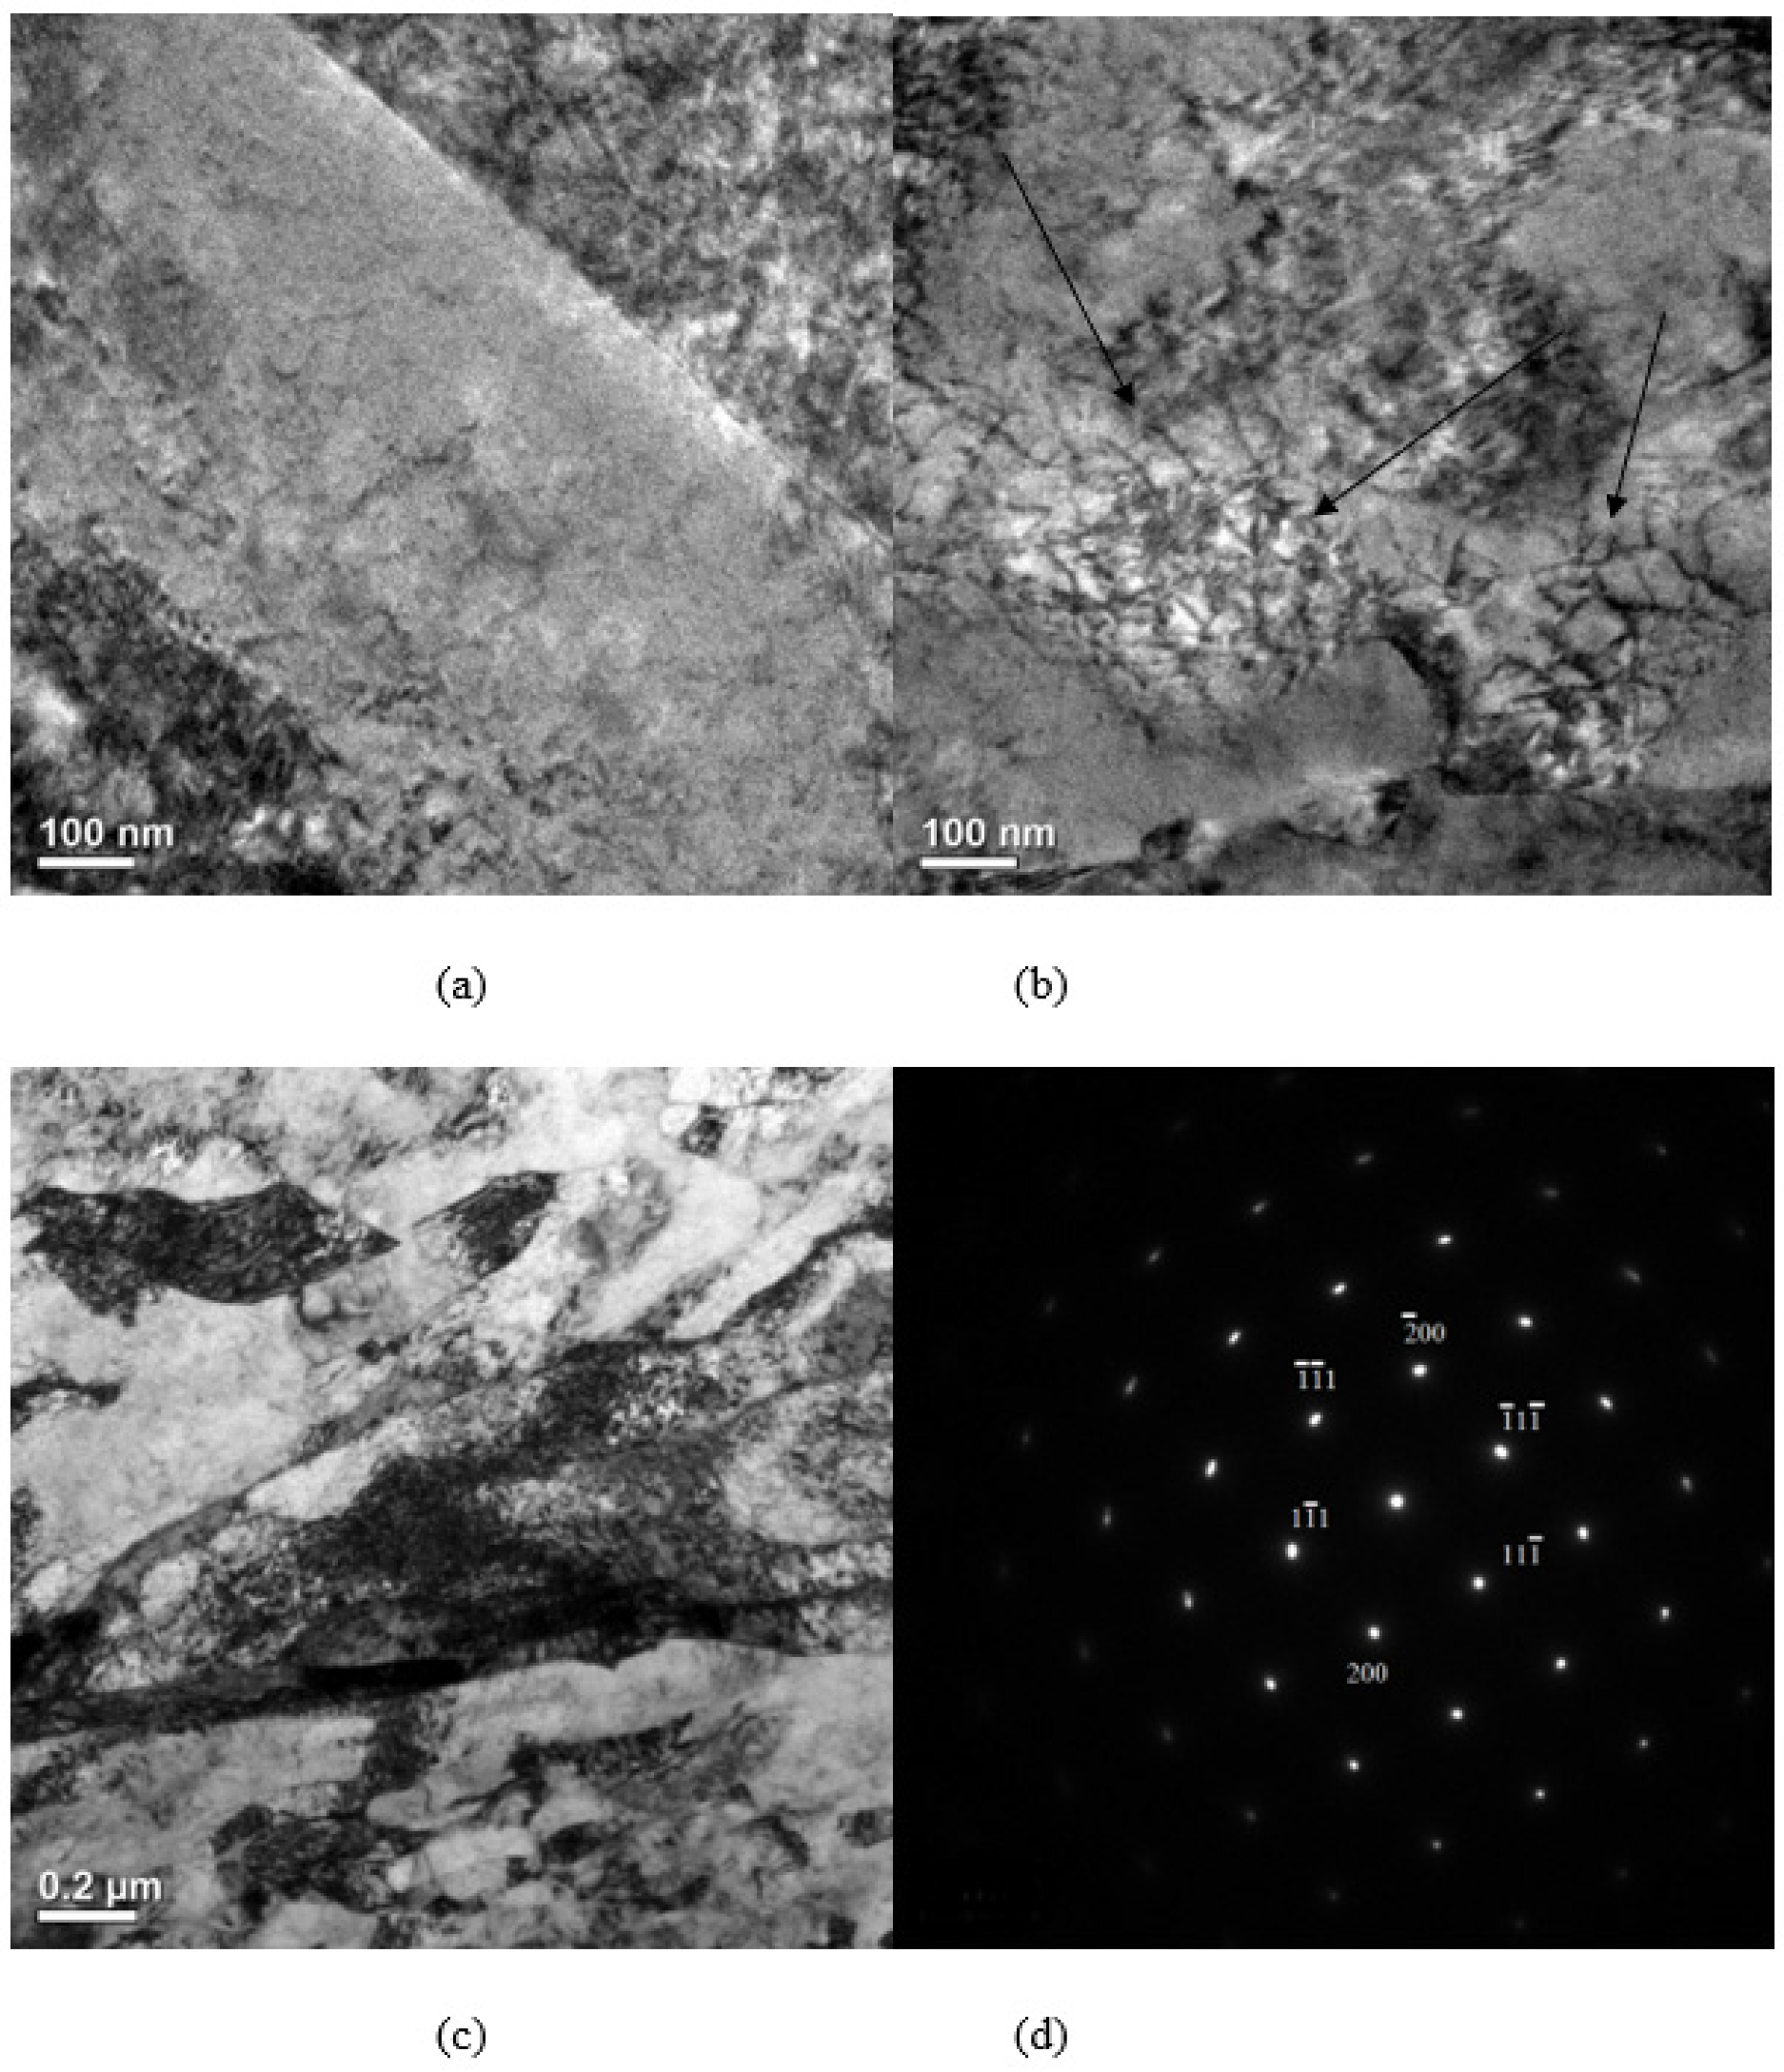
Figure 5a,b are bright-field (BF) TEM micrographs of the parent material taken near <> Z.A. showing a twin boundary (Figure 5a) and dislocation networks (Figure 5b). Figure 5c shows BF TEM micrographs of the processed material, while Figure 5d shows the electron diffraction pattern of the respectively selected area. Submicron and even nanosized grains are discernible in Figure 5d. The dark contrast typical of grains tilted to a certain zone axis indicates that they are separate grains rather than subgrains.
4. Discussion
The tensile test results indicate that both the yield strength and the ultimate tensile strength of the FSP’ed material are markedly lower than those of the parent material. The microhardness profiles shown in Figure 2 also reflect a certain drop in hardness in the case of the FSP’ed material compared to the parent metal. In the case of pure metals, a drop in mechanical properties can be related to defects such as cracks introduced during processing, grain coarsening or a lower dislocation density. As for defect introduction, the processed specimens were radiographically checked prior to tension tests and found to be defect free. Moreover, a fractography study conducted on all the broken tensile specimens revealed no evidence of pre-existing cracks. Hence, the existence of any sort of cracks introduced during friction stir processing can be ruled out. A comparison between Figure 2a,b shows that even though, as stated earlier, the average grain size of the processed material is nonuniform to some extent, it is almost an order of magnitude lower than that of the parent metal. Hence, the main question that arises from the current study is the issue of why the material does not comply with the Hall–Petch relation.
Reports in the literature are ambiguous. Some researchers reported improved mechanical properties achieved by FSP [4,5,6,10,11,17], while others reported achieving either improvement or deterioration, depending on the process parameters [3,7,8] or on the hardness improvement together with tensile deterioration [2,9,12]. Reports of improved mechanical properties attributed this to grain refinement [4,5,6,17], i.e., to the Hall–Petch relation, increased dislocation density [10] or both [11]. Mixed results are attributed to dislocation density and grain refinement [3], solely to grain refinement [2,7,9] or solely to dislocation density [8,12]. To summarize, reports in the literature seem to agree that FSP leads to grain refinement in all cases due to DRX. Nevertheless, two opposite contributions can be expected. On the one hand, grain refinement leads to increased hardness and yield strength according to the Hall–Petch relation, while, on the other hand, reduced dislocation density resulting from DRX leads to reduced mechanical properties. The dominance of one of these two contradictory trends eventually dictates whether the processed material will show improved or inferior mechanical properties. This notion seems to be applicable in the current study as well. A simplified model can be based on the well-known Taylor equation, here rewritten in a simplified form:
where m is the Taylor factor, σ0i represents the stress required to move a dislocation in a very coarse-grained metal in the absence of other dislocations, b is the Burgers vector, d is the grain size, G is the shear modulus and α is a constant. Substituting the following values:
results in a yielding stress of 132 MPa, with ρ = 5 × 10¹³ m−2. In the case of the parent alloy, the average yielding stress is 225 MPa. The material of the present study is a copper sheet in an F240 half-hard state. This condition can be achieved by applying, after annealing, a skin-pass rolling. According to Equation (1), a sheet that underwent skin-pass, that, for example, imparted 10–15% strain hardening to reach the F240 state, with a dislocation density ranging from 3 × 10¹⁴ m−2 [23] to 9 × 10¹⁴ m−2 [24] and a grain size of 15–20 μm, will exhibit a yield strength of 180–233 MPa, which is reasonably close to the measured one. To summarize, in the case of the half-hardened sheet, after FSP, one can expect a reduction in strength, because the Hall–Petch strengthening cannot compensate for the reduction of the dislocation hardening term.
| σ0i = 7 MPa | [19] |
| kHK = 0.144 MPa m−0.5 | [20,21] |
| d = 3 μm | |
| m = 3.06, α = 0.19, G = 4.75 × 10⁴ − 17T [MPa], b = 2.56 × 10 − 10 [m] | [22] |
Based on the TEM results, which showed even finer grains, we propose that another factor, i.e., the inverse Hall–Petch effect, may to some extent contribute to the deterioration of the mechanical properties. Several researchers [25,26,27,28,29,30] have observed and reported the inverse Hall–Petch effect in Cu. According to these publications, the Hall–Petch relation breaks down in submicron grain-sized materials. In other words, the yield strength decreases rather than increases with decreasing grain size. According to Song et al. [25], there is evidence of a transition from a normal to an inverse Hall–Petch relation at a critical grain size of 33 nm. As stated earlier concerning Figure 5d, tilting the specimen to <> Z.A revealed nanosized grains. Moreover, given that the DRX is the grain refinement operative mechanism, the entire spectrum of grain sizes is expected to exist, ranging from nanograins up to 20 μm, as detected by optical microscopy. The yielding process may therefore occur in stages, during which grains smaller than the critical size yield first; that is, part of the cross-section is still within the elastic range while the other part has already yielded. This means, in turn, that the effective cross-section for yielding is smaller than the original one, and the yield strength is therefore reduced accordingly. It is hard to say what fraction of the cross-section is composed of grains smaller than 33 nm. In the case of Figure 5d, it looks as if one-third of the cross-section is composed of nanosized grains. Nevertheless, this problem requires further quantitative analysis to obtain well-established statistics. It should be kept in mind that even if Figure 5d represents the grain size distribution at one single point along the specimen’s gauge length, this point can become a bottleneck and hence will dictate the yield strength.
5. Conclusions
- Pure Cu underwent FSP on both sides with the aid of a square pin, thus yielding a more rectangular and homogenous stir zone.
- Although showing grain refinement, the FSP’ed material proved to be mechanically inferior to the parent material.
- X-ray inspection and the fractography study ruled out the existence of any crack or other kind of defect inside the stir zone.
- The TEM study provided evidence for DRX, yielding ultrafine and even nanosized grains.
- The inferior mechanical properties in the case of the processed material can be explained on the basis of a reduced dislocation density due to DRX, as shown quantitatively by relying on the simplified Taylor equation
- Further quantitative analysis is still required in order to obtain a well-established statistic of grain size distribution. Such an analysis will make it possible to determine the contribution of the inverse Hall–Petch effect
Author Contributions
Conceptualization, M.R. and S.S.; data curation, M.R.; formal analysis, M.R., S.S.; funding acquisition, M.R.; investigation, M.R. and S.S.; methodology, M.R. and S.S.; validation, S.S.; writing—original draft preparation, M.R. and S.S.; writing—review and editing, M.R. All authors have read and agreed to the published version of the manuscript.
Funding
This research project is partially funded by Ort Braude College.
Institutional Review Board Statement
Not applicable.
Informed Consent Statement
Not applicable.
Data Availability Statement
All the data generated during this study are included in this article.
Acknowledgments
The assistance of Netzer Navot with processing the material is highly appreciated. The authors thank Y. Kauffmann for his assistance with the TEM study and L. Popilevsky for TEM specimen preparation.
Conflicts of Interest
The authors declare no conflict of interest.
References
- Mishra, R.S.; Mahoney, M.W.; McFadden, S.X.; Mara, N.A.; Mukherjee, A.K. High strain rate superplasticity in a friction stir processed 7070 Al alloy. Scr. Mater. 2000, 42, 163–168. [Google Scholar] [CrossRef]
- Cartigueyen, S.; Mahadevan, K. Influence of rotational speed on the formation of friction stir processed zone in pure copper at low-heat input conditions. J. Manuf. Process. 2015, 18, 124–130. [Google Scholar] [CrossRef]
- Barmouz, M.; Kazem, M.; Givi, B.; Jafari, J. Evaluation of tensile deformation properties of friction stir processed pure copper: Effect of processing parameters and pass number. J. Mater. Eng. Perform. 2014, 23, 101–107. [Google Scholar] [CrossRef]
- Xue, P.; Xiao, B.L.; Ma, Z.Y. Achieving large-area bulk ultrafine grained Cu via submerged multiple-pass friction stir processing. J. Mater. Sci. Technol. 2013, 29, 1111–1115. [Google Scholar] [CrossRef]
- Surekha, K.; Els-Botes, A. Development of high strength, high conductivity copper by friction stir processing. Mater. Des. 2011, 32, 911–916. [Google Scholar] [CrossRef]
- Xue, P.; Xiao, B.L.; Ma, Z.Y. High tensile ductility via enhanced strain hardening in ultrafine-grained Cu. Mater. Sci. Eng. A 2012, 532, 106–110. [Google Scholar] [CrossRef]
- Galvao, I.; Loureiro, A.; Rodrigues, D.M. Influence of process parameters on the mechanical enhancement of copper-DHP by FSP. Adv. Mat. Res. 2012, 445, 631–636. [Google Scholar]
- Salahi, S.; Rezazadeh, V. Fracture mechanism in friction stir processed annealed pure copper samples. World Appl. Sci. J. 2013, 23, 54–58. [Google Scholar]
- Cartigueyen, S.; Mahadevan, K. Study of friction stir processed zone under different tool pin profiles in pure copper. IOSR-JMCE 2014, 11, 6–12. [Google Scholar] [CrossRef]
- Barmouz, M.; Abrinia, K.; Khosravi, J. Using hardness measurement for dislocation densities determination in FSPed metal in order to evaluation of strain rate effect on the tensile behavior. Mater. Sci. Eng. A 2013, 559, 917–919. [Google Scholar] [CrossRef]
- Leal, R.M.; Galvao, I.; Loureiro, A.; Rodrigues, D.M. Effect of friction stir processing parameters on the microstructural and electrical properties of copper. Int. J. Manuf. Technol. 2015, 80, 1655–1663. [Google Scholar] [CrossRef]
- Barmouz, M.; Kazem, M.; Givi, B.; Seyfi, J. On the role of processing parameters in producing Cu/SiC metal matrix composites via friction stir processing: Investigating microstructure, microhardness, wear and tensile behavior. Mater. Charact. 2011, 62, 108–117. [Google Scholar] [CrossRef]
- Wang, Y.; Fu, R.; Jing, L.; Li, Y.; Sang, D. Grain refinement and nanostructure formation in pure copper during cryogenic friction stir processing. Mater. Sci. Eng. A 2017, 703, 470–476. [Google Scholar] [CrossRef]
- Wang, Y.; Fu, R.; Jing, L.; Sang, D.; Li, Y. Tensile behaviors of pure copper with different fraction of nonequilibrium grain boundaries. Mater. Sci. Eng. A 2018, 724, 164–170. [Google Scholar] [CrossRef]
- Wang, Y.; Fu, R.; Zhou, X.; Thompson, G.B.; Yu, Z.; Li, Y. Enhanced mechanical properties of pure copper with a mixture microstructure of nanocrystalline and ultrafine grains. Mater. Lett. 2016, 185, 546–549. [Google Scholar] [CrossRef]
- Wang, Y.; Wang, M.; Yin, K.; Huang, A.; Li, Y.; Huang, C. Yielding and fracture of coarse-grain/ultrafine-grain heterogeneous-structured copper with transitional interface. Trans. Nonferr. Met. Soc. China 2019, 29, 588–594. [Google Scholar] [CrossRef]
- Moaref, A.; Rabiezadeh, A. Microstructural evaluation and tribological properties of underwater friction stir procrssed CP-pure copper and its alloy. Trans. Nonferr. Met. Soc. China 2020, 30, 972–981. [Google Scholar] [CrossRef]
- Regev, M.; Spigarelli, S. Microstructure, Thermal Stability During Creep and Fractography Study of Friction Stir Processed AA2024-T3 Aluminum Alloy. J. Mater. Eng. Perform. 2020, 29, 4872–4878. [Google Scholar] [CrossRef]
- Jiang, M.; Devincre, B.; Monnet, G. Effects of the grain size and shape on the flow stress: A dislocation dynamics study. Int. J. Plast. 2019, 113, 111–124. [Google Scholar] [CrossRef] [Green Version]
- Panin, V.E.; Armstrong, R.W. Hall-Petch analysis for temperature and strain rate dependent deformation of polycrystalline lead. Phys. Mesomech. 2016, 19, 35–40. [Google Scholar] [CrossRef]
- Armstrong, R.W. 60 years of Hall-Petch: Past to present nano-scale connections. Mater. Trans. 2014, 55, 2–12. [Google Scholar] [CrossRef] [Green Version]
- Sandström, R.; Andersson, H.C. Creep in phosphorus alloyed copper during power-law breakdown. J. Nucl. Mater. 2008, 372, 76–88. [Google Scholar] [CrossRef]
- Jiang, J.; Britton, T.B.; Wilkinson, A.J. Evolution of dislocation density distributions in copper during tensile deformation. Acta Mater. 2013, 61, 7227–7239. [Google Scholar] [CrossRef]
- Schafler, E.; Zehetbauer, M.; Ungàr, T. Measurement of screw and edge dislocation density by means of X-ray Bragg profile analysis. Mater. Sci. Eng. A 2001, 319–321, 220–223. [Google Scholar] [CrossRef]
- Song, H.W.; Guo, S.R.; Hu, Z.Q. A coherent polycrystal model for the inverse Hall-Petch relation in nanocrystalline materials. Nanostruct. Mater. 1999, 11, 209–210. [Google Scholar] [CrossRef]
- Vijay, D. A review on inverse Hall-Petch relation in nano crystalline materials: Grain size effects. Phys. Rev. B 2016, 94, 1–8. [Google Scholar]
- Chokshi, A.H.; Rosen, A.; Karch, J.; Gleiter, H. On the validity of the Hall-Petch relationship in nanocrystalline materials. Scr. Mater. 1989, 23, 1679–1684. [Google Scholar] [CrossRef] [Green Version]
- Emeis, F.; Peterlechner, M.; Wilde, M. Hall-Petch relations of severely deformed Cu, Ni, and Cu-Ni alloys: Analysis of the dislocation blockage strength of defprmed-modified grain boundaries. Adv. Eng. Mater. 2019, 22, 1–10. [Google Scholar] [CrossRef]
- Yang, M.C.; Ye, F.; Sun, X.C.; Sun, X.K.; Wei, W.D. Study on microhardness of bulk nanocrystalline copper. Nanostruct. Mater. 1997, 9, 481–484. [Google Scholar] [CrossRef]
- Jang, J.S.; Koch, C.C. The Hall-Petch relationship in nanocrystalline iron produced by ball milling. Scr. Mater. 1990, 24, 1599–1604. [Google Scholar] [CrossRef]
Figure 1.
The processing tools: (a) cylindrical (b) square.

Figure 2.
Optical micrographs: (a) parent metal (b) friction-stir-processed material.

Figure 3.
Microhardness profiles across the stir zone.

Figure 4.
SEM micrographs of the fracture surface of broken tensile specimens: (a) parent material; (b) friction-stir-processed (FSP’ed) specimen.
Figure 4.
SEM micrographs of the fracture surface of broken tensile specimens: (a) parent material; (b) friction-stir-processed (FSP’ed) specimen.

Figure 5.
TEM bright-field (BF) micrographs taken near <> Z.A.: (a,b) parent material; (c) FSP’ed material; (d) SADP of <> Z.
Figure 5.
TEM bright-field (BF) micrographs taken near <> Z.A.: (a,b) parent material; (c) FSP’ed material; (d) SADP of <> Z.


Table 1.
Friction stir processing (FSP) list of experiments.
| Experiment | ω (rpm) | v (mm/min) | Pin |
|---|---|---|---|
| 1 | 600 | 50 | cylindrical |
| 2 | 600 | 50 | square |
| 3 | 900 | 50 | cylindrical |
| 4 | 900 | 50 | square |
| 5 | 900 | 100 | cylindrical |
| 6 | 900 | 100 | square |
| 7 | 900 | 30 | square |
| 8 | 1200 | 30 | square |
Table 2.
Tensile test results.
| Type | Yield Strength (MPa) | UTS (MPa) | Elongation (%) |
|---|---|---|---|
| PM | 208.2 | 265 | 37 |
| PM | 234 | 300.9 | 36.25 |
| PM | 209.9 | 269.4 | 36.5 |
| PM | 246.6 | 317.6 | 38.5 |
| PM | 221.6 | 273.6 | 37 |
| PM | 228.2 | 279.9 | 35 |
| FSP’ed | 115.4 | 217.9 | 49.9 |
| FSP’ed | 151.5 | 251.2 | 43.4 |
| FSP’ed | 120.6 | 216.5 | 48.5 |
| FSP’ed | 155.1 | 246.6 | 41.5 |
| FSP’ed | 114.4 | 218.1 | 49.3 |
| FSP’ed | 151.9 | 257.2 | 40.65 |
Publisher’s Note: MDPI stays neutral with regard to jurisdictional claims in published maps and institutional affiliations. |
© 2021 by the authors. Licensee MDPI, Basel, Switzerland. This article is an open access article distributed under the terms and conditions of the Creative Commons Attribution (CC BY) license (https://creativecommons.org/licenses/by/4.0/).
Share and Cite
MDPI and ACS Style
Regev, M.; Spigarelli, S. A Study of the Metallurgical and Mechanical Properties of Friction-Stir-Processed Cu. Metals 2021, 11, 656. https://doi.org/10.3390/met11040656
AMA Style
Regev M, Spigarelli S. A Study of the Metallurgical and Mechanical Properties of Friction-Stir-Processed Cu. Metals. 2021; 11(4):656. https://doi.org/10.3390/met11040656
Chicago/Turabian StyleRegev, Michael, and Stefano Spigarelli. 2021. "A Study of the Metallurgical and Mechanical Properties of Friction-Stir-Processed Cu" Metals 11, no. 4: 656. https://doi.org/10.3390/met11040656
Note that from the first issue of 2016, this journal uses article numbers instead of page numbers. See further details here.