Article

Experimental Study of the Mg-Ni-Y System at 673 K Using Diffusion Couples and Key Alloys

by
Mohammad Mezbahul-Islam
1,
Dmytro Kevorkov
1 and
Mamoun Medraj
1,2,*
1
Department of Mechanical and Industrial Engineering, Concordia University, 1455 de Maisonneuve Blvd. West, Montreal, QC H3G 1M8, Canada
2
Mechanical and Materials Engineering, Masdar Institute, P.O. Box 54224, Abu Dhabi, UAE
*
Author to whom correspondence should be addressed.
Metals 2015, 5(3), 1746-1769; https://doi.org/10.3390/met5031746
Submission received: 1 September 2015 / Revised: 15 September 2015 / Accepted: 16 September 2015 / Published: 22 September 2015

Abstract

:
Three solid-solid and two solid-liquid diffusion couples together with 32 key samples were used to construct the isothermal section of the Mg-Ni-Y system at 673 K. The present investigation revealed 12 ternary intermetallic compounds. Crystal structures of two ternary compounds τ1 (Gd4RhIn prototype with lattice parameter of a = 1.3666 nm) and τ2 (Mo2FeB2 prototype with lattice parameters of a = 0.7395 nm and c = 0.3736 nm) were determined. The phase relations and ternary solubility of the binary and ternary compounds at 673 K were determined using scanning electron microscopy (SEM), wave dispersive X-ray spectrometer (WDS) and X-ray diffraction (XRD) analysis.

Graphical Abstract

1. Introduction

Mg-based alloys are widely used in structural applications because of their high strength to weight ratio. Light weight alloys reduce the fuel consumption of automobiles. The innovation and rapid development of Mg-based metallic glass can further improve the physical and chemical properties of these alloys. It has been found that amorphization to produce metallic glass by a higher cooling rate improves the mechanical strength, hardness and corrosion resistance compared to the crystalline alloys [1,2,3,4,5]. Some of the promising metallic glasses with large super cooled liquid region have been reported in the Mg-Ni-Y system [1,6]. In addition to structural applications, Mg-Ni-Y alloys have been used for hydrogen storage purpose [7]. Mg2Ni has been used commercially as hydrogen storage material. It is found that addition of Y to Mg2Ni improves the rate and amount of hydrogen absorption [7]. It is also found that amorphization increases the hydrogen storage capacity of the crystalline alloys [8,9] due to their short-range order structures and extra free volume. This enhances the diffusion and site occupation of the hydrogen atoms in the amorphous matrix [10]. It is possible to have new metallic glass alloys suitable for hydrogen storage application in the Mg-Ni-Y system. Thus a clear understanding of the phase equilibrium in the Mg-Ni-Y system is required.
Figure 1. (a) Isothermal section of the Mg-Ni-Y system at 673 K (Ni-rich part) [11]; (b) Calculated isothermal section of the Mg-Ni-Y system at 673 K [16].
Metals 05 01746 g001
Limited amount of experimental work has been done on this system. Yao et al. [11] investigated the 673 K isothermal section of the Ni-rich region using X-ray diffraction (XRD), scanning electron microscopy (SEM), and differential thermal analysis (DTA) and reported a partial section as shown in Figure 1a. They [11] confirmed the occurrence of two ternary compounds τ3 (MgNi4Y) and τ4 (Mg2Ni9Y). The compositions of these ternary compounds were reported earlier by Kadir et al. [12,13,14] and Aona et al. [15]. Mezbahul-Islam and Medraj [16] thermodynamically optimized the system based on the available experimental data until 2009 as shown Figure 1b. Later the same authors [17] published a partial isothermal section along the Mg-NiY line at 673 K. They [17] reported the presence of five new ternary compounds, τ2 (Mg3Ni2Y4), τ5 (MgNi2Y2), τ6 (MgNiY), τ10 (Mg5NiY), and τ11 (Mg8–13NiY) based on key sample analysis. Recently, Wang et al. [18] reported two isothermal sections with less than 50 at% Y at 673 and 773 K. The experimental investigation of Wang et al. [18] confirmed the presence of three ternary compounds, τ3 (MgNi4Y), τ4 (Mg2Ni9Y) and τ5 (MgNi2Y2). Another investigation by Jiang et al. [19] proved the existence of a Mg-rich ternary compound τ11 (Mg91Ni4Y5). However, complete understanding of the phase relations across the whole compositional range is still unknown. It can be seen in the previous works that either the Ni-rich or the Mg-rich side of the Mg-Ni-Y system had been experimentally investigated. However, other ternary compounds may still exist which will make the phase relations significantly different in this system. The chemistry of the phases and their structural details should be further studied. Therefore, it was decided to investigate the system experimentally in order to have better understanding of the phase equilibria for the whole composition range.

2. Experimental Procedure

In order to establish the phase relations, three solid-solid and two solid-liquid diffusion couples together with 32 key samples were utilized. The actual composition of the key alloys along with the terminal composition of the diffusion couples’ end-members are shown in Figure 2. The diffusion couple is a powerful and efficient technique for mapping the phase diagram of ternary systems [20,21,22]. It also eliminates the problems associated with alloy preparation especially for the systems with high melting temperatures [23]. Within the diffusion layers the equilibrium phases occur, whereas at the interface local equilibrium takes place [23]. However, one should always consider the possibility of missing phases [23,24] while using the diffusion couple for determining the phase diagram. This may occur because of the slow nucleation of the phase which prevents formation of the diffusion layer. In order to obtain more reliable information, Kodentsov et al. [23], among others, suggested to combine the diffusion couple method with key sample analysis. Therefore, in the present work both of these techniques were used.
Figure 2. Actual global composition of the Mg-Ni-Y alloys. Dotted lines show the diffusion couples. SS and SL refer to the solid-solid and solid-liquid diffusion couples.
Metals 05 01746 g002
The key alloys were prepared using an arc melting furnace equipped with a water cooled copper crucible under flowing argon. The purity of the elements used was Cu–99.99%, Ni–99.99%, and Y–99.9%, all supplied by Alfa Aesar (Haverhill, MA, USA). The furnace chamber was evacuated and purged by argon several times before melting. Each alloy was crushed and remelted at least four times to ensure homogeneity. The actual global composition of the samples was identified by Inductively Coupled Plasma-Optical Emission Spectrometry (ICP-OES) (Ultima-2 ICP from Horiba Scientific, Edison, NJ, USA). The solid-solid diffusion couples were prepared from two end-member blocks of pure Mg, binary or ternary alloys. Contacting surfaces of these blocks were pre-grinded down to 1200 grit using SiC paper and polished with 1 µm diamond paste and 99% ethanol as a lubricant. The blocks were pressed together using clamping rings, placed in a Ta container and sealed in a quartz tube under protective Ar atmosphere. The key alloys and diffusion couples were annealed at 673 K for 4 weeks. Although a higher annealing temperature is desirable for faster kinetics, this temperature should be chosen below the lowest melting point in the system to avoid melting during annealing. In the present work, the annealing temperature was chosen based on the lowest eutectic of the three pertinent binary systems. Among the three binaries the lowest eutectic occurs in the Mg-Ni system at around 782 K. Therefore, it was decided to anneal the samples at 673 K to reach equilibrium faster without melting. These alloys were then characterized by light optical microscopy, scanning electron microscopy (SEM) and wave dispersive X-ray spectrometer (WDS) using point and line scans. The Hitachi (Tokyo, Japan) S-3400N SEM (equipped with WDS and EDS Oxford® (Abingdon, UK) detectors was used for the elemental analysis. The error of the WDS measurements was estimated to be around ±1 at%. The XRD patterns were obtained using a PANanalytical Xpert Pro powder X-ray diffractometer (Almelo, The Netherlands) with a CuKα radiation. The XRD spectrum was acquired from 20° to 120° 2θ with a 0.02° step size. XRD analysis of the samples was carried out using X’Pert HighScore Plus Rietveld analysis software (Almelo, The Netherlands).

3. Results and Discussion

3.1. Diffusion Couple Analysis

3.1.1. Solid-Solid Diffusion Couple 1

Backscatter electron (BSE) images of the solid-solid diffusion couple 1 are shown in Figure 3. This diffusion couple is between Mg and sample 20 (18.5/22.4/59.1 Mg/Ni/Y at%) as shown in Figure 2. The ternary alloy consists of three phases: NiY, τ1 (MgNiY4) and τ5 (Mg29Ni20Y42). These end members were chosen in order to identify the intermetallic compounds located in the Mg-Y side of the Gibbs triangle. The diffusion couple was annealed for four weeks at 673 K. During the heat treatment, extensive interdiffusion among Mg, Ni, and Y took place allowing various equilibrium phases to form. Each layer represents a phase which is in equilibrium with its adjacent layers. The microstructure of the diffusion couple with increased magnification of the area of interest is shown in Figure 3b. The compositions of the formed phases were detected by the WDS point analysis. The WDS line scans were used to determine the solubility ranges and phase equilibria among the intermetallics. The same approach was used to study other diffusion couples.
Figure 3. (a) Solid-solid diffusion couple of Mg–sample 20 (18.5/22.4/59.1 Mg/Ni/Y at%) annealed at 673 K for 4 weeks; (b) Magnified area of interest.
Metals 05 01746 g003
The diffusion path through the entire system is shown in Figure 4a. The composition profile as shown in Figure 4b explains the configuration of these layers and has been used to distinguish each layer. By taking advantage of the local equilibrium at the interfaces formed between the layers, the sequence of phases along the diffusion path can be deduced as:
{NiY + τ1 + τ5} (end-member 1) → τ5 → τ6 → τ9 → Mg2Y(δ) → Mg24Y5(ε) → τ12 → {hcp-Mg} (end-member 2).
Figure 4. (a) Diffusion path projected on the Mg-Ni-Y Gibbs triangle; (b) Composition profile of the diffusion couple 1 along the line scan shown in Figure 3.
Metals 05 01746 g004
The first diffusion layer was found to have a composition of Mg32.9Ni22.5Y44.6. According to the SEM/WDS analysis this layer was identified as a ternary compound, τ5 (Mg29Ni20Y42). The layer is thin (~4 μm), but can be seen clearly at higher magnification in Figure 3b. After that the diffusion path reaches the second layer with a composition of Mg35.4Ni31.5Y33.1, which is also a ternary compound, τ6. The layer is about 5 µm in width. The composition of this layer indicates a ternary compound of almost equal amount of each element suggesting the MgNiY formula. The next diffusion layer represents τ9 (Mg57Ni18Y25), which is another ternary compound with approximate composition of Mg59.1Ni16.5Y24.4. These three intermetallics, τ5, τ6, and τ9 are considered as stoichiometric ternary compounds as the compositional profile in Figure 4b does not show any evidence for significant atomic replacement. Also, considering local equilibrium at the interfaces, τ5 is in equilibrium with τ6 and τ5 is in equilibrium with τ9. The next diffusion layer represents Mg2Y(δ). The width of this layer is about 30 µm. After Mg2Y(δ), a large layer of about 90 µm width which was identified as Mg24Y5(ε) forms. Ni solubility in both Mg2Y(δ) and Mg24Y5(ε) was found to be very small (~0.5 at%) which can be considered negligible because it is smaller than the measurement error (±1 at%). However, the maximum Ni solubility could not be confirmed using this diffusion couple as the diffusion path crossed both Mg2Y(δ) and Mg24Y5(ε) laterally. The maximum solubility of Ni in these compounds was confirmed using key samples as is discussed in Section 3.2. The homogeneity range of Mg2Y(δ) and Mg24Y5(ε) in the Mg-Y binary is about 70.5–75.8 and 84.2–88.1 at% Mg respectively, at 673 K [25,26]. In this diffusion couple, the solubility was found as 74.8–75.6 and 85–86.3 at% Mg for Mg2Y(δ) and Mg24Y5(ε), respectively which are within the reported solubility [25,26]. The next diffusion layer represents τ12 (Mg15NiY) with a composition of Mg86.8Ni5.5Y7.7. The composition profile of this layer in Figure 4b shows variation of Mg content from ~86.3 at% to ~89.0 at%, which demonstrates the homogeneity range of τ12. The concentration of Ni and Y changes from ~4.6 to 5.9 at% Ni and ~6.7 to 8.1 at% Y. A very thin white layer can be seen in Figure 3a. WDS analysis of this thin layer revealed a composition that represents τ3 (MgNi4Y) which was reported earlier [14]. This indicates equilibrium relationship between τ12 and τ3. However this layer could not be shown in Figure 4b because it is very thin. The diameter of the WDS probe is 2 μm which is larger than this layers’ thickness. The phase relation: τ12 + τ3 was confirmed by key samples as is discussed later.

3.1.2. Solid-Solid Diffusion Couple 2

The second solid-solid diffusion couple was used to identify and understand the ternary compounds in the Mg-Ni side of the Mg-Ni-Y system. The two end members have the compositions of 6.2/64.9/28.9 and 55.5/36.6/7.9 Mg/Ni/Y at%. End member 1 is in a two phase region consisting of NiY (0.7/50.3/49.0 Mg/Ni/Y at%) and τ3 (7.1/66.4/26.5 Mg/Ni/Y at%), whereas end member 2 is located in a three phase region of τ3 (19.2/65.5/15.3 Mg/Ni/Y at%), Mg2Ni (66.8/31.4/1.8 Mg/Ni/Y at%) and τ12 (91.4.1/4.2/4.4 Mg/Ni/Y at%). These end members were selected to obtain the maximum amount of information. They contain a common phase τ3 which dominates in this part of the phase diagram. In diffusion couple 1 shown in Figure 3a, a thin layer with a composition similar to τ3 was observed within the τ12 phase. It reflects that τ3 is in equilibrium with τ12. Due to the locations of τ3 and τ12 (shown in Figure 4), it is possible that τ3 will have an equilibrium relation with each ternary compound located on the Mg-NiY line. Therefore, a successful diffusion couple with these end members will not only provide information about the presence of any new compounds but will also establish the phase relationship in this region.
The BSE image of the diffusion zone can be seen in Figure 5. It was very difficult to obtain a better diffusion layer due to the formation of a crack during the heat treatment. Only localized diffusion could be obtained which is analyzed here to extract information of the phase relationship. Five diffusion layers were identified and a line scan through these layers is shown in Figure 6a. Based on the WDS analysis, the diffusion path was estimated as projected on the Gibbs triangle in Figure 6b. The dotted line in Figure 6b shows the tentative phase relations of NiY-τ6 and τ68 as the diffusion couple did not form τ6. However, these phase relationships were proven later by the key samples. The diffusion starts with the formation of a white bush shape layer which was identified as NiY. The next layer is about 15 µm thick and was identified as a stoichiometric ternary compound, τ8 (Mg2NiY) with of 51.0/24.7/24.2 Mg/Ni/Y at% composition. The next layer is quite thin and is about 6 µm. According to the WDS analysis, its composition is 74.7/12.9/12.4 Mg/Ni/Y at%. It represents another ternary compound, τ10 (Mg6NiY). The subsequent layer is τ11 (Mg9NiY). This layer is about 20 µm thick. The compositional profile in Figure 6a shows a concentration gradient for this compound. The Mg concentration increased from 82.3 at% to 84.1 at%. Whereas, the variation of Ni and Y concentration was found from 7.9–7.1 at% Ni and 9.8–8.7 at% Y. This suggests the presence of the solubility for τ11 where Mg has been replaced by Ni and Y. After this layer, the diffusion ends in the three-phase region (Mg2Ni + τ12 + τ3) of end member 2. The BSE image of the diffusion zone in Figure 5, shows that τ3 is in contact with all the diffusion layers. This demonstrates that τ3 has an equilibrium phase relation with each compound on the Mg-NiY line. Some of the phase triangulations are confirmed using the key samples.
Figure 5. Backscatter electron (BSE) images of the solid–solid diffusion couple 2 annealed at 673 K for 4 weeks.
Metals 05 01746 g005
Figure 6. (a) Composition profile of the diffusion couple 2 along the line scan shown in Figure 5; (b) Extracted phase equilibria based on the solid-solid diffusion couple 2 projected on the Mg-Ni-Y Gibbs triangle. Dotted line indicates expected phase equilibria which is not recognized in DC 2.
Metals 05 01746 g006

3.1.3. Solid-Solid Diffusion Couple 3

The third solid-solid diffusion couple was prepared to confirm some of the ternary compounds already identified in the first two diffusion couples. End members of this diffusion couple are Mg and a ternary alloy with the composition 6.2/64.9/28.9 Mg/Ni/Y at%. This alloy is located in the two-phase region of NiY and τ3. The BSE image of the diffusion couple is shown in Figure 7a,b with increased magnification.
Figure 7. (a) BSE images of the solid-solid diffusion couple-3 annealed at 673 K for 4 weeks; (b) Magnified area of interest.
Metals 05 01746 g007
Figure 8. (a) Composition profile along the line scan shown in Figure 7b; (b) Extracted phase equilibria based on the solid-solid diffusion couple 3 projected on the Mg-Ni-Y Gibbs triangle. Dotted lines indicate expected phase equilibria which are not recognized in DC 3.
Metals 05 01746 g008
The BSE image in Figure 7b shows the formation of a small region with five diffusion layers. In order to identify them properly, a WDS line scan was performed. The composition profile as a result of the line-scan has been shown in Figure 8a. It reveals five ternary compounds. These compounds are τ6 (MgNiY), τ7 (Mg8Ni5Y5), τ8 (Mg2NiY), τ11 (MgxNiY, x 9–13), and τ12 (MgxNiY, x 13–18). Except τ7 (Mg8Ni5Y5), other ternary compounds were identified in the previous two diffusion couples. The phase relations confirmed from this diffusion couple are: {NiY + τ3} (end-member 1)/τ3 + τ6 + τ73 + τ7 + τ83 + τ11 + τ123 + τ12/{τ12 + hcp-Mg} (end-member 2). τ11 (81.7–83.5 at% Mg, 7.9–7.3 at% Ni, 10.4–9.2 at% Y) and τ12 (86.3–89.5 at% Mg, 6.0–4.6 at% Ni, 7.7–5.9 at% Y) show some solubility as can be seen in the composition profile in Figure 8a. Both of these compounds show similar type of solubility where Mg has been replaced by an almost equal amount of Ni and Y. The phase relations obtained based on the solid-solid diffusion couple 3 are shown in Figure 8b. The ternary compounds identified in all the three solid-solid diffusion couples are shown with red squares. It can be observed that τ9 and τ10 did not form in these diffusion couples. However, the possibility of a missing phase is a common phenomenon in diffusion couples [23]. Sometimes, the nucleation and growth of a phase are too slow to form a diffusion layer to be detected by SEM. In order to overcome this uncertainty a combined investigation with key sample analysis has been carried out and will be discussed in Section 3.2.

3.1.4. Solid-Liquid Diffusion Couple

Two solid-liquid diffusion couples were used to confirm the existence of the ternary compounds identified in the three prior solid-solid diffusion couples. The diffusion zone in solid-solid diffusion couples 2 and 3 (Figure 5 and Figure 7) is quite localized and restricted to a small region because of a not ideal contact between the faying surfaces of the end members. To improve the contact and obtain continuous diffusion layers Mg block was partly melted on top of two different alloy blocks (Ni78Y22 and Ni52Y48) in an induction melting furnace to form two diffusion couples. This improved the contact and formed continuous diffusion layers as can be seen in Figure 9 and Figure 10.
Figure 9. (a) BSE images of the solid–liquid diffusion couple-1 (Mg-Ni78Y22) annealed at 673 K for 4 weeks; (b) Magnified area of interest; (c) Schematic representation of the phase relations of the diffusion zone in Figure 9b.
Metals 05 01746 g009
Figure 10. (a) BSE images of the solid–liquid diffusion couple-2 (Mg-Ni52Y48) annealed at 673 K for 4 weeks; (b) Magnified area of interest.
Metals 05 01746 g010
The BSE image of the solid-liquid diffusion couple 1 (Mg-Ni78Y22) in Figure 9a shows a three-phase region among hcp-Mg, Mg2Ni and τ12 in contact with pure Mg. Diffusion layers containing three phases are not possible in a ternary system. This area was formed as a result of reaction between molten Mg and solid Ni78Y22 end member, generating an alloy in the three-phase region of hcp-Mg + Mg2Ni + τ12. According to the EDS area scan the average composition of this layer is 84.8/12.6/2.6 Mg/Ni/Y at%. This 3-phase alloy has been considered as the end member of this diffusion couple. The first diffusion layer is τ3 as can be seen in Figure 9b. The layer is uneven and showed teeth like formation as can be seen in Figure 9b inset. The Gibbs energy of formation of the end member phases: Ni3Y and Ni7Y2 is −34.4 and −33.1 kJ/mole·atom, respectively [16]. Since both have comparable energy of formation ΔG, the diffusion kinetics play a more important role for this type of layer formation. In order to explain the phase relations obtained from this diffusion couple a schematic drawing of the diffusion zone is shown in Figure 9c. The following phase relations can be extracted: (i) Ni3Y + Ni7Y2 {end member 1}; (ii) τ3 + Ni7Y2; (iii) τ3 + Ni3Y; (iv) τ3 + Mg2Ni; (v) τ3 + Ni3Y + Ni7Y2 and (vi) Mg2Ni + τ12 + hcp-Mg {end member 2}. A line WDS analysis was performed as can be seen in Figure 9b. The composition profile based on the WDS scan is shown in Figure 11. The homogeneity range of τ3 was found from 14.5 to 19.3 at% Mg with a constant amount of about 64 at% Ni. The solubility limit of this compound was confirmed using key samples and discussed in Section 3.2. Also, the maximum solubility of Y in Mg2Ni was found to be about 3.5 at%. No solubility of Y or Ni could be detected in the hcp-Mg phase.
Figure 11. Composition profile of the solid-liquid diffusion couple-1 along the line scan shown in Figure 9b.
Metals 05 01746 g011
The 2nd solid-liquid diffusion couple (Mg-Ni52Y48) in Figure 10 also indicates reaction between liquid Mg and the end member Ni52Y48. It produced an alloy (Mg78.4Ni15.5Y6.1) containing τ12 and Mg2Ni. This alloy is considered as an end member of this diffusion couple. Four diffusion layers formed after annealing and a line WDS scan was carried out through them as can be seen in Figure 10b. The composition profile and diffusion path deduced from the line scan is shown in Figure 12a,b. Three intermetallic compounds τ6 (~32.0/31.5/36.5 Mg/Ni/Y at%), τ7 (~42.1/26.2/31.7 Mg/Ni/Y at%) and τ8 (~48.3/23.5/28.1 Mg/Ni/Y at%) are identified in the first three layers as can be seen in Figure 12a. In between τ6 and τ7 another layer can be seen which is found to have less Mg concentration (~39 at%) than τ7 (42 at%). This indicates that τ7 may have a narrow solubility range. However, none of the previous diffusion couples showed any solubility of τ7. Hence, this solubility was not considered while constructing the isothermal section. Also, in all of these layers small precipitates of another phase can be seen. Spot WDS analysis revealed this as τ3. This means that τ3 is in equilibrium with all of the ternary compounds in this diffusion couple. This is in agreement with the previous diffusion couples. The fourth diffusion layer is a two-phase region between τ11 and τ12. After this the diffusion terminates in the two phase region of Mg2Ni and τ12.
Figure 12. (a) Composition profile of the solid–liquid diffusion couple-2 along the line scan shown in Figure 10b; (b) Extracted phase equilibria based on the solid-liquid diffusion couple-2 projected on the Mg-Ni-Y Gibbs triangle. Dotted lines indicate expected phase equilibria which are not recognized in this DC.
Metals 05 01746 g012

3.2. Isothermal Section based on Diffusion Couples and Key Sample Analysis

In addition to the diffusion couples 32 key alloys were studied in order to construct the isothermal section at 673 K. The BSE images of selected key alloys are shown in Figure 13. The WDS analysis of all the key samples was performed, the samples were grouped based on the phase analysis and are discussed accordingly. The occurrence of twelve ternary compounds (τ1–τ12) in the Mg-Ni-Y system was confirmed. Among these only two, τ3 and τ4 were reported in the literature [12,13,14,15]. Based on the current analysis, approximate composition of all the compounds was obtained. The composition and homogeneity range of these ternary compounds are listed in Table 1. The ternary solubility of the binary compounds was also determined. The maximum Ni solubility in MgY(γ), Mg2Y(δ) and Mg24Y5(ε) was found to be ~1.0 at% Ni. Among the Ni-Y compounds, Ni17Y2 and NiY dissolved about 3.5 and 1.3 at% Mg. The solubility of Mg in Ni3Y, Ni4Y and NiY3 is negligible (~0.5 ± 1 at% Mg). Both, Mg2Ni and MgNi2 were found to dissolve about 4.0 at% Y.
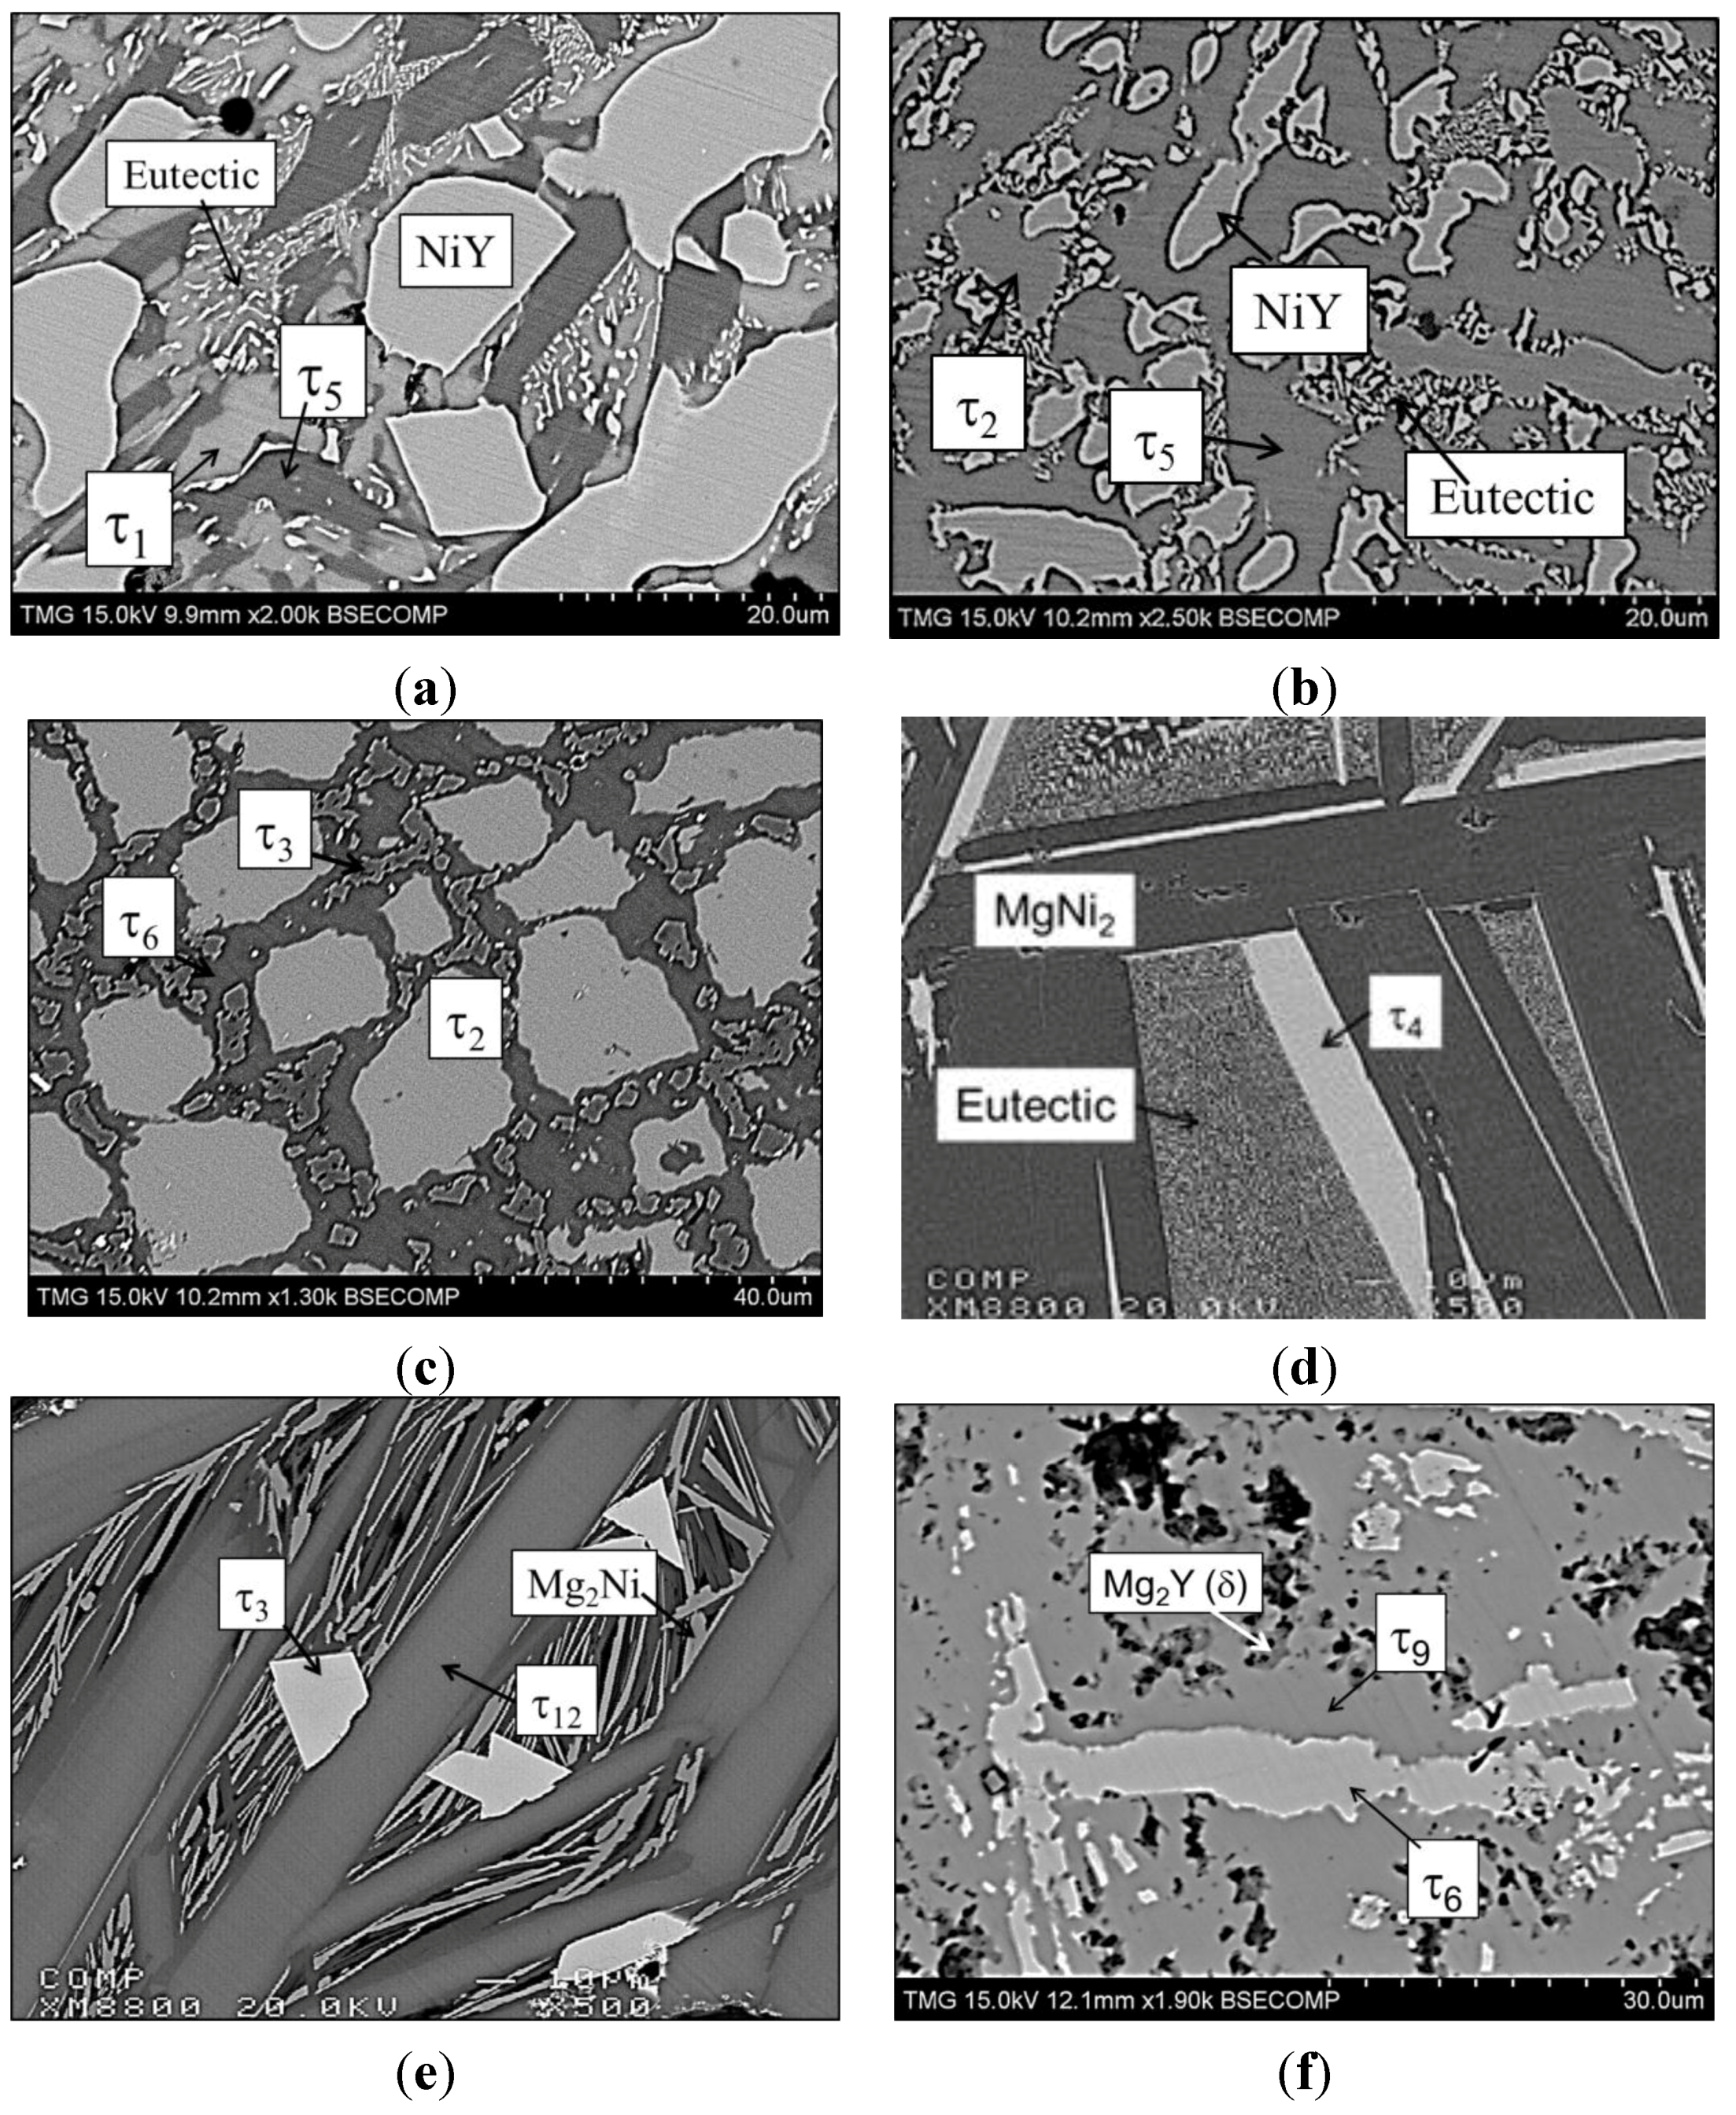
Figure 13. BSE image of (a) sample 1 (19.5/29.5/51.0 Mg/Ni/Y at%); (b) sample 9 (25.0/30.3/44.7 Mg/Ni/Y at%); (c) sample 11 (26.0/38.2/35.8 Mg/Ni/Y at%); (d) Sample 18 (28.7/69.1/2.2 Mg/Ni/Y at%); (e) sample 25 (78.2/15.5/6.3 Mg/Ni/Y at%); (f) sample 30 (54.0/15.9/30.1 Mg/Ni/Y at%).
Metals 05 01746 g013
The presence of the ternary compound τ
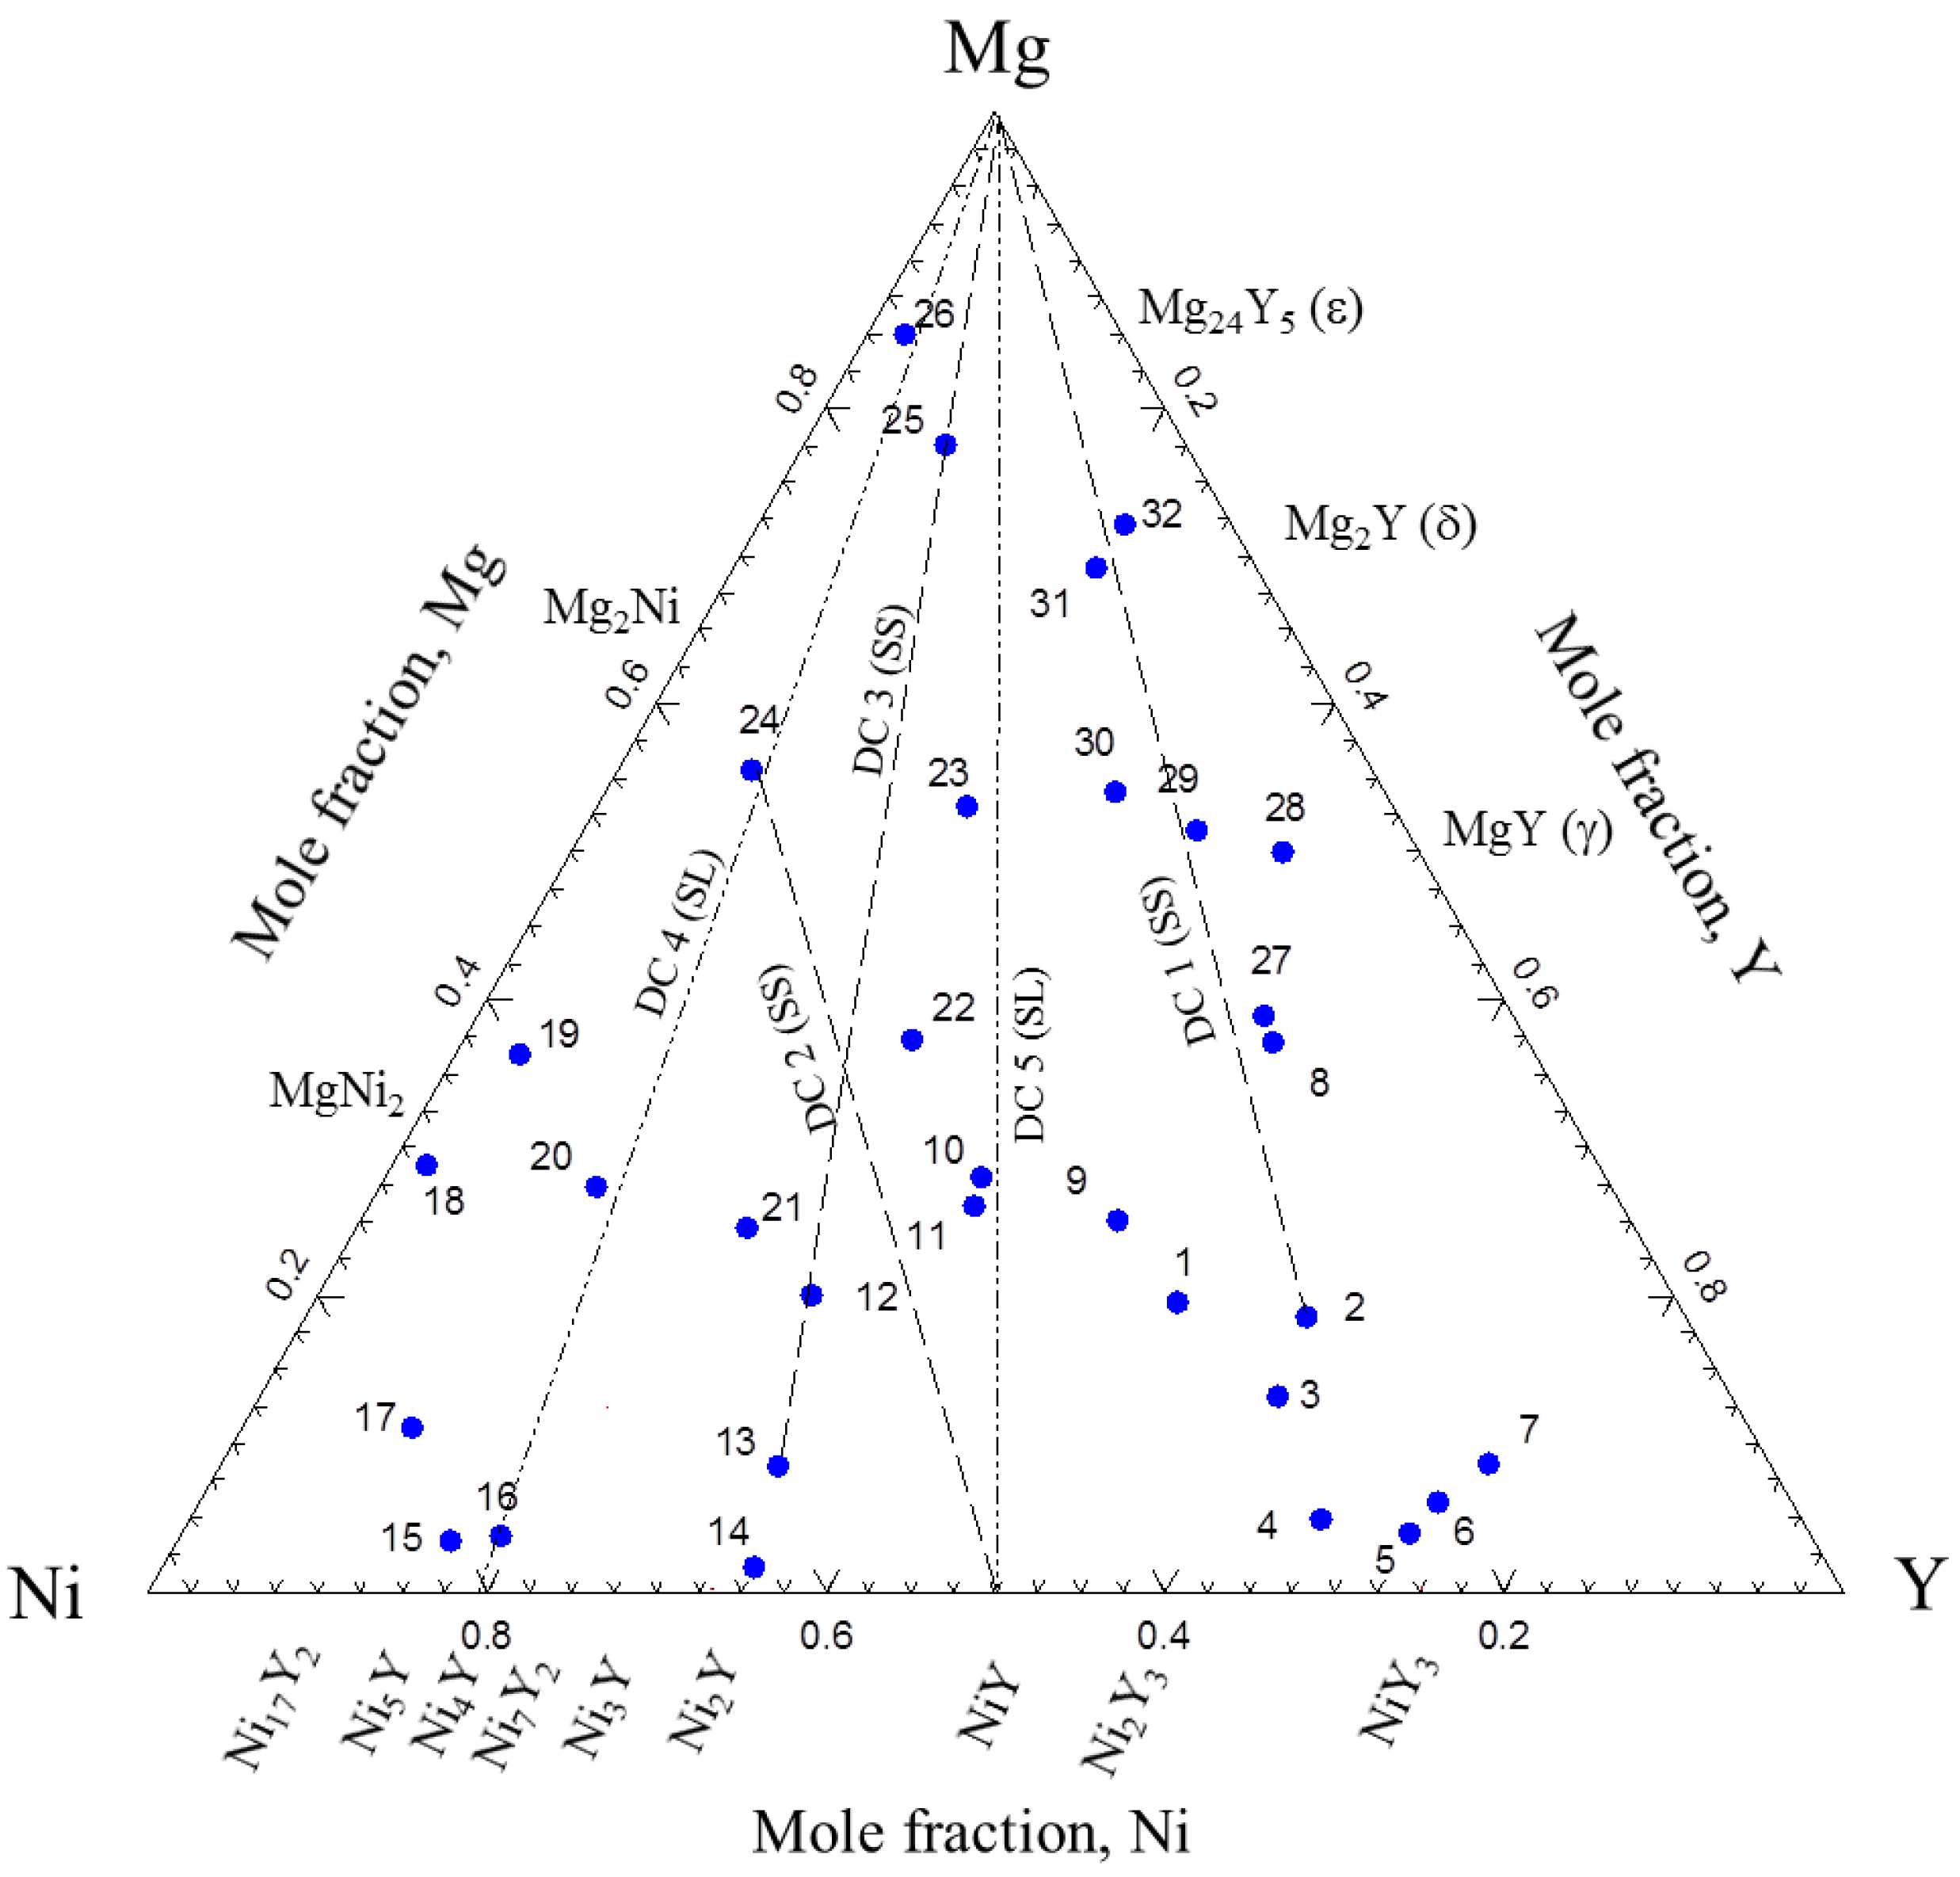
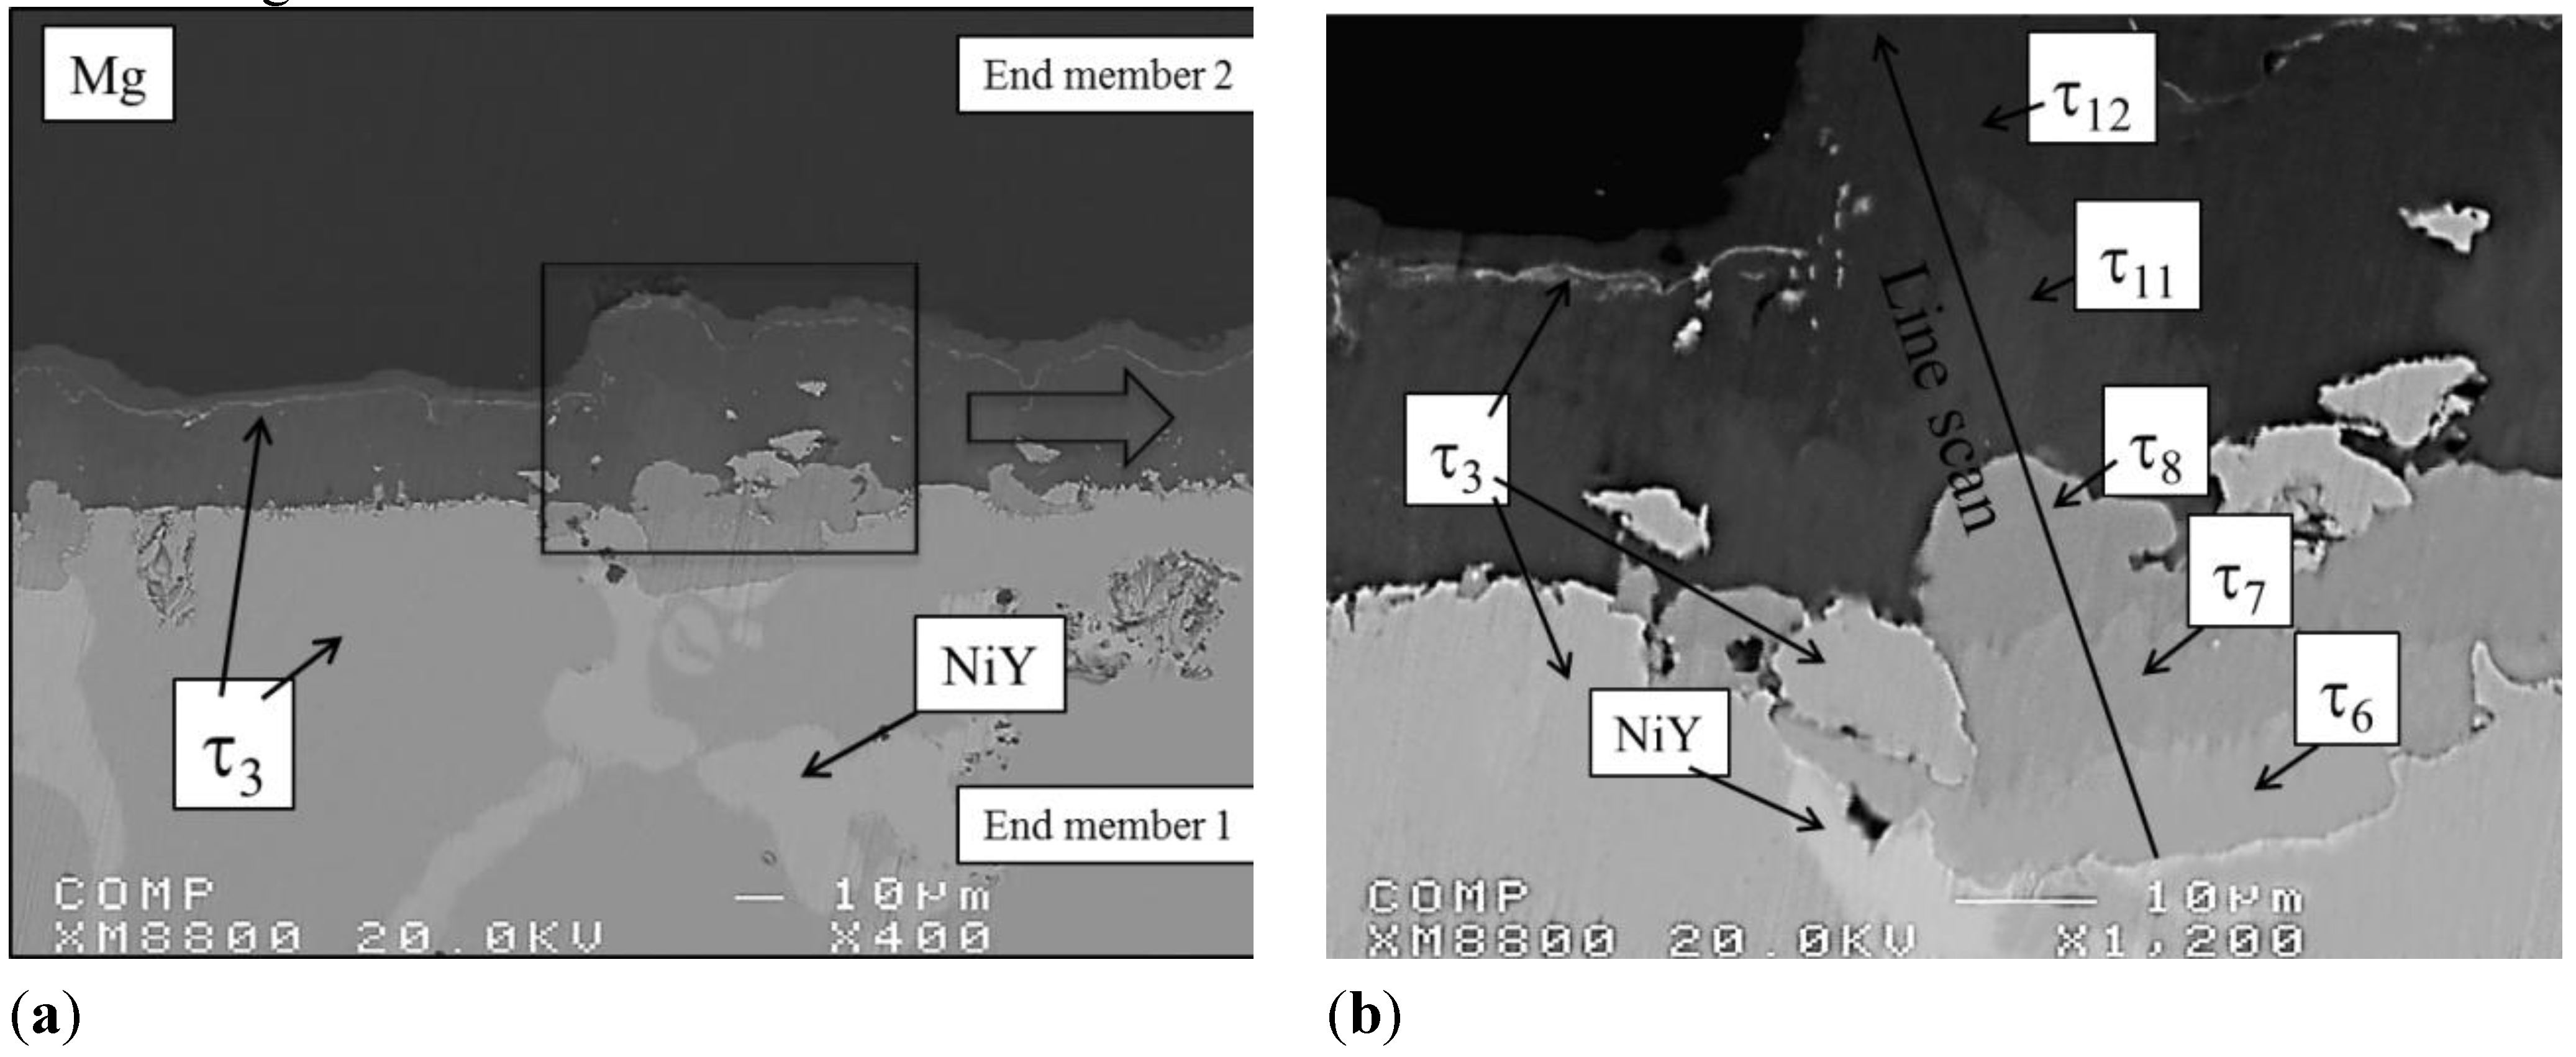
1 and the phase relationship in the Y-rich portion of the phase diagram were confirmed by the analysis of eight key samples 1–8. The actual composition of the alloys are shown in Figure 2. In all these alloys, τ1 is positively identified. The WDS analysis listed in Table 2 shows a range of composition (~15–20 at% Mg, ~16–20 at% Ni) of τ1 suggesting solid solubility. Variation in all the three elements indicates random substitution of atoms. Therefore, a relatively round region has been assigned to demonstrate the solubility range of τ1. According to the WDS analysis of τ1 containing alloys (1–8), five three-phase regions were also established: τ1 + NiY + Ni2Y3, τ1 + NiY3 + Ni2Y3, τ1 + NiY + τ5, τ1 + MgY + τ5 and τ1 + NiY3 + hcp-Y.
Table 1. Ternary intermetallic compounds in the Mg-Ni-Y system.
PhaseCrystal StructureLattice Parameter (nm)Homogeneity RangeRef.
ac
τ1-MgNiY4Gd4RhIn1.3666 15–20 at% MgThis work
16–20 at% Ni
τ2-MgNi2Y2Mo2FeB20.7395(9)0.3736(3) This work
τ3-MgNi4YMgCu4Sn0.71853 11–23 at% MgThis work
~66.6 at% Ni
τ4-Mg2Ni9YMg2Ni9La0.48666(5)2.37733(5) [12]
τ5-Mg29Ni20Y42Unknown This work
τ6-MgNiYUnknown This work
τ7-Mg8Ni5Y5Unknown This work
τ8-Mg2NiYUnknown This work
τ9-Mg57Ni18Y25Unknown This work
τ10-Mg6NiYUnknown This work
τ11-Mg9NiYUnknown 85.6–89.0 at% MgThis work
at%Ni/at%Y 1
τ12-Mg15NiYUnknown 81.6–85.0 at% MgThis work
at%Ni/at%Y 1
Table 2. Wave dispersive X-ray spectrometer (WDS) data of the samples 1–8 annealed at 673 K.
Actual CompositionIdentified Phases
No.at%NameComposition by WDS
MgNiYMgNiY
119.529.551.0τ120.916.662.5
τ533.621.944.5
NiY0.948.950.2
218.522.459.1τ120.117.362.6
τ531.721.646.7
NiY0.448.750.9
313.126.760.2τ116.420.363.3
Eutectic12.9629.158.0
44.828.366.9τ116.421.362.3
NiY30.924.974.2
NiY0.448.850.8
53.923.672.5τ114.722.163.2
NiY30.725.573.8
65.920.973.2τ116.218.665.2
NiY31.224.374.5
78.616.574.9τ117.216.566.2
NiY30.924.474.7
Y-hcp0.70.898.5
837.015.048.0MgY(γ)51.51.646.9
τ126.315.658.1
τ532.821.445.8
Hara et al. [7] in their hydrogen storage work on the Mg-Ni-Y system, reported an unknown phase of composition MgNiY3. They reported that this compound plays a role as a catalyst for the adsorption of hydrogen. However, they could not identify the crystal structure of this compound. The composition of this compound (MgNiY3) is very close to the single phase region of τ1. Hence, it is likely that Hara et al. [7] were actually detected τ1 (MgNiY4).
The crystallographic information of τ1 was determined in this work. This was done by comparing XRD patterns of several τ1 containing alloys (KS# 1–8) with similar structure type compounds from Pearson crystal structure database [27]. It was found that the XRD pattern of Gd4RhIn was very similar to that of τ1. Tappe et al. [28] reported several rare earth containing compounds with this prototype. Therefore, the crystallographic data of Gd4RhIn was taken as the starting value for the Rietveld structural refinement of τ1 in the present work. Using this strategy the lattice parameter of τ1 was determined as: a = 1.3666 nm. The refined crystal structure data and atomic positions of τ1 are listed in Table 3 and 
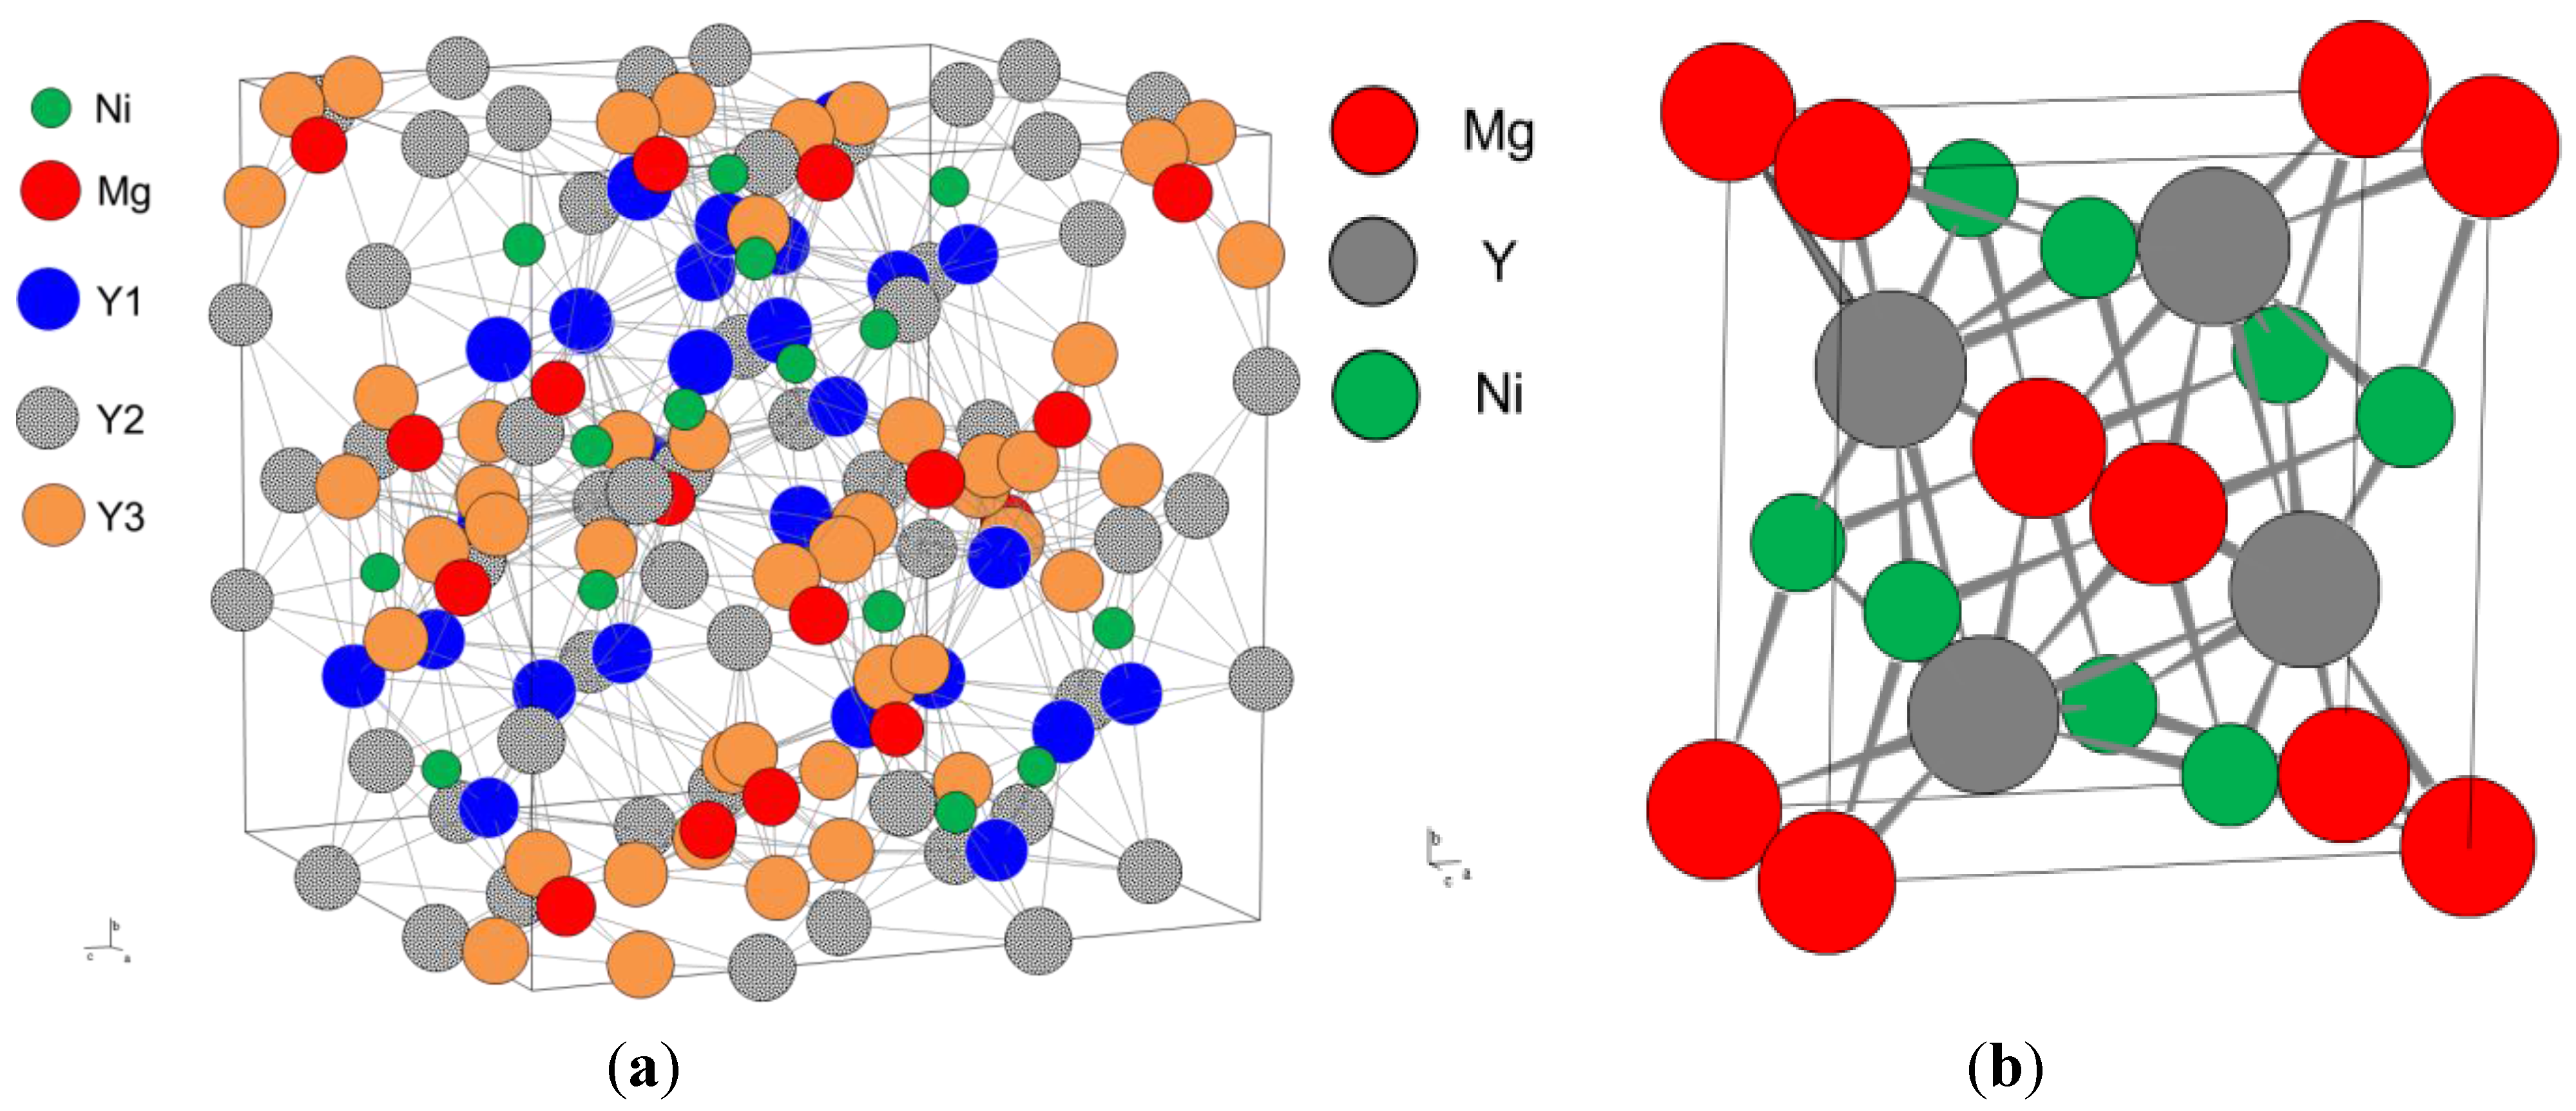
Table 4. Also, the unit cell is shown in 
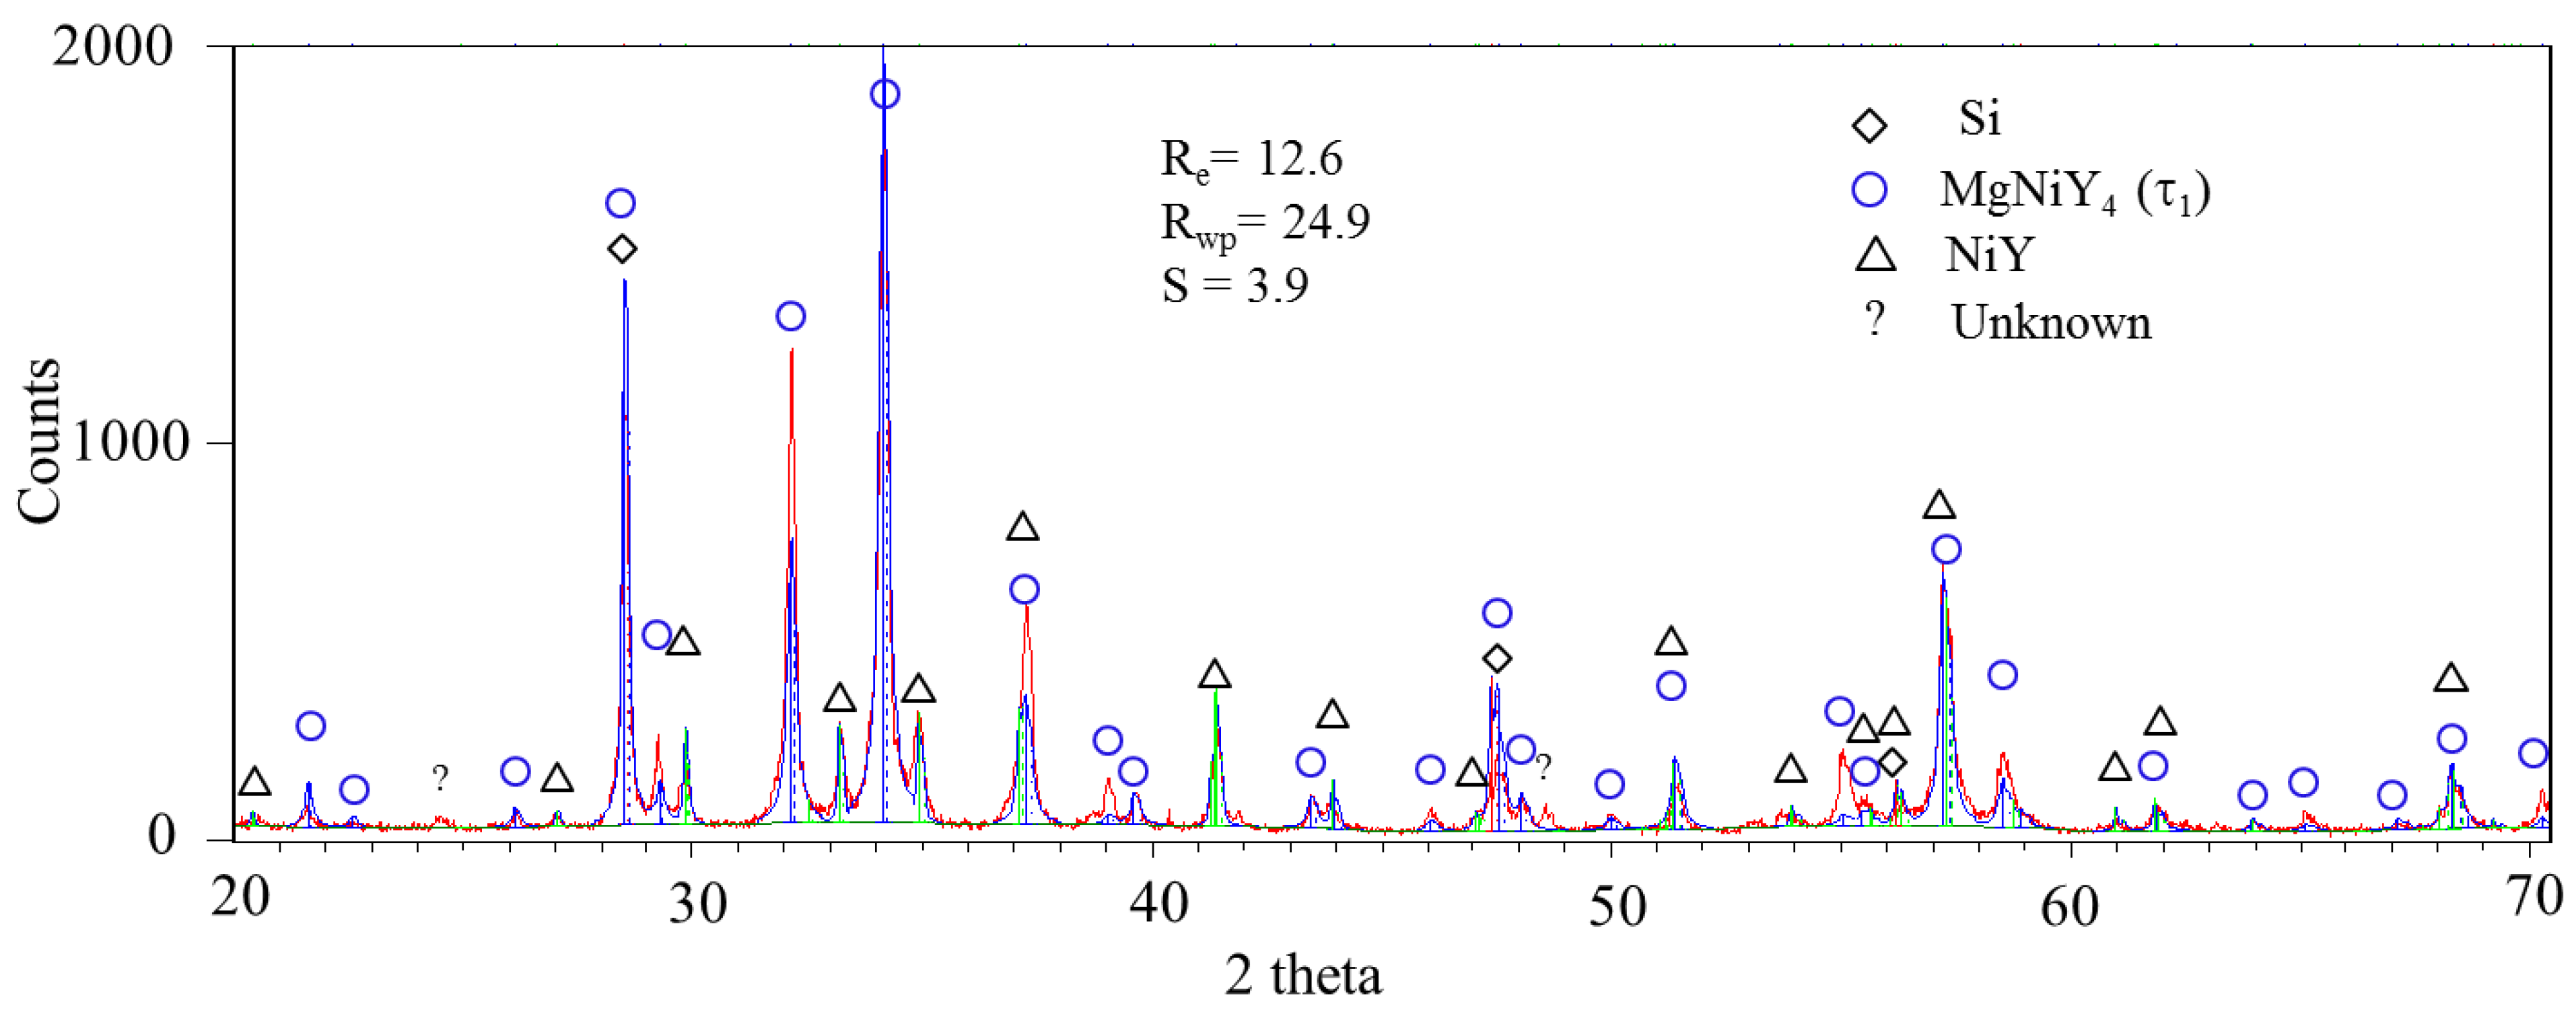
Figure 14a. The XRD pattern of sample 2, shown in Figure 15, positively identifies τ1 and NiY. The SEM analysis of this alloy as listed in Table 2 showed three phases, τ1 + NiY + τ5. Therefore it can be said that the unknown peaks in the XRD pattern belong to τ5. Since the crystal structure of τ5 is unknown these peaks are labeled by a question mark (?). The statistically expected values Re (12.6), weighted summation of residuals of the least squared fit Rwp (24.9) and goodness of fit s (3.9) were used to judge the degree of refinement in the Rietveld analysis. Due to the unknown peaks of τ5, a better statistical fit was not possible.
Table 3. The crystal structure data of τ1 and τ2.
CompoundMgNiY41)MgNi2Y22)
StructureCubicTetragonal
PrototypeGd4RhInMo2FeB2
Space group F 4 ¯ 3 m (216)P4/mbm (127)
Lattice parameter (nm)aac
1.3666(0)0.7395(9)0.3736(3)
Anglesα βγα βγ
90°90°90°90°90°90°
Atoms in unit cell9610
Table 4. Atoms position in the unit cell of τ1 and τ2.
AtomWyckoff Positionxyz
MgNiY41)
Mg16e0.0800.0800.080
Ni16e0.6400.6400.640
Y124g0.5600.2500.250
Y224f0.31000
Y316e0.1530.1530.153
MgNi2Y22)
Mg2a (12)000
Ni4g (9)0.62160.12160
Y4h (17)0.17160.67160.5000
Figure 14. Unit cell for (a) τ1 and (b) τ2.
Metals 05 01746 g014
Figure 15. X-ray diffraction (XRD) pattern for sample 2 (18.5/22.4/59.1 Mg/Ni/Y at%).
Metals 05 01746 g015
The ternary compound, τ2 was not observed in any of the diffusion couples. Therefore more effort was dedicated towards confirming its presence. Five key alloys (9–13) were prepared near this compound. τ2 was found to exist in all of them. According to the WDS analysis in Table 5, the composition of this compound is 20/40/40 Mg/Ni/Y at%. Based on this, the MgNi2Y2 formula was assigned to it. These key alloys also demonstrated the occurrence of three 3-phase regions, τ2 + τ3 + NiY, τ2 + τ5 + NiY and τ2 + τ3 + τ6.
The crystallographic information of τ2 was determined in the present work in a similar approach to that of τ1 by comparing the XRD patterns of several alloys containing this phase with similar structure type compounds from the Pearson crystal structure database [27]. It was found that τ2 has Mo2FeB2 prototype and the lattice parameters were determined as a = 0.7395(9) nm and c = 0.3736(3) nm. The crystal structure data and atoms position within the unit cell are listed in Table 3 and Table 4. Also, the unit cell of τ2 is shown in Figure 14b.
Table 5. WDS data of the samples 19–26 annealed at 673 K.
Actual CompositionIdentified Phases
No.at%NameComposition by WDS
MgNiYMgNiY
925.030.344.7τ220.937.941.2
τ535.021.543.5
NiY0.349.250.5
1028.036.835.2τ222.439.338.3
τ316.364.219.5
τ635.932.731.4
1126.038.235.8τ221.439.239.4
τ316.464.019.6
τ635.632.332.1
1220.050.829.2τ219.740.539.8
τ311.866.521.7
τ632.234.333.5
138.458.633.0NiY1.349.649.1
τ221.239.339.5
τ318.066.515.5
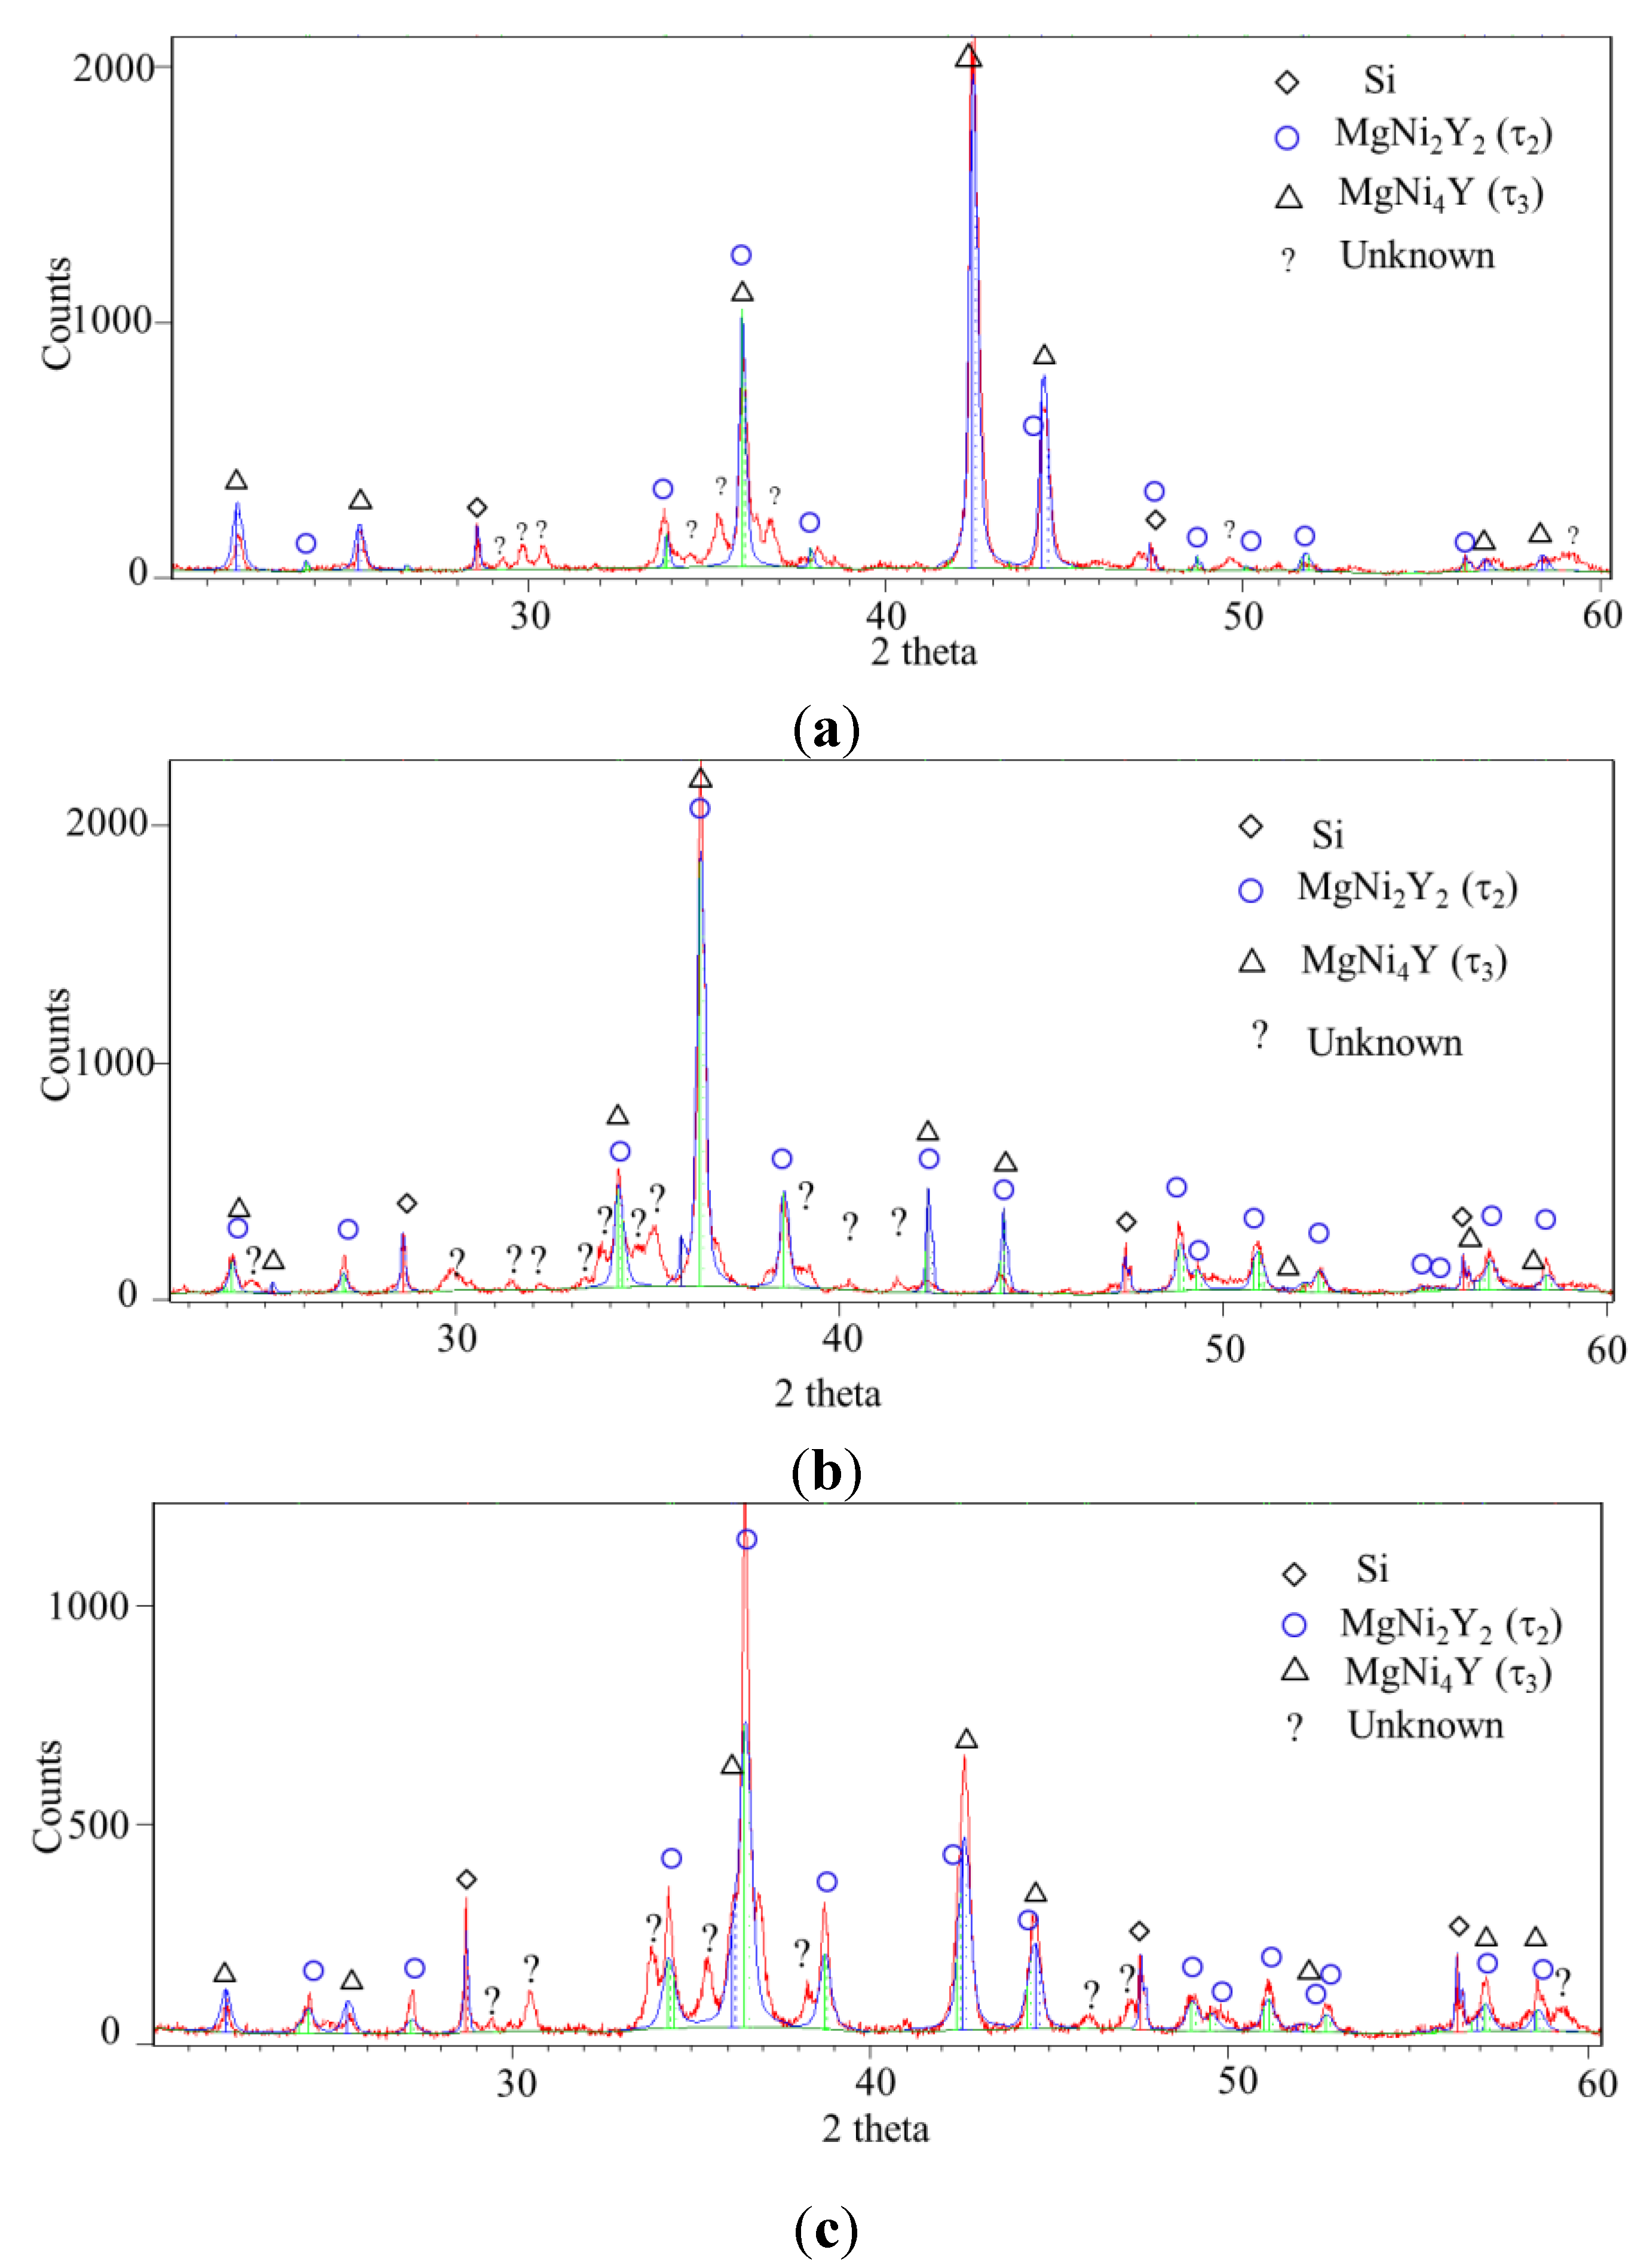
XRD patterns of key alloys 10, 11 and 12 are shown in Figure 16a–c. τ2 was positively identified in all of them. The unknown phase in these XRD patterns belongs to τ6. Another ternary compound, τ3 was also positively identified in these XRD patterns. This compound was first reported by Kadir et al. [14]. They reported SnMgCu4 prototype with lattice parameter of 0.71853 nm. This compound was found in several alloys (10–13, 16, 19–25) in the current work. According to the WDS analysis in Table 5 and Table 6, τ
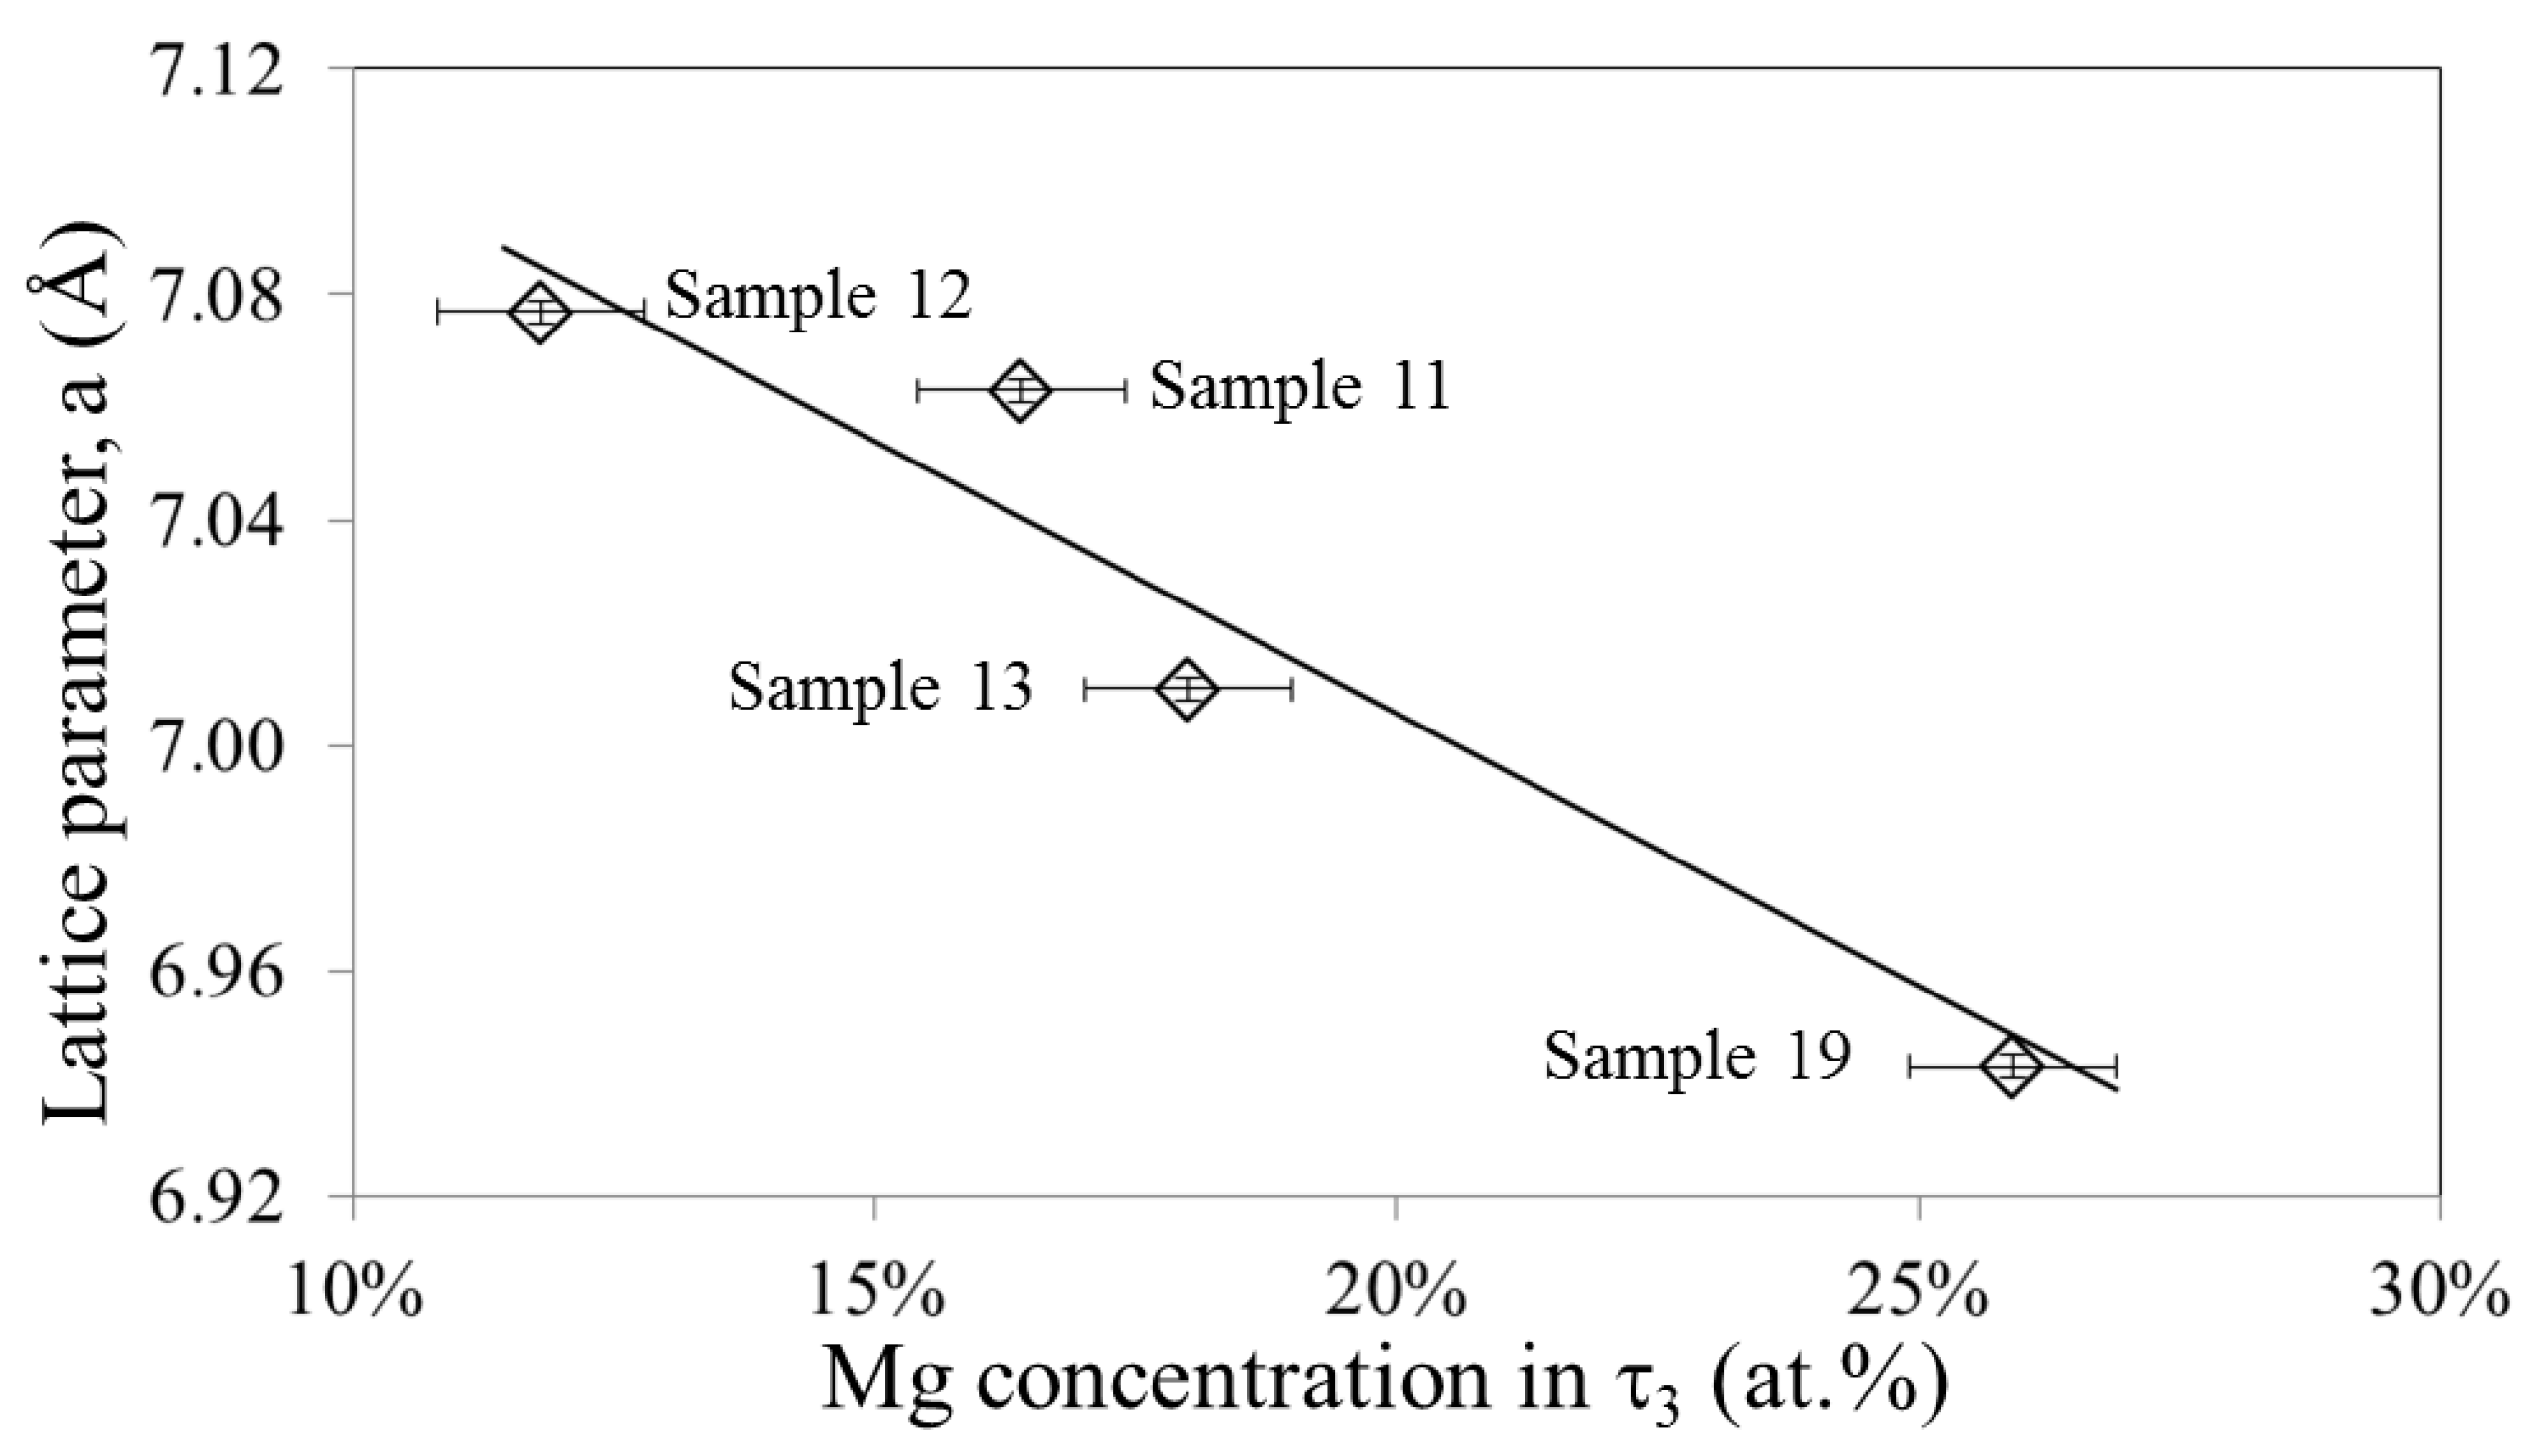
3 has solubility from ~11 to 23 at% Mg with constant 66.67 at% Ni. The variation of lattice parameter of τ3 was also observed in the Rietveld analysis performed on the XRD patterns of four key alloys (5, 9, 10 and 11). The change in lattice parameter, “a” of τ3 with Mg concentration is presented in Figure 17. The atomic radius of Mg (145 pm) is less than that of Y (212 pm). According to Vegard’s law, the decrease of size of any atom or ion in a crystal leads directly to the proportional decrease of lattice constants. Hence the lattice parameter “a” decreases with the increase of Mg concentration. It reflects substitutional solid solution for τ3 where Mg replaces Y atoms.
τ4 (Mg2Ni9Y) was identified in sample 17 (11.0/78.9/10.1 Mg/Ni/Y at%) and sample 18 (28.7/69.1/2.2 Mg/Ni/Y at%). Kadir et al. Reference [12] reported a hexagonal structure for τ4, which is iso-structure of LaMg2Ni9. Two different plate-like structures can be seen in the BSE image of sample 18 in Figure 13d. These were identified as MgNi2 and τ4.
The intermetallic compound, τ5 was found in samples 1, 2, 8, 9 and 27–29. Based on the WDS analysis of these alloys in Table 5 and Table 7, the approximate composition of τ5 was determined as 33.8/21.5/44.7 Mg/Ni/Y at%. The BSE image of sample 9 (25.0/30.3/44.7 Mg/Ni/Y at%) in Figure 13b clearly shows τ5 which is in equilibrium with τ2 and NiY. The crystal structure of τ5 is not known. Determining the crystal structure of τ5 in the same approach as for τ1 and τ2 was not successful because a crystallographic prototype has not been found yet.
Figure 16. XRD patterns for (a) Sample 10 (20.0/50.8/29.2 Mg/Ni/Y at%); (b) Sample 11 (26.0/38.2/35.8 Mg/Ni/Y at%); (c) sample 12 (28.0/36.8/35.2 Mg/Ni/Y at%).
Metals 05 01746 g016
Figure 17. Variation of lattice parameter of τ3.
Metals 05 01746 g017
Table 6. WDS data of the samples 14–26 annealed at 673 K.
Actual CompositionIdentified Phases
No.at%NameComposition by WDS
MgNiYMgNiY
141.563.435.1Ni2Y0.763.136.2
NiY0.546.752.8
153.380.516.2Ni5Y0.782.916.4
τ415.574.79.8
163.777.319.0Ni5Y0.482.916.7
τ39.866.923.3
Ni4Y1.378.819.9
1711.078.910.1Ni17Y23.584.911.6
τ417.675.66.8
1828.769.12.2MgNi231.366.81.8
τ416.575.48.1
1936.259.93.9Mg2Ni67.232.50.3
τ325.964.99.2
MgNi231.464.34.3
2027.259.912.9Mg2Ni67.232.50.3
τ322.764.912.3
2124.552.423.1τ315.164.720.2
τ745.927.127.0
τ851.224.524.3
22 *37.236.326.5τ315.665.119.3
τ634.631.733.7
τ851.224.424.4
τ1074.113.012.9
τ1182.58.68.9
23 *54.124.021.9τ317.864.118.1
τ852.324.323.4
τ1074.512.812.7
τ1184.57.67.9
2455.536.67.9τ1285.16.78.2
Mg2Ni65.333.80.9
τ317.466.815.8
2578.215.56.3τ1285.36.38.4
Mg2Ni67.530.71.8
τ318.864.516.5
2684.912.92.2hcp-Mg99.40.50.1
τ1292.04.13.9
Mg2Ni67.930.21.9
* The samples indicated with (*) are not in complete equilibrium.
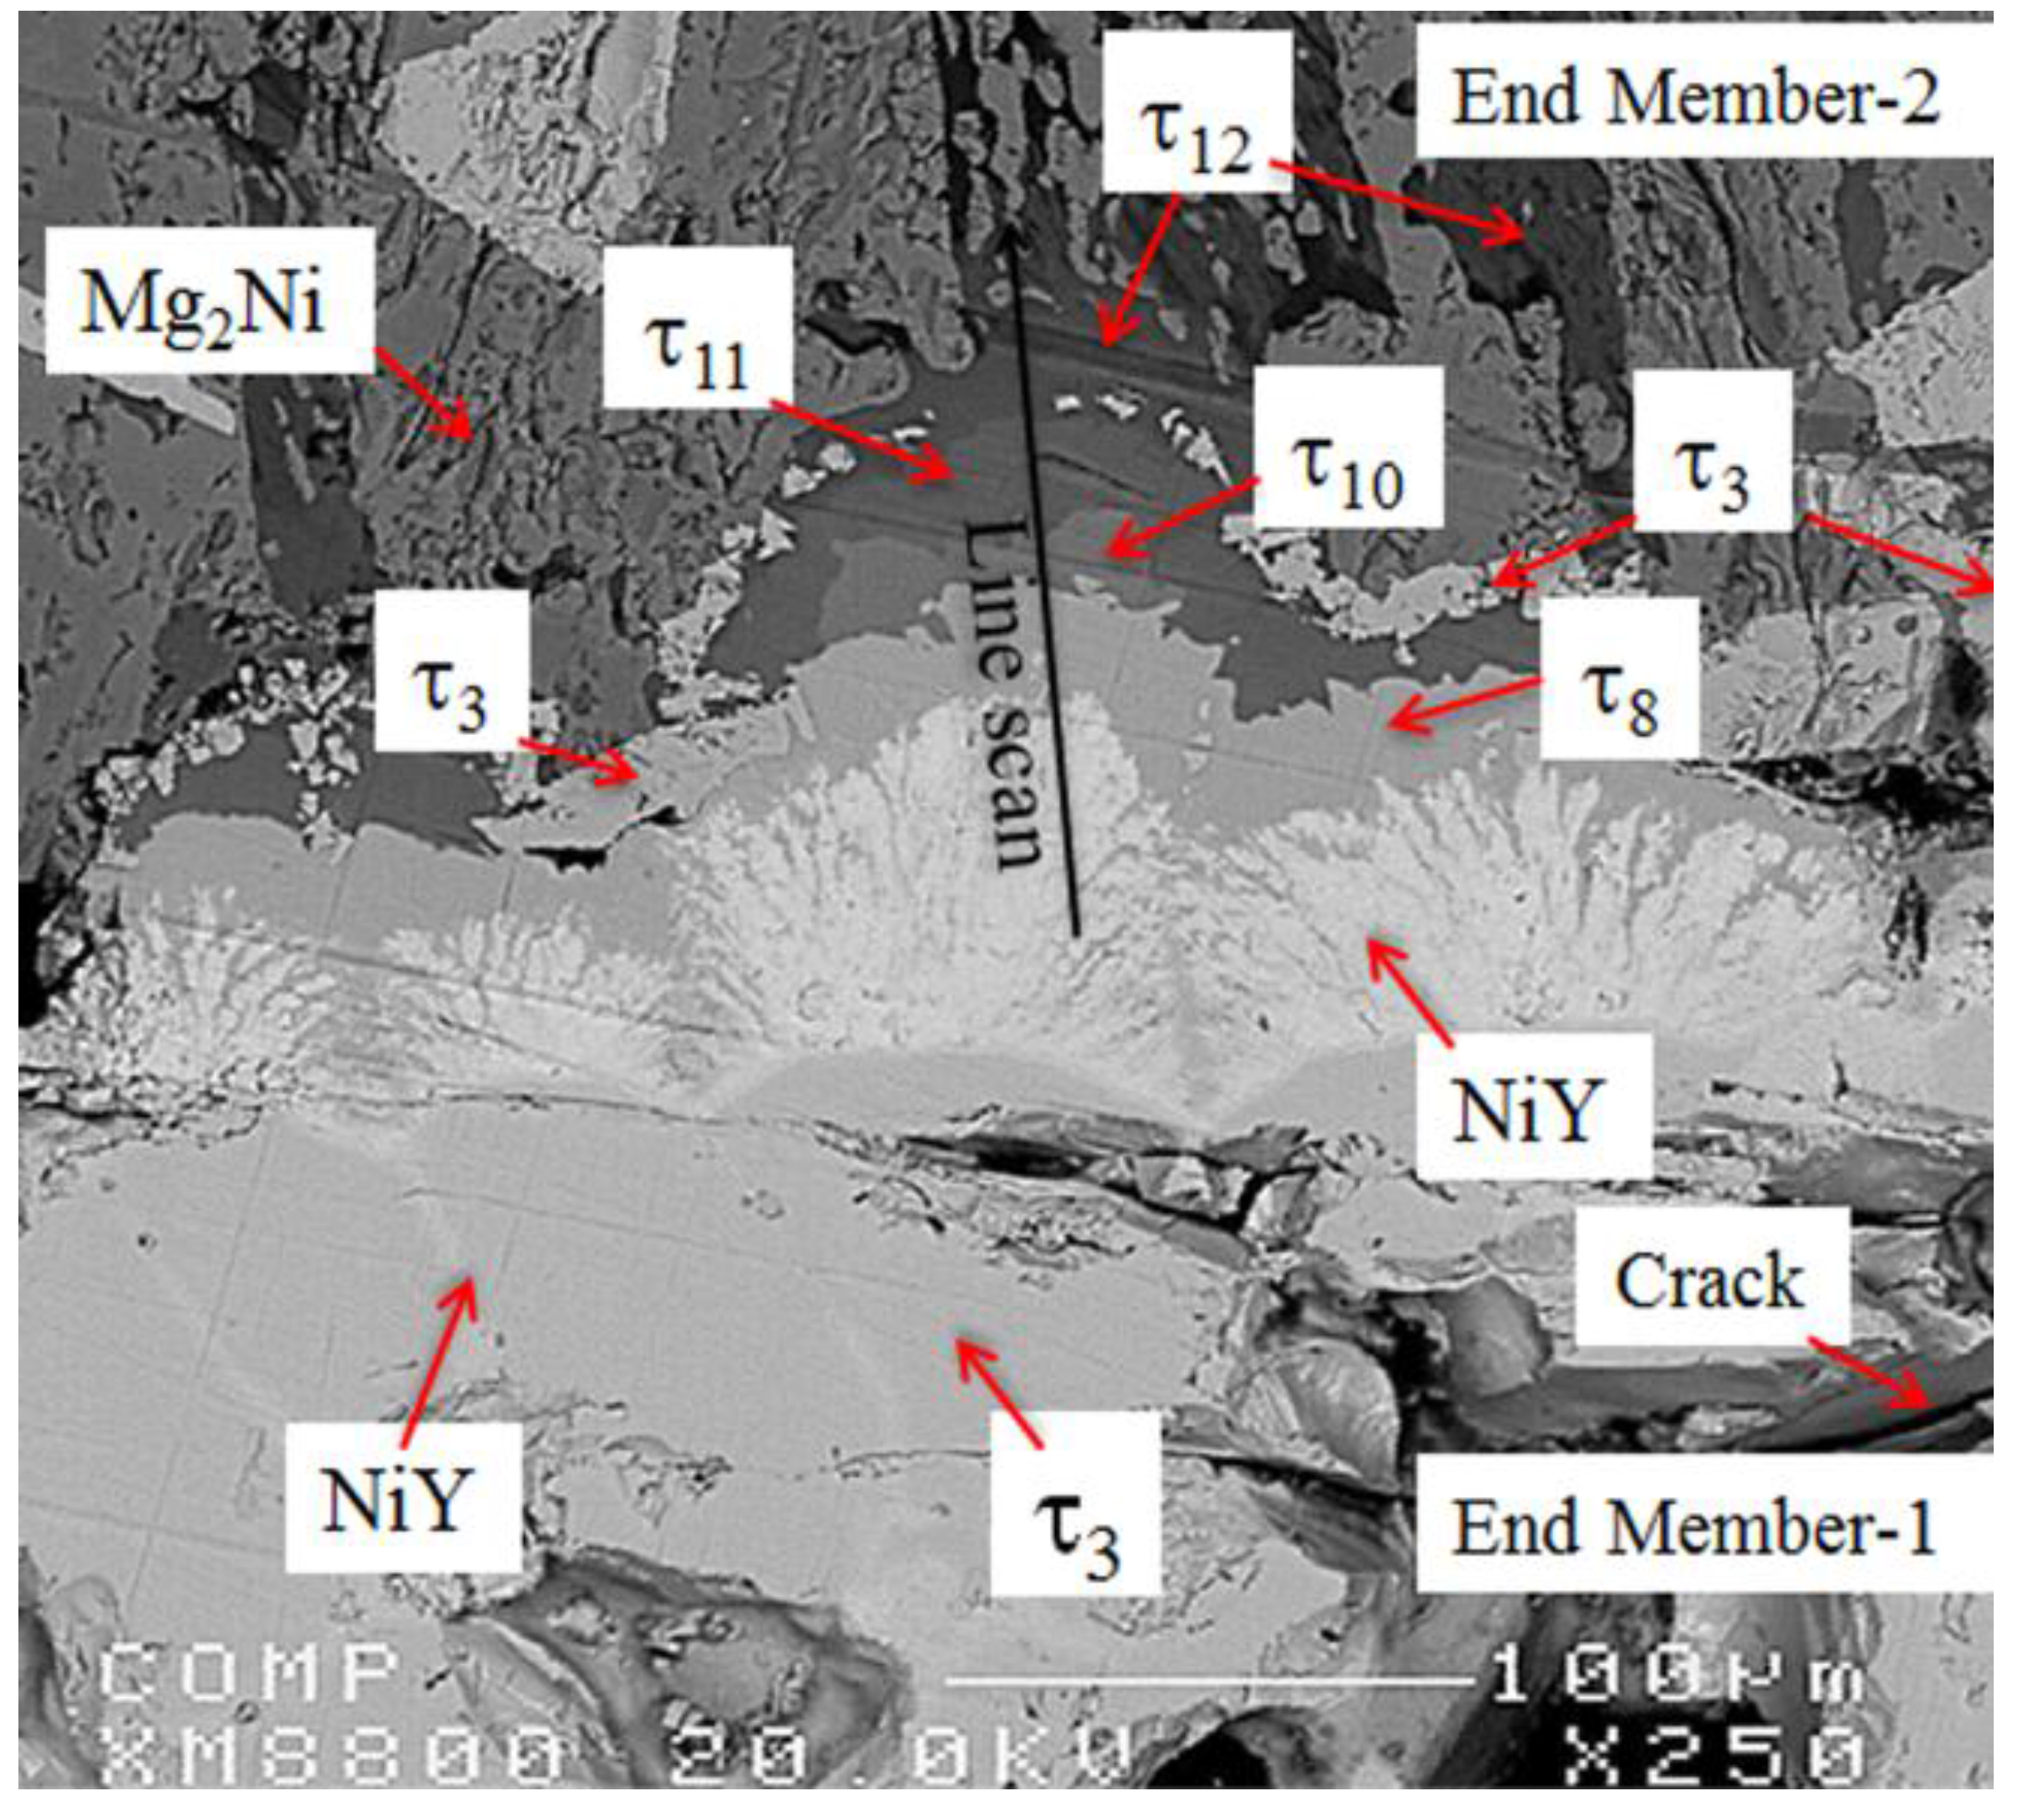
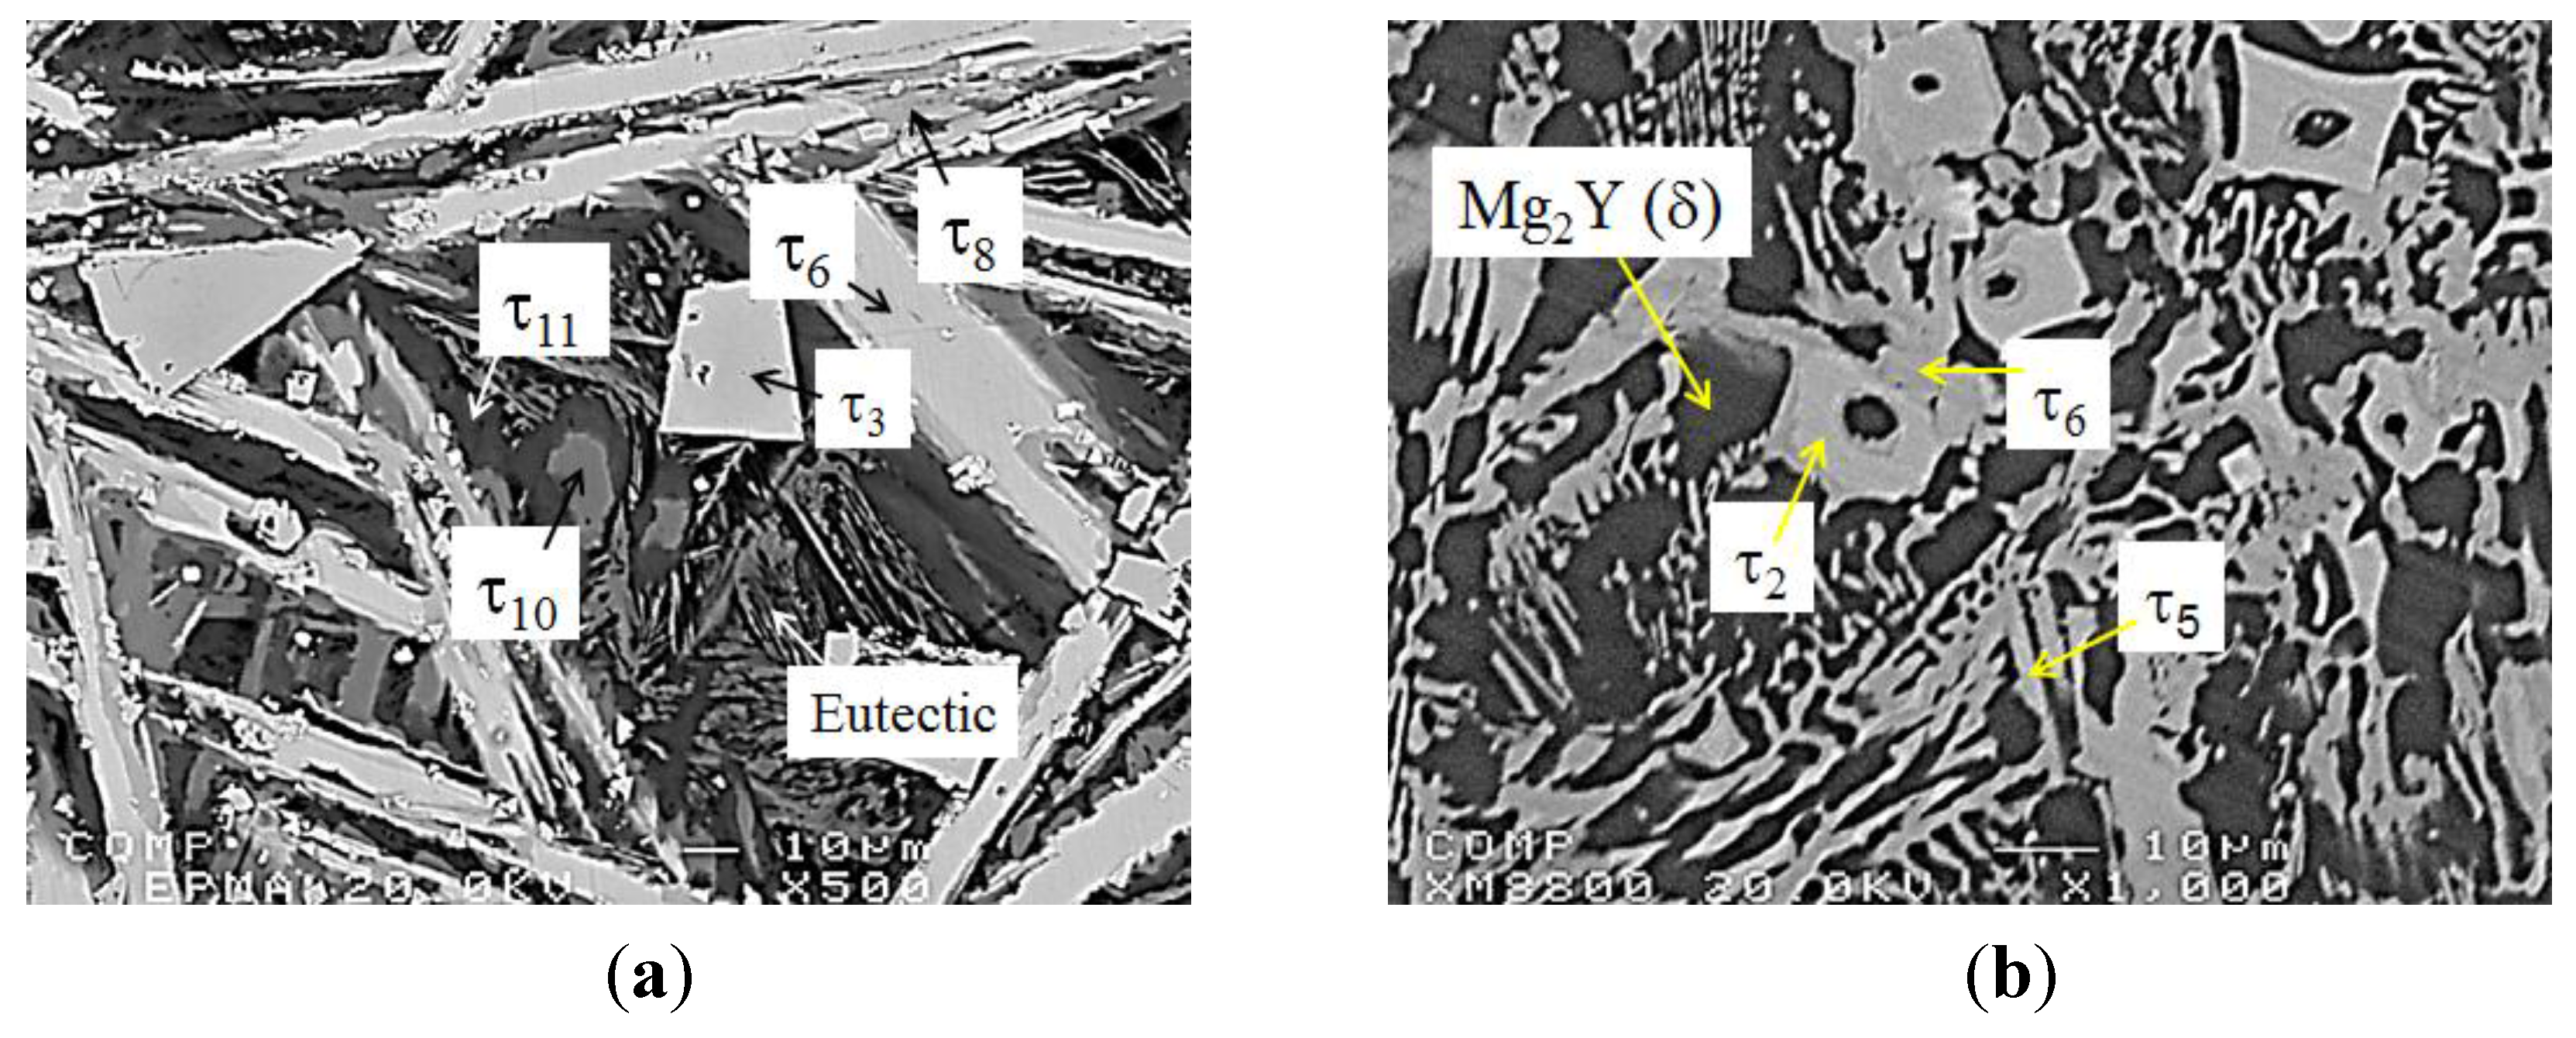
The BSE images of sample 22 (37.2/36.3/26.5 Mg/Ni/Y at%) and sample 29 (51.4/12.3/36.3 Mg/Ni/Y at%) in Figure 18a,b, show the presence of τ6. This compound was also found in samples 10–12 and 29. In order to obtain equilibrium, these alloys were annealed for six weeks instead of four. Still complete equilibrium could not be obtained. This is probably due to the peritectic decomposition of some of the compounds. The BSE image of sample 22 in Figure 18a shows several phases; τ3, τ6, τ8, τ10, and τ11. Based on the analysis of samples 22 and 23 and the diffusion couples, it can be concluded that τ3 is in equilibrium with all the compounds in the vicinity of the Mg-NiY line.
Although not in complete equilibrium, a three-phase relation among Mg2Y(δ), τ5 and τ6 can be identified in sample 29 (51.4/12.3/36.3 Mg/Ni/Y at%) in Figure 18b. It is observed that τ2 (white-square shape) always remains within τ6 and will probably transfer to τ6 after a much longer annealing time. This indicates a three-phase region: Mg2Y(δ) + τ5 + τ6. The colors of τ5 and τ6 are very close because of their similar composition. This makes it difficult to recognize these two phases in the BSE image.
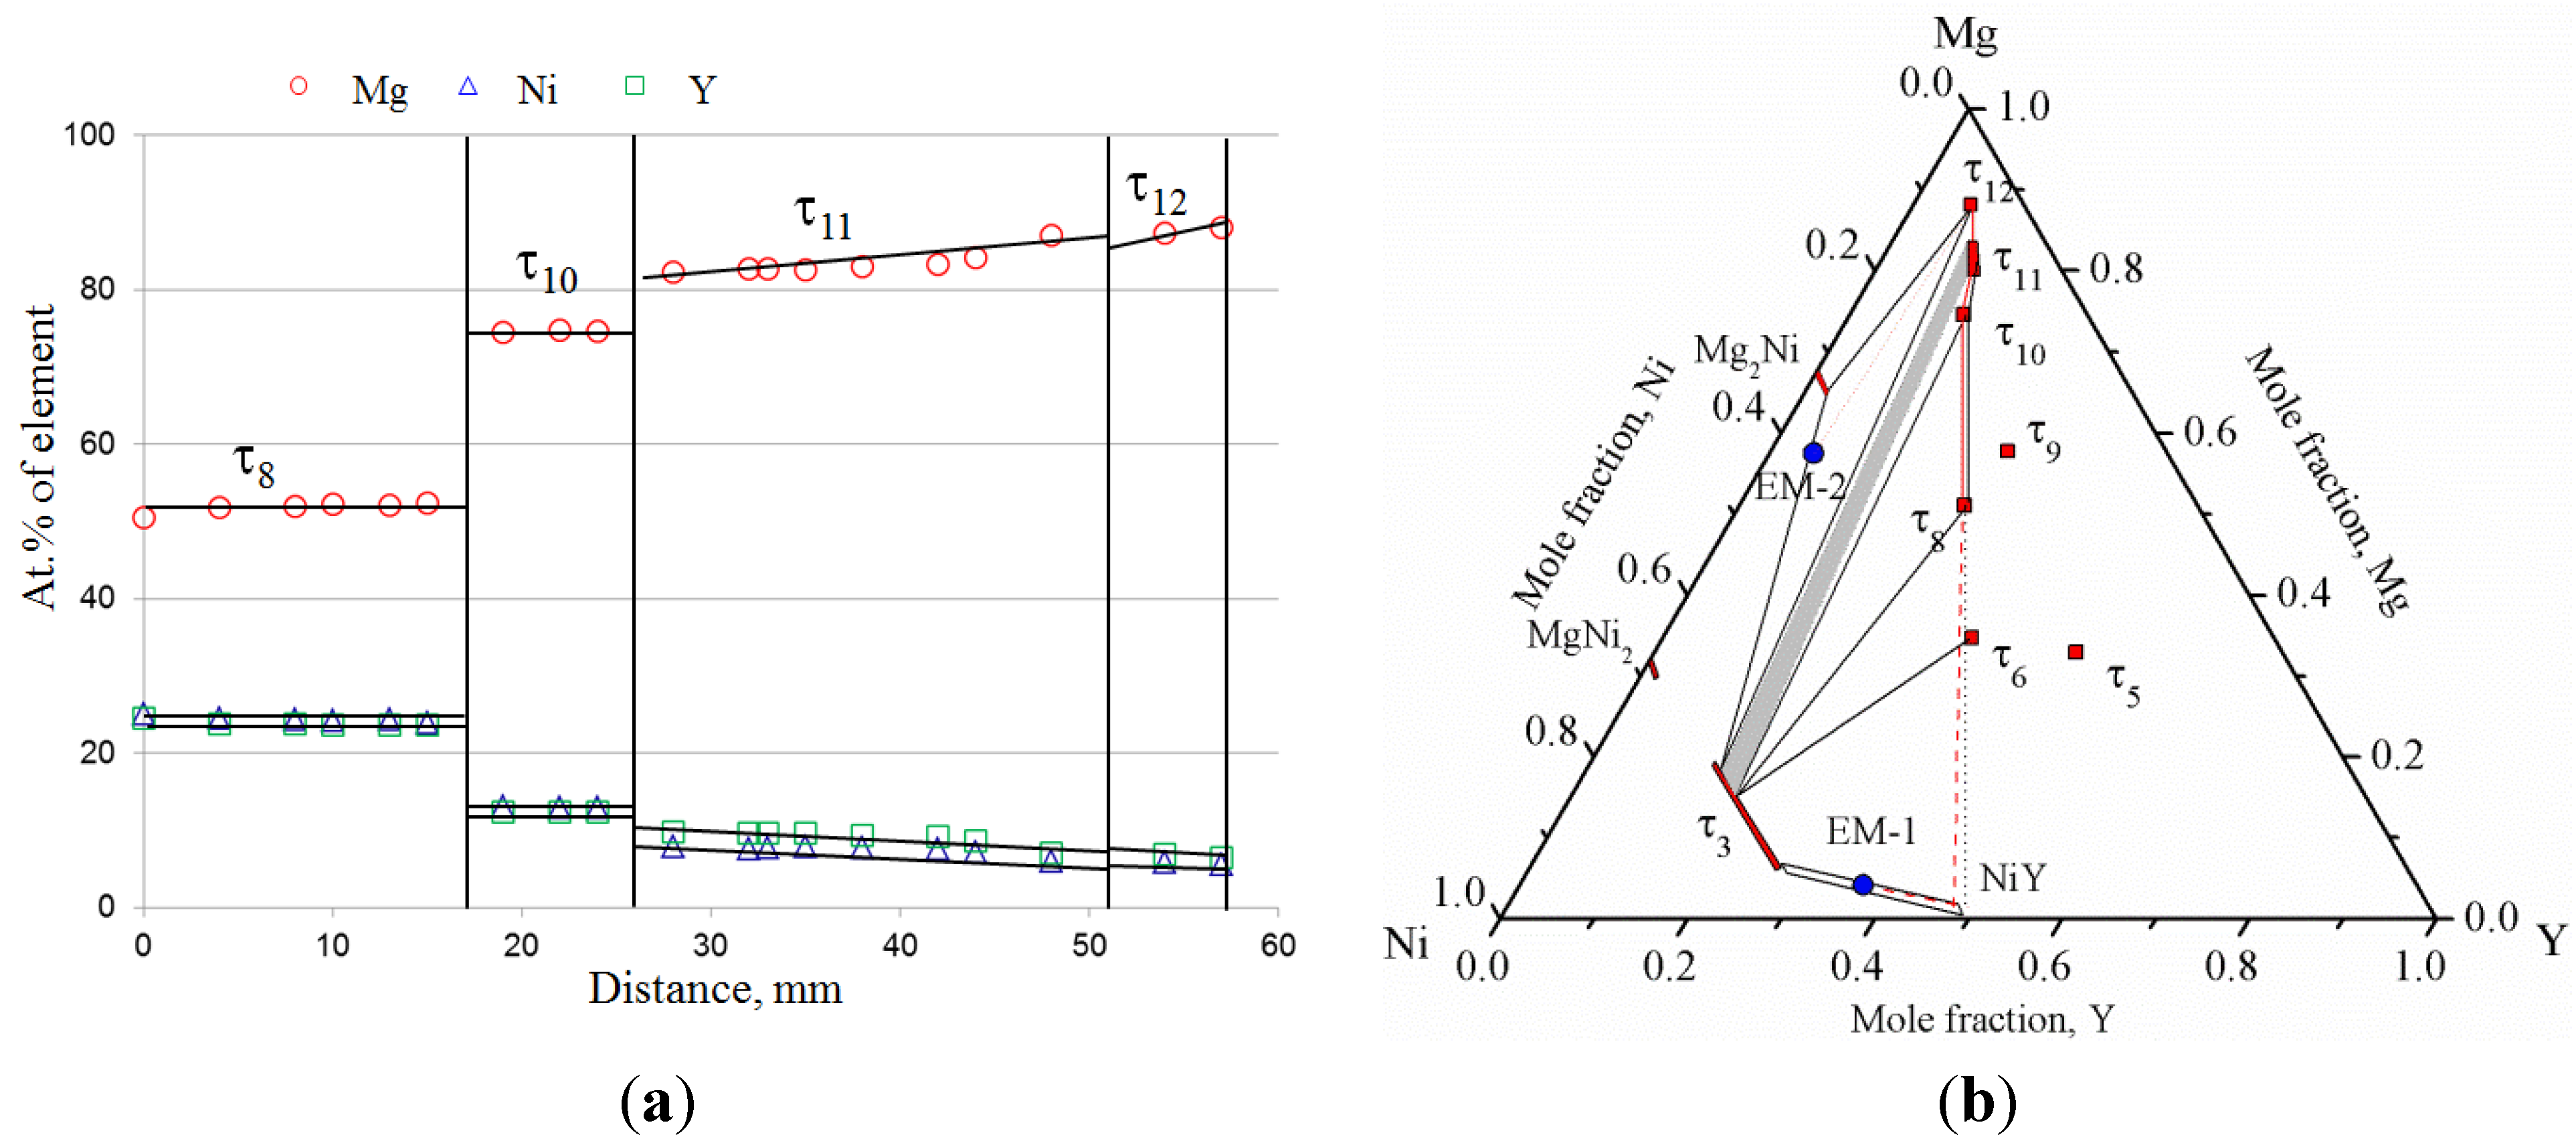
The ternary compounds τ7 and τ8 were found in sample 21 (24.6/52.4/23.0 Mg/Ni/Y at%). τ8 was also identified in samples 22 and 23. The WDS analysis of these alloys is summarized in Table 6. Their presence was also confirmed in three diffusion couples (DC{SS} 2, 3 and DC{SL} 2) as shown earlier in Figure 5, Figure 7 and Figure 10, respectively.
Table 7. WDS data of the samples 27–32 annealed at 673 K.
Actual CompositionIdentified Phases
No.at%NameComposition by WDS
MgNiYMgNiY
2738.514.746.8MgY(γ)49.61.149.3
τ534.121.544.4
Mg2Y(δ)---
2849.98.042.1Mg2Y(δ)68.60.431.0
MgY(γ)53.40.845.8
τ534.121.144.8
29 *51.412.336.3τ221.437.541.1
τ535.721.642.7
τ636.230.833.0
Mg2Y(δ)71.70.827.5
3054.015.930.1τ635.132.432.5
τ956.716.526.8
Mg2Y(δ)69.11.529.4
3169.19.421.5τ957.516.426.1
τ1067.014.118.9
Mg2Y(δ)72.61.426.0
3272.06.321.7τ1067.112.320.6
Mg2Y(δ)73.51.125.4
* The sample indicated with (*) are not in complete equilibrium.
Figure 18. BSE image of (a) sample 22 (37.2/36.3/26.5 Mg/Ni/Y at%); (b) Sample 29 (51.4/12.3/36.3 Mg/Ni/Y at%).
Metals 05 01746 g018
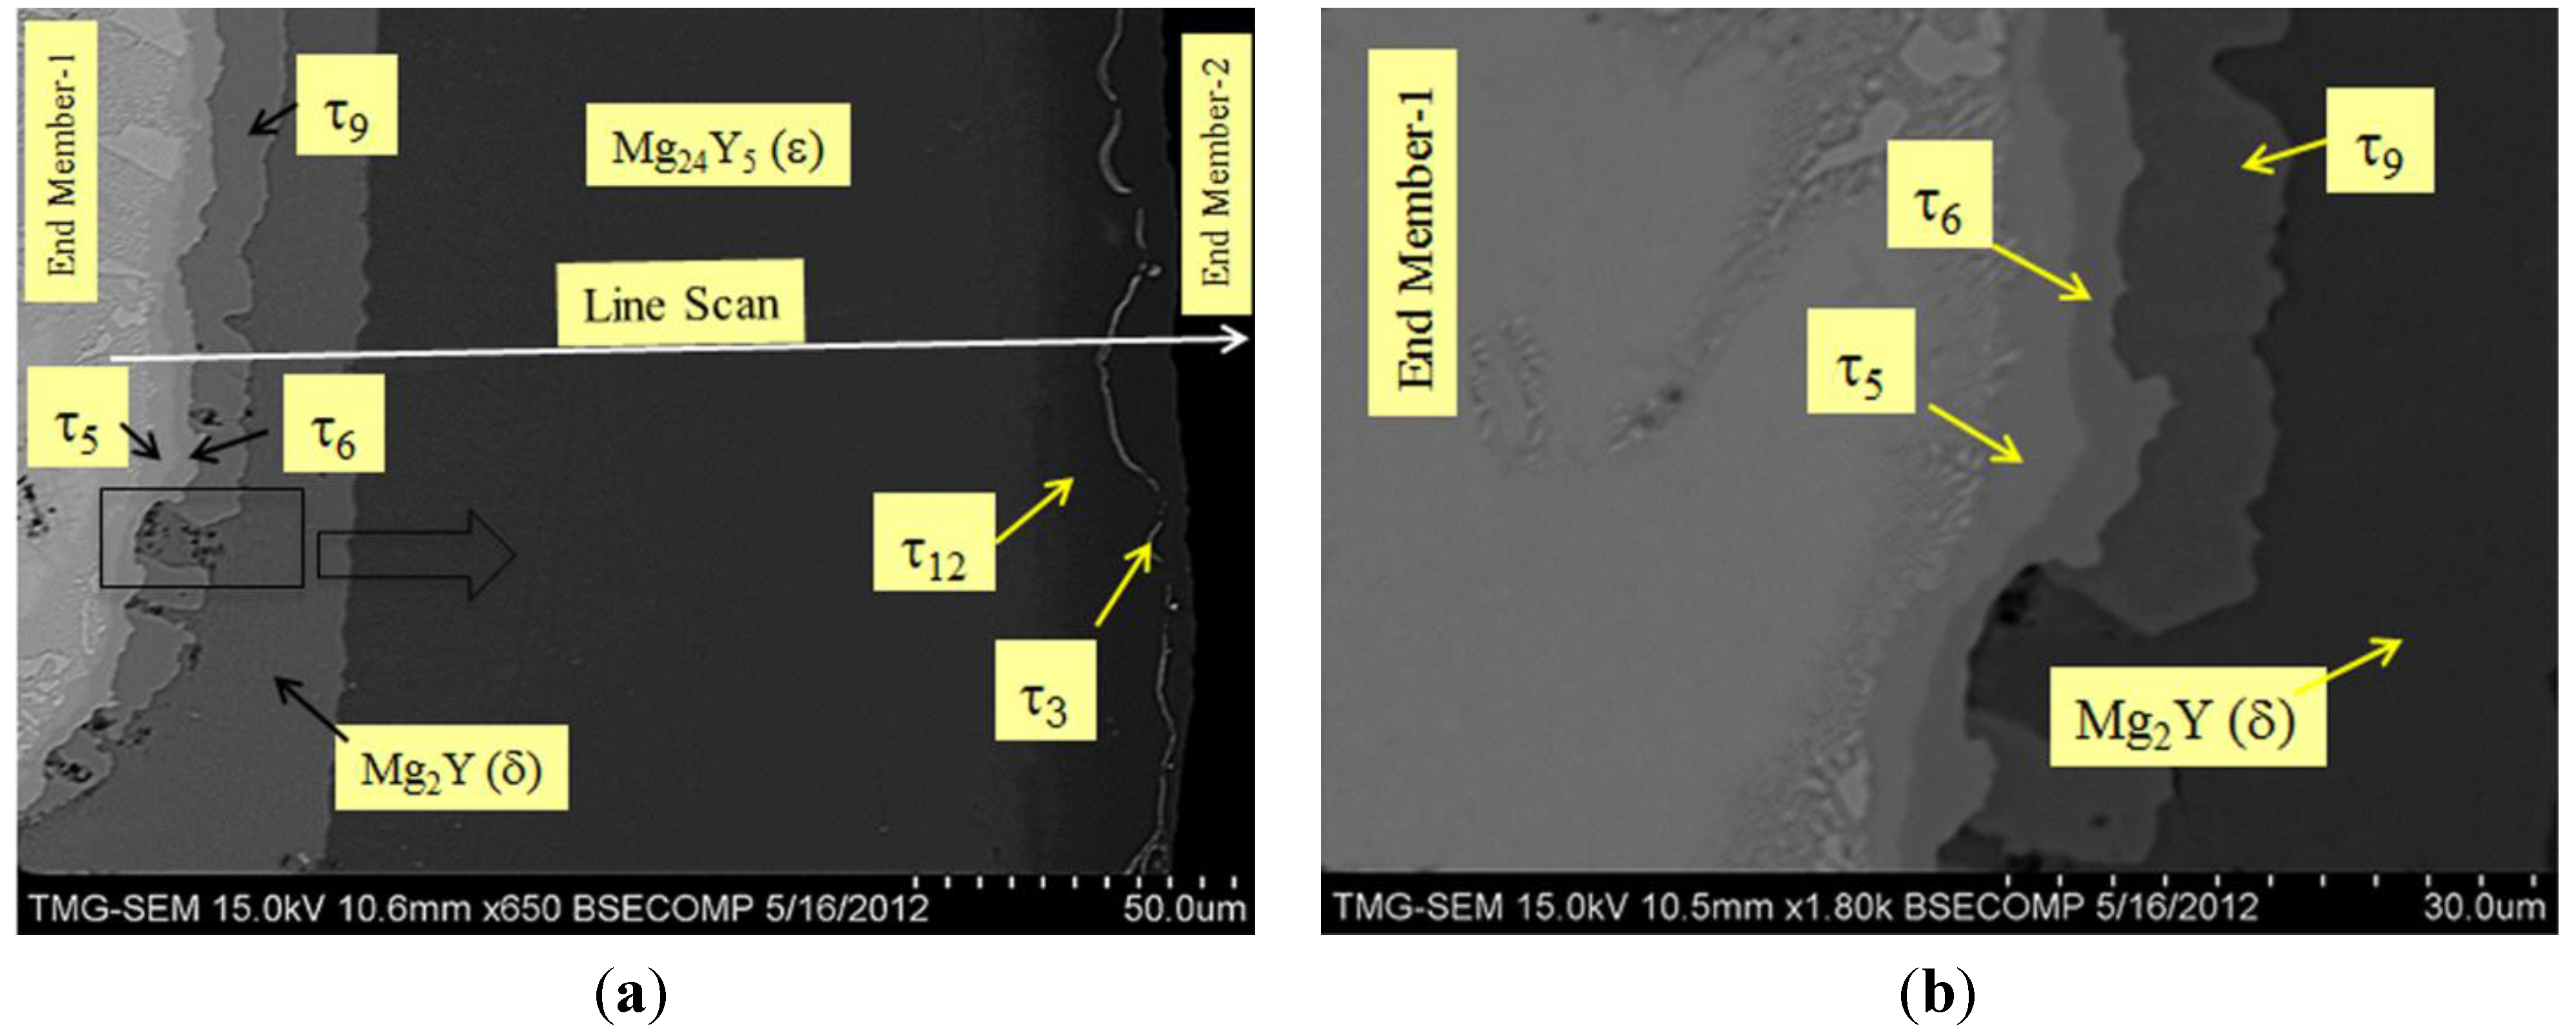
The BSE image of sample 30 (54.0/15.9/30.1 Mg/Ni/Y at%) in Figure 13f shows a three-phase equilibrium among Mg2Y(δ), τ6 and τ9. The white flakes and the grey matrix in the microstructure were identified as τ6 and τ9, respectively. Mg2Y(δ) was found as fine precipitates in the grey matrix. According to the WDS analysis of sample 30 in Table 7, the composition of the ternary compound τ9 is 56.7/16.5/26.8 Mg/Ni/Y at%. This compound was also observed in the solid-solid diffusion couple 1 in Figure 3 with slightly different composition 59.1/16.5/24.3 Mg/Ni/Y at%. The WDS analysis of sample 31 (69.1/9.4/21.5 Mg/Ni/Y at%) in Table 7, identified this compound, τ9, as 57.5/16.4/26.1 Mg/Ni/Y at%, which is closer to the diffusion couple analysis. Therefore, it was decided to use the composition obtained by the diffusion couple analysis since it is generally more accurate.
The WDS analysis of sample 31 (69.1/9.4/21.5 Mg/Ni/Y at%) and sample 32 (72.0/6.3/21.7 Mg/Ni/Y at%) in Table 7, showed a three-phase, Mg2Y(δ) + τ9 + τ10, and a two-phase, Mg2Y(δ) + τ10 equilibria. Both of these alloys confirmed the existence of the ternary compound τ10 with an average composition 66.4/12.7/20.9 Mg/Ni/Y at%. However, the solid-solid diffusion couple 2 shown in Figure 5 revealed the composition as 74.7/12.9/12.4 Mg/Ni/Y at%. The compositional variation is probably due to a linear solubility of τ10 from ~66.4 at% (sample 31 and 32) to 74.7 at% Mg at constant Ni of ~12.7 at%. The diffusion layer for τ10 in the solid-solid diffusion couple 2, is only 6 μm which was not wide enough for detecting the solubility. Therefore, the solubility of τ10 could not be confirmed.
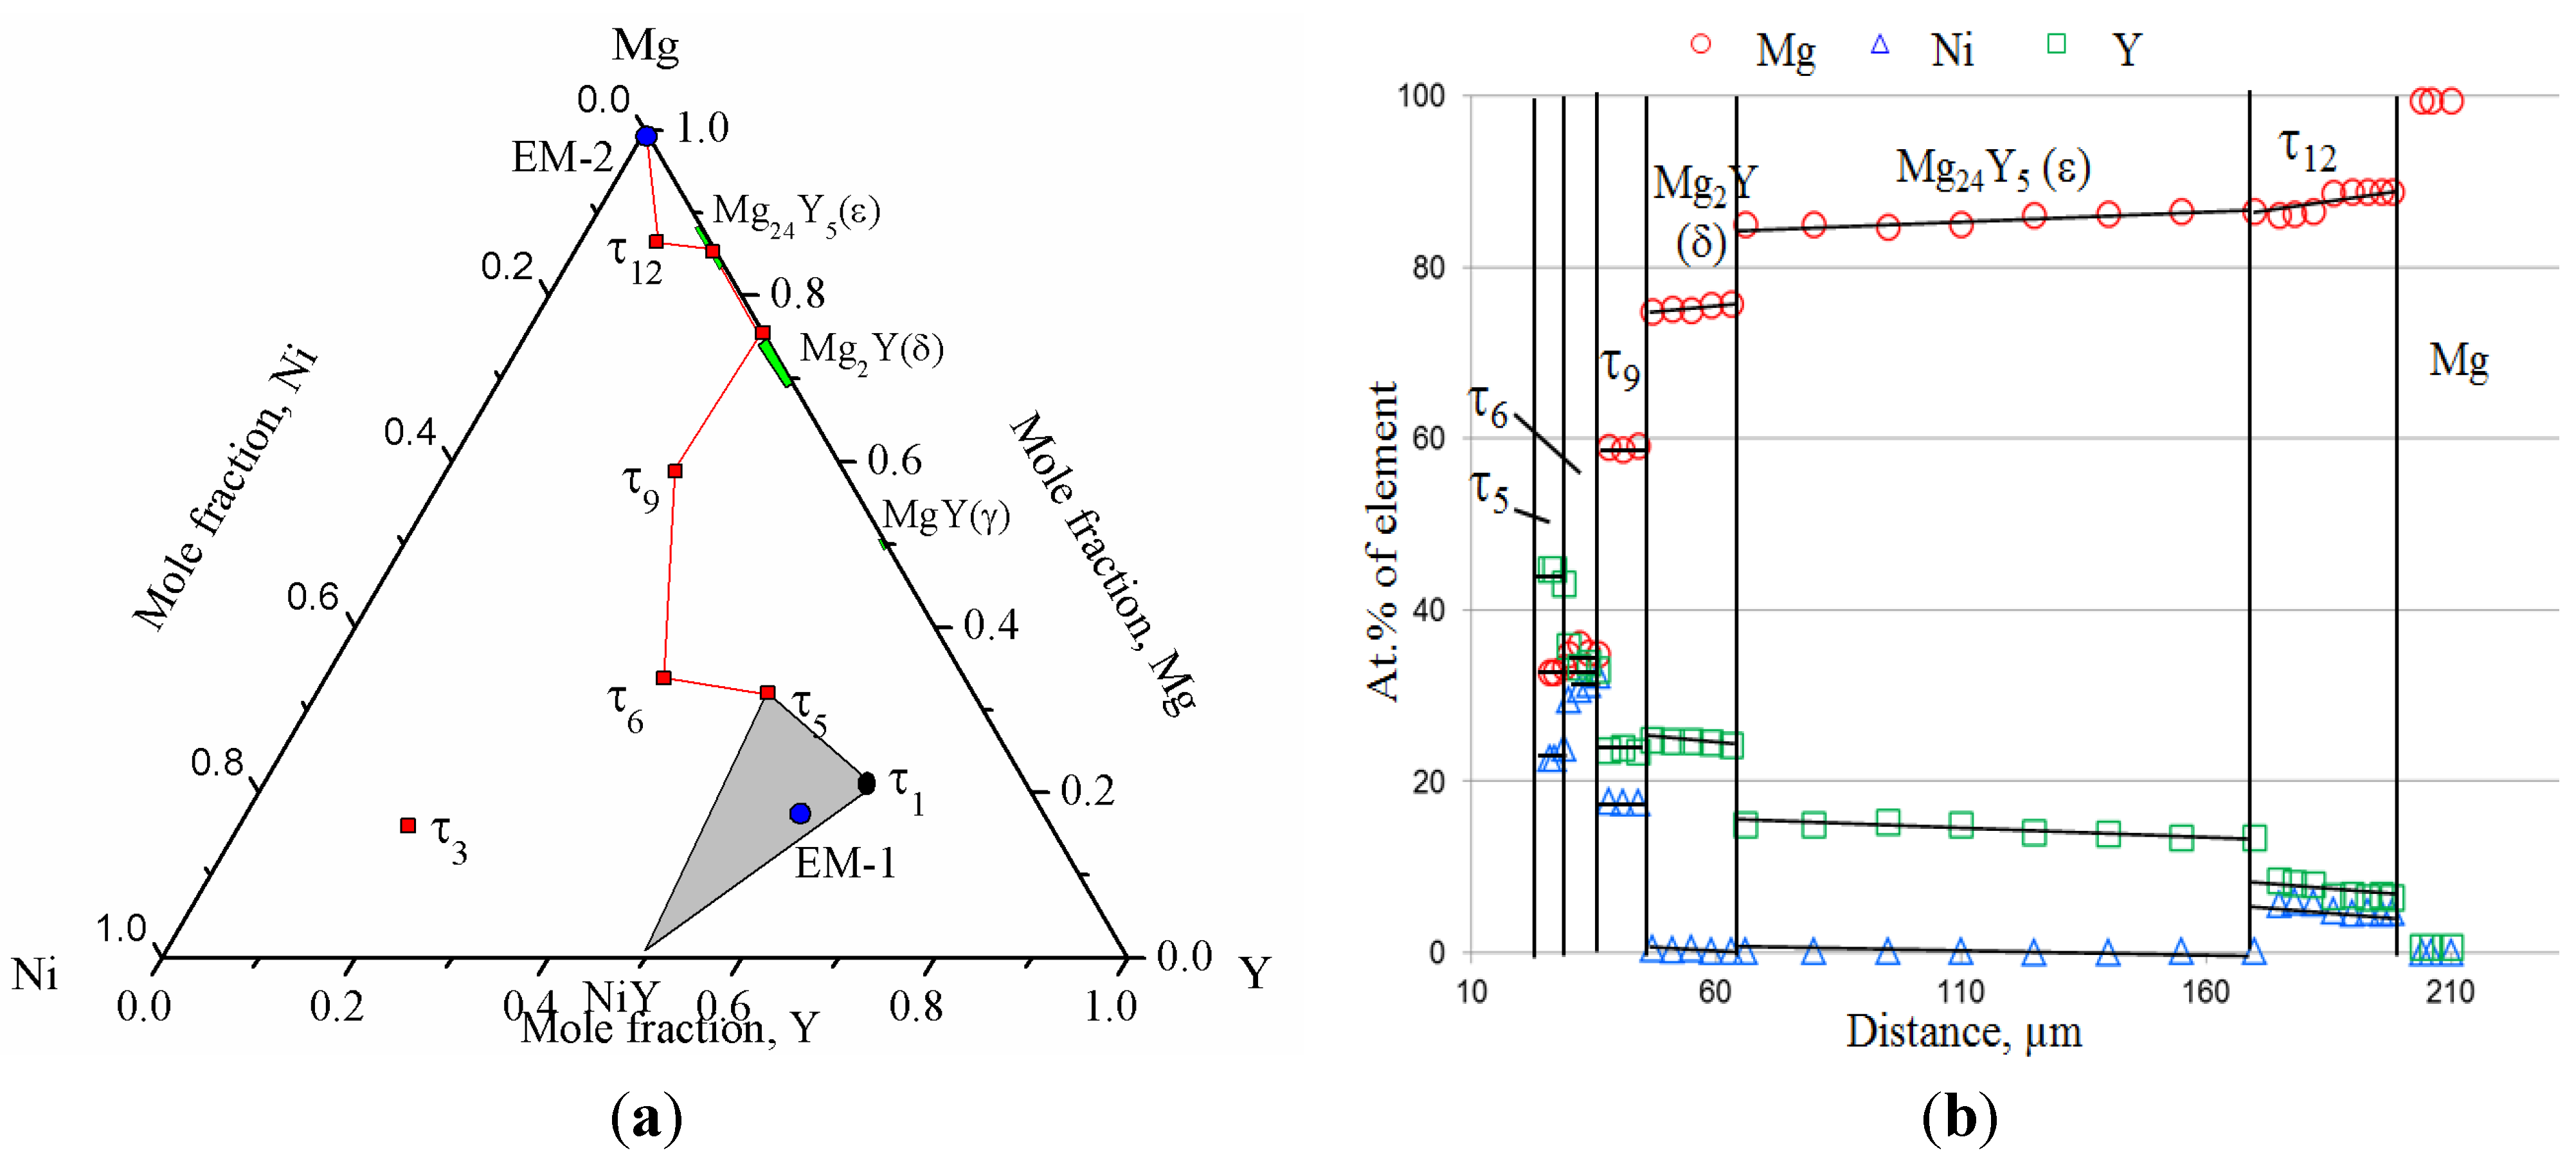
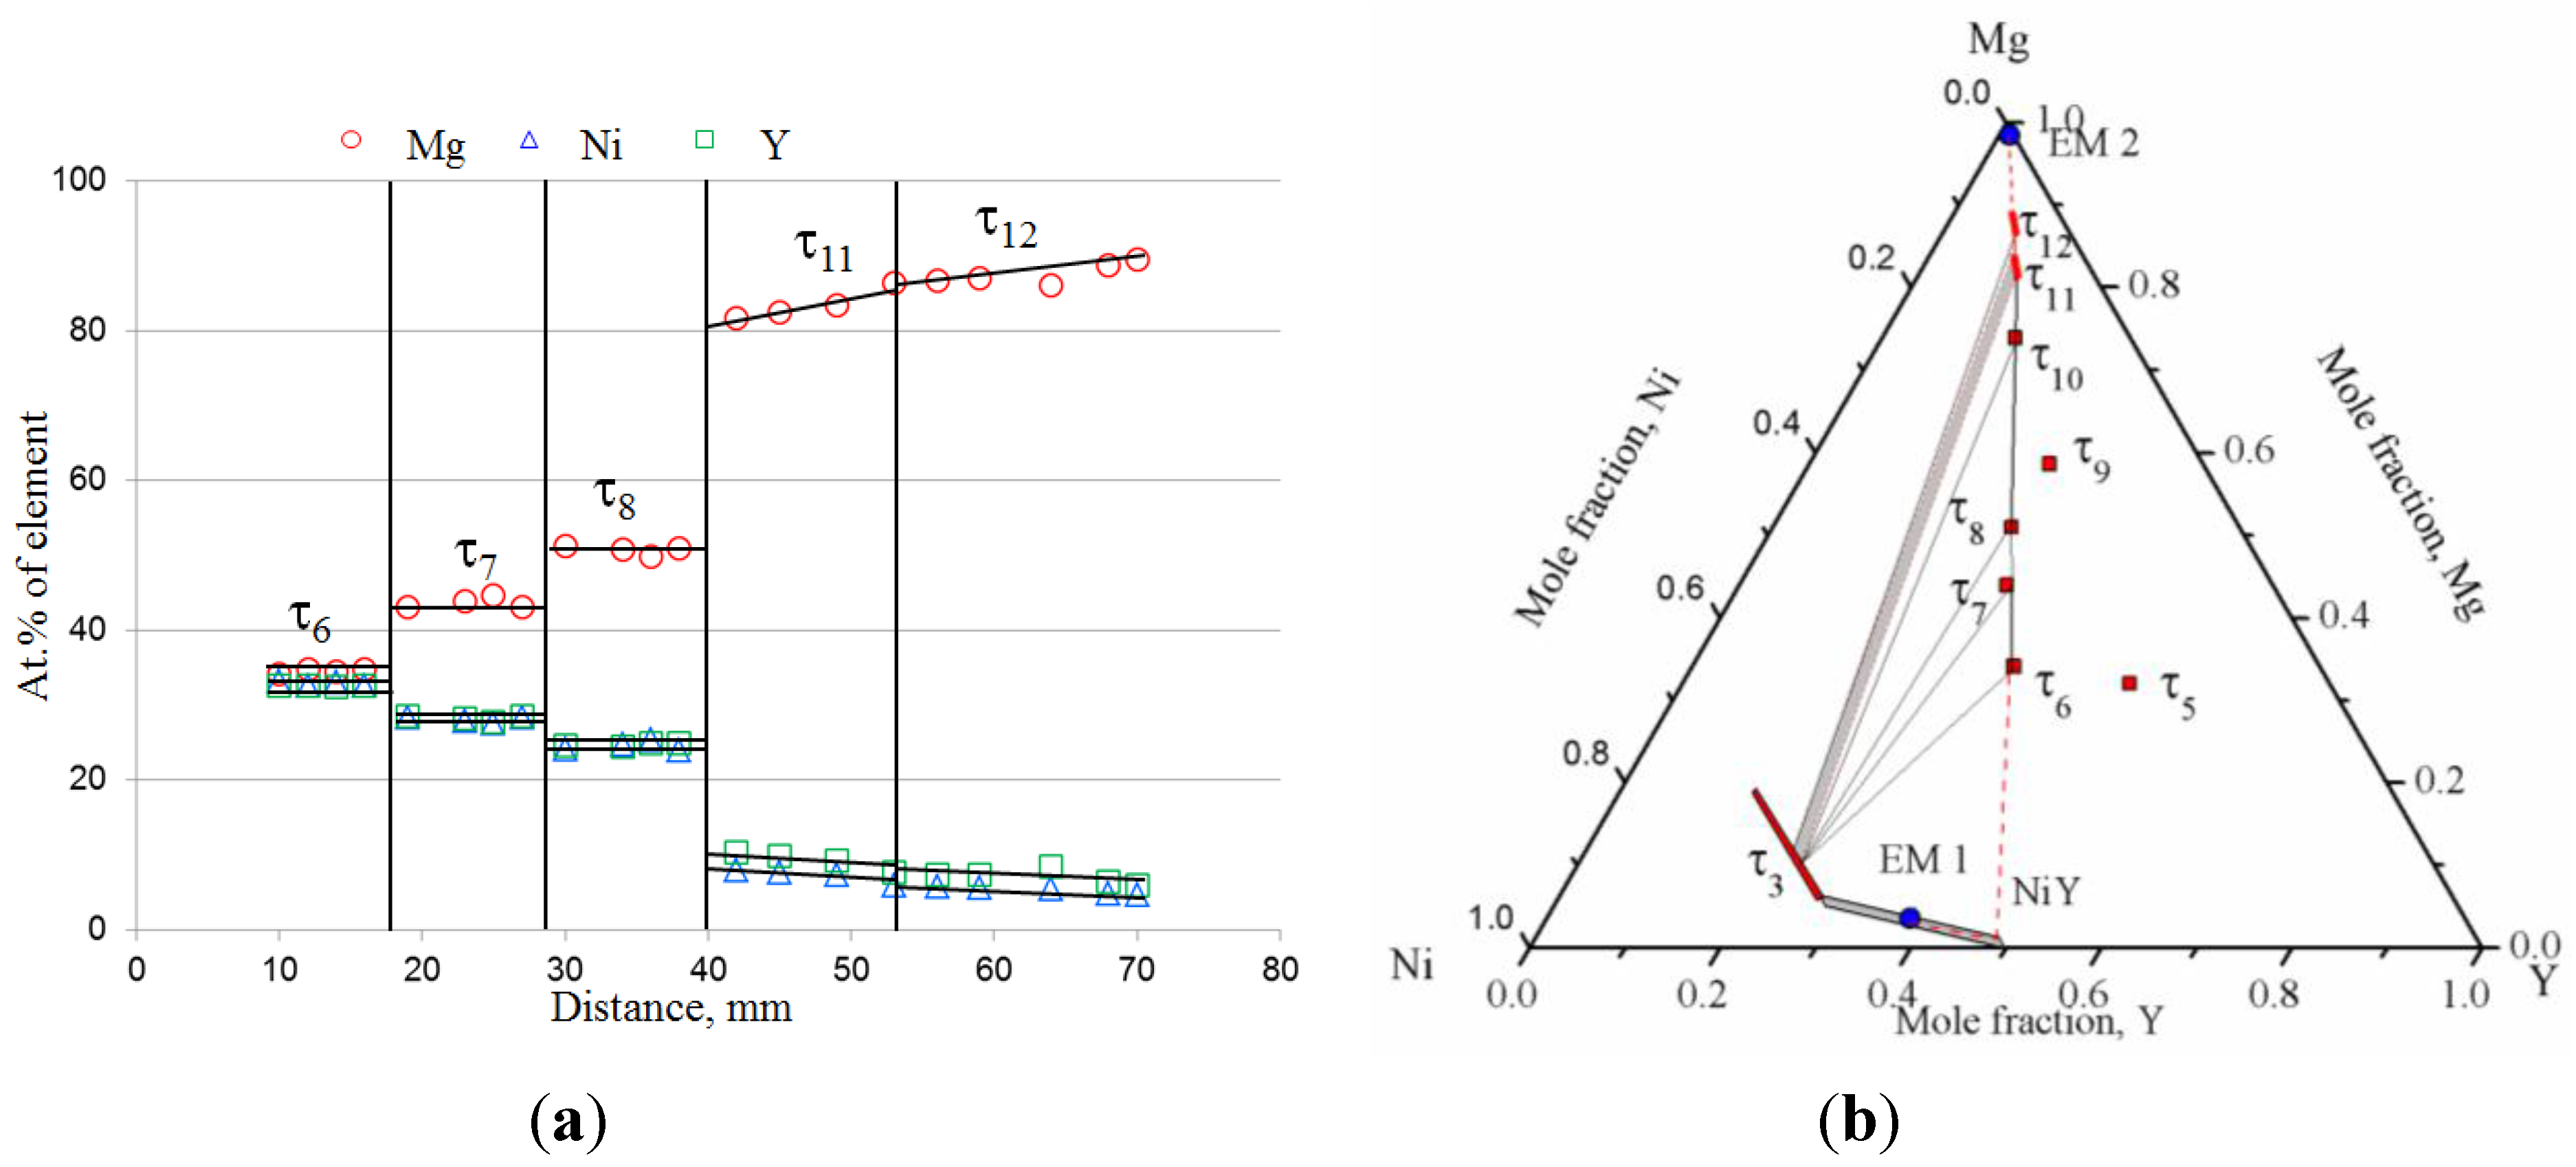
Two ternary compounds τ11 and τ12 in the Mg-rich corner of the Mg-Ni-Y phase diagram were identified in this work. τ11 was found in key samples 22 (37.2/36.3/26.5 Mg/Ni/Y at%) and 23 (53.0/25.1/21.9 Mg/Ni/Y at%). Also, solid-solid diffusion couples 2 and 3 in Figure 5 and Figure 7, showed the presence of τ11. It was found that τ11 has a solid solubility, which extends from ~82 to 85 at% Mg. τ12 was found in all three solid-solid diffusion couples as well as in key samples 24 (55.5/36.6/7.9 Mg/Ni/Y at%), 25 (78.2/15.5/6.3 Mg/Ni/Y at%) and 26 (84.9/12.9/2.2 Mg/Ni/Y at%). According to the WDS analysis, τ12 has a solubility range, which extends from ~85 to 89 at% Mg.
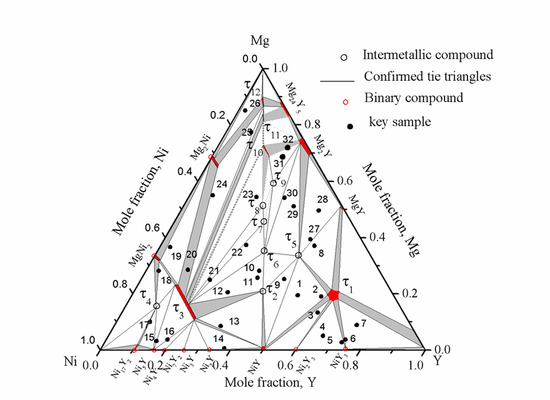
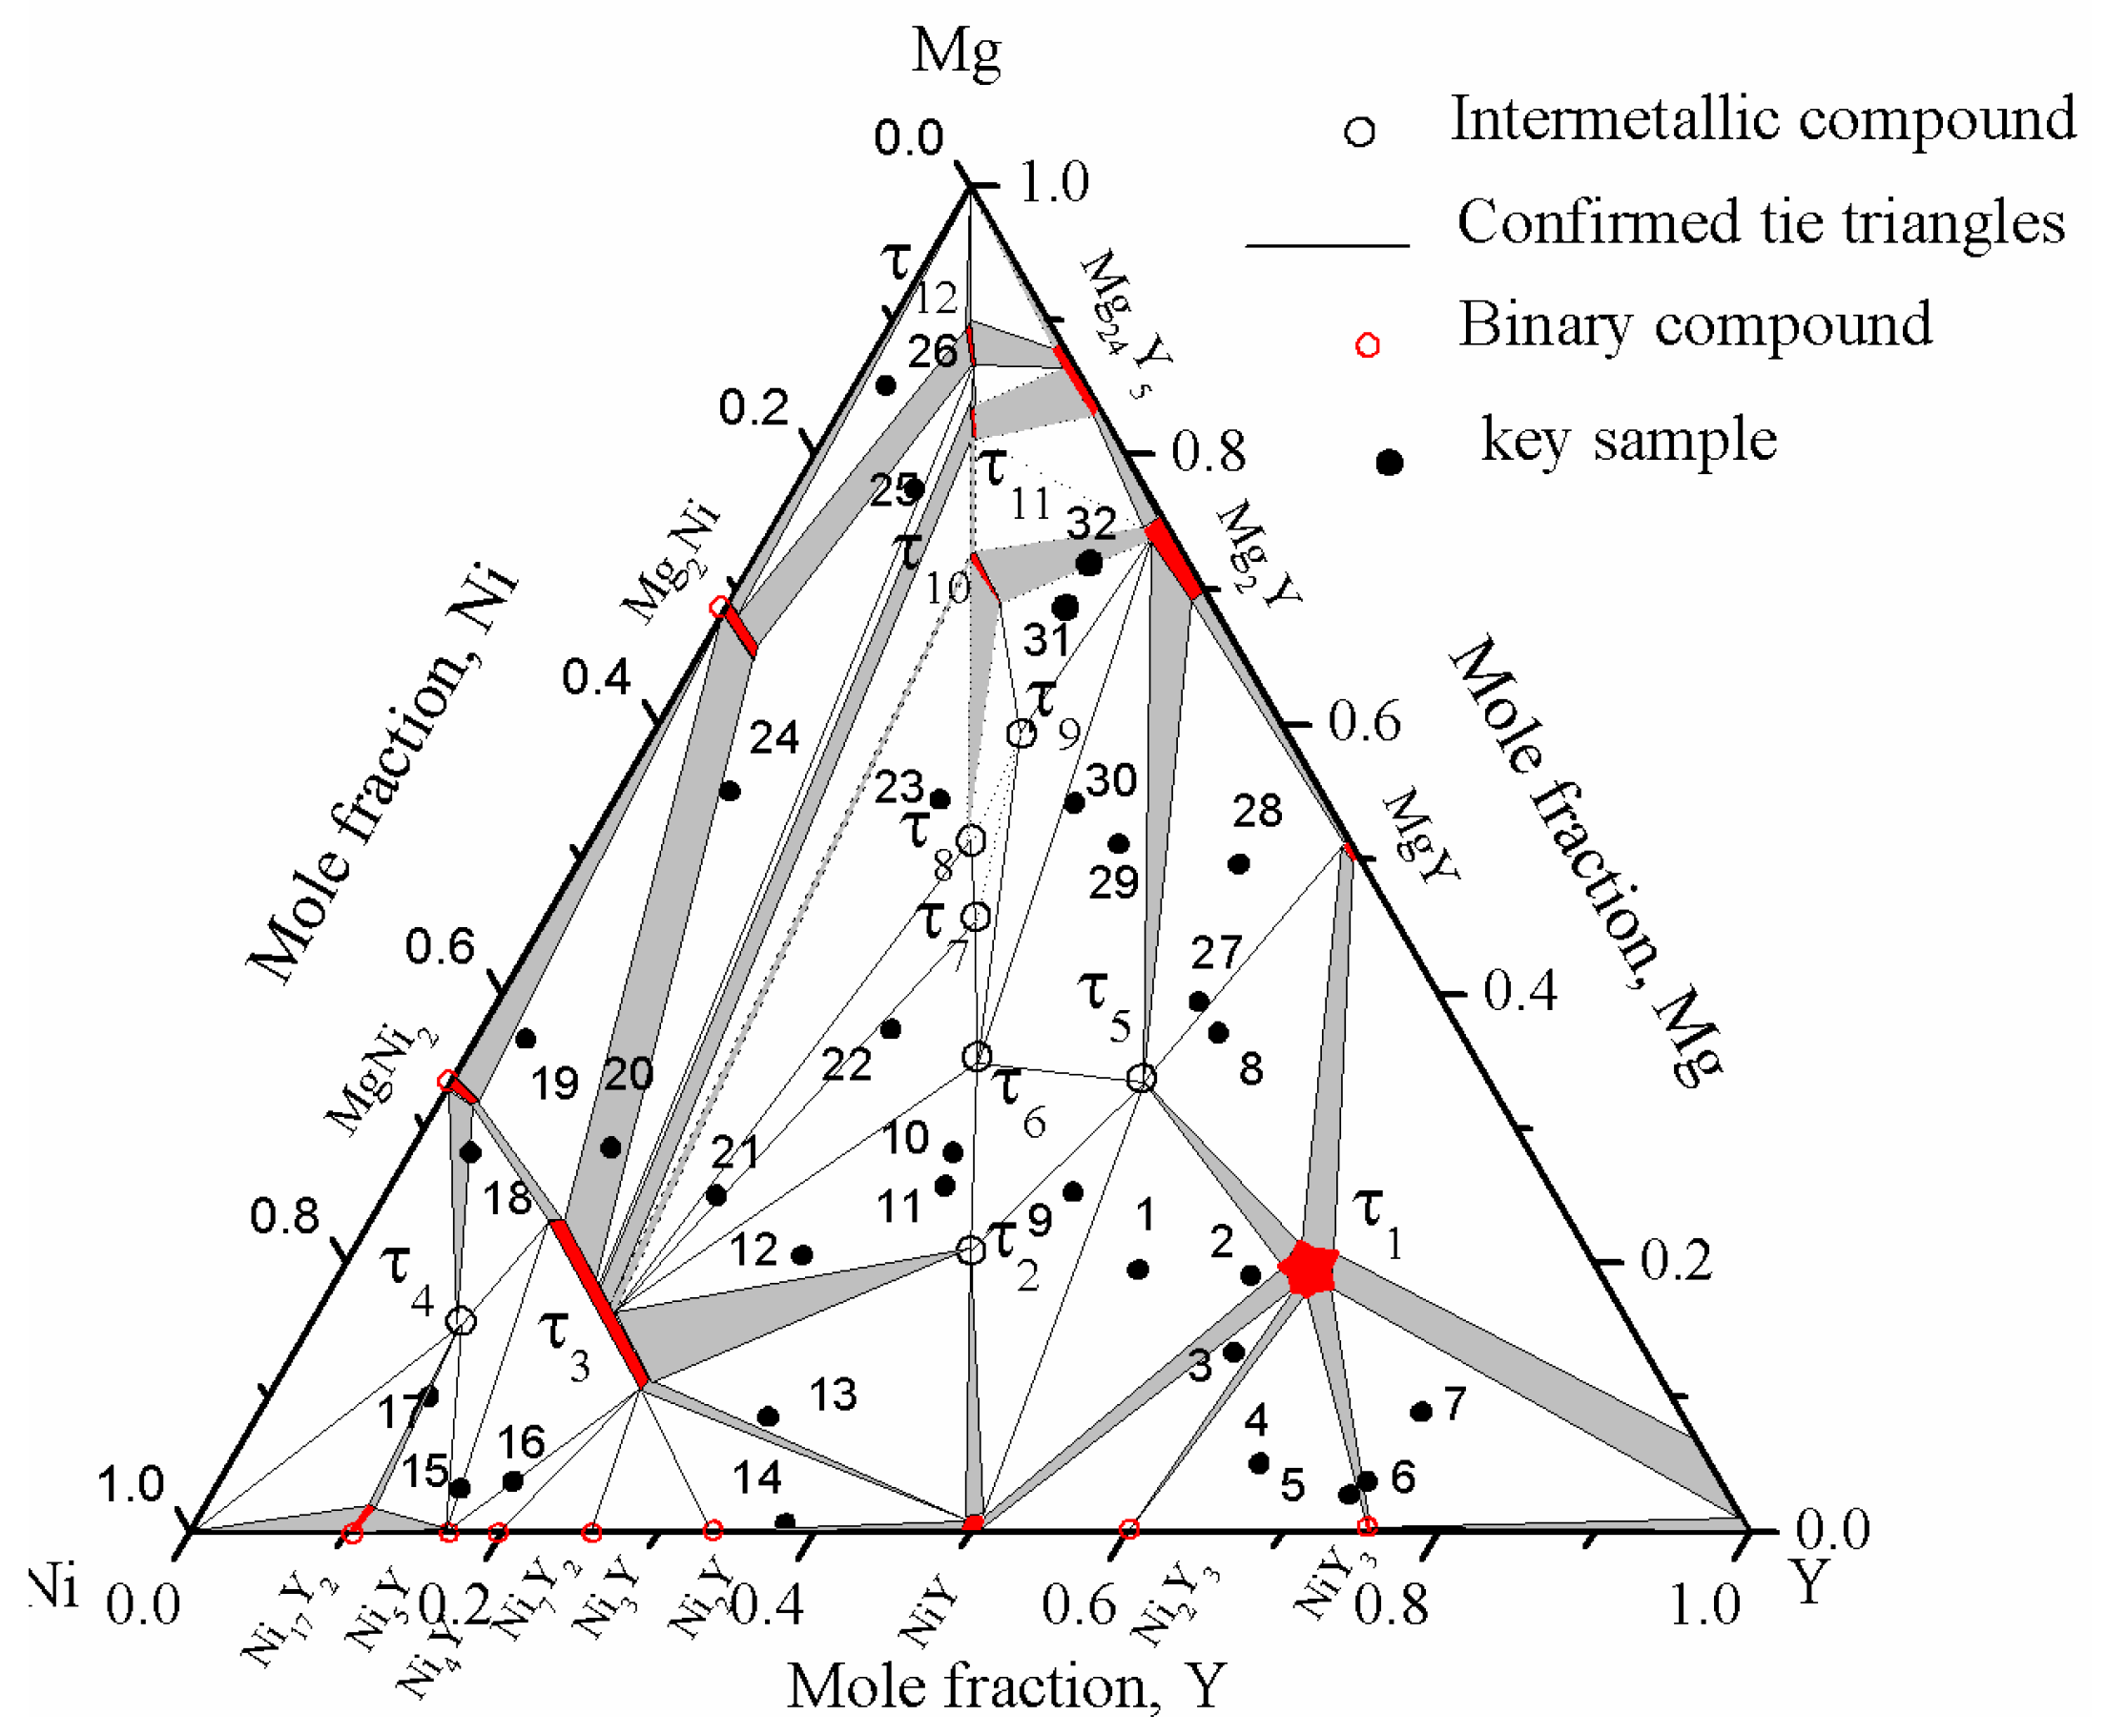
Based on the current results, an isothermal section of the Mg-Ni-Y system at 673 K was constructed as shown in Figure 19. The dotted lines in the isothermal section show the tentative phase relations, as these could not be confirmed experimentally due to very sluggish kinetics.
Figure 19. Isothermal section of the Mg-Ni-Y system at 673 K for the whole composition.
Metals 05 01746 g019

4. Summary

The isothermal section of the Mg-Ni-Y phase diagram at 673 K for the whole composition range was constructed using diffusion couples and key samples for the first time. The homogeneity ranges of ternary and binary compounds were determined and the phase relations among them were established using WDS and XRD studies. Ten new ternary compounds (τ1, τ2, τ5–τ12) were discovered in this system. The existence of two ternary compounds τ3 and τ4 were also confirmed. Ternary solubility of five of the ternary compounds, τ1, τ3, τ10, τ11, and τ12 at 673 K was determined and the rest were assumed stoichiometric compounds. Crystal structures of τ1 (Gd4RhIn) and τ2 (Mo2FeB2) were determined. The lattice parameter of τ1 is a = 1.3666 nm, and τ2 is a = 0.7395(9) nm and c = 0.3736(3) nm. τ3 is the most stable ternary compound which has solid solutions from 11 to 23 at% Mg, where Mg substitutes Y at constant 66% Ni. All the intermetallics along the Mg-NiY section are in equilibrium with τ3.

Acknowledgments

This research was carried out with the support of NSERC Alexander Graham Bell Canada Graduate Scholarship (NSERC CGS). The authors wish to express their appreciation for this support.

Author Contributions

Mamoun Medraj initiated the project. Mohammad Mezbahul-Islam and Mamoun Medraj designed the experiments. Mohammad Mezbahul-Islam performed the experiments. Mohammad Mezbahul-Islam, Dmytro Kevorkov and Mamoun Medraj interpreted the results. Mohammad Mezbahul-Islam wrote the manuscript with the suggestions of Dmytro Kevorkov and Mamoun Medraj. Mamoun Medraj revised the manuscript.

Conflicts of Interest

The authors declare no conflict of interest.

References

  1. Kim, S.G.; Inoue, A.; Masumoto, T. High mechanical strengths of magnesium-nickel-yttrium and magnesium-copper-yttrium amorphous alloys with significant supercooled liquid region. Mater. Trans. Jpn. Inst. Metals Mater. 1990, 31, 929–934. [Google Scholar]
  2. Puech, S.; Blandin, J.-J.; Soubeyroux, J.-L. Mg based bulk metallic glasses with high mechanical strength and large viscoplastic forming capacity. Adv. Eng. Mater. 2007, 9, 764–768. [Google Scholar] [CrossRef]
  3. Katz-Demyanetz, A.; Rosenson, H.; Koren, Z.; Regev, M. Bulk metallic glass formation in the Mg-Cu-Y system. Mater. Sci. Technol. 2009, 25, 1227–1233. [Google Scholar] [CrossRef]
  4. Inoue, A.; Masumoto, T. Mg-based amorphous alloys. Mater. Sci. Eng. A 1993, 173, 1–8. [Google Scholar] [CrossRef]
  5. Zhao, X.; Ma, L. Recent progress in hydrogen storage alloys for nickel/metal hydride secondary batteries. Int. J. Hydrogen Energy 2009, 34, 4788–4796. [Google Scholar] [CrossRef]
  6. Abrosimova, G.E. Formation of the metastable phase upon crystallization of light amorphous Mg-Ni-Y alloys. Phys. Solid State 2002, 44, 204–209. [Google Scholar] [CrossRef]
  7. Hara, M.; Morozumi, S.; Watanabe, K. Effect of a magnesium depletion on the Mg-Ni-Y alloy hydrogen absorption properties. J. Alloys Compd. 2006, 414, 207–214. [Google Scholar] [CrossRef]
  8. Orimo, S.; Züttel, A.; Ikeda, K.; Saruki, S.; Fukunaga, T.; Fujii, H.; Schlapbach, L. Hydriding properties of the MgNi-based systems. J. Alloys Compd. 1999, 293–295, 437–442. [Google Scholar] [CrossRef]
  9. Savyak, M.; Hirnyj, S.; Bauer, H.D.; Uhlemann, M.; Eckert, J.; Schultz, L.; Gebert, A. Electrochemical hydrogenation of Mg65Cu25Y10 metallic glass. J. Alloys Compd. 2004, 364, 229–237. [Google Scholar] [CrossRef]
  10. Du, Y.; Xu, L.; Shen, Y.; Zhuang, W.; Zhang, S.; Chen, G. Hydrogen absorption/desorption behavior of Mg50La20Ni30 bulk metallic glass. Int. J. Hydrogen Energy 2013, 38, 4670–4674. [Google Scholar] [CrossRef]
  11. Yao, Q.; Zhou, H.; Wang, Z. The isothermal section of the phase diagram of the ternary system Y-Mg-Ni at 673 K in the region 50–100 at% Ni. J. Alloys Compd. 2006, 421, 117–119. [Google Scholar] [CrossRef]
  12. Kadir, K.; Sakai, T.; Uehara, I. Structural investigation and hydrogen capacity of YMg2Ni9 and (Y0.5Ca0.5)(MgCa)Ni9: New phases in the AB2C9 system isostructural with LaMg2Ni9. J. Alloys Compd. 1999, 287, 264–270. [Google Scholar] [CrossRef]
  13. Kadir, K.; Sakai, T.; Uehara, I. Synthesis and structure determination of a new series of hydrogen storage alloys; RMg2Ni9 (R = La, Ce, Pr, Nd, Sm and Gd) built from mgni2 laves-type layers alternating with AB5 layers. J. Alloys Compd. 1997, 257, 115–121. [Google Scholar] [CrossRef]
  14. Kadir, K.; Noreus, D.; Yamashita, I. Structural determination of AMgNi4 (where A = Ca, La, Ce, Pr, Nd and Y) in the AuBe5 type structure. J. Alloys Compd. 2002, 345, 140–143. [Google Scholar] [CrossRef]
  15. Aono, K.; Orimo, S.; Fujii, H. Structural and hydriding properties of MgYNi4: A new intermetallic compound with C15b-type Laves phase structure. J. Alloys Compd. 2000, 309, L1–L4. [Google Scholar] [CrossRef]
  16. Mezbahul-Islam, M.; Medraj, M. A critical thermodynamic assessment of the Mg-Ni, Ni-Y binary and Mg-Ni-Y ternary systems. CALPHAD 2009, 33, 478–486. [Google Scholar] [CrossRef]
  17. Mezbahul-Islam, M.; Kevorkov, D.; Essadiqi, E.; Medraj, M. Ternary intermetallic compounds across the mg-niy line at 673 K. Mater. Sci. Forum 2012, 706–709, 1134–1139. [Google Scholar] [CrossRef]
  18. Wang, Z.; Luo, Q.; Chen, S.; Chou, K.-C.; Li, Q. Experimental investigation and thermodynamic calculation of the Mg–Ni–Y system (Y < 50 at%) at 400 and 500 °C. J. Alloys Compd. 2015, 649, 1306–1314. [Google Scholar]
  19. Jiang, M.; Zhang, S.; Bi, Y.; Li, H.; Ren, Y.; Qin, G. Phase equilibria of the long-period stacking ordered phase in the Mg-Ni-Y system. Intermetallics 2015, 57, 127–132. [Google Scholar] [CrossRef]
  20. Zhao, J.-C. A combinatorial approach for structural materials. Adv. Eng. Mater. 2001, 3, 143–147. [Google Scholar] [CrossRef]
  21. Zhao, J.-C. A combinatorial approach for efficient mapping of phase diagrams and properties. J. Mater. Res. 2001, 16, 1565–1578. [Google Scholar] [CrossRef]
  22. Van Loo, F.J.J. Multiphase diffusion in binary and ternary solid-state systems. Progress Solid State Chem. 1990, 20, 47–99. [Google Scholar] [CrossRef]
  23. Kodentsov, A.A.; Bastin, G.F.; van Loo, F.J.J. The diffusion couple technique in phase diagram determination. J. Alloys Compd. 2001, 320, 207–217. [Google Scholar] [CrossRef]
  24. Zhao, J.C.; Jackson, M.R.; Peluso, L.A. Determination of the Nb–Cr–Si phase diagram using diffusion multiples. Acta Mater. 2003, 51, 6395–6405. [Google Scholar] [CrossRef]
  25. Zhao, H.D.; Qin, G.W.; Ren, Y.P.; Pei, W.L.; Chen, D.; Guo, Y. The maximum solubility of Y in α-Mg and composition ranges of Mg24Y5−x and Mg2Y1−x intermetallic phases in Mg–Y binary system. J. Alloys Compd. 2011, 509, 627–631. [Google Scholar] [CrossRef]
  26. Mezbahul-Islam, M.; Mostafa, A.O.; Medraj, M. Essential magnesium alloys binary phase diagrams and their thermochemical data. J. Mater. 2014, 2014, 33. [Google Scholar] [CrossRef]
  27. Villars, P.; Cenzual, K. Pearson’s Crystal Data—Crystal Structure Database for Inorganic Compounds [CD-ROM]; ASM International: Materials Park, OH, USA, 2009. [Google Scholar]
  28. Tappe, F.; Schwickert, C.; Linsinger, S.; Poettgen, R. New rare earth-rich aluminides and indides with cubic Gd4RhIn-type structure. Monatsh. Chem. 2011, 142, 1087–1095. [Google Scholar] [CrossRef]

