Microstructure and Tensile-Shear Properties of Resistance Spot-Welded Medium Mn Steel
by
Qiang Jia
1, 
Lei Liu
1,
Wei Guo
2,
Yun Peng
3,
Guisheng Zou
1,*,
Zhiling Tian
3 and
Y. Norman Zhou
4 1
Department of Mechanical Engineering, Tsinghua University, Beijing 100084, China
2
School of Mechanical Engineering and Automation, Beihang University, Beijing 100191, China
3
Welding Research Institute, Central Iron and Steel Research Institute, Beijing 100081, China
4
Department of Mechanical and Mechatronics Engineering, University of Waterloo, Waterloo, ON N2L 3G1, Canada
*
Author to whom correspondence should be addressed.
Metals 2018, 8(1), 48; https://doi.org/10.3390/met8010048
Submission received: 10 December 2017
/
Revised: 4 January 2018
/
Accepted: 5 January 2018
/
Published: 11 January 2018
(This article belongs to the Special Issue Medium-Mn Steels, a Promising Type of the 3rd Generation Steels)
Abstract
:The medium Mn steels are gaining increasing attention due to their excellent combination of mechanical properties and material cost. A cold-rolled 0.1C5Mn medium Mn steel with a ferrite matrix plus metastable austenite duplex microstructure was resistance spot-welded with various welding currents and times. The nugget size rose with the increase of heat input, but when the welding current exceeded the critical value, the tensile-shear load increased slowly and became unstable due to metal expulsion. The fusion zone exhibited a lath martensite microstructure, and the heat-affected zone was composed of a ferrite/martensite matrix with retained austenite. The volume fraction of retained austenite decreased gradually from the base metal to the fusion zone, while the microhardness presented a reverse varying trend. Interfacial failure occurred along the interface of the steel sheets with lower loading capacity. Sufficient heat input along with serious expulsion brought about high stress concentration around the weld nugget, and the joint failed in partial interfacial mode. Pull-out failure was absent in this study.
1. Introduction
Current trends in automobiles have mainly aimed at improving safety, weight reduction and enhanced fuel economy [1]. Advanced high-strength steels (AHSSs) offer an opportunity to meet the increasing requirements of the car body. Twining-induced plasticity (TWIP) steels, as second-generation AHSSs, exhibit desirable tensile properties with strength higher than 700 MPa, as well as remarkable elongation exceeding 50% [2]. However, the high level of Mn (~20 wt %) not only increases the costs of the raw materials but also introduces problems during welding [3]. Recently, medium Mn steels, as third-generation AHSSs, are becoming attractive, with a good balance of material cost and mechanical properties.
Research about medium Mn steel was first reported by Miller in 1972, in which 0.11C5.7Mn steel was annealed at 600 °C for 16 h; the ultimate tensile strength (UTS) reached 878.4 MPa with a total elongation of 34% [4,5]. Studies relevant to medium Mn steel are mainly focused on (0.1–0.2)C(3–10)Mn (wt %) steels with a certain amount of austenite [6,7,8]. The final microstructure is usually controlled to be ferrite + austenite dual phases by inter-critical annealing between the start (As) and finish (Af) temperatures of the reverse transformation after hot-rolling or cold-rolling, during which the ferrite or martensite transforms into austenite [2,9]. It should be noted that the retained austenite in medium Mn steel is essential to obtain high strength with high ductility, which derives from the deformation-induced transformation of retained austenite to hard martensite. At the same time, dislocations around the newly formed martensite resulting from volume expansion during transformation can enhance its mechanical properties, too [10].
Although medium Mn steels have been actively investigated, current studies are mainly focused on the relationship of the microstructure and properties of hot-rolled or cold-rolled steel sheets. There are very few published studies available on the welding of medium Mn steel. Lun et al. [11] investigated laser-welded Fe-0.15C-10Mn-1.5Al medium Mn transformation-induced plasticity (TRIP) steel; the joints achieved approximately 96% joint efficiency, while the formability was severely limited by the brittle fusion zone (FZ). Resistance spot-welding (RSW) is the predominant process for joining steel sheet components in the automobile industry. The spot-weld quality is critical to the reliability of the overall automobile as cars typically contain thousands of spot-welds [12,13,14]. Saha et al. [15] reported that the TWIP steel was highly susceptible to the liquation crack, and some elements such as C, Mn, and Ti showed strong segregation behavior of TWIP steel after RSW. However, the characteristic of resistance spot-welded AHSSs containing medium levels of Mn has still not been reported. In this work, 0.1C5Mn steel was selected and spot-welded. The focus of this study is to evaluate the effect of heat input on tensile-shear properties and the microstructure evolution of the steel after spot-welding.
2. Materials and Methods
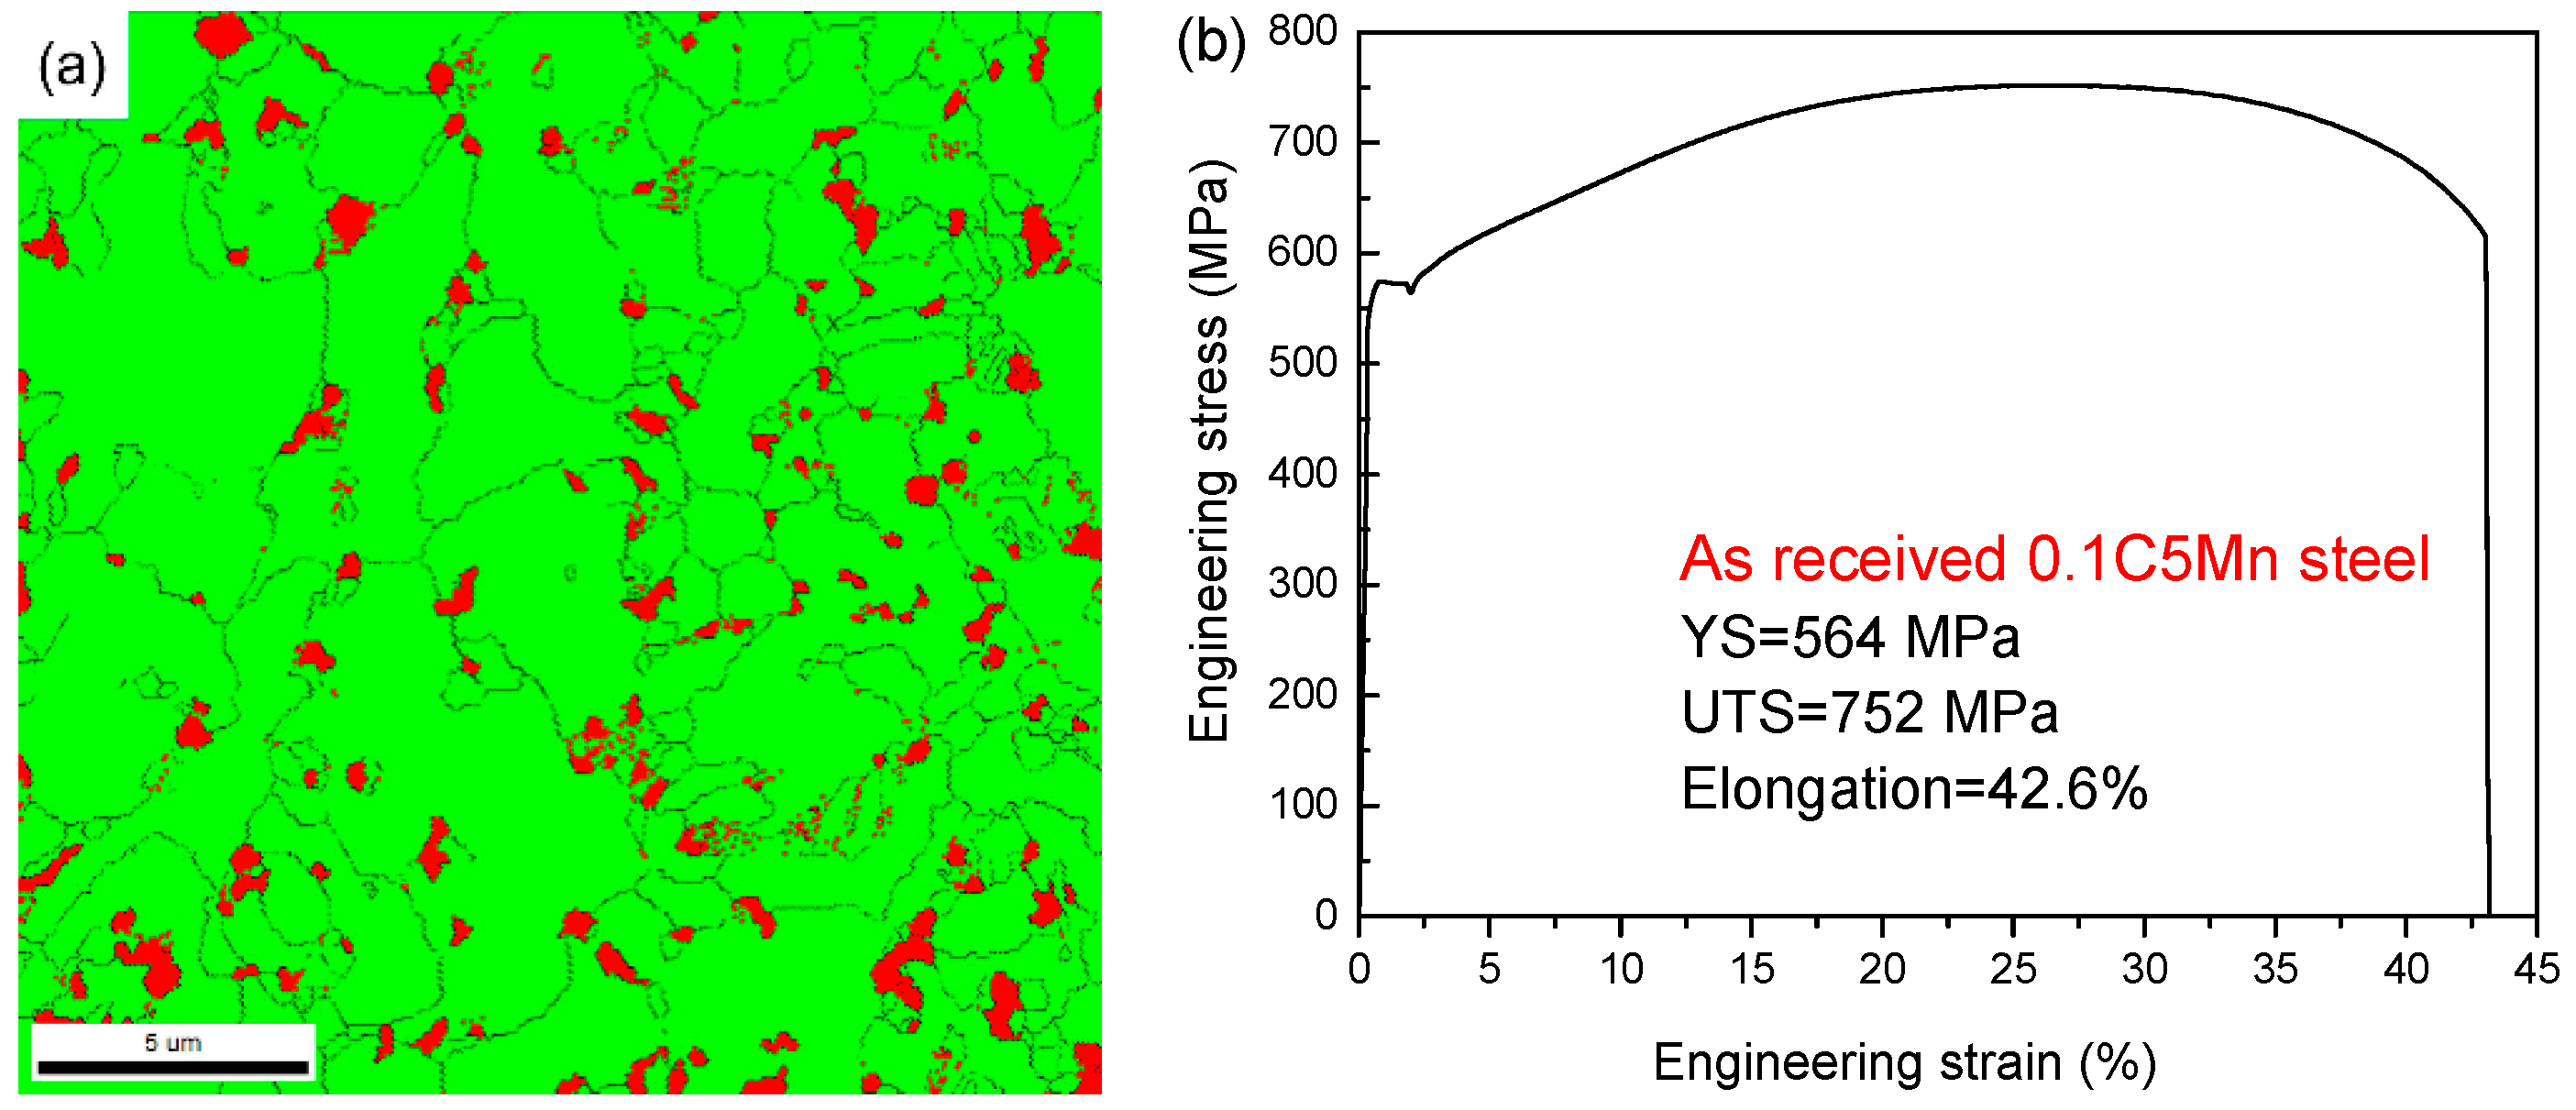
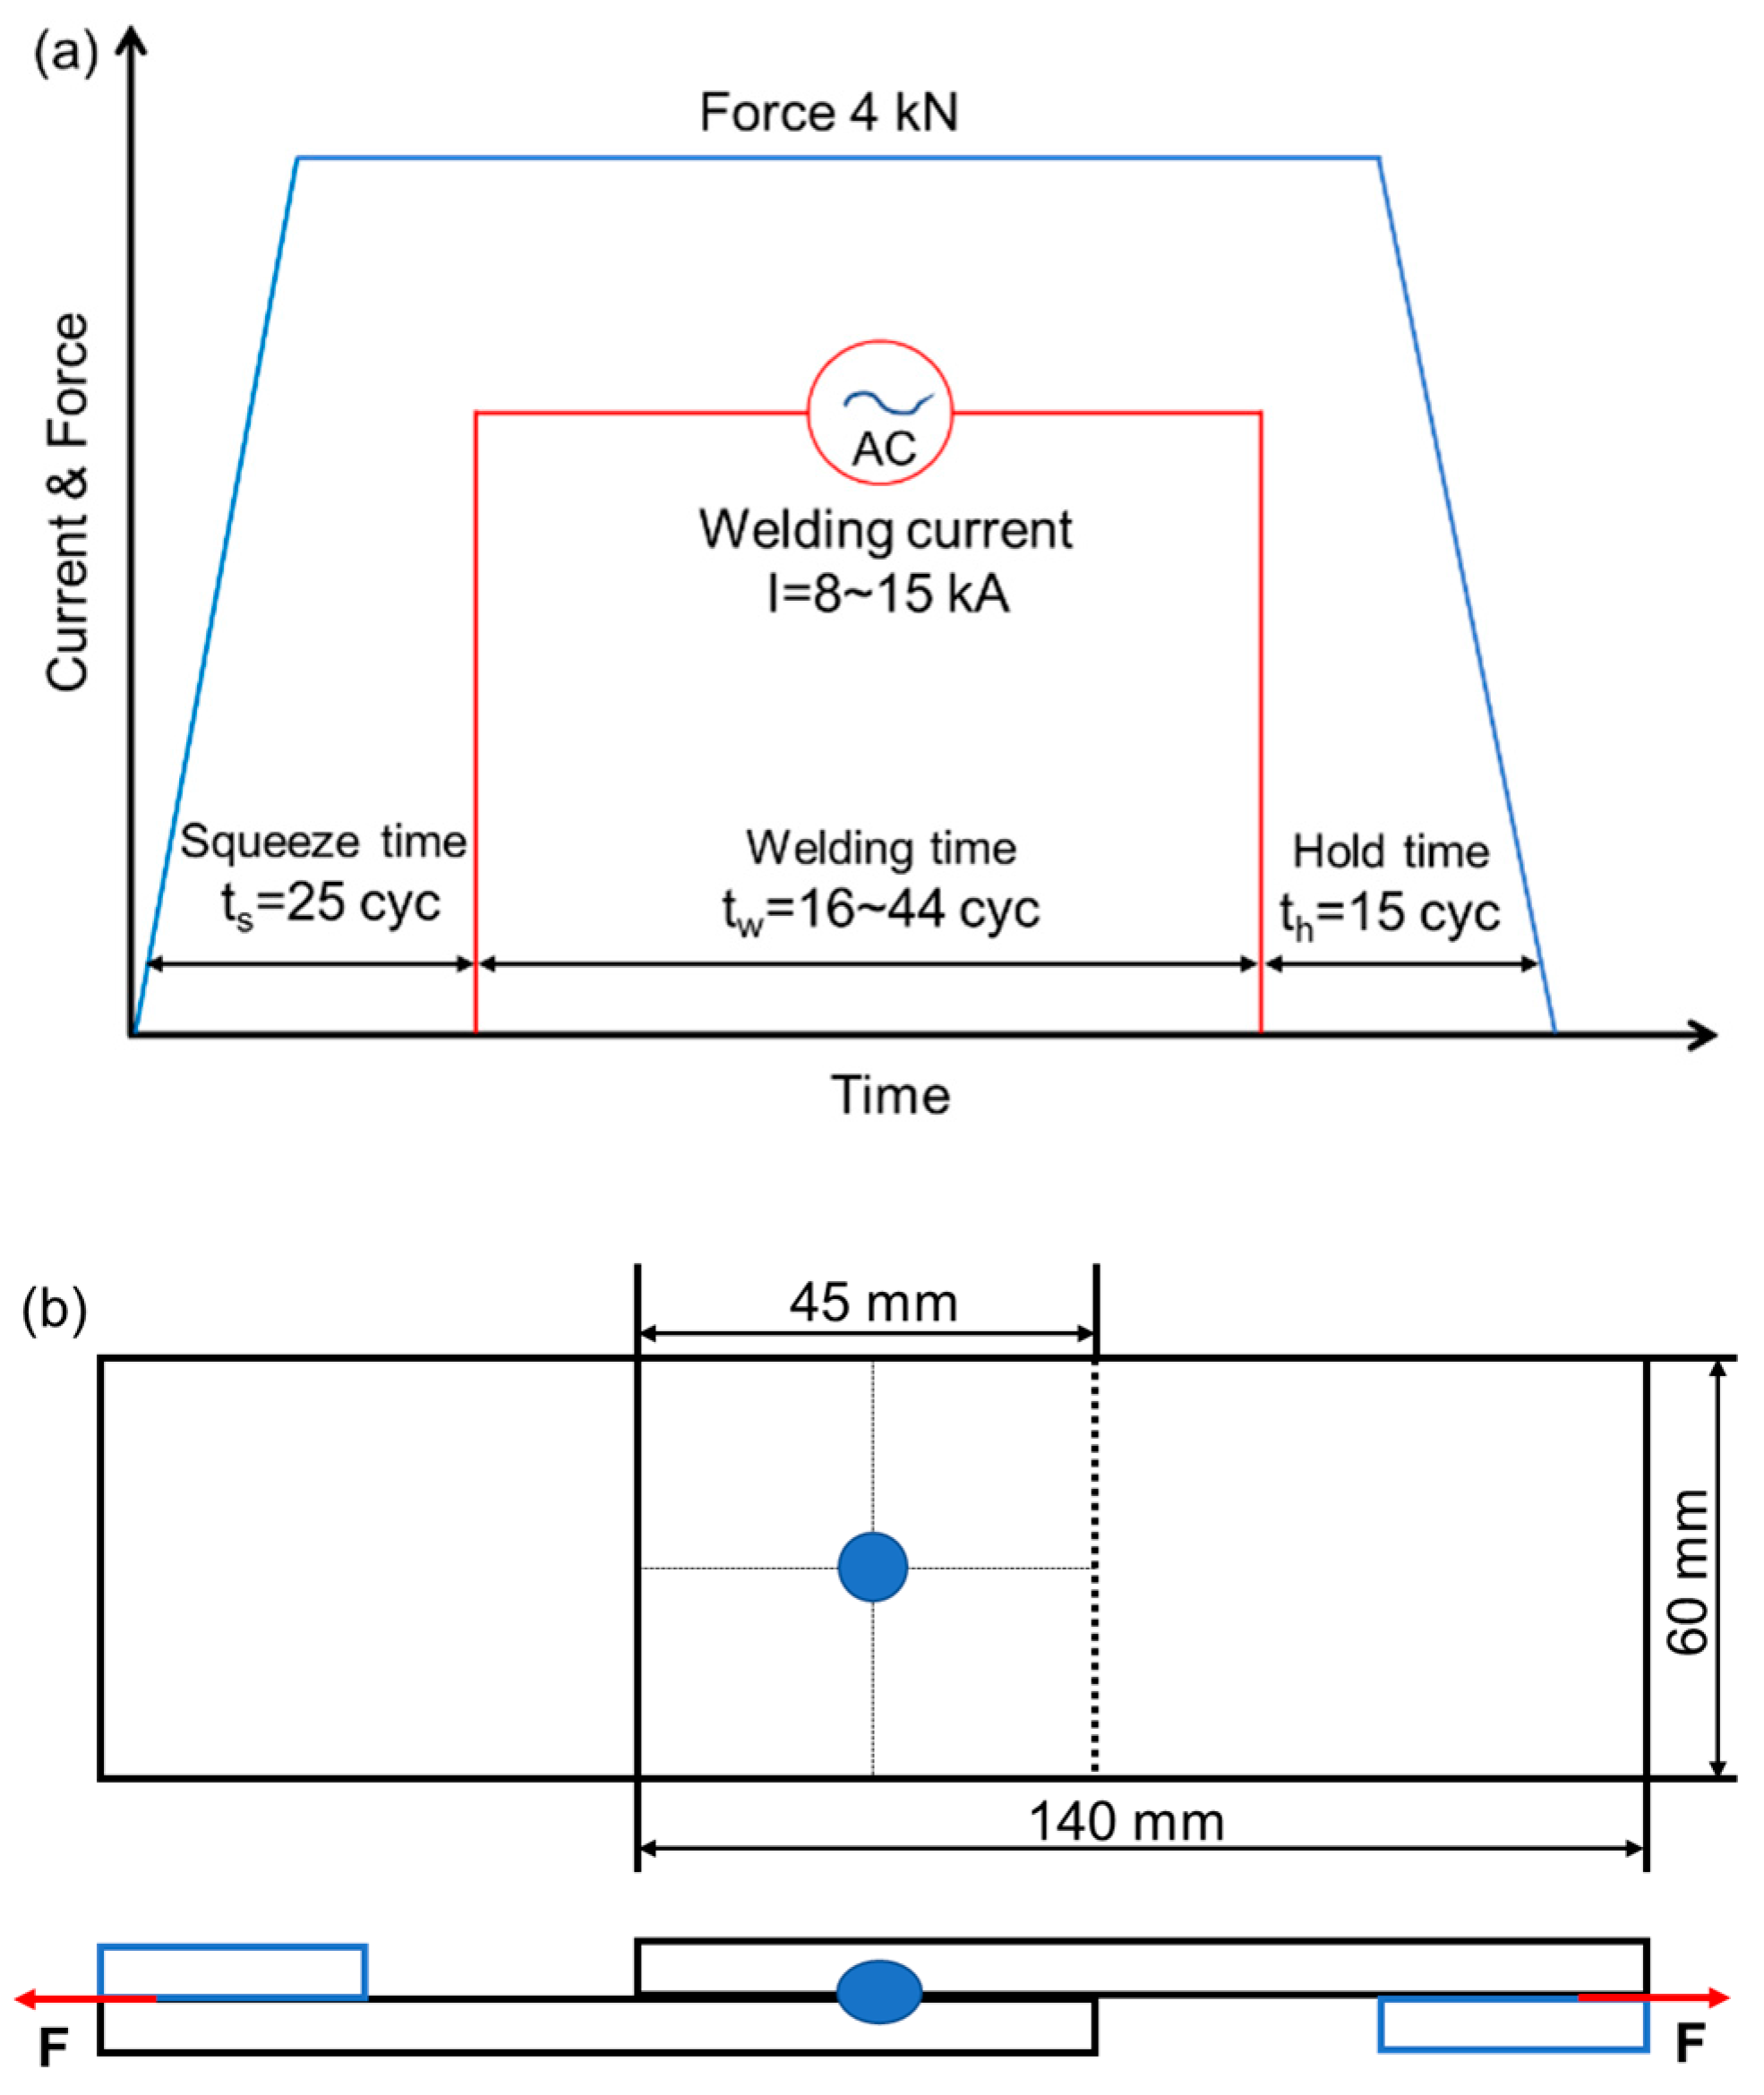
The base metal (BM) used in this study was 0.1C5Mn (wt %) steel, which was cold-rolled to 1.96 mm in thickness. As shown in Figure 1a, the BM consisted of a dual-phase microstructure of globular-shaped ferrite (green) and retained austenite (red) phases after intercritical annealing as a result of active recovery and recrystallization. Figure 1b presents the engineering stress-strain curve of the BM. The ultimate tensile strength (UTS) and yield strength (YS) reached 752 MPa and 564 MPa, respectively, and the elongation was as high as 42.6%. The surfaces of the steel sheets were cleaned by acetone prior to the welding experiments. RSW was implemented using a Panasonic spot-welding machine (YF-0701DHGE). The 45° truncated cone electrode was Cu-Cr alloyed with 8 mm face diameter. Figure 2a shows the schematic schedule of welding process (1 cyc = 0.02 s), and Figure 2b presents the dimensions of the spot-welding samples.
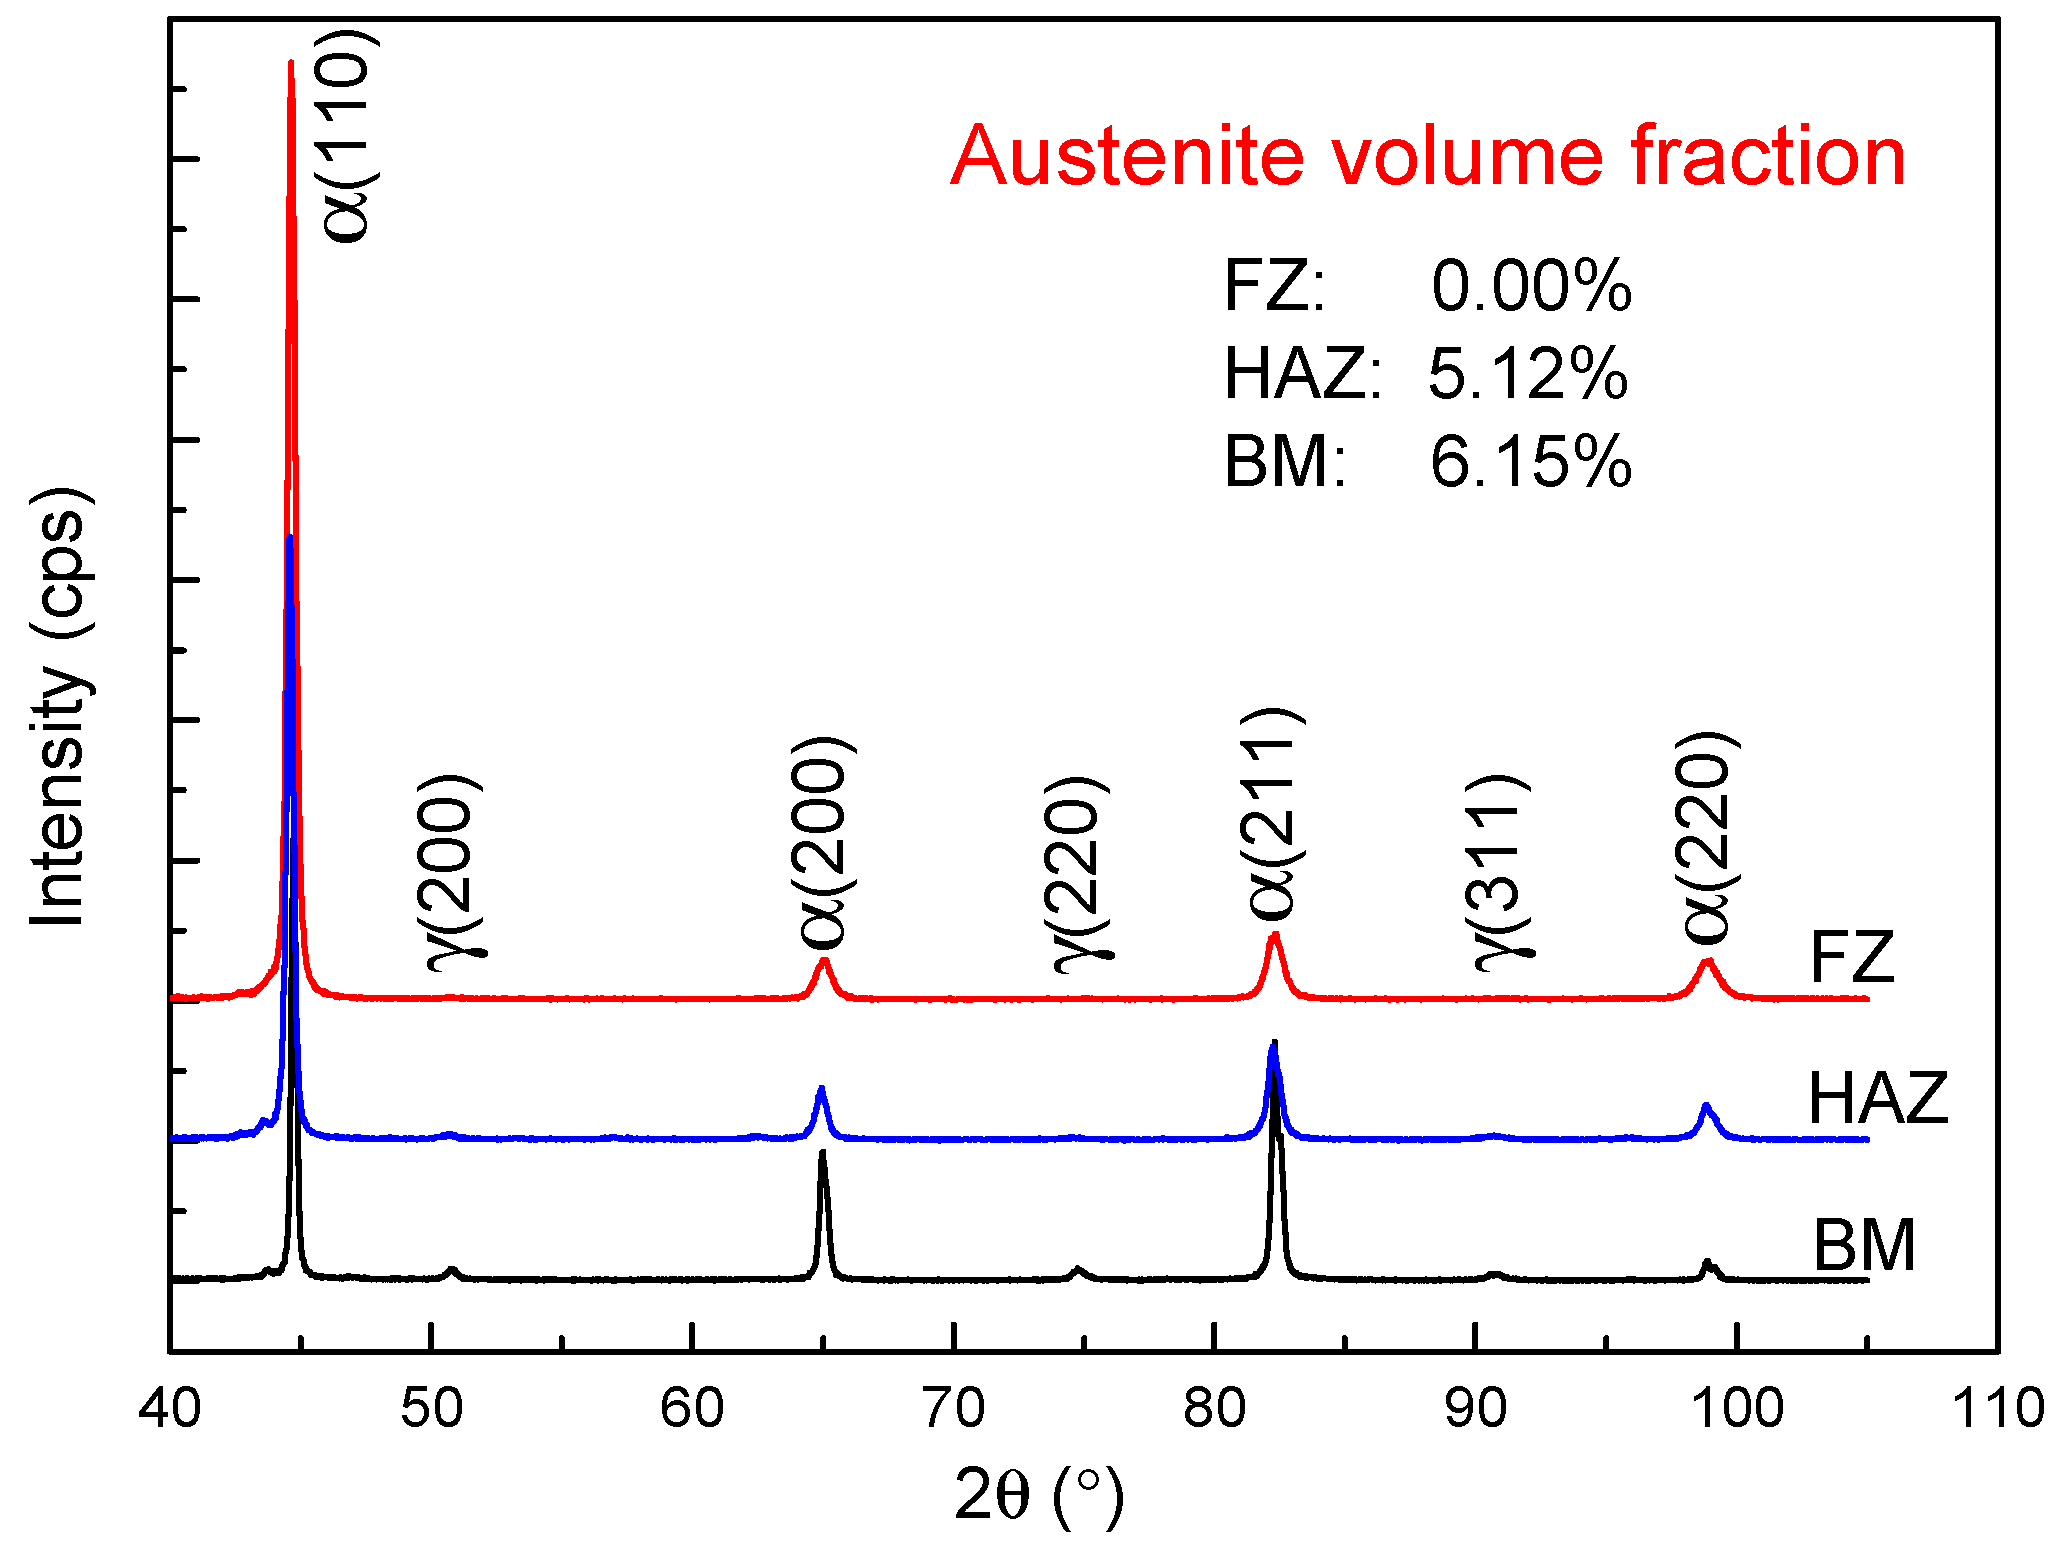
Metallographic samples of the welded joints were prepared using standard metallographic procedure followed by 2% nital solution. Optical microscope (OM; Olympus DP72, Tokyo, Japan), scanning electron microscope (SEM; Zeiss Sigma 500, Oberkochen, Germany) and electron backscatter diffraction (EBSD; EDAX, Mahwah, NJ, USA) were employed to characterize the microstructure. Samples for EBSD measurements were then fine-polished by argon ion milling (5.0, 4.5, and 4.0 kV for 30 min, respectively; Leica, Wetzlar, Germany). X-ray diffraction (XRD; Cu-Kα radiation, 40 kV, 150 mA; Rigaku Corporation, Tokyo, Japan) based on the integrated intensities of (200) α, (211) α, (200) γ, (220) γ and (311) γ diffraction peaks was used to determine the austenite volume fraction. Samples for XRD measurements were stress-relieved in a solution of 20% perchloric acid, 10% glycerin, and 70% ethyl alcohol.
Microhardness was evaluated using a Vickers hardness tester (FM 800, Future-Tech Corp., Kawasaki, Japan) with a load of 300 g and 15 s dwell time. The tensile-shear load, i.e., the peak force during loading, was used to evaluate the mechanical properties of the joint. The tensile-shear test samples were prepared according to ISO 14273-2001 standard, using an electromechanical universal testing machine (WDW-50, Shanghai Bairoe Test Instrument Co., Ltd., Shanghai, China) at a constant crosshead speed of 2 mm/min.
3. Results and Discussion
3.1. Effect of Welding Parameters on Nugget Size and Tensile-Shear Properties
The effect of welding current and welding time on nugget size, tensile-shear load, and energy absorption was investigated. The nugget size mainly depended on the heat input during spot-welding. The heat input Q(t), caused by Joule effect, can be calculated as:
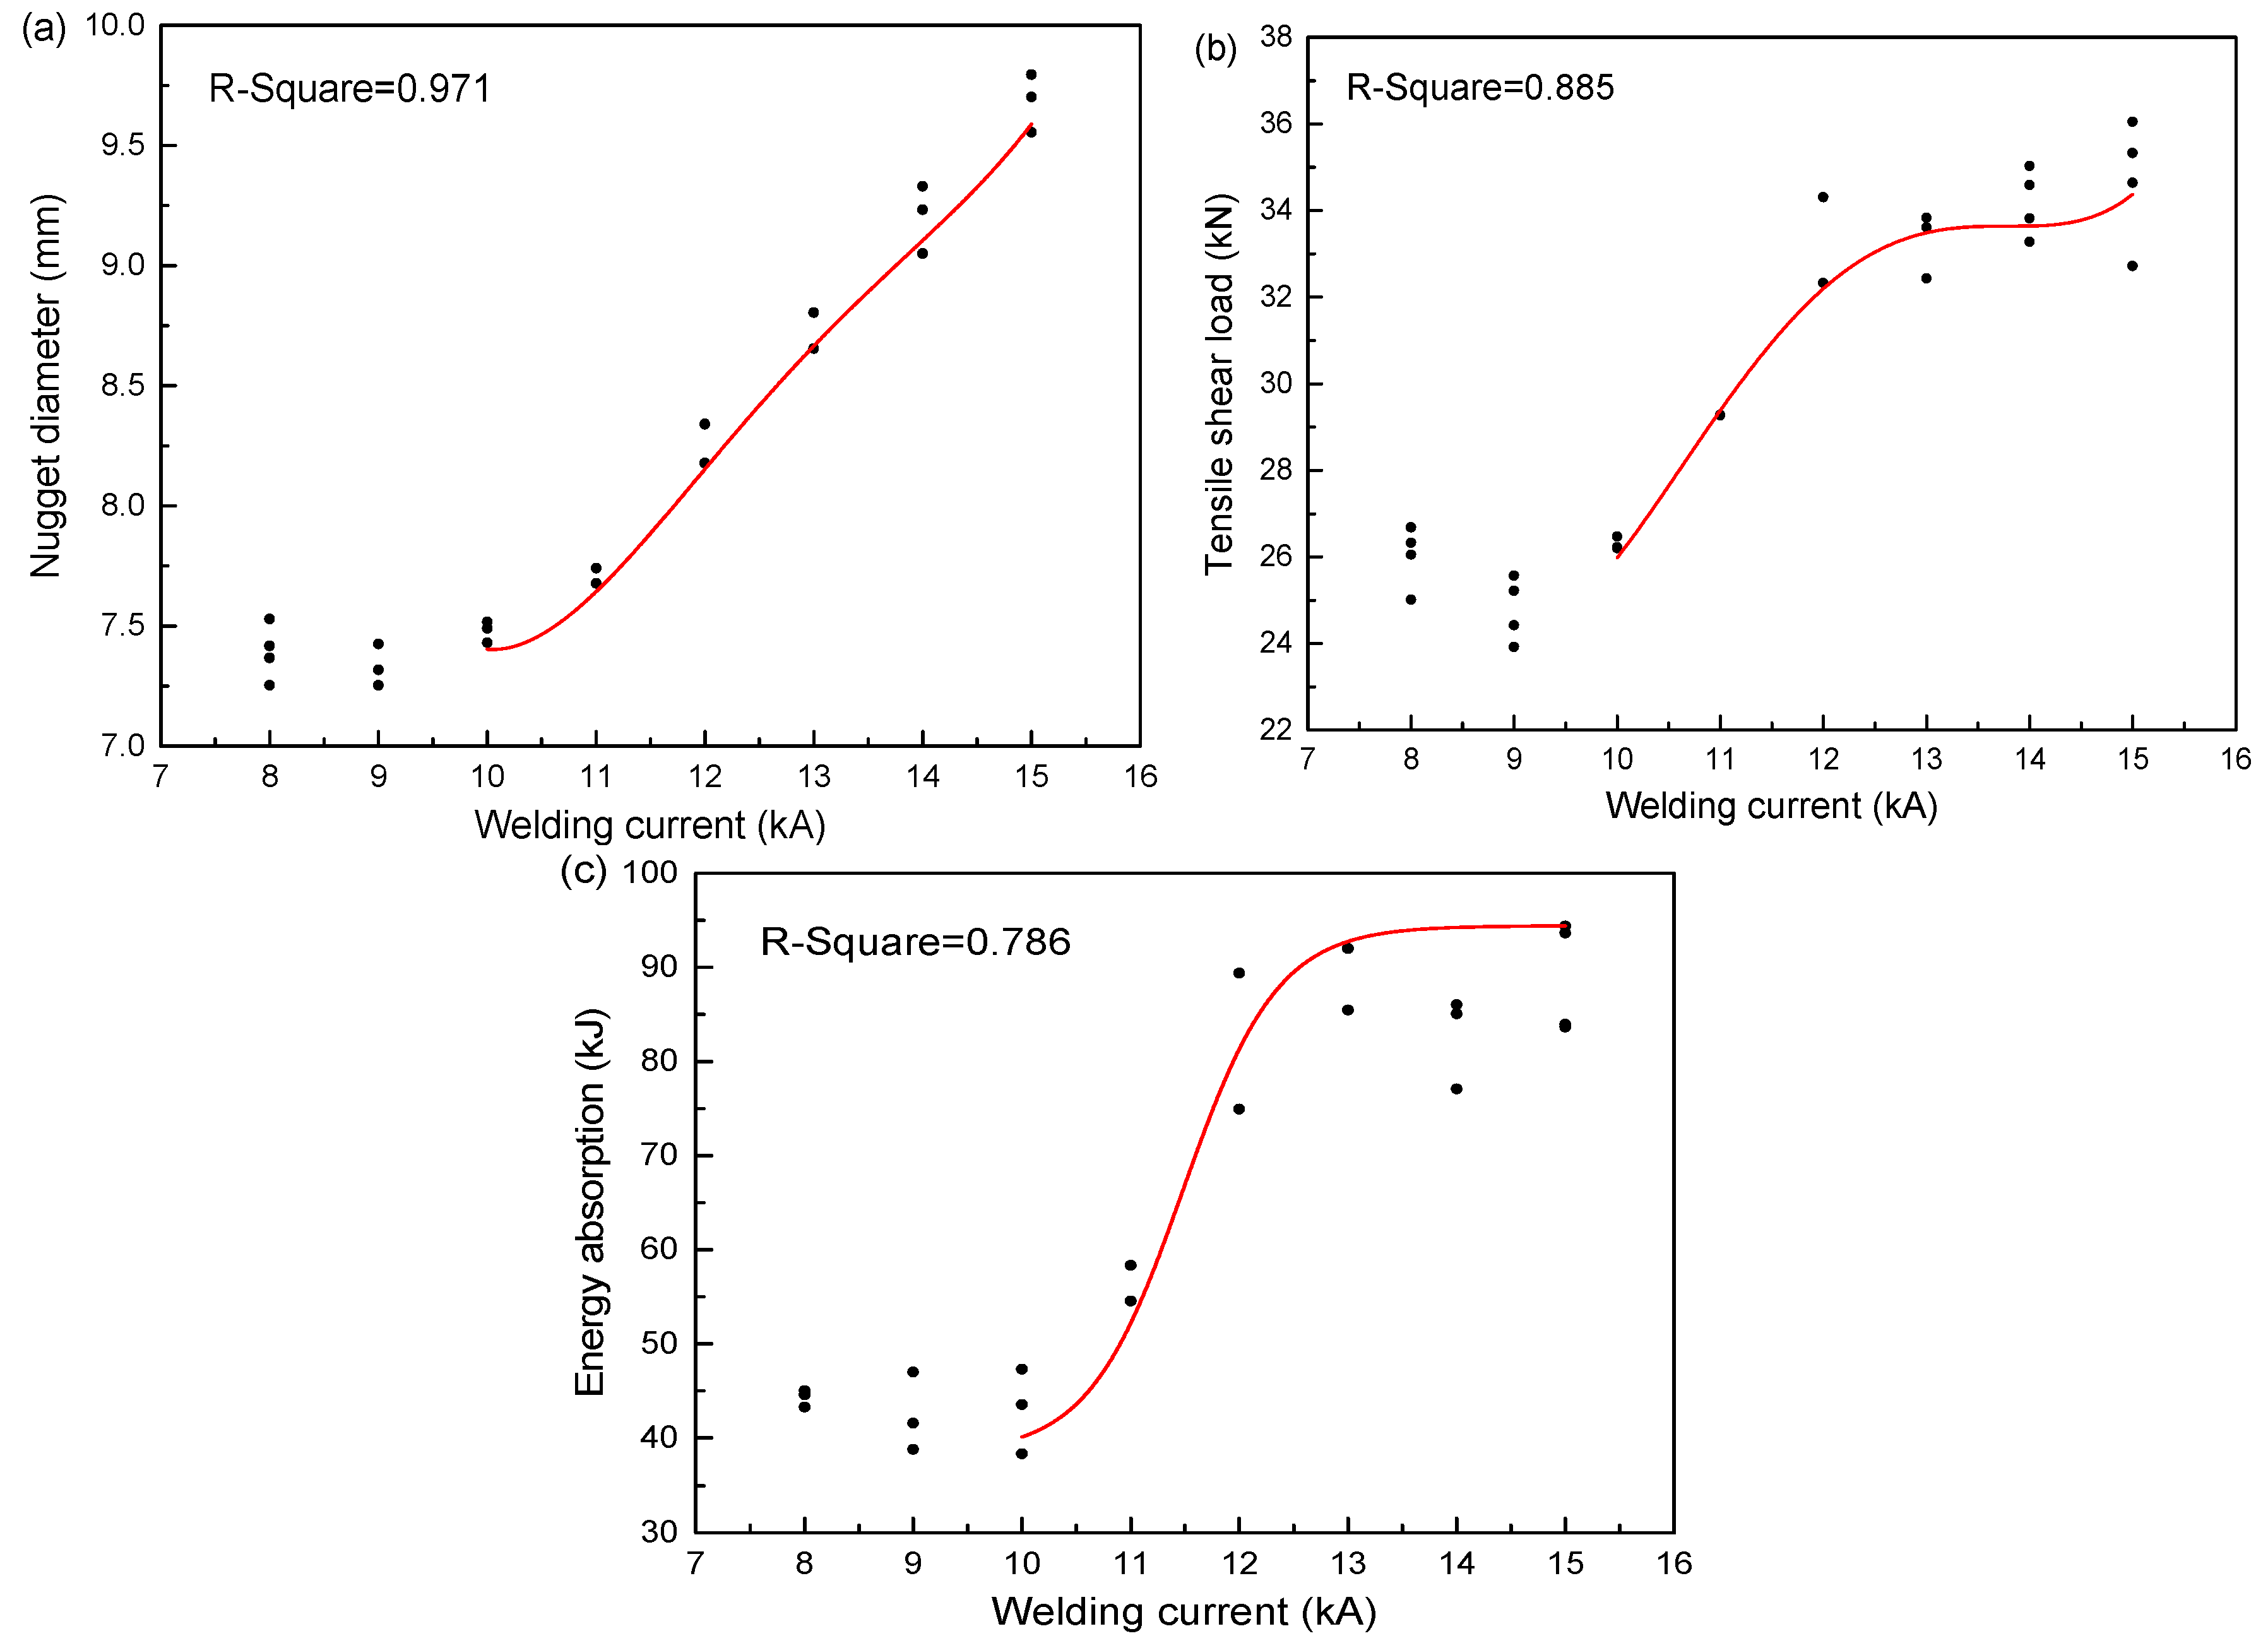
where η is the thermal efficiency, I(t) is the welding current, R(t) is the spot-weld electrical resistance. Thus, the welding current counts much for the heat input during spot-welding. Figure 3 demonstrates the results spot-welded at constant welding time 20 cyc and electrode force 4 kN with welding current varying from 8 to15 kA. Incomplete FZ was found when the joint was spot-welded at 8 and 9 kA due to insufficient heat input. Extremely serious metal expulsion between the steel sheets was ejected when the welding current reached 15 kA. The nugget size, as shown in Figure 3a, increased linearly with the welding current rising from 10 to 15 kA. Generally, a larger nugget diameter can bear a higher load [16]. As can be found in Figure 3b, the tensile-shear load increased linearly when the welding current ranged from 10 to 12 kA. However, the peak load only increased slightly and became unstable when the welding current exceeded 12 kA. This was because of the molten metal ejected from the FZ during RSW. The metal expulsion and the deep electrode indentation had a negative effect on the mechanical properties of the spot-welds on the condition of excessive heat input. Energy absorption was calculated using the area under the load-displacement curve up to the maximum load. The energy absorption presented similar varying trends to that of the tensile-shear load under various welding currents (Figure 3c).
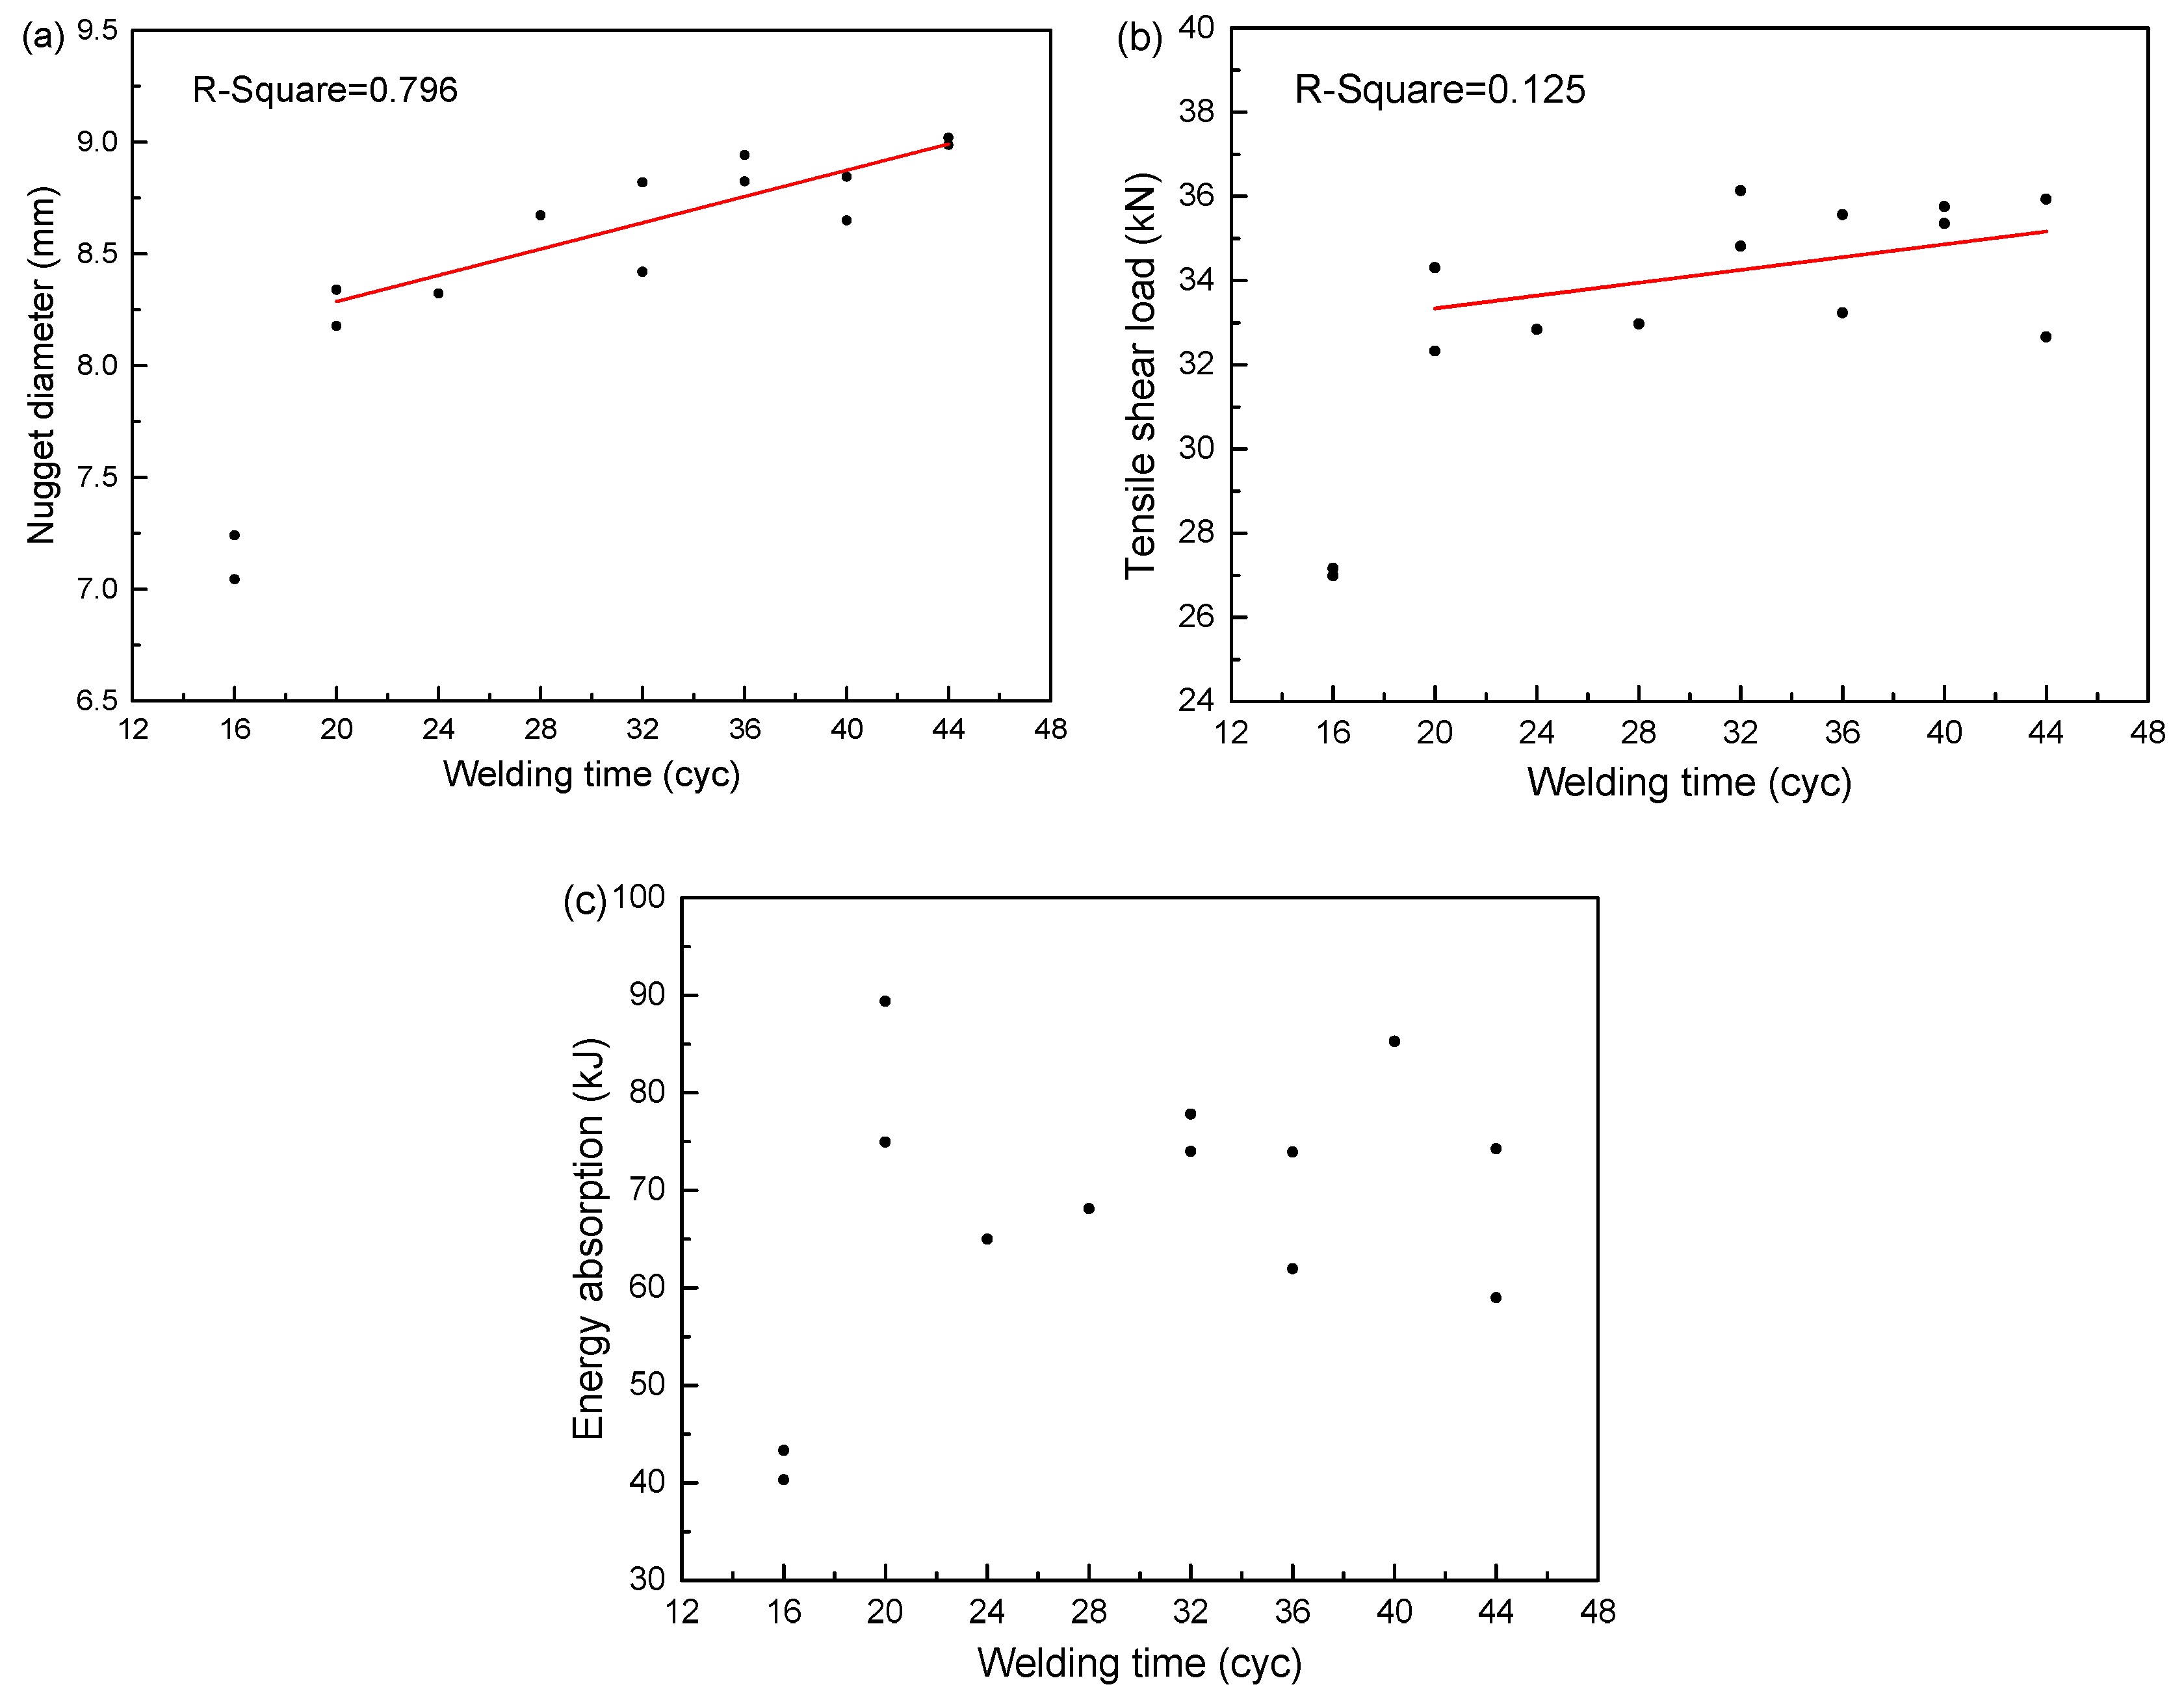
Equation (1) indicates that the welding time also has obvious influence on the heat input of spot-welding. Figure 4 displays the results spot-welded at the welding current 12 kA and electrode force 4 kN with welding time ranged from 16 to 44 cyc. Weld defect, i.e., the unfused zone, appeared when the welding time was less than 20 cyc. As illustrated in Figure 4a,b, nugget size and the tensile-shear load increased linearly but slowly when the welding time increased from 20 to 44 cyc. However, the steel sheet and electrode became joined together when the welding time was more than 44 cyc. Energy absorption was higher than 60 kJ when the welding time was more than 20 cyc (Figure 4c). Longer welding time resulted in obvious metal expulsion and deep electrode indentation, which affected the repeatability of the tensile-shear behavior, while energy absorption was not only influenced by the tensile-shear load but also the ductility. Thus, the energy absorption exhibited larger scattering.
3.2. Microstructure Evolution
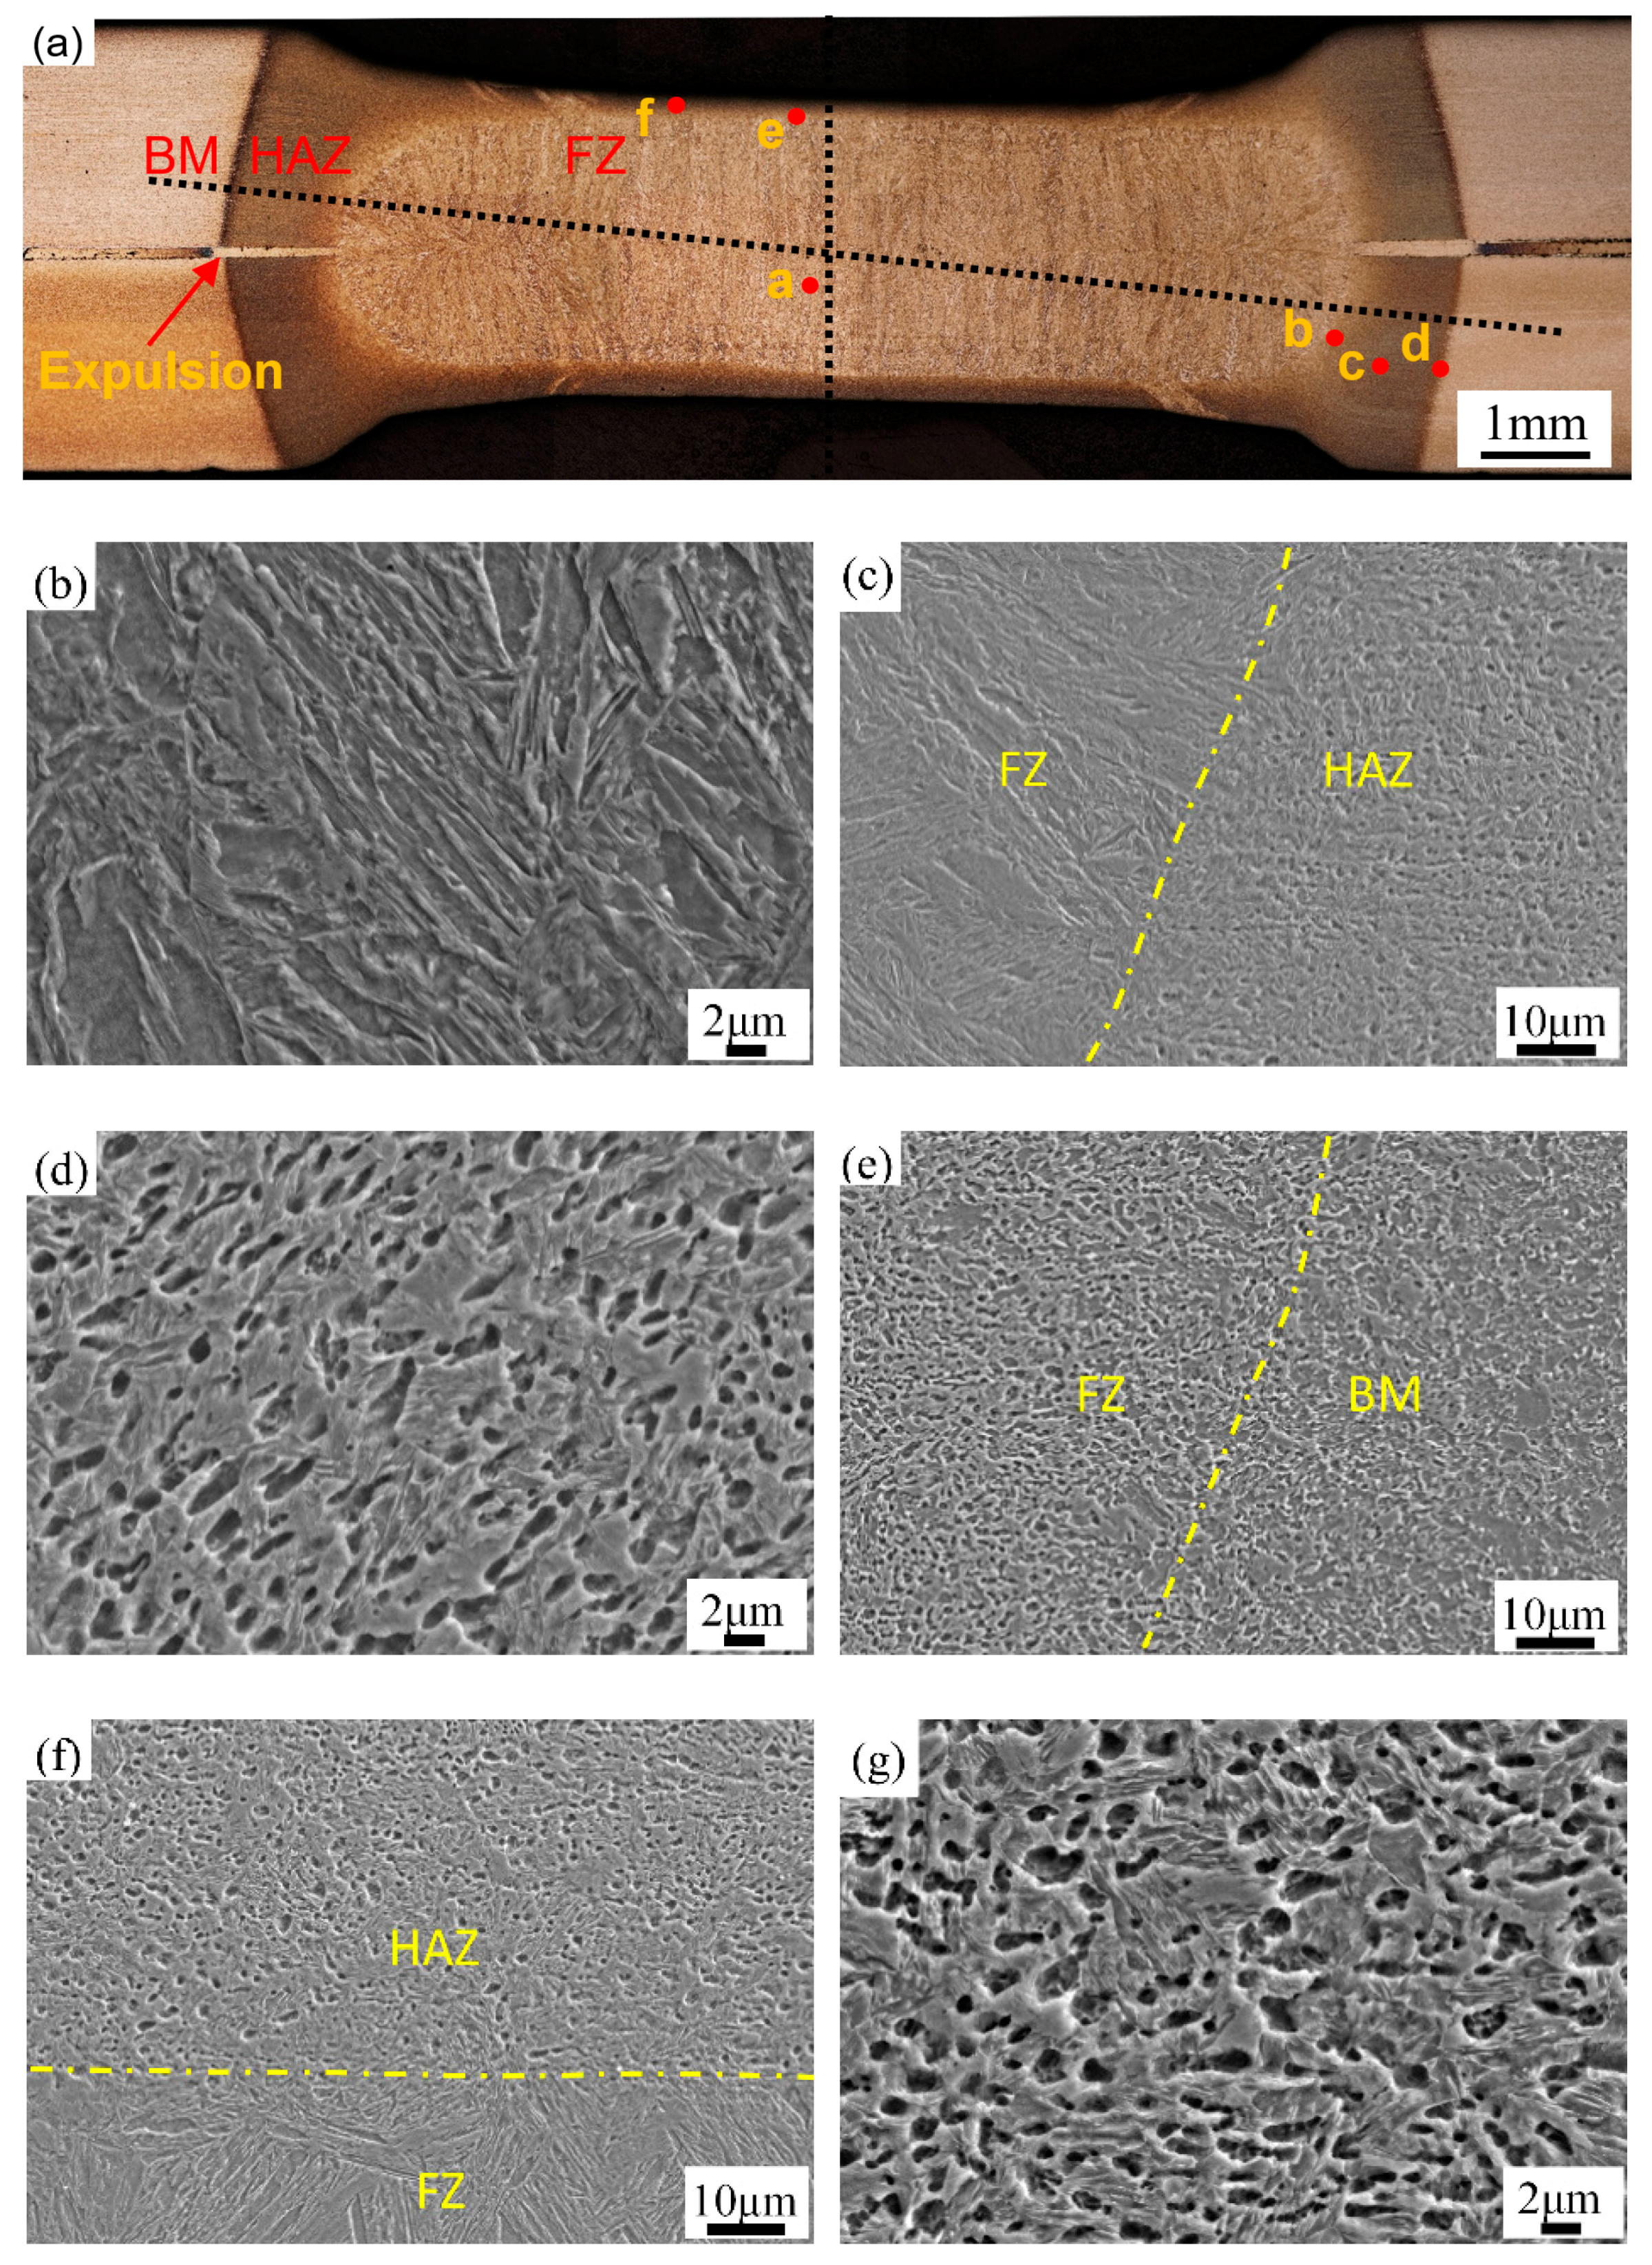
Optical microscopy of the typical symmetrical weld cross-section, as shown in Figure 5a, reveals the microstructure evolution of FZ and HAZ (heat-affected zone). An obvious indentation appeared and a part of the molten metal was lost due to liquid metal ejection. The FZ (point a in Figure 5a) exhibited columnar grains as shown in Figure 5b, which was mainly composed of lath martensite. It was reported that the cooling rate during RSW can reach roughly 3000 K/s for steel of 2.0 mm thickness [17]. The grain nucleated from the fusion boundary, and columnar grains in the FZ, were basically perpendicular to the fusion boundary as a result of temperature gradient, as shown in Figure 5a. Similar results were reported by Yuan et al. [18]. Figure 5c presents the fusion line clearly between the FZ and HAZ on the right side of the weld cross-section, corresponding to point b in Figure 5a. The microstructure changes observed in the HAZ was unobvious and cannot be divided into different regions as the peak temperature varied across the HAZ. As exhibited in Figure 5d, the HAZ (point c) had a microstructure of ferrite/martensite matrix with metastable austenite. The HAZ could not fully achieve austensite compared to TWIP steel, as the Mn content in this kind of steel was reduced to about 5 wt % for economic purposes. As can be seen in Figure 5e, there was an obvious boundary between the HAZ and BM (point d). No tempered martensite was found in the HAZ near the BM, which was frequently referred to in other kind of AHSSs, such as dual-phase steel and martensitic steel [19,20].
On the top and bottom of the FZ, there was obvious fusion boundary. For example, Figure 5f presents the detailed microstructure of point e. Similar to the microstructure of point c, ferrite/martensite combined with metastable austenite was observed in the HAZ above the fusion line (point f), as can be found in Figure 5g.
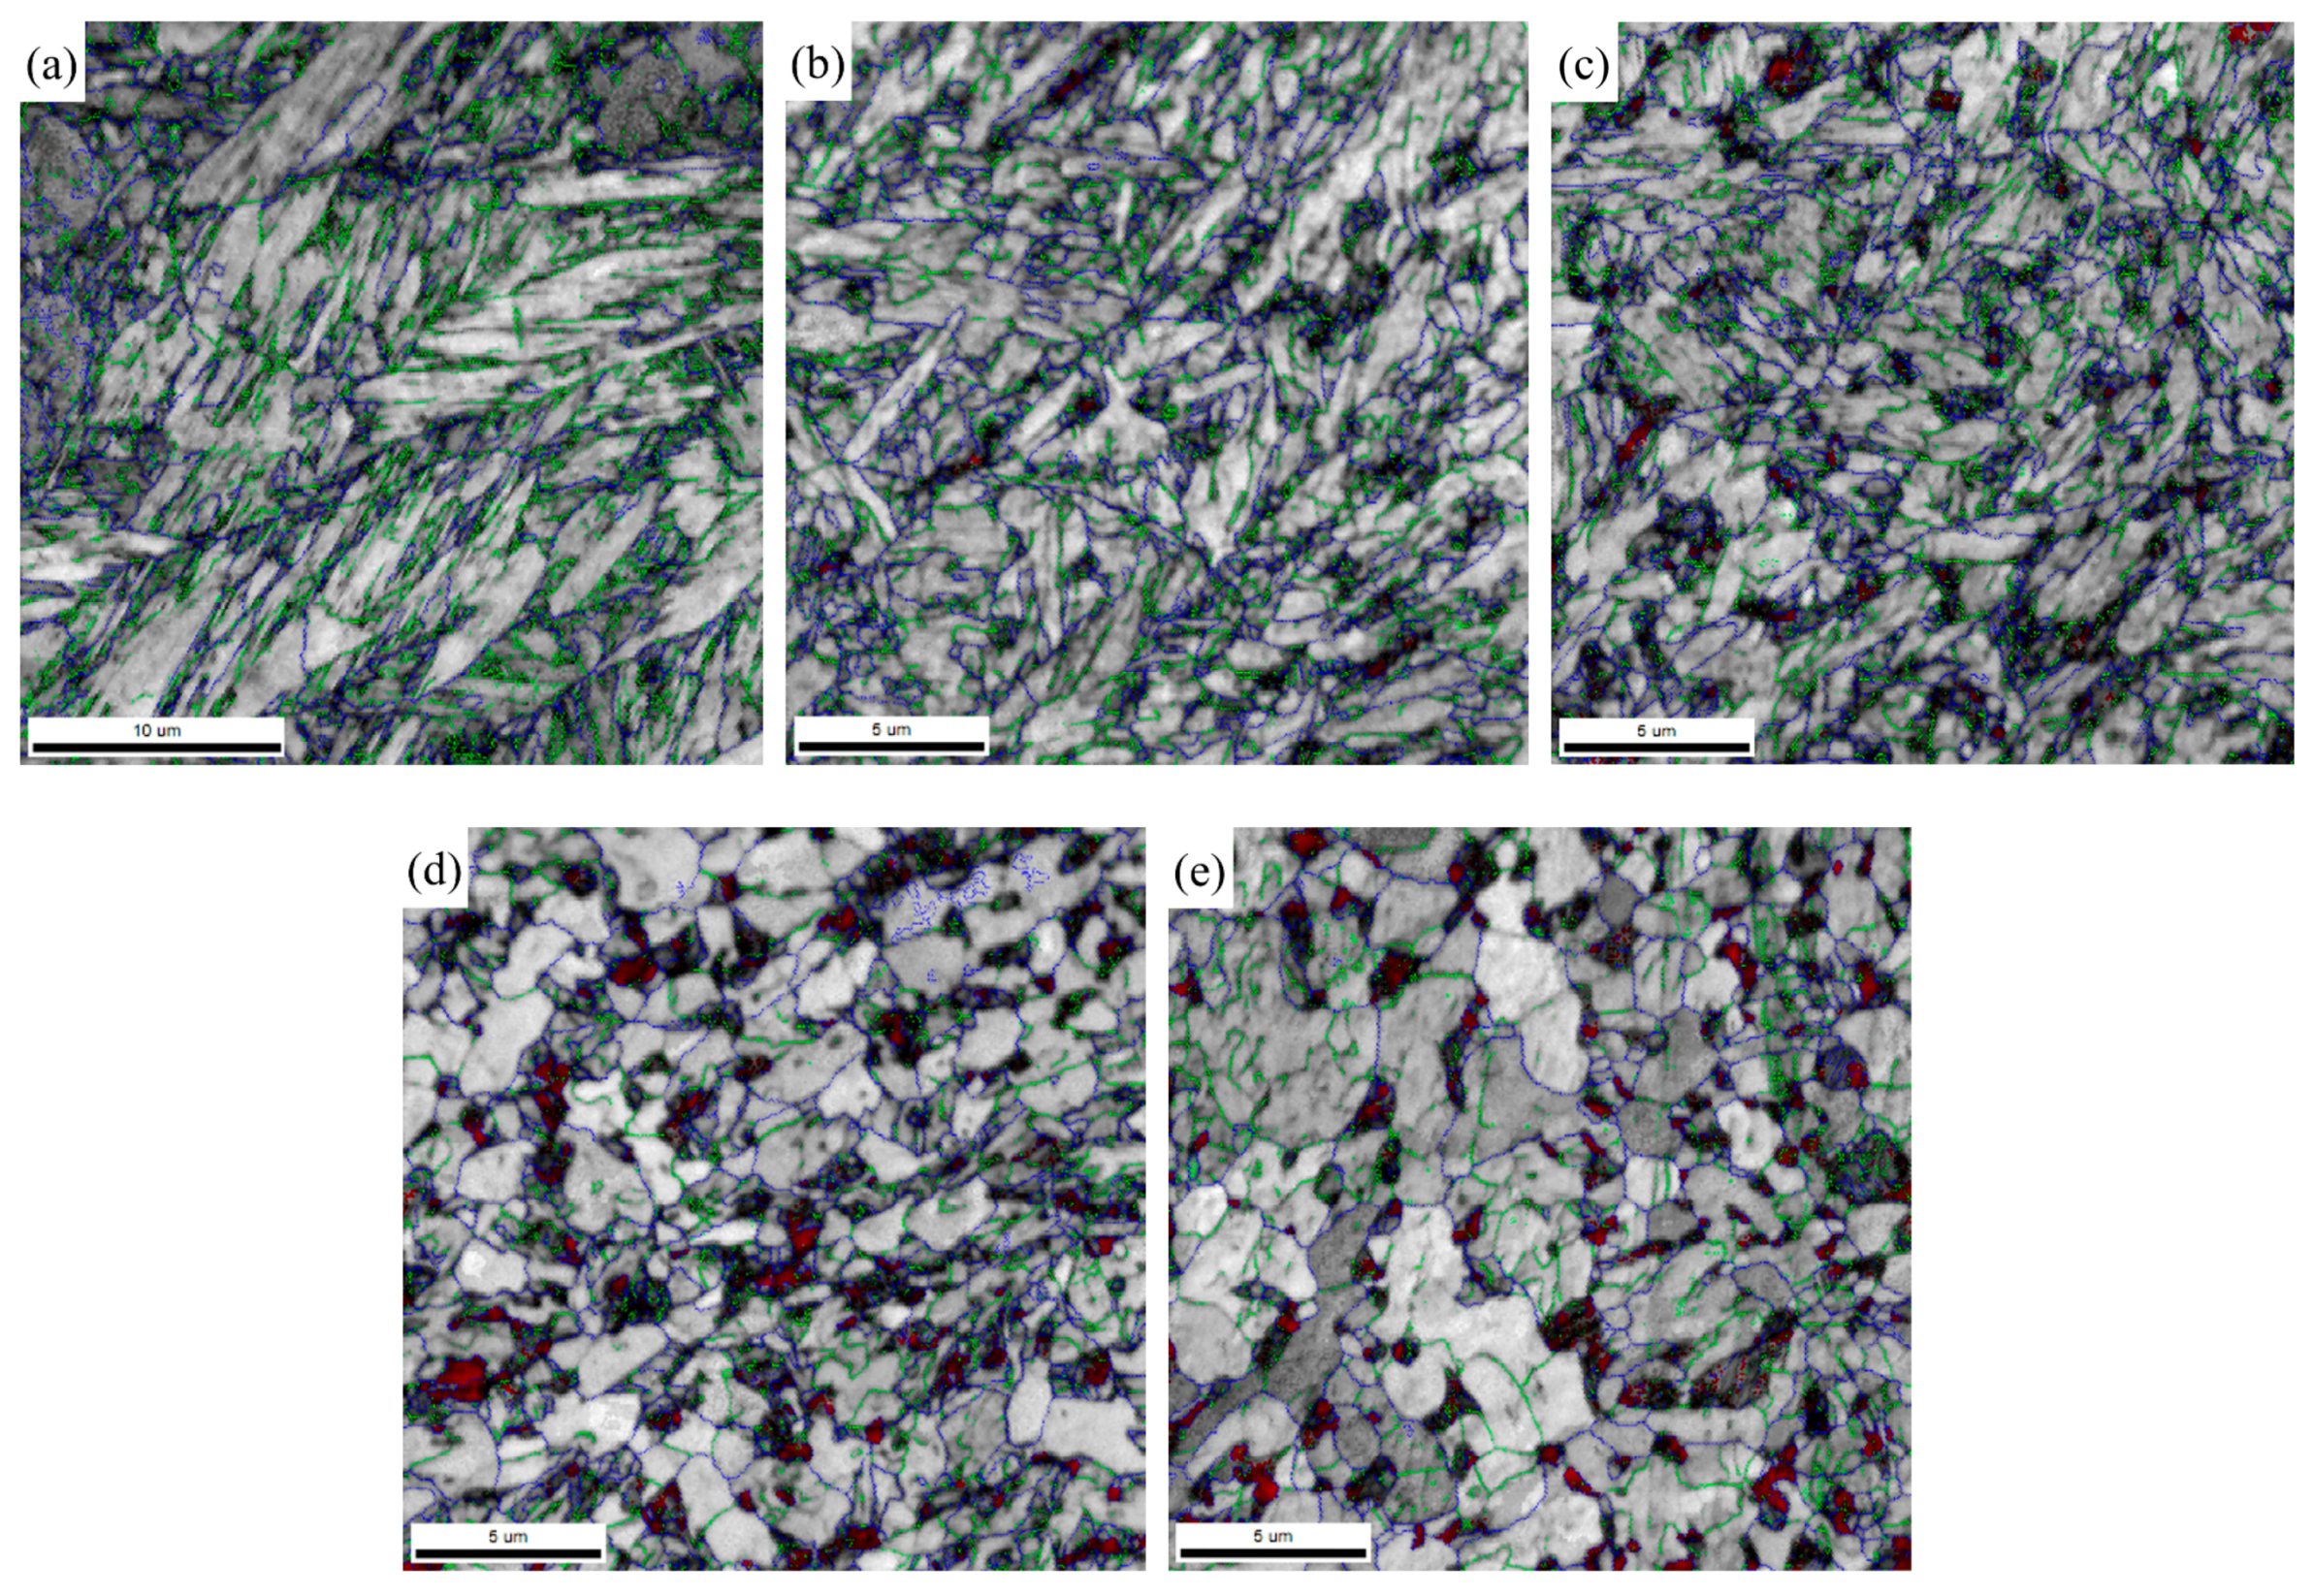
The strength and ductility product of the 0.1C5Mn steel can reach 32 GPa %, where the retained austenite plays an important role attributing to the TRIP effect. XRD results in Figure 6 indicate that the BM possessed about 6.15% (volume fraction) of retained austenite, while no metastable austenite was detected in the FZ. For the HAZ, about 5.12% of retained austenite was found. However, it is difficult to determine the exact phase volume fraction of local regions, e.g., the local HAZ, using the XRD method. The distribution of retained austenite detected by EBSD across the weld is presented in Figure 7. The results show that the BM contained approximately 5.90% retained austenite, as the step size of EBSD may be higher than that of some ultra-fine grain of retained austenite. There was about 0.1% retained austenite in the FZ (Figure 7a), which was too low to determine by XRD. Near the FZ in point b of Figure 5, approximately 0.5% retained austenite was detected among these fine grained martensite, as shown in Figure 7b, where it experienced a peak temperature higher than Ac3. The middle HAZ, i.e., point c of Figure 5, which may go through a peak temperature between the inter-critical temperature range, finally presented 2.3% retained austenite (Figure 7c). The transitional zone between the BM and HAZ underwent a peak temperature lower than Ac1. For instance, in point d, the volume fraction of retained austenite (5.8%) stayed nearly unchanged compared with the BM (Figure 7d,e).
3.3. Microhardness Distribution
Microhardness distribution was measured across the joint in two directions, as the dotted line indicated in Figure 5a. Figure 8a shows the results in the longitudinal direction. As expected, the FZ with nearly full martensite achieved high-average microhardness (~414.9 HV) across the joint, which was almost twice as much as that of BM (~208.1 HV). Figure 8b illustrates the microhardness curve in thickness direction of the joint. It can be seen that the FZ near the top and bottom surface had obviously higher microhardness (~426.3 HV) than that in the middle region. This difference resulted from the different cooling rates, as the top and bottom surfaces of the joint were pressed by the electrode. It should be noted that the Cu-Cr alloyed electrode with good thermal conductivity was water-cooled during spot-welding, causing a higher cooling rate in the region near the electrodes.
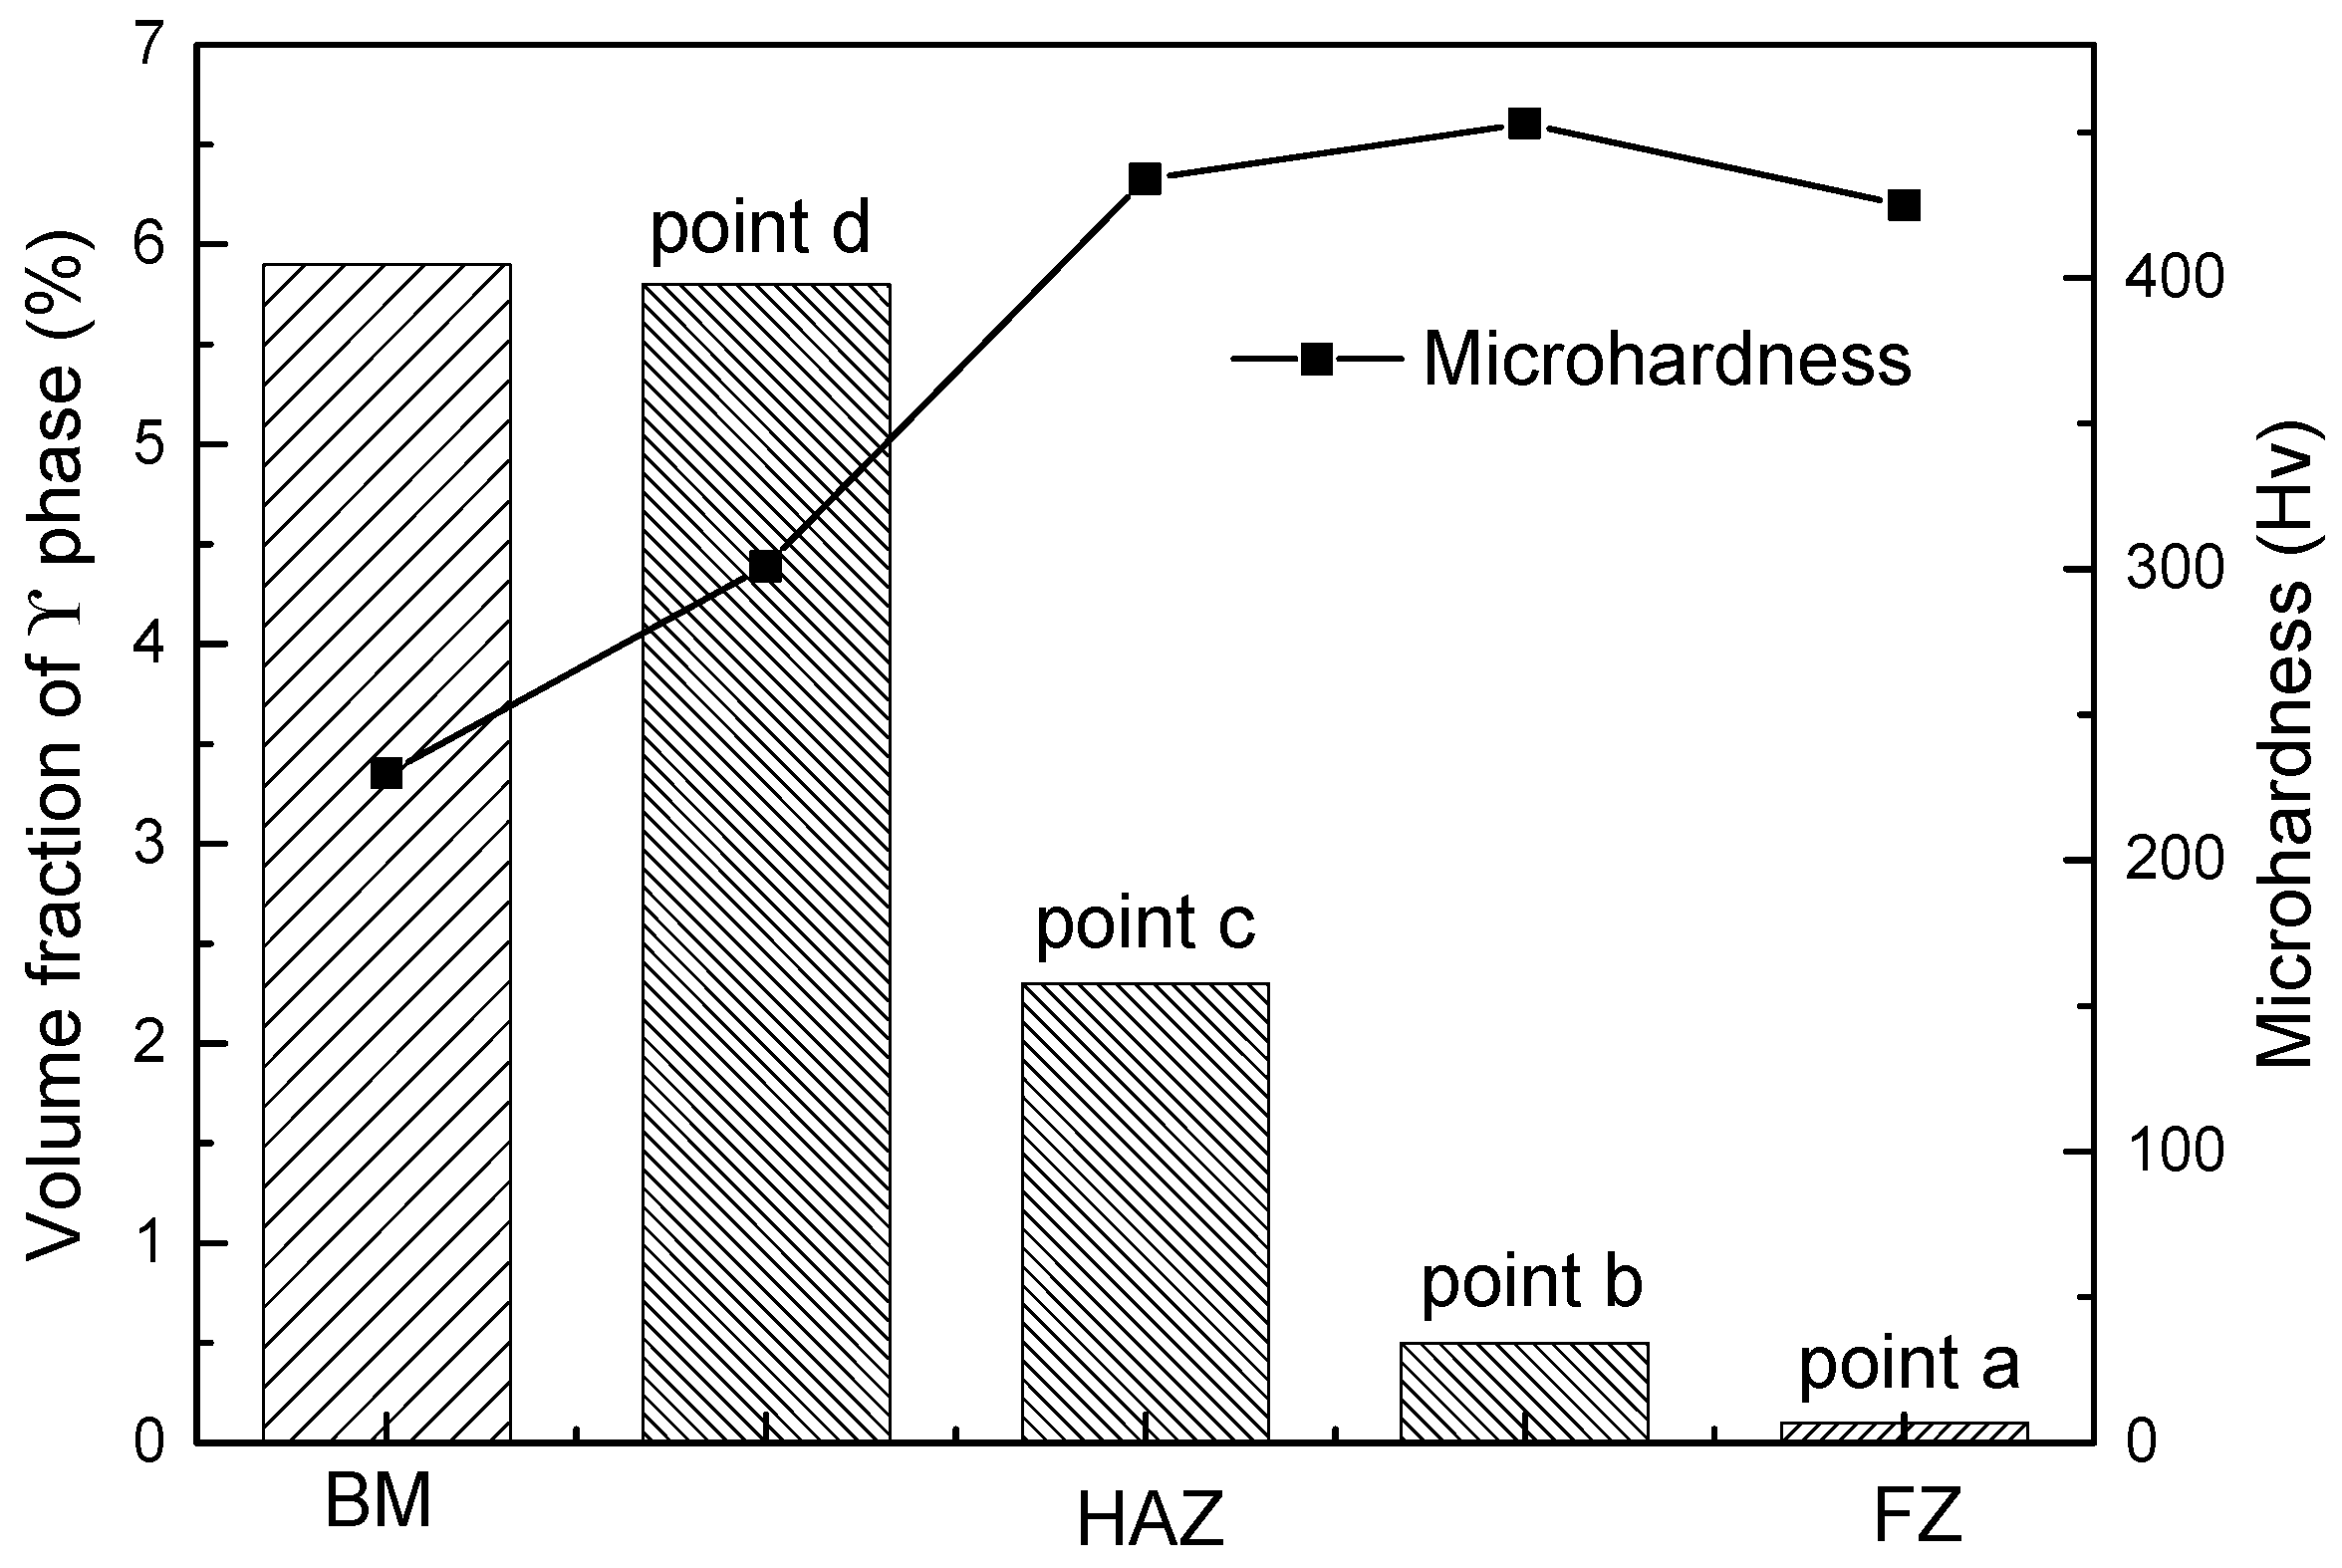
Typical microhardness across the joint as well as the corresponding volume fraction of retained austenite are demonstrated in Figure 9, and the points a–d are marked in Figure 5a. It can be found that the microhardness in HAZ rose as the distance increased from the BM. The HAZ near the FZ exhibited even higher microhardness than that of the FZ. This resulted from the finer grain size of martensite in this region. In contrast with the microhardness, the volume fraction of retained austenite in HAZ and FZ decreased with increasing distance from the BM, as a result of austenitization during welding and the subsequent martensite transformation from austenite contributing to higher microhardness.
3.4. Failure Mode and Fracture Mechanism
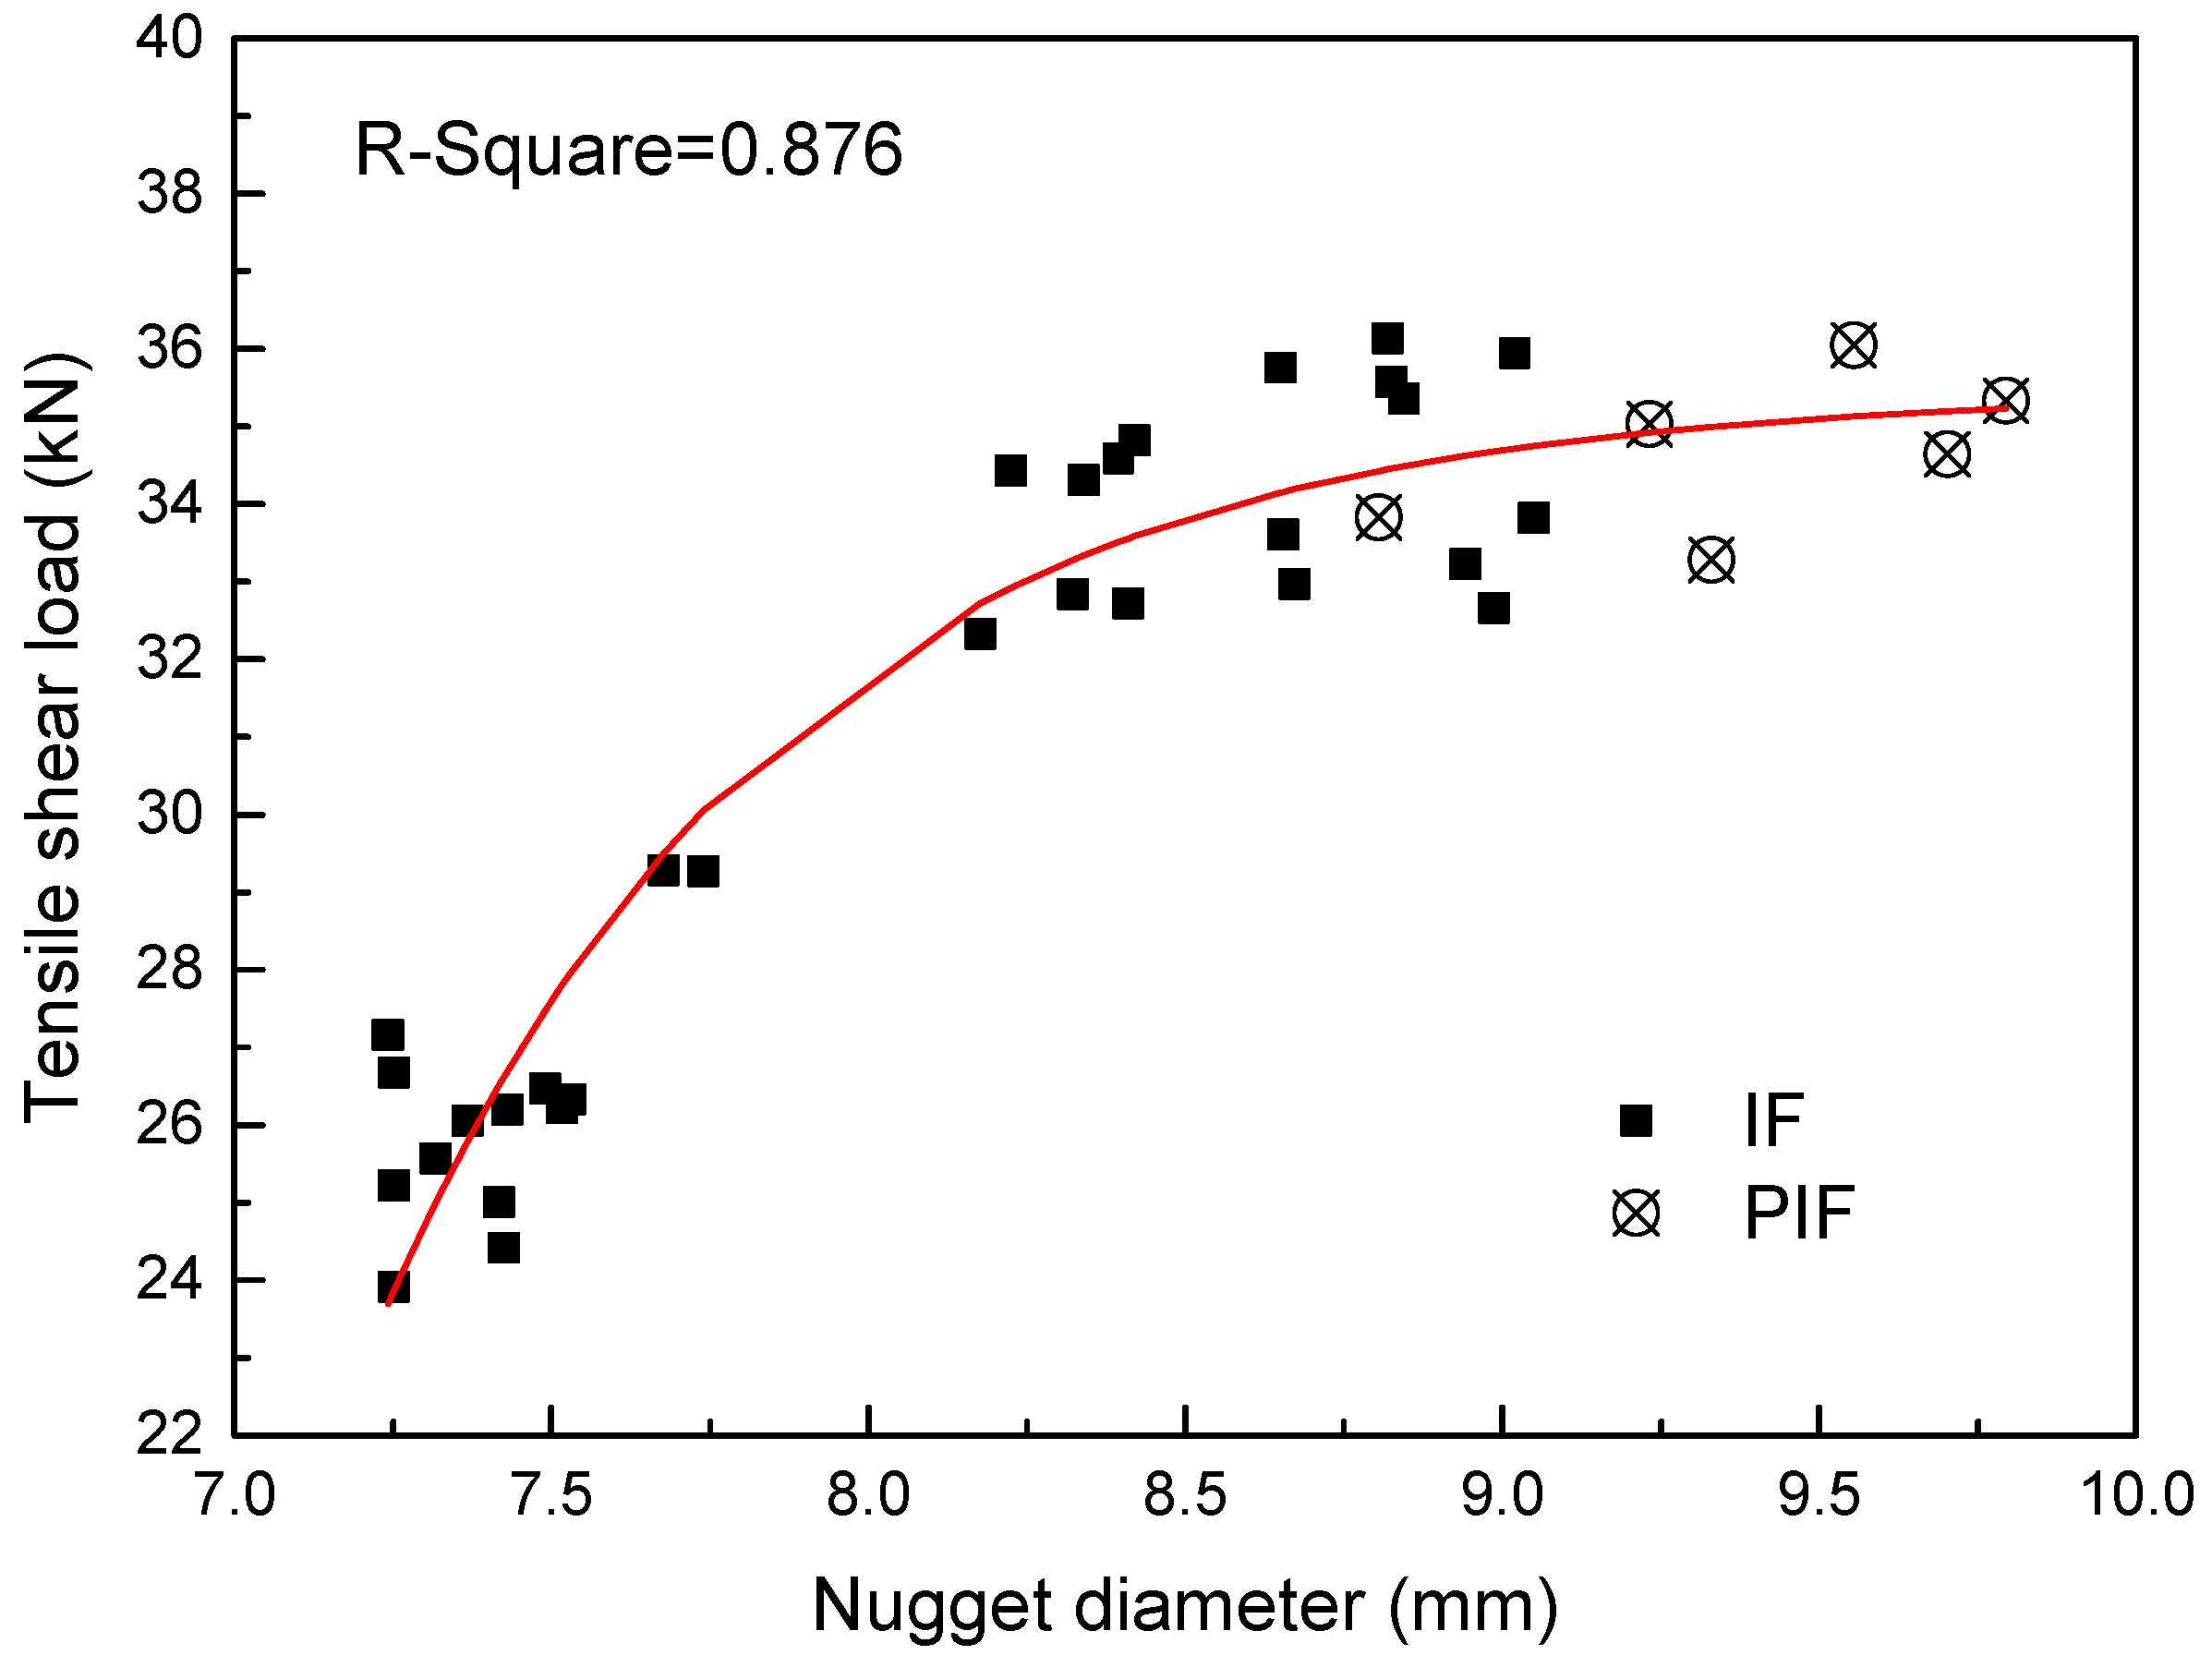
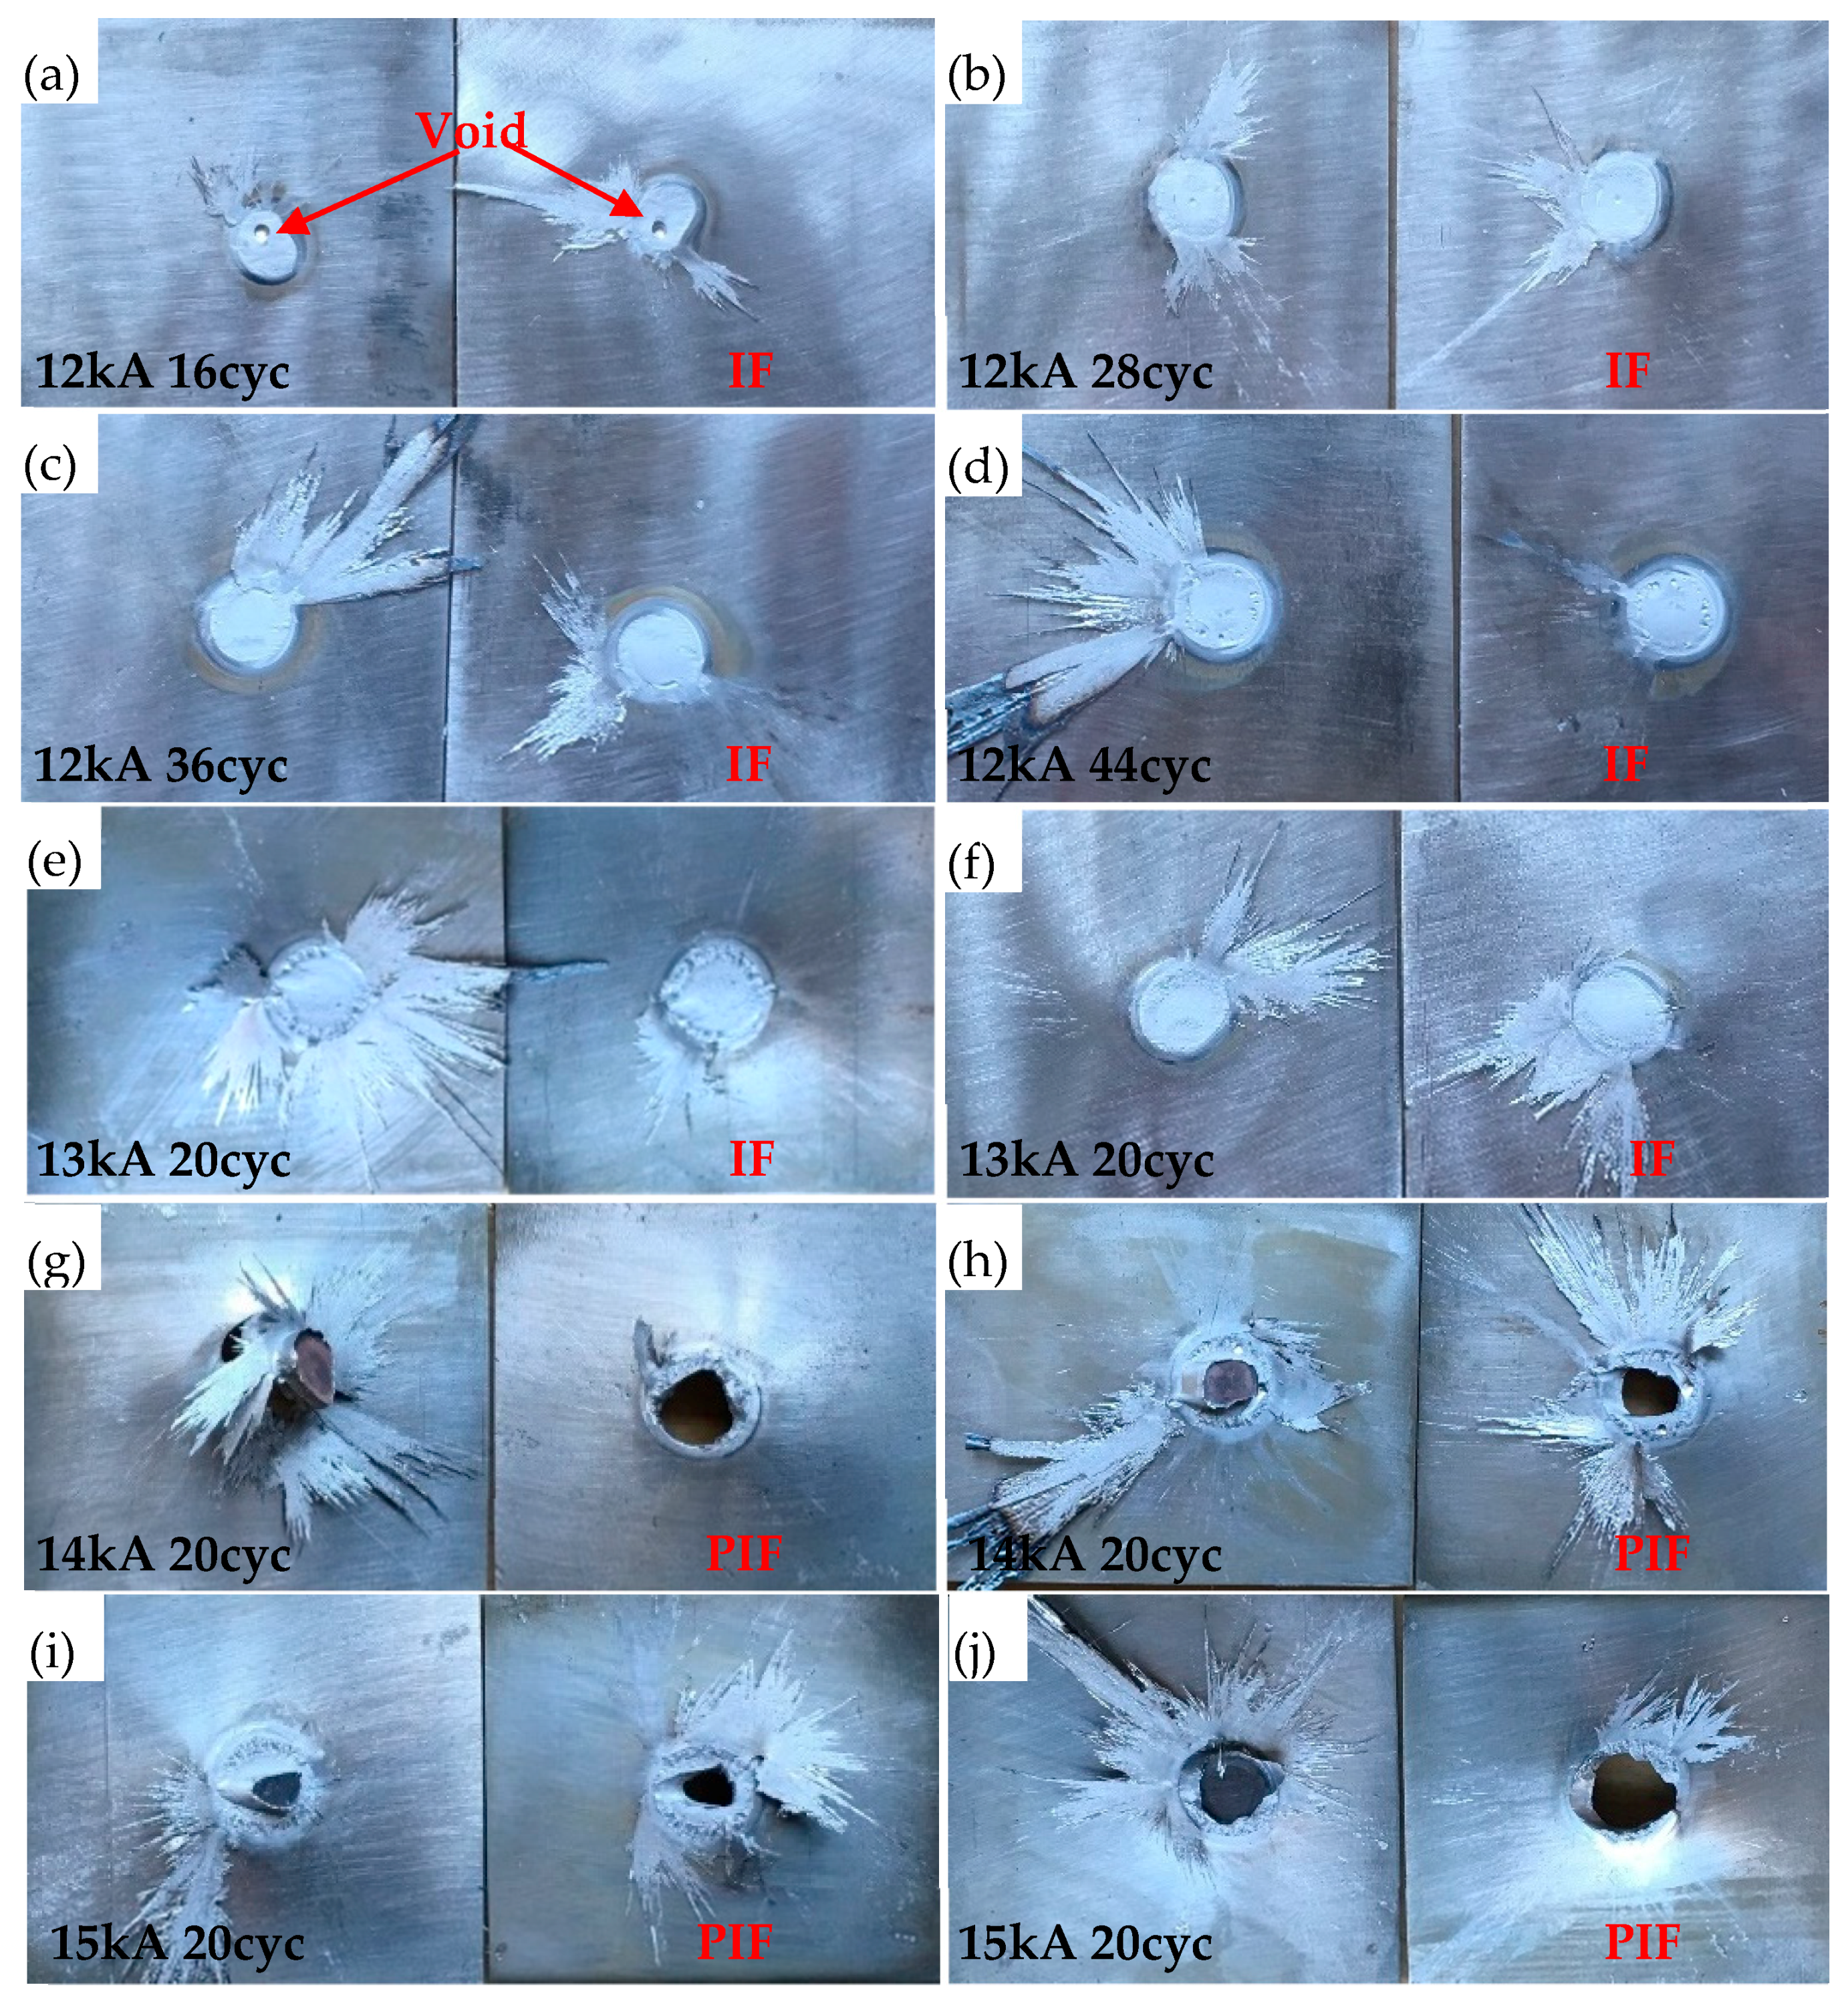
It was reported that the RSW joint usually fractured in three kinds of modes during tensile-shear tests, i.e., interfacial failure (IF), partial interfacial failure (PIF) and pull-out failure (PF) [21]. In terms of tensile-shear behavior of the joint, the influence of nugget size is remarkable, and the transition of failure mode is usually related to the increase of nugget size [22]. Figure 10 presents the effect of nugget diameter on the failure mode after tensile-shear test. It can be found that most of the samples failed in the IF mode, and the peak tensile-shear load increased with the rose of nugget diameter. However, it changed to PIF mode when the nugget diameter was higher than 9.1 mm, while the peak tensile-shear load reached relatively stable value. As a result, the failure mode and tensile-shear strength of the RSW joint can be estimated by measuring the nugget size [21]. A minimum nugget size is usually required to ensure the weld quality and reliability during production, and the weldable welding current and time could be chosen to meet the design criteria. Conventionally, 4 (h: sheet thickness) is required as the minimum nugget diameter for acceptable RSW joint. However, all the spot-welds failed in the mode of IF or PIF, and fully PF mode was absent in the present study, which can be found in Figure 11. To obtain the PIF mode in this study, the critical value of nugget diameter is recommended to be 6.5. Several studies have shown that RSW of AHSS presents a higher tendency of IF mode compared to conventional low-carbon steels [23]. For instance, Zeytin et al. [21] found a larger nugget diameter than the recommended value 4 was needed to obtain the PF mode in terms of 1.0 mm thickness TWIP steel. Russo Spena et al. [24] reported that spot-welded 1.5 mm thickness TWIP steel joint failed in IF or PIF mode, while Saha et al. [25] found that the 1.4 mm thickness TWIP steel joint always failed in IF mode.
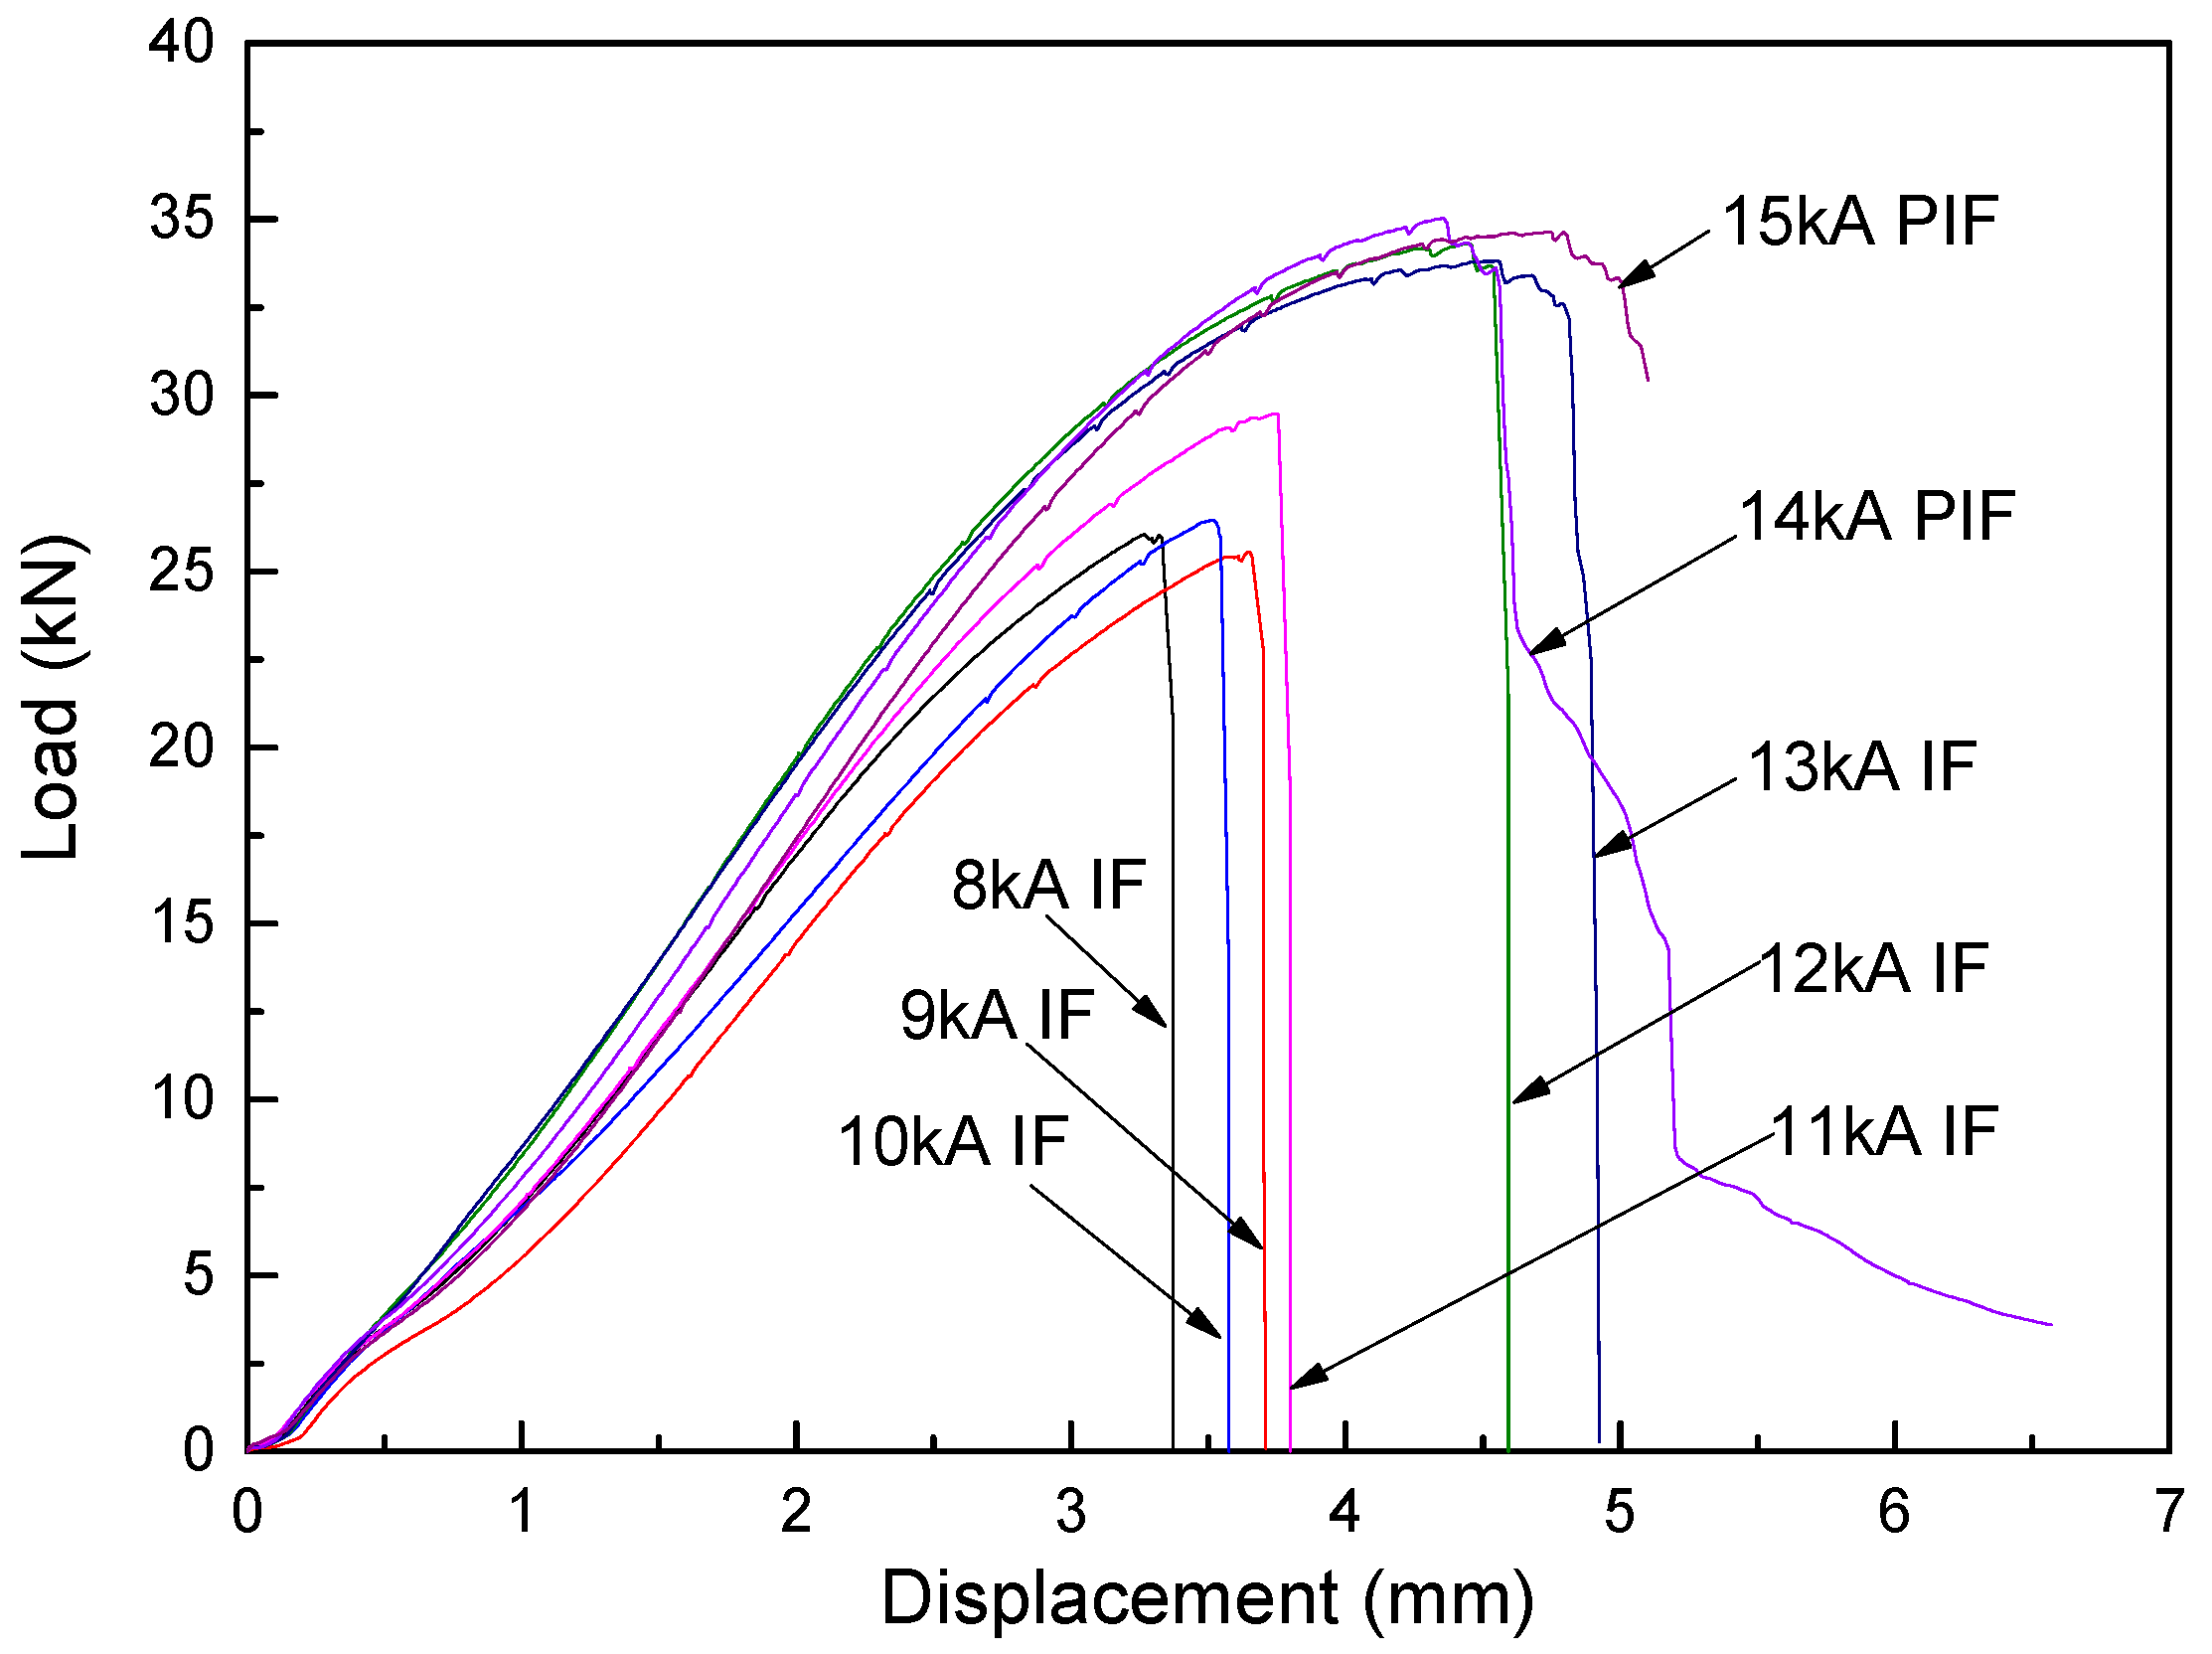
Typical load-displacement curves of RSW joints under various welding current with constant welding time (20 cyc) are illustrated in Figure 12. For the joint that failed in the IF mode, there was a sharp decrease of tensile force once peak load was reached. This phenomenon was particularly obvious when the heat input was lower, i.e., the nugget size was too small to absorb further failure energy, which was not acceptable in practical use. Transition of failure mode from the IF to PIF depends on the weld nugget size and properties of BM. The joint fractured in the PIF mode when the heat input was sufficient due to the enlargement of nugget size. The slowly decreased load after reaching the peak load indicated that more plastic deformation occurred, thus more failure energy can be absorbed.
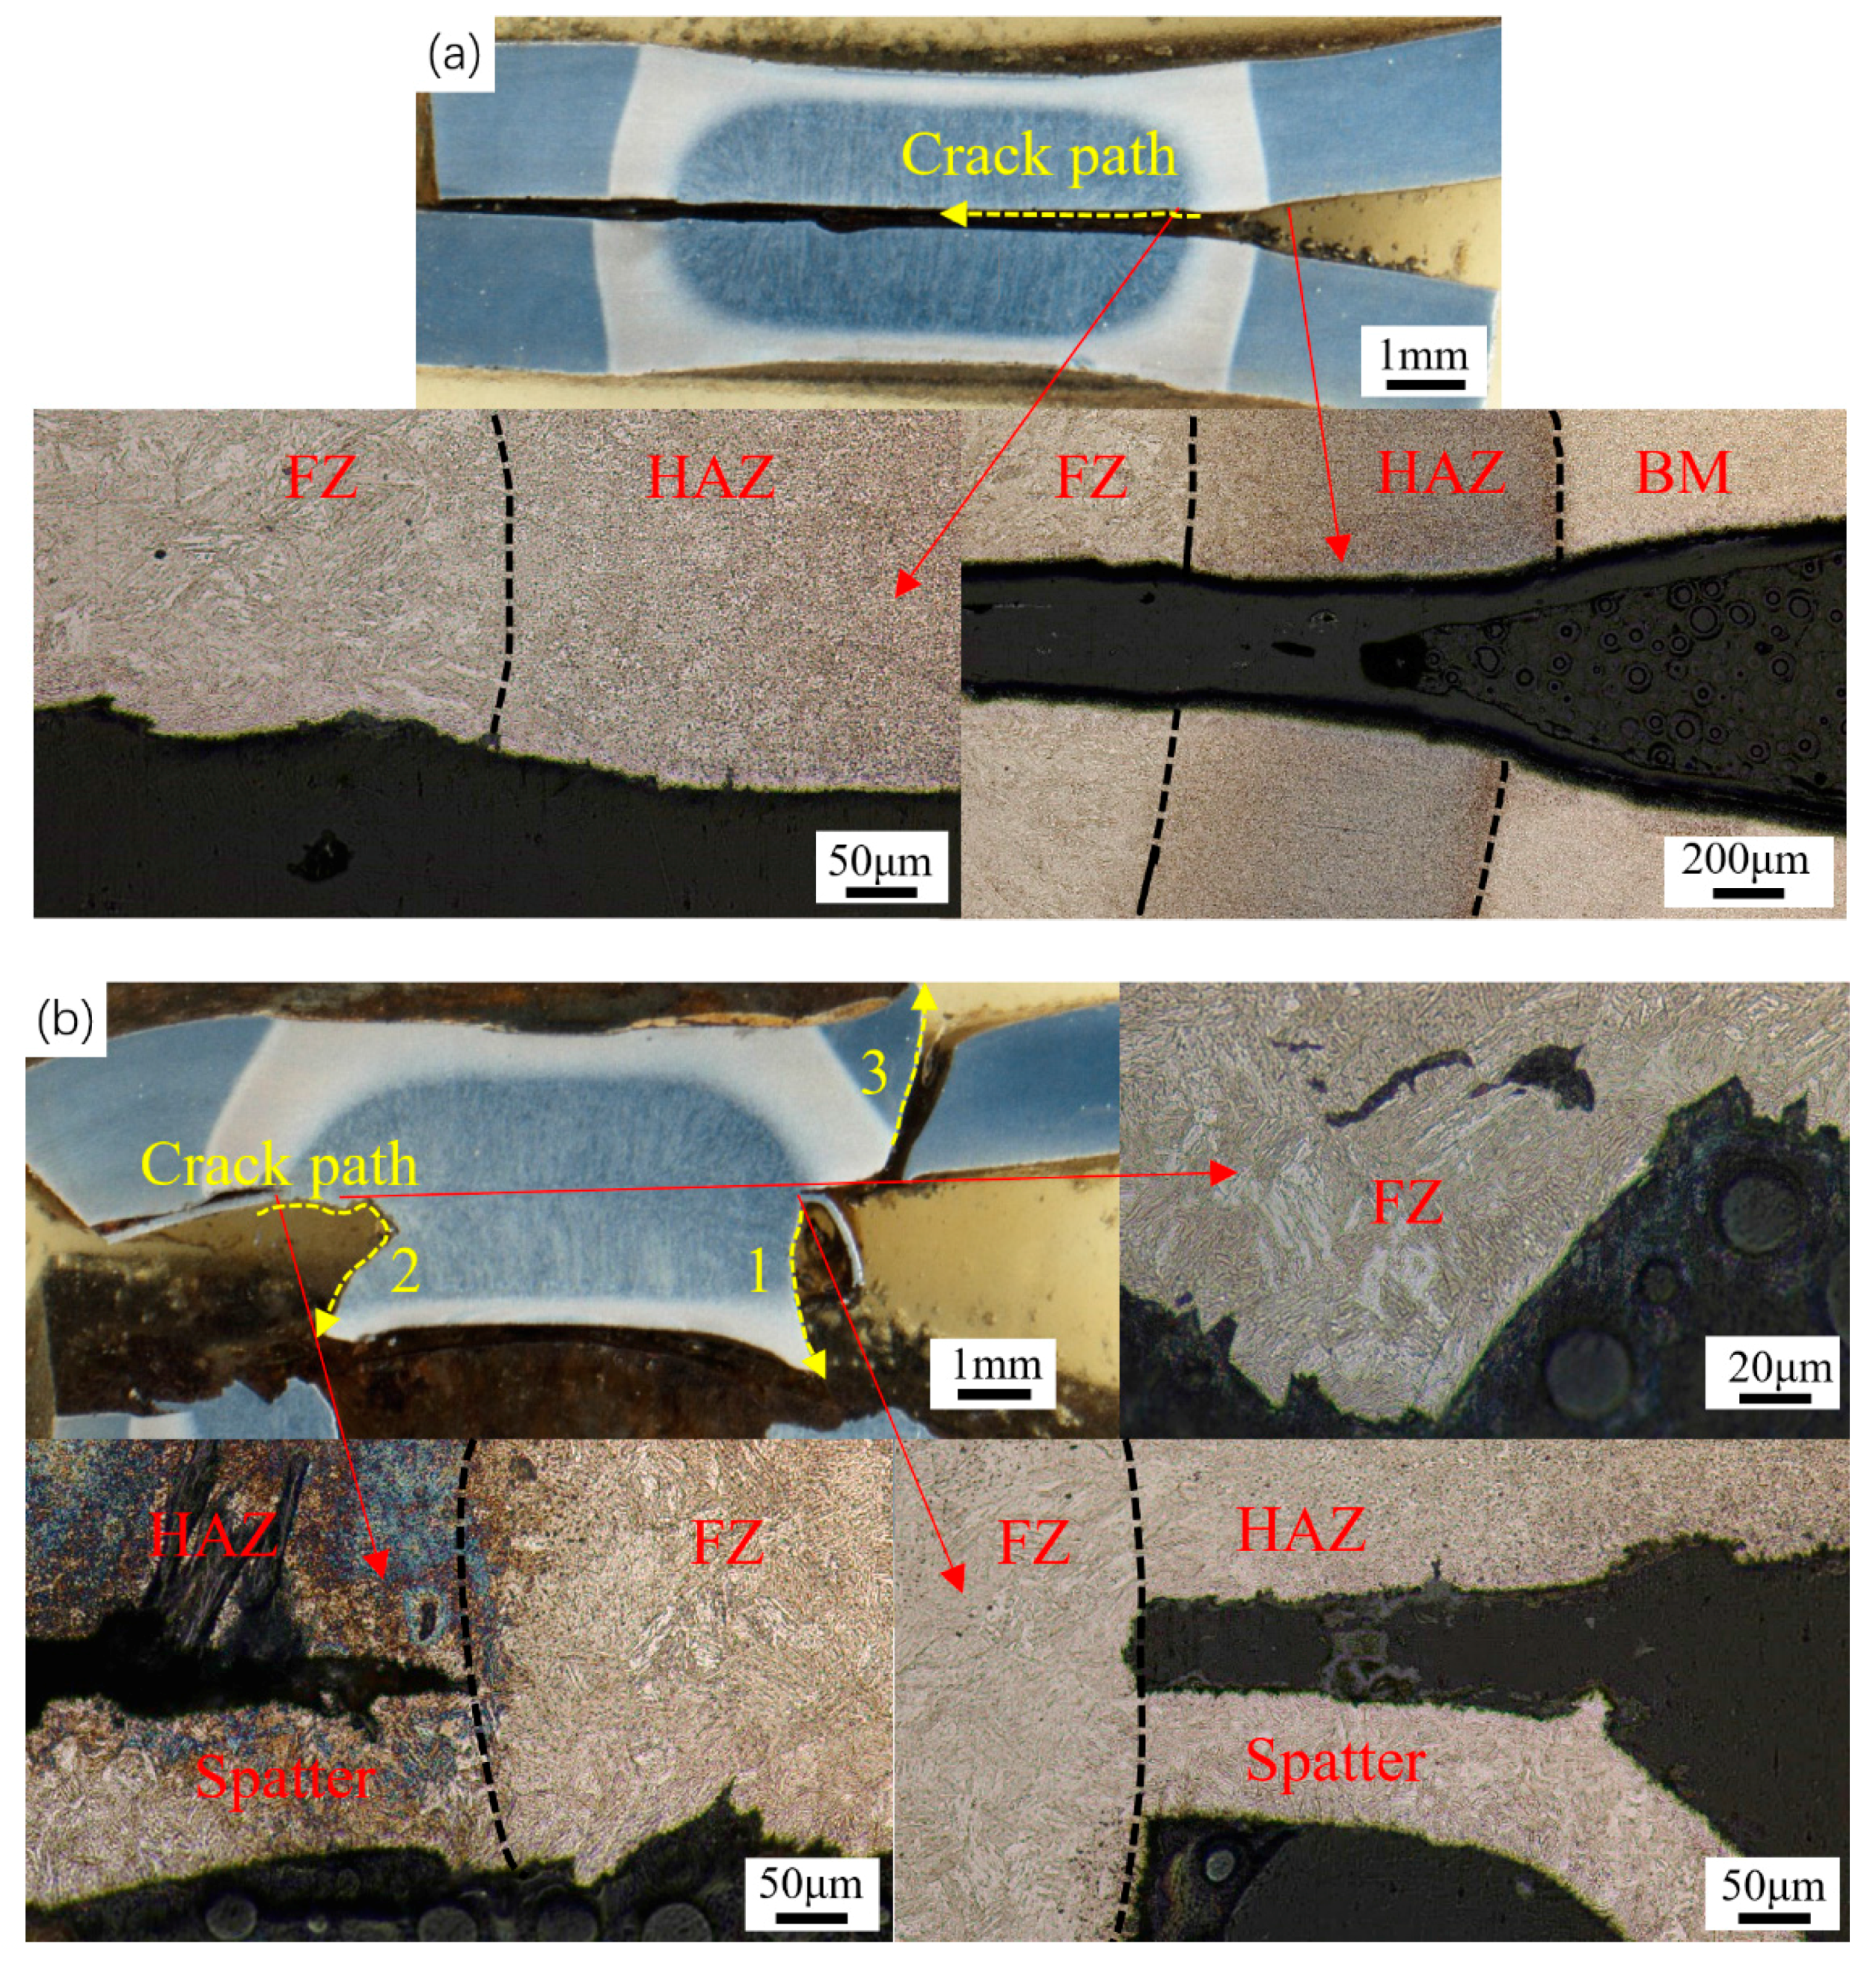
Typical weld cross-section after tensile-shear test with IF and PIF failure modes are presented in Figure 13. For the IF mode, the crack propagated in the middle of FZ, resulting in the separation of the welded sheets (Figure 13a). The sheet interface of the nugget was not able to withstand appreciable plastic deformation. In this case, the fracture path, shown with a dotted yellow line, was almost a straight line, which was parallel to the loading direction. This corresponds to the planar fracture surface of the joint that failed in IF mode, as exhibited in Figure 11a–f. In terms of PIF mode in Figure 13b, the crack path 1 initiated from the sheet interface and then propagated along the weld nugget circumference. However, the crack path 2 propagated along the centerline of nugget and then redirected toward the sheet surface. Finally, the weld nugget was partially pulled out from one of the steel sheets. From the magnification of crack 2, it can be found that the crack paths exhibited zigzag patterns with micro-cracks, indicating ductile characteristics with higher bearing capacity. It should be noted that between the BM and HAZ, there was another crack path (No. 3) initiated and propagated within the BM during the growth of crack 1 and 2. It is stated that the maximum tensile-shear strength can be obtained when the weld nugget fractured from the BM [21]. Thus, the joint that welded at 14 kA, 20 cyc and failed in PIF mode reached higher tensile-shear strength in this study. Russo Spena et al. [24] concluded that the high stress concentration around the weld nugget led to the PIF mode. In general, the transition of failure mode from IF to PF mainly depends on the nugget size and the strength of the BM and HAZ for expulsion-free spot-welds. When serious expulsion occurs under excessive heat input, however, the failure mode usually changes to the PIF mode. For instance, as shown in Figure 11g–j, there was obvious metal expulsion for these joints that failed in PIF mode. Serious expulsion brought about higher electrode indentation, causing higher stress concentration around the edge of the weld nugget, and the border of the nugget easily became the crack nucleation zone. Pouranvari et al. [26] pointed out that while the expulsion does not have a significant effect on the peak load of the spot-weld, it does reduce the energy absorption capability.
4. Conclusions
The following conclusions can be drawn from the present study:
- (1)
- The nugget size increased linearly with the welding current from 10 to 15 kA (20 cyc, 4 kN); the tensile-shear load increased as well with the current but became unstable when the current exceeded 12 kA due to metal expulsion. The nugget size and tensile-shear load increased linearly but slowly with the welding time from 20 to 44 cyc (12 kA, 4 kN).
- (2)
- The fusion zone was mainly composed of lath martensite, while the heat-affected zone (HAZ) had a microstructure of ferrite/martensite matrix with metastable austenite. The volume fraction of retained austenite in HAZ and fusion zone decreased with the increasing distance from the base metal, while the microhardness presented a reverse varying trend.
- (3)
- Two different failure modes were observed. Interfacial failure (IF) mode occurred in the middle of the fusion zone with lower loading capacity. Transition of failure mode from IF to PIF (partial IF) depended on the weld nugget size. PIF mode resulted from the high stress concentration around the weld nugget, caused by higher electrode indentation due to serious expulsion.
Acknowledgments
This work was supported by the International Science and Technology Cooperation Program of China (No. 2015DFA51460) and National Natural Science Foundation of China (No. 51520105007).
Author Contributions
Qiang Jia and Lei Liu conceived and designed the experiments; Qiang Jia and Wei Guo performed the experiments; Yun Peng and Guisheng Zou analyzed the data; Zhiling Tian and Y. Norman Zhou guided the writing of the article.
Conflicts of Interest
The authors declare no conflict of interest.
References
- Aydin, H.; Essadiqi, E.; Jung, I.; Yue, S. Development of 3rd generation AHSS with medium Mn content alloying compositions. Mater. Sci. Eng. A 2013, 564, 501–508. [Google Scholar] [CrossRef]
- Lee, Y.K.; Han, J. Current opinion in medium manganese steel. Mater. Sci. Technol. 2015, 31, 843–856. [Google Scholar] [CrossRef]
- Bhattacharya, D. Microalloyed steels for the automotive industry. Tecnol. Metal. Mater. Miner. 2014, 11, 371–383. [Google Scholar] [CrossRef]
- Miller, R.L. Ultrafine-grained microstructures and mechanical properties of alloy steels. Metall. Trans. 1972, 3, 905–912. [Google Scholar] [CrossRef]
- Cao, W.Q.; Wang, C.; Shi, J.; Wang, M.Q.; Hui, W.J.; Dong, H. Microstructure and mechanical properties of Fe–0.2C–5Mn steel processed by ART-annealing. Mater. Sci. Eng. A 2011, 528, 6661–6666. [Google Scholar] [CrossRef]
- He, B.B.; Huang, M.X.; Liang, Z.Y.; Ngan, A.H.W.; Luo, H.W.; Shi, J.; Cao, W.Q.; Dong, H. Nanoindentation investigation on the mechanical stability of individual austenite grains in a medium-Mn transformation-induced plasticity steel. Scr. Mater. 2013, 69, 215–218. [Google Scholar] [CrossRef]
- Sun, B.; Aydin, H.; Fazeli, F.; Yue, S. Microstructure evolution of a medium manganese steel during thermomechanical processing. Metall. Mater. Trans. A 2016, 47, 1782–1791. [Google Scholar] [CrossRef]
- Han, J.; Da Silva, A.K.; Ponge, D.; Raabe, D.; Lee, S.M.; Lee, Y.K.; Lee, S.I.; Hwang, B. The effects of prior austenite grain boundaries and microstructural morphology on the impact toughness of intercritically annealed medium Mn steel. Acta Mater. 2017, 122, 199–206. [Google Scholar] [CrossRef]
- Nakada, N.; Mizutani, K.; Tsuchiyama, T.; Takaki, S. Difference in transformation behavior between ferrite and austenite formations in medium manganese steel. Acta Mater. 2014, 65, 251–258. [Google Scholar] [CrossRef]
- Cai, Z.H.; Ding, H.; Misra, R.D.K.; Ying, Z.Y. Austenite stability and deformation behavior in a cold-rolled transformation-induced plasticity steel with medium manganese content. Acta Mater. 2015, 84, 229–236. [Google Scholar] [CrossRef]
- Lun, N.; Saha, D.C.; Macwan, A.; Pan, H.; Wang, L.; Goodwin, F.; Zhou, Y. Microstructure and mechanical properties of fibre laser welded medium manganese TRIP steel. Mater. Des. 2017, 131, 450–459. [Google Scholar] [CrossRef]
- Chabok, A.; van der Aa, E.; De Hosson, J.T.M.; Pei, Y.T. Mechanical behavior and failure mechanism of resistance spot welded DP1000 dual phase steel. Mater. Des. 2017, 124, 171–182. [Google Scholar]
- Chung, K.; Noh, W.; Yang, X.; Han, H.N.; Lee, M. Practical failure analysis of resistance spot welded advanced high-strength steel sheets. Int. J. Plast. 2017, 94, 122–147. [Google Scholar] [CrossRef]
- Raoelison, R.N.; Fuentes, A.; Pouvreau, C.; Rogeon, P.; Carré, P.; Dechalotte, F. Modeling and numerical simulation of the resistance spot welding of zinc coated steel sheets using rounded tip electrode: Analysis of required conditions. Appl. Math. Model. 2014, 38, 2505–2521. [Google Scholar] [CrossRef]
- Saha, D.C.; Chang, I.; Park, Y. Heat-affected zone liquation crack on resistance spot welded TWIP steels. Mater. Charact. 2014, 93, 40–51. [Google Scholar] [CrossRef]
- Dancette, S.; Fabrègue, D.; Massardier, V.; Merlin, J.; Dupuy, T.; Bouzekri, M. Experimental and modeling investigation of the failure resistance of advanced high strength steels spot welds. Eng. Fract. Mech. 2011, 78, 2259–2272. [Google Scholar] [CrossRef]
- Gould, J.E.; Khurana, S.P.; Li, T. Predictions of microstructures when welding automotive advanced high-strength steels—A combination of thermal and microstructural modeling can be used to estimate performance of welds in advanced high-strength steels. Weld. J. 2006, 85, 111S–116S. [Google Scholar]
- Yuan, X.; Li, C.; Chen, J.; Li, X.; Liang, X.; Pan, X. Resistance spot welding of dissimilar DP600 and DC54D steels. J. Mater. Process. Technol. 2017, 239, 31–41. [Google Scholar] [CrossRef]
- Jia, J.; Yang, S.; Ni, W.; Bai, J. Microstructure and mechanical properties of fiber laser welded joints of ultrahigh-strength steel 22MnB5 and dual-phase steels. J. Mater. Res. 2014, 29, 2565–2575. [Google Scholar] [CrossRef]
- Farabi, N.; Chen, D.L.; Zhou, Y. Microstructure and mechanical properties of laser welded dissimilar DP600/DP980 dual-phase steel joints. J. Alloys Compd. 2011, 509, 982–989. [Google Scholar] [CrossRef]
- Zeytin, H.K.; Emre, H.E.; Kacar, R. Properties of resistance spot-welded TWIP Steels. Metals 2017, 7, 14. [Google Scholar] [CrossRef]
- Pouranvari, M. Susceptibility to interfacial failure mode in similar and dissimilar resistance spot welds of DP600 dual phase steel and low carbon steel during cross-tension and tensile-shear loading conditions. Mater. Sci. Eng. A 2012, 546, 129–138. [Google Scholar] [CrossRef]
- Pouranvari, M.; Marashi, S.P.H. Critical review of automotive steels spot welding: Process, structure and properties. Sci. Technol. Weld. Join. 2013, 18, 361–403. [Google Scholar] [CrossRef]
- Russo Spena, P.; De Maddis, M.; Lombardi, F.; Rossini, M. Investigation on resistance spot welding of TWIP steel sheets. Steel Res. Int. 2016, 86, 1480–1489. [Google Scholar] [CrossRef]
- Saha, D.C.; Cho, Y.; Park, Y.D. Metallographic and fracture characteristics of resistance spot welded TWIP steels. Sci. Technol. Weld. Join. 2013, 18, 711–720. [Google Scholar] [CrossRef]
- Pouranvari, M.; Abedi, A.; Marashi, P.; Goodarzi, M. Effect of expulsion on peak load and energy absorption of low carbon steel resistance spot welds. Sci. Technol. Weld. Join. 2013, 13, 39–43. [Google Scholar] [CrossRef]
Figure 1.
Microstructure and tensile properties of BM (base metal): (a) Phase distribution with high angle boundaries obtained by EBSD (red: retained austenite; green: ferrite); (b) Engineering stress-strain curve.
Figure 1.
Microstructure and tensile properties of BM (base metal): (a) Phase distribution with high angle boundaries obtained by EBSD (red: retained austenite; green: ferrite); (b) Engineering stress-strain curve.

Figure 2.
(a) Welding processes (1 cyc = 0.02 s); (b) Dimensions of the spot-welded samples.

Figure 3.
Effect of welding current: (a) Nugget diameter vs. welding current; (b) Tensile-shear load vs. welding current; (c) Energy absorption vs. welding current.
Figure 3.
Effect of welding current: (a) Nugget diameter vs. welding current; (b) Tensile-shear load vs. welding current; (c) Energy absorption vs. welding current.

Figure 4.
Effect of welding time: (a) Nugget diameter vs. welding time; (b) Tensile-shear load vs. welding time; (c) Energy absorption vs. welding time.
Figure 4.
Effect of welding time: (a) Nugget diameter vs. welding time; (b) Tensile-shear load vs. welding time; (c) Energy absorption vs. welding time.

Figure 5.
Optical micrograph and SEM of the spot-weld cross-section: (a) Over view; (b) FZ (fusion zone); (c) Fusion boundary of the right side, point b; (d) HAZ (heat-affected zone) of the right side, point c; (e) Boundary between the HAZ and BM, point d; (f) Fusion boundary of the top side, point e; (g) HAZ of the top side, point f.

Figure 6.
XRD results of the BM, HAZ and FZ.

Figure 7.
Image quality combined with grain boundaries: (a) FZ; (b) HAZ, point b; (c) HAZ, point c; (d) HAZ, point d; (e) BM (the red phase represents retained austenite, green line represents boundary 2° < θ < 15°, and blue line represents θ > 15°).
Figure 7.
Image quality combined with grain boundaries: (a) FZ; (b) HAZ, point b; (c) HAZ, point c; (d) HAZ, point d; (e) BM (the red phase represents retained austenite, green line represents boundary 2° < θ < 15°, and blue line represents θ > 15°).

Figure 8.
Microhardness distribution of the spot-welded joint: (a) In longitudinal direction; (b) In thickness direction.
Figure 8.
Microhardness distribution of the spot-welded joint: (a) In longitudinal direction; (b) In thickness direction.

Figure 9.
Typical microhardness variation and corresponding volume fraction of retained austenite (γ phase).
Figure 9.
Typical microhardness variation and corresponding volume fraction of retained austenite (γ phase).

Figure 10.
Effect of nugget diameter on the tensile-shear load and failure mode.

Figure 11.
Failed tensile-shear samples under various welding parameters: (a) 12 kA, 16 cyc; (b) 12 kA, 28 cyc; (c) 12 kA, 36 cyc; (d) 12 kA, 44 cyc; (e) 13 kA, 20 cyc; (f) 13 kA, 20 cyc; (g) 14 kA, 20 cyc; (h) 14 kA, 20 cyc; (i) 15 kA, 20 cyc; (j) 15 kA, 20 cyc. IF: interfacial failure; PIF: partial interfacial failure.

Figure 12.
Representative load-displacement curves under various welding current with constant welding time of 20 cyc.
Figure 12.
Representative load-displacement curves under various welding current with constant welding time of 20 cyc.

Figure 13.
Weld cross-section with typical failure modes: (a) IF (10 kA, 20 cyc); (b) PIF (14 kA, 20 cyc).
Figure 13.
Weld cross-section with typical failure modes: (a) IF (10 kA, 20 cyc); (b) PIF (14 kA, 20 cyc).

© 2018 by the authors. Licensee MDPI, Basel, Switzerland. This article is an open access article distributed under the terms and conditions of the Creative Commons Attribution (CC BY) license (http://creativecommons.org/licenses/by/4.0/).
Share and Cite
MDPI and ACS Style
Jia, Q.; Liu, L.; Guo, W.; Peng, Y.; Zou, G.; Tian, Z.; Zhou, Y.N. Microstructure and Tensile-Shear Properties of Resistance Spot-Welded Medium Mn Steel. Metals 2018, 8, 48. https://doi.org/10.3390/met8010048
AMA Style
Jia Q, Liu L, Guo W, Peng Y, Zou G, Tian Z, Zhou YN. Microstructure and Tensile-Shear Properties of Resistance Spot-Welded Medium Mn Steel. Metals. 2018; 8(1):48. https://doi.org/10.3390/met8010048
Chicago/Turabian StyleJia, Qiang, Lei Liu, Wei Guo, Yun Peng, Guisheng Zou, Zhiling Tian, and Y. Norman Zhou. 2018. "Microstructure and Tensile-Shear Properties of Resistance Spot-Welded Medium Mn Steel" Metals 8, no. 1: 48. https://doi.org/10.3390/met8010048
Note that from the first issue of 2016, this journal uses article numbers instead of page numbers. See further details here.