Characterizing the Soldering Alloy Type In–Ag–Ti and the Study of Direct Soldering of SiC Ceramics and Copper

1
Faculty of Materials Science and Technology in Trnava, Slovak University of Technology in Bratislava, Jána Bottu č. 2781/25, 917 24 Trnava, Slovakia
2
FMMI—Faculty of Metallurgy and Material Engineering, 17. listopadu 15, Poruba, 708 33 Ostrava, Czech Republic
*
Author to whom correspondence should be addressed.
Metals 2018, 8(4), 274; https://doi.org/10.3390/met8040274
Submission received: 13 March 2018
/
Revised: 10 April 2018
/
Accepted: 11 April 2018
/
Published: 16 April 2018
(This article belongs to the Special Issue Science, Characterization and Technology of Joining and Welding)
Abstract
:The aim of the research was to characterize the soldering alloy In–Ag–Ti type, and to study the direct soldering of SiC ceramics and copper. The In10Ag4Ti solder has a broad melting interval, which mainly depends on its silver content. The liquid point of the solder is 256.5 °C. The solder microstructure is composed of a matrix with solid solution (In), in which the phases of titanium (Ti3In4) and silver (AgIn2) are mainly segregated. The tensile strength of the solder is approximately 13 MPa. The strength of the solder increased with the addition of Ag and Ti. The solder bonds with SiC ceramics, owing to the interaction between active In metal and silicon infiltrated in the ceramics. XRD analysis has proven the interaction of titanium with ceramic material during the formation of the new minority phases of titanium silicide—SiTi and titanium carbide—C5Ti8. In and Ag also affect bond formation with the copper substrate. Two new phases were also observed in the bond interphase—(CuAg)6In5 and (AgCu)In2. The average shear strength of a combined joint of SiC–Cu, fabricated with In10Ag4Ti solder, was 14.5 MPa. The In–Ag–Ti solder type studied possesses excellent solderability with several metallic and ceramic materials.
1. Introduction
The application of ultrasonic power to form joints between different materials is a frequently used method [1,2,3]. Ultrasonic power has numerous advantages regarding the formation of joints between different materials: The absence of flux, bond soundness, high speed joint formation, and the possibility to join metals with non-metals. These traits make the use of ultrasonic power greatly desired in the field of soldering as well as in the electronics industry. The suitability of this technology has been successfully documented by many scientific studies in the fields of brazing, soldering [1,2,3,4] and transient liquid phase (TLP) bonding [5,6,7,8,9].
Applications of In-based solders are mainly used to solder dissimilar materials in the electronics industry. One of the common applications of these alloys occurs when the service temperature is well below the freezing point. This mainly concerns in the fields of space and inter-planetary research. Electronic equipment suffers at very low temperatures. Advantages of using In and its alloys in cryogenic temperatures include; excellent wettability, higher toughness, and excellent conductivity when compared to the standard Sn–Pb solders [10,11,12].
Many researchers and research workplaces in the world are devoted to the study of solders with high indium content. A study released in 1991 [13] investigated the deformation properties of In-based solders at both room temperature and −196 °C. InBiSn and InBi type solders were studied. The InBi solder showed considerably higher toughness at −196 °C than the InBiSn solder. Therefore, the authors demonstrated that the InBi solder is suitable for application in the electronics industry at low service temperatures. Research of the properties of In and In-based solders at low temperatures was mentioned in several studies [14,15,16,17].
All authors agreed on the excellent properties of In and In-based solders in cryogenic temperatures. However, residual stresses were observed in the soldered joints. The joint fabricated from In solder was subjected to tensile loading after cooling down and exhibited the highest residual stresses during thermal changes.
In-based solders are used in the electronics industry as a substitute for banned Pb-based solders. The authors of this work [18] examined the issues of soldering Al–Si alloys using a solder of high indium content with ultrasound assistance. They studied the formation of multi-phase reinforced bonds when soldering with a Sn51In solder. The bonds were formed from Si particles, creating a solid solution of Al–In and intermetallic phases. They found that joint strength may increase with longer periods of ultrasound assistance. The period of ultrasound activity was 0.2, 1, 15, and 25 s. At 0.2 s, the measured joint strength was 0.28 MPa, at 15 s it was 4.89 MPa, and at 25 s, the strength rose to 6.81 MPa.
The authors of Reference [19] used an In-based solder for the study of intermetallic phases formed in the interface between the Ni substrate and In49Sn solder. In that case, the soldering was performed in a vacuum furnace, with infrared heating, and the application of flux. The intermetallic phases of NiInSn were formed in the interface. The soldering time varied from 15 to 240 min. However, this process was rather time demanding, therefore, the authors preferred to use technologies that applied ultrasound, as the soldering time takes just a few seconds. This prevents the dissolution of the substrate in the liquid solder and excessive formation of intermetallic phases, both of which affect the strength of the joints.
The aim of this research is to characterize the soldering alloy type In10Ag4Ti. This solder is intended for lower temperature soldering, which Sn active solders (e.g., Sn3.5Ag2Ti solder) do not cover. Indium and titanium were selected because both are active metals. Indium has excellent wettability on many metallic and non-metallic materials. Its disadvantage as a base solder is its low tensile strength of 2–4 MPa. Therefore, the solder was alloyed with 10 wt % of Ag, in order to increase the strength of the In matrix of the solder and improve electrical conductivity. The amount of active metal Ti used varied between 2 to 6 wt %. Therefore, 4 wt % of Ti was proposed. Titanium is an active metal with a high affinity for many elements. It was examined whether the designated composition of the soldering alloy was suitable for soldering SiC ceramics and copper substrates under defined conditions. Thus, this research consisted of the study of solder proper, and its interactions with solder-substrate interfaces.
2. Experimental Section
After determining the weight proportions of the prepared alloy, weighing of individual components was performed. Materials with a purity of 4N or higher were used for solder manufacturing.
The chemical composition of the prepared alloy is shown in Table 1.
Substrates of the following materials were used in experiments;
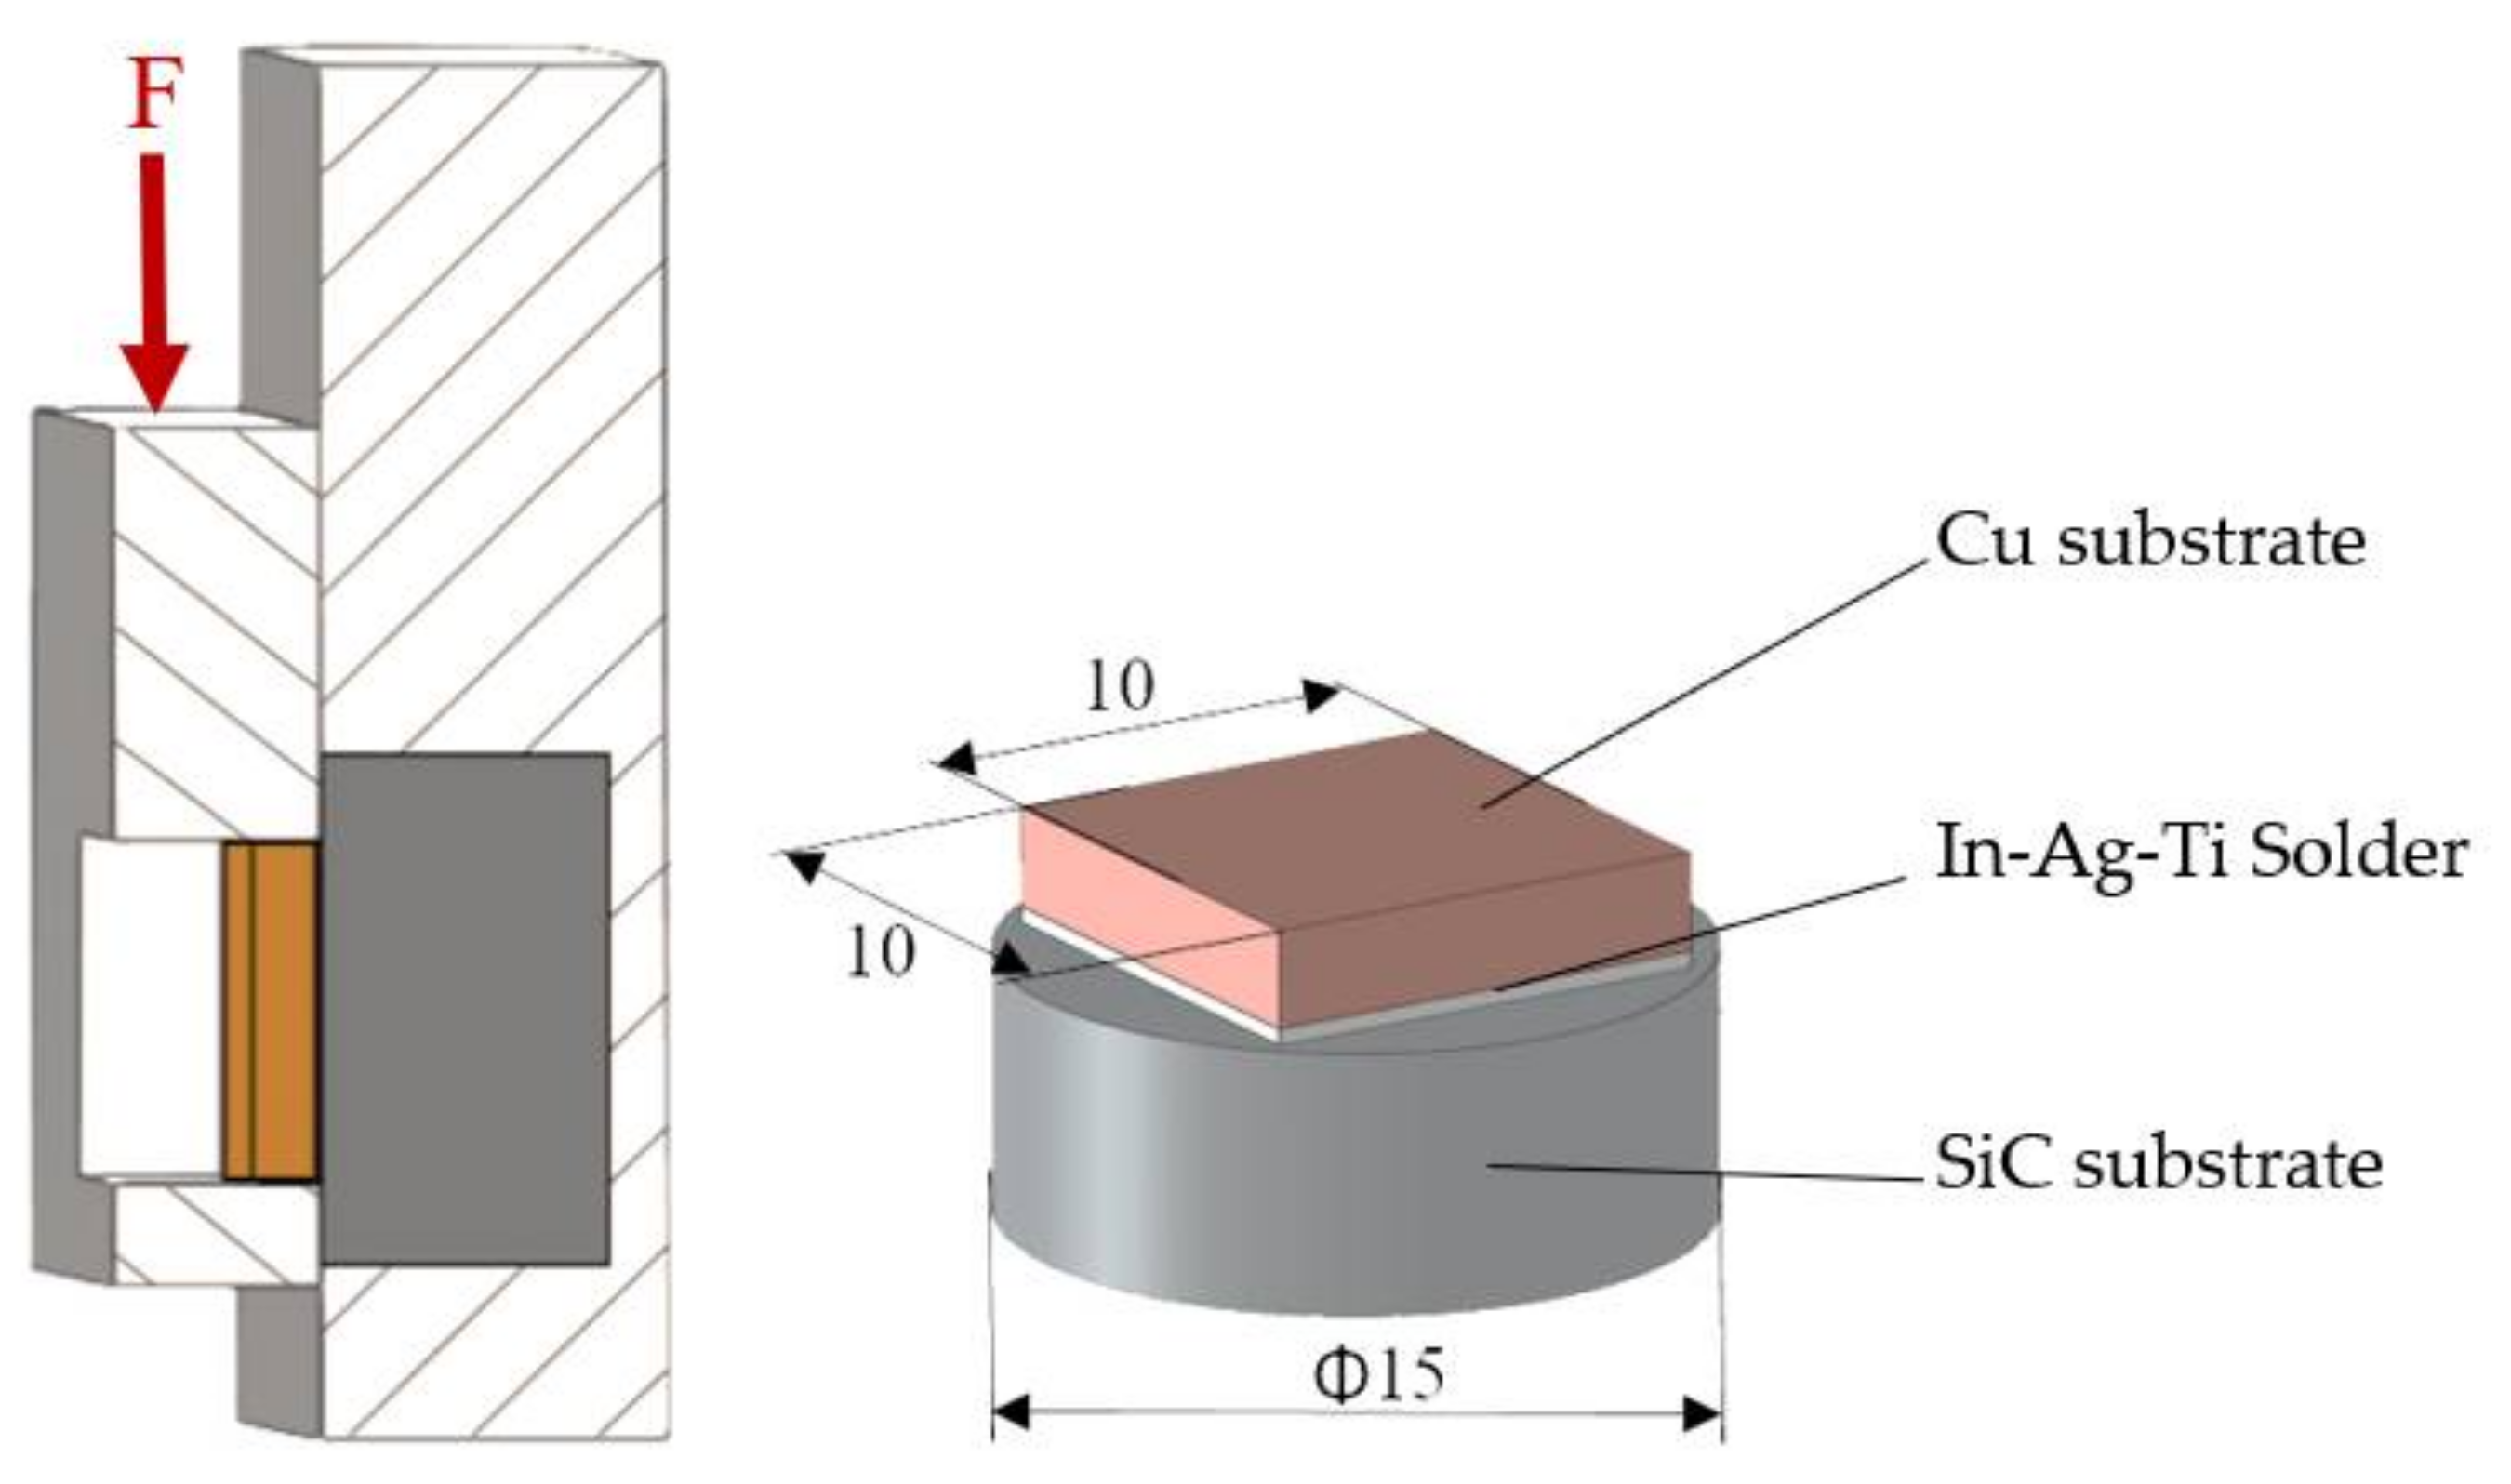
- ceramic SiC substrate in the form of disks Ø 15 × 3 mm;
- metallic Cu substrate with 4N purity of dimensions Ø 15 × 2 mm and 10 × 10 × 2.5 mm.
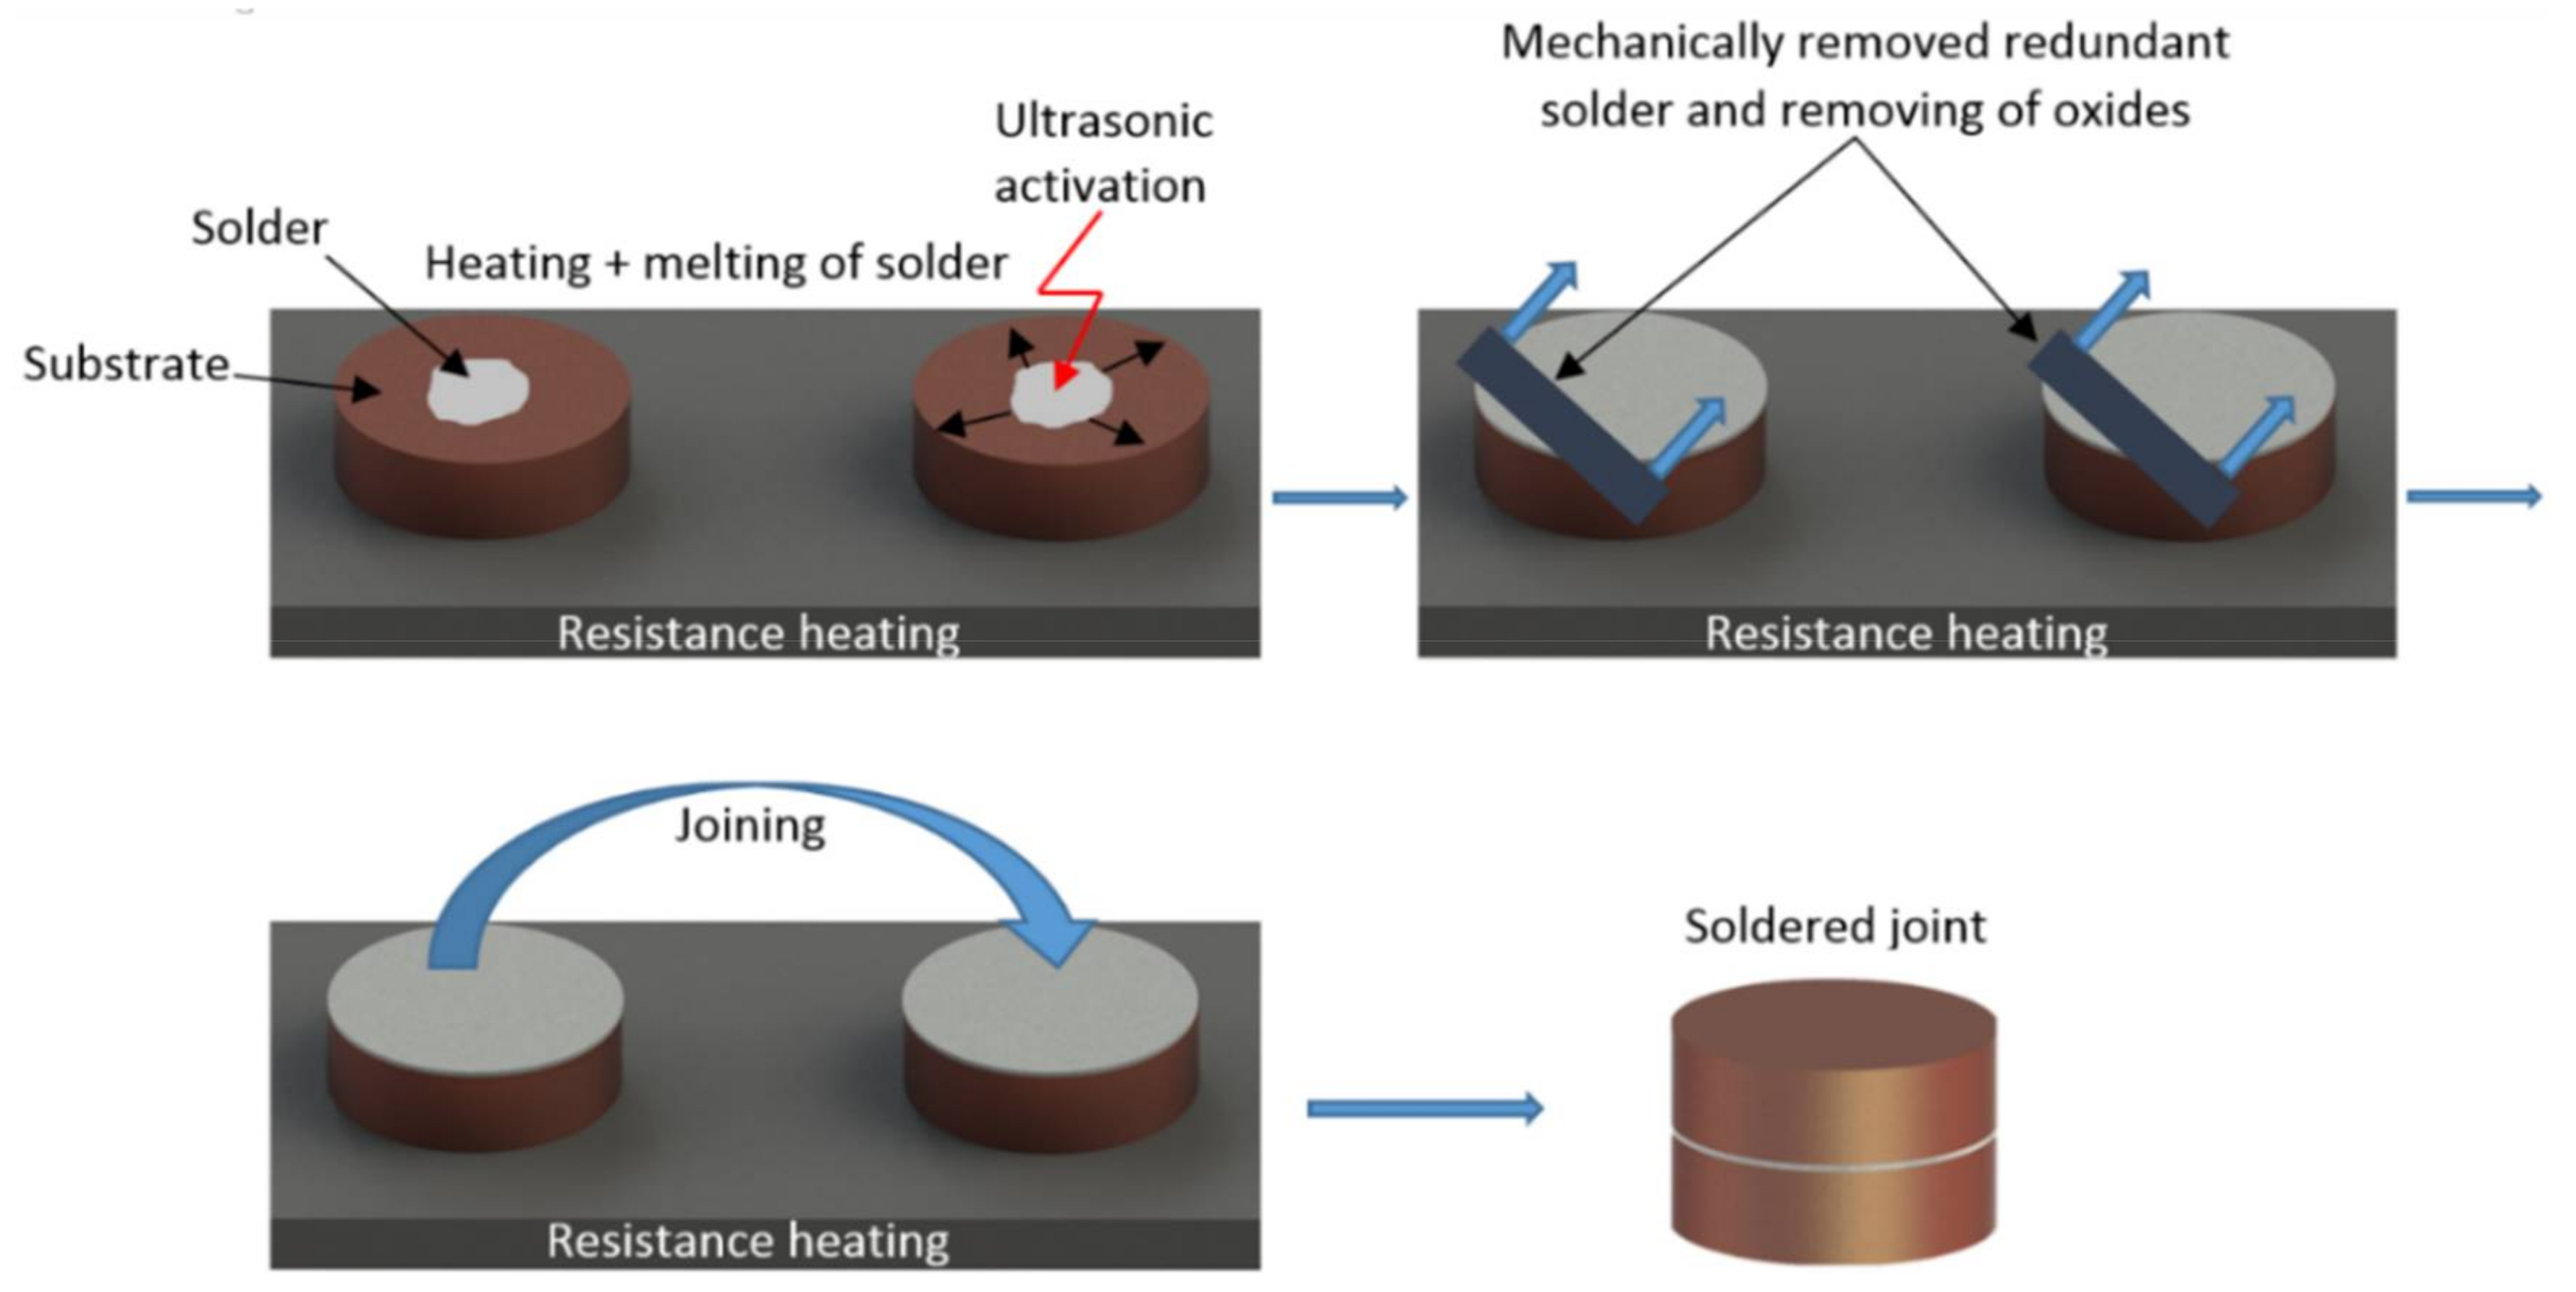
A hot-plate with thermostatic regulation was used for the fabrication of soldered joints. The SiC substrate was placed on the hot-plate, the solder was then added, and heated to soldering temperature. Soldering was performed using Hanuz UT2ultrasonic equipment with the parameters given in Table 2.
Solder activation was accomplished via an encapsulated ultrasonic transducer consisting of a piezo-electric oscillating system and a titanium sonotrode with a tip diameter of Ø 3 mm. The soldering temperature was 230 °C. Soldering temperature was checked by a continuous temperature measurement of the hot-plate by a NiCr–NiSi thermocouple. The time of ultrasonic power use was 5 s.
Soldering was performed without flux. The redundant layer of oxides on the surface of molten solder was removed. An identical procedure was repeated with the other substrate. Substrates with molten solder were then attached to each other, thus, forming a joint. A schematic representation of this procedure is shown in Figure 1.
Metallographic preparation of specimens from soldered joints was done using the standard metallographic procedures for specimen preparation. Grinding was performed using SiC emery papers with granularities of 240, 320, and 1200 g/cm2. Polishing was performed with diamond suspensions of grain size: 9, 6, and 3 μm. Final polishing was performed by a OP-S (Struers, Detroit, MI, USA) polishing emulsion with 0.2 μm granularity.
The solder microstructure was studied with scanning electron microscopy (SEM) using microscope types TESCAN VEGA 3 (Brno, Czech Republic) and JEOL 7600 F (Belfast, Northern Ireland) with a X-ray micro-analyzer type Microspec WDX-3PC, used to perform both qualitative and semi-quantitative chemical analysis. The X-ray diffraction analysis was used for the identification of phase composition of the solder. X-ray diffraction measurements were carried out using a PANalytical Empyrean diffractometer in Bragg–Brentano geometry (EA Almelo, The Netherlands). Characteristic CuKα1,2 (CuKα1 = 1.540598 × 10⁻¹⁰ m, CuKα2 = 1.544426 × 10⁻¹⁰ m) was emitted at an accelerating voltage of 40 kV and a beam current of 40 mA, and was collimated using fixed slits. Diffracted radiation was collected using area-sensitive detectors operating in 1D scanning mode. XRD data were analyzed using the ICSD Inorganic Crystal Structure Database and ICDD PDF2 powder diffraction and crystal structure database. The differential scanning calorimetry (DSC) analysis of the In–Ag–Ti solder was done using Netzsch STA 409 C/CD equipment that was shielded with Ar gas of 6N purity.
A shear test was performed to determine the mechanical properties of the soldered joints. A schematic representation of the sample and a measurement scheme of shear stress are shown in Figure 2. Shear strength was measured using a versatile LabTest 5.250SP1-VM tearing machine. To alter the direction of tensile force acting upon the test piece, a special jig with the defined shape of the test piece was applied. This shearing jig ensured uniform shear loading of the specimen in the plane of the interface between the solder and substrate. The loading velocity of the sample was 1 mm·min−1.
3. Experimental Results
3.1. DSC Analysis
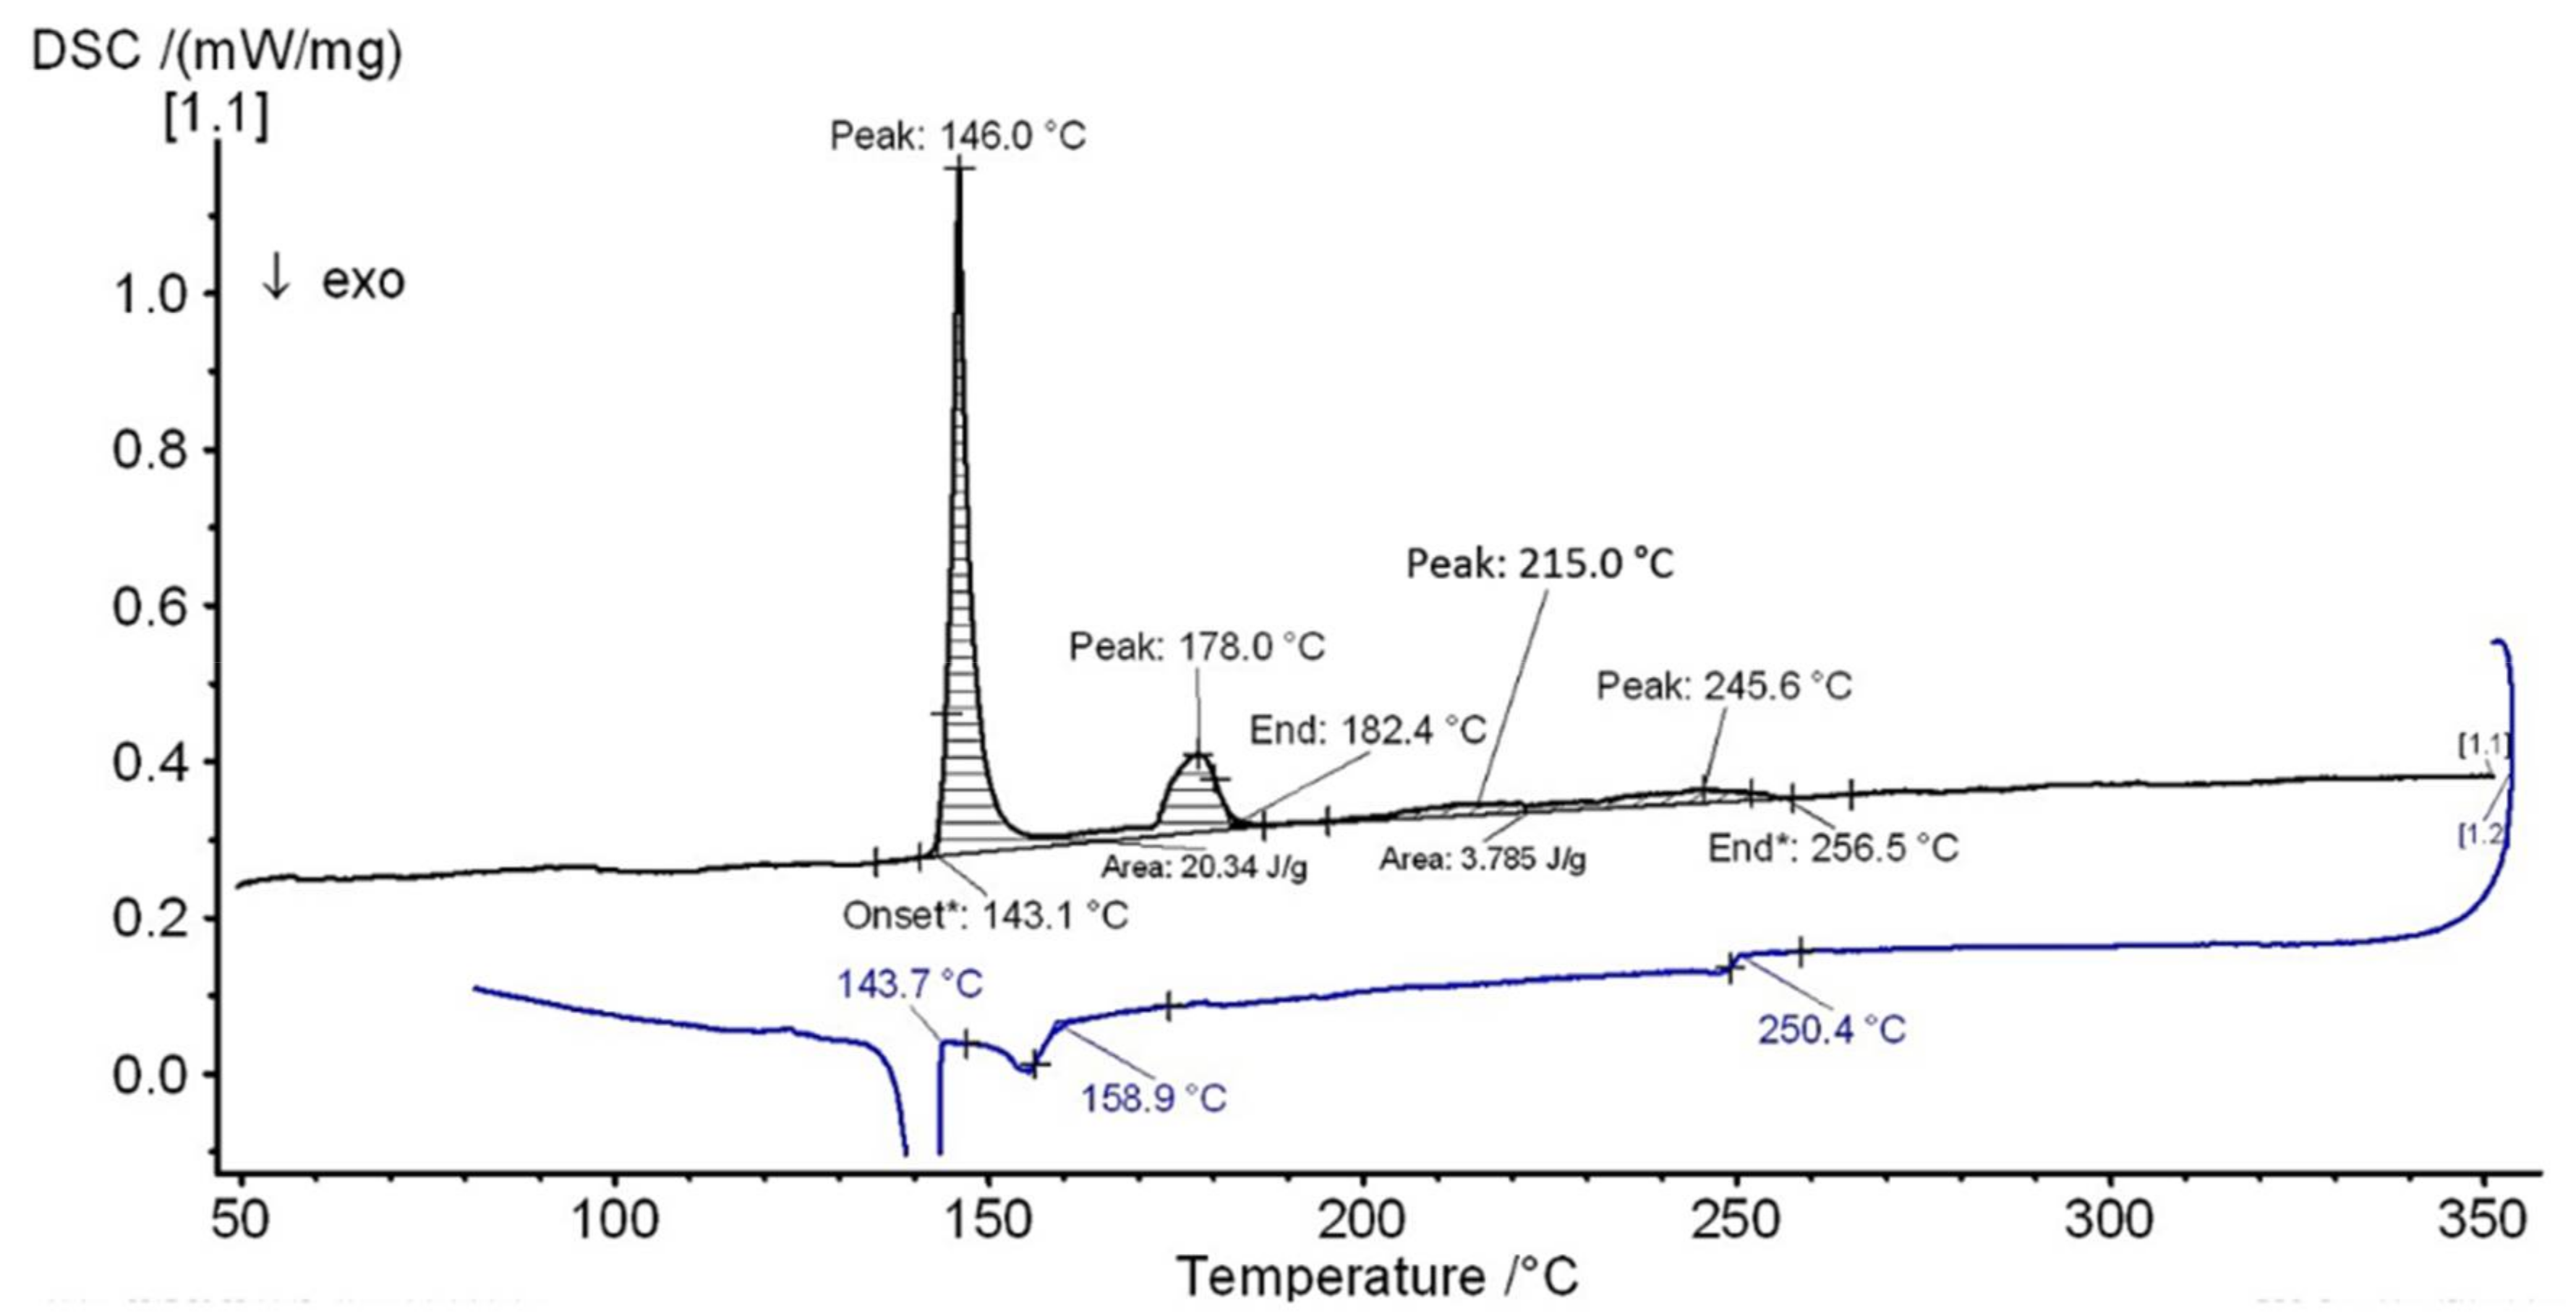
DSC analysis was performed to determine the melting point of the solder. The curve of the In10Ag4Ti solder at a heating rate of 10 K·min−1 is documented in Figure 3. Two pronounced peaks were obtained. The first peak, of maximum temperature146.9 °C, corresponds to the temperature of eutectic transformation, after which the mechanical mixture of the solid solution (In) and intermetallic phase of AgIn2—φ was formed. In accordance with the binary diagram of the authors [20], the temperature of eutectic transformation should be 144 °C, but the slight amount of Ti contained in the solder increased the melting point of eutectics to 146 °C. Approximately 65% of the solder volume was molten at the first peak.
The second peak, of maximum temperature 178 °C, represents the peritectic reaction in the Ag–In system. After this peritectic reaction, an intermetallic phase of Ag2In was formed in the melt. At the second peak, approximately 19% of the volume of solder was molten.
The third peak, of temperature approximately 215 °C, represented the second peritectic reaction in the Ag–In system. After this peritectic reaction, the Ag3In phase was formed in the melt.
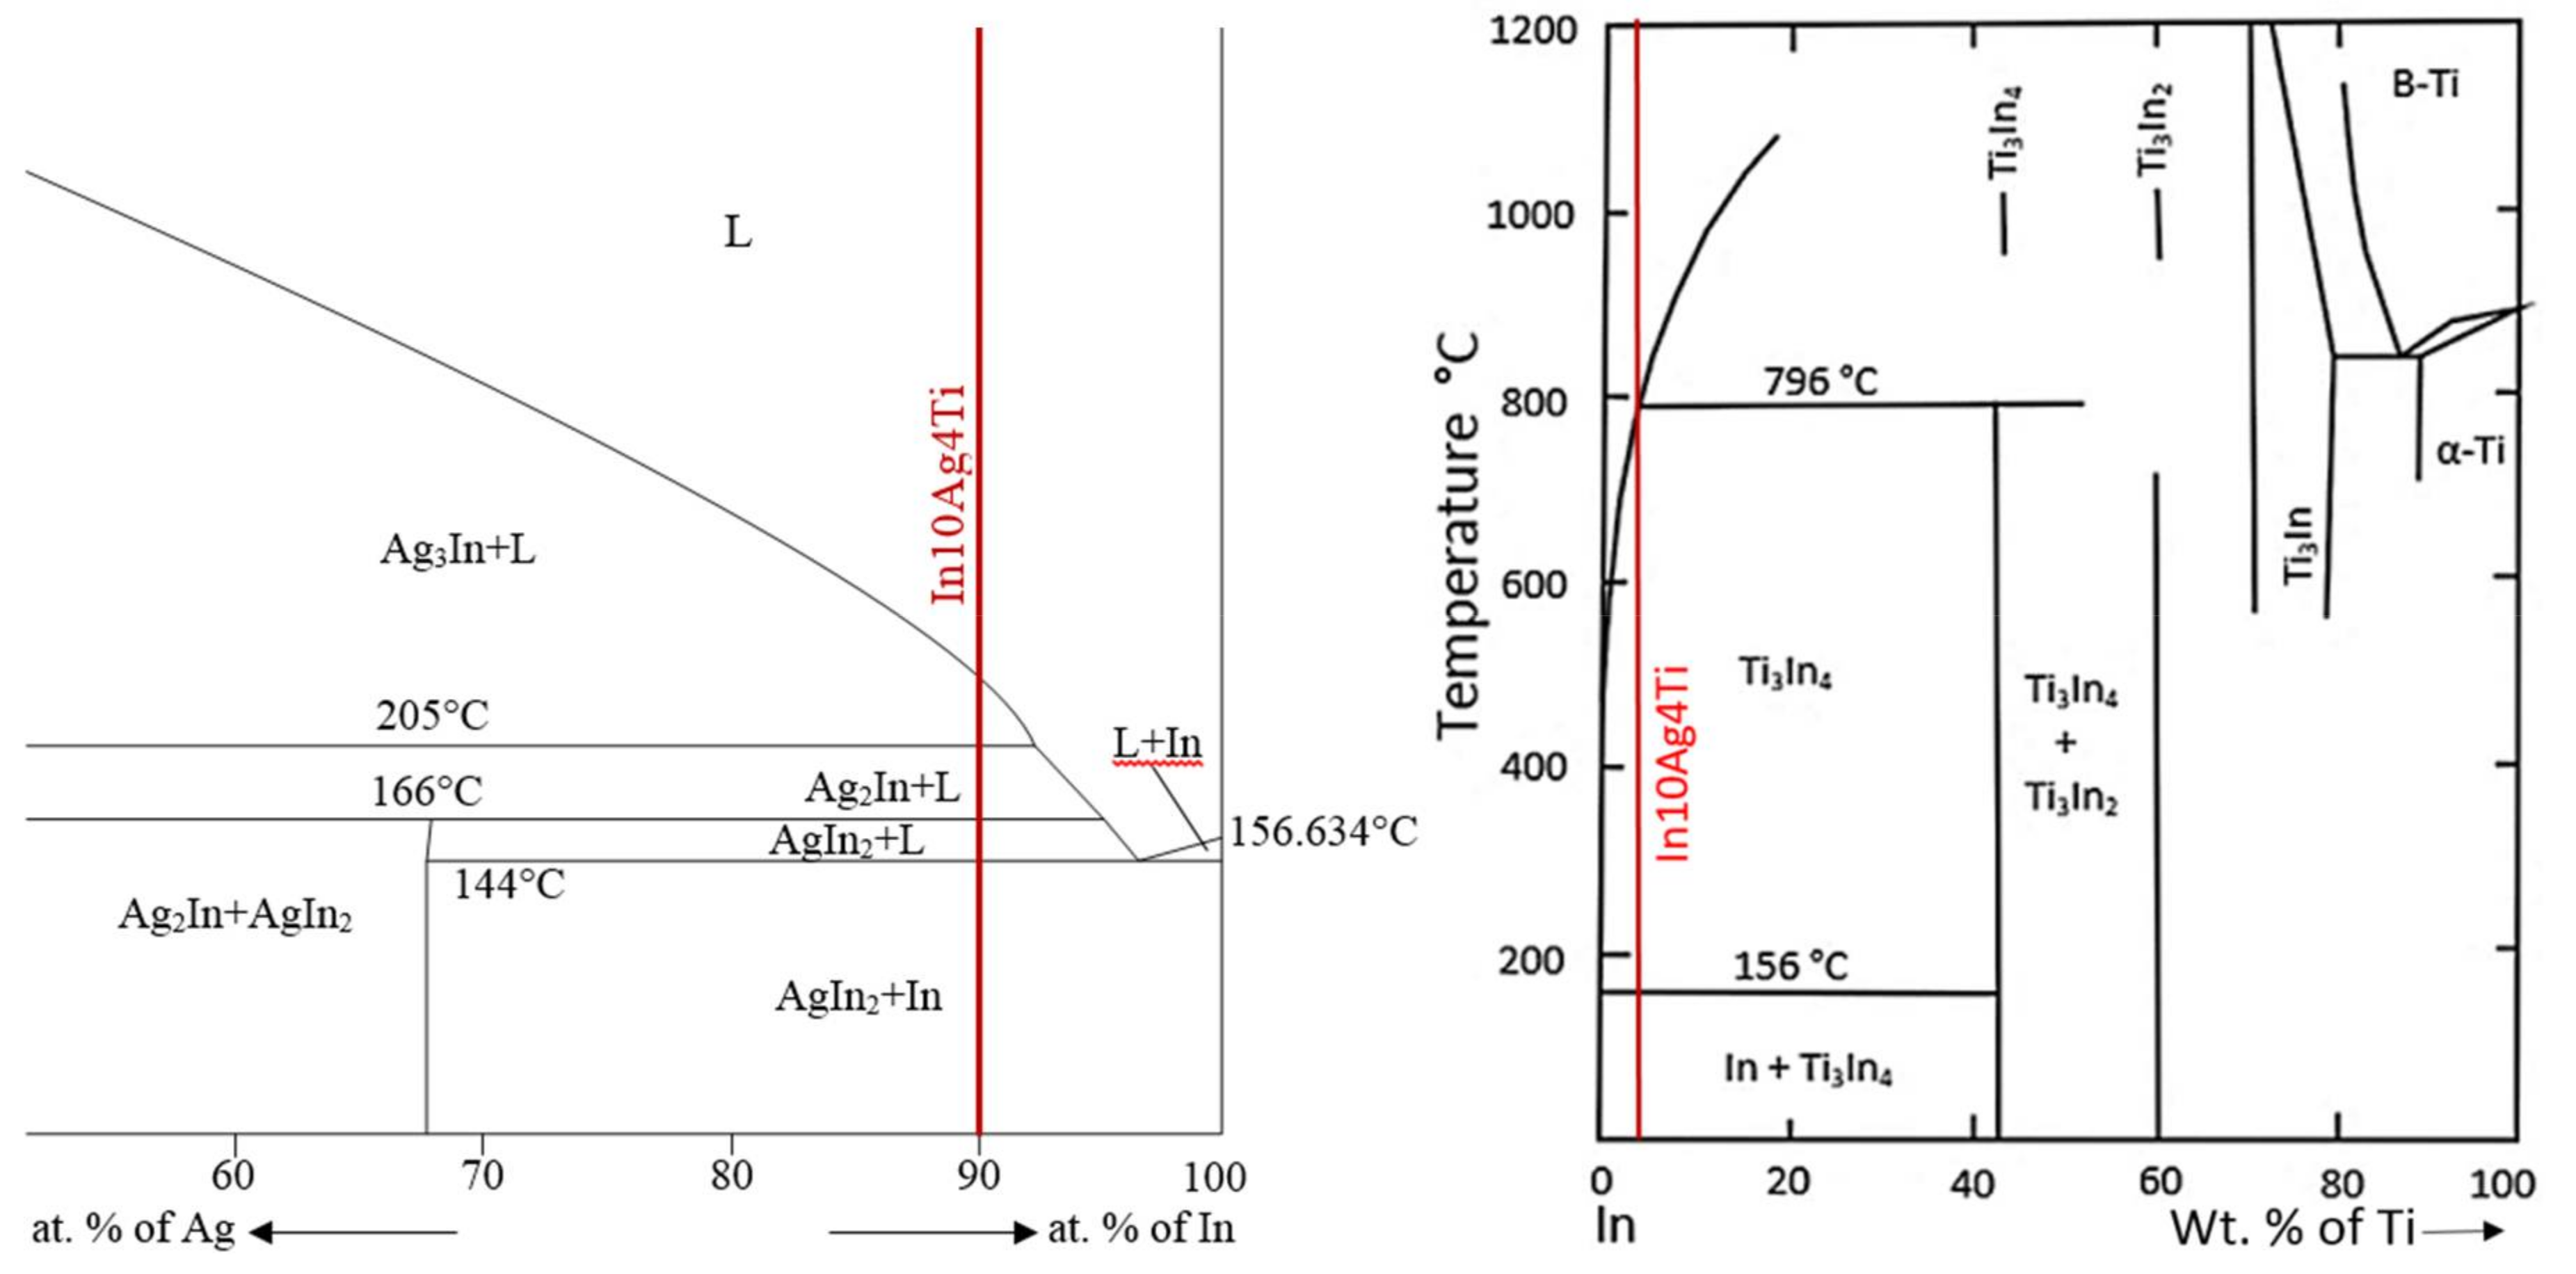
The fourth peak, at 245.6 °C, represented the termination of melting of the components in the Ag–In system—Figure 4. The titanium phase, Ti3In4, which occurs in the matrix of the indium solder, was not yet fully molten at this temperature. In accordance with the binary diagram of In–Ti [21], this phase will be fully molten at 796 °C—Figure 4.
From the results of the DSC analysis it is obvious that the Ag addition decreased the melting point of the In10Ag4Ti solder, while the Ti addition slightly increased the melting point.
3.2. Microstructure of In10Ag4Ti Solder
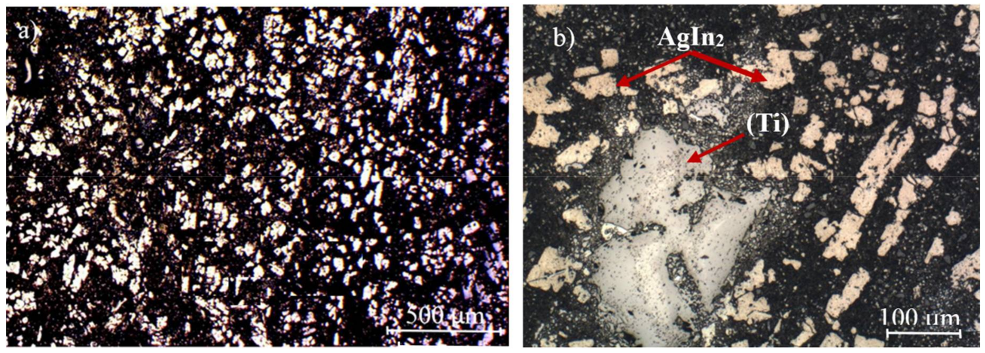
The microstructure of the In10Ag4Ti soldering alloy, shown in Figure 5, consists of a indium solder matrix, where the intermetallic silver phases, mainly AgIn2, are uniformly distributed, it also contains the non-uniformly distributed phases of the titanium solid solution, α-Ti, see Figure 5b.
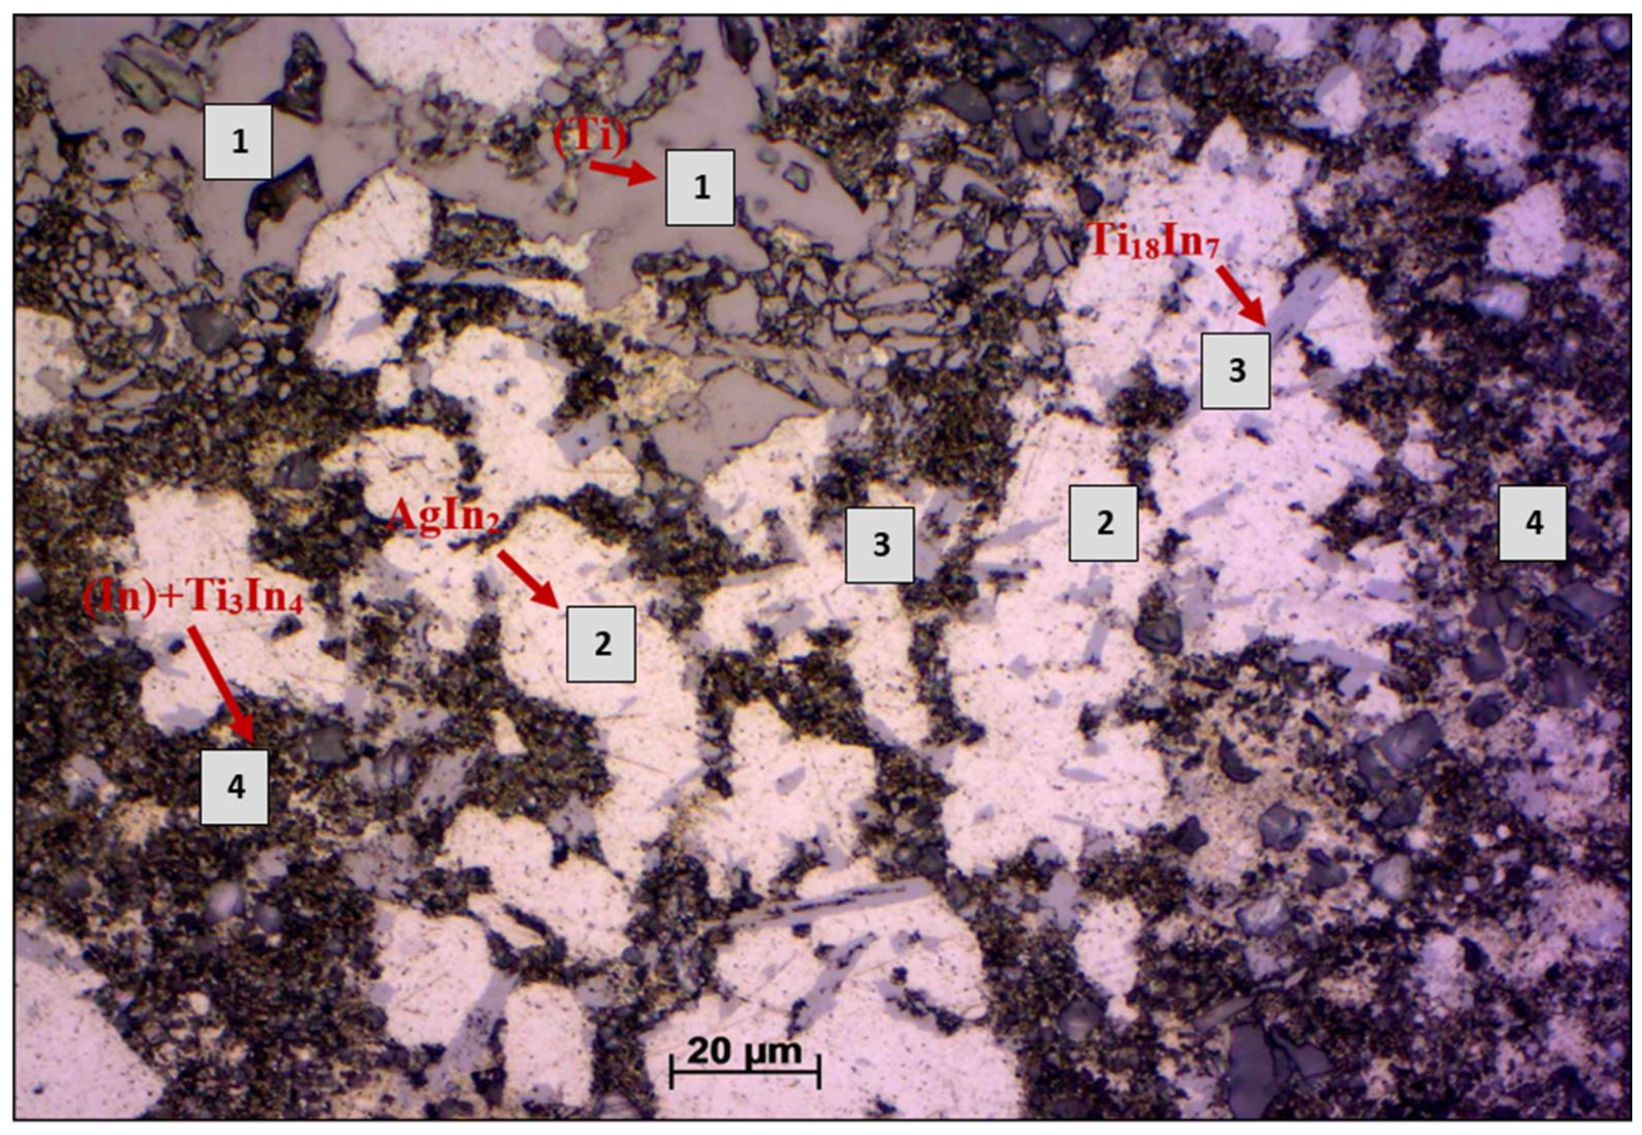
EDX analysis was performed to determine the chemical composition of the individual components in the soldering alloy. The points of measurements are shown in Figure 6 and Table 3. These are marked from 1 to 4.
The dark-grey phase in Figure 6, designated as Spectrum 1, is composed of a titanium (Ti) solid solution. The bright zones are due to the AgIn2 phase. The solder matrix consists of a fine mechanical mixture of (In) + Ti3In4 phase. The dark particles in the microstructure are comprised of SiC and abrasive. The solder is very soft and the grains of abrasive are stuck to it.
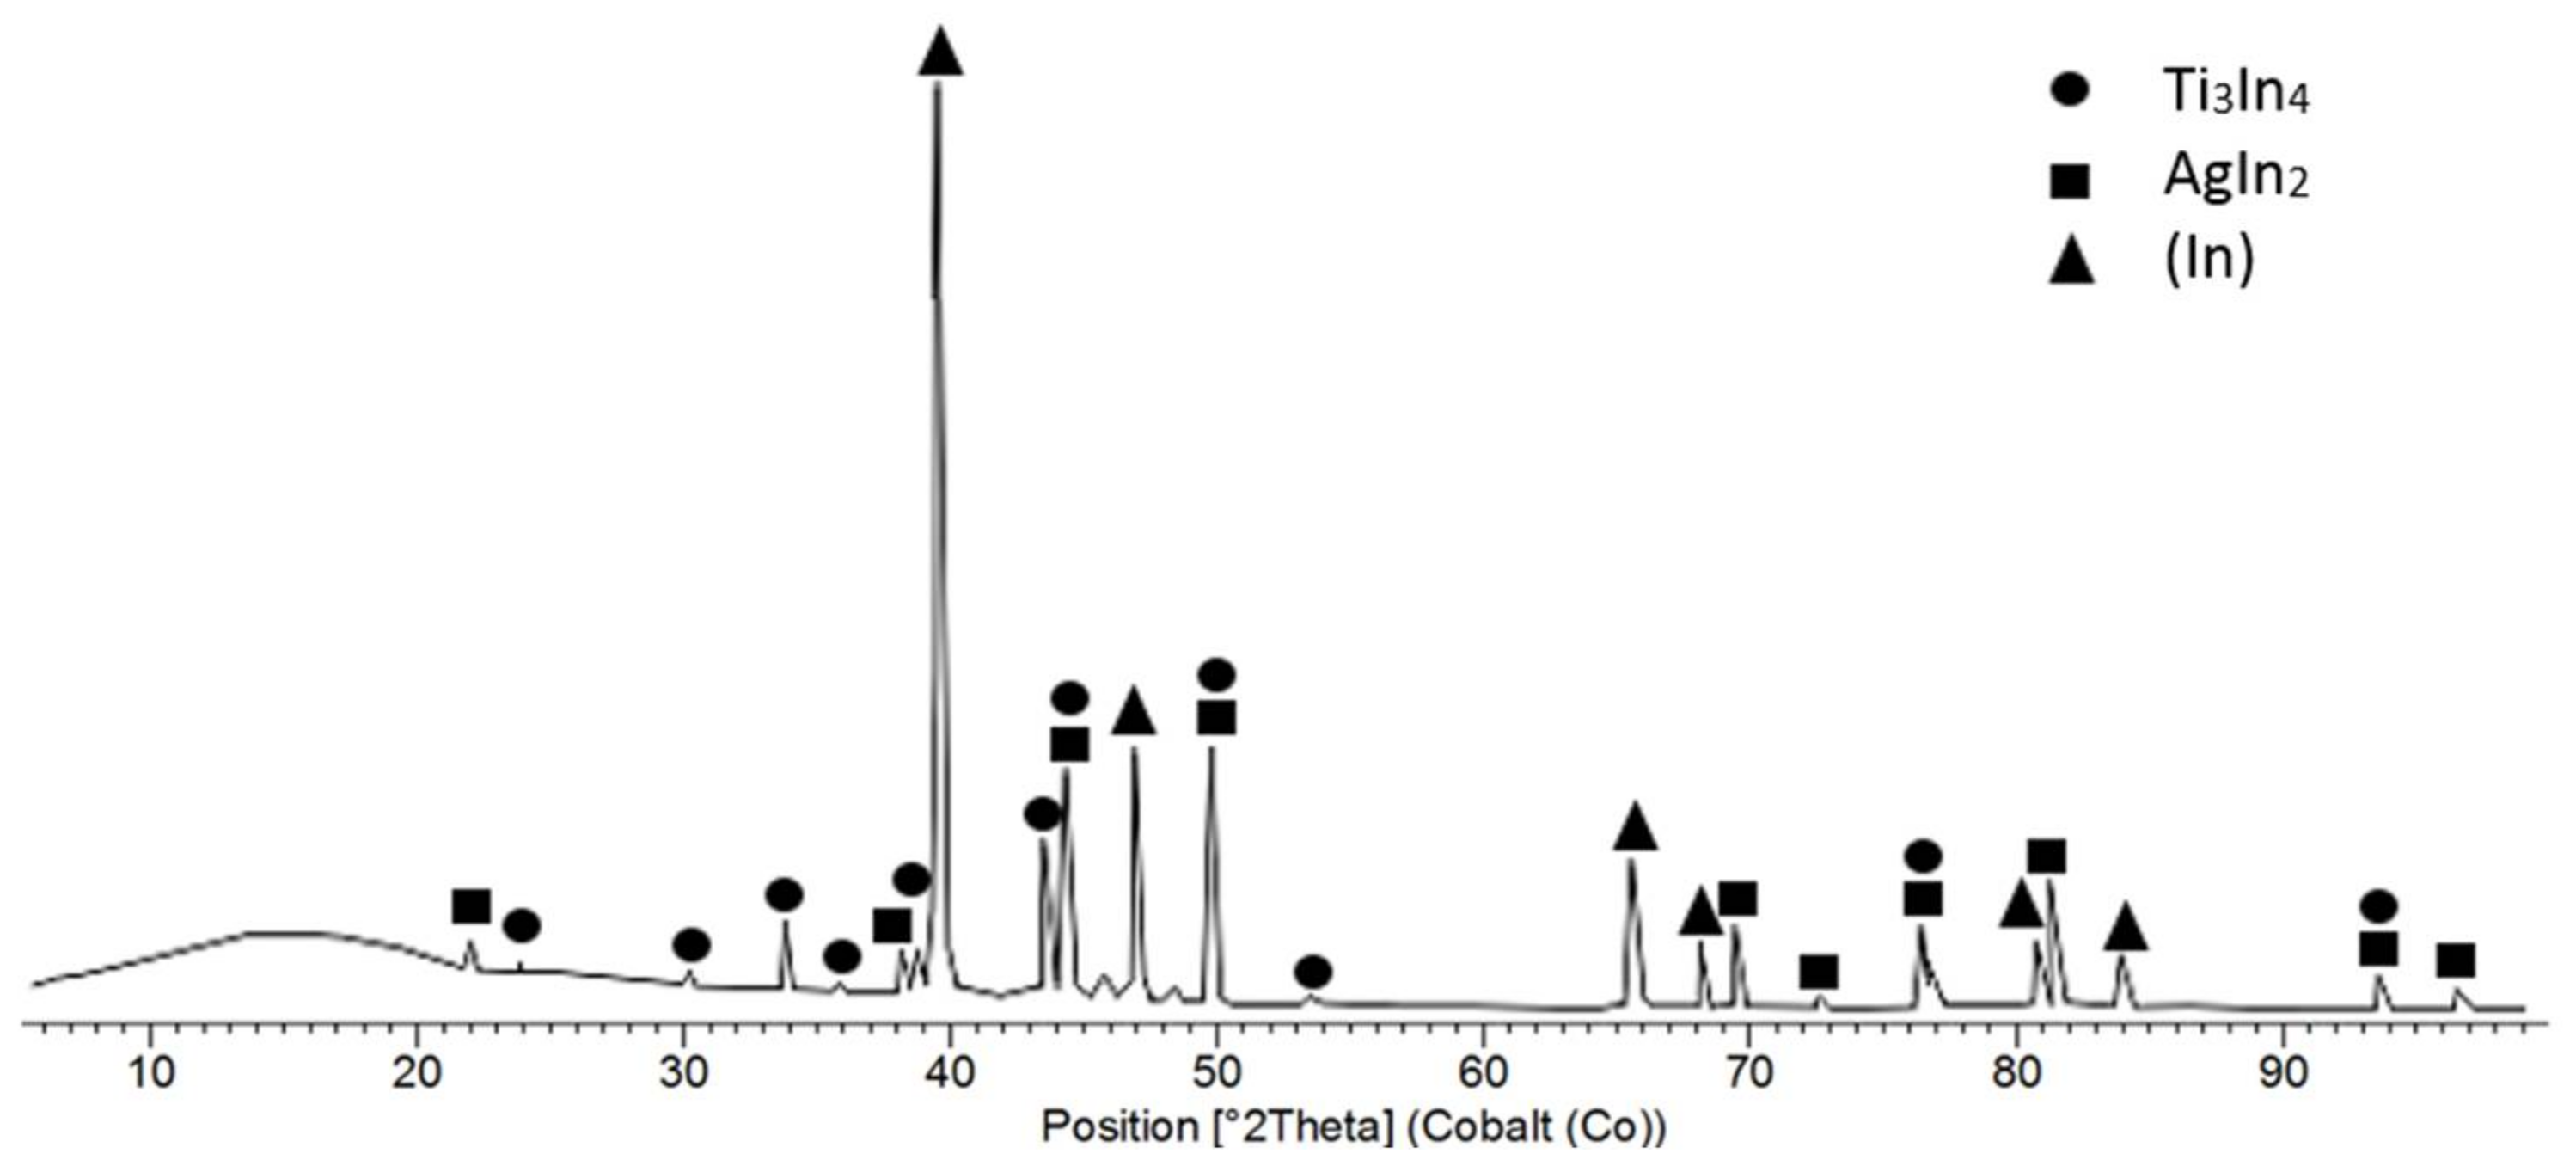
Diffraction XRD analysis of the In10Ag4Ti solder has proven the presence of solid solution (In), intermetallic phase AgIn2 and the presence of intermetallic phase titanium Ti3In4. The record of the diffraction analysis is documented in Figure 7. The solid solution (Ti) and intermetallic phase (Ti18In7) occur in the matrix only scarcely and were undetected by XRD analysis.
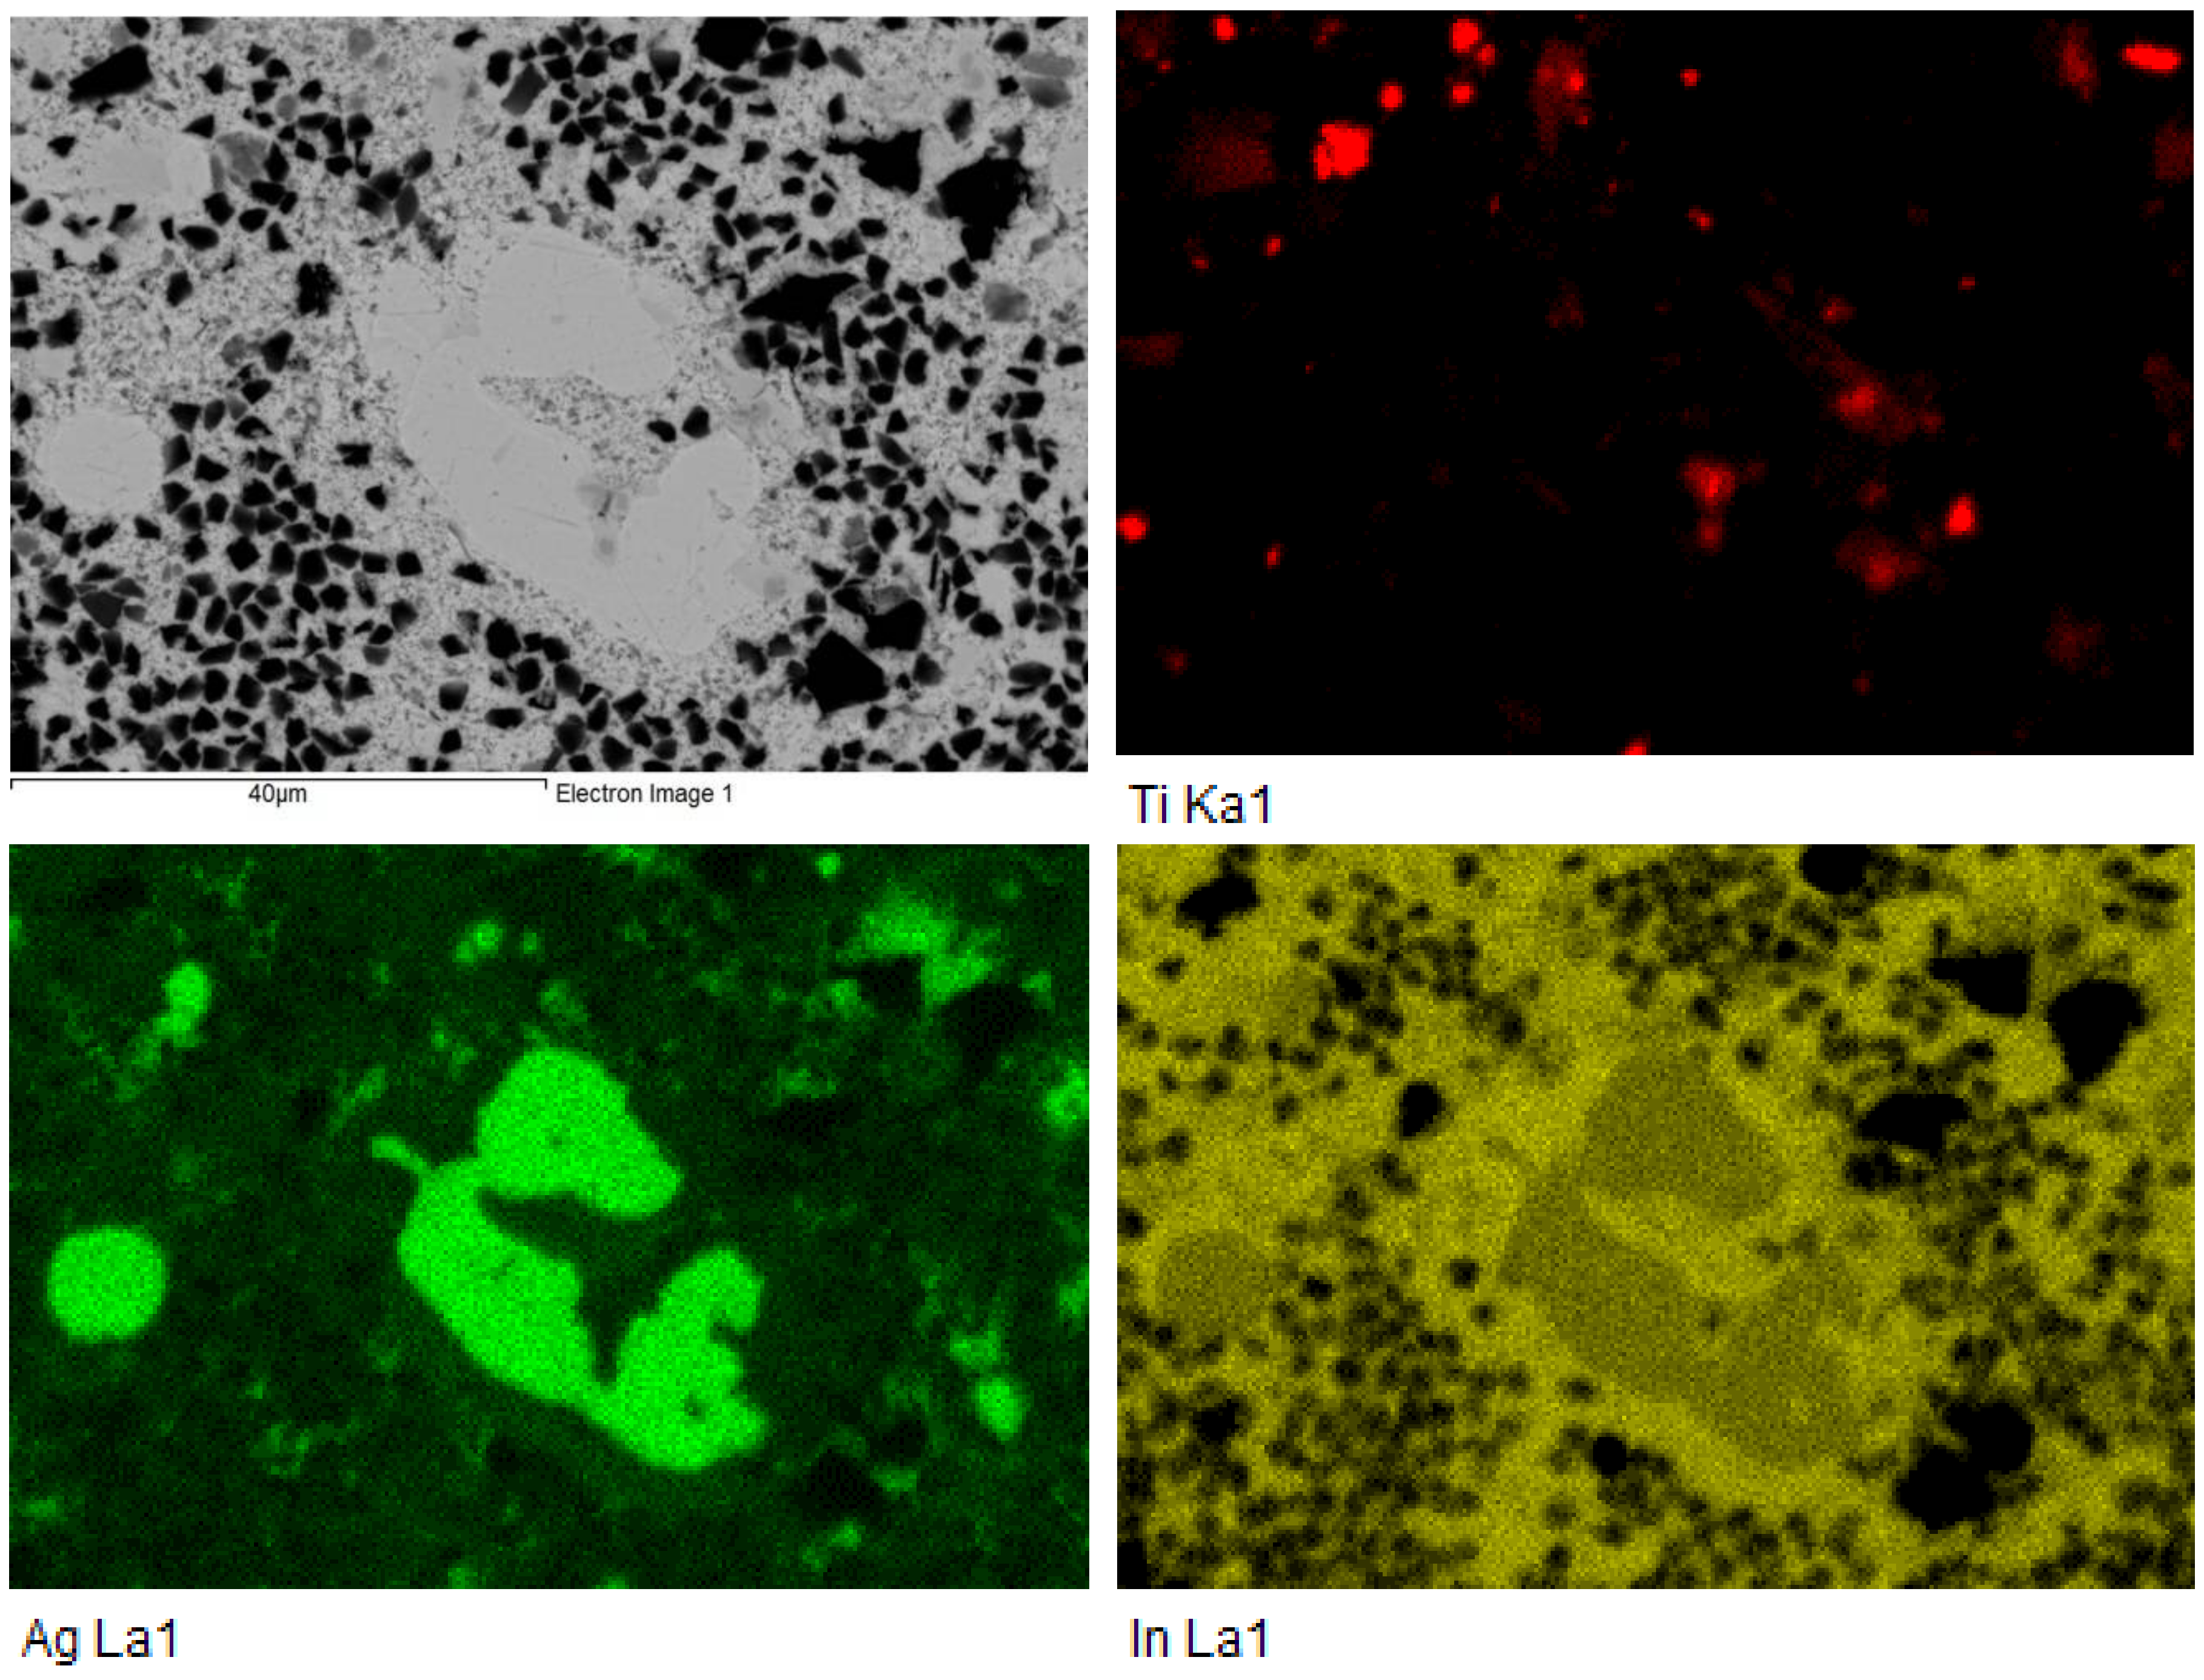
The planar distribution of silver phase AgIn2 and titanium phases in the matrix of indium solder is documented in Figure 8. The origin of the dark particles in the solder matrix is from abrasive.
3.3. Microstructure of SiC–In10Ag4Ti–Cu Joint
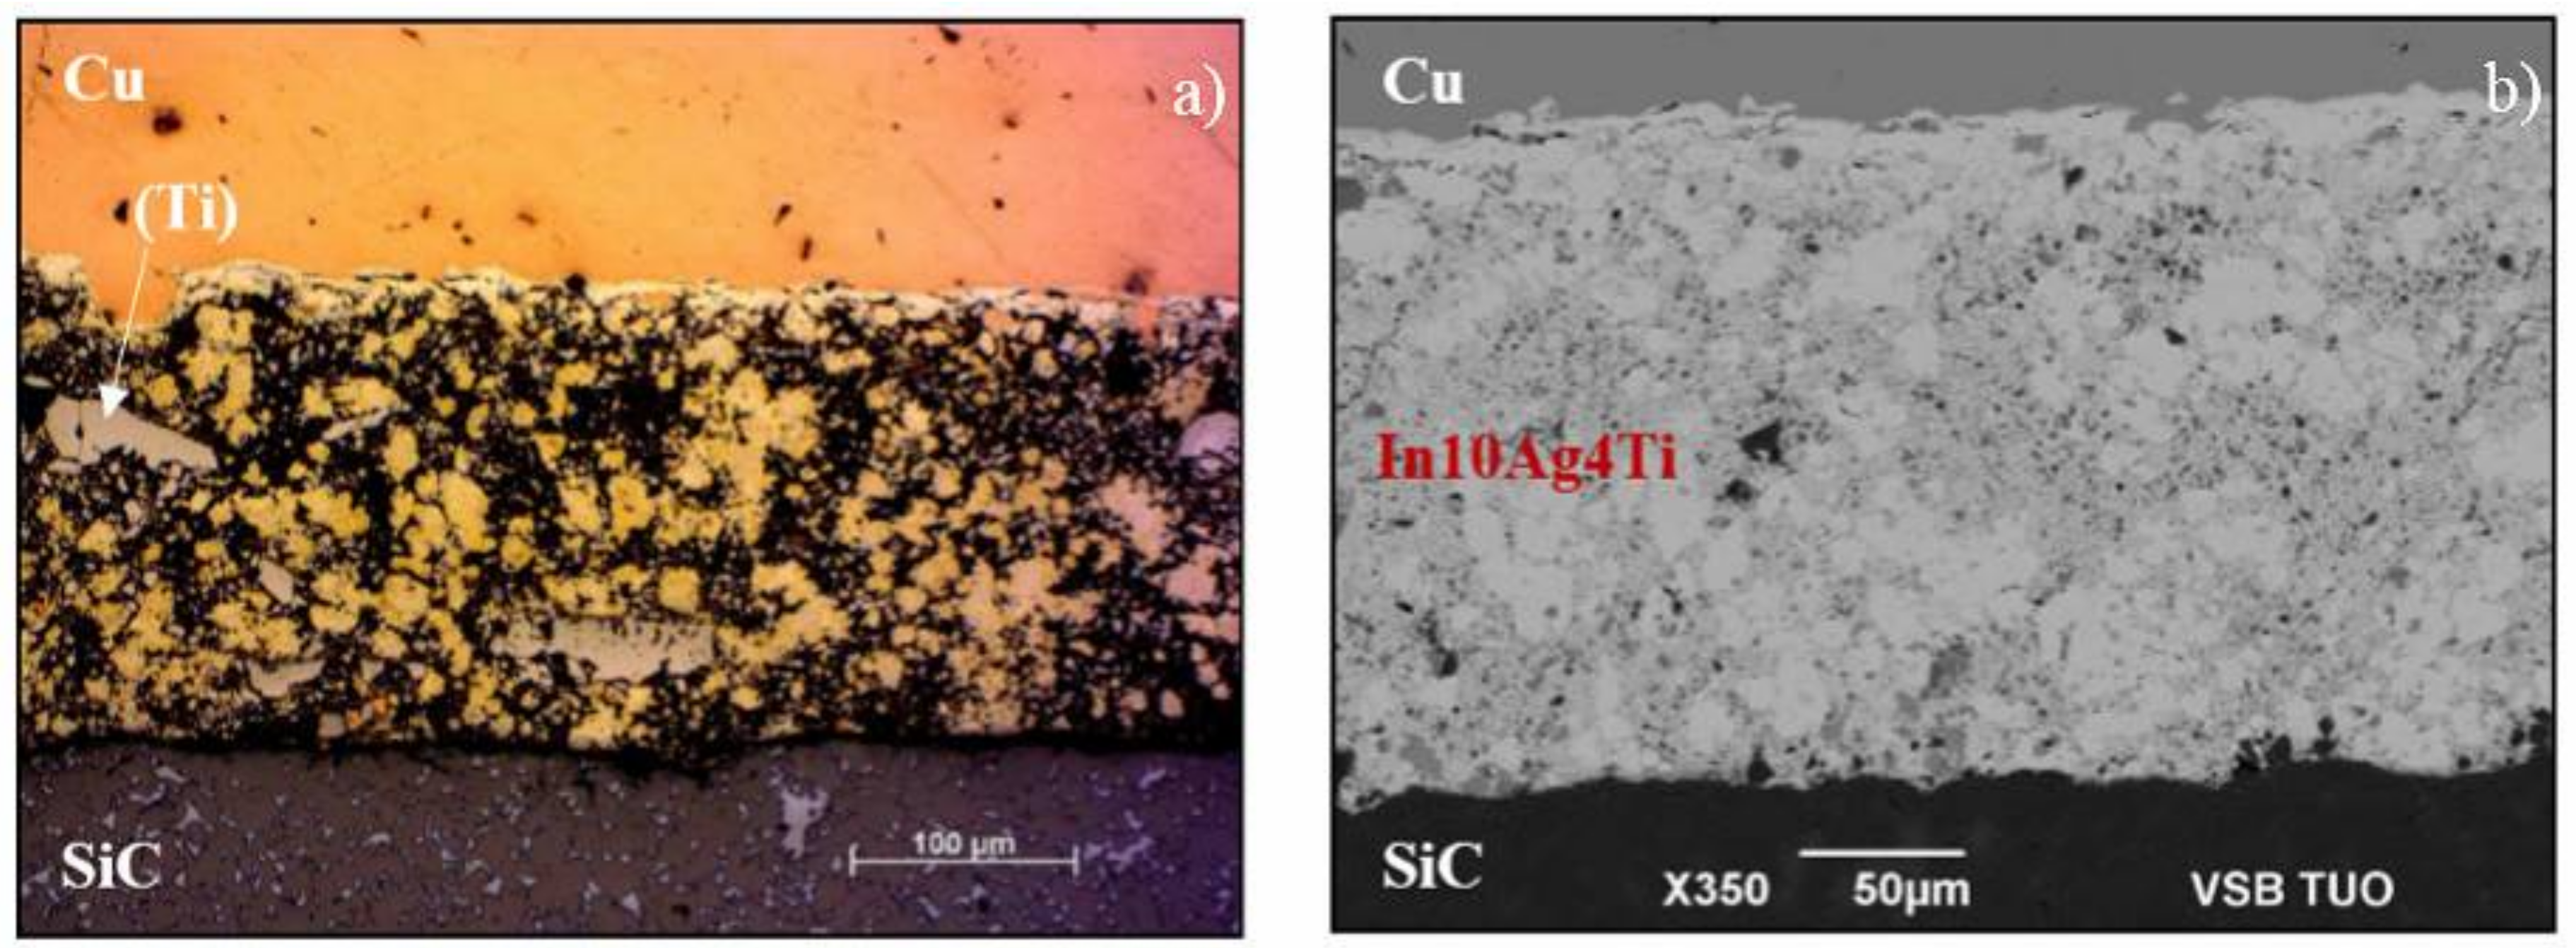
The SiC–In10Ag4Ti–Cu soldered joint was fabricated at 230 °C. Owing to ultrasound activation, an acceptable bond was achieved using a soldering process that did not contain cracks or other irregularities. The microstructure of the soldered joint is shown in Figure 9.
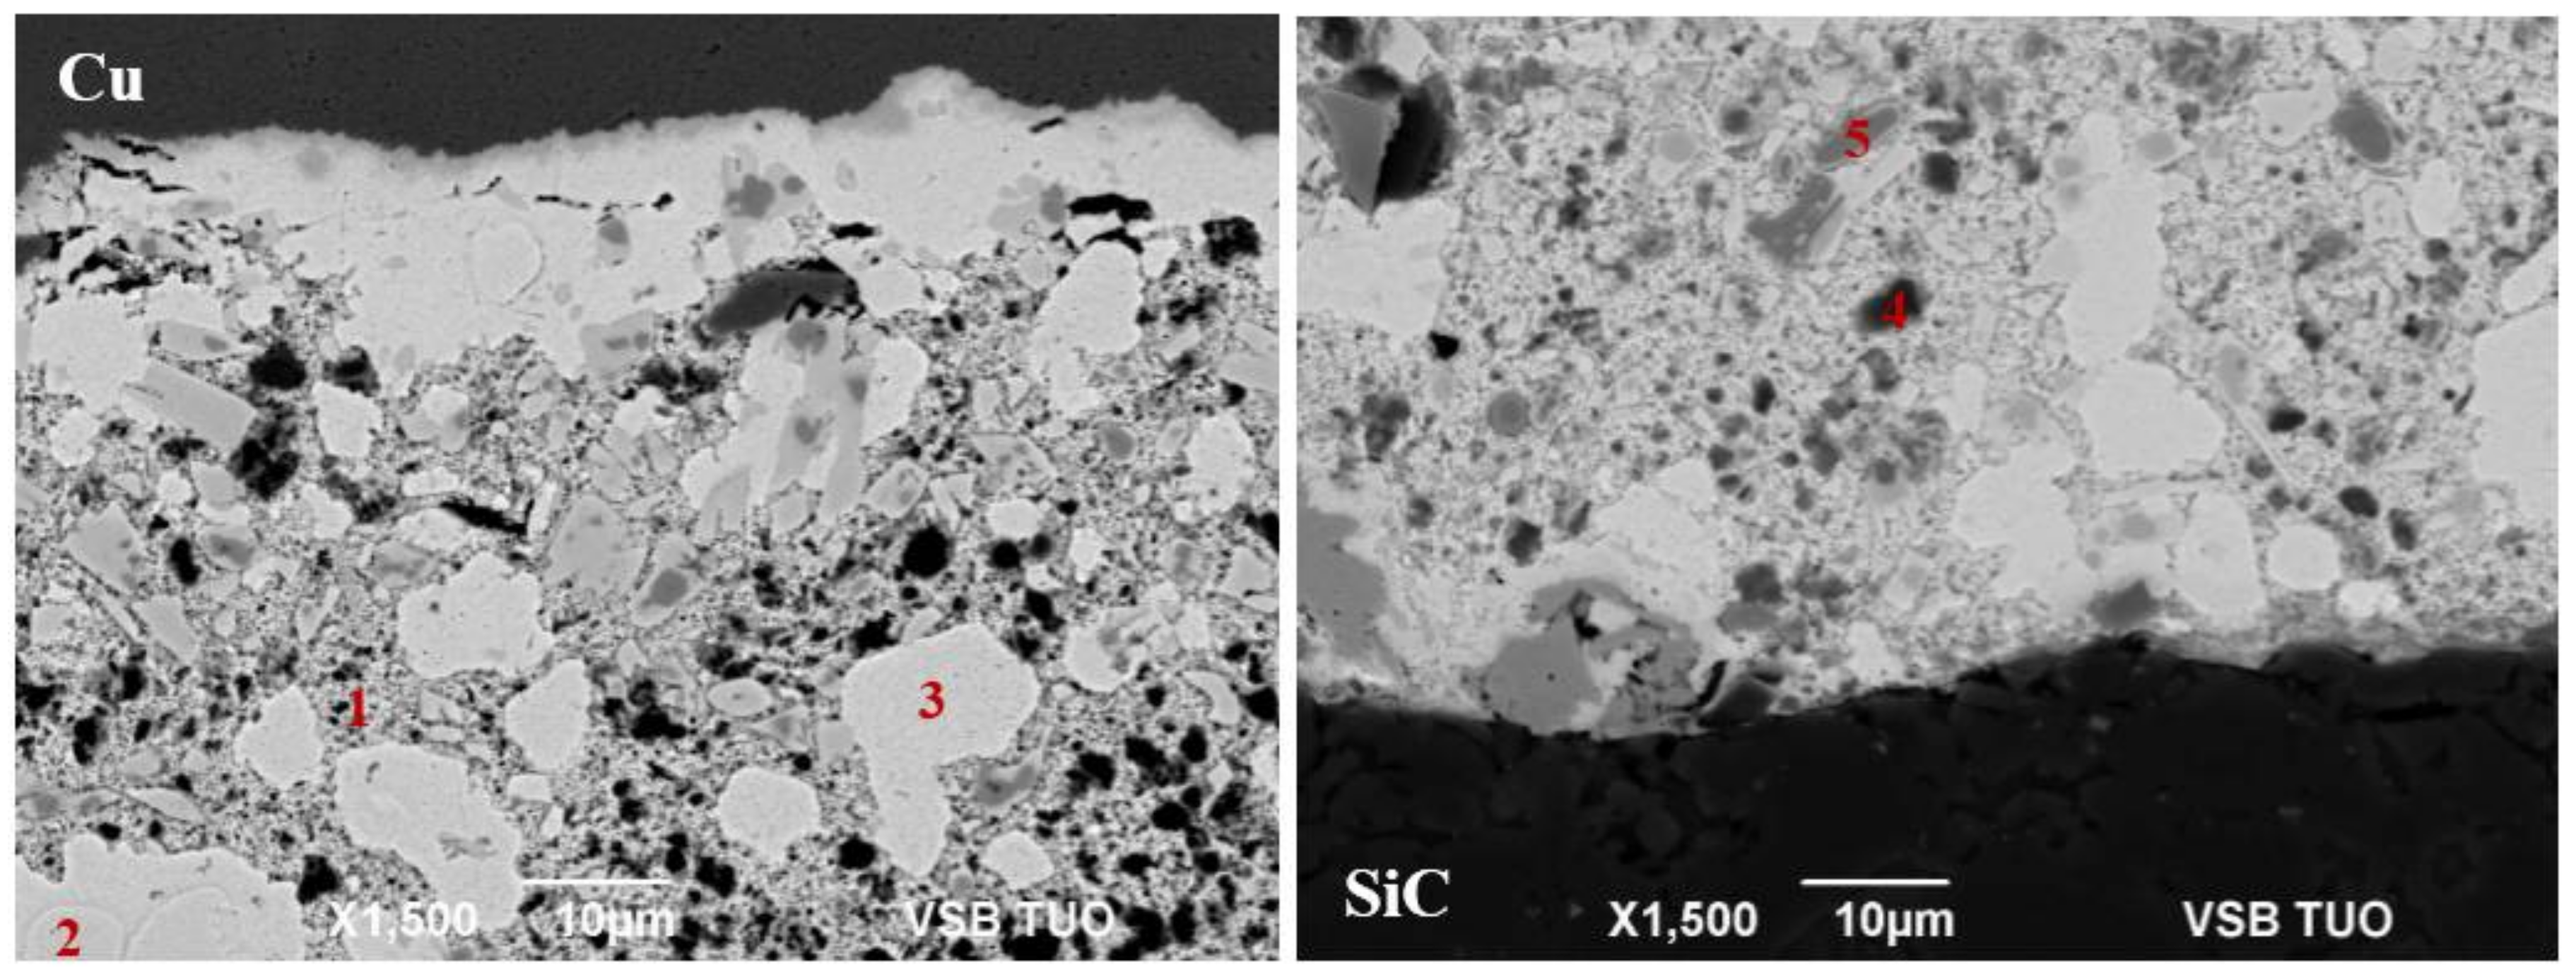
Figure 9a shows that the larger particles of solid solution (Ti) remained preserved in the solder matrix after ultrasonic soldering. EDX analysis of the soldered joint was done to determine the chemical composition and identification of individual phases (Figure 10 and Table 4).
Silver phases of Ag2In and AgIn2 as well as titanium phases occurred in the solder matrix after soldering. The matrix was composed of In eutectics; Ti and Ag elements were present, but only in low concentrations. Zones with undiluted copper have also occurred in the solder matrix.
Based on previous studies [22,23], it was supposed that the active Ti element would concentrate in the interface with the ceramic SiC material, where it would then form new phases as a result of the interaction between the solder and the substrate, for example, the formation of Ti–C and Ti–Si. However, no interaction of titanium was accompanied with the formation of new phases in the interface of the solder-SiC ceramics, as observed by EDX analysis, in spite of Ti mapping along the entire interface of the solder-ceramics.
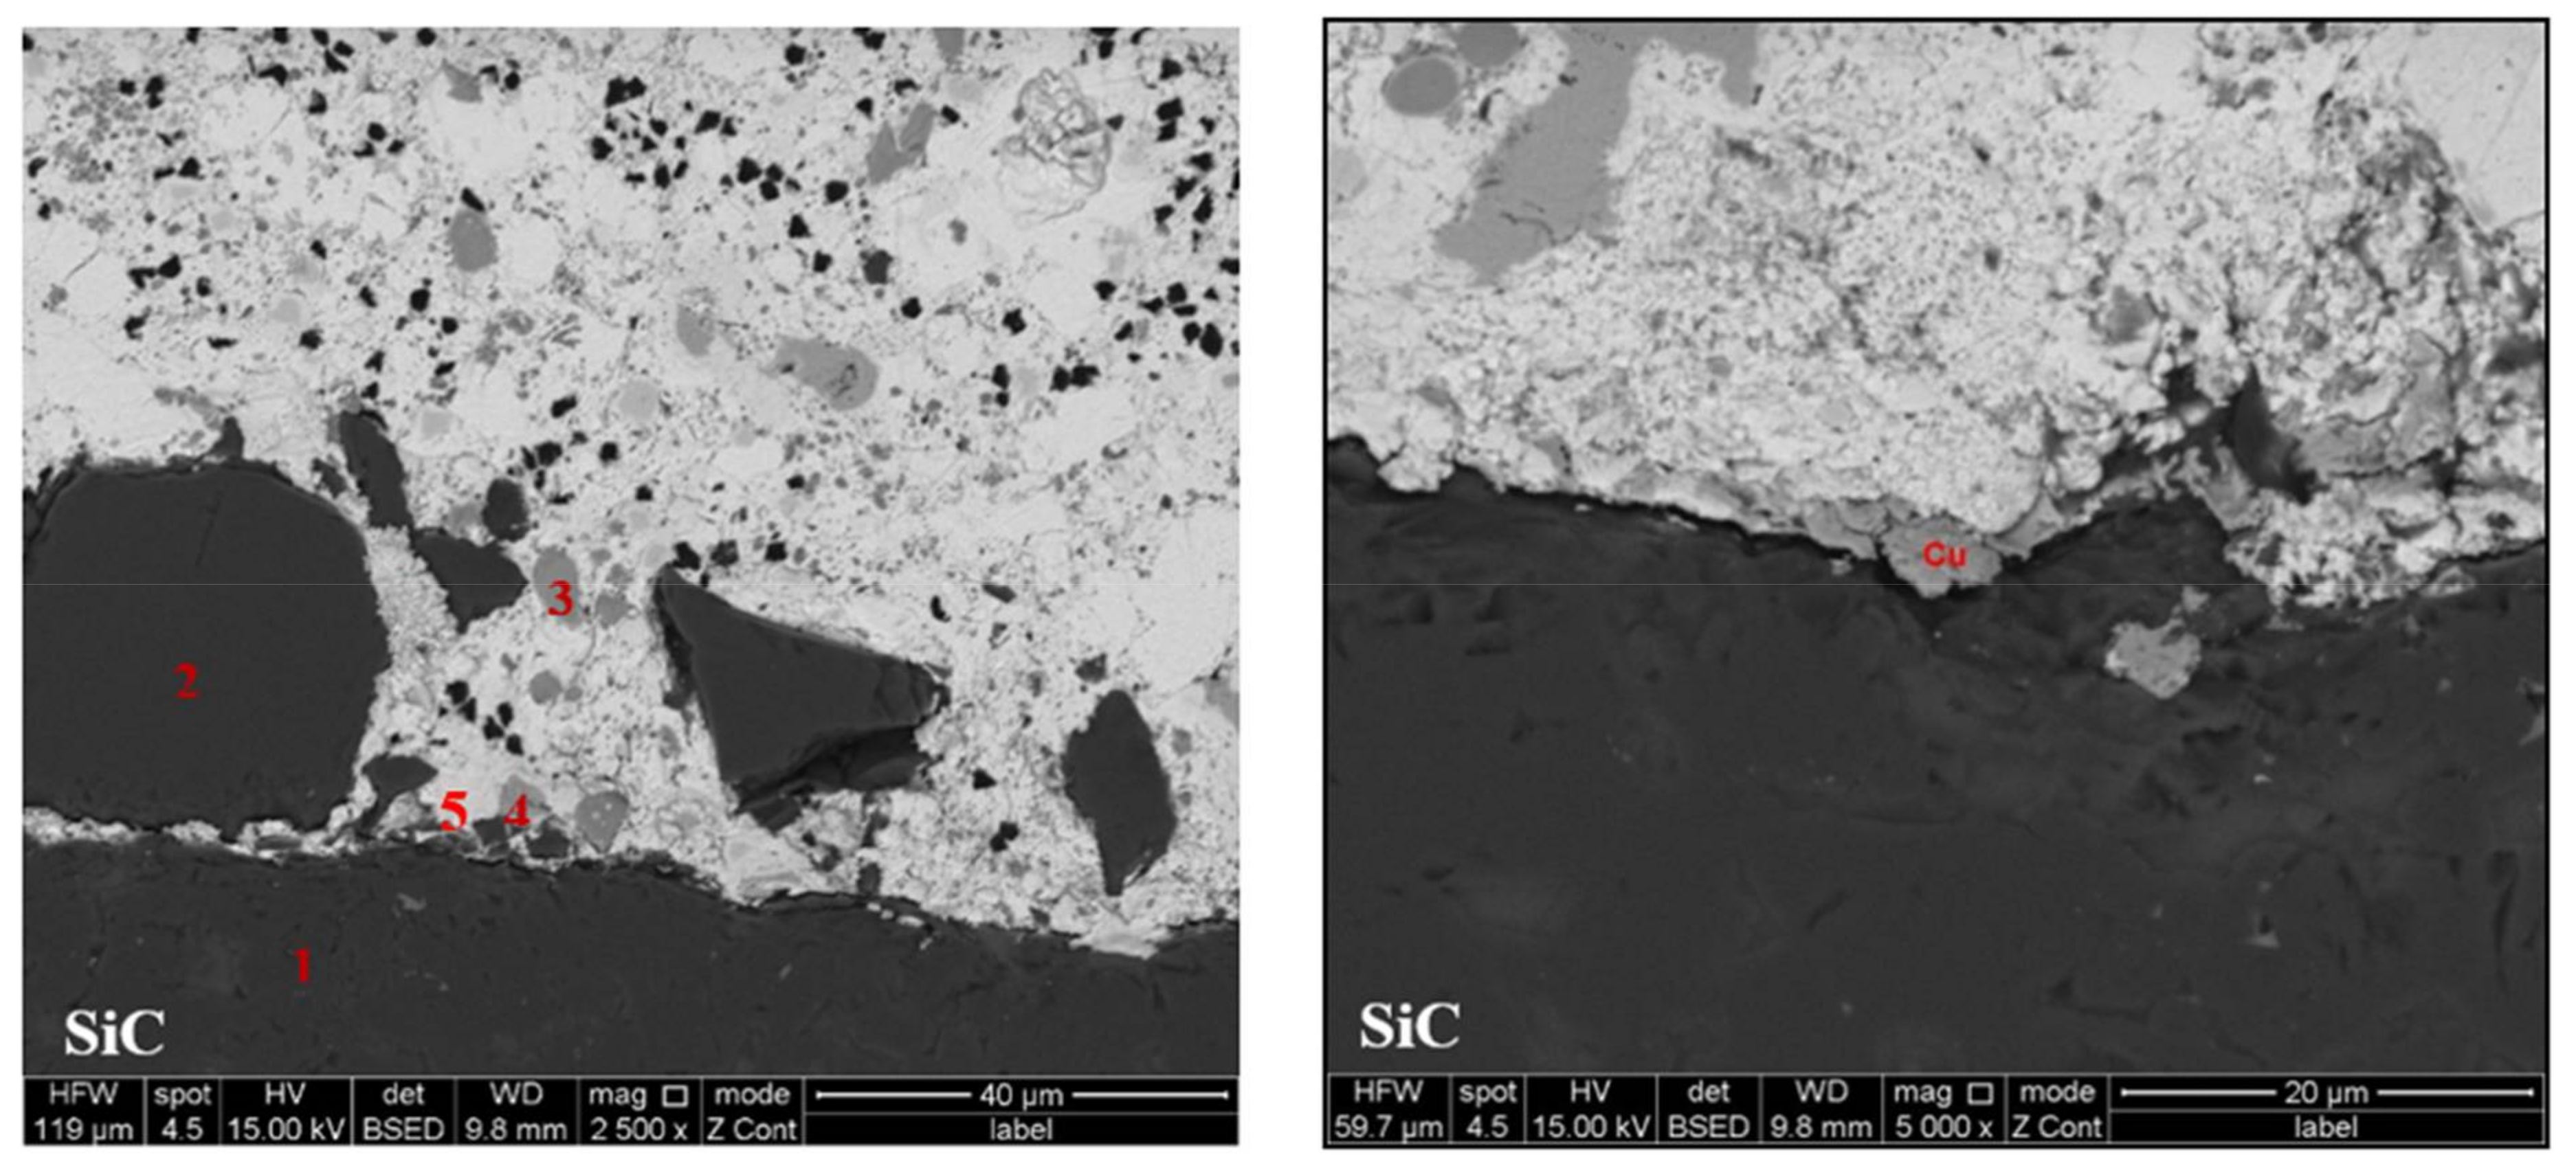
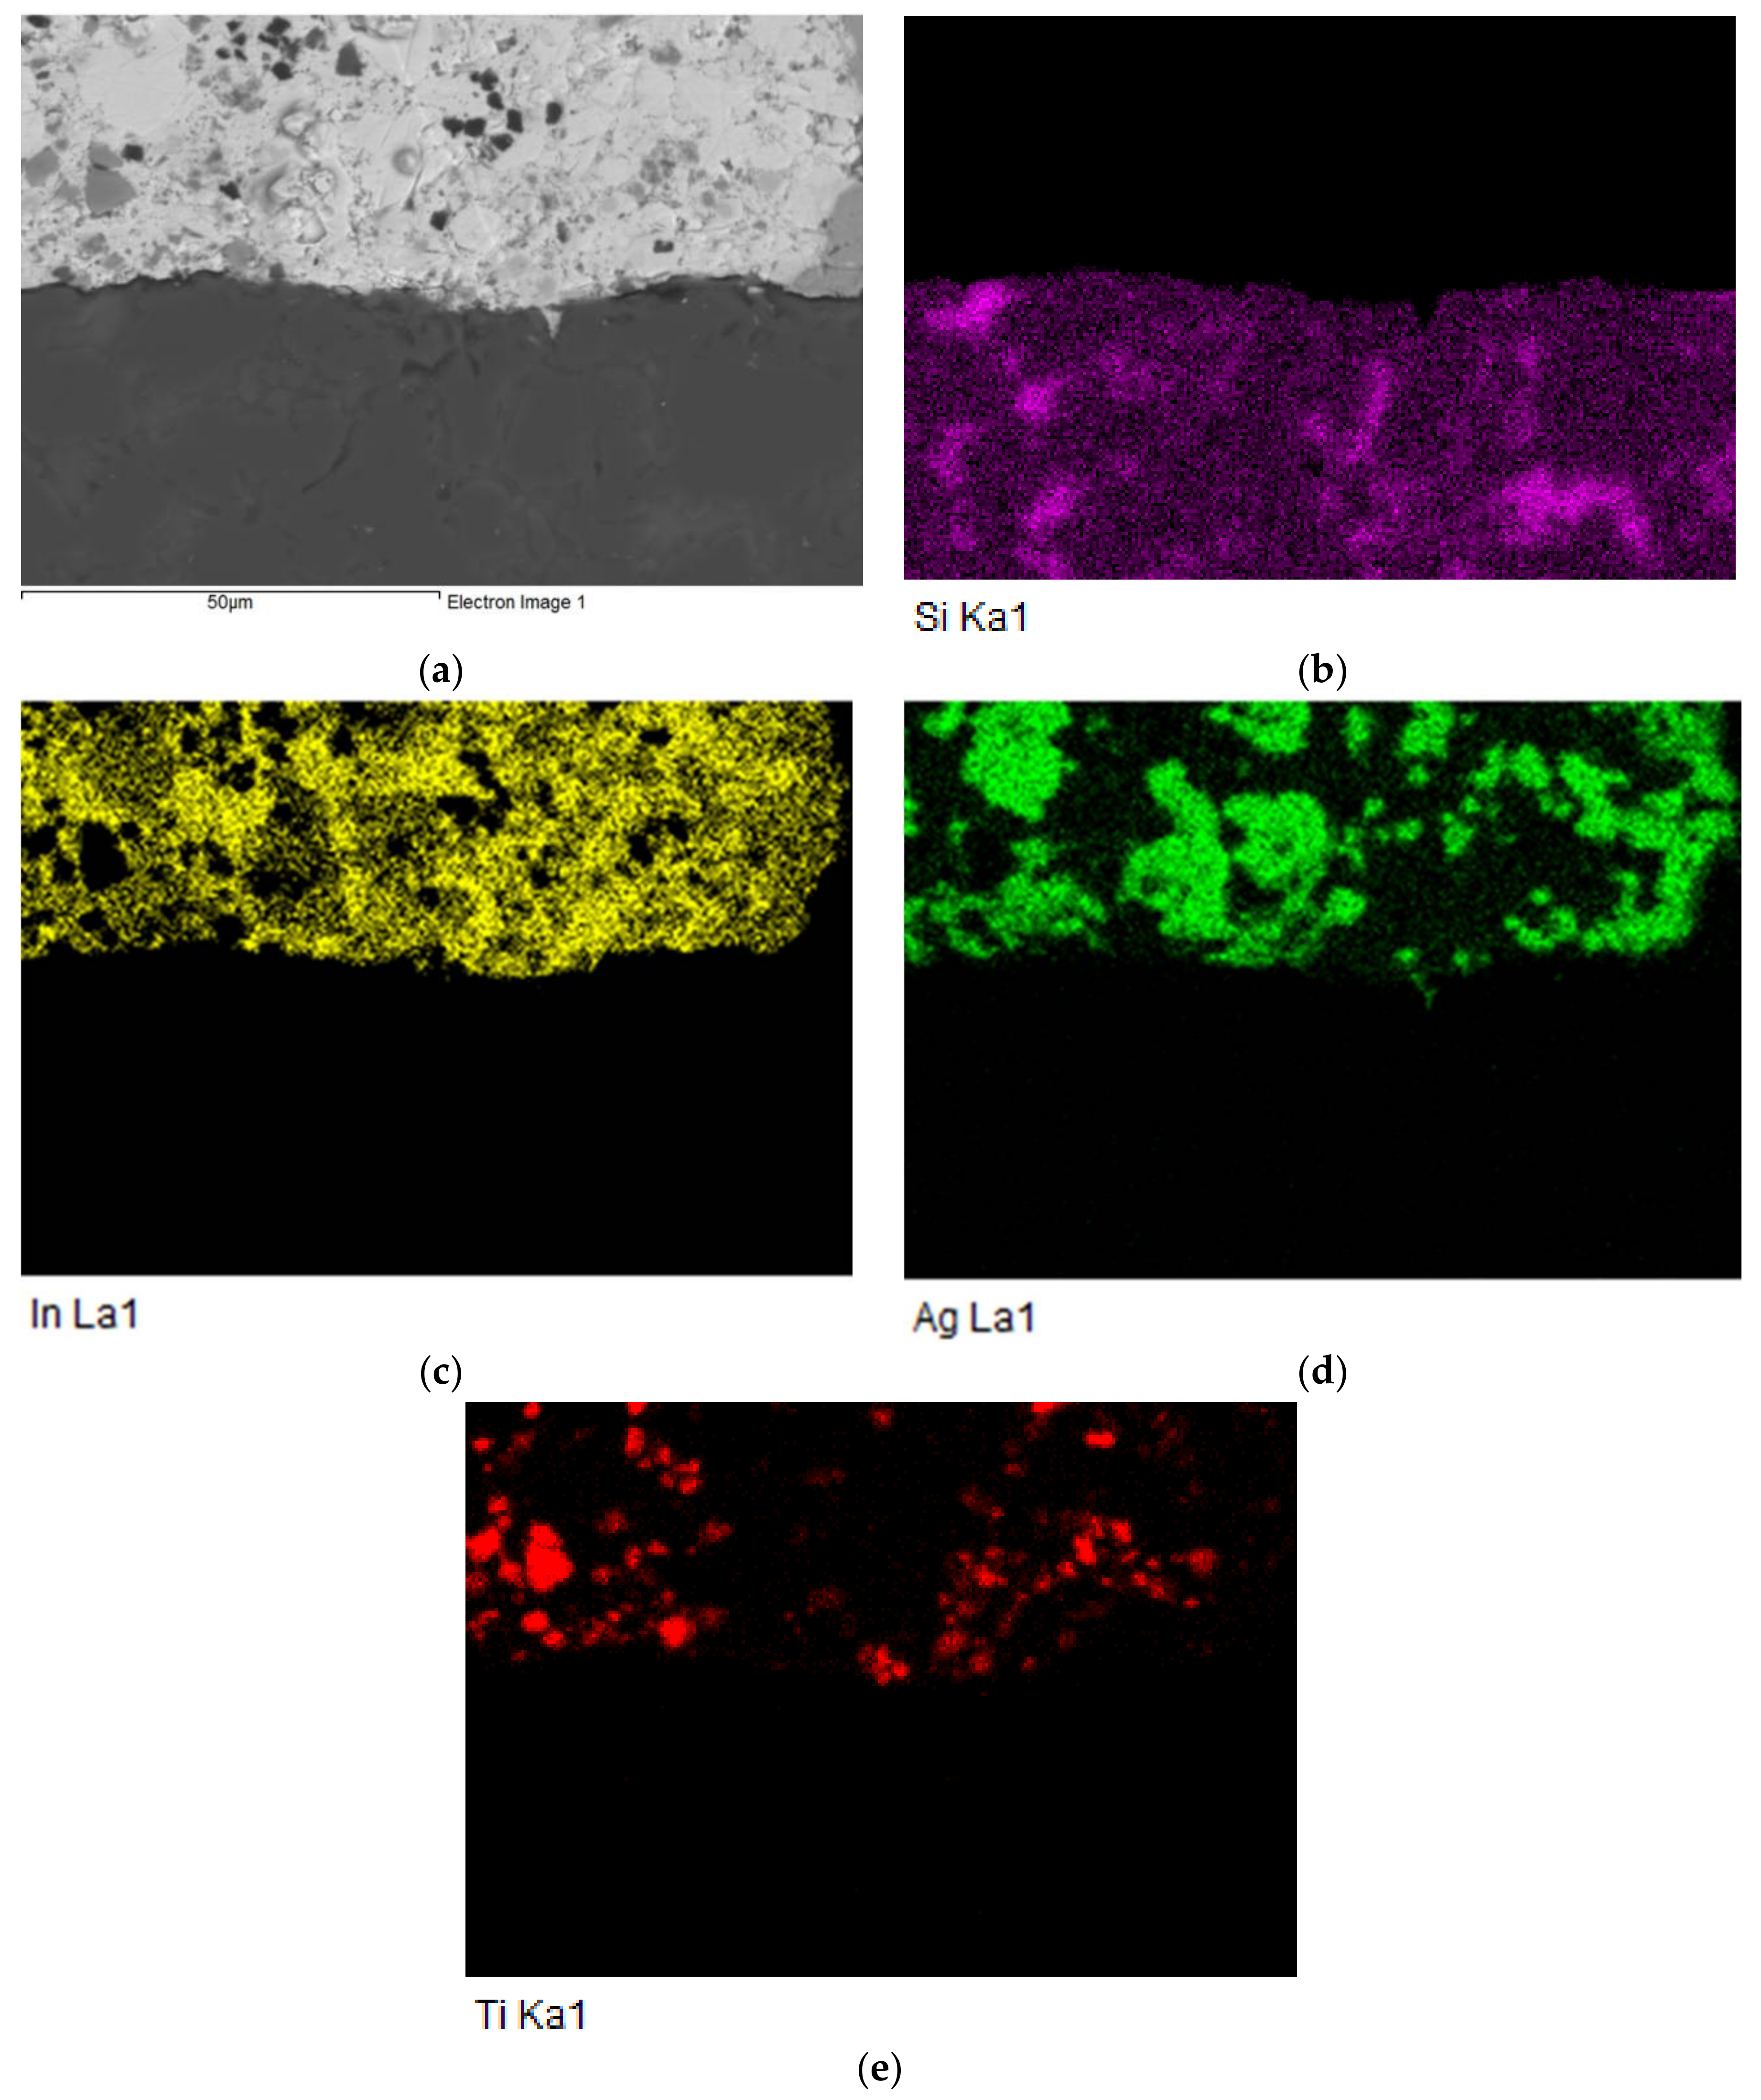
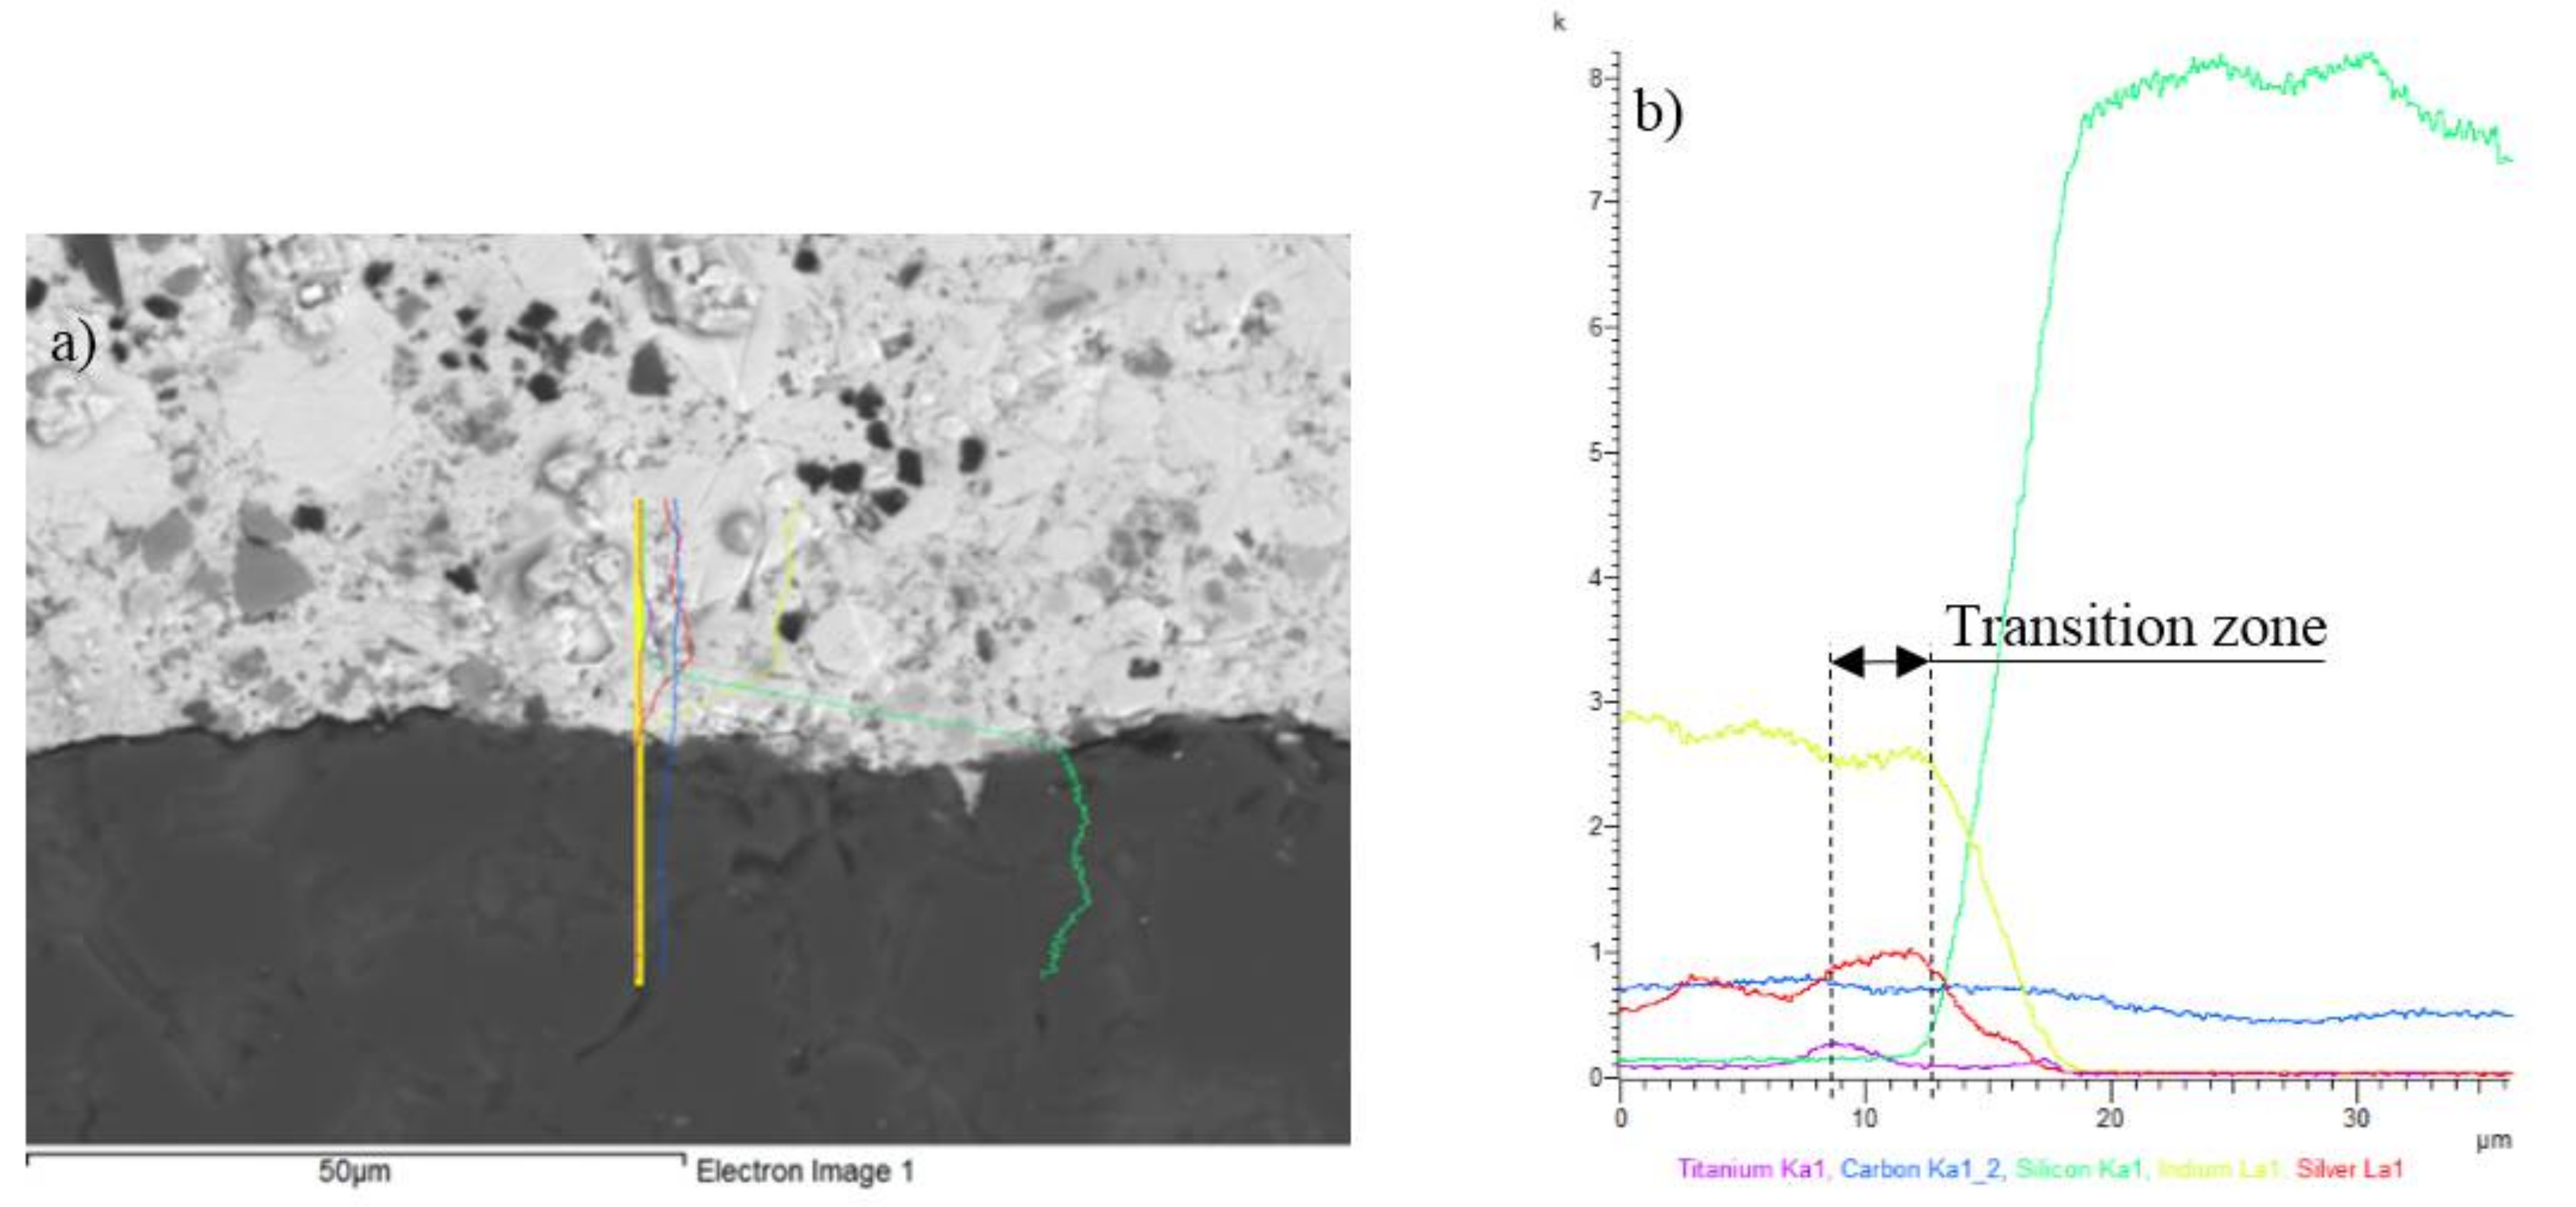
However, the connection of both materials was satisfactory and lacked formation pores or cracks at the joint interface. The EDX point analysis of the SiC-solder interface is shown in Figure 11 and Table 5. The planar distribution of elements is documented in Figure 12. From the planar distribution it is obvious that Ti is non-uniformly distributed across the entire solder volume, however, its local interaction cannot be excluded.
Bond formation is due to the interaction of indium with the surface of the SiC material: During the soldering process the indium particles are distributed to the interface of the SiC ceramics, due to the effect of ultrasonic activation, where they are combined with the silicon infiltrated in the SiC ceramics. The bond of indium with ceramics has an adhesive character, and does not form the new type Ti–C or Ti–Si contact phases.
Line analysis and concentration profiles of elements Ti and In (Figure 13) prove that Ti is not segregated in the interface of the ceramic SiC material, but that a significant effect is exerted one bond formation by indium.
3.4. Analysis of the Transition Zone in Cu–In10Ag4Ti Joint
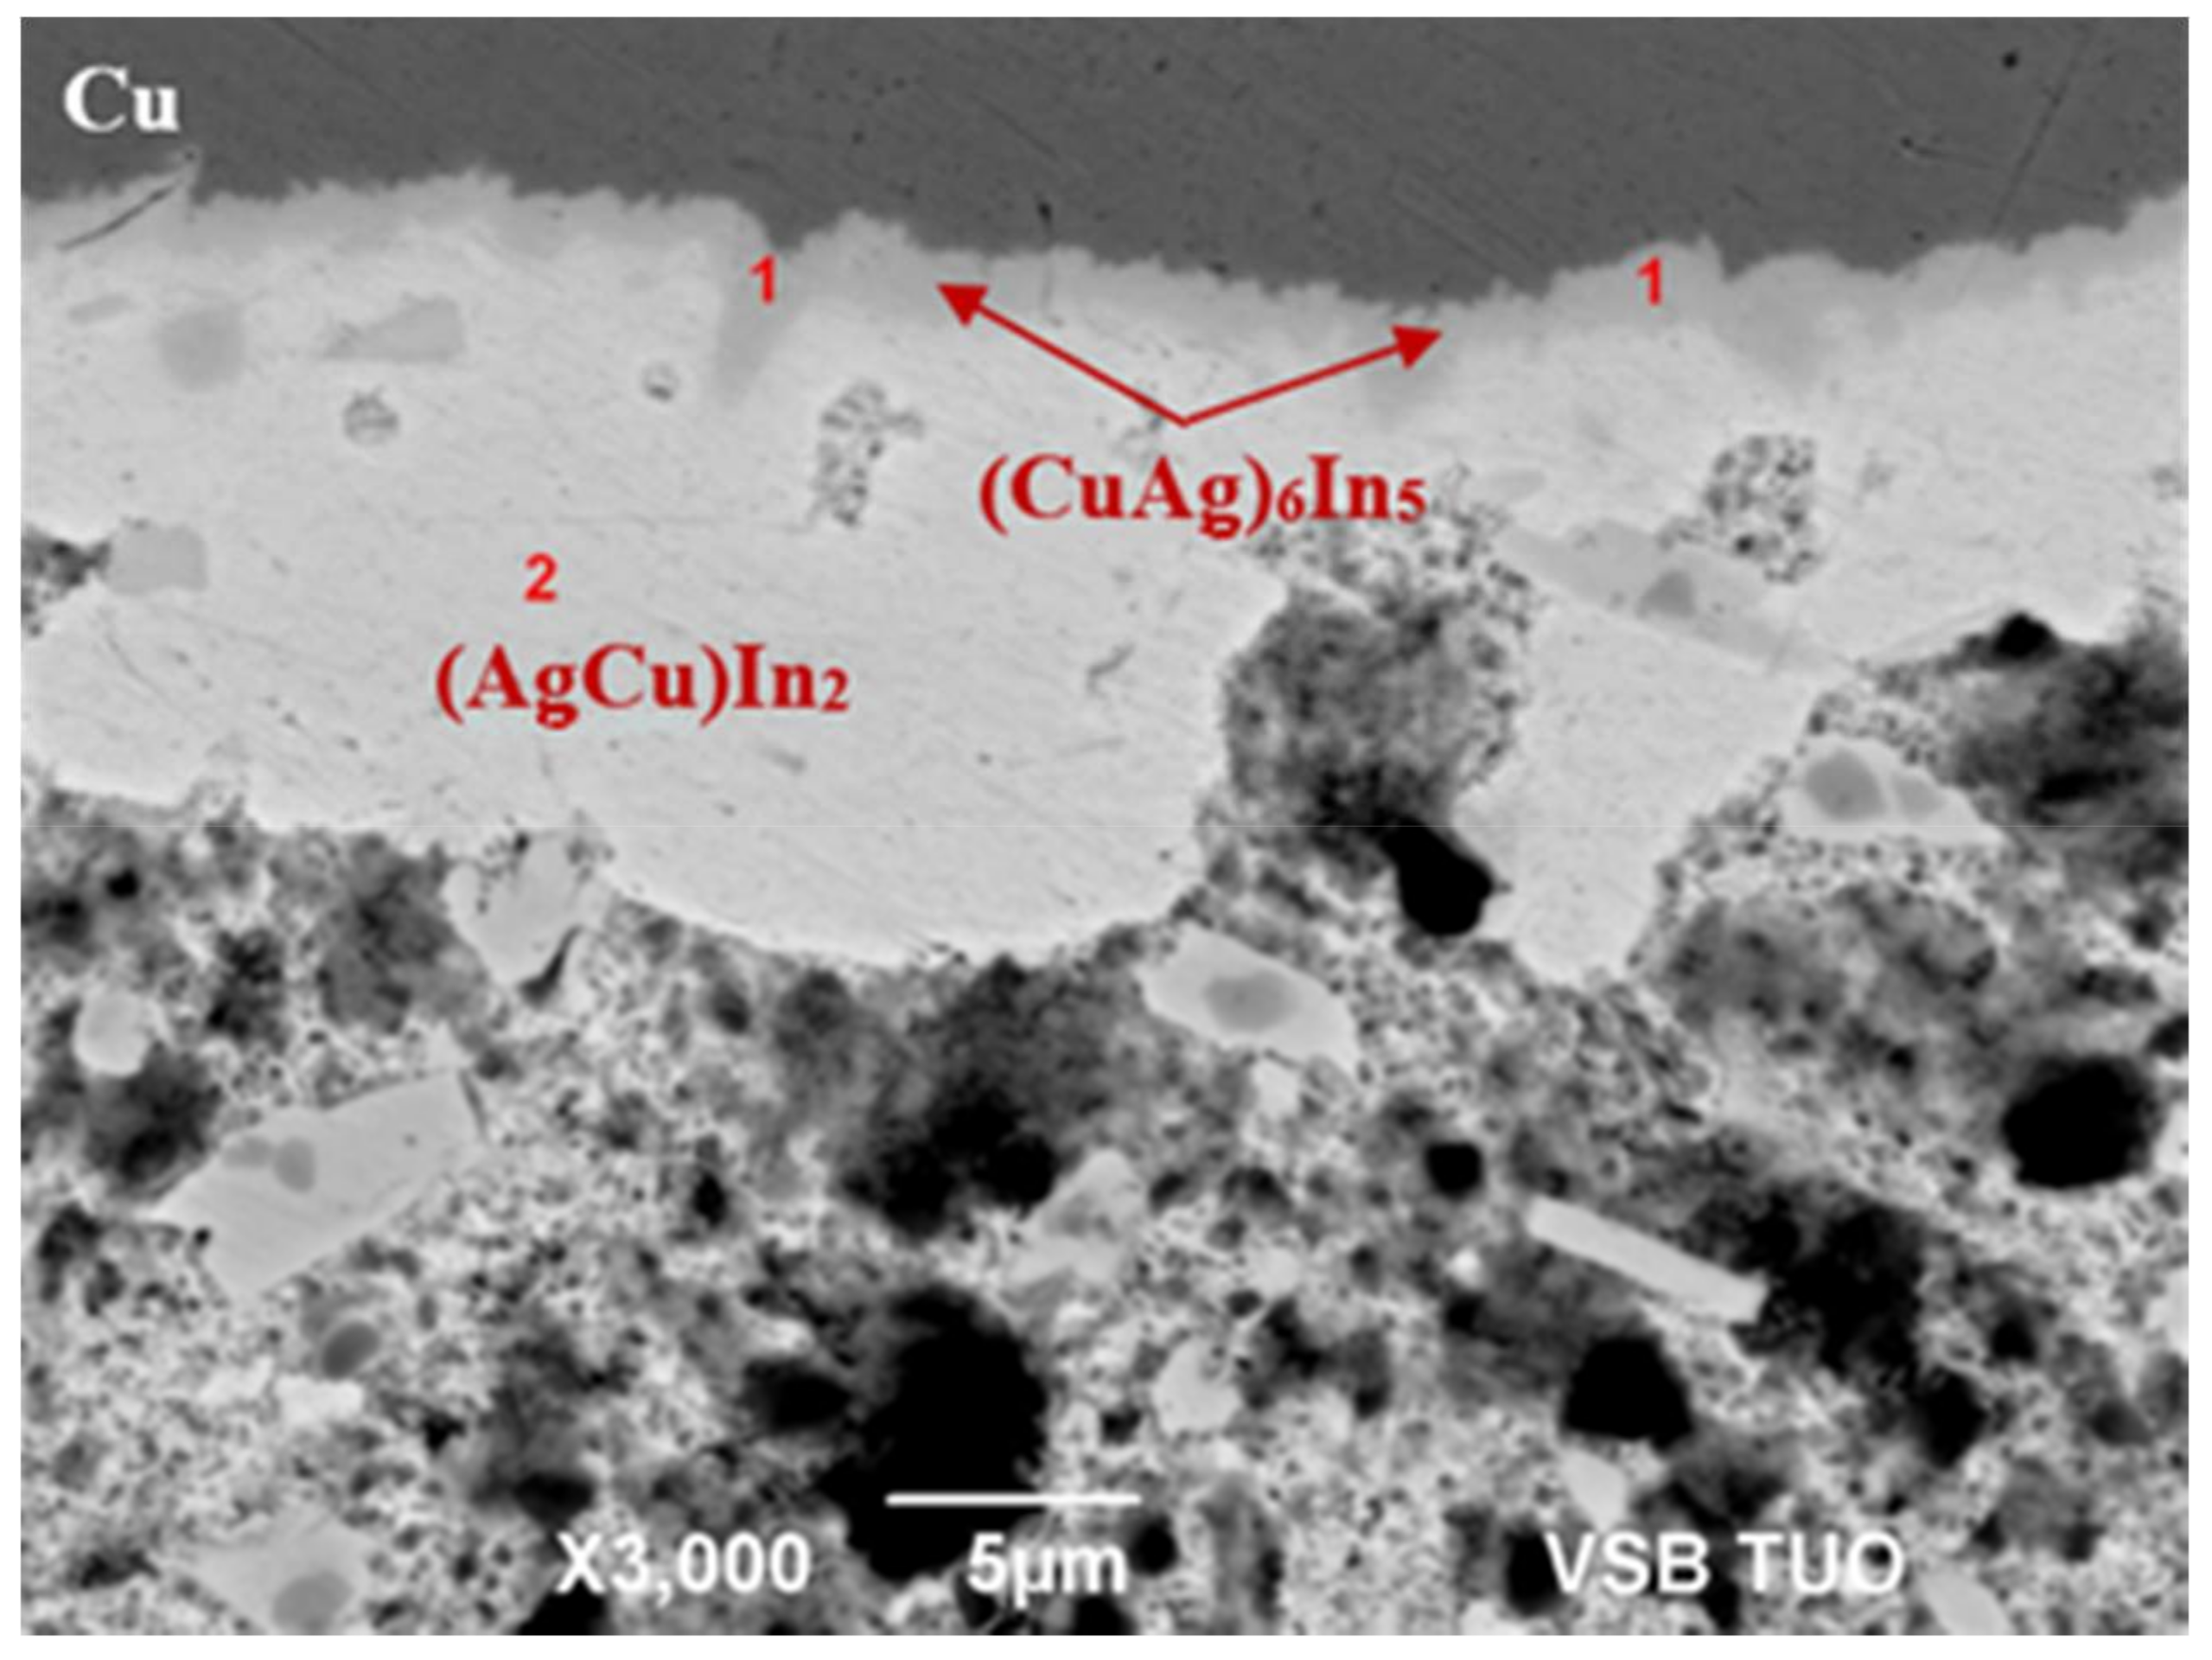
Analysis primarily focused on the transition zone of the joint. Two intermetallic phases, (CuAg)6In5 and (AgCu)In2, were analyzed in the interface of the Cu–In10Ag4Ti joint; the phases were the result of an interaction between the indium solder and copper substrate. The effect of the active Ti element on bond formation with the copper substrate was negligible.
The (CuAg)6In5 phase was narrow, with a thickness of approximately 1 µm, this was more similar to copper and had a higher Cu content when compared to Ag. The (CuAg)6In5 phase, shown in Figure 14, corresponded to the composition at the point of Spectrum 1. The (AgCu)In2 phase was closer to the solder and had a higher silver content (approximately 23 wt %), when compared to copper (approximately 7 wt %); it was wettable by the solder. The (AgCu)In2 phase was relatively heavy with a thickness of up to 13 µm. It corresponded to the composition at the measured point in Spectrum 2, see Table 6.
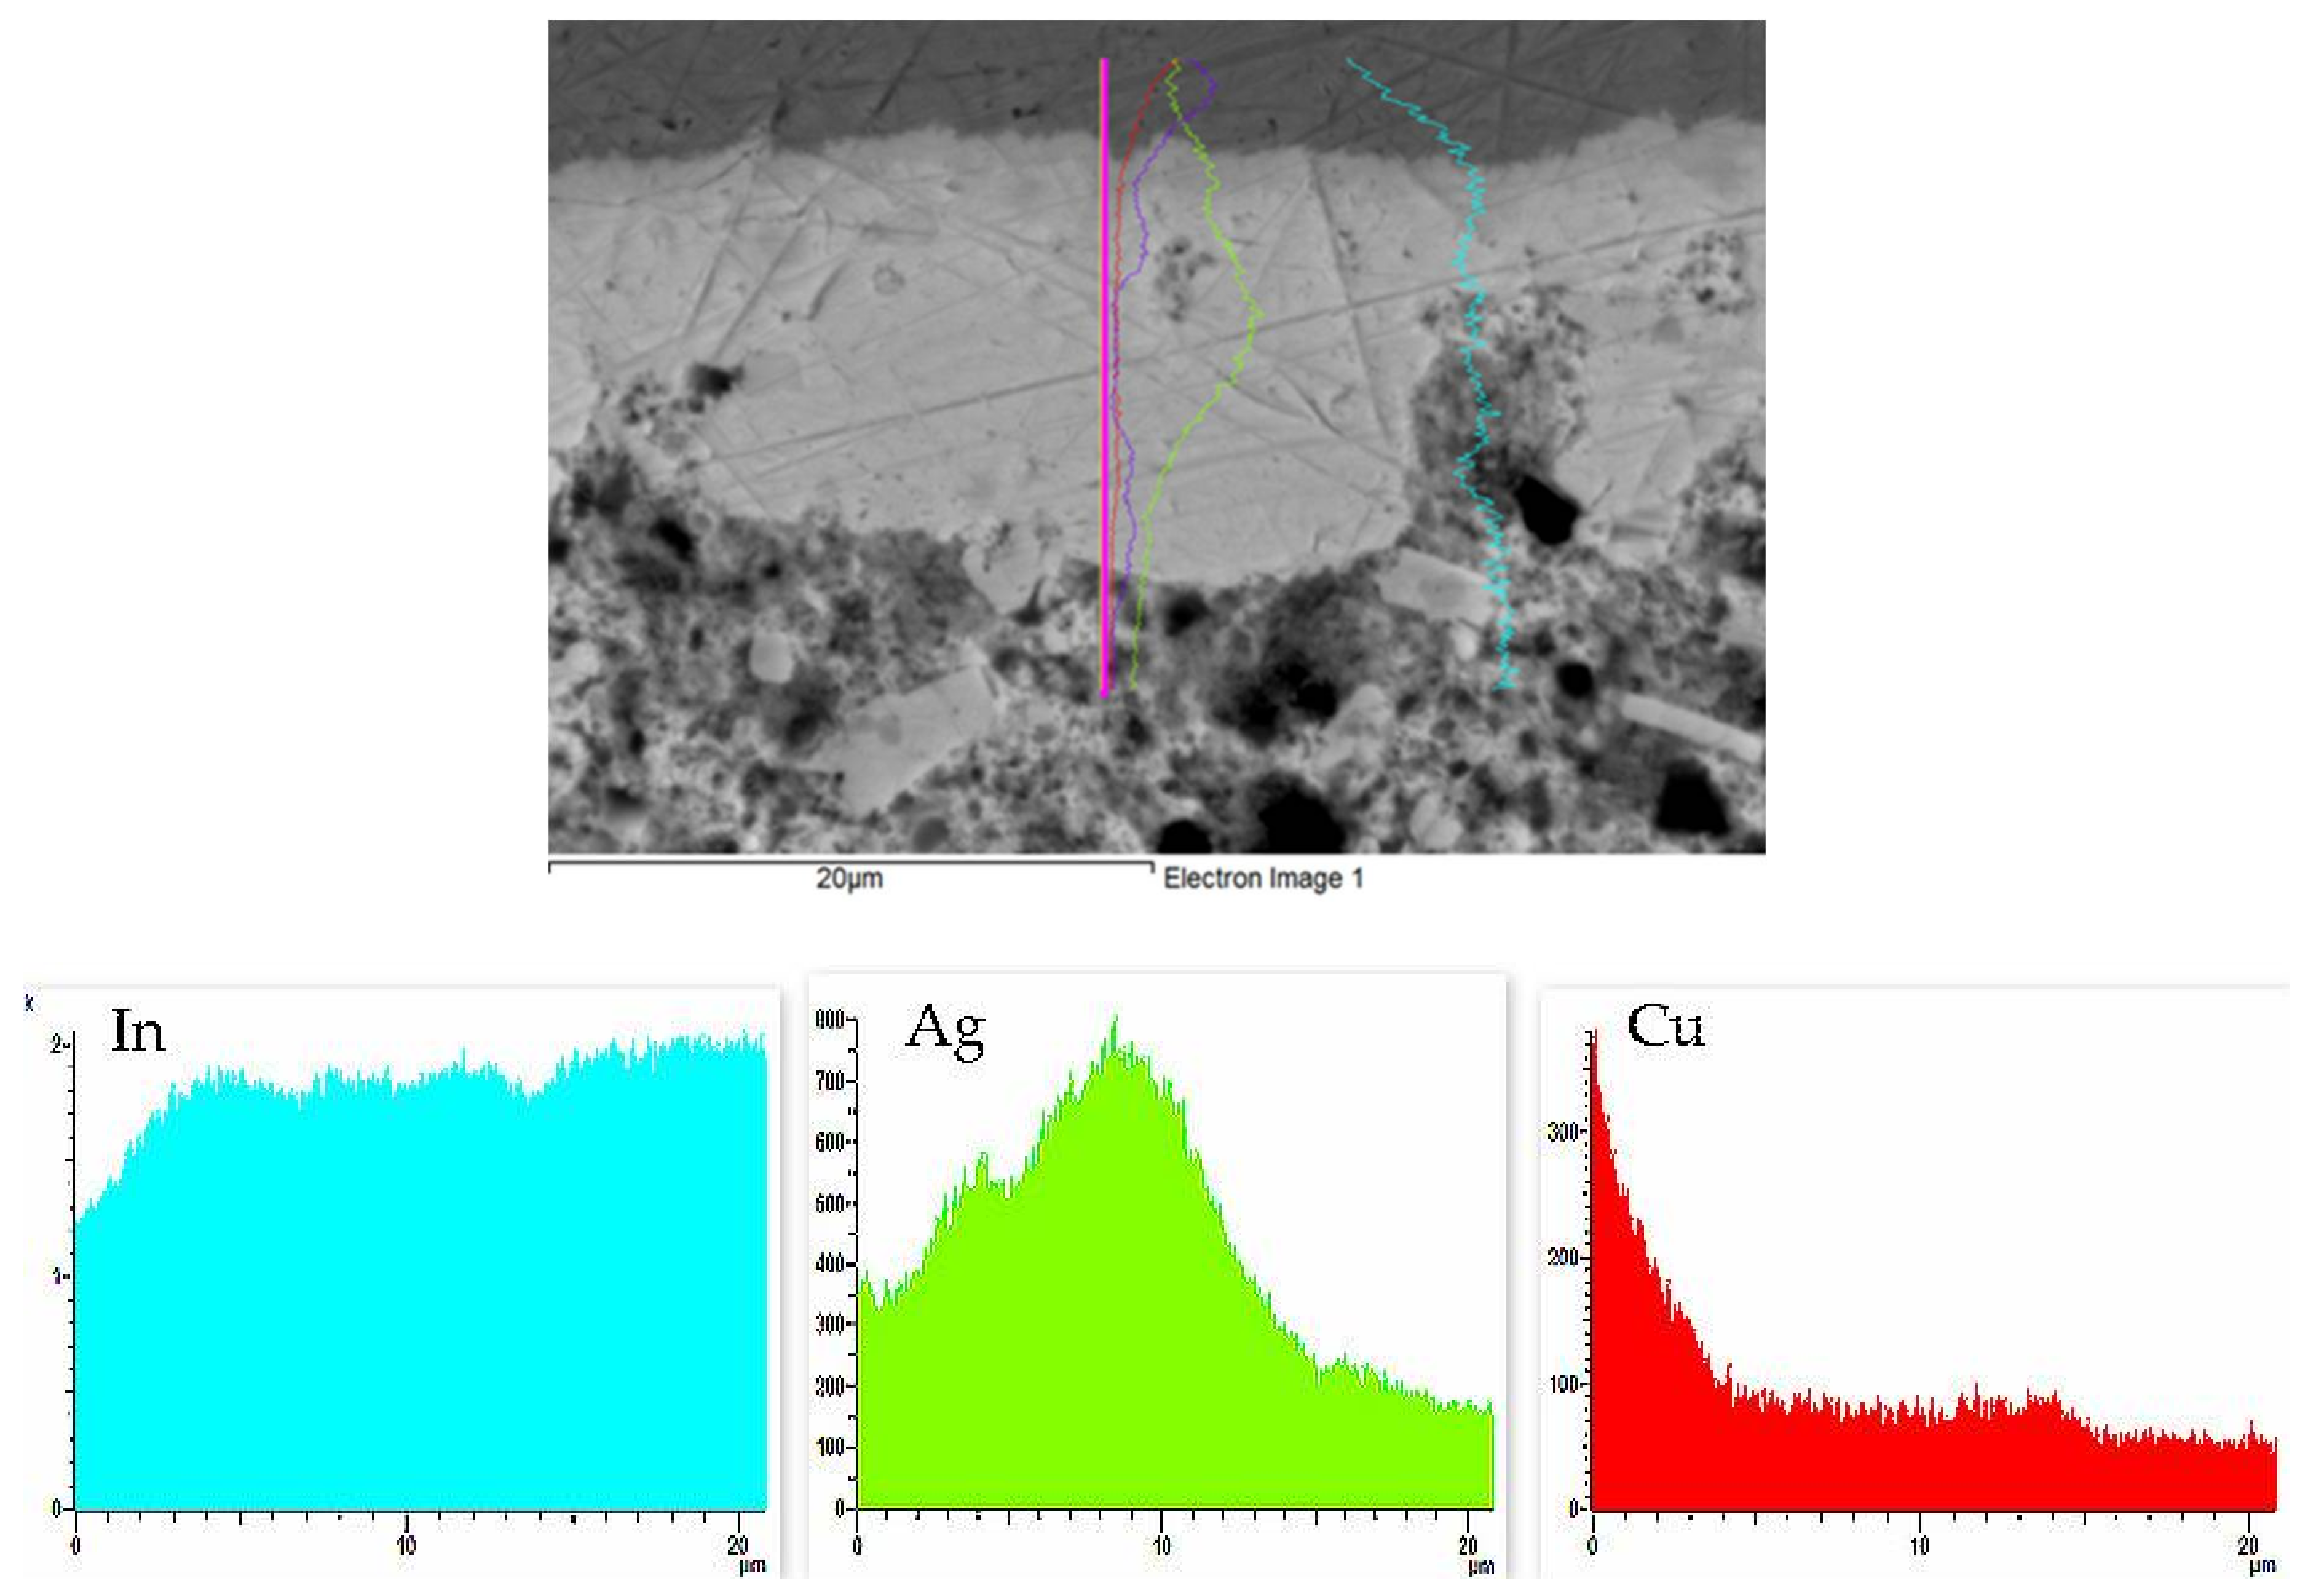
The results of the EDX point analysis were proven by the course of concentration profiles of In, Ag, and Cu elements in Figure 15. An increase in concentration of Ag can also be observed. This relates to the formation of IMC (AgCu)In2, which contains up to 23 wt % Ag.
3.5. Shear Strength of Soldered Joints
This study was primarily oriented toward the soldering of SiC ceramics with copper substrate. Owing to the potential application and further use of active In10Ag4Ti solder in industrial practice, the testing of shear strength was also extended to other metals (Cu, Ag, Ni, Al, and stainless steel type AISI 316) and ceramics (Si3N4, Al2O3, ZrO2, and AlN).
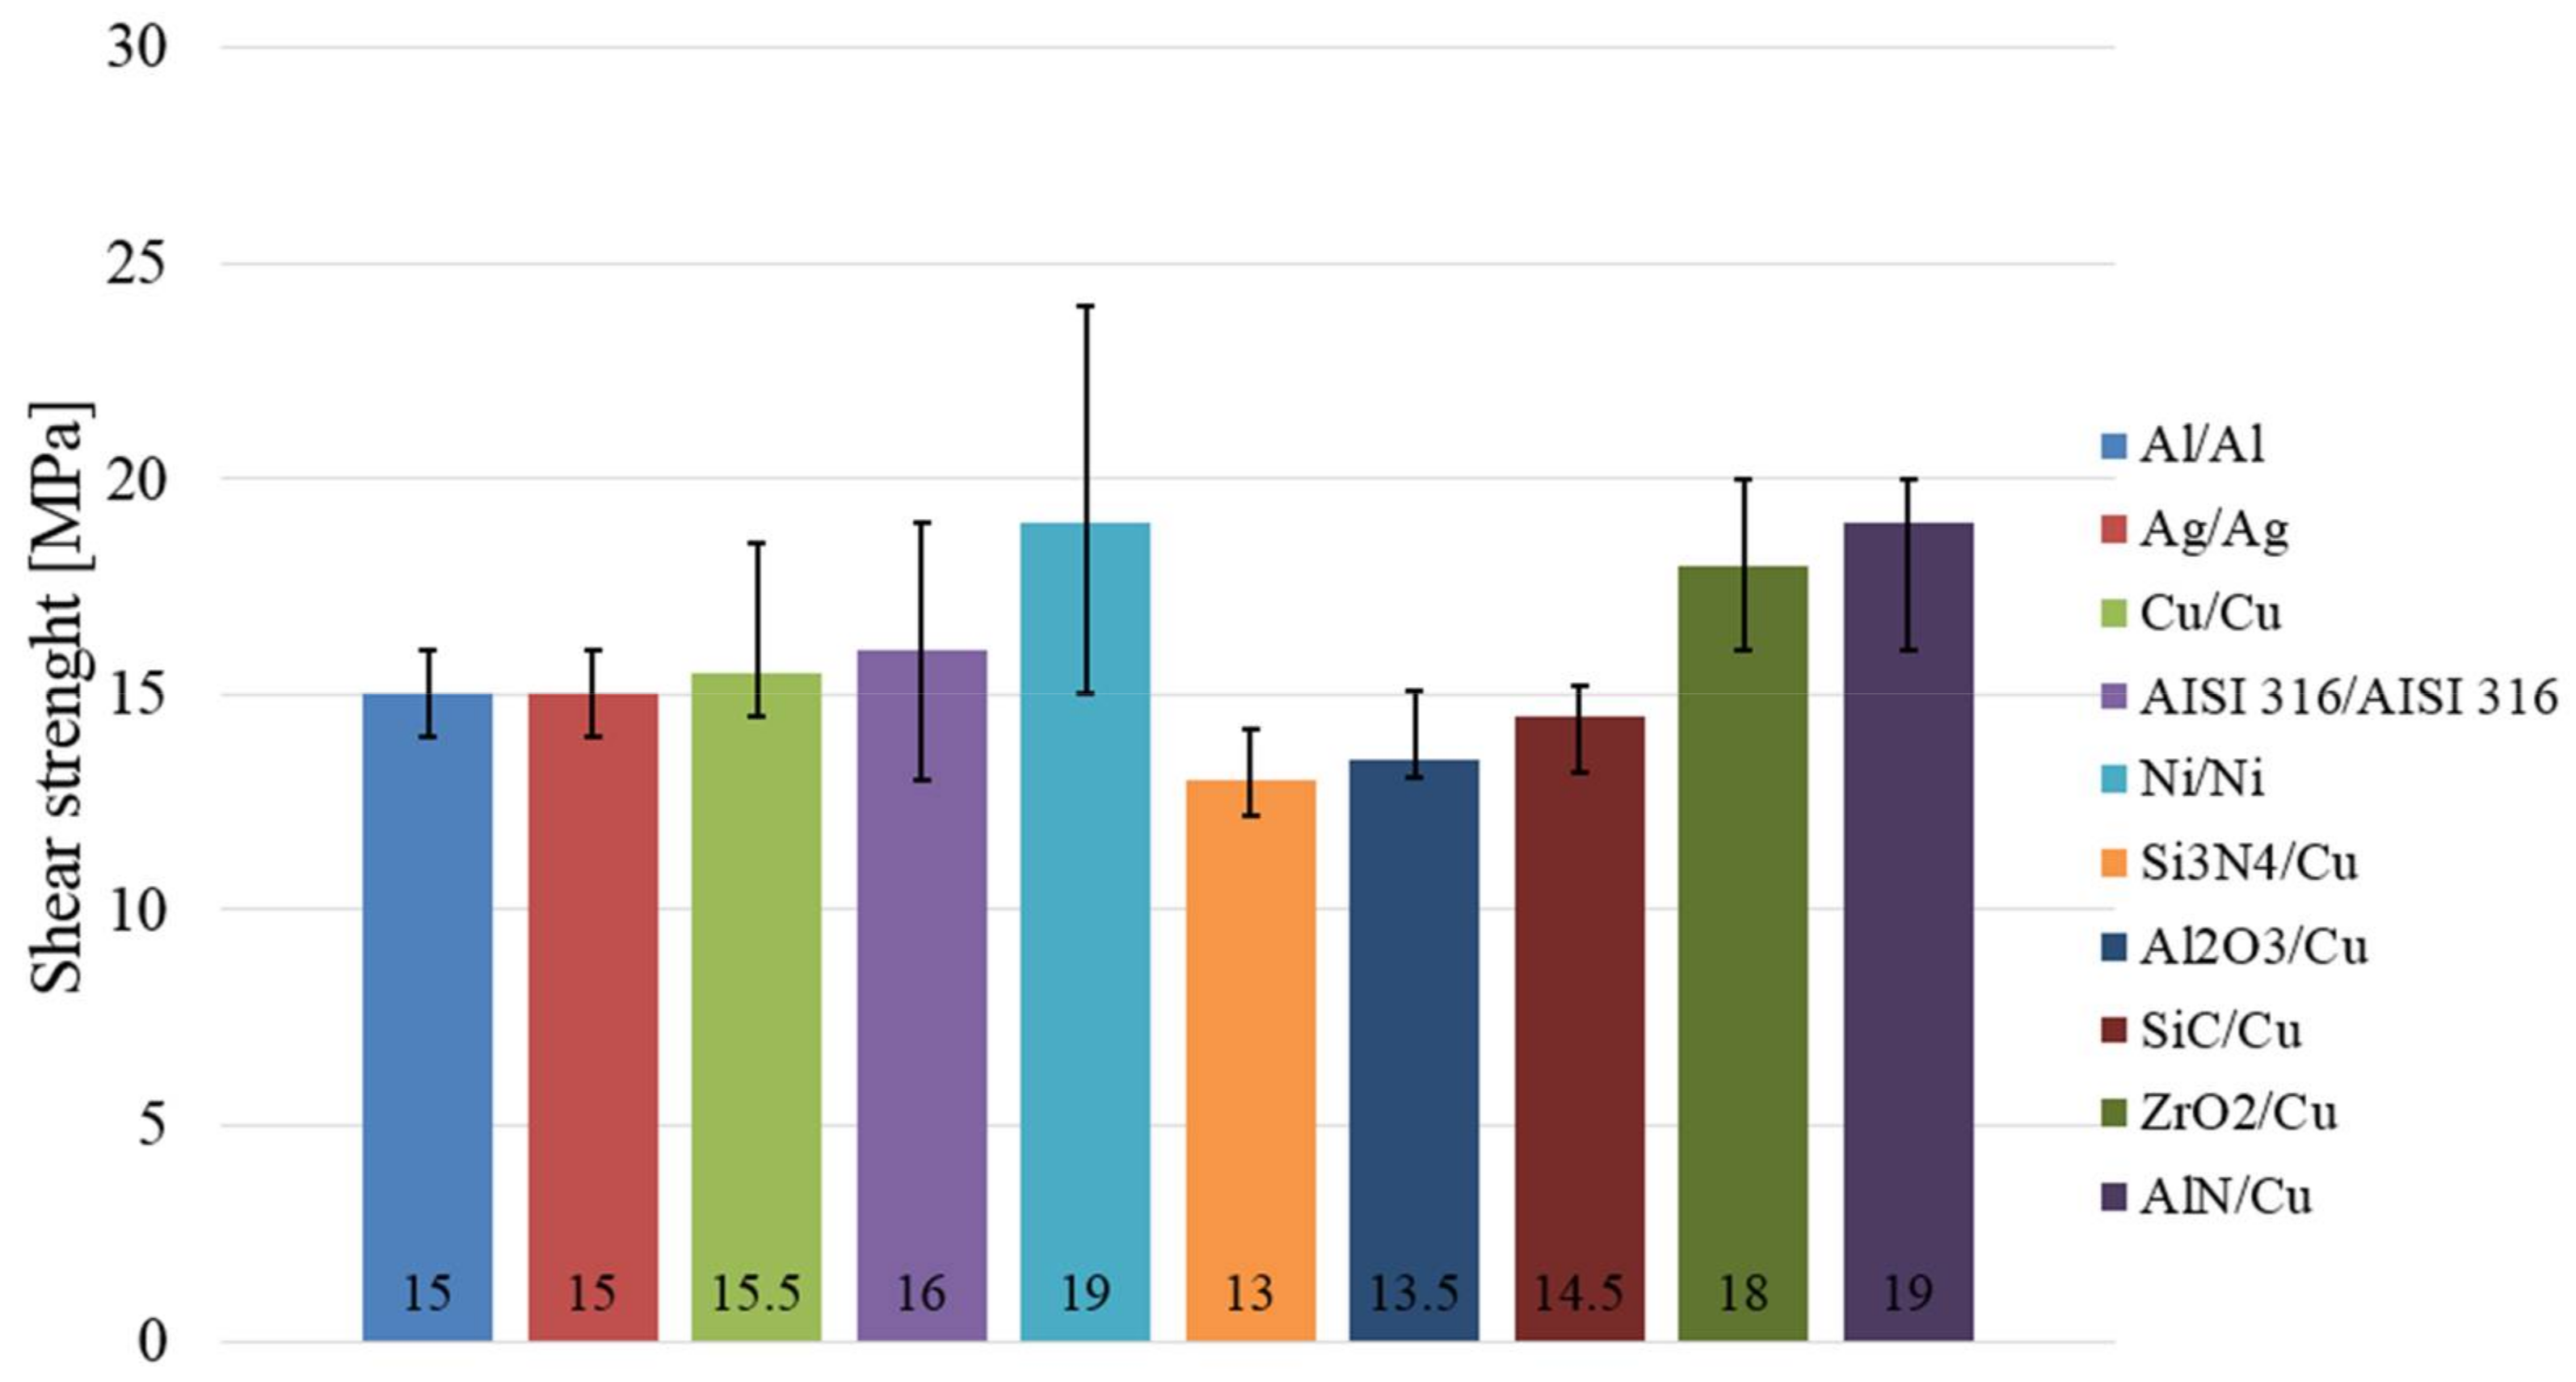
The ceramics were always tested in combination with a copper substrate. The metals were mutually tested as Cu–Cu, Ag–Ag, etc. Measurements were performed with 3 specimens of each material. The results of the average shear strength testing are documented in Figure 16. Marked deviations represent the minimum and maximum values measured.
The greatest shear strength of the ceramic-metal combinations, 19 MPa, was observed in the AlN–Cu joint. A similar strength of 18 MPa was observed in the ZrO2–Cu joint. Other material combinations, such as SiC–Cu, Si3N4–Cu, and Al2O3–Cu, demonstrated comparable average shear strengths ranging between 13 and 13.5 MPa. Of the metals, the greatest average shear strength was observed in the joint of two metallic Ni materials—19 MPa.
However, this metal also exerted the highest scatter of measurements, between 14 and 24 MPa. Metals Al, Ag, Cu, and AISI 316 displayed average shear strengths between 15 and 16 MPa.
From these results it can be concluded that the strength of ceramic-metal joints, in the case of In10Ag4Ti solder, is comparable to that of metal-metal joints. This is caused by the excellent wettability of indium on ceramic materials in conjunction with ultrasonic activation.
3.6. Analysis of Fractured Surfaces
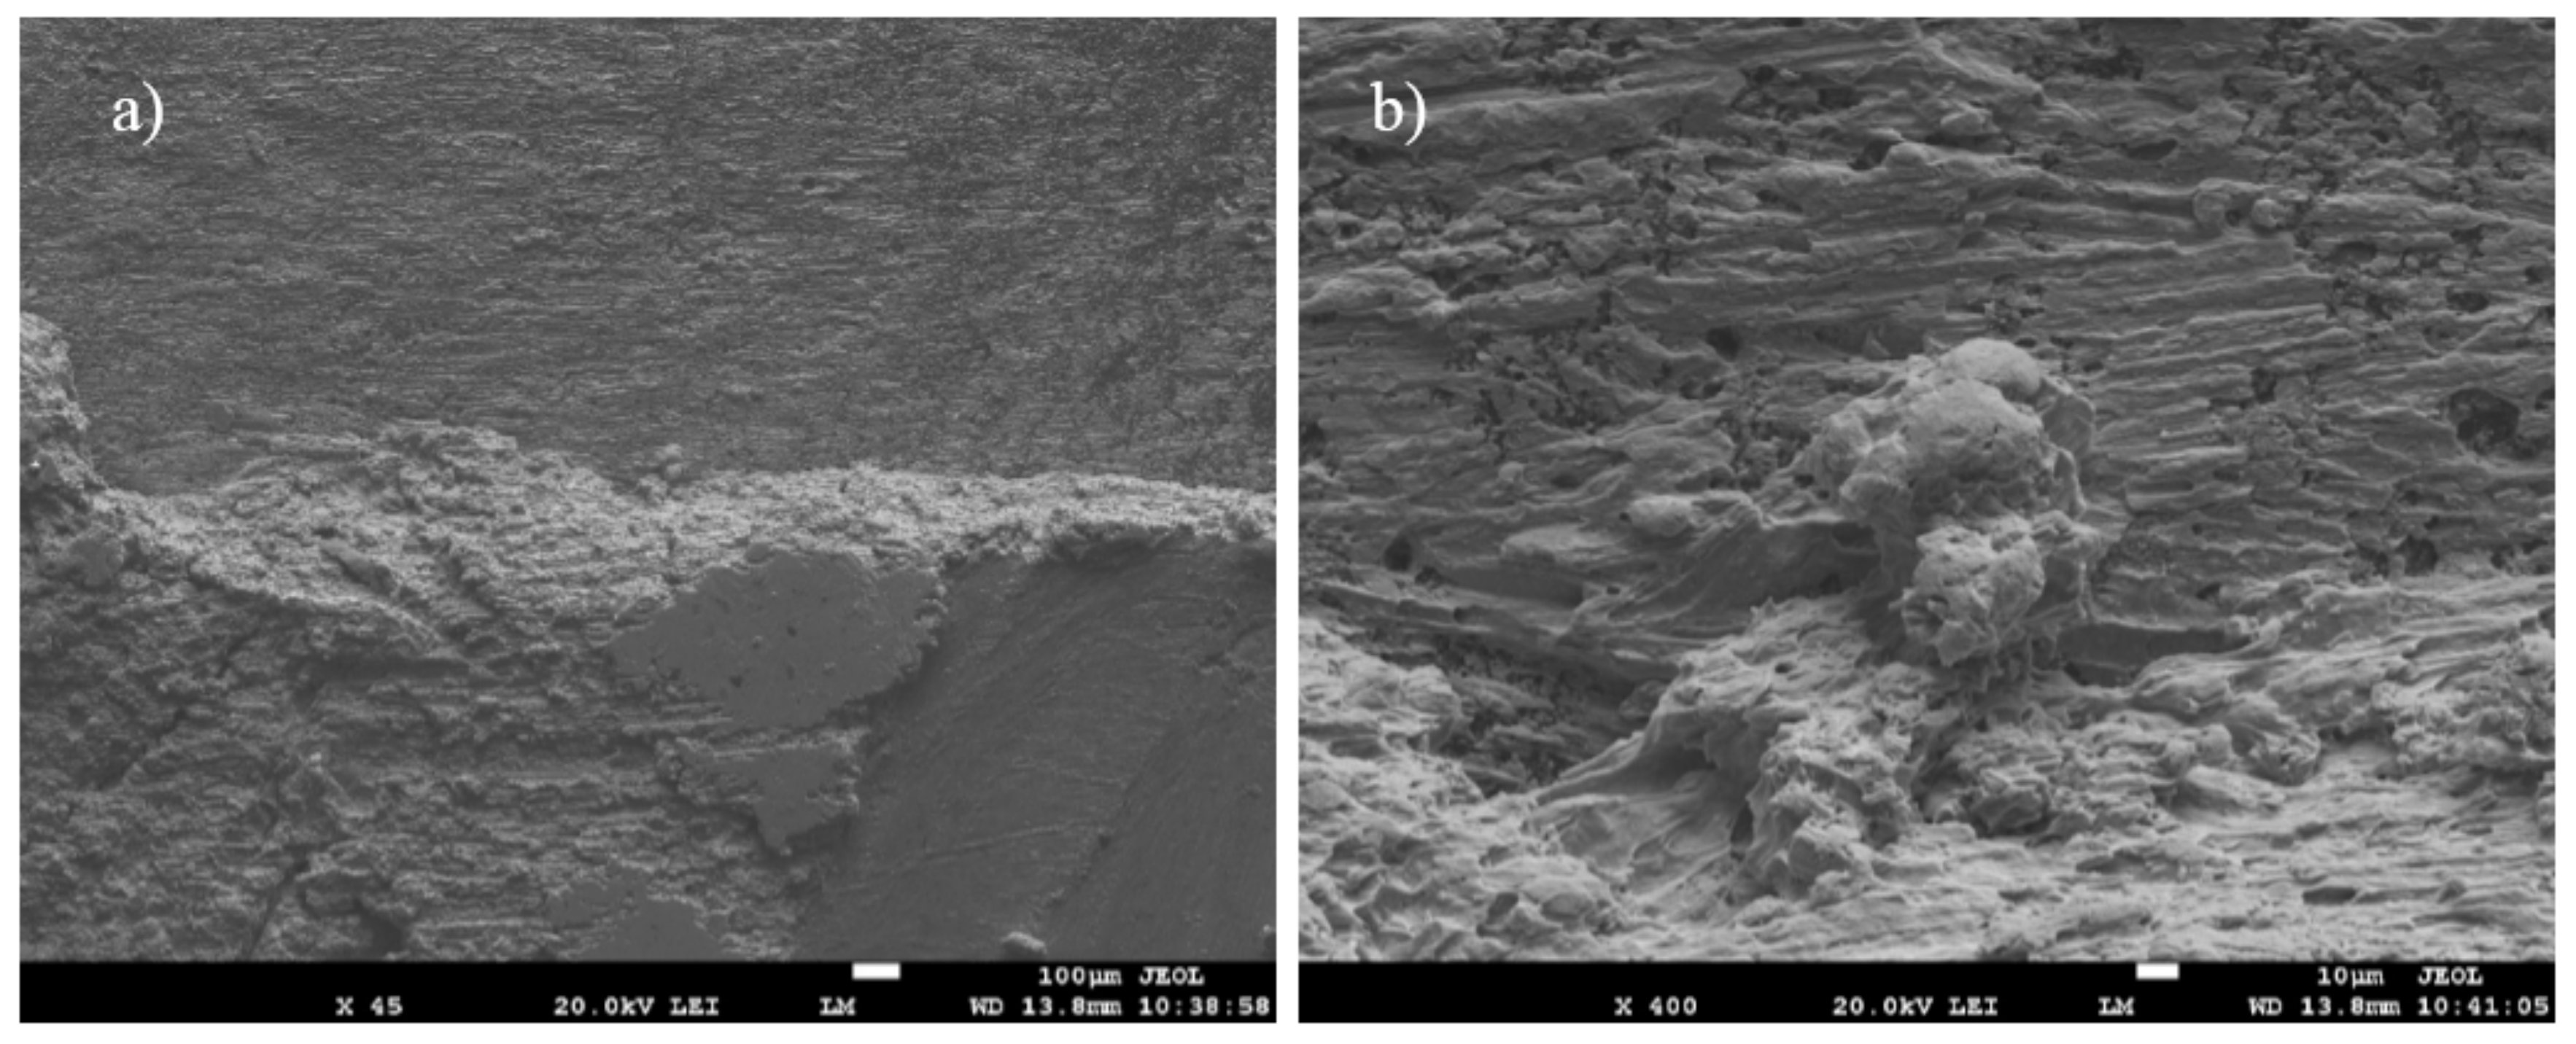
The fractured surfaces of joints were analyzed for more exact identification of the bond formation mechanism. Figure 17a,b shows the fractured surface at the interface of a SiC–In10Ag4Ti–Cu joint.
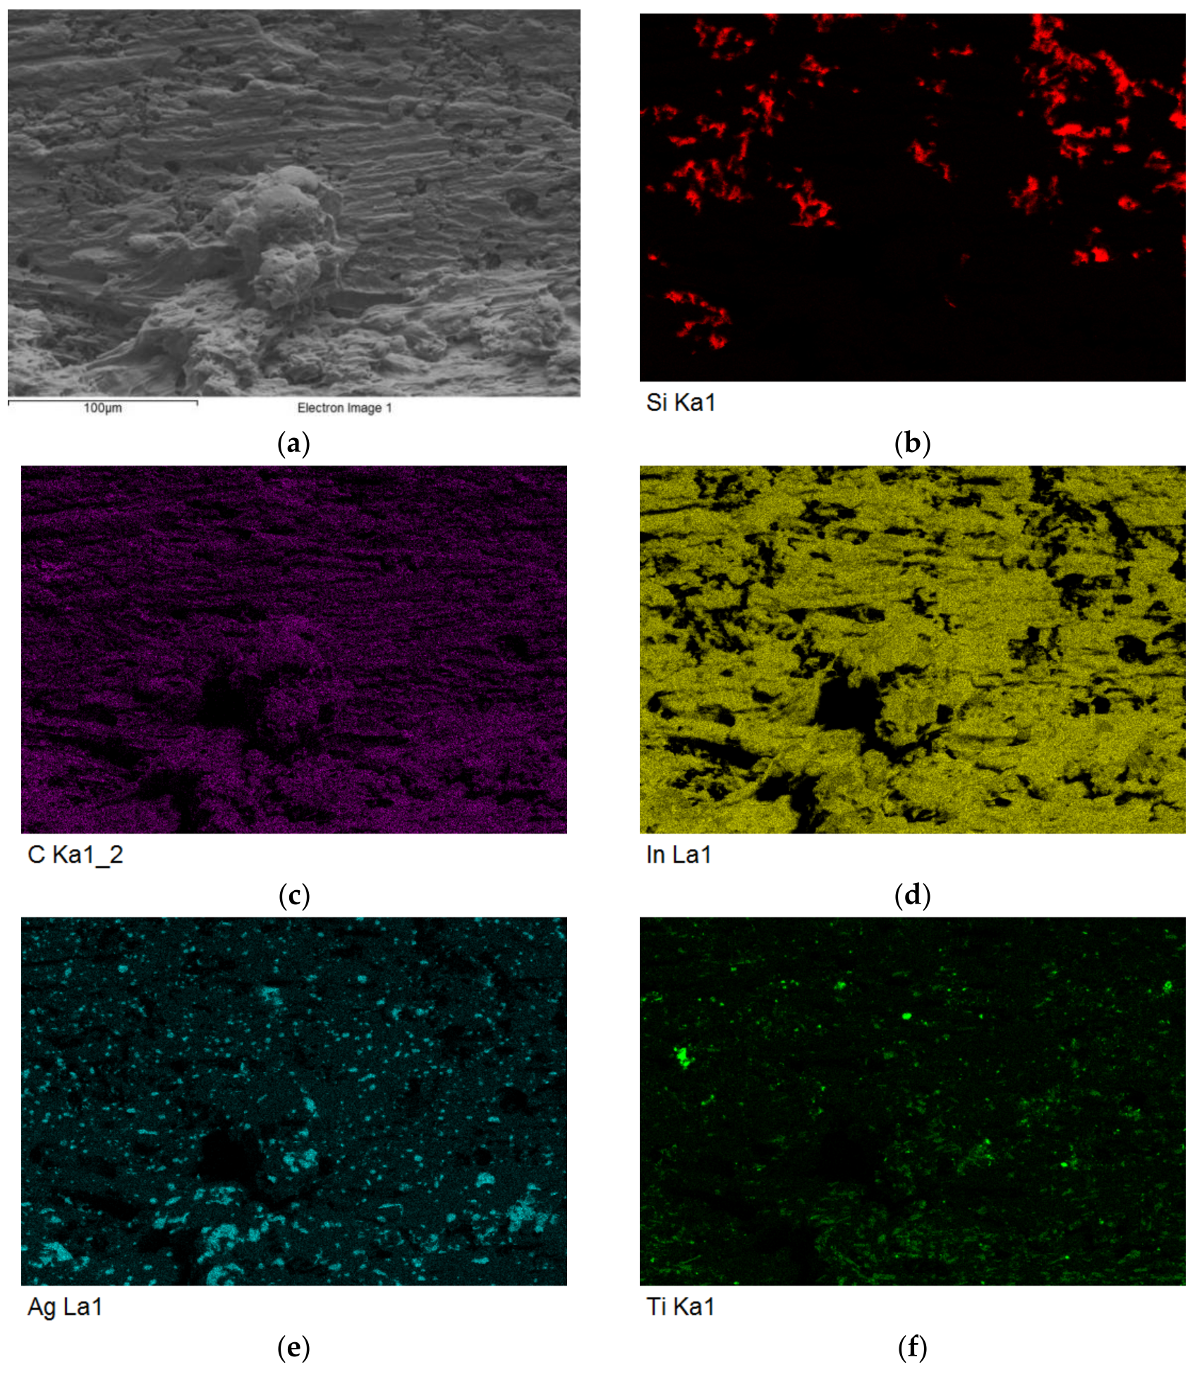
The fractured surface, on the side containing SiC ceramics, remained completely covered with solder. A ductile fracture occurred within the solder. An analysis of the planar distribution of Si, C, In, Ag, and Ti elements was carried out on the fractured surface, as is documented in Figure 18b–f. Regarding the planar distribution of Si, which represents the SiC ceramics in Figure 18b, local spots may be observed, caused by ripping out of solder from the substrate surface.
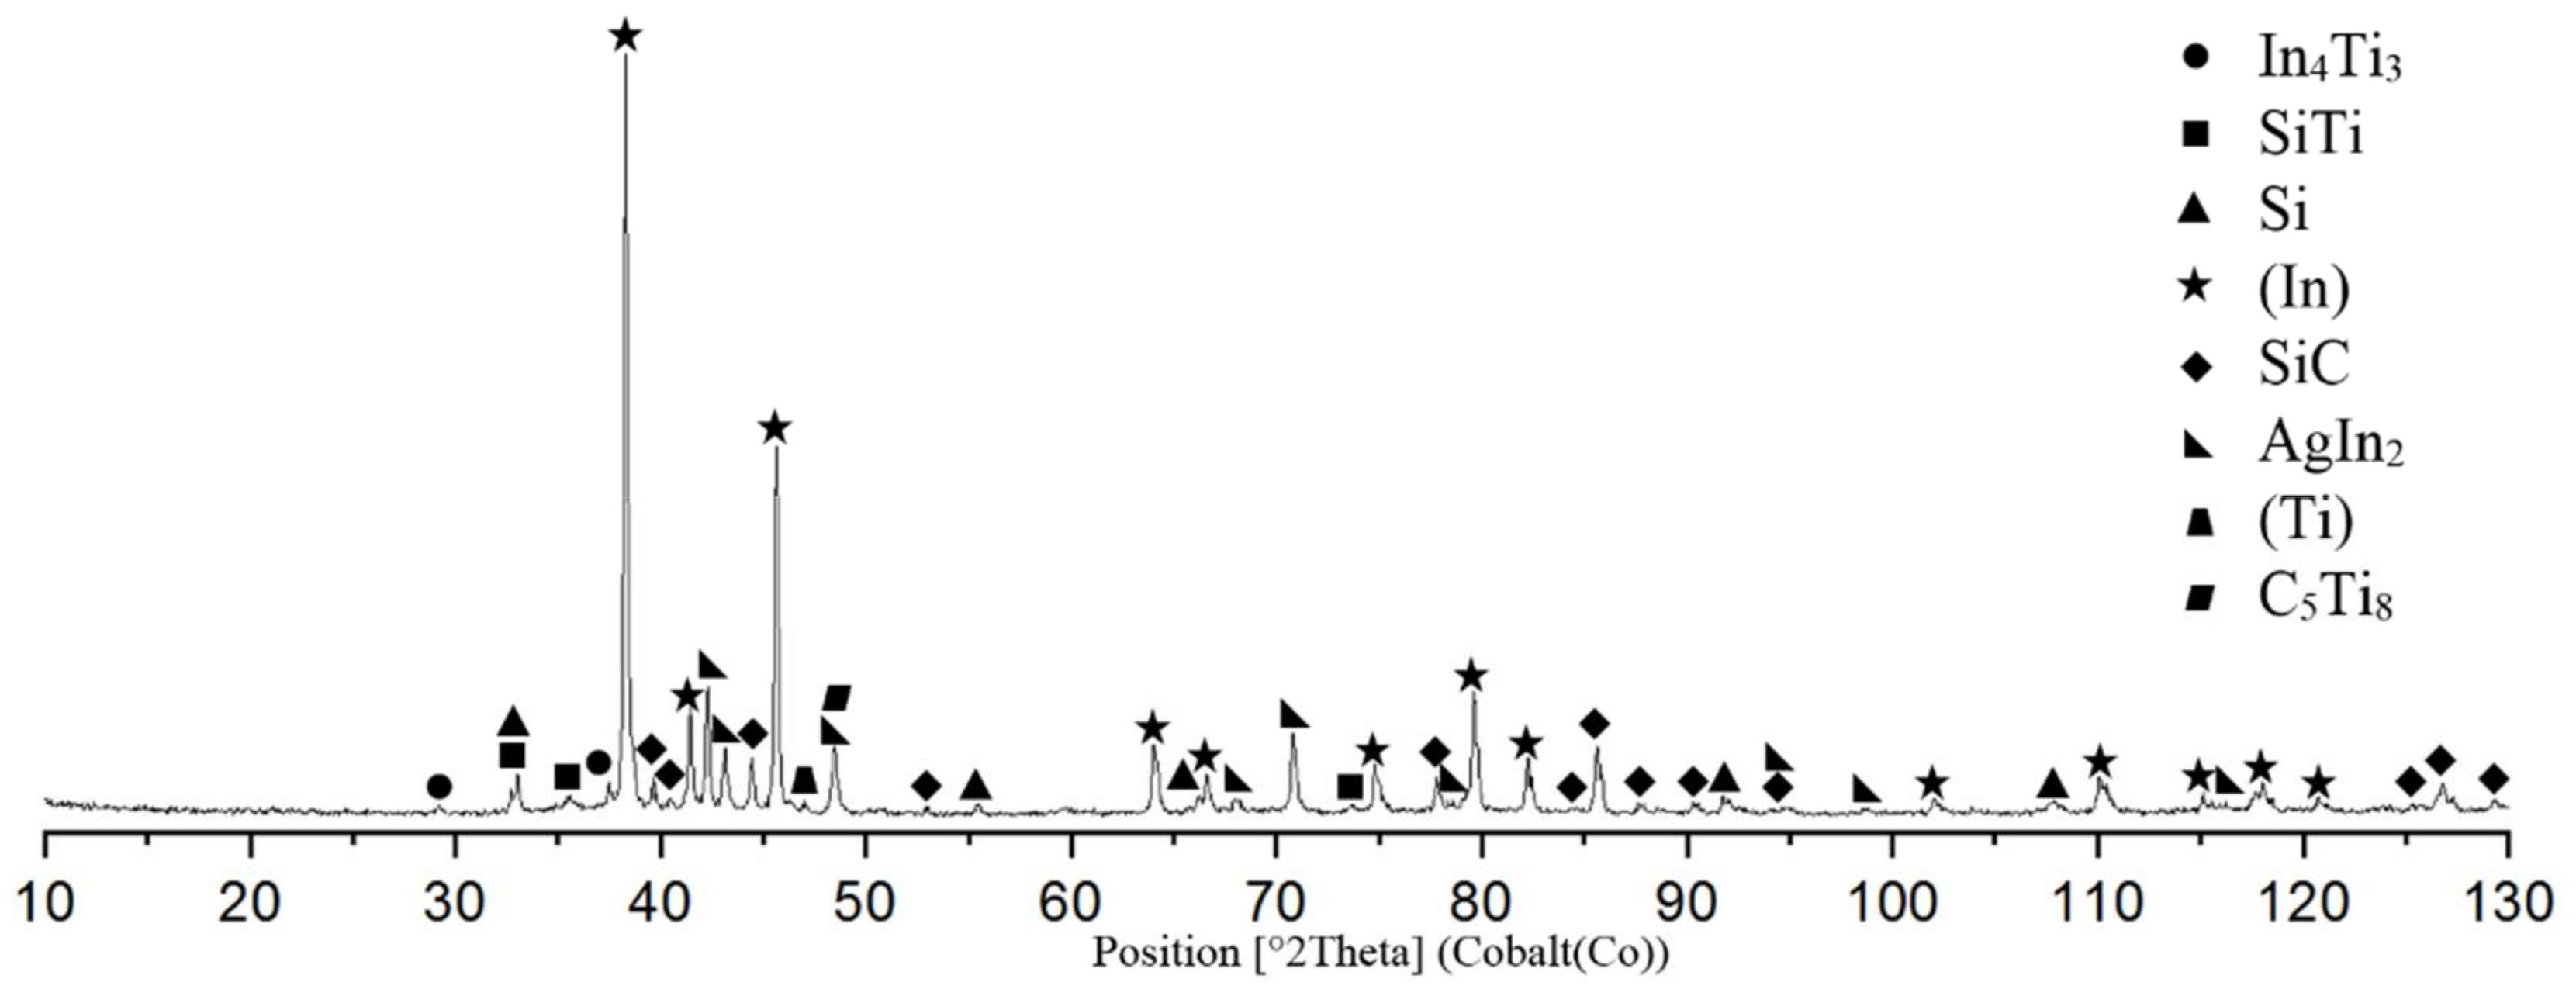
The character of Ti distribution on the fractured surface, Figure 18f, suggests that Ti is partially bound with the SiC ceramics and may thus contribute locally to bond formation. Therefore, an XRD analysis of the fractured surface in the interface of the SiC–In10Ag4Ti joint was performed.
Nevertheless, it was found that Ti from the solder locally reacted with the surface of the ceramic SiC material at the formation of new phases. Thus, two minority phases, namely the titanium silicide, SiTi, and titanium carbide, C5Ti8, were identified, which proves the interaction of titanium with the surface of the SiC ceramics. The record of XRD analysis is documented in Figure 19. Besides the SiTi and C5Ti8 phases, other minority phases, such as (In), (Ti), AgIn2, and Ti3In4, were also proved by EDX analysis.
4. Conclusions
The aim of our research was to characterize the In–Ag–Ti soldering alloy type. We also studied whether the designed composition of the experimental soldering alloy is suitable for soldering SiC ceramics and copper with ultrasound assistance. The following results were achieved;
- DSC analysis was employed to determine the melting point of solder. The DSC curve shows four basic peaks. The first peak, with a maximum temperature of 146.9 °C, corresponds to the temperature of eutectic transformation in the binary system of Ag–In. 65% of the solder volume was molten at this peak. The second and third peak, with maximum temperatures of 178 °C and 215 °C, respectively, represent the peritectic reactions in the Ag–In system, 19% of the solder volume was molten. The fourth and final peak, with a maximum temperature of 245.6 °C, represented the termination of melting of the components in the Ag–In system.
- The microstructure of the In–Ag–Ti type solder was composed of a solder matrix formed by fine eutectics—(In) + Ti3In4 phase. The solder matrix contains uniformly distributed intermetallic phases of silver, mainly AgIn2, and non-uniformly distributed phases of titanium solid solution—α-Ti.
- The SiC-solder bond is formed due to the interaction of indium with the surface of ceramic SiC material: During the soldering process, the indium particles are distributed to the interface with SiC ceramics under the effect of ultrasonic activation, where they combine with the silicon of the SiC ceramics. The indium-SiC bond has an adhesion character, barring the formation of new contact phases. However, XRD analysis proved a local interaction of titanium with the ceramic materials during the formation of new minority phases of titanium silicide (SiTi) and titanium carbide (C5Ti8).
- Two new intermetallic phases, namely (CuAg)6In5 and (AgCu)In2, were identified in the interface of the Cu–In10Ag4Ti joint, this was the result of the interaction between indium solder and copper substrate. The effect of an active Ti element on bond formation with the copper substrate was negligible.
- The measurement of shear strength was performed across a wide scope of metallic and ceramic materials. The average shear strength of a combined joint of SiC–Cu, fabricated with In10Ag4Ti solder, was 14.5 MPa. The results of measurements show that the strength of ceramic–metal joints in the case of In10Ag4Ti solder is comparable to that of metal-metal joints. This is because of the excellent wettability of indium on the ceramic materials at ultrasonic activation.
Acknowledgments
This paper was prepared with the support of the VEGA 1/0089/17 project: Research of new alloys for direct soldering of metallic and ceramic materials. The authors thank Ing. Marián Drienovský for DSC analysis and Martin Kusý for XRD analysis.
Author Contributions
Roman Koleňák and Igor Kostolný conceived, designed the experiments and wrote the paper. Ján Urminský and Jaromír Drápala performed the experiments. Martin Sahul contributed materials tools.
Conflicts of Interest
The authors declare no conflicts of interest.
References
- Chen, X.; Xie, R.; Lai, Z.; Liu, L.; Zou, G.; Yan, J. Ultrasonic-Assisted Brazing of Al–Ti Dissimilar Alloy by a Filler Metal with a Large Semi-solid Temperature Range. Mater. Des. 2016, 95, 296–305. [Google Scholar] [CrossRef]
- Watanabe, T.; Sakuyama, H.; Yanagisawa, A. Ultrasonic Welding between Mild Steel Sheet and Al-Mg Alloy Sheet. J. Mater. Process. Technol. 2009, 209, 5475–5480. [Google Scholar] [CrossRef]
- Wang, Q.; Zhu, L.; Chen, X. Si Particulate-reinforced Zn-Al Based Composites Joints of Hypereutectic Al-50Si Alloys by Ultrasonic-assisted Soldering. Mater. Des. 2016, 107, 41–46. [Google Scholar] [CrossRef]
- Nagaoka, T.; Morisada, Y.; Fukusumi, M.; Takemoto, T. Ultrasonic-assisted Soldering of 5056 Aluminum Alloy Using Quasi-melting Zn-Sn Alloy. Metall. Mater. Trans. B 2010, 41, 864–871. [Google Scholar] [CrossRef]
- Lai, Z.; Chen, X.; Pan, C. Joining Mg Alloys with Zn Interlayer by Novel Ultrasonic-Assisted transient Liquid Phase Bonding Method in Air. Mater. Lett. 2016, 166, 219–222. [Google Scholar] [CrossRef]
- Lai, Z.; Xie, R.; Pan, C. Ultrasound-assisted Transient Liquid Phase Bonding of Magnesium Alloy Using Brass Interlayer in Air. J. Mater. Sci. Technol. 2017, 33, 567–572. [Google Scholar] [CrossRef]
- Guo, W.; Leng, X.; Luan, T. Ultrasonic-promoted Rapid TLP Bonding of Fine-grained 7034 High Strength Aluminum Alloys. Ultrason. Sonochem. 2017, 36, 354–361. [Google Scholar] [CrossRef] [PubMed]
- Qian, W.; Chen, X.; Lin, Z. Rapid Ultrasound-induced Transient-liquid-phase Bonding of Al-50Si Alloys with Zn Interlayer in Air for Electrical Packaging Application. Ultrason. Sonochem. 2017, 34, 947–952. [Google Scholar]
- Zhao, H.Y.; Liu, J.H.; Li, Z.L. Non-interfacial Growth of Cu3Sn in Cu/Sn/Cu Joints During Ultrasonic-assisted Transient Liquid Phase Soldering Process. Mater. Lett. 2016, 186, 283–288. [Google Scholar] [CrossRef]
- Kirschmann, R.K.; Sokolowski, W.M.; Kolawa, E.A. A Scattering-Mediated Acoustic Mismatch Model for the Prediction of Thermal Boundary Resistance. J. Heat Transf. 2000, 123, 105–112. [Google Scholar]
- Swenson, C.A. Properties of Indium and Thalium at Low Temperatures. Phys. Rev. J. Arch. 1955, 100, 1067. [Google Scholar]
- Glazer, J. Metallurgy of Low Temperature Pb-free solders for electronic assembly. Int. Mater. Rev. 1995, 40, 65–93. [Google Scholar] [CrossRef]
- Plotner, M.; Donat, B.; Benke, A. Deformation properties of indium-based solders at 294 and 77 K. Cryogenics 1991, 31, 159–162. [Google Scholar] [CrossRef]
- Chang, R.W.; McCluskey, F.P. Constitutive Relations of Indium in Extreme-Temperature Electronic Packaging Based on Anand Model. J. Electron. Mater. 2009, 38, 1855–1859. [Google Scholar] [CrossRef]
- Cheong, J.; Goyal, A.; Tadigadapa, S.; Rahn, C. Reliable Bonding Using Indium-Based Solders. In Proceedings of the SPIE 5343, Reliability, Testing, and Characterization of MEMS/MOEMS III; SPIE; Bellingham, WA, USA, 2003. [Google Scholar]
- Choi, W.K.; Premachandran, C.S.; Chiew, O.S.; Ling, X.; Ebin, L.; Khairyanto, A.; Ratmin, B.; Sheng, K.C.W.; Thaw, P.P.; Lau, J.H. Development of Novel Intermetallic Joints Using Thin Film Indium Based Solder by Low Temperature Bonding Technology for 3D IC Stacking. In Proceedings of the 59th Electronic Components and Technology Conference (ECTC 2009), San Diego, CA, USA, 26–29 May 2009. [Google Scholar]
- Cheng, X.; Liu, C.; Silberschmidt, V.V. Numerical Analysis of Thermo-Mechanical Behavior of Indium Micro-joint at cryogenic temperature. Comput. Mater. Sci. 2012, 52, 274–281. [Google Scholar] [CrossRef]
- Zhu, L.; Wang, Q.; Shi, L.; Zhang, X.; Yang, T.; Yan, J.; Zhou, X.; Chen, S. Ultrarapid Formation of Multi-Phase Reinforced Joints of Hypereutectic Al-Si Alloys via an Ultrasound-Induced Liquid Phase Method Using Sn-51In Interlayer. Mater. Sci. Eng. A 2018, 711, 94–98. [Google Scholar] [CrossRef]
- Wang, S.S.; Tseng, Y.H.; Chuang, T.H. Intermetalic Compounds Formed during the Interfacial Reactions between Liquid In-49Sn Solder and Ni substrate. J. Electron. Mater. 2006, 35, 165–169. [Google Scholar] [CrossRef]
- Baren, M.R. Binary Alloy Phase Diagrams; Massalski, T.B., Ed.; ASM International: Metal Park, OH, USA, 1990; p. 47. [Google Scholar]
- Baraballi, O.M.; Kova, N. Struktura i Svojstva Metalov i Splavov; Kyjev Naukova Dumka: Kyjev, Ukraine, 1986. [Google Scholar]
- Chang, S.Y.; Tsao, L.C.; Chiang, M.J.; Chuang, T.H.; Tung, C.N.; Pan, G.H. Active Soldering of Indium Tin Oxide (ITO) with Cu in Air Using an Sn3.5Ag4Ti(Ce, Ga) Filler. J. Mater. Eng. Perform. 2003, 12, 383–390. [Google Scholar] [CrossRef]
- Koleňák, R.; Šebo, P.; Provazník, M.; Koleňáková, M.; Ulrich, K. Shear strength and wettability of active Sn3.5Ag4Ti(Ce, Ga) solder on Al2O3 ceramics. Mater. Des. 2011, 32, 3997–4003. [Google Scholar] [CrossRef]
Figure 1.
Schematic representation of soldering process at the presence of ultrasonic power.

Figure 2.
The scheme of shear stress measurement (unit: mm).

Figure 3.
DSC analysis of In10Ag4Ti solder at the heating rate of 10 K·min−1.


Figure 5.
Microstructure of In10Ag4Ti solder from the optical microscope (a) in polished condition and (b) in etched condition.
Figure 5.
Microstructure of In10Ag4Ti solder from the optical microscope (a) in polished condition and (b) in etched condition.

Figure 6.
Point EDX analysis of In10Ag4Ti solder.

Figure 7.
XRD analysis of In10Ag4Ti solder.

Figure 8.
Map of In, Ag, and Ti elements.

Figure 9.
Microstructure of the SiC–In10Ag4Ti–Cu joint (a) from optical microscope; (b) from SEM.

Figure 10.
EDX point analysis of the SiC–In10Ag4Ti–Cu joint.

Figure 11.
EDX point analysis of the SiC–In10Ag4Ti joint.

Figure 12.
Planar distribution of Si, In, Ag, and Ti elements in the interface of the SiC–In10Ag4Ti joint (a) interface microstructure; (b) Si; (c) In; (d) Ag; and (e) Ti.
Figure 12.
Planar distribution of Si, In, Ag, and Ti elements in the interface of the SiC–In10Ag4Ti joint (a) interface microstructure; (b) Si; (c) In; (d) Ag; and (e) Ti.

Figure 13.
The line EDX analysis of the SiC–In10Ag4Ti joint (a) transition zone with a marked line; (b) concentration profiles of Ti, C, Si, In, and Ag elements.
Figure 13.
The line EDX analysis of the SiC–In10Ag4Ti joint (a) transition zone with a marked line; (b) concentration profiles of Ti, C, Si, In, and Ag elements.

Figure 14.
EDX point analysis of the interface of the Cu–In10Ag4Ti joint.

Figure 15.
The concentration profiles of Cu, In, and Ag elements in the interface of the Cu–In10Ag4Ti joint in the zone of formation of the new intermetallic phases, (CuAg)6In5 and (AgCu)In2.
Figure 15.
The concentration profiles of Cu, In, and Ag elements in the interface of the Cu–In10Ag4Ti joint in the zone of formation of the new intermetallic phases, (CuAg)6In5 and (AgCu)In2.

Figure 16.
Shear strength of soldered joints with In10Ag4Ti solder.

Figure 17.
Fractured surface of soldered joint of SiC–In10Ag4Ti–Cu (a) 45 times magnification, (b) 400 times magnification.
Figure 17.
Fractured surface of soldered joint of SiC–In10Ag4Ti–Cu (a) 45 times magnification, (b) 400 times magnification.

Figure 18.
Fractured surface of the soldered joint of SiC–In10Ag4Ti–Cu and the planar distribution of individual elements (a) structure of fracture; (b) Si; (c) C; (d) In; (e) Ag; and (f) Ti.
Figure 18.
Fractured surface of the soldered joint of SiC–In10Ag4Ti–Cu and the planar distribution of individual elements (a) structure of fracture; (b) Si; (c) C; (d) In; (e) Ag; and (f) Ti.

Figure 19.
XRD analysis of the interface of SiC–In10Ag4Ti joint.


Table 1.
The chemical composition of soldering alloy in wt %.
| Sample | In [%] | Ag [%] | Ti [%] |
|---|---|---|---|
| In–Ag–Ti | 86.0 | 10.0 | 4.0 |
Table 2.
Soldering parameters.
| Ultrasound Power | 400 | [W] |
|---|---|---|
| Working Frequency | 40 | [kHz] |
| Amplitude | 2 | [μm] |
| Soldering Temperature | 230 | [°C] |
| Time of Ultrasound Activation | 5 | [s] |
Table 3.
Point EDX analysis of In10Ag4Ti solder.
| Spectrum | In [wt %] | Ag [wt %] | Ti [wt %] | Solder Component |
|---|---|---|---|---|
| Spectrum 1 | 13.8 | 0 | 86.2 | solid solution (Ti) |
| Spectrum 2 | 68.4 | 31.6 | 0 | phase AgIn2 |
| Spectrum 2 | 67.7 | 32.3 | 0 | phase AgIn2 |
| Spectrum 3 | 85.9 | 0 | 14.1 | phase Ti18In7 |
| Spectrum 4 | 99.2 | 0 | 0.8 | matrix (In) + phase Ti3In4 |
Table 4.
EDX point analysis of the SiC–In10Ag4Ti–Cu joint.
| Spectrum | In [wt %] | Ag [wt %] | Ti [wt %] | Solder Component |
|---|---|---|---|---|
| Spectrum 1 | 99.2 | 0.1 | 0.7 | eutectic In-Ti, In-Ag |
| Spectrum 2 | 35.6 | 64.4 | 0 | phase Ag2In |
| Spectrum 3 | 70.1 | 29.9 | 0 | phase AgIn2 |
| Spectrum 4 | 0 | 0 | 0 | abrasive particle Al2O3 |
| Spectrum 5 | 29.8 | 0 | 70.2 | solid solution (Ti)—α-Ti |
Table 5.
EDX point analysis of the SiC–In10Ag4Ti joint.
| Spectrum | In [wt %] | Ag [wt %] | Ti [wt %] | Cu [wt %] | Si [wt.%] | C [wt %] | Component |
|---|---|---|---|---|---|---|---|
| Spectrum 1 | 0 | 0 | 0 | 0 | 60.1 | 39.9 | ceramics SiC |
| Spectrum 2 | 0 | 0 | 0 | 0 | 59.3 | 40.7 | particle SiC |
| Spectrum 3 | 15.3 | 0.3 | 0 | 84.4 | 0 | 0 | solid solution (Cu) |
| Spectrum 4 | 0 | 0 | 0 | 100 | 0 | 0 | particle Cu |
| Spectrum 5 | 54.7 | 19.4 | 19.5 | 6.4 | 0 | 0 | - |
Table 6.
EDX point analysis of the interface of the Cu–In10Ag4Ti joint.
| Spectrum | In [wt %] | Ag [wt %] | Cu [wt %] | Component |
|---|---|---|---|---|
| Spectrum 1 | 58.5 | 8.2 | 33.3 | phase (CuAg)6In5 |
| Spectrum 1 | 57.6 | 7.3 | 35.1 | phase (CuAg)6In5 |
| Spectrum 2 | 69.8 | 23.2 | 7.0 | phase (AgCu)In2 |
© 2018 by the authors. Licensee MDPI, Basel, Switzerland. This article is an open access article distributed under the terms and conditions of the Creative Commons Attribution (CC BY) license (http://creativecommons.org/licenses/by/4.0/).
Share and Cite
MDPI and ACS Style
Koleňák, R.; Kostolný, I.; Drápala, J.; Sahul, M.; Urminský, J. Characterizing the Soldering Alloy Type In–Ag–Ti and the Study of Direct Soldering of SiC Ceramics and Copper. Metals 2018, 8, 274. https://doi.org/10.3390/met8040274
AMA Style
Koleňák R, Kostolný I, Drápala J, Sahul M, Urminský J. Characterizing the Soldering Alloy Type In–Ag–Ti and the Study of Direct Soldering of SiC Ceramics and Copper. Metals. 2018; 8(4):274. https://doi.org/10.3390/met8040274
Chicago/Turabian StyleKoleňák, Roman, Igor Kostolný, Jaromír Drápala, Martin Sahul, and Ján Urminský. 2018. "Characterizing the Soldering Alloy Type In–Ag–Ti and the Study of Direct Soldering of SiC Ceramics and Copper" Metals 8, no. 4: 274. https://doi.org/10.3390/met8040274
Note that from the first issue of 2016, this journal uses article numbers instead of page numbers. See further details here.