Hydrometallurgical Process for Selective Metals Recovery from Waste-Printed Circuit Boards
by
 ,
,
Željko Kamberović
1, 
Milisav Ranitović
2,*,
Marija Korać
1,
Zoran Andjić
3,
Nataša Gajić
2,
Jovana Djokić
3 and
Sanja Jevtić
1 1
Faculty of Technology and Metallurgy, University of Belgrade, Karnegijeva 4, Belgrade 11000, Serbia
2
Innovation Center of Faculty of Technology and Metallurgy in Belgrade Ltd., Karnegijeva 4, Belgrade 11000, Serbia
3
Innovation Center of the Faculty of Chemistry Ltd., Studentski trg 12-16, Belgrade 11000, Serbia
*
Author to whom correspondence should be addressed.
Metals 2018, 8(6), 441; https://doi.org/10.3390/met8060441
Submission received: 11 May 2018
/
Revised: 28 May 2018
/
Accepted: 29 May 2018
/
Published: 11 June 2018
(This article belongs to the Special Issue Sustainable Utilization of Metals - Processing, Recovery and Recycling)
Abstract
:This paper presents an experimentally-proved hydrometallurgical process for selective metals recovery from the waste-printed circuit boards (WPCBs) using a combination of conventional and time-saving methods: leaching, cementation, precipitation, reduction and electrowinning. According to the results obtained in the laboratory tests, 92.4% Cu, 98.5% Pb, 96.8% Ag and over 99% Au could be selectively leached and recovered using mineral acids: sulfuric, nitric and aqua regia. Problematic tin recovery was addressed with comprehensive theoretical and experimental work, so 55.4% of Sn could be recovered through the novel physical method, which consists of two-step phase separation. Based on the results, an integral hydrometallurgical route for selective base and precious metals recovery though consecutive steps, (i) Cu, (ii) Sn, (iii) Pb and Ag, and (iv) Au, was developed. The route was tested at scaled-up laboratory level, confirming feasibility of the process and efficiencies of metals recovery. According to the obtained results, the proposed hydrometallurgical route represents an innovative and promising method for selective metals recovery from WPCBs, particularly applicable in small scale hydrometallurgical environments, focused on medium and high grade WPCBs recycling.
1. Introduction
Due to high concentrations of the base and precious metals and their corresponding values, waste printed circuit boards (WPCBs) represent the most significant part of electronic waste. Hence, important for WPCBs recycling is increasing from the point of the resource efficiency and sustainable use of resources, and also from the point of environmental issue [1]. Nevertheless, materials and components variety makes recycling of WPCBs a very complex and demanding process, which consists of different pre-processing and end-processing operations.
Therefore, various mechanical operations are suggested as the first step, which helps that further operations, either pyro- or hydrometallurgical, can be carried out more effectively [2]. In pyrometallurgy, WPCBs recycling is integrated in the base metals production process in which valuable metals are concentrated in the metal carrier, copper or lead, and subsequently valorized through series of pyro-hydro-electro refining operations to produce high-purity metals [3,4]. Although these operations are well-established on the industrial scale, intense marketing activities hinder environmental risks, and their ecological acceptance is dependent on implementation of high-efficient off-gas treatment systems, which affects already high capital and operating costs. Therefore, pyrometallurgical processes are dependent on the high operating capacities and on the processing high-grade WPCBs. However, changes in the material composition and recent trends toward decreasing metals content in the electronic devices may represent serious drawbacks for these operations in the near future [4]. Recycling technologies lagging behind product designers’ activities and distance is regrettably increasing.
In contrast, high flexibility and selectivity of the hydrometallurgical operations are offering possibility for separate metals recovery in early stages of processing. This makes hydrometallurgical recycling of electronic waste economically feasible even at lower operating capacities. From a technological perspective, due to morphological similarity between WPCBs and specific “refractory” copper ores, traditional hydrometallurgical methods are applied for WPCBs recycling as well [5,6]. Thus, in the beginning, hydrometallurgical recycling of WPCBs was focused only on gold and silver recovery, mainly through simplified variations of the cyanidation process. However, increased environmental awareness and need for sustainable material management has imposed necessity for development of more comprehensive metals recovery processes. Accordingly, in the scientific literature, various studies have been reported, but generally focused on the independent recovery of the base (BM) [7,8,9], precious (PM) [10,11,12], or solder metals [13,14,15]. However, investigations of compatibility and possible adverse interactions between consecutive leaching and recovery steps are scarce. For that reason, in recent years, significant efforts have been made to combine and incorporate the above mentioned methods in the unique multi-step processing route [16,17,18]. Since the major economic driver for WPCBs recycling relies on the efficient PM recovery, most of these processes are developed following the concept of metals concentration, in which BM are selectively removed in first stage of processing by mainly using oxidative sulfate solutions [19,20]. Even though the main objective of this step is leaching of copper, other BM like iron, zinc, nickel, or cobalt are leached as well, reducing the possibility for any inhibiting effect on the successive PM leaching [19]. Subsequently, leaching of the gold and silver is performed using cyanides, halides, aqua-regia (AR) or acidic thiosulfate or thiourea solutions [21]. Over the decades, cyanide leaching represented the dominant method for gold recovery from primary and secondary sources. In spite of low cost and consumption of cyanides, their high toxicity generally restricts their implementation in modern WPCBs recycling process. Instead, usage of the thio-based solutions is emphasized in many recent studies, due to their high selectivity for precious metals and non-toxicity. However, instability of the thio-based solutions, relatively slow leaching rates and high consumption makes them less attractive for industrial application. Also, gold surface passivation as well as insufficiently tested risks for human health additionally complicate their application. Consequently, in addition to promising results of extraction rate and yield for iodine leaching, favorable leaching kinetic and ability to effectively prevent any interfering effect caused by residual BM still make AR one of the main reagents for PM recovery [22].
Nevertheless, even with these great improvements done in the past period, shortfalls in comprehensive process overview obtained from scaled-up demonstrations are preventing better understanding of the full-scale system performances. Additionally, even though lead and tin quantitatively are next in-line to copper, a small number of studies considers these metals of interest [23].
In response, investigations presented in this study are related to Cu, Pb, Sn, Ag, and Au recoveries, which are based on quantities and economic importance identified as metals of major interest. According to the experimental investigation, by implementing a specially designed combination of simple and time-saving methods (leaching, cementation, precipitation, reduction and electrowinning), Cu, Pb, Ag, and Au could be successfully leached and recovered through three consecutive steps using mineral acids (sulfuric, nitric and aqua regia). In addition, the simple mechanical method of coagulation, gravitation concentration, and filtration for Sn recovery from WPCBs is introduced, improving the overall metals recovery rate. Obtained results were used for definition of an improved multi-step hydrometallurgical processing route tested at scaled-up laboratory level, confirming the process feasibility and the metals recovery efficiencies.
2. Materials and Methods
2.1. Materials
In the presented research, 100 kg of mechanically treated WPCBs were provided by a local electronic waste recycler. Material was obtained after primary crushing in the cross-flow QZ® chain mill equipped with the magnetic separator and secondary shredding in the Meccanoplastica® cutter. Chemicals used in the laboratory tests were p.a. (pro analysi) certified, while chemicals used in the scaled-up laboratory test were technical grade.
2.2. Analytical Methods
Chemical composition of WPCBs and solid products was determined by X-ray fluorescence spectrometry (XRF) using Thermo Scientific ARL Quant’x EDXRF Spectrometer. Chemical composition of pregnant leaching solutions (PLS) and solutions after metals recovery (MRS) was determined by atomic absorption spectrometry (AAS) using Perkin Elmer 4000 spectrometer. Phase composition and material morphology was analyzed by X-ray diffraction analysis (XRD) and scanning electron microscopy (SEM) using Philips PW-1710 difractometer and Mira3 Tescan microscope.
Chemical composition of WPCBs was determined after thermal treatment of three samples, each weighing 1.00 kg, in medium induction furnace (reduction conditions, at 1250 °C for 1 h) in which organic fraction was burned (loss on ignition), oxides together with other slag-forming compounds were transferred to slag phase, and metals were collected in melt (M° state). Obtained fractions were measured and analyzed, and chemical composition was determined as average value of three analyses. For this analysis, the slag phase was grinded to a particle size <100 µm to support a representative measurement.
Due to high heterogeneity of investigated material, the leaching degree was determined by material balance method [19]:
Concentration of metals in PLS and MRS was determined directly by AAS. Concentration of targeted metal in leaching residue was determined by AAS after leaching of residue in hot AR solution.
2.3. Experimental Methods
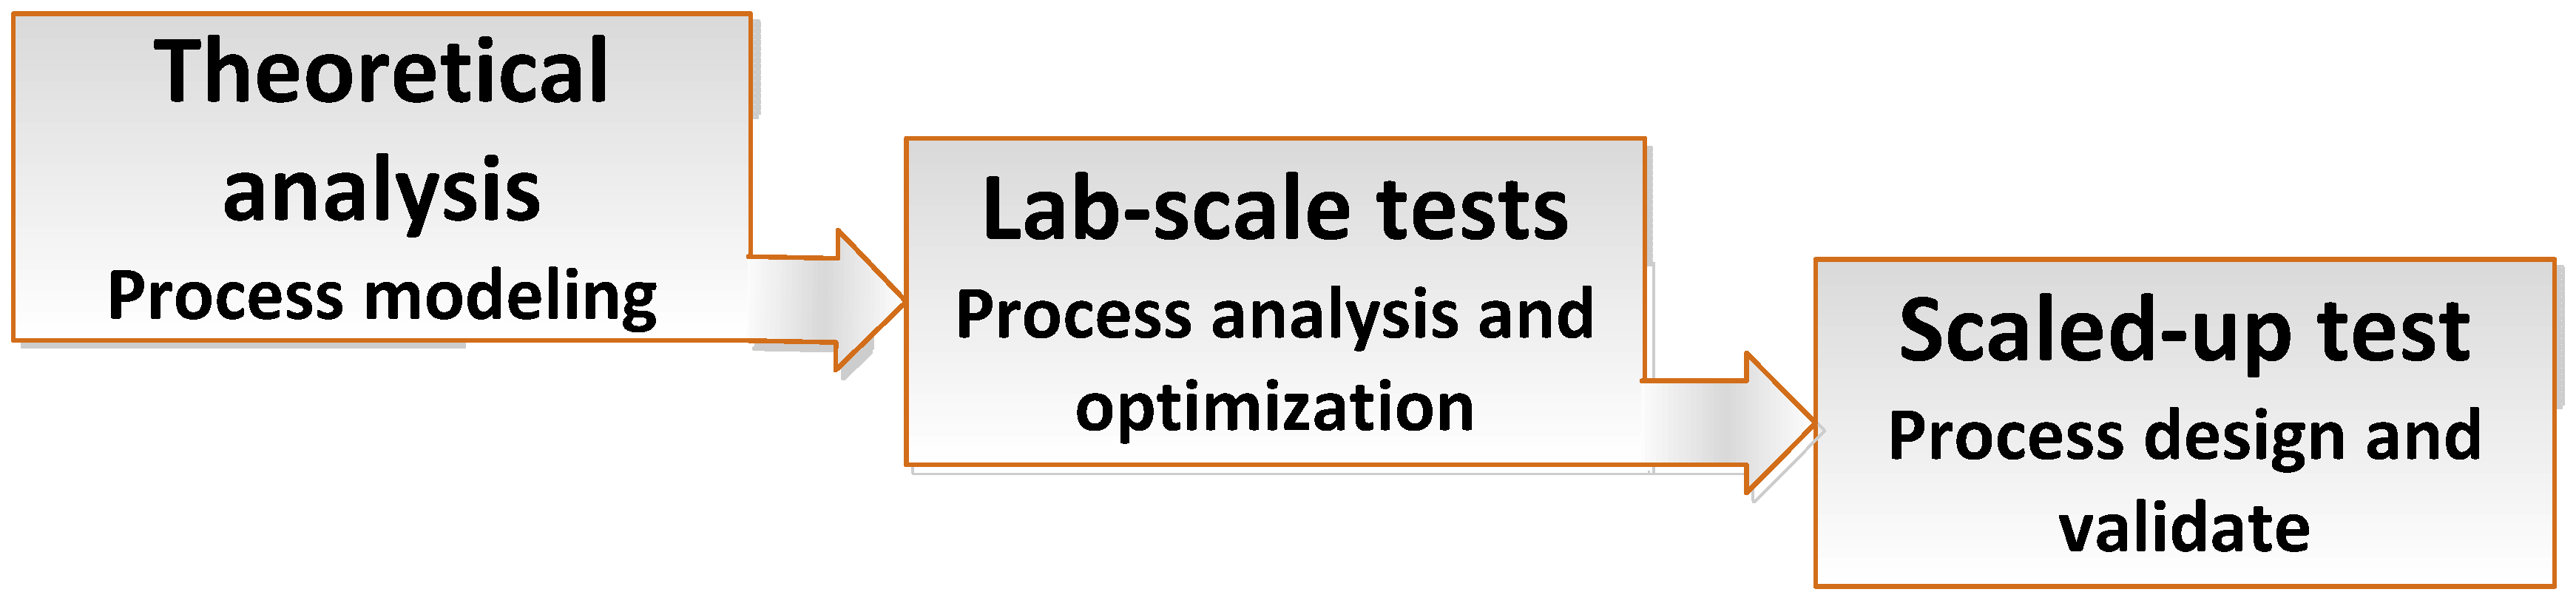
Development of the integral hydrometallurgical process for selective base and precious metals recovery from WPCBs was performed through theoretical and experimental investigations, which included simulation and modeling of the leaching reactions, laboratory tests, and scaled-up laboratory testing (Figure 1).
2.3.1. Simulation of Leaching Reactions
Theoretical analysis of the thermodynamic characteristics of selected leaching reactions was performed as the first step, to obtain more comprehensive overview of the highly-complex reaction system and to define major processing steps and their relative order. Therefore, analysis of phase stability of the metals and their possible chemical reactions (based on Pourbax, Eh-pH, diagrams) with common mineral acids, sulfuric, nitric and hydrochloric, in predefined temperature range, was performed using HSC Chemistry software [24].
2.3.2. Laboratory Tests
Leaching tests were performed in order to investigate influence of time, temperature, leaching and oxidizing agent concentration, solid:liquid (S/L) ratio, and stirring rate on leaching degree.
Cu leaching tests were performed through oxidative sulfate leaching, using 2 mol/dm3 solution of H2SO4 with continuous H2O2 addition (30 vol. %) as oxidizing agent. Electrowinning tests (EW) for Cu recovery were performed to investigate influence of the process control, current density and temperature, with and without mixing. Ag cementation tests were performed using Cu powder (1.5 g, 100 wt. % excess, purity >99.5%, <125 µm,). Tests were performed in order to investigate influence of the temperature under fixed time (30 min) and pH (2.2–2.4). Adjustment of pH was performed by adding Na2CO3 into solution [25]. Sn recovery was performed by a two-step phase separation of micron-sized, coarse, suspended particles of stannic acid obtained during Cu leaching step. Extracted stannic acid is probably a mixture of α- (H2SnO3) and β- modifications (SnO2 × xH2O). In this step, PLS after Cu leaching was filtered through coarse cellulose filter, pore size 38–75 µm, separating solid residue and solution containing suspended particles. Subsequently, fine suspended particles were extracted using laboratory centrifuge.
Pb and Ag leaching tests were performed using HNO3 at fixed temperature (80 °C) and stirring rate (300 rpm) [23]. Tests were performed using sample of WPCBs after liberation of BM through oxidative sulfate leaching. Pb and Ag recovery from leaching solution was performed by chemical precipitation using excessive amount of 4 mol/dm3 NaCl solution (100% molar excess), at room temperature.
Au leaching was performed using standard AR solution, a mixture of nitric and hydrochloric acid with 1:3 molar ratio. Knowing that an increase of temperature tends to give faster Au leaching rates, the test was performed at 60 °C, which is adopted as upper temperature level, above which decomposition reactions and evaporation of AR are intensified [22]. Au leaching kinetic was investigated by measuring the concentration of Au in solution, in intervals of 30 min for total of 180 min of leaching. Tests were performed using sample of the WPCBs liberated from the major metals presence, which is obtained after dissolution in 50 vol. % HNO3. Due to rapid decrease in apparent density after dissolution of metals, S/L ratio was changed (increased) to 500 g/dm3. Au recovery from leachate was performed by chemical reduction using an excessive amount of FeSO4 (0.2 g, 100 wt. % excess).
Due to low initial content, other valuable metals like Ni, Co, and Pd were not of interest in this study, though chemical behavior is known.
Laboratory tests were performed in three-neck glass reactor, 2 dm3 volume, equipped with condenser, stirrer, pH and temperature control, and chemicals addition system. Depending on the S/L ratio, a different amount of the WPCBs sample was leached with 1 dm3 of the corresponding leaching agent. Laboratory galvanostatic polarization tests were performed using a Potentiostat/Galvanostat Bank STP 84. Two-electrodes configuration, Cu foil as cathode and PbSb7 as anode with same surface area of 3 cm2 were used. For enlarged laboratory EW tests, system of parallel-connected monopolar electrodes placed in rectangular electrolytic cell, with 2 dm3 volume, equipped with heater and stirrer was used. A system of 10 cathodes (Cu sheet) and 11 anodes (PbSb7) with the same surface area, 50 × 60 × 1 mm, and electrode distance 20 mm, was used. A rectifier with maximum capacity of 100 A and 40 V was used as DC source. For electric measurements, an HP 3466a multimeter was used.
2.3.3. Scaled-up Laboratory Test
Scaled-up test was performed using 5 kg of WPCBs sample, through consecutive reproduction of process parameters of each leaching and recovery step.
Leaching, chemical precipitation, and reduction were performed in glass-leaching rector, effective volume 30 dm3, equipped with stirrer, chemicals addition system, temperature control, and condenser coupled with off-gas washing system. EW recovery of Cu was performed in polypropylene electrolytic cell—volume 15 dm3, cathode surface 150 mm × 100 mm, electrodes distance 30 mm, equipped with heating tank, volume 80 dm3, and electrolyte recirculation system. Same DC source, 100 A and 40 V, as in galvanostatic laboratory tests, was used. Phase separation was performed using acid-resistant trommel screen (<105 µm) and plate and frame filter press. Process efficiency of each consecutive leaching step was followed by AAS, analyzing concentration of targeted metal in leachate aliquot in time interval of 30 min, until constant value of concentration.
2.4. Development of the Process Flow Sheet
Based on the results obtained in previous stages, an integral multi-step hydrometallurgical processing route for selective base and precious metals recovery was developed. The process flow sheet with overall mass balance and efficiency of each processing step is presented. Also, improvements related to innovative two-step separation method for Sn recovery is presented.
3. Results
3.1. Material Characterization
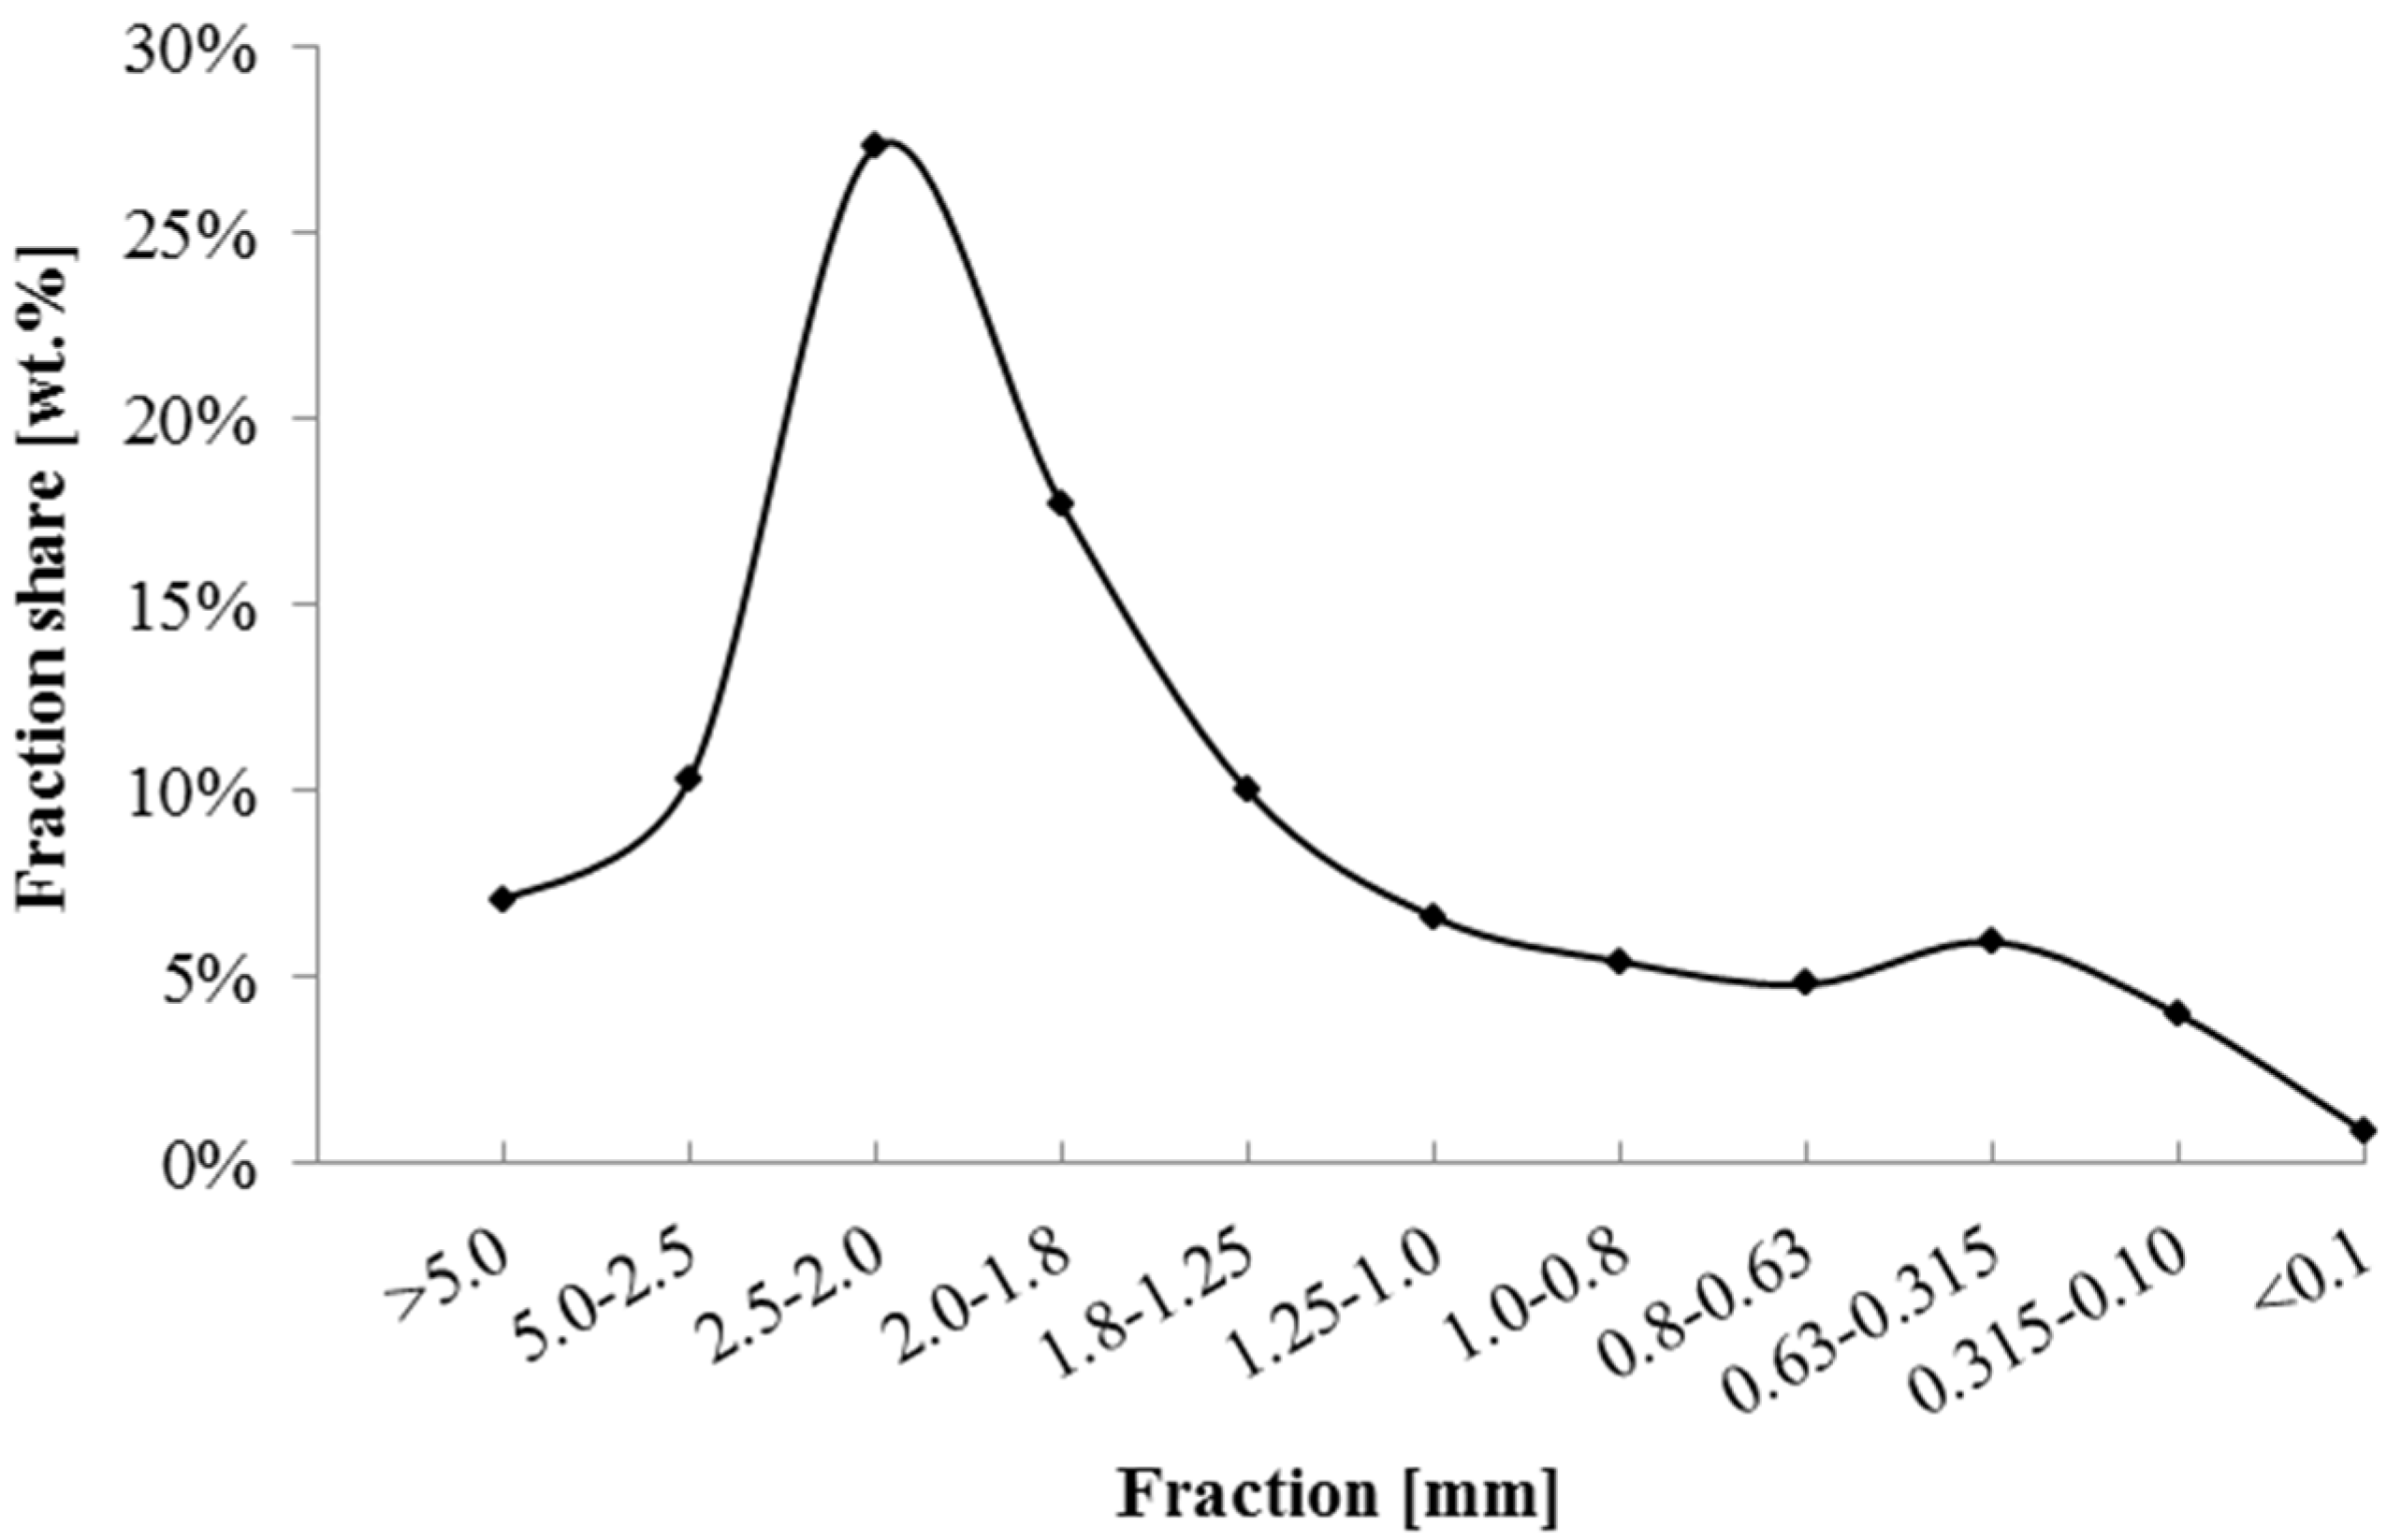
Physical–chemical characterization included determination of chemical composition (Table 1), content of magnetic fraction (2.3 wt. %), and moisture (1.71 wt. %), bulk density (889 kg/m3) and particle size distribution (Scheme 1).
Results obtained by sieve analysis suggest that material is suitable for hydrometallurgical processing as only 7 wt. % of the complete sample consists of particles bigger than 5.00 mm (coarse fraction), whereas less than 10 wt. % are particles smaller than 0.63 mm (dusty fraction).
Considering the generally adopted methodology by which WPCBs are categorized into several groups depending on the gold content, it may be concluded that used material is on threshold for medium and high grade (minimum content 200 ppm) [1,26]. Additionally, very low amounts of Fe and Al suggest on efficient magnetic separation as well as that aluminum parts were most probably extracted prior to mechanical treatment, i.e., during the processor’s dismantling and removal of cooling and housing parts.
3.2. Simulation of Leaching Reactions
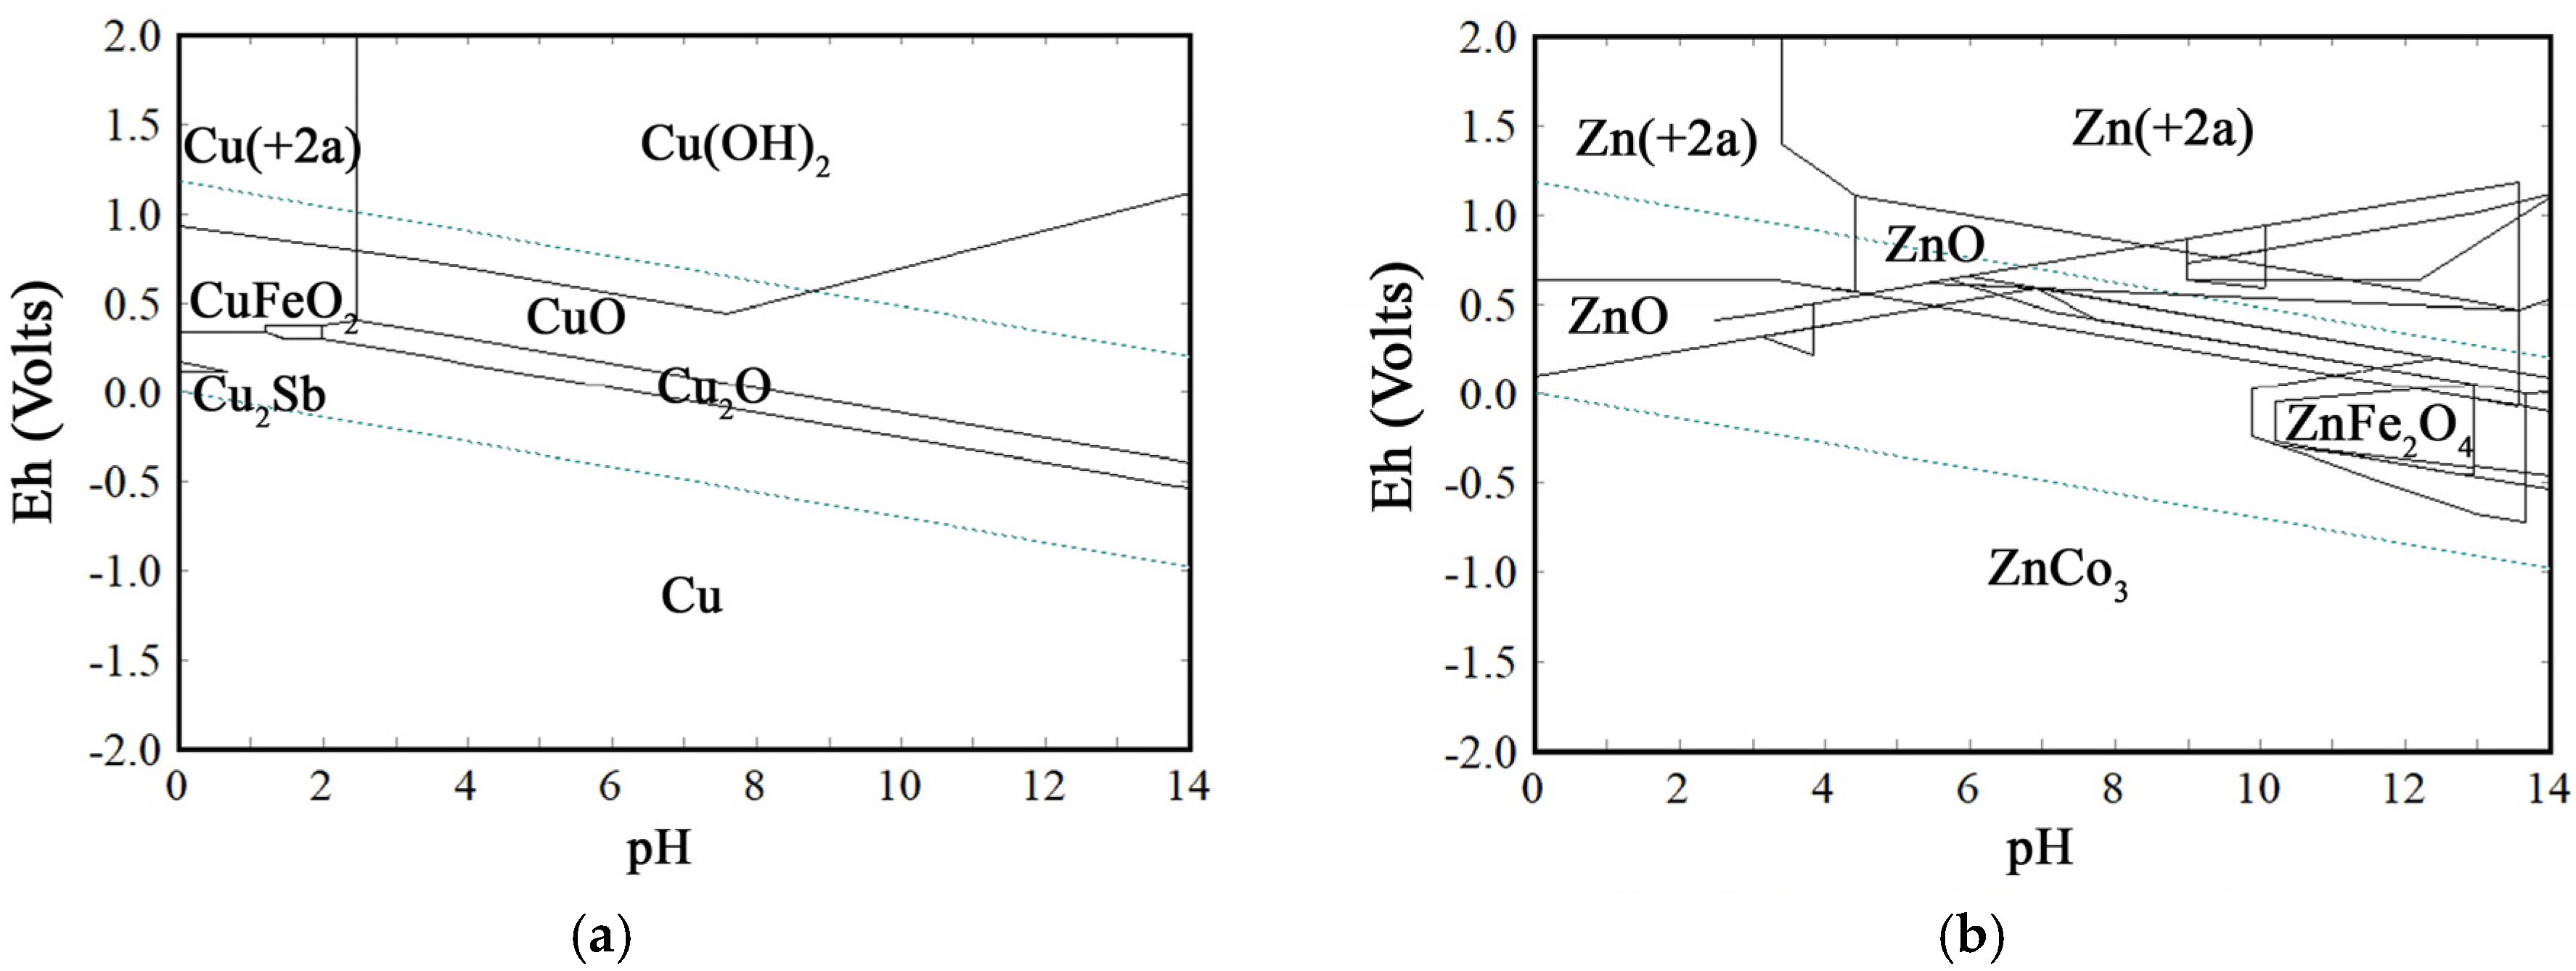
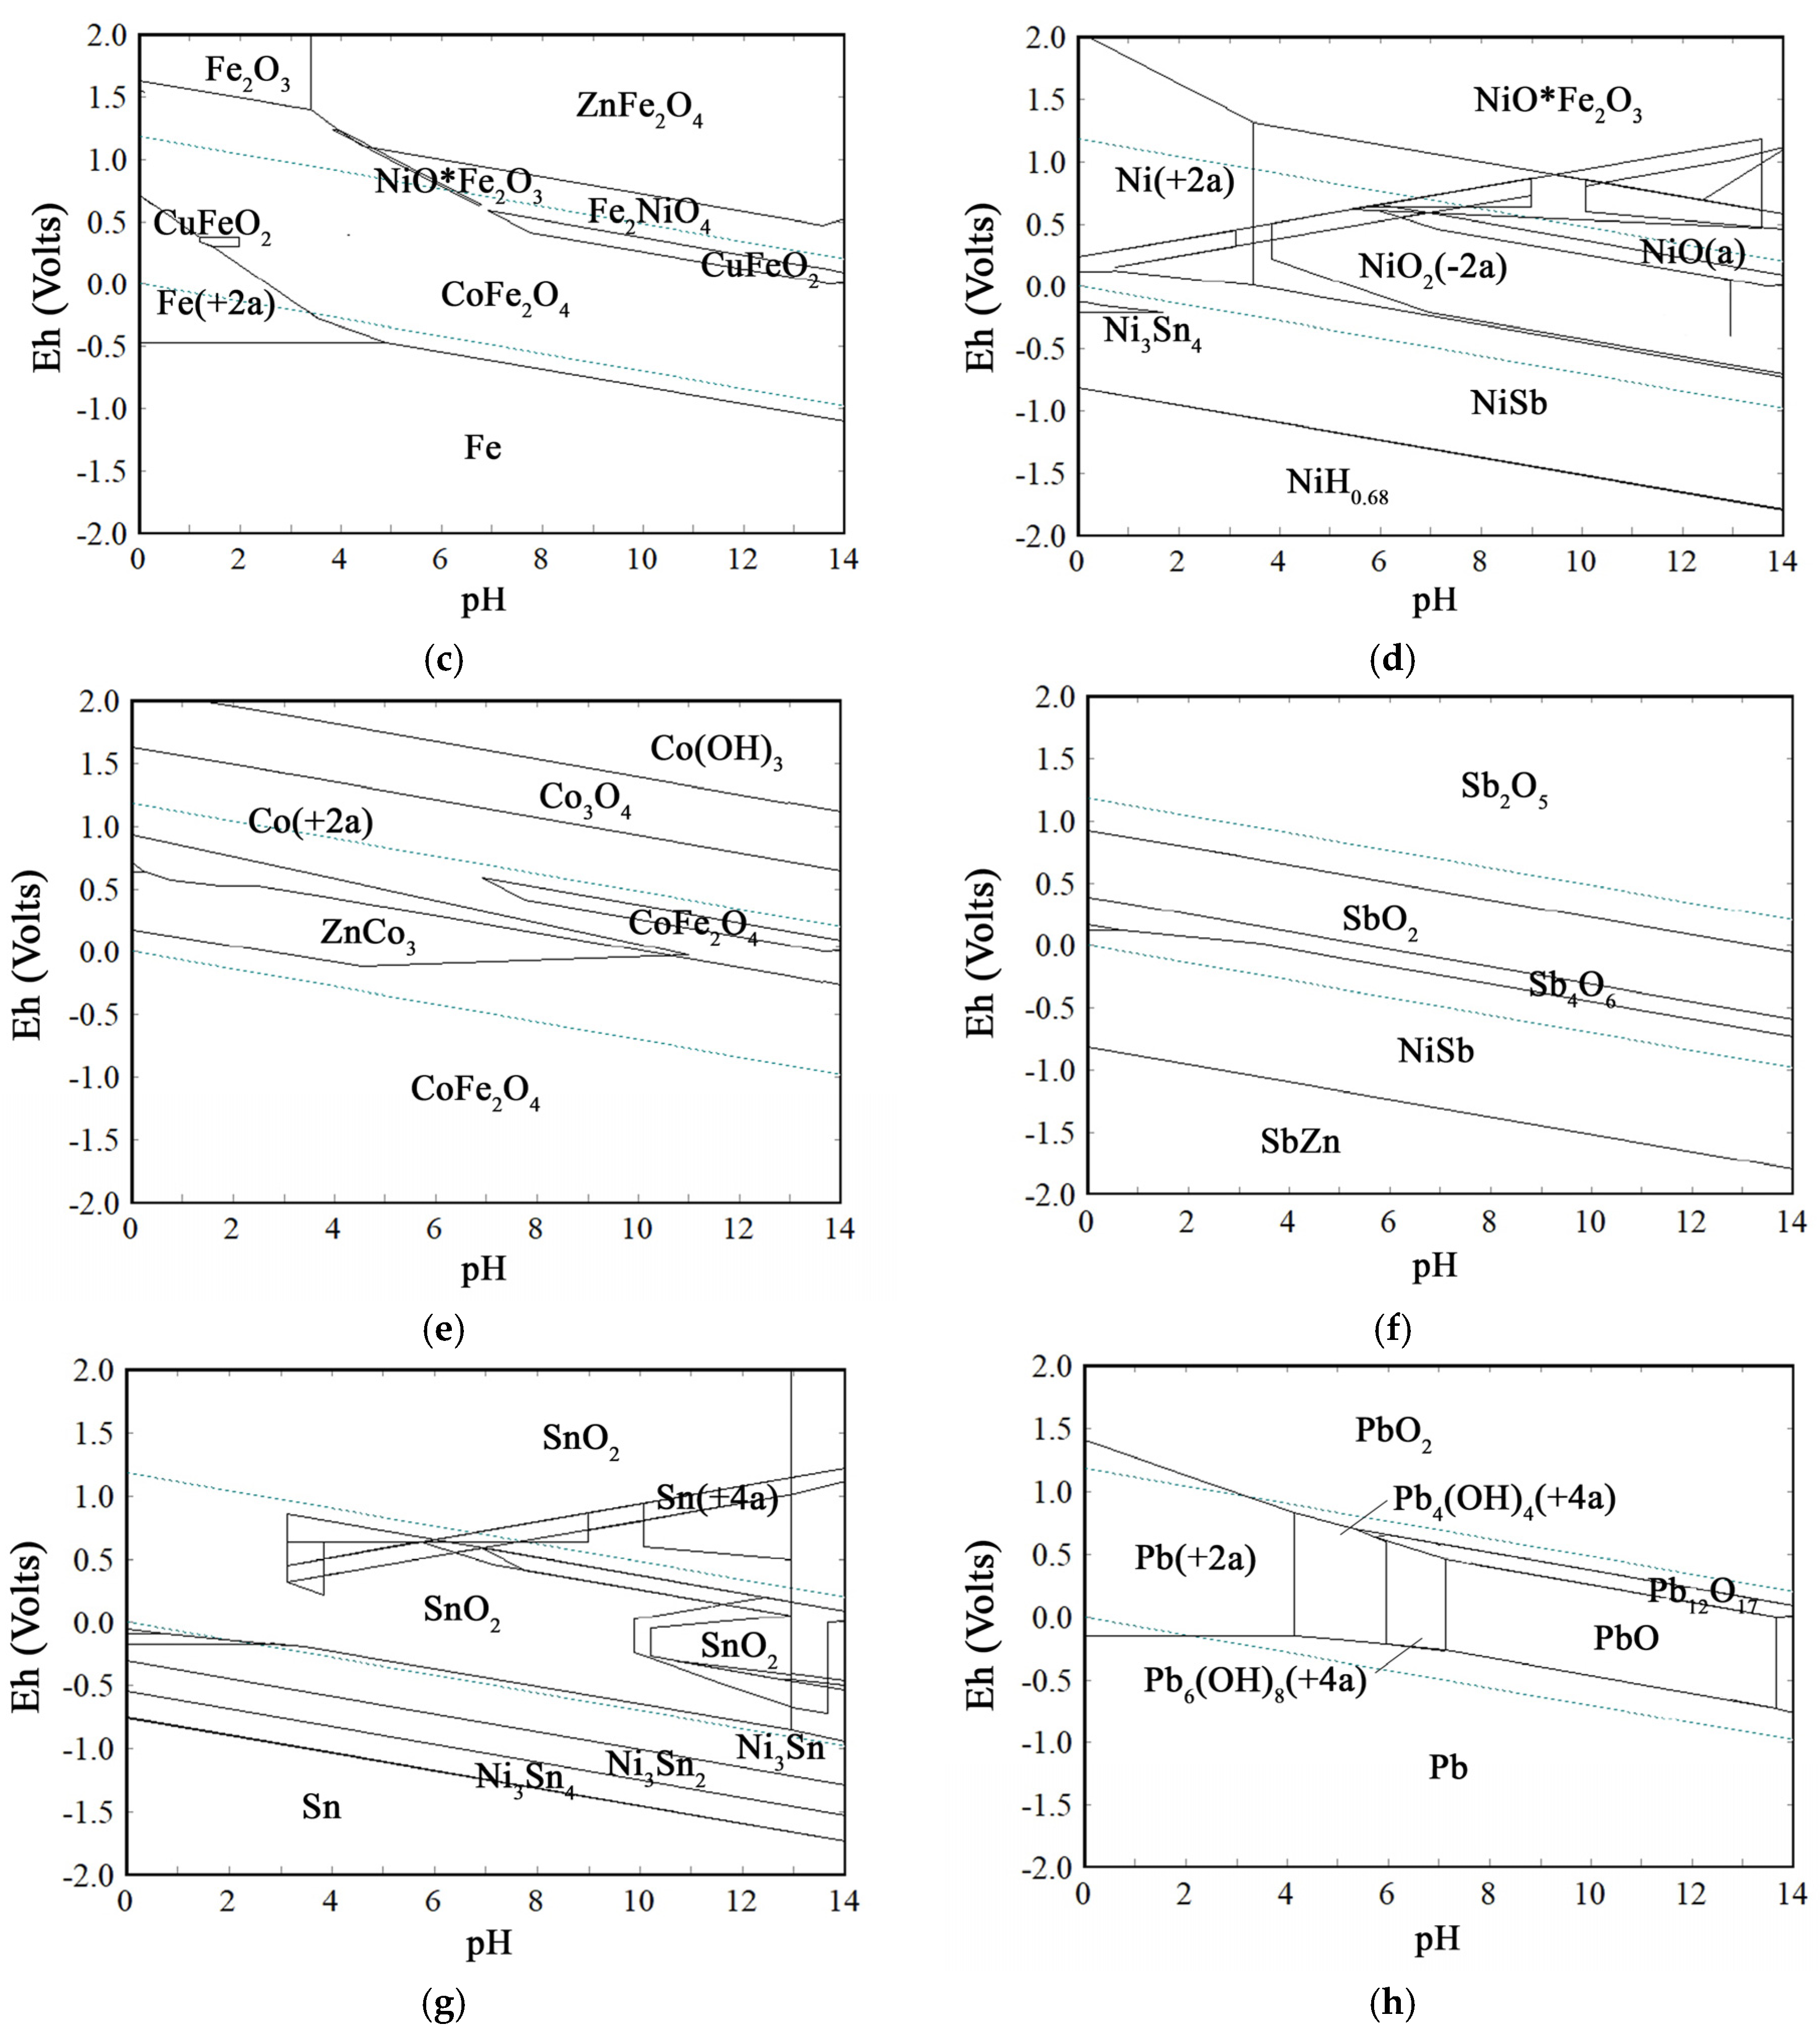
Stability of the different phases of metals was determined as a function of the electrochemical potential (Eh) and the pH, which are major parameters for determination of the conditions required for the leaching process. Pourbaix (Eh-pH) diagrams are presented on Figure 2.
Figure 2a–d show the stability regions of Cu, Zn, Fe and Ni, respectively. As presented, the stability of soluble ionic phase, M(2+a), of said metals is influenced by both Eh (>0.0 V) and pH (<3). In negative regions of electrochemical potential (Eh < 0.0), metallic forms are stable, while at pH > 3, various combinations of oxides, hydroxides, and oxyhydroxides are stable. On the contrary, the soluble form of Co is highly influenced by electrochemical potential, where in only a small region of Eh in between 1.0–1.5 V of Co(2+a) is in stable phase, whereby this region narrows as pH increases(Figure 2e). A similar situation is observed in the case of Sb, Figure 2f, with the exception that in complete pH range and Eh in between 0.5–1.0 V, various oxides of Sb are stable.
According to the results presented in Figure 2g,h, both Sn and Pb have soluble forms within certain regions of pH (>6) and Eh in between 0.0–0.5 V. However, unlike Pb, which has stable soluble phase Pb(2+a) at pH < 4 and Eh > 0.0 V, for almost all values of pH and Eh > 0.0 V, the stable phase of Sn is SnO2.
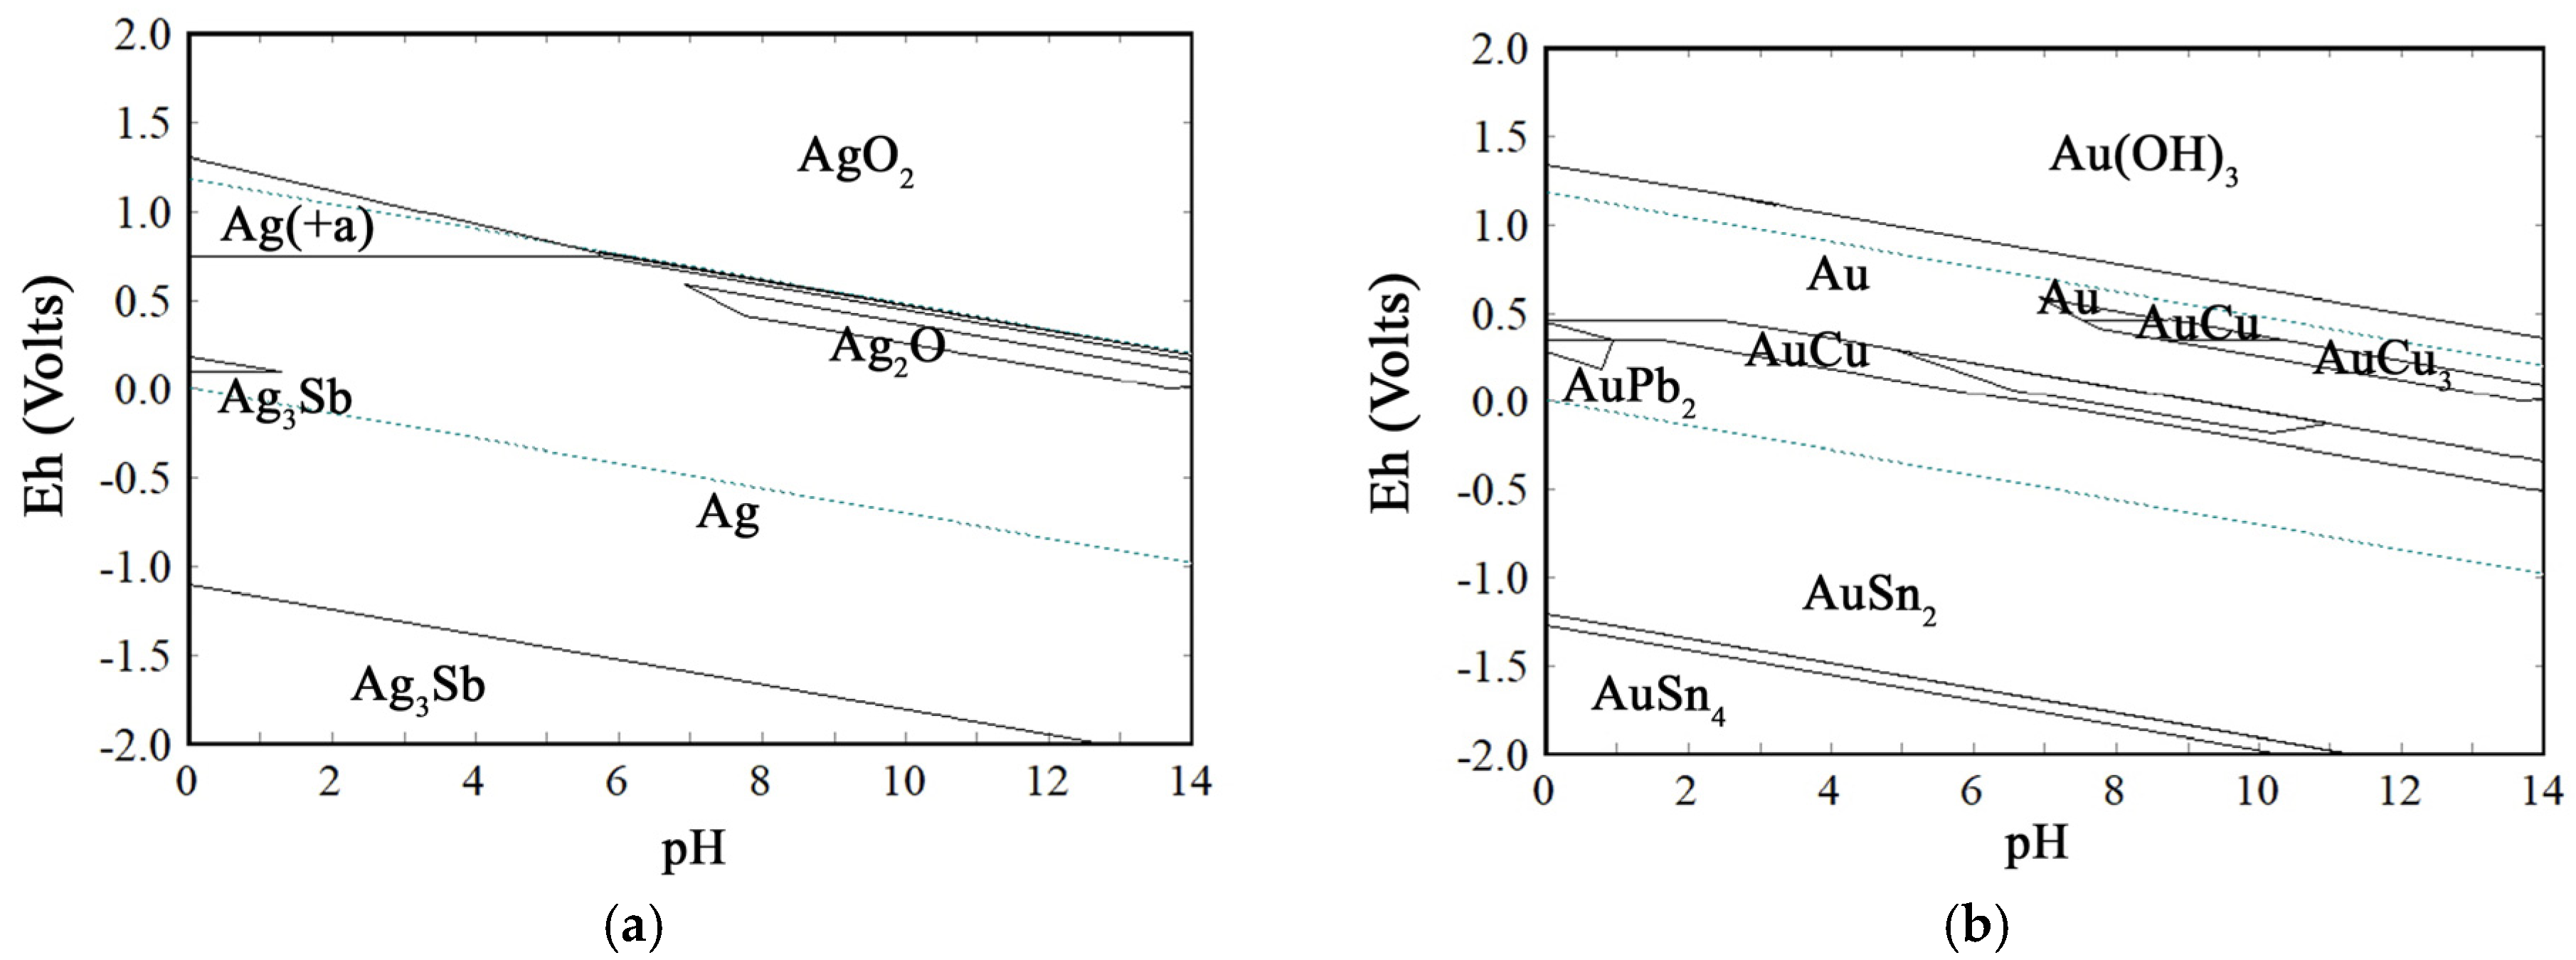
On contrary to Au, where the phase stability analysis confirmed its limited solubility, i.e., in most regions Au form is dominate, analysis of the phase stability of Ag, Figure 3a, showed that soluble form is influenced with highly oxidative conditions and may be achieved at Eh > 1.0 V and pH < 4.
During the calculations, it was determined that temperature (if changed from 25 to 80 °C) and concentration (if changed from 1/10 to 1/100 mol/dm3/kg H2O) does not have significant influence on the type of phase in which stability prevails, but only on the stability region, shifting the regions insignificantly to higher or lower values of pH and Eh. This is the reason why figures for different temperatures and concentrations were excluded.
Since investigations of phase stability showed that the majority of investigated metals have their soluble forms in acidic (pH < 4) and oxidative (Eh > 0.0) regions, further theoretical investigations were focused on thermodynamic modeling of the possible chemical reactions of the metals with the selected acidic leaching agents: sulfuric, nitric, and hydrochloric acid.
Accordingly, values of standard-state free energy (ΔGᶿ) for reactions of metals with H2SO4 and H2O2, within the predefined temperature range (25–80 °C), are presented in Table 2.
Analyzing the results presented in Table 2, negative values of ΔGᶿ for Equation (1) suggest that H2SO4-H2O2 could represent a suitable system for BM leaching. Also, a slight decrease of ΔGᶿ suggests that in the investigated temperature range, its increase has a positive effect on BM leaching kinetic. However, according to values of ΔGᶿ for Equations (3) and (4), in an oxidative sulfate system, the reaction of Sn with H2O2 is dominant, resulting in intensive oxidation of Sn in highly stable hydrolyzed tin (IV) oxide, H2SnO3, and/or SnO2 × xH2O. In addition, although reaction between metallic Ag and H2SO4 is disfavored according to Equation (5), a reaction may be expected as a result of partial oxidation of Ag, since Ag2O may be subsequently dissolved in H2SO4 (refer to Equations (6) and (7)).
Values of standard-state free energy of possible chemical reactions of metals with HNO3 and HCl, within the predefined temperature range (25–80 °C) are presented in Table 3 and Table 4.
Analysis of possible chemical reactions of metals with HNO3 and negative values of ΔGᶿ for Equation (8) indicate spontaneous character of reactions which means that all BM including Ag can be easy dissolved in HNO3. However, comparing the values of ΔGᶿ for the reactions Equations (9) and (10), the dominant reaction of Sn with HNO3 is intensive oxidation to highly stable SnO2 × xH2O. An analogue situation is observed in the case of Sb, where oxidation to Sb2O3 represents the dominant reaction, as in Equation (11).
In case of HCl, negative values of the ΔGᶿ calculated for the reactions defined with Equations (12) and (13) indicate that Sn along with other BM (Pb, Zn, Fe, Ni, Co) may be dissolved in HCl. However, comparing the values of the ΔGᶿ, Equations (16)–(19), leaching of Au and Cu is dependent on the presence of an oxidizing agent. In addition, the low value of ΔGᶿ for the reaction of Ag with HCl, as in Equation (14), points out that the transformation of Ag to stable solid salt AgCl may occur.
In line with the results obtained after theoretical reconsiderations, it may be concluded that the majority of investigated metals may be leached using the aforementioned mineral acids. However, the obtained results indicate that the main drawback is related to the limited selectivity in this highly complex system, which is the consequence of the different hydrometallurgical behaviors and properties of metals contained within WPCBs. This eventually may influence overall process selectivity, if priority of leaching operations is not designed properly.
Contrary to the high selectivity of H2SO4 for BM leaching, the ability of HNO3 to dissolve the majority of metals can be seen as a disadvantage rather than an advantage, because in subsequent recovery steps, multi-metal composition of PLS highly complicates their selective recovery. On the contrary, usage of HCl showed better properties in terms of selectivity, i.e., possibility for selective recovery of Pb and Sn. However, the main disadvantage is related to the possible transformation of Ag to highly stable AgCl, which is why this leaching operation should be performed only after Ag leaching.
These findings were essential for the definition and relative order of hydrometallurgical operations. Accordingly, implementation of successive leaching steps using H2SO4, HNO3 and AR may result in selective recovery of BM, Pb and Ag, and lastly, Au. Additionally, due to the fact that successive usage of H2SO4-HNO3-AR does not require significant adjustments of pH, laboratory tests investigating possibility of selective metals recovery from mechanically treated WPCBs were organized as follows:
- Oxidative sulfate leaching of BM, specially referenced to Cu leaching and recovery, was investigated as the first processing step,
- Following the Cu recovery and removal of other BM, leaching and recovery of Pb and Ag using HNO3 was investigated as a second processing step,
- Au recovery using AR solution was investigated as the last processing step.
3.3. Laboratory Tests
3.3.1. Cu Leaching and Recovery
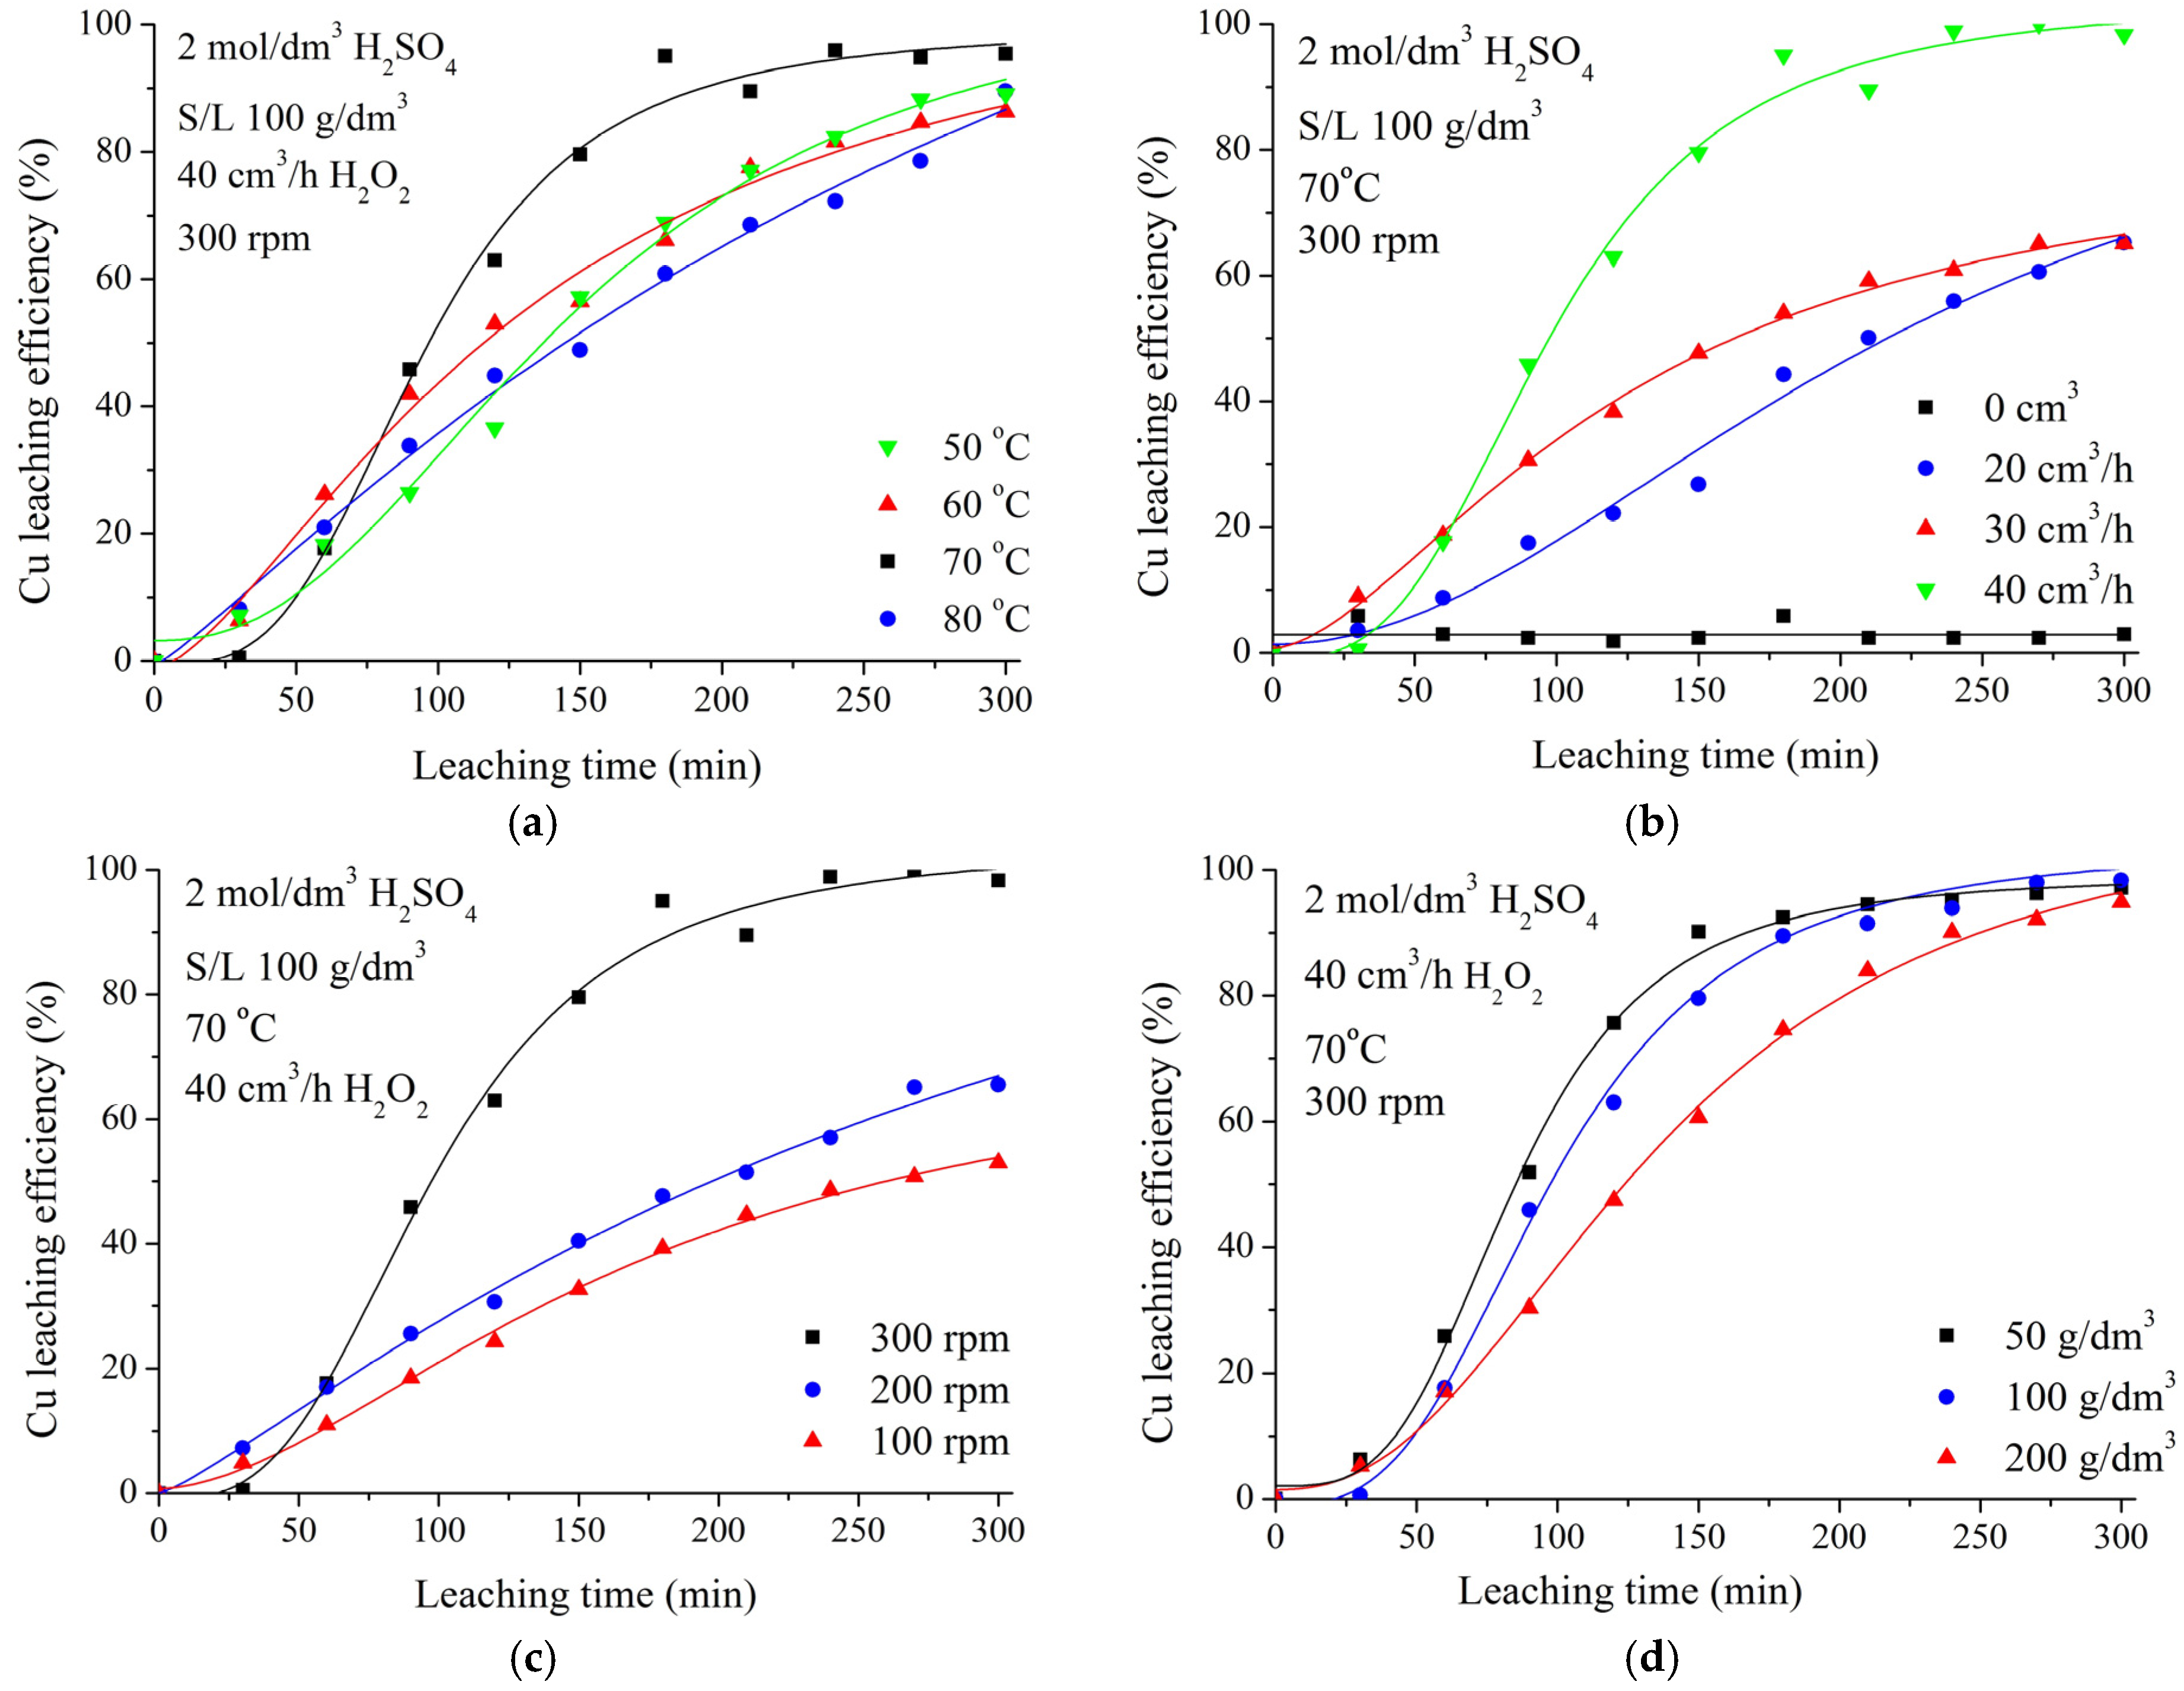
Influence of various process parameters on Cu leaching efficiency is presented on Figure 4a–d.
Considering the positive effect on leaching kinetic determined in the theoretical analysis, influence of temperature was investigated in the range of 50–80 °C. As seen from results presented in Figure 4a, temperature has no significant influence on overall process efficiency, giving the high leaching efficiencies for all analyzed temperatures. However, in terms of leaching kinetic, the highest leaching rate was obtained at 70 °C. Due to rapid decomposition of H2O2, further temperature increase had no significant impact on the Cu leaching efficiency.
Investigating the influence of oxidizing agent addition, as presented in Figure 4b, Cu leaching efficiency increases with the increase of H2O2 concentration, as a result of oxygen produced from the decomposition of H2O2 and which acts as oxidant in the reaction with metallic Cu.
Figure 4c shows that an increase of the stirring rate has a positive impact on Cu leaching efficiency. This may be a consequence of the complex and composite structure of WPCBs, where in the case of inappropriate mixing of suspension, heavier, metal-bearing particles are remaining at the bottom of the reactor, covered with lighter particles of non-metallic materials, affecting the metal’s accessibility to the leaching agent. Due to highly achieved leaching efficiency, the further increase of stirring rate was not investigated.
Investigation of S/L ratio influence on Cu leaching efficiency, presented in Figure 4d, revealed that S/L ratio has no significant effect on overall leaching efficiency, but only on leaching kinetic, meaning that lower S/L ratio allows achievement of the same Cu leaching efficiency in shorter leaching time.
From the presented experimental results, it can be summarized that optimum conditions for Cu leaching using 2 mol/dm3 H2SO4 solution as leaching agent, are as follows: temperature of 70 °C, S/L ratio of 200 g/dm3, H2O2 addition 40 cm3/h, time of 5 h, and stirring rate of 300 rpm. By applying these conditions, achieved Cu leaching efficiency was 95.4%.
Sn Recovery
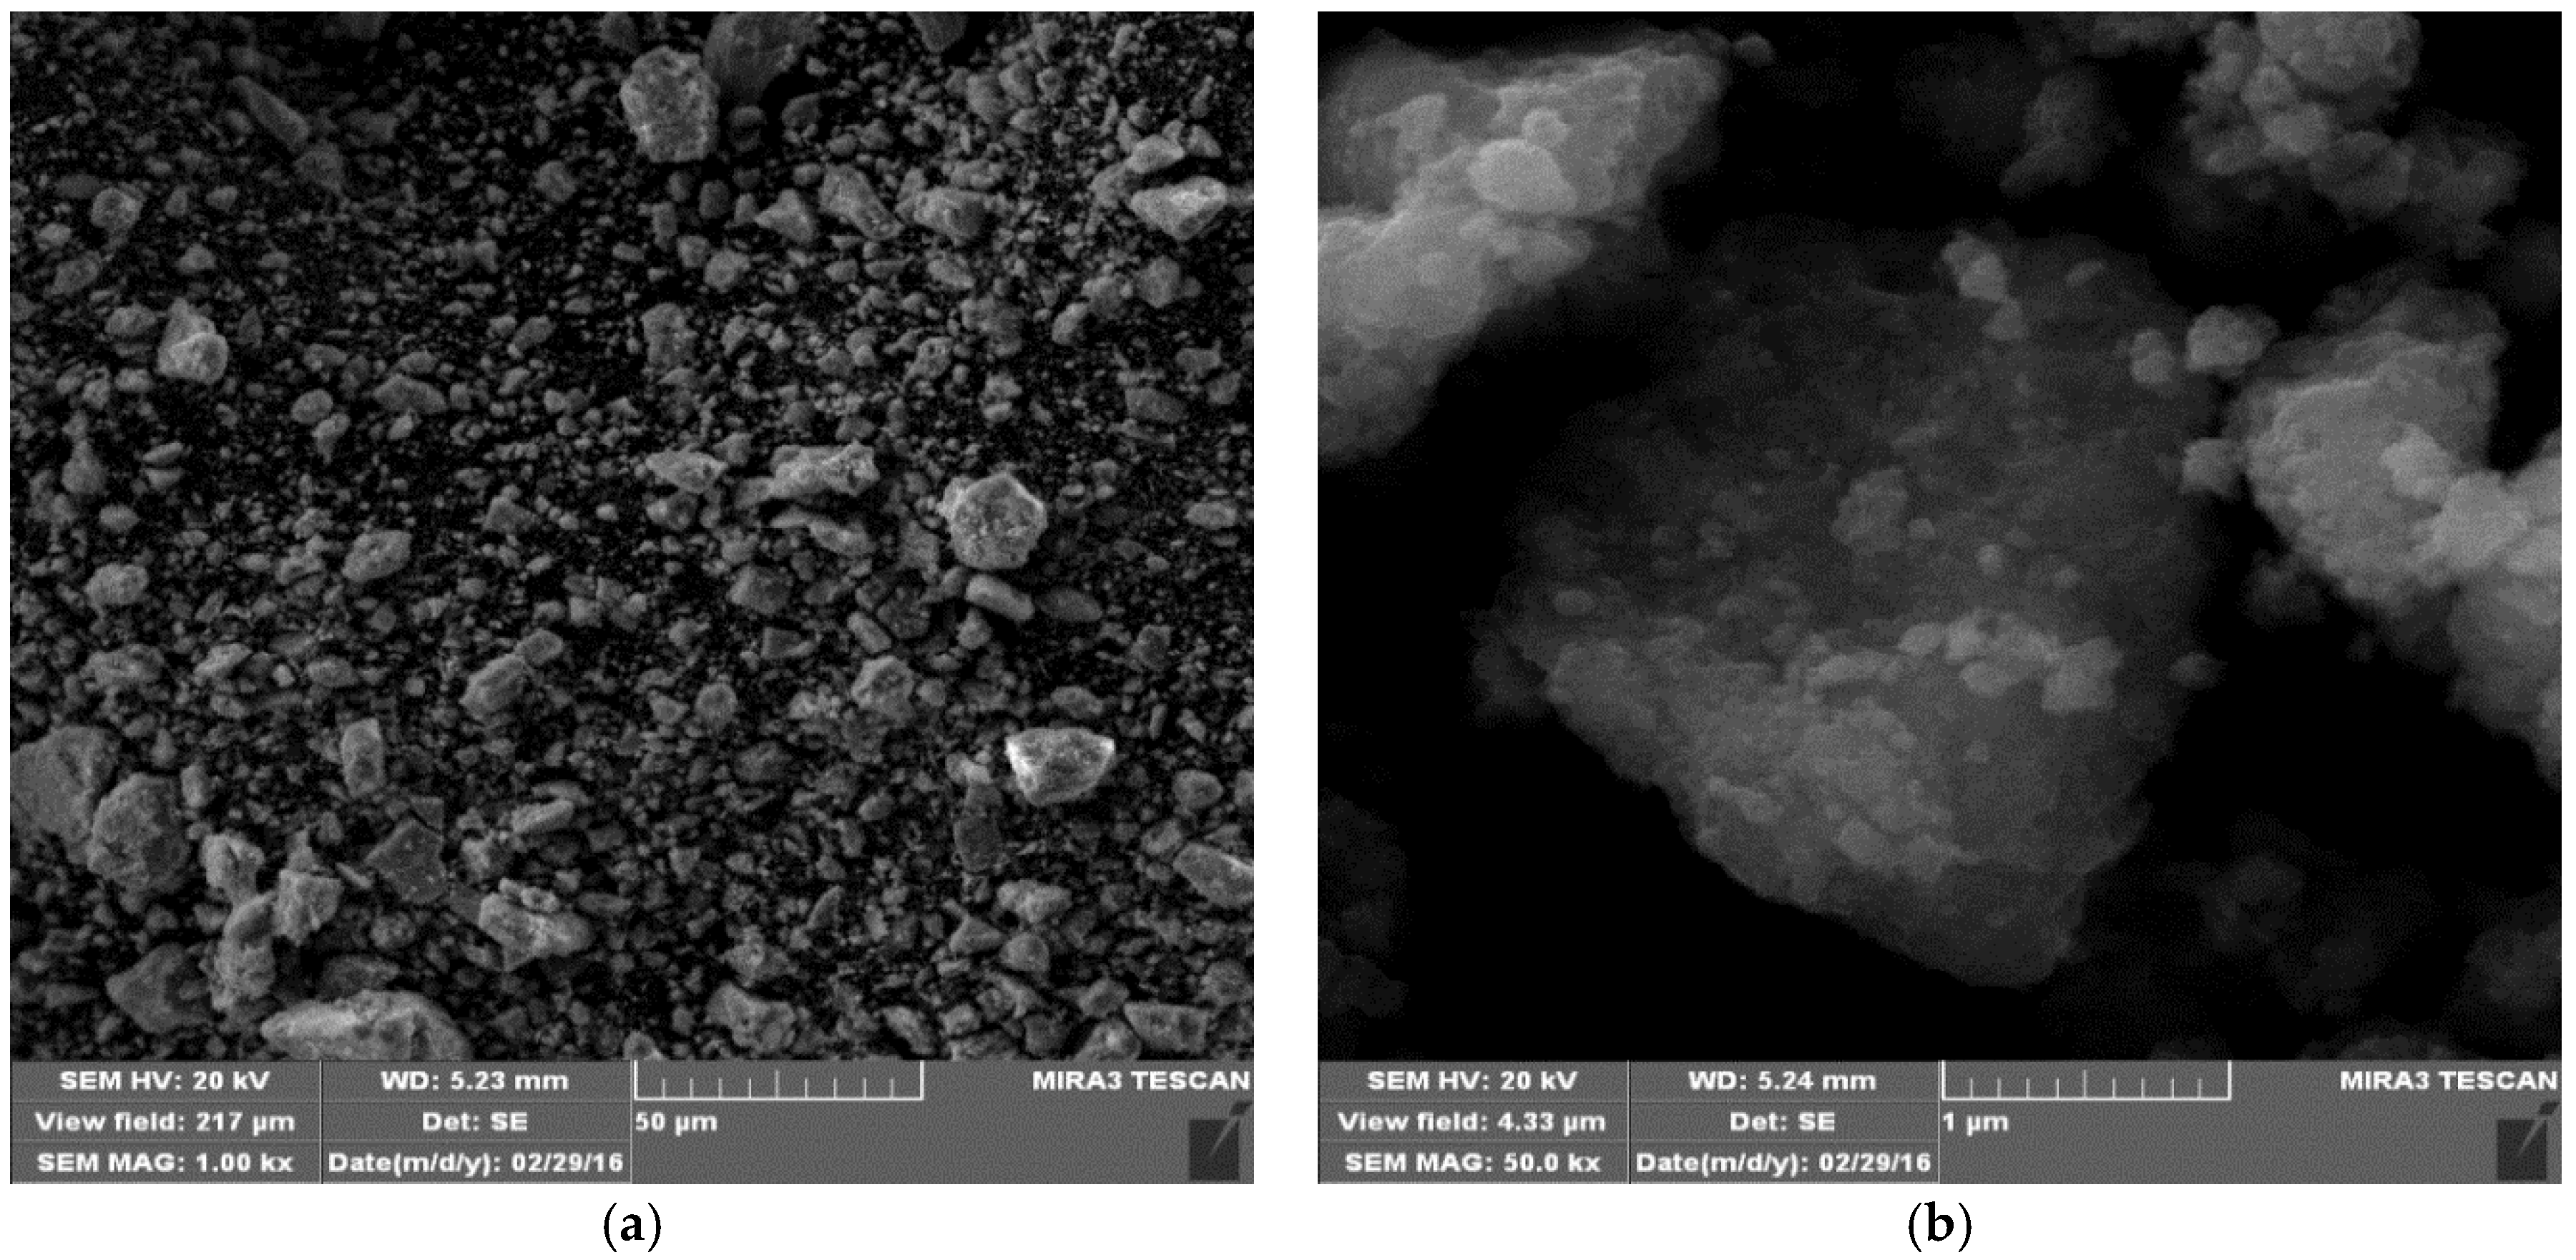
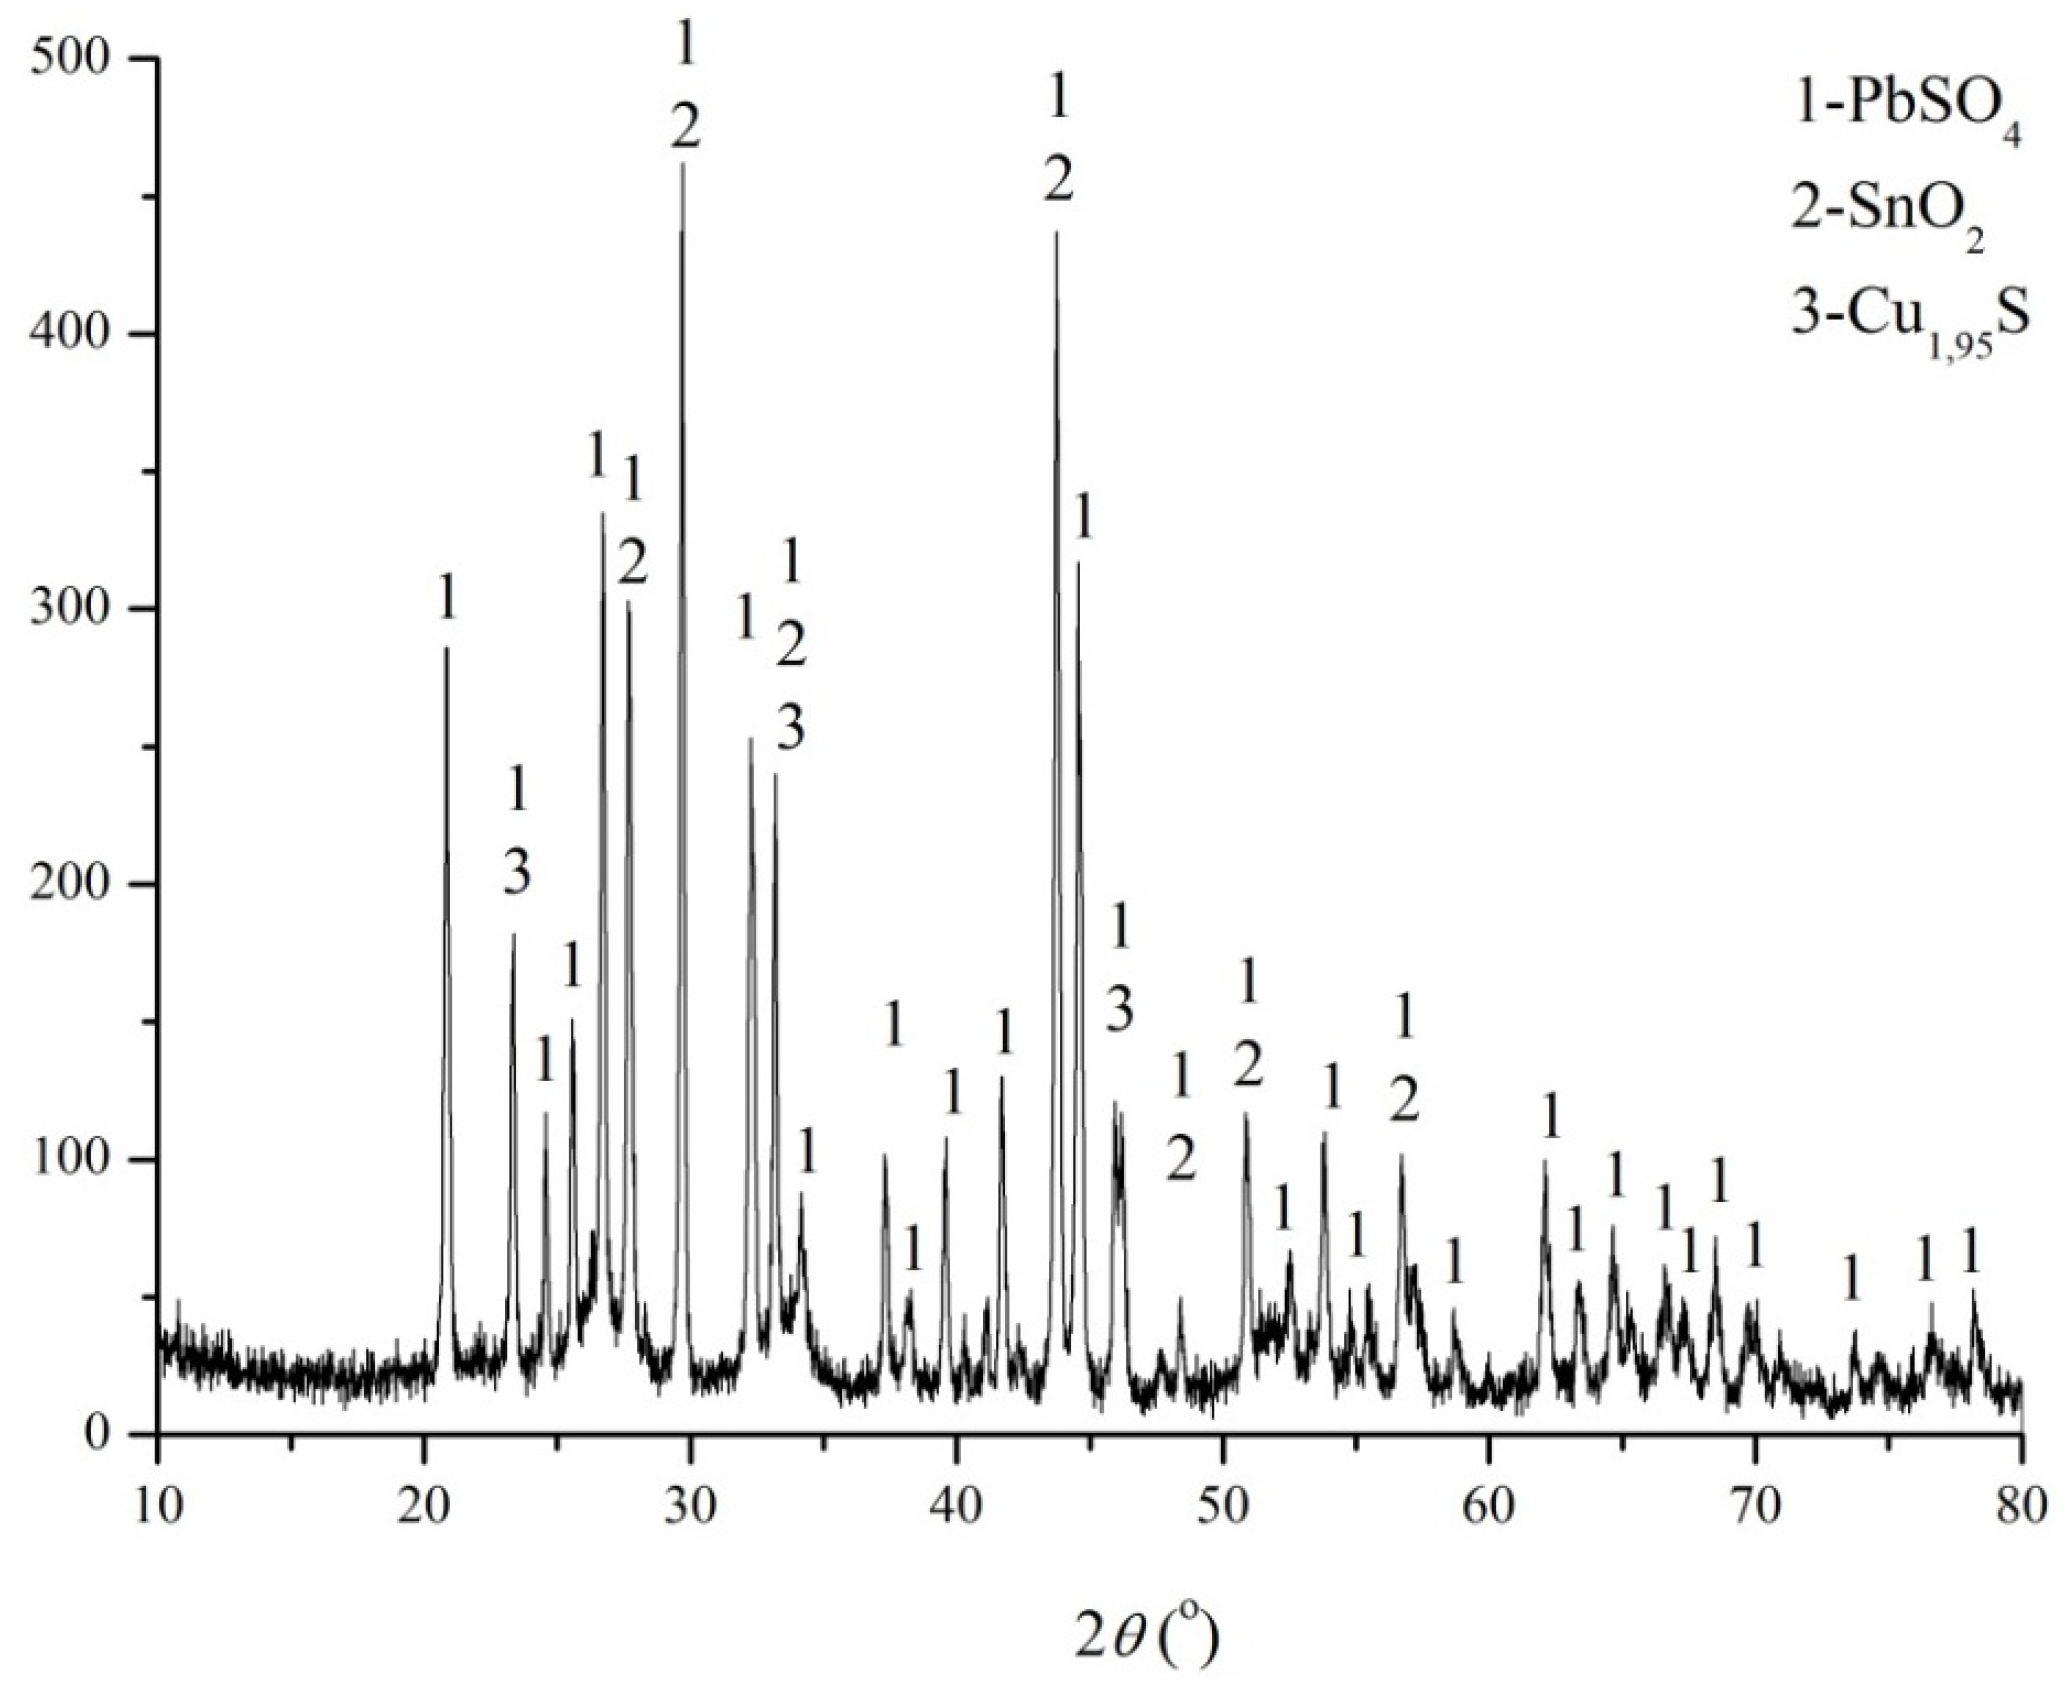
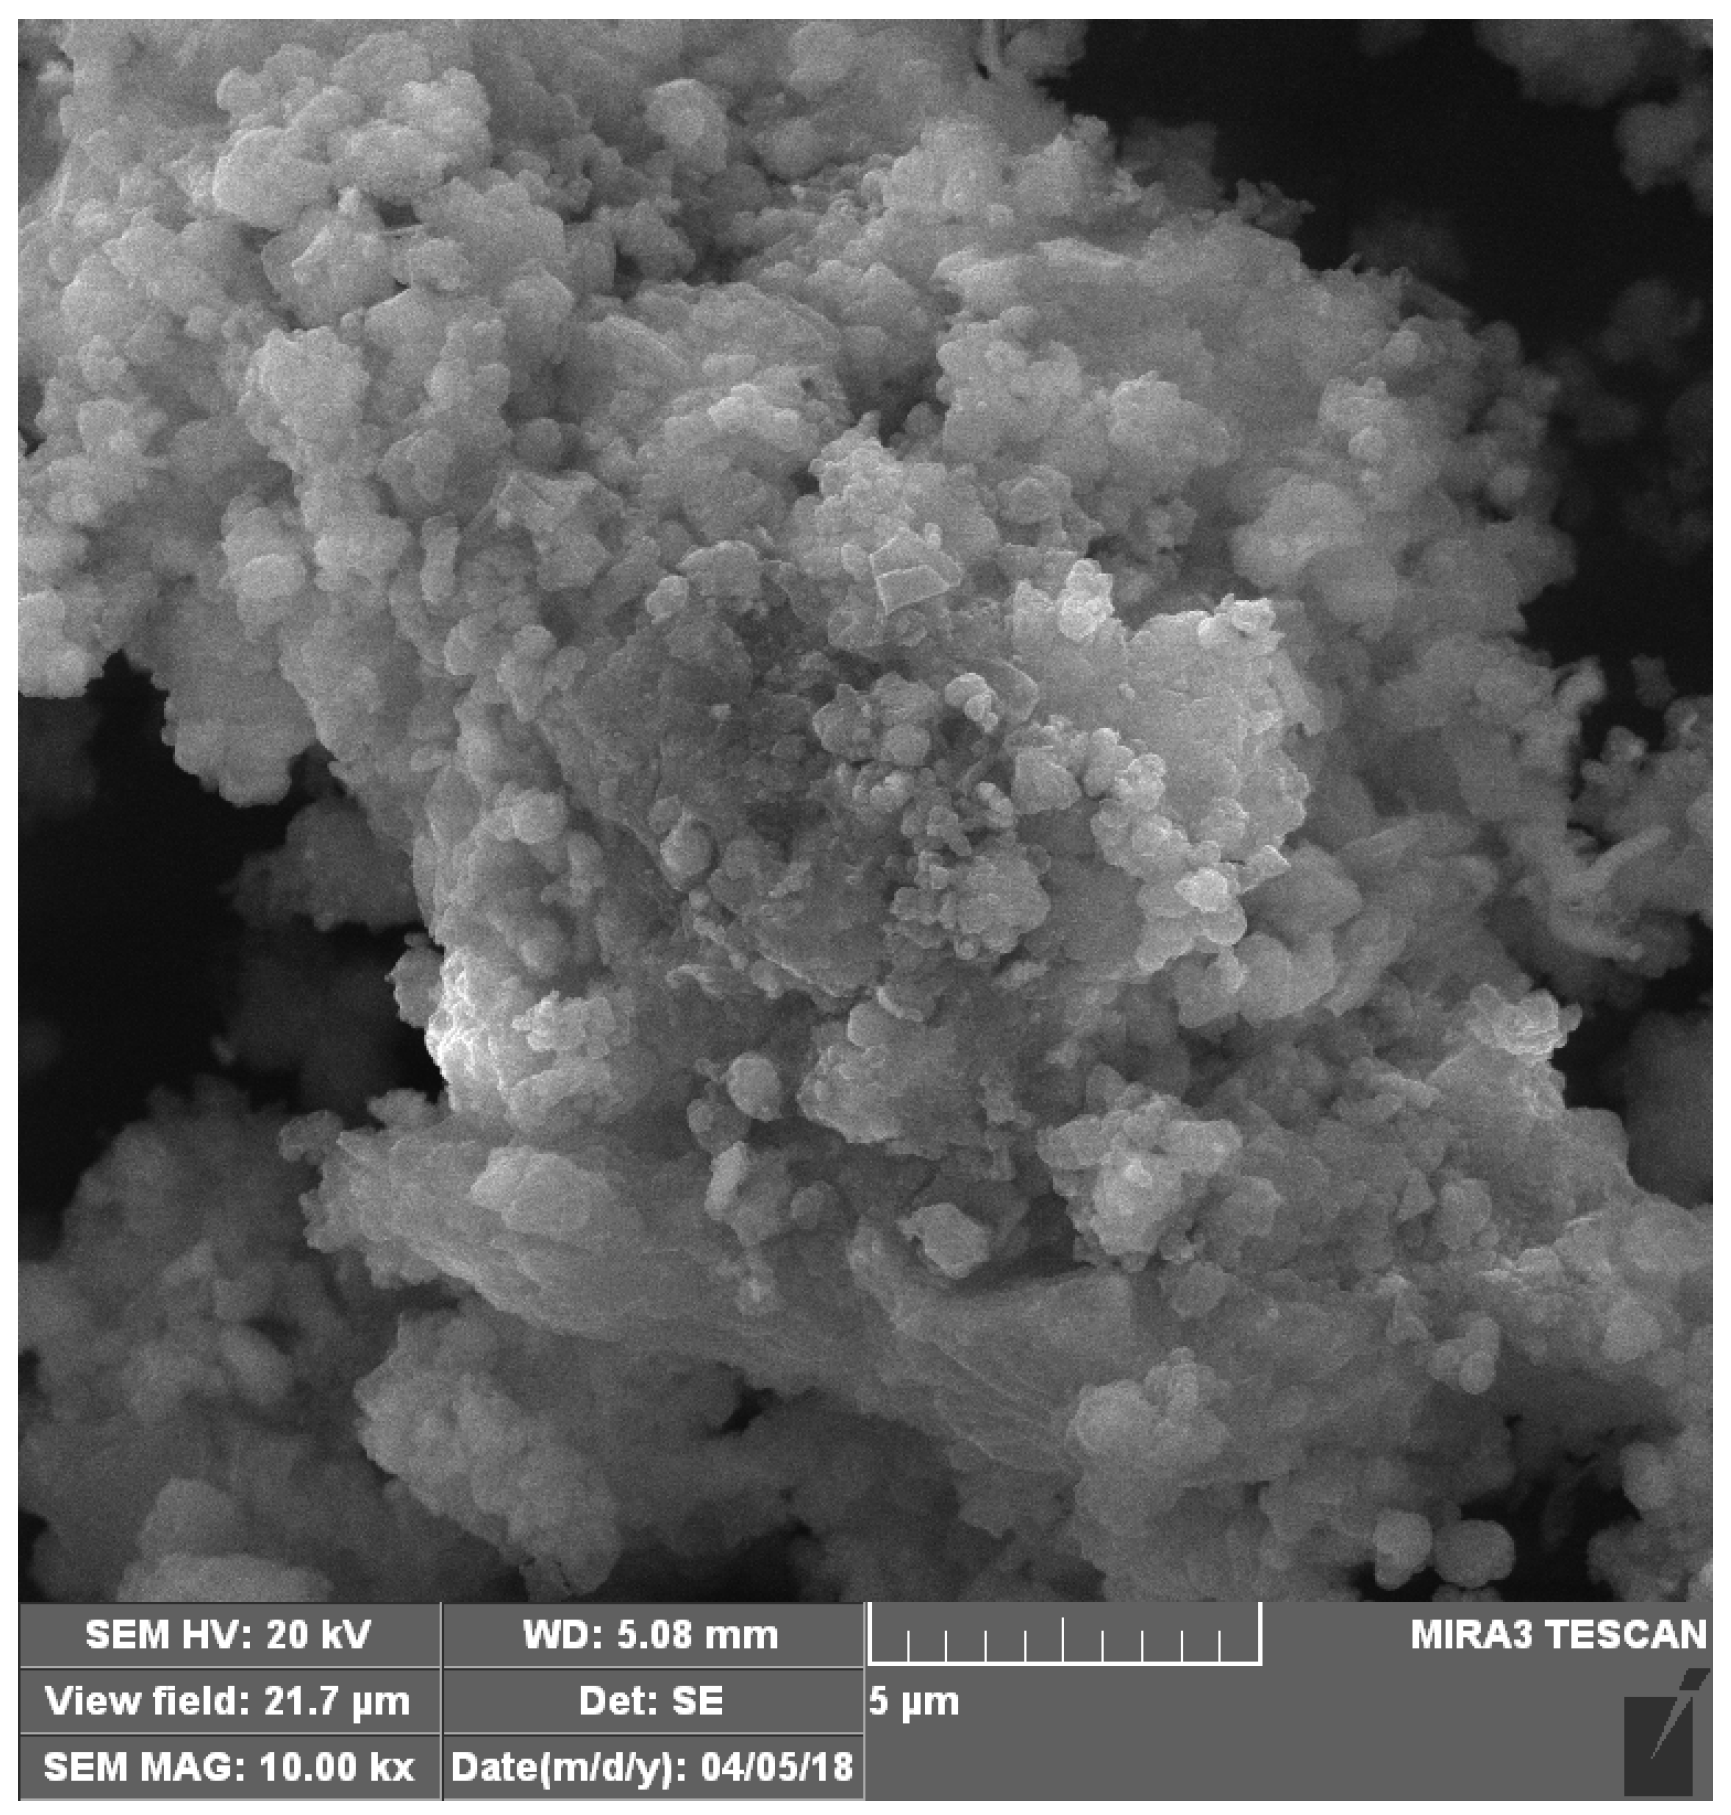
High concentration of fine suspended particles, present in most Cu leaching suspensions, was identified as the main reason for difficulties faced during the phase separation process. To further investigate this phenomenon, suspension obtained after the leaching test yielding highest Cu recovery was subjected to two-step phase separation, consisting of filtration and centrifugal separation. After washing and drying, morphology, phase composition, and chemical composition of extracted suspended particles was subjected to SEM, XRD, and XRF analysis. According to obtained results presented in Figure 5 and Figure 6 and in Table 5, it was determined that the basis of extracted suspended particles represent Sn in the form of agglomerated stannic acid particles smaller than 1 μm.
Presented results confirm theoretical findings that in an oxidative sulfate system, transformation of Sn in highly stable stannic acid is the dominant reaction. Additionally, according to mass balance, it is calculated that 55.4 wt. % of total Sn contained in investigated WPCBs may be easily extracted in form of mixture of H2SnO3 and SnO2 × xH2O.
Ag Cementation
Cementation of Ag was investigated using leaching solutions from the last three tests of Cu leaching (Figure 4d influence of S/L). Content of Ag in solutions prior and after cementation, as average value of three different measurements, as well efficiencies of cementation process at various temperatures, are presented in Table 6.
As presented, the best results for Ag cementation were obtained at room temperature. Notable decrease in process efficiency on higher temperatures, 30 °C and 40 °C, most probably come from intensified dissolution of Cu powder. According to AAS analysis, Ag concentration in the leachates after Cu leaching step is in range of 11.85–29.91 mg/dm3, indicating that, comparing to total content of Ag in WPCBs, on average 3.10 wt. % of Ag may be expected in solutions after Cu leaching.
EW Recovery of Cu
In the final phase of Cu leaching and recovery, laboratory tests for Cu electrowinning from leaching solution were performed. The tests were performed for 2 h. According to the results presented in Table 7, most adequate parameters for scaled-up Cu EW recovery, considering the Cu quality and current efficiency, were adopted as follows: 2.2 V, 250 A/m2, 40 °C, and 100 rpm. Under these conditions, Cu concentration in electrolyte prior and after EW was 48.43 g/dm3 and 32.25 g/dm3, respectively. Concentration of Fe in electrolyte was 1.68 g/dm3 and virtually unchanged during the process. According to results of XRF analysis, in obtained Cu deposits, only presence of Fe and Ni were detected. Ni concentration in all analysis was below 20 ppm. Copper recovery was enhanced by the second stage of the EW process. It was performed with ic = 135 Am−2 until the Cu concentration of 2 g/L. The obtained cathode deposit has lower purity (<99% Cu) but can be used for anode casting and further refined up to >99.97 wt. % Cu by standard procedure for electrorefining [27].
3.3.2. Pb and Ag Leaching and Recovery
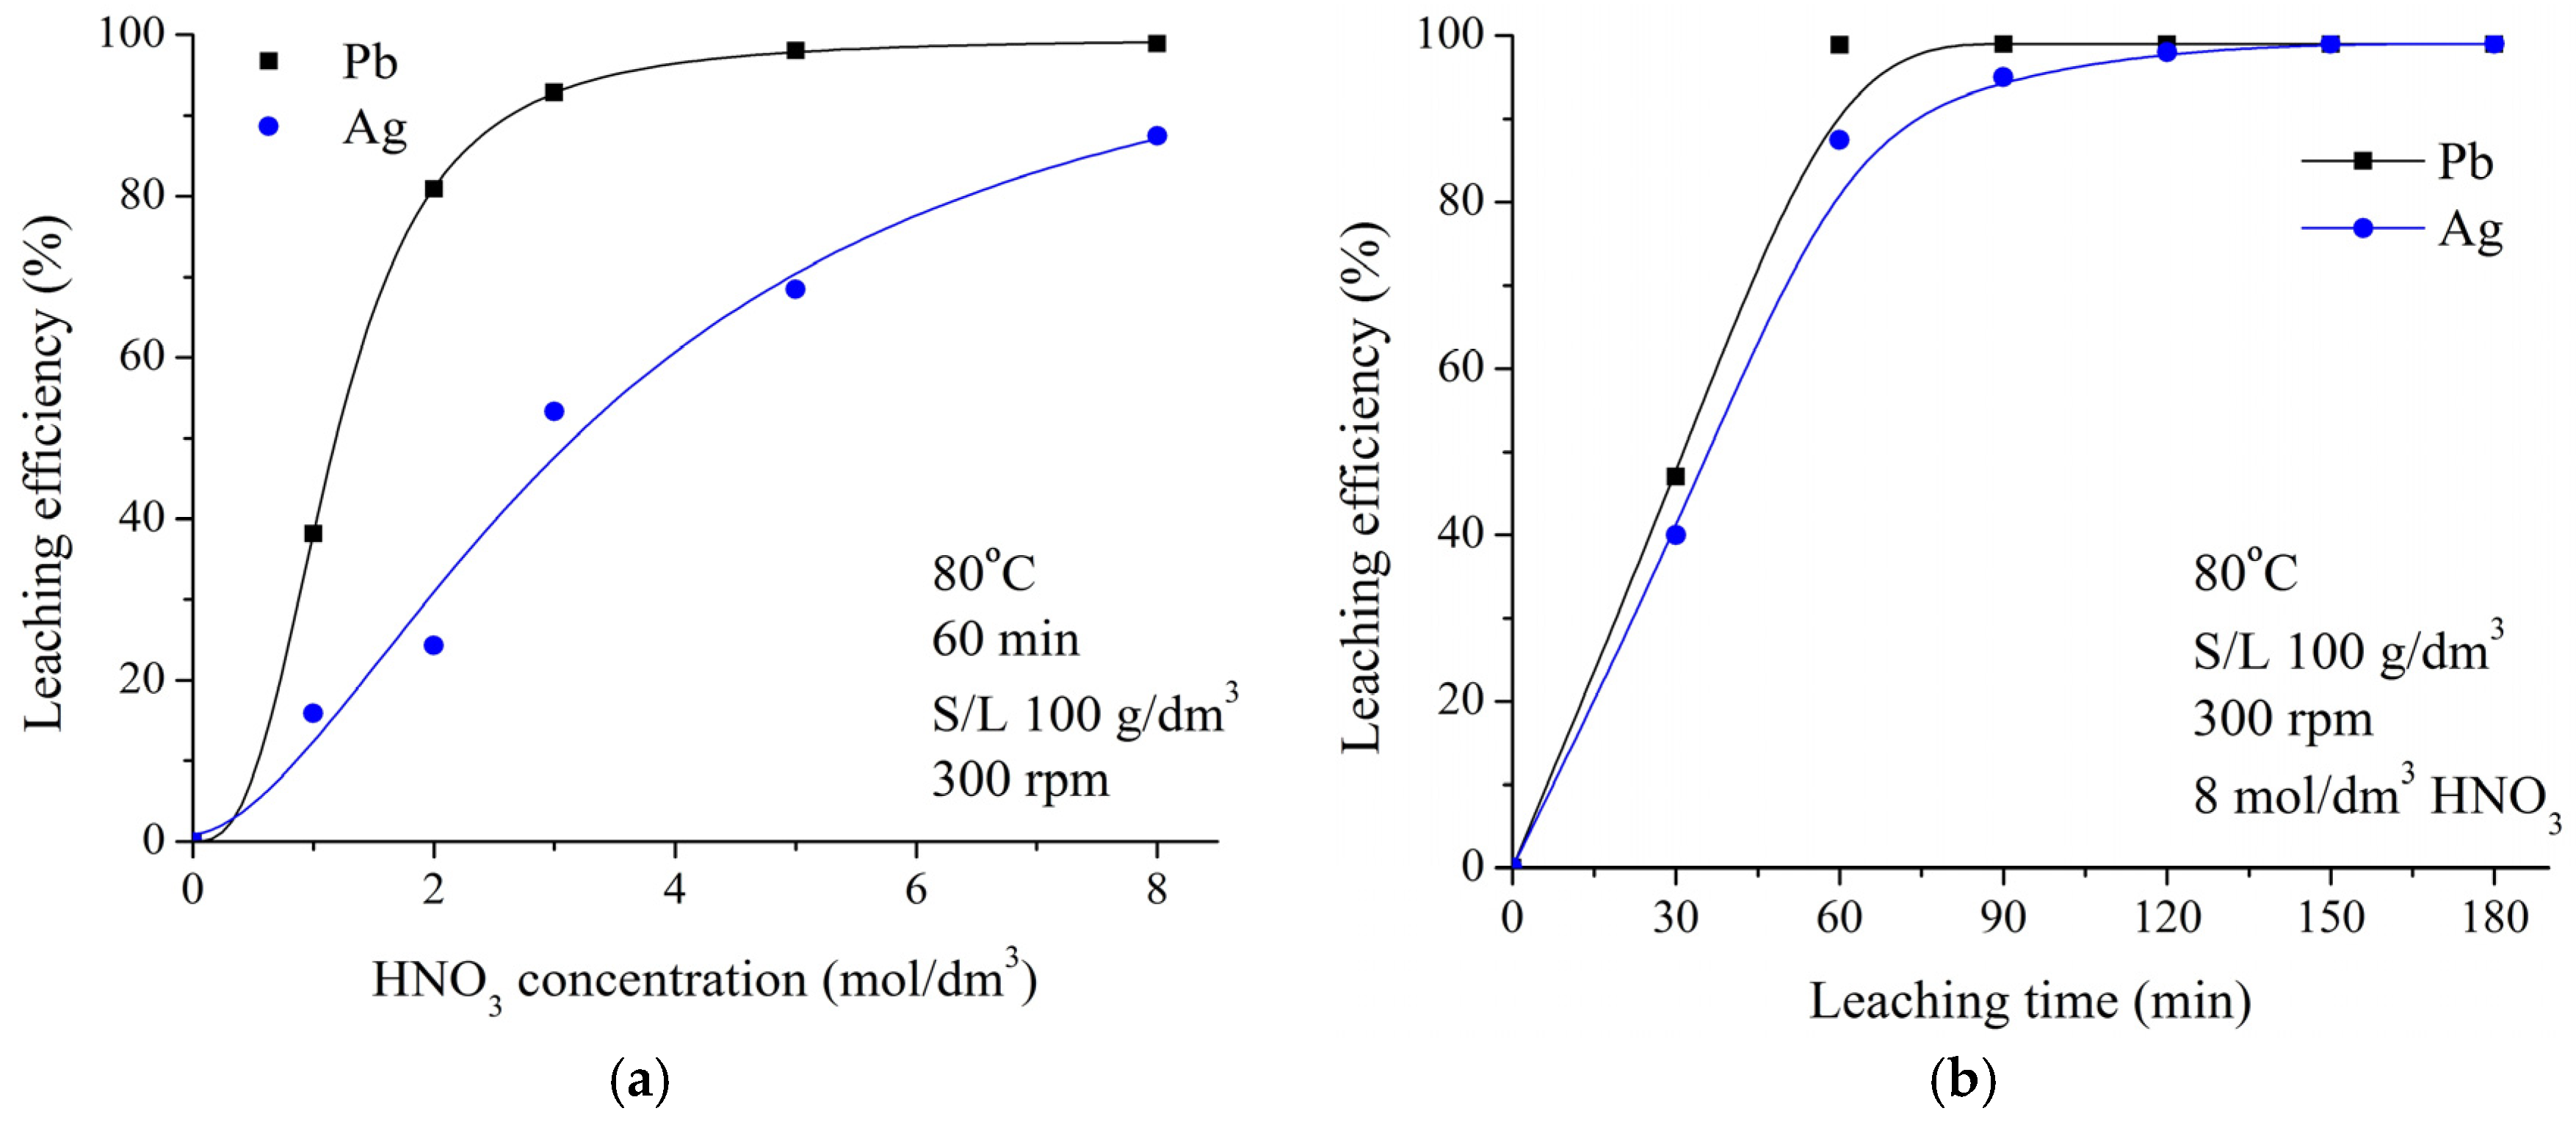
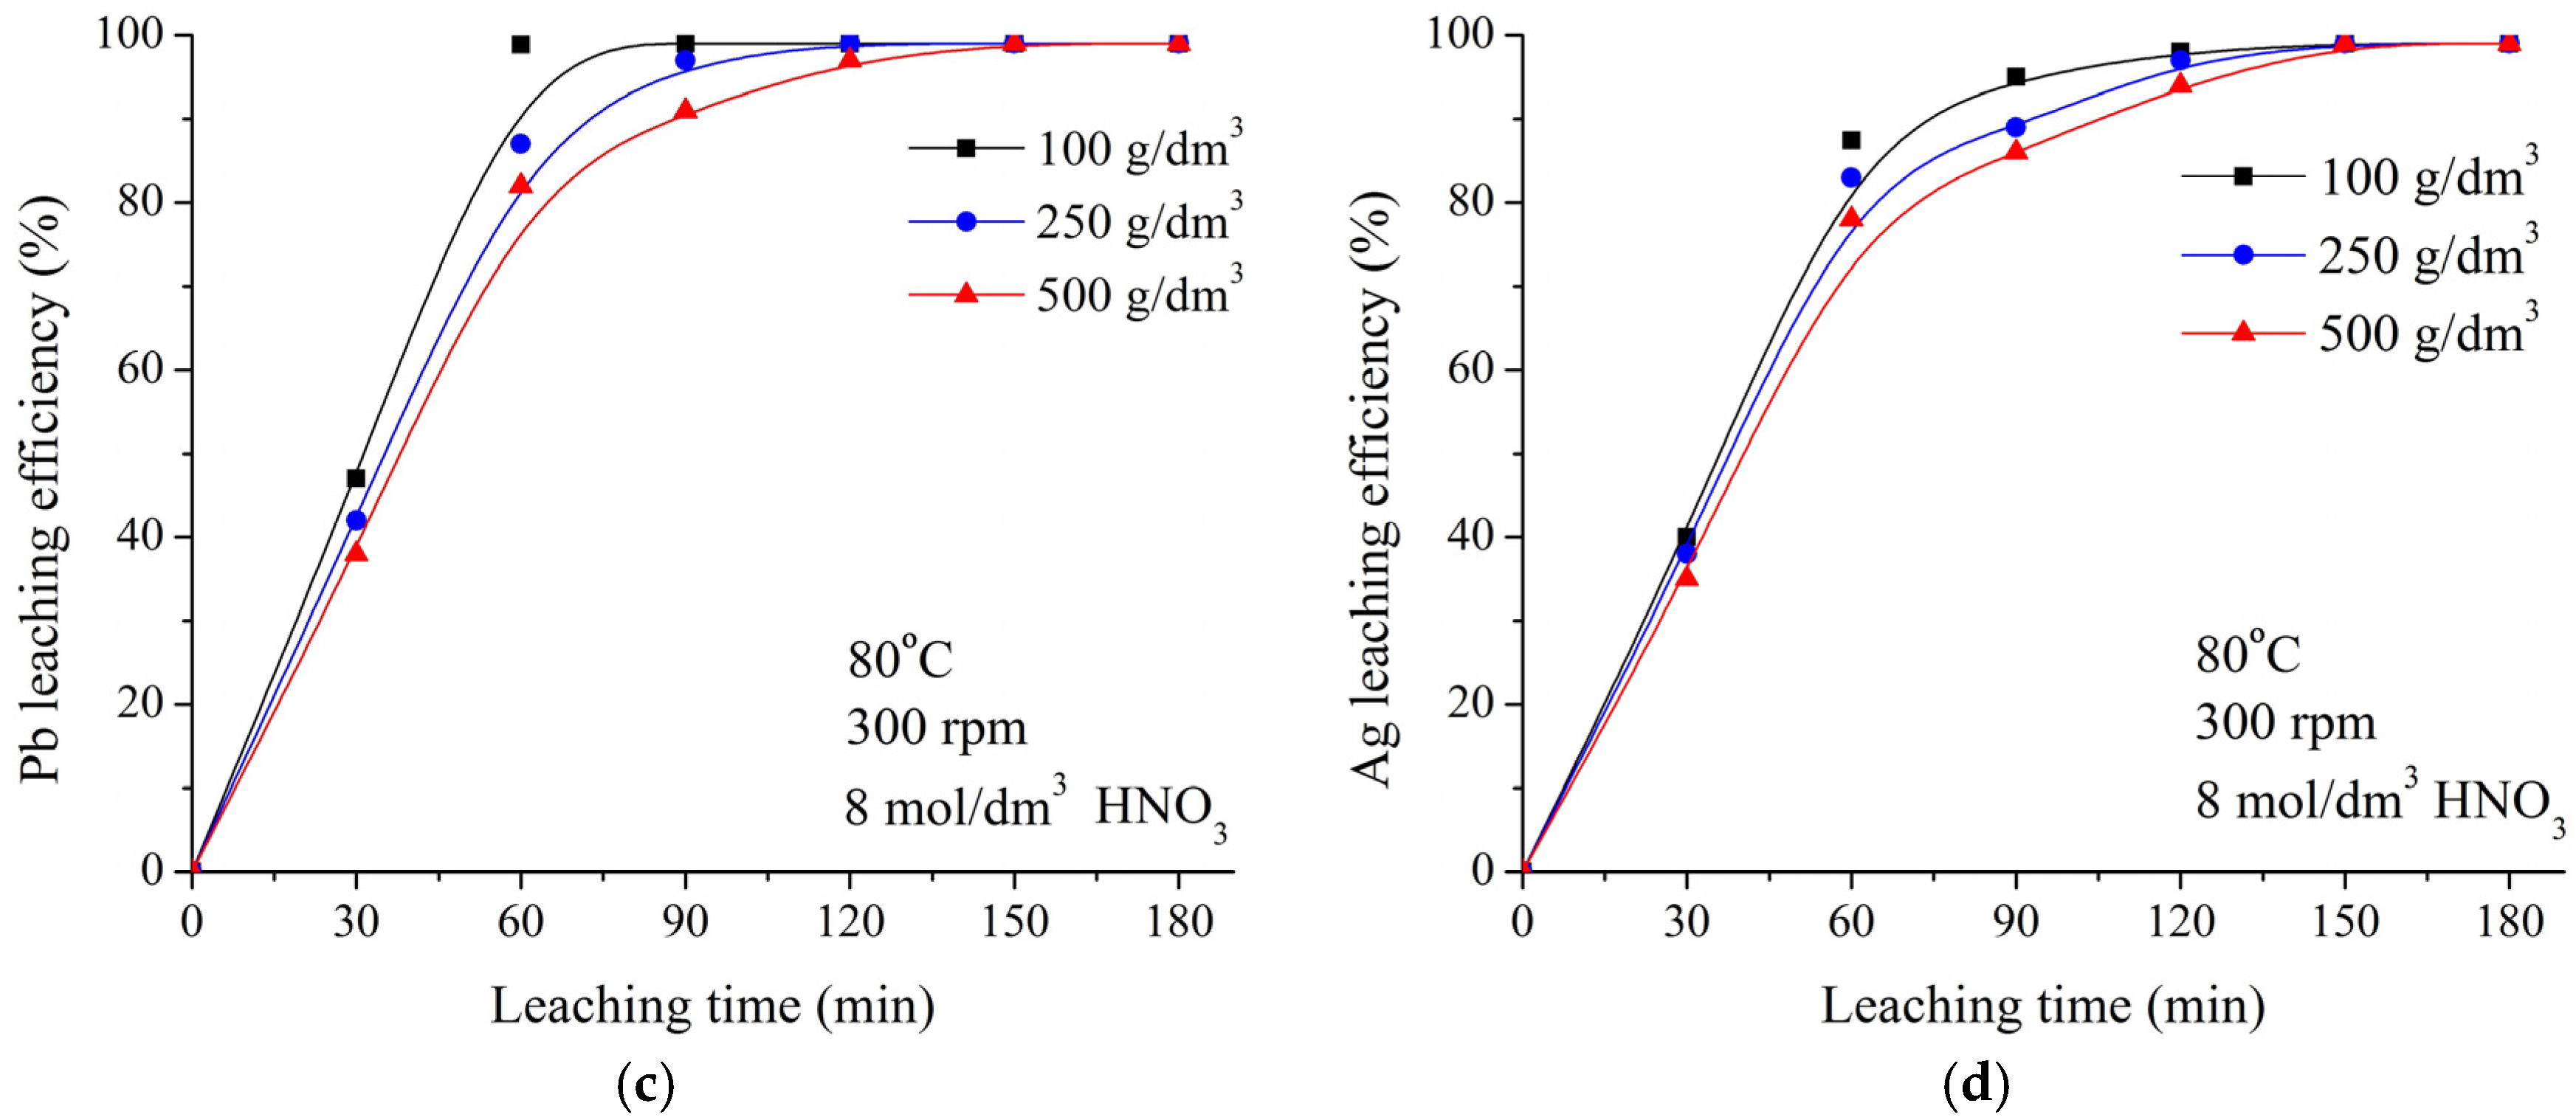
Figure 7a–d represents the influence of various process parameters on Pb and Ag leaching efficiency.
As presented in Figure 7a, acid concentration significantly impacts leaching efficiency, Ag in particular. Increasing the HNO3 concentration to 8 mol/dm3, after 60 min of leaching, achieved efficiency for Pb and Ag was over 98% and 87%, respectively.
Figure 7b shows influence of leaching time, revealing that prolonging the process duration for more than 120 min has no influence on already high Pb and Ag leaching efficiencies. Based on this conclusion and high achieved efficiencies for Pb and Ag leaching within first 120 min, leaching time of 2 h was adopted as optimal.
Figure 7c,d shows that S/L ratio has no significant influence on Pb and Ag leaching efficiency. The probable reason for obtained high efficiencies comes from the significant decrease of apparent density after removal of all base metals, from 889 to 520 kg/m3, and which consequently allows better mixing of suspension.
From the presented experimental results, it can be summarized that best results for Pb and Ag leaching were achieved using 8 mol/dm3 HNO3, temperature of 80 °C, S/L ratio of 500 g/dm3, time of 2 h, and stirring rate of 300 rpm. By applying these conditions, achieved Pb and Ag leaching efficiency was 98.5% and 96.8%, respectively.
Selective precipitation of PbCl2 and AgCl was performed using solution after the last leaching test with highest S/L ratio (500 g/dm3), by adding an excessive amount of 4 mol/dm3 NaCl solution at room temperature. Comparing the concentration of these metals in PLS and MRS, presented in Table 8, efficiency of recovery process is calculated to over 99%.
3.3.3. Au Leaching and Recovery
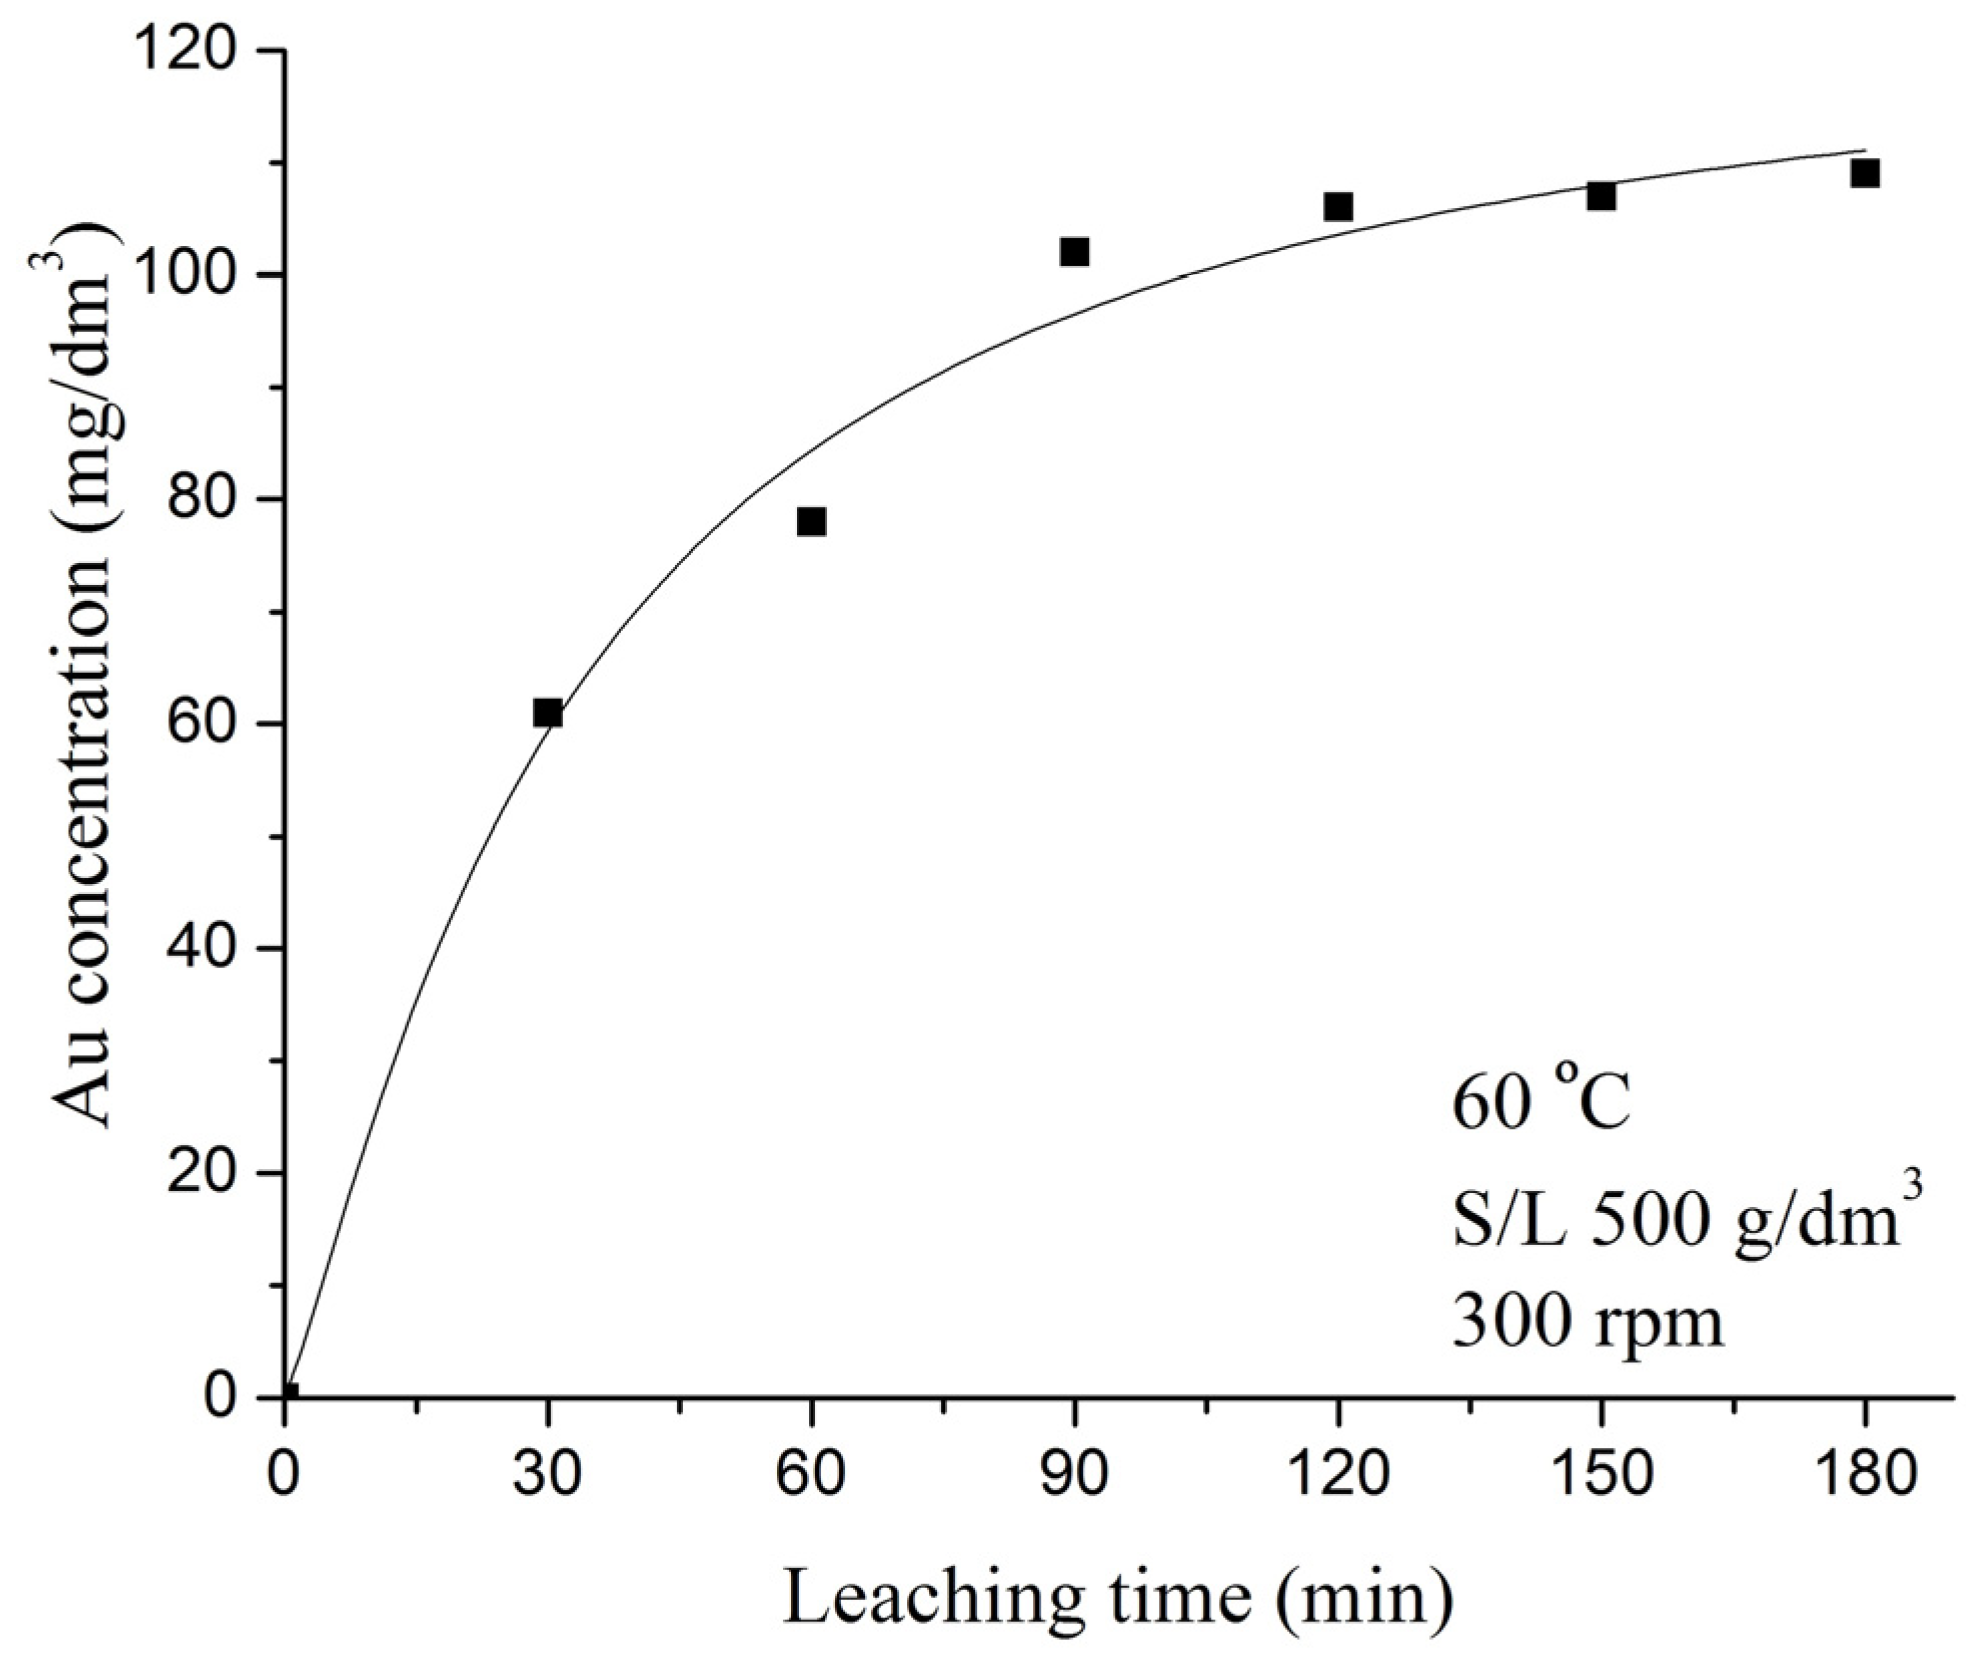
Figure 8 shows the relationship between Au leaching efficiency versus time, under constant temperature (60 °C) and stirring rate (300 rpm). As presented, no change of Au concentration in AR solution was detected when leaching time was extended more than 120 min, suggesting that under assessed process parameters leaching time has no significant influence on Au leaching efficiency. Moreover, AAS analysis, after repeated dissolution of the solid residue in freshly prepared hot AR solution, suggest that under applied process parameters (60 °C, 2 h, S/L ratio 500 g/dm3, 300 rpm) full dissolution (exceeding 99%) of Au was achieved.
Gold recovery from AR solution was performed by chemical reduction using excessive amount of FeSO4 (0.2 g, 100 wt. % excess), at room temperature. According to the AAS analysis of solution after reduction, particles settling and phase separation, Au concentration in solution was below detection limit (1 ppm), proving the expected high efficiency, over 99%. The SEM micrograph of the obtained Au powder, consisted from agglomerated fine particles, is presented on Figure 9.
3.4. Scaled-up Laboratory Test
Integration of processing steps in selective multi-step hydrometallurgical route for comprehensive metals recovery from WPCBs was tested on scaled-up laboratory level, through consecutive steps, as follows:
(i) Cu leaching and recovery: Oxidative sulfate leaching followed by Ag cementation and EW recovery of Cu, reproducing previously defined process parameters, was performed as first leaching and recovery stage. Overall Cu leaching and recovery efficiency of 92.5% was achieved after 10 h of leaching and 12 h of EW recovery stage,
(ii) Partial Sn recovery: In this recovery step, solution after Cu leaching preceding the Ag cementation and EW, was primarily filtered using acid-resistant trommel screen, mesh 150 (<105 µm), separating solid residue and solution containing suspended particles of stannic acid. Afterwards, solution was subjected to coagulation, by adding 0.2 vol. % of commercial coagulant, Brenntamer A3322®, concentration 1 g/dm3, in PLS at room temperature and constant stirring, 100 rpm. After settling of coagulated particles, solution was filtered using filter press, separating purified leachate from Sn-enriched residue,
(iii) Pb-Ag recovery: Leaching and recovery of Pb and Ag using HNO3 followed by NaCl precipitation, was performed as the third processing step by applying process parameters defined in laboratory tests, using solid residue after Cu leaching,
(iv) Gold recovery: Finally, gold leaching using AR solution from solid residue after Pb–Ag recovery, by applying process parameters adopted as optimal, followed by reduction using ferrous sulfate, was performed as the last leaching and recovery step.
According to mass distribution and chemical composition of all obtained products and solutions after the scaled-up laboratory test, efficiency of each processing step was determined and presented in Table 9.
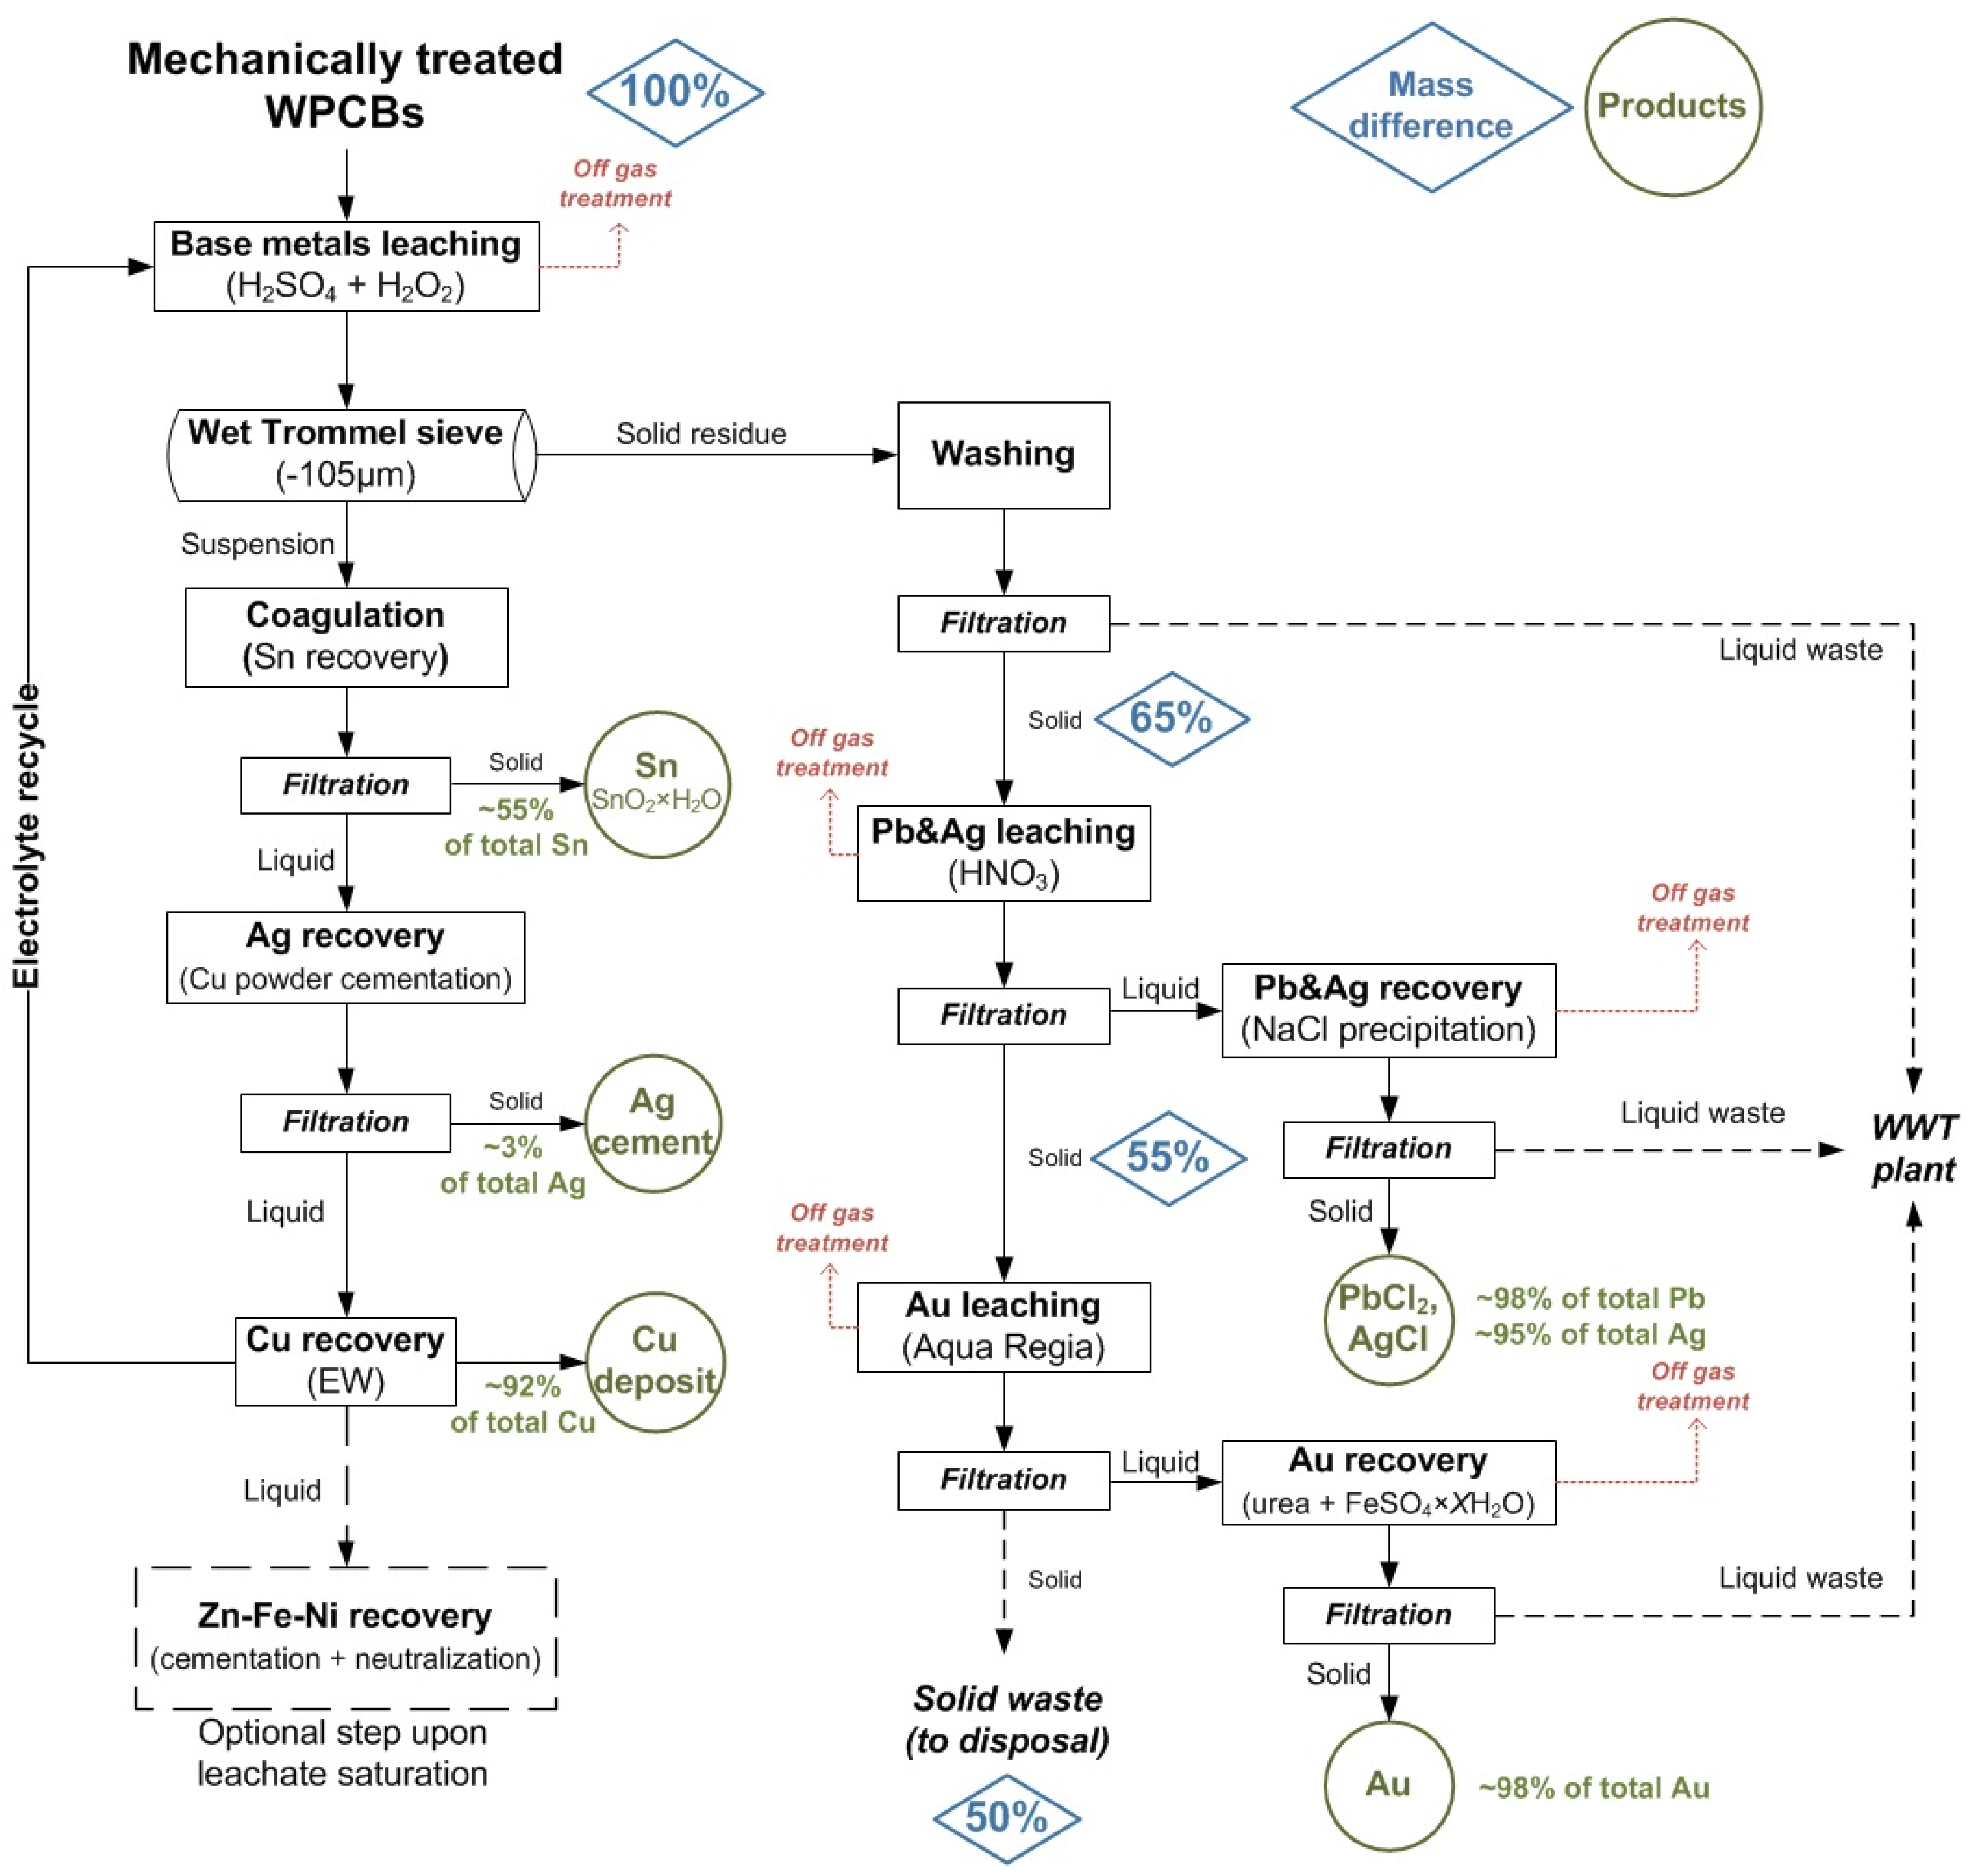
3.5. Development of the Process Flow Sheet
Based on all obtained results, integral multi-step hydrometallurgical process for selective base and precious metals recovery was developed (Figure 10). Overall process efficiency as well as mass distribution is also presented.
4. Conclusions
In this study, presented integral multi-step technological route for the selective base and precious metals recovery from WPCBs is experimentally proved. As determined, by implementing simple and time saving methods (leaching, cementation, precipitation, reduction and electrowinning), Cu, Sn, Pb, Ag, and Au could be successfully recovered through the consecutive processing steps.
In the first stage, Cu was leached using 2 mol/dm3 H2SO4 solution in the presence of H2O2 and subsequently recovered by EW, with the overall process efficiency of 92.4%. Additionally, around 3.10% of the total Ag leached during this leaching step was recovered by cementation with efficiency exceeding 95%. In the second stage, after 2 h, 98.5% Pb and 96.8% Ag were leached using 8 mol/dm3 solution of HNO3 at 80 °C, and recovered by precipitation using NaCl, with efficiency that exceeds 99%. In the third stage, over 99% of gold was leached using AR solution and completely recovered from the PLS by chemical reduction using FeSO4. In addition, by implementing the innovative method, consisting of the two-step phase separation of suspension after Cu leaching, 55.4% of Sn may be recovered in the form of highly stable hydrolyzed tin (IV) oxide.
According to the results of the scaled-up laboratory test, in addition to the demonstrated high efficiencies of each consecutive step, which were over 92% for Cu and over 95% for Pb–Ag and Au recovery, implementation of the novel method for partial Sn recovery was tested as well. Although preliminary process efficiency was limited to 55%, technological simplicity of the novel method indicates possibility for further improvement of process efficiency, yielding the material with significantly increased Sn content.
Recovery of major beneficial metals, Cu, Sn, Pb, Ag and Au, followed by production of minimal waste materials with known character, represents great advantage of presented technological route which is of the highest importance for the lower operating capacities. Further analysis of the process economy could give a more comprehensive overview if such a process represents a promising alternative for the present status dominated by the pyrometallurgical sector.
Author Contributions
Conceptualization, Ž.K., M.R., M.K.; Methodology, Ž.K., M.R., Z.A.; Validation, Ž.K., M.R. and S.J.; Investigation, M.R.; N.G.; J.D.; Writing-Original, M.R.; Writing-Review & Editing, Ž.K., M.K.; Visualization, N.G.; J.D.; Supervision, Ž.K.
Acknowledgments
Presented research was supported by Ministry of Education, Science and Technological Development, Republic of Serbia, project “Innovative synergy of by-products, waste minimization and cleaner production in metallurgy”, No. TR34033.
Conflicts of Interest
The authors declare no conflict of interest.
References
- Reuter, M.; Hudson, C.; Van Schaik, A.; Heiskanen, K.; Meskers, C.; Hagelüken, C. Metal Recycling: Opportunities, Limits, Infrastructure; UNEP: Nairobi, Kenya, 2013; ISBN 978-92-807-3267-2. [Google Scholar]
- Cui, J.; Forssberg, E. Mechanical recycling of waste electric and electronic equipment: A review. J. Hazard. Mater. 2003, 99, 243–263. [Google Scholar] [CrossRef]
- Ghodrat, M.; Rhamdhani, M.; Brooks, G.; Masood, S.; Corder, G. Techno economic analysis of electronic waste processing through black copper smelting route. J. Clean. Prod. 2016, 126, 178–190. [Google Scholar] [CrossRef]
- Yazici, E.Y.; Deveci, H. Extraction of metals from waste printed circuit boards (WPCBs) in H2SO4–CuSO4–NaCl solutions. Hydrometallurgy 2013, 139, 30–38. [Google Scholar] [CrossRef]
- Kamberović, Ž.; Sokić, M.; Korać, M. On the physicochemical problems of aqueous oxidation of polymetalic gold bearing sulphide ore in an autoclave. Physicochem. Probl. Miner. Process. 2003, 37, 107–114. [Google Scholar]
- Lee, J.; Kim, S.; Kim, B.; Lee, J.-C. Effect of Mechanical Activation on the Kinetics of Copper Leaching from Copper Sulfide (CuS). Metals 2018. [Google Scholar] [CrossRef]
- Birloaga, I.I.; De Michelis, I.; Ferella, F.; Buzatu, M.; Vegliò, F. Study on the influence of various factors in the hydrometallurgical processing of waste printed circuit boards for copper and gold recovery. Waste Manag. 2013, 33, 935–941. [Google Scholar] [CrossRef] [PubMed]
- Sun, Z.H.I.; Xiao, Y.; Sietsma, J.; Agterhuis, H.; Visser, G.; Yang, Y. Selective copper recovery from complex mixtures of end-of-life electronic products with ammonia-based solution. Hydrometallurgy 2015, 152, 91–99. [Google Scholar] [CrossRef]
- Orac, D.; Havlik, T.; Maul, A.; Berwanger, M. Acidic leaching of copper and tin from used consumer equipment. J. Min. Metall. Sect. B Metall. 2015, 51, 153–161. [Google Scholar] [CrossRef]
- Park, Y.J.; Fray, D.J. Recovery of high purity precious metals from printed circuit boards. J. Hazard. Mater. 2009, 164, 1152–1158. [Google Scholar] [CrossRef] [PubMed]
- Kim, E.; Kim, M.; Lee, J.C.; Pandey, B. Selective recovery of gold from waste mobile phone PCBs by hydrometallurgical process. J. Hazard. Mater. 2011, 198, 206–215. [Google Scholar] [CrossRef] [PubMed]
- Li, J.; Xu, X.; Liu, W. Thiourea leaching gold and silver from the printed circuit boards of waste mobile phones. Waste Manag. 2012, 32, 1209–1212. [Google Scholar] [CrossRef] [PubMed]
- Jha, M.; Kumari, A.; Choubey, P.; Lee, J.; Kumar, V.; Jeong, J. Leaching of lead from solder material of waste printed circuit boards (PCBs). Hydrometallurgy 2012, 121–124, 28–34. [Google Scholar] [CrossRef]
- Havlik, T.; Orac, D.; Petranikova, M.; Miskufova, A. Hydrometallurgical treatment of used printed circuit boards after thermal treatment. Waste Manag. 2011, 31, 1542–1546. [Google Scholar] [CrossRef] [PubMed]
- Cheng, C.Q.; Yang, F.; Zhao, J.; Wang, L.H.; Li, X.G. Leaching of heavy metal elements in solder alloys. Corros. Sci. 2011, 53, 1738–1747. [Google Scholar] [CrossRef]
- Kamberović, Ž.; Korać, M.; Ranitović, M. Hydrometallurgical process for extraction of metals from electronic waste-part II: Development of the processes for the recovery of copper from printed circuit boards (PCB). Metalurgija 2011, 17, 139–149. [Google Scholar]
- Birloaga, I.; Coman, V.; Kopacek, B.; Vegliò, F. An advanced study on the hydrometallurgical processing of waste computer printed circuit boards to extract their valuable content of metals. Waste Manag. 2014, 34, 2581–2586. [Google Scholar] [CrossRef] [PubMed]
- Kumari, A.; Jha, M.K.; Singh, R.P. Recovery of metals from pyrolysed PCBs by hydrometallurgical techniques. Hydrometallurgy 2016, 165, 97–105. [Google Scholar] [CrossRef]
- Behnamfard, A.; Salarirad, M.; Veglio, F. Process development for recovery of copper and precious metals from waste printed circuit boards with emphasize on palladium and gold leaching and precipitation. Waste Manag. 2013, 33, 2354–2363. [Google Scholar] [CrossRef] [PubMed]
- Yang, H.; Liu, J.; Yang, J. Leaching copper from shredded particles of waste printed circuit boards. J. Hazard. Mater. 2011, 187, 393–400. [Google Scholar] [CrossRef] [PubMed]
- Syed, S. Recovery of gold from secondary sources—A review. Hydrometallurgy 2012, 115–116, 30–51. [Google Scholar] [CrossRef]
- Birch, A.; Mohamed, S.R.; Friedrich, B. Screening of Non-cyanide Leaching Reagents for Gold Recovery from Waste Electric and Electronic Equipment. J. Sustain. Metall. 2018. [Google Scholar] [CrossRef]
- Ranitović, M.; Kamberović, Ž.; Korać, M.; Jovanović, N.; Mihjalović, A. Hydrometallurgical recovery of tin and lead from waste printed circuit boards (WPCBs): Limitations and opportunities. Metalurgija 2016, 55, 153–156. [Google Scholar]
- Roine, A. HSC Chemistry® v 6.12; Outotec Research Oy Center: Pori, Finland, 2006. [Google Scholar]
- Timur, S.; Cetinkaya, O.; Erturk, S. Investigating silver cementation from nitrate solutions by copper in forced convection systems. Miner. Metall. Proc. 2005, 22, 205–210. [Google Scholar]
- Cucchiella, F.; D’Adamo, I.; Koh, S.C.L.; Rosa, P. A profitability assessment of European recycling processes treating printed circuit boards from waste electrical and electronic equipments. Renew. Sustain. Energy Rev. 2016, 64, 749–760. [Google Scholar] [CrossRef]
- Dimitrijević, S.; Ivanović, A.; Simonović, D.; Kamberović, Ž.; Korać, M. Electrodepositon of copper and precious metals from waste sulfuric acid solution. In Proceedings of the 15th International Research TMT, Prague, Czech Republic, 12–18 September 2011; pp. 689–692. [Google Scholar]
Figure 1.
Process development methodology.

Scheme 1.
Particle size distribution.

Figure 2.
Pourbaix diagrams (Eh-pH) for 1 mol/dm3 (metal)/kg H2O and Pθ: (a) Cu; (b) Zn; (c) Fe; (d) Ni; (e) Co; (f) Sb; (g) Sn and (h) Pb.
Figure 2.
Pourbaix diagrams (Eh-pH) for 1 mol/dm3 (metal)/kg H2O and Pθ: (a) Cu; (b) Zn; (c) Fe; (d) Ni; (e) Co; (f) Sb; (g) Sn and (h) Pb.


Figure 3.
Pourbaix diagrams (Eh-pH) for 1 mol/dm3 (metal)/kg H2O and Pθ: (a) Ag; (b) Au.

Figure 4.
Influence of various process parameters on Cu leaching efficiency: (a) temperature; (b) H2O2 addition; (c) stirring rate; (d) S/L ratio.
Figure 4.
Influence of various process parameters on Cu leaching efficiency: (a) temperature; (b) H2O2 addition; (c) stirring rate; (d) S/L ratio.

Figure 5.
SEM micrographs of extracted suspended particles under different magnifications: (a) 1000×; (b) 50,000×.
Figure 5.
SEM micrographs of extracted suspended particles under different magnifications: (a) 1000×; (b) 50,000×.

Figure 6.
XRD pattern of extracted suspended particles.

Figure 7.
Influence of various process parameters on Pb and Ag leaching efficiency: (a) HNO3 concentration; (b) leaching time; (c) S/L ratio on Pb leaching efficiency; (d) S/L ratio on Ag leaching efficiency.
Figure 7.
Influence of various process parameters on Pb and Ag leaching efficiency: (a) HNO3 concentration; (b) leaching time; (c) S/L ratio on Pb leaching efficiency; (d) S/L ratio on Ag leaching efficiency.


Figure 8.
Influence of leaching time on Au leaching efficiency.

Figure 9.
SEM micrograph of reduced Au particles.

Figure 10.
Process flow sheet for integral multi-step hydrometallurgical method for selective base and precious metals recovery from WPCBs.
Figure 10.
Process flow sheet for integral multi-step hydrometallurgical method for selective base and precious metals recovery from WPCBs.


Table 1.
Chemical composition of mechanically treated WPCBs.
| Material | Share | Unit |
|---|---|---|
| Metals | ||
| Cu | 25.51 | wt. % |
| Sn | 3.57 | wt. % |
| Pb | 2.47 | wt. % |
| Zn | 2.18 | wt. % |
| Fe | 0.85 | wt. % |
| Ni | 0.18 | wt. % |
| Al | <0.1 | wt. % |
| Sb | 960 | ppm |
| Co | 620 | ppm |
| Ag | 6800 | ppm |
| Au | 203 | ppm |
| Glass/Ceramic | ||
| SiO2 | 21.94 | wt. % |
| Al2O3 | 6.16 | wt. % |
| TiO2 | 0.88 | wt. % |
| Na2O | 0.14 | wt. % |
| Polymer | ~35 | wt. % |
Table 2.
ΔGᶿ for reactions of metals with H2SO4 and H2O2.
| Leaching Reaction | |||
|---|---|---|---|
| kJ·mol−1 | |||
| Me * + H2SO4 + H2O2 → Me * SO4 (a) + 2H2O | <0 | <0 | (1) |
| Pb + H2SO4 + H2O2 → PbSO4 (s) + 2H2O | −477.19 | −474.60 | (2) |
| Sn + 2H2O2 → H2SnO3 (s)+ H2O | −753.80 | −749.11 | (3) |
| Sn + H2SO4 + H2O2 → SnSO4 (s) + 2H2O | −572.90 | −570.56 | (4) |
| 2Ag + H2SO4 → Ag2SO4 (a) + H2(g) | 71.02 | 65.89 | (5) |
| 2Ag + H2O2 → Ag2O (s) + 2H2O | −127.19 | −127.70 | (6) |
| Ag2O + H2SO4 → Ag2SO4 (a) + H2O | −155.42 | −154.93 | (7) |
* Me = Sb, Zn, Fe, Co, Ni, Cu—in reaction priority order (decreasing negative value ΔGᶿ); (a) = aqua; (s) = solid; (g) = gas.
Table 3.
ΔGᶿ possible chemical reactions of metals with HNO3.
| Leaching Reaction | |||
|---|---|---|---|
| kJ·mol−1 | |||
| aMe * + bHNO3 → aMe * (NO3)2 (a) + cNO2 (g) + dH2O | <0 | <0 | (8) |
| Sn + 4HNO3 → SnO2 (s) + 4NO2 (g) + 2H2O | −462.95 | −492.19 | (9) |
| Sn + 4HNO3 → Sn(NO3)2 (a) + 2NO2 (g) + 2H2O | −310.52 | −319.70 | (10) |
| 2Sb + 6HNO3 → Sb2O3 (s) + 6NO2 (g) + 3H2O | −408.56 | −445.91 | (11) |
* Me = Fe, Zn, Pb, Co, Ni, Cu, Ag—in reaction priority order (decreasing negative value ΔGᶿ); a, b, c, d, x, y—stoichiometric coefficients; (a) = aqua; (s) = solid; (g) = gas.
Table 4.
ΔGᶿ possible chemical reactions of metals with HCl.
| Leaching Reaction | |||
|---|---|---|---|
| kJ·mol−1 | |||
| Me * + 2HCl → Me ** Cl2 (a) + H2 (g) | <0 | <0 | (12) |
| Pb + 2HCl → PbCl2 (s) + H2 (g) | −58.82 | −68.60 | (13) |
| 2Ag + 2HCl → 2AgCl (s) +H2 (g) | 35.92 | 22.12 | (14) |
| 2Sb + 6HCl → 2SbCl3 (a) + 3H2 (g) | 58.70 | 41.63 | (15) |
| Cu + 2HCl → CuCl2 (a) + H2 (g) | 81.59 | 71.60 | (16) |
| Au + 4HCl → [AuCl4]− (a) + 4H+ (g) | 420.42 | 420.85 | (17) |
| 2Cu + 4HCl (a) + O2 (g) = 2CuCl2 (a) + 2H2O | −352.38 | −341.75 | (18) |
| Au + 4HCl + O2 (g) → [AuCl4]− (a) + 2H2O | 84.48 | 100.85 | (19) |
* Me = Zn, Sn, Ni, Fe, Co—in reaction priority order (decreasing negative value ΔGᶿ); a, b, c, d, x, y—stoichiometric coefficients; (a) = aqua; (s) = solid; (g) = gas.
Table 5.
Chemical composition of extracted suspended particles.
| Element | Fe | Cu | Zn | Sn * | Pb | Non-Metallic |
|---|---|---|---|---|---|---|
| Amount, % | 0.31 | 0.24 | 0.36 | 82.53 | 3.46 | balance |
* as stannic acid.
Table 6.
Degree of Ag cementation by Cu powder.
| CAg Prior Cementation, mg/dm3 | Temperature, °C | CAg after Cementation, mg/dm3 | Efficiency, % |
|---|---|---|---|
| 11.85 | 20 | <1 | >95 |
| 26.01 | 30 | 4.57 | 82.43 |
| 29.91 | 40 | 12.10 | 59.55 |
Table 7.
Investigated EW process parameters.
| Cathodes | Cu Foil | Cu Sheet | |||||
|---|---|---|---|---|---|---|---|
| ic, A/m2 | 150 | 300 | 300 | 450 | 200 | 250 | 300 |
| U (cell), V | 1.93 | 2.12 | 2.04 | 2.38 | 2.1–2.2 | 2.2–2.3 | 2.2–2.4 |
| Current efficiency, % | 94 | 89 | 92 | 85 | 93 | 91 | 88 |
| Stirring, rpm | No | No | 100 | 100 | 100 | 100 | 100 |
| Temperature, °C | Room | Room | 40 | 40 | 40 | 40 | 40 |
| Chemical composition of deposit/% | |||||||
| Cu | 99.98 | 99.77 | 99.92 | 99.78 | 99.93 | 99.91 | 99.87 |
| Fe | n/a | 0.153 | 0.056 | 0.192 | 0.043 | 0.059 | 0.078 |
Table 8.
Pb and Ag concentration of PLS and MRS.
| PLS, g/dm3 | MRS, mg/dm3 | Efficiency, % | |
|---|---|---|---|
| Pb | 16.17 | 91.11 | 99.40 |
| Ag | 4.31 | 17.40 | 99.60 |
Table 9.
Mass distribution, chemical composition of products, and process efficiencies.
| Product | Mass | Efficiency | Cu | Pb | Sn * | Ag | Au |
|---|---|---|---|---|---|---|---|
| g | % | wt. % | |||||
| Coagulated Sn | 232.10 | 54 | 0.14 | 6.41 | 57.55 | n.d. | n.d. |
| Ag cement | 7.20 | >95 | 81.93 | 0.02 | 0.02 | 16.89 | n.d. |
| Cathode Cu | 1180.00 | >92 | 99.71 | 0.04 | 0.08 | n.d. | n.d. |
| PbCl2 and AgCl precipitate | 155.10 | >98 | n.d. | 79.33 | 0.07 | 20.60 | n.d. |
| Au powder | 0.92 | >98 | n.d. | n.d. | n.d. | n.d. | >99.9 |
n.d.—not detected; * as stannic acid.
© 2018 by the authors. Licensee MDPI, Basel, Switzerland. This article is an open access article distributed under the terms and conditions of the Creative Commons Attribution (CC BY) license (http://creativecommons.org/licenses/by/4.0/).
Share and Cite
MDPI and ACS Style
Kamberović, Ž.; Ranitović, M.; Korać, M.; Andjić, Z.; Gajić, N.; Djokić, J.; Jevtić, S. Hydrometallurgical Process for Selective Metals Recovery from Waste-Printed Circuit Boards. Metals 2018, 8, 441. https://doi.org/10.3390/met8060441
AMA Style
Kamberović Ž, Ranitović M, Korać M, Andjić Z, Gajić N, Djokić J, Jevtić S. Hydrometallurgical Process for Selective Metals Recovery from Waste-Printed Circuit Boards. Metals. 2018; 8(6):441. https://doi.org/10.3390/met8060441
Chicago/Turabian StyleKamberović, Željko, Milisav Ranitović, Marija Korać, Zoran Andjić, Nataša Gajić, Jovana Djokić, and Sanja Jevtić. 2018. "Hydrometallurgical Process for Selective Metals Recovery from Waste-Printed Circuit Boards" Metals 8, no. 6: 441. https://doi.org/10.3390/met8060441
Note that from the first issue of 2016, this journal uses article numbers instead of page numbers. See further details here.