Review

Microstructure, Solidification Texture, and Thermal Stability of 316 L Stainless Steel Manufactured by Laser Powder Bed Fusion

1
Department of Engineering and Physics, Karlstad University, SE-651 88 Karlstad, Sweden
2
Department of Mechanical and Mechatronic Engineering, Bloemfontein, Central University of Technology, Free State 9300, South Africa
3
Department of Physics, Chalmers University of Technology, SE-412 96 Gothenburg, Sweden
4
Department of Management and Engineering, Linköping University, SE-581 83 Linköping, Sweden
*
Author to whom correspondence should be addressed.
Metals 2018, 8(8), 643; https://doi.org/10.3390/met8080643
Submission received: 25 July 2018 / Revised: 1 August 2018 / Accepted: 13 August 2018 / Published: 15 August 2018
(This article belongs to the Special Issue Additive Manufacturing of Ferrous Materials)

Abstract

:
This article overviews the scientific results of the microstructural features observed in 316 L stainless steel manufactured by the laser powder bed fusion (LPBF) method obtained by the authors, and discusses the results with respect to the recently published literature. Microscopic features of the LPBF microstructure, i.e., epitaxial nucleation, cellular structure, microsegregation, porosity, competitive colony growth, and solidification texture, were experimentally studied by scanning and transmission electron microscopy, diffraction methods, and atom probe tomography. The influence of laser power and laser scanning speed on the microstructure was discussed in the perspective of governing the microstructure by controlling the process parameters. It was shown that the three-dimensional (3D) zig-zag solidification texture observed in the LPBF 316 L was related to the laser scanning strategy. The thermal stability of the microstructure was investigated under isothermal annealing conditions. It was shown that the cells formed at solidification started to disappear at about 800 °C, and that this process leads to a substantial decrease in hardness. Colony boundaries, nevertheless, were quite stable, and no significant grain growth was observed after heat treatment at 1050 °C. The observed experimental results are discussed with respect to the fundamental knowledge of the solidification processes, and compared with the existing literature data.

1. Introduction

Additive manufacturing (AM) techniques are recognized as manufacturing processes with the high ability to generate parts from three-dimensional (3D) CAD models that are impossible to produce through conventional methods. Initially developed for prototyping, nowadays, AM techniques are used to produce spare parts and repair parts, and to fabricate end-use products. Powder bed fusion (PBF) and direct energy deposition (DED) are the most widely used methods in the AM of metallic materials [1]. Effective implementation of laser powder bed fusion processes (LPBF) requires a clear understanding of the process–structure–properties–performance relationships in fabricated components. This is especially important for the manufacturing of end-use products, as the qualities and properties of the materials have to be the same as for conventional alloys.
The optimization of laser processing parameters to produce high-quality, porosity-free samples is one challenge for LPBF. A number of studies have shown that by controlling the laser power and the laser scanning speed, one can remarkably eliminate porosity in quite a broad window of the process parameters [2,3,4]. The final properties are governed by the microstructure of the material. The microstructure of the LPBF material is formed under the conditions of high temperature gradients and solidification rates, far from the ones of conventional materials. This results in the formation of a nonequilibrium microstructure with a unique set of properties. Epitaxial nucleation of cellular colonies has commonly been observed, which results in the solidification texture and anisotropic mechanical properties of LPBF materials [5,6,7,8,9,10,11]. The methods of designing microstructure and control the solidification texture have been rarely suggested in the literature. Most commonly, a post-treatment is recommended to convert the LPBF colonial microstructure and to obtain the typical structures and properties for the corresponding conventional materials. Nevertheless, the direct application of conventional heat-treatment regimes is not always successful [6,12,13,14,15], so the thermal stability of LPBF microstructures has to be further investigated.
This article overviews the scientific results obtained by the authors over several years, and discusses the results with respect to the existing literature data. Our focus was on the metallurgical aspects, and a deep understanding of the microstructure and the microstructure stability of LPBF 316 L stainless steel. The formation of the cellular structure in the molten pool was discussed in relation to the thermal gradient and solidification rate. The correlation between the primary cell spacing and hardness was discussed with respect to the AM process parameters and the presence of porosity. The formation of the solidification texture and the way to control it was experimentally illustrated. The stability of the microstructure under isothermal conditions was investigated to provide a background for the future development of post-treatment regimes of LPBF 316 L steel. Generally, the discussed phenomena can be expanded to other single-phase LPBF alloys solidifying without phase transformations in solid state.

2. Materials and Methods

Spherical gas-atomized powder supplied by Sandvik Osprey Ltd. (Neath, UK) was used in this study. The volume equivalent diameters were d10 = 4.6 μm, d50 = 13.0 μm, and d90 = 27.5 μm. According to the supplier, the chemical composition of the powders was (in wt %, bal. Fe), 10–14% Ni, 16–18% Cr, 2–3% Mo, max 0.75% Si, max 2% Mn, max 0.03% C, max 0.045% P, and max 0.03% S. Prior to the laser manufacturing, the powders were dried at 80 °C for 12 h.
LPBF experiments were carried out using a Phenix Systems PM 100 (Riom, France) machine. The machine was equipped with a single-mode continuous-wave ytterbium fiber laser with a wavelength of 1075 nm (IPG Photonics Corp., Oxford, MA, USA) in a protective atmosphere of nitrogen. The laser beam had a transverse electromagnetic (TEM) mode, TEM00, with Gaussian profile. The focal length of the optical system was 495 mm. The focal spot size was about 70 μm (1/e2 metrics) and this size was confirmed by measuring the width of the molten pool at different process parameters. A laser power of 50 W and scanning speed of 0.08 to 0.28 m/s with a step of 0.04 m/s were used as the test manufacturing process parameters. The thickness of the deposited powder layer was 50 µm, and the hatch distance was 120 μm. For microstructure assessment, rectangular 5 × 5 × 30 mm3 specimens were manufactured. Process-parameters of a 50 W laser power and a 120 mm/s laser scanning speed, which provided the lowest porosity (below 0.01%, assessed by the image analysis with an optical microscope), were chosen to manufacture specimens for the microstructural analysis.
The specimens were fabricated using a rescanning strategy. In the first scan, a laser beam melts a powder layer with a 120 μm hatch distance and then, without deposition of any new powder, the laser beam shifts by 60 μm and rescans the surface again in the same direction, but between the previously formed tracks (Figure 1a). Next, the scanning direction changes by 90° and the next layer is manufactured in the same way. This rescanning strategy significantly improves the surface quality and minimizes porosity in the final 3D LPBF objects [16,17]. In cross sections of the material, the tracks appear as semi-circular features if they are oriented perpendicular to the observation direction, and as horizontal, elongated features if they are oriented along the plane of the image (Figure 1b).
Microstructural characterization of the as-built specimens was conducted by optical and electron microscopy methods. Specimens were cut into cross sections, ground, and mirror-like polished with 1 µm diamond paste. Electroetching in aqueous oxalic acid and chemical etching by standard Kalling’s No.2 reagent were used to etch specimens for microscopy. For the electron back-scattering diffraction (EBSD) studies, colloidal silica was used for the final step of surface preparation. Scanning electron microscopy (SEM) was carried out with a LEO 1350 FEG-SEM (Carl Zeiss Microscopy GmbH, Oberkochen, Germany) at 20 kV. Energy dispersive X-ray spectroscopy (EDX analysis) was done with an Oxford Instruments (Oxford Instruments plc, Abingdon, UK) INCAx-sight EDX detector. Orientation imaging microscopy was performed using an analytical SEM Hitachi SU70 equipped with an electron back-scattering diffraction (EBSD) system from HKL Technology (Hong Kong, China) at 20 kV.
The X-ray diffraction (XRD) phase analysis was conducted using Cr–Kα radiation in a Seifert XRD 3000 PTS X-ray diffractometer (XRD Eigenmann GmbH, Schnaittach-Hormersdorf, Germany), operating at 40 kV and 35 mA. Transmission electron microscopy (TEM) was done with a JEOL JEM 2100 equipped with a LaB6 cathode and a digital camera from Gatan (San Francisco, CA, USA) (SC1000 Orius). Specimens for TEM were electro-chemically prepared with Struers TenuPol-5 equipment using the procedure and the electrolyte recommended by Struers (Ballerup, Denmark).
Preparation of needle-shaped specimens for atom probe tomography (APT) analysis was done using the standard two-step electropolishing method. The samples were analyzed in an Imago LEAP 3000X HR atom probe system (Imago Scientific Instruments Corporation, Madison, WI, USA). Field evaporation was initiated by laser pulsing with green light (λ = 532 nm) at a 200 kHz pulse rate using 0.3–0.4 nJ pulse energy. The temperatures of the tips were held at 50 K and the pressure in the chamber was approximately 10−9 Pa. APT data were analyzed using CAMECA IVAS software (Version 3.6.10, CAMECA, Gennevilliers, France). The reconstructions were made using the k-factor of 4.0 and an evaporation field of 25 V/nm.

3. Results and Discussion

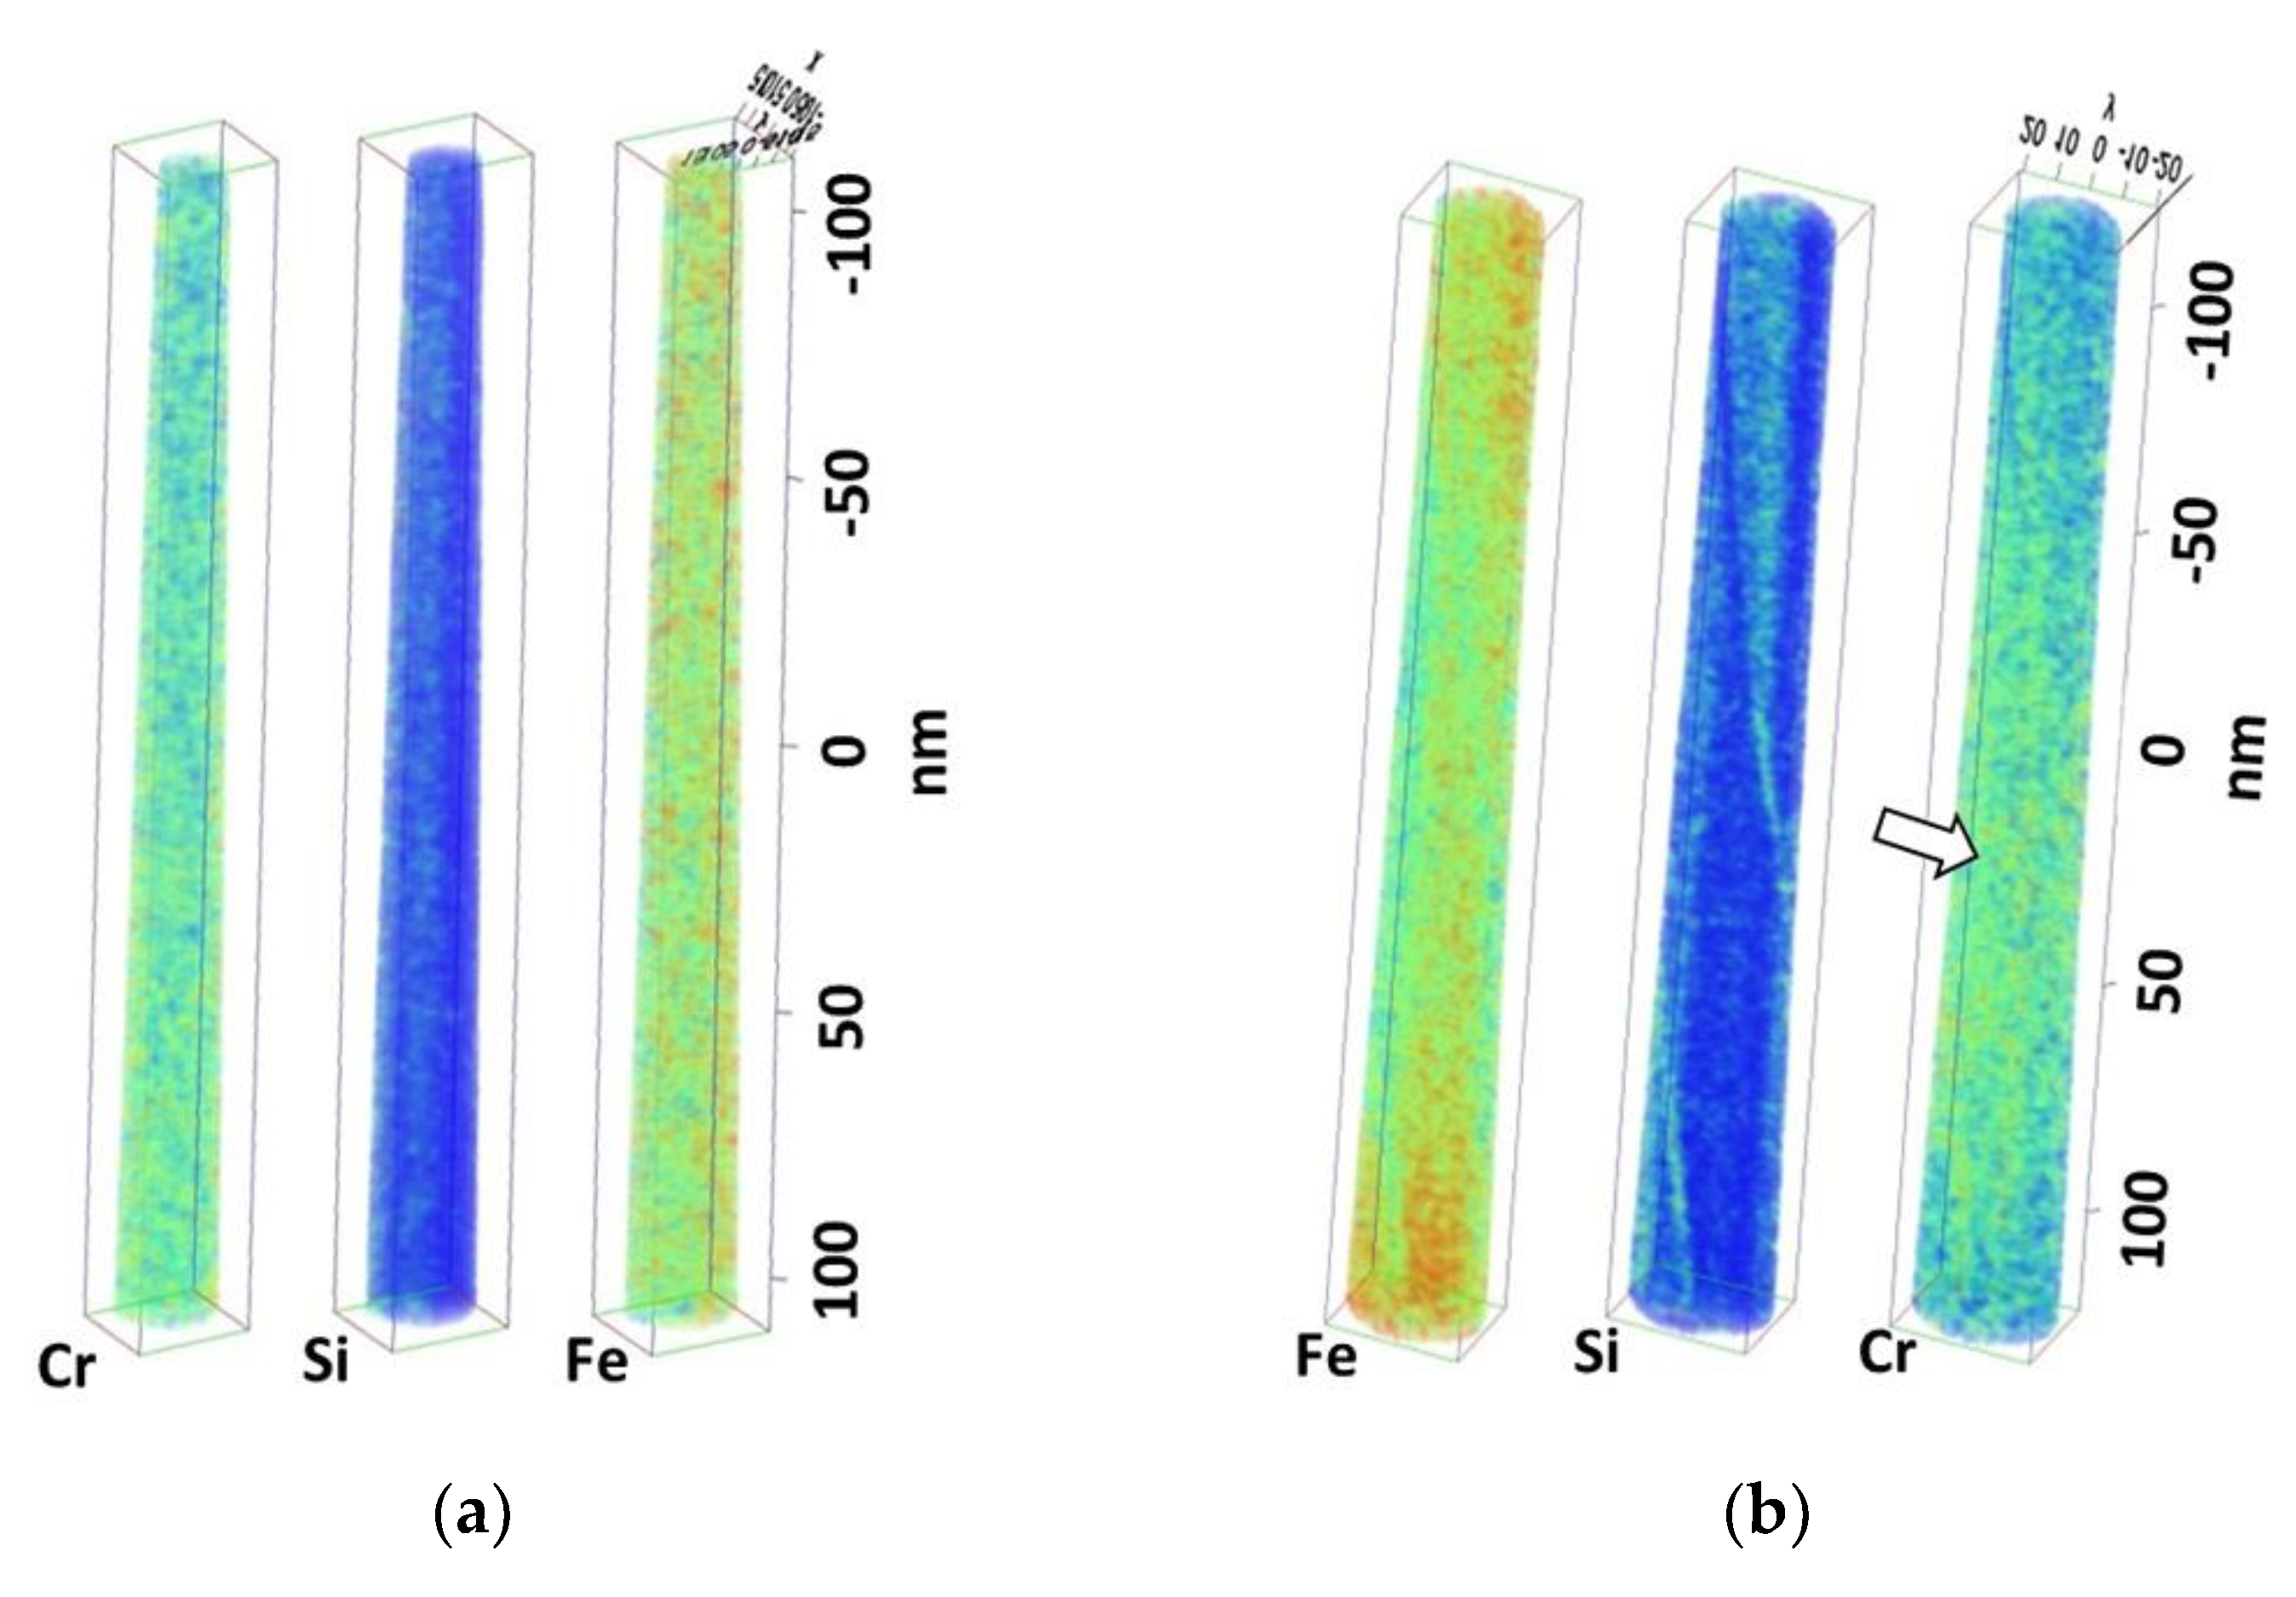
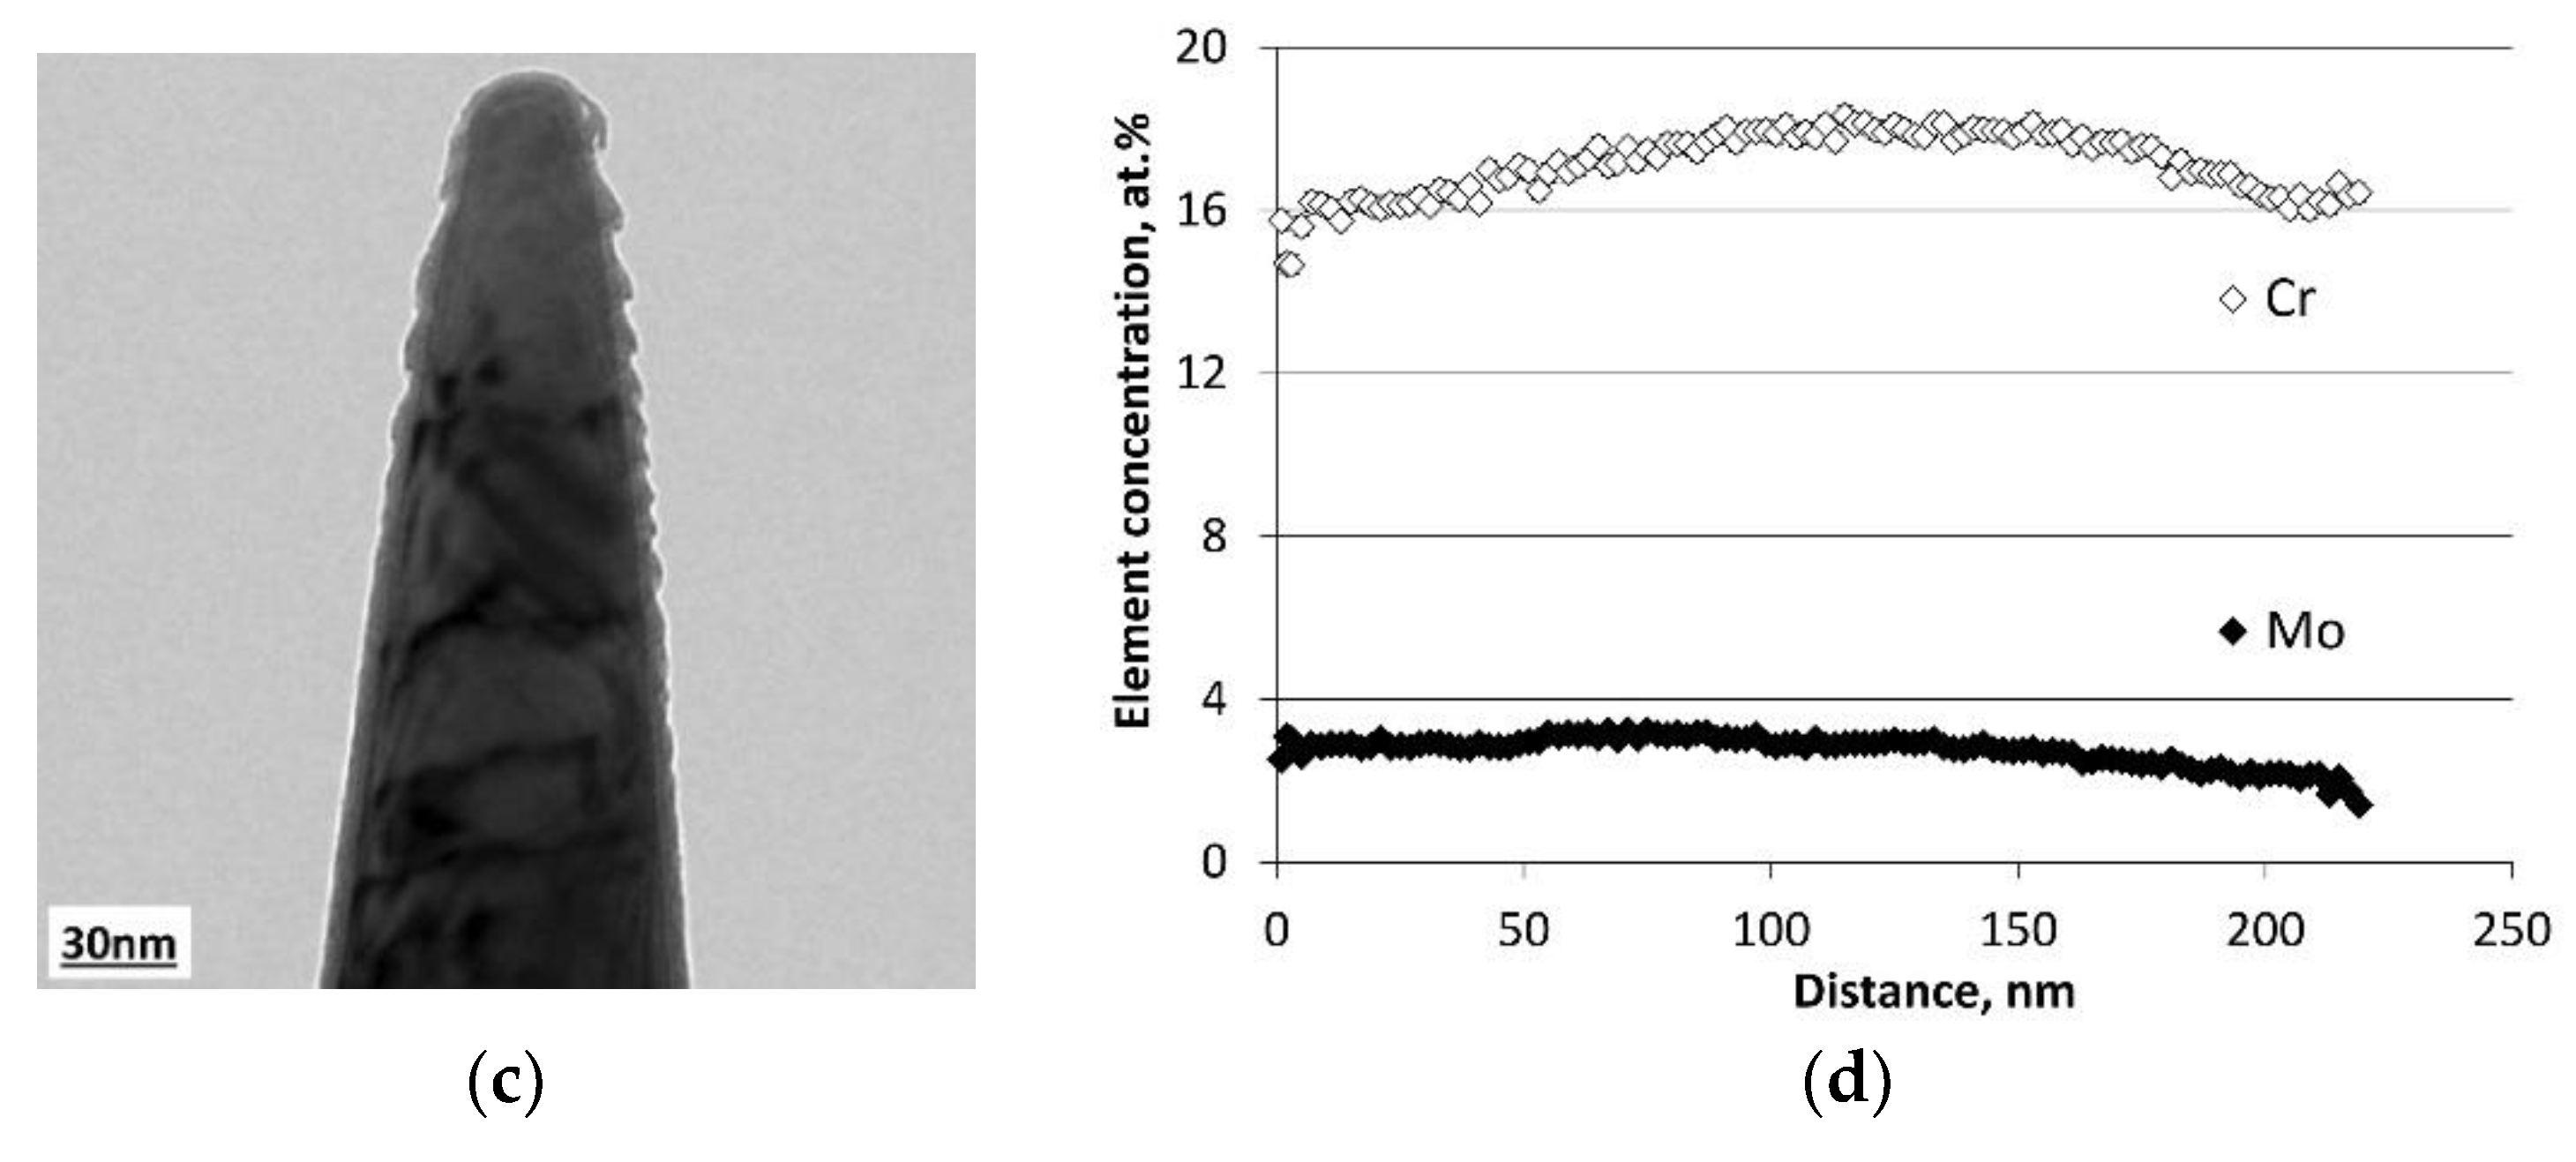
3.1. Microstructure: Colonies, Epitaxial Nucleation, Cellular Dendritic Structure, and Nanoparticles

The investigated specimens in the present study were manufactured in a layer-by-layer way, and the layers were clearly visible by means of optical microscopy of the etched specimens, as shown in Figure 1b. The layers consisted of colonies that were inclined towards the laser movement direction. Each colony had a cellular structure or a cellular dendritic structure. The observed colonies of the cellular dendrites microstructure of 316 L steel manufactured by LPBF were consistent with previous reports [5,6,7,18,19,20,21,22]. XRD, EBSD, and TEM analysis carried out in the present investigation revealed a fully austenitic structure in the LPBF 316 L steel. These results were similar to the ones reported in [7,18,19,20,21,22], while contradicting the authors in [23,24], where delta ferrite or martensite was observed.
When manufacturing a single layer, the laser beam melts the deposited powder and a part of the previous layer. This is a requirement to obtain track stability and material integrity in high quality LPBF objects. The crystallization of a track starts with the nucleation of the solid phase at the solid–liquid interface where the solid is the previously solidified layer. Figure 2a shows a SEM micrograph of the etched cross section of a single track. Here, it can be seen that the microstructure consisted of colonies of cellular dendrites. The colonies are marked with dashed lines in Figure 2a. It can also be seen that cells within a single colony grew continuously through the fusion boundaries.
To investigate the relationship between the crystal orientation of the substrate and the orientation of the colonies in a single track, an EBSD map of the colony and a part of the substrate was acquired (Figure 2c). The crystallographic orientation of different colonies was color coded in the map. It can be seen that several colonies, marked as 1, 2 and 3, had the same color as the parental grains below the fusion boundary in the substrate. This confirmed that these new grains were nucleated epitaxially, and therefore inherited the crystallographic orientation of the parental grains. Not all newly nucleated colonies had the same color as the adjacent grains in the substrate, meaning that that not all substrate grains satisfied the conditions for epitaxial nucleation. Similar epitaxial nucleation between the layers was observed by EBSD in different AM materials [5,6,7,25,26]. Figure 2c also shows that in many colonies, the orientation in the inner region was generally the same. For example, in the upper part of the image, there was a colony consisting of regions colored in different shades of green. This indicates that all the cells forming one colony had almost the same crystallographic orientation, with insignificant misorientation between regions of different shades.
The EBSD observations carried out in the present investigations suggested that all cells that formed a colony inherited the crystallographic orientation of a substrate grain, due to epitaxial nucleation. According to [27], the new grains also grow along a preferred crystallographic direction. In the case of cubic crystals, it has been shown that the dominating direction of crystal growth is <100>, which is typical for stainless steels, Ni-base alloys, and Al alloys [5,27]. TEM observations in the present investigation confirmed this behavior. Figure 3a,b show a bright-field TEM image from the central region containing several cells. In Figure 3a, cells were oriented perpendicular to the observation direction. In Figure 3b, the cells grew approximately parallel to the observation direction. Additionally, a selected area electron diffraction (SAED) pattern taken from several cells is presented in Figure 3b, and the diffraction pattern had the typical appearance of a single crystal. The diffraction pattern from this region corresponded to the <100> zone axis, confirming the preferential cell growth along the <100> crystallographic direction.
Misorientation between adjacent cells was negligible, although the cells were formed directly from the melt at solidification. The cell boundaries that were perfectly visible in the etched specimens should not be interpreted as regular high-angle boundaries, since TEM observations showed that the boundaries between the cells were quite thick and consisted of high-density dislocation structures. Additionally, all cells grew in the same crystallographic direction, which means that the crystal planes between adjacent cells could be distorted by dislocations, but could still be continuous. The experimental TEM and EBSD observations presented in this investigation clearly support this statement. Recently, it was shown in [28] that in the LPBF of a martensitic stainless steel subjected to martensitic transformation upon cooling, fresh martensite needles grow freely through the cell boundaries, but stop at the colony boundary. This observation confirmed a crystallographic continuousness of crystal planes between cells, but not between colonies. Nevertheless, the mechanism of formation of such boundaries directly at solidification is not clear. Additionally, factors such as thermal stresses caused by high thermal gradients could also influence the redistribution of dislocation in the as-built material.
Spherical particles were observed in the microstructure of the as-built LPBF 316 L steel (Figure 3c). The particles were 15–100 nm in size and they were located both in the cells and at the cell boundaries without any preferred location. No additional reflexes were observed in the diffraction patterns taken from areas, including particles and the surrounding matrix, which implies that the particles were amorphous. TEM EDX analysis (Figure 3d) showed that the particles contained an enhanced concentration of Si, O, and Mn. These observations were consistent with the data obtained by others [22,23,25,29,30,31] who have also investigated LPBF 316 L stainless steel. Saeidi [22] detected similar elements in nanoparticles observed by TEM and denoted the particles as silicates. It has been suggested that the round nano-inclusions were chromium-containing silicates with a high viscosity and tendency to solidify in a spherical shape to reduce surface tension. In [23], amorphous particles containing Cr, Mn, Si, and O were studied by TEM. MnO-SiO2 nanoscale rhodonite particles were reported in [25]. Si-enriched oxide nanoparticles were also reported in [29]. In [30,31], Mn-Si-Al-O particles with some amounts of Al were investigated by TEM EDX.
Formation of nanoparticles has commonly been associated with a reaction of molten powder with residual oxygen during manufacturing. Rapid cooling from the melt resulted in the amorphous structure of the particles observed in [32]. Another possible origin of the particles could be an oxide layer on the feedstock powder. Auger and X-ray photoelectron spectroscopy performed by [32] showed that the surface of the gas-atomized powder of 316 L stainless steel, which is a typical manufacturing method for 316 L powder for LPBF, contained enhanced amounts of Fe-, Mn-, and Cr-oxides. This thin oxide layer could coalesce in the melt during the laser remelting. The spherical shape of the particles supports the idea that they were formed in the liquid phase.

3.2. Influence of Solidification Conditions on Microstructure and Microsegregation

A cellular microstructure that developed during the solidification of LPBF 316 L steel was observed (Figure 1). In the laser powder fusion processes, the cellular or cellular-dendritic mode was not uncommon. This type of microstructure has been observed for different engineering alloys like austenitic steels, aluminum alloys Co-Cr, and nickel base alloys [5,6,7,10,11,12,13,14,15,16,17,18,19,20,21,22] manufactured by laser or electron powder bed fusion methods. At the high solidification rates observed in the PBF processes, a solute-rich boundary layer is built up in front of the solid–liquid interface due to the limited solute atom diffusion in the liquid phase, thus approaching the conditions for constitutional supercooling [27]. If conditions for the constitutional supercooling described by Equation (1) are satisfied, the planar crystallization front becomes unstable, and cellular or dendritic solidification mode is observed.
G/R < ΔT/Dl
where G is the thermal gradient, R is the solidification rate, ΔT is the is the equilibrium freezing range ΔT = Tliquidus − Tsolidus, and Dl is the diffusion coefficient of the solute in the liquid. If the gradient G is steep, the material crystallizes in a cellular mode. If the gradient G has a gentle slope, directly solidified dendrites with well-developed arms are formed. This phenomenon has been thoroughly investigated in relation to welding and the conventional directional solidification processes [27].
As has been experimentally confirmed, the LPBF 316 L steel is crystallized in cellular mode, therefore, the characteristic feature of the microstructure is the primary cell spacing. The primary cell spacing is defined as an average distance between centerlines of adjacent primary cells.
A relationship between the primary cell spacing, λ1, the thermal gradient G, and the solidification rate R can be expressed as follows:
λ1GmRn
where m and n are the constants [33]. The thermal gradient G is defined as the temperature change rate in a direction that is normal to the solid-liquid interface.
Equation (2) shows a strong correlation between λ1, and thermal gradient G and solidification rate R. The solidification rate is not a constant within the moving molten pool. At a selected point at the solid-liquid interface, it is coupled with the energy source movement velocity by an expression that includes a misorientation factor [19,27,34,35]:
|R| = |VL| × {cos (α)/cos (αβ)}
where R is the local velocity of the solid-liquid interface, VL is the laser beam velocity, α is the misorientation angle between the source movement direction and the normal to the solid-liquid interface, and β is the angle between the normal of the solid-liquid interface and a crystallographic orientation, along which preferable crystallization takes place. In the case of cubic crystals, this orientation is <100>.
If the surface is molten by a moving energy source, the solid-liquid interface has a complex shape [27], and the solidification rate and the thermal gradient are varied continuously along the solid-liquid interface. The thermal gradient has its highest values at the bottom, and it decreases gradually along the interface towards the end and sides of the melt pool. The solidification rate, in contrast, is the lowest at the bottom (α approaches 90°, cos (α) → 0), but is the highest at the end and sides of the pool (α approaches 0°, cos (α) → 1), see Equation (3). In an intermediate location, the thermal gradient and the solidification rate have intermediate values with respect to the misorientation factor, which is related to the preferred crystallization direction. Due to this, the primary cell spacing varies depending on the location at the solid-liquid interface, and it reaches the lowest values at points where G and V are the highest (Equation (2)).
Figure 4 presents the experimental confirmation of this discussion. Experimental results obtained in the present investigation showed that the primary cell spacing varied at the top and bottom of the single tracks. The SEM study showed that the primary cell spacing in the LPBF 316 L steel was smaller at the bottom of the single track where the thermal gradient G was the highest. This was similar to the results reported in [19,36].
Commonly, the primary cell spacing obeys an empirical dependence on the laser scanning speed [33,37]:
λ1VL−k
where VL is the laser scanning speed, and k is a constant. The k value has been reported as 0.5 for tool steel [38] and martensitic stainless steel [39] manufactured by laser cladding i.e., with relatively low solidification rates. As experimentally observed in this study, the constant k values varied between k = 0.240–0.378, as shown in Figure 4. At the higher solidification rates observed in LPBF, the diffusional path became shorter than the length of a characteristic microstructural feature, and this dependence was not obeyed. The laser scanning speeds used in the present investigation varied in the range of 0.08–0.28 m/s, which were very close to the transition values [37]. This can explain why the values of the constant k, obtained from the fitted lines in Figure 4, deviated from the ~VL0.5 dependence. This deviation, in turn, reflected the fact that crystallization can approach a rapid solidification regime at which diffusional processes are suppressed [40].
In metallic materials manufactured by LPBF, microsegregations are not uncommon and they can cause undesirable effects like hot cracking [41,42]. In LPBF 316 L steel, segregation of Cr and Mo on cell boundaries has been reported [22,43,44]. In the present investigation, TEM EDX and APT were carried out to study microsegregation in LPBF 316 L austenitic stainless steel. The results from the APT are shown in Figure 5. Figure 5a represents the results from a specimen where no segregation of Cr, Ni, or Mo were observed. On the contrary, in the specimen presented in Figure 5b, Cr segregation was clearly visible. This inconsistency could be explained by suggesting that Specimen 1 in Figure 5a was cut out from the cell body, while Specimen 2 was from the region containing the cell boundary, which does not contain a boundary and, therefore, does not contain any segregation of elements at the atomic scale. Figure 5c illustrates the size of the APT specimen, which was obviously much smaller when compared to the cell boundary thickness.
The area with enhanced concentration of Cr in Figure 5b was quite broad, and the concentration gradient in this area was quite smooth (Figure 5d), which is not typical for sharp microsegregations or an ordinary high-angle grain boundary [45]. At the same time, the thickness of the area enriched with Cr corresponded quite well to the thickness of the cell boundaries observed in TEM (Figure 3b). Additionally, some segregation of Si was visible, but they could be artefacts related to the migration of Si on the surface and to crystallographic orientation of the specimen. These observations allow us to suggest that microsegregation could occur on cell boundaries at manufacturing.
In the TEM EDX analyses carried out in the present investigations, Cr segregation was detected in about half of the line scans performed across cell boundaries. The observed reduced repeatability in the observation of Cr on cell boundaries by TEM EDX could be explained if solidification conditions were taken into account. The solidification conditions of the molten pool differed depending on the location at the solid-liquid interface, as confirmed by a variation of the primary cell spacing (Figure 4). Consequently, it was suspected that at locations where the solidification rate was the highest, material could crystallize in the rapid solidification regime. Under these conditions, the diffusional path and the solidification rate are comparable, so solute atoms do not have enough time to segregate, and are trapped in the newly formed solid phase with a random distribution [40]. This regime does not imply a microsegregation phenomenon. If the specimen was cut from such a region, microsegregation would not have been observed by TEM EDX, or by APT. Therefore, APT and TEM EDX investigations of microsegregation in LPBF materials are challenging, as results can vary depending on the location of the specimen. It, nevertheless, has to be statistically investigated as the currently available data on APT and TEM EDX of LPBF materials is limited.

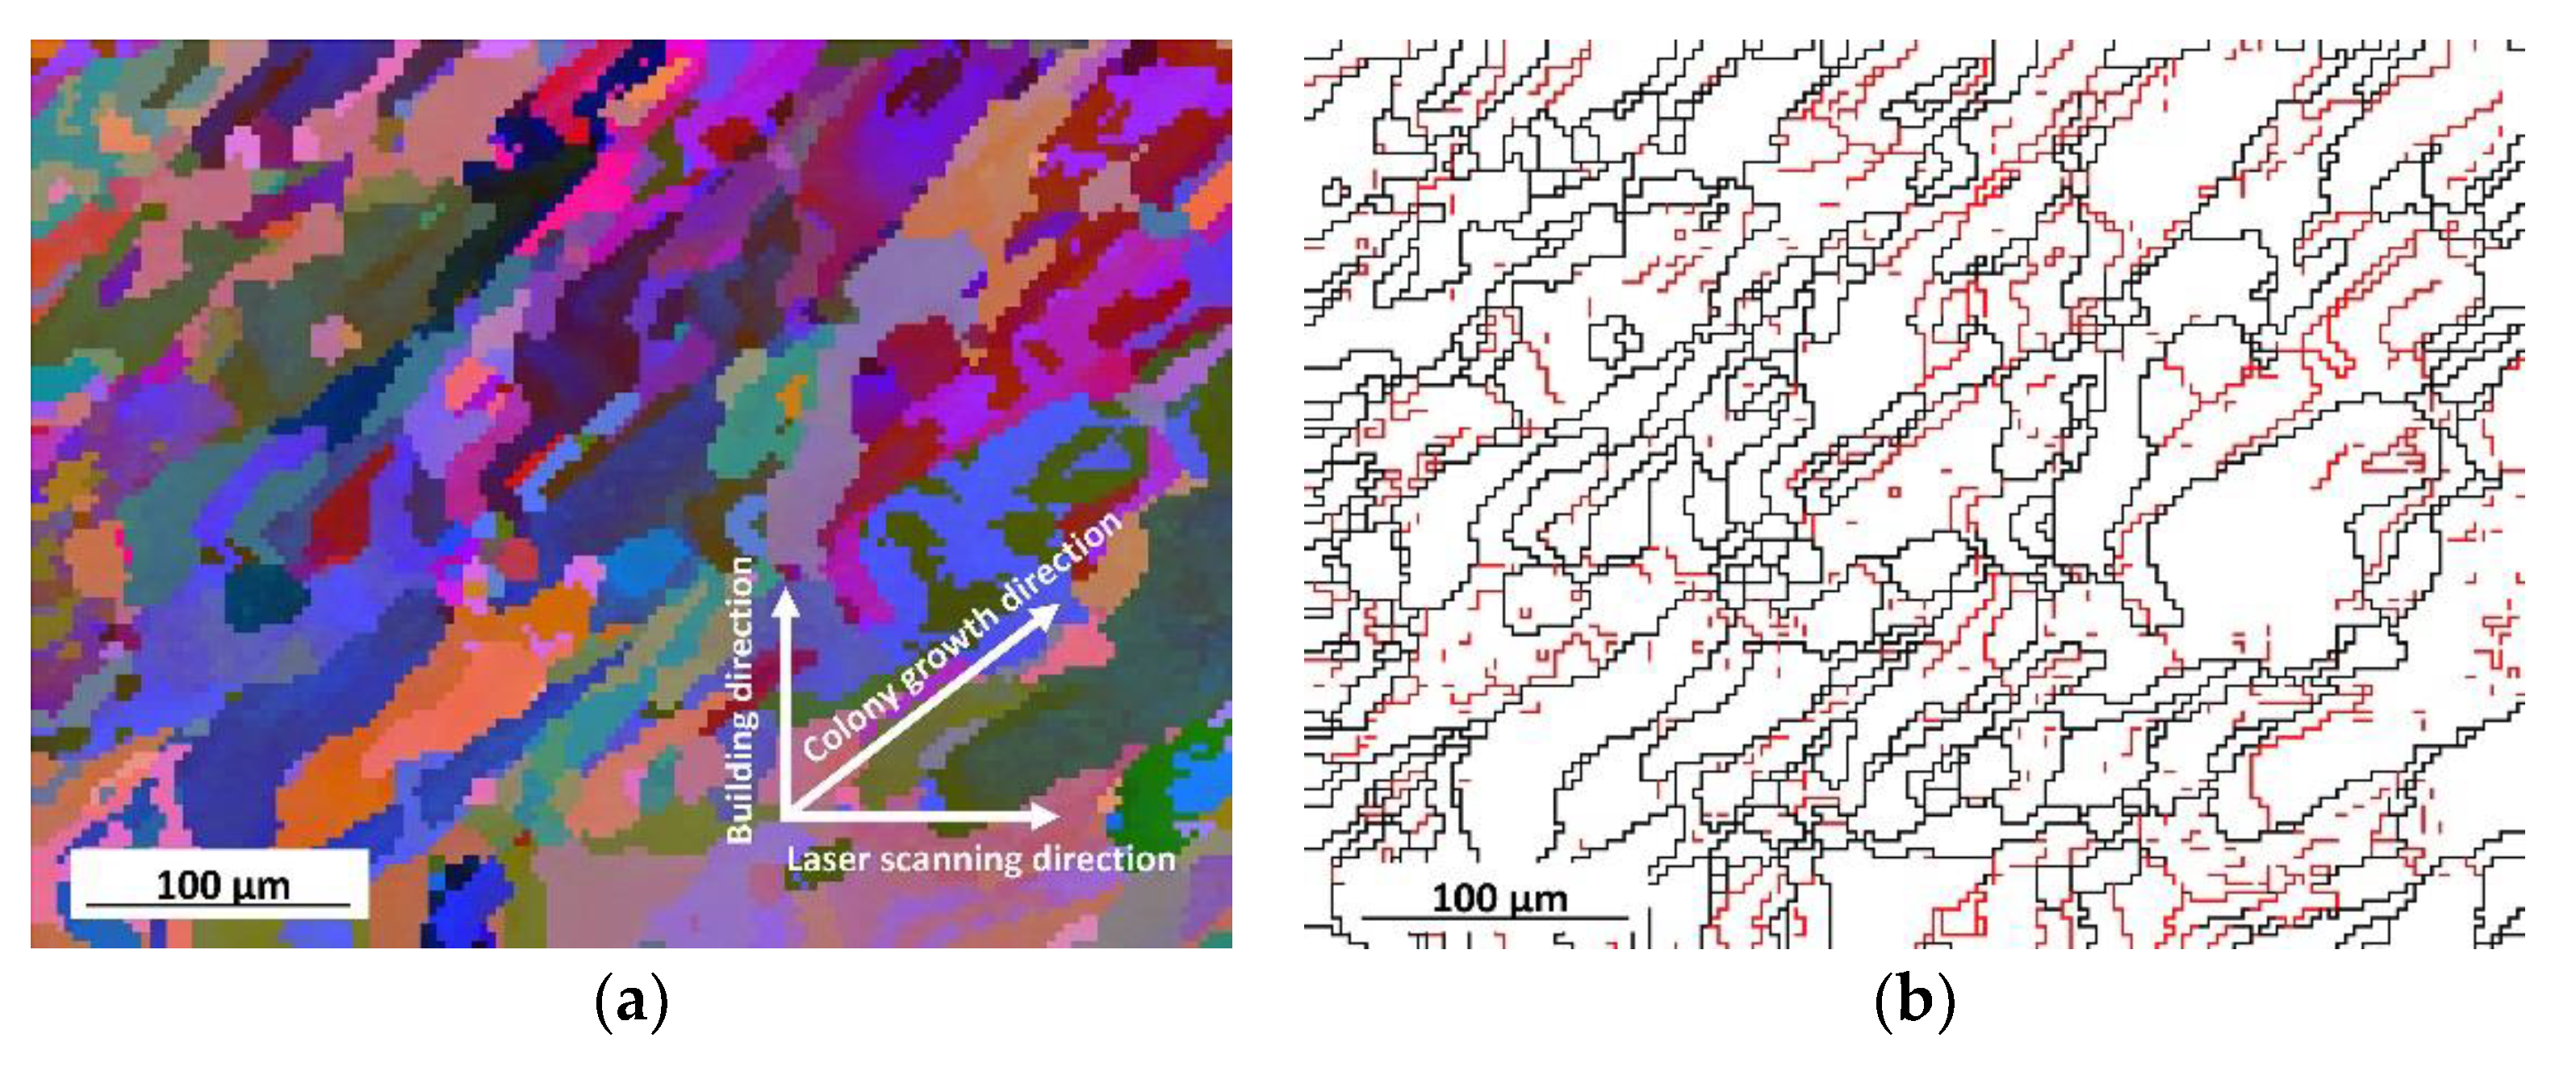
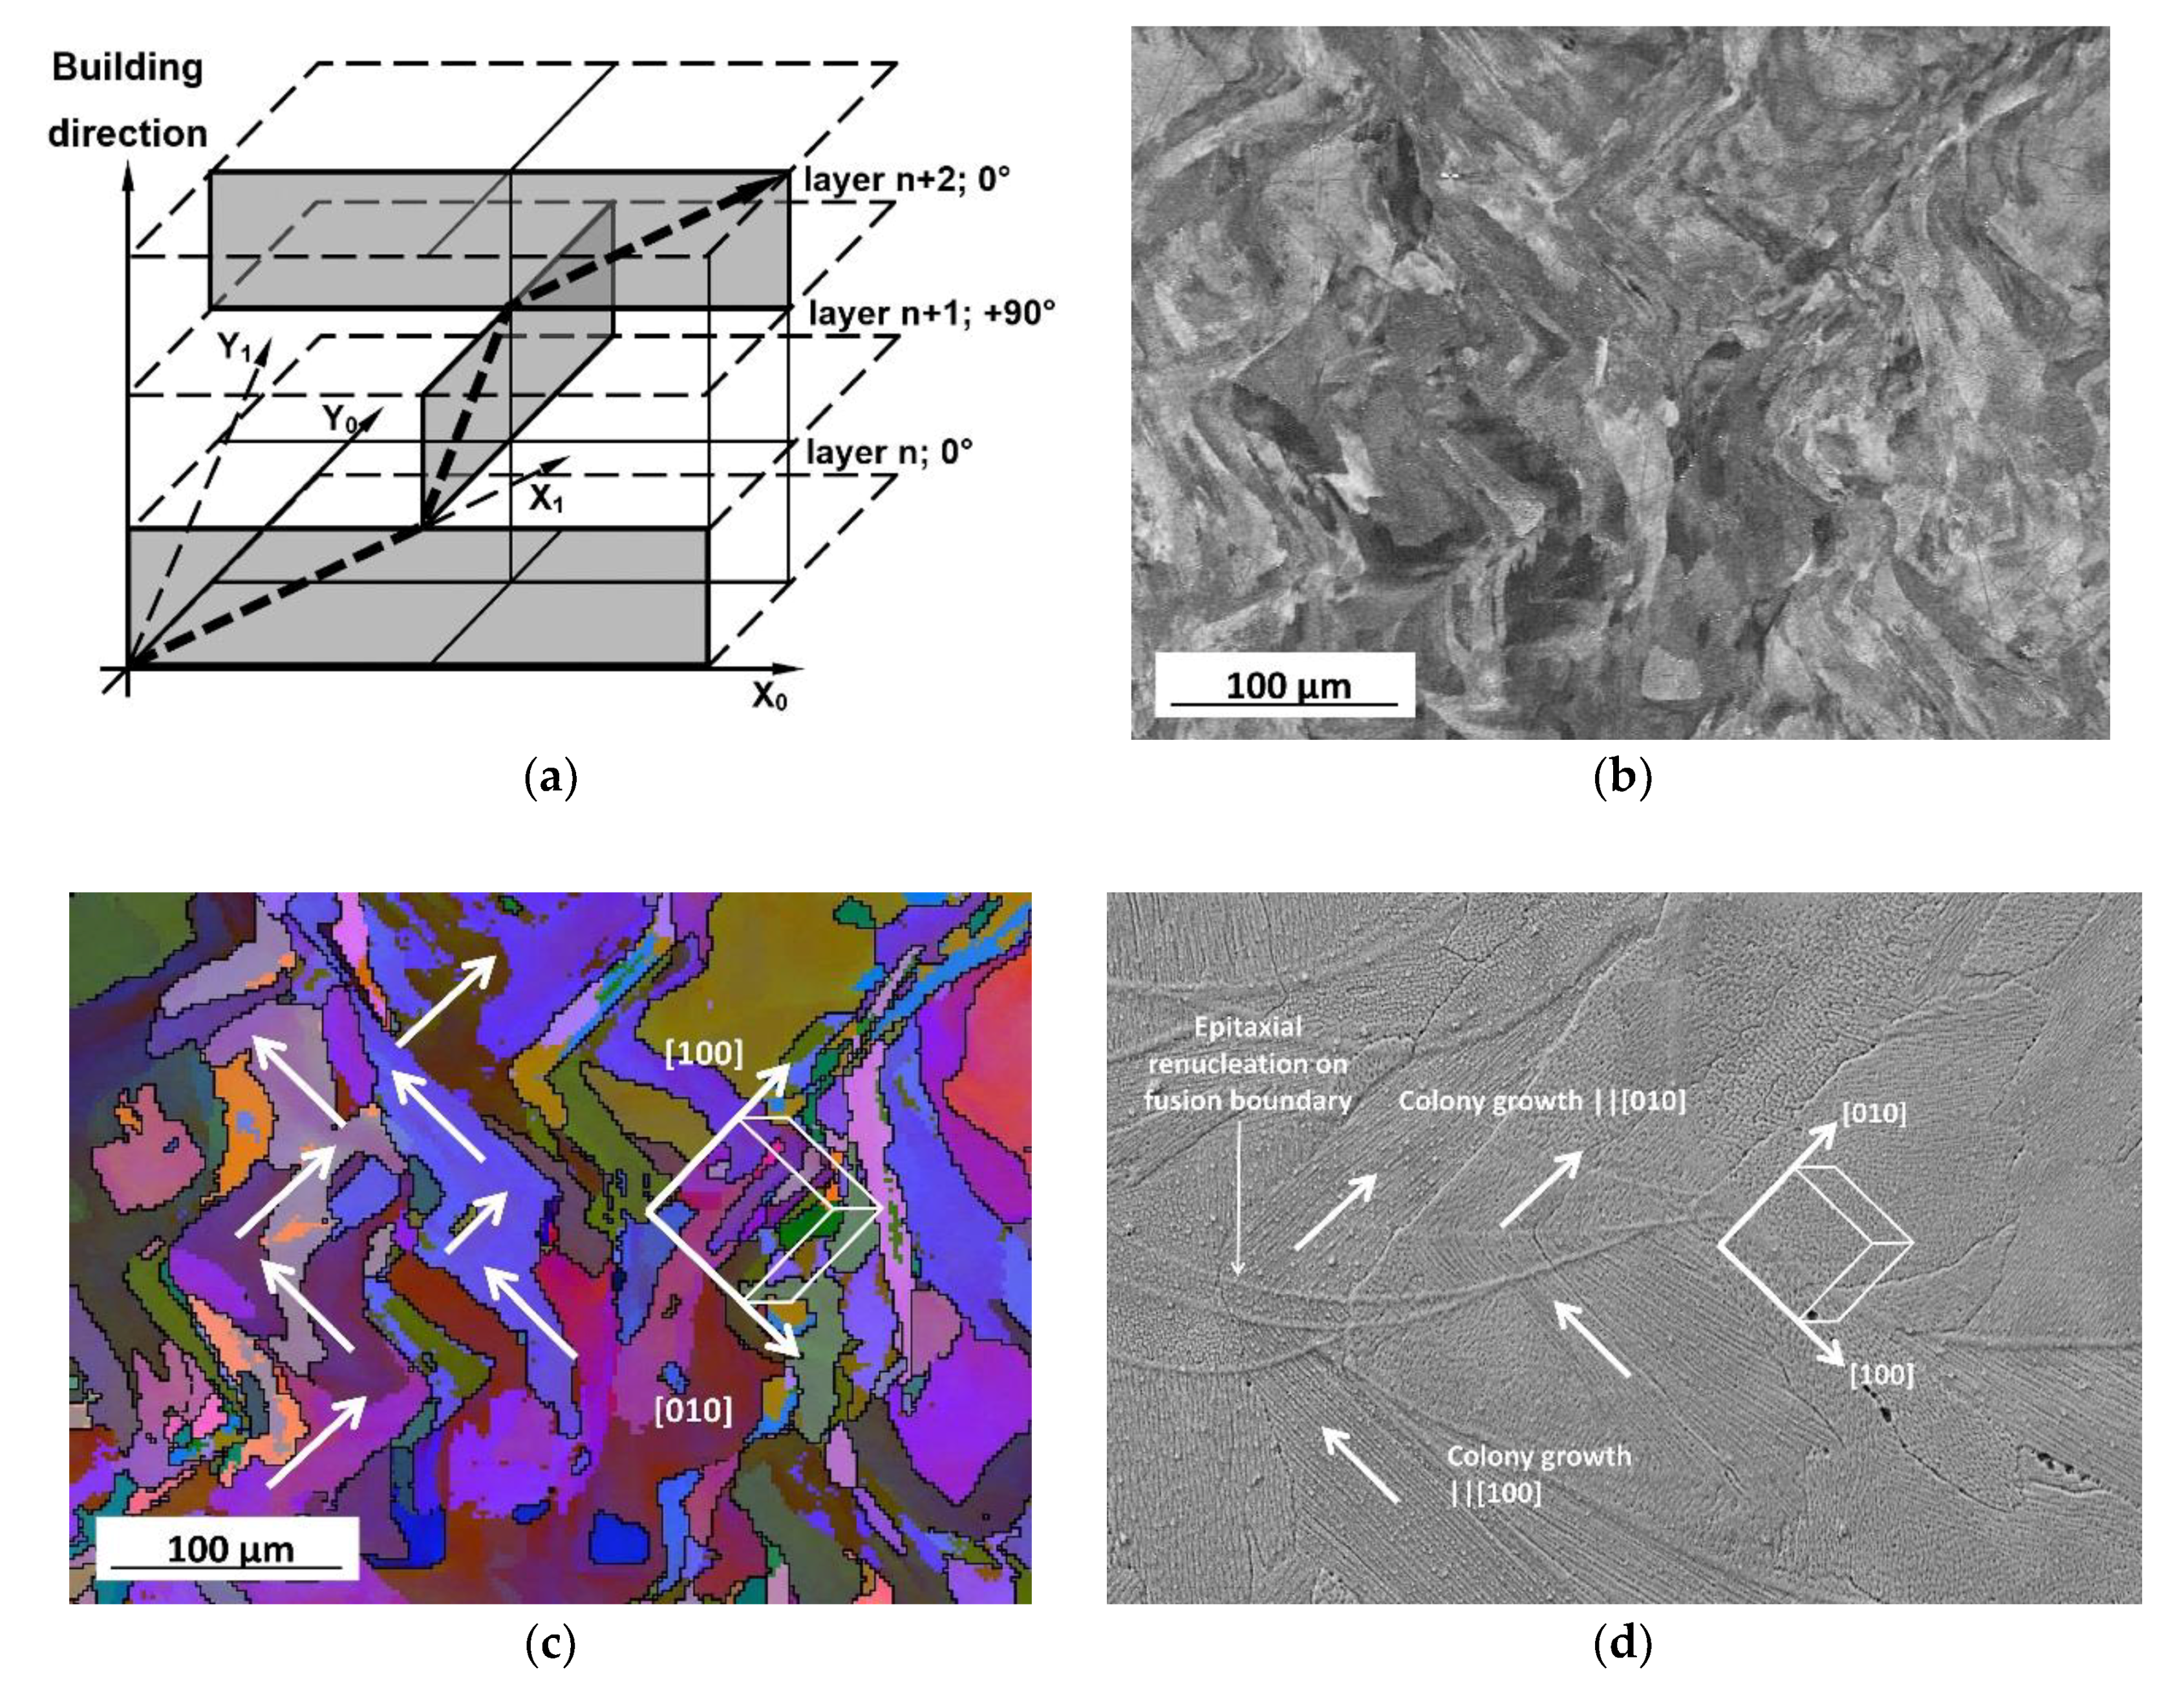
3.3. Solidification Texture

The growth of colonies at LPBF is controlled by competitive crystallization. Colonies that have the best orientation according to Equation (3) will have preferential conditions to continue growing [5,27]. Therefore, within one single layer, the majority of the colonies will have a solidification texture and will grow at a similar angle to the laser scanning direction. This angle depends on the laser scanning speed (Equation (3)). As the solid-liquid interface at the bottom of the molten pool is curved, a number of colonies with different misorientations will also nucleate, following the epitaxial nucleation conditions.
Figure 6a illustrates the orientation map of LPBF manufactured 316 L stainless steel specimen, cross sectioned along the longitudinal direction. The misorientation angle between the colony growth direction and the laser scanning direction depends on the shape of the solid-liquid interface and the local G and R parameters within the molten pool. Within colonies, low-angle boundaries were also observed; shades of color (Figure 6a), and red dashed lines (Figure 6b) indicate the low angle boundaries within a colony. It has been reported that the angle between colonies varies between 30–65° depending on laser scanning speed [35], and the position of the colony within the molten pool [7]. The experimentally observed variations in the colony growth direction could be related to the local crystallographic orientation of the nucleation site of each colony, nucleation of a colony at a side of the pool, local temperature, and concentration fluctuations in the melt at manufacturing. In [19], it was also indicated that the Marangoni flow in the molten pool might also change the heat flux direction and affect the growth orientation of dendrites in LPBF.
In manufacturing a multilayered object, the colonies inherit the crystallographic orientation from the previous layer due to the epitaxial nucleation (Figure 1 and Figure 2). Therefore, each next layer inherits the texture repeatedly, layer after layer, forming a three-dimensional solidification texture in the final 3D object. Formation of solidification <100> texture has been reported for cubic materials like austenitic stainless steel [5,46,47], Ni-base superalloys [9,34], Al alloys [48], tantalum [49], and others. Strongly textured as-built LPBF 316 L samples with a high fraction of <100> oriented grains have been investigated by [18,46], while in [47], relatively low fraction of <100> textured grains were reported.
Figure 7 illustrates the formation of the 3D solidification texture that was observed in the present investigation in the 316 L steel manufactured using the rescanning strategy. A schematic representation of the mechanisms of the formation of the 3D texture is illustrated in Figure 7a. When the laser manufactures layer “n”, it scans along the X0 direction. According to Equation (3), the colonies grow along the X1 direction. Then, the laser scanning direction is changed by 90° and a new layer is manufactured. The laser scans along the Y0 direction, and colonies, after epitaxial renucleation, grow along the Y1 direction. Then, the laser changes the scanning direction back and colonies again grow along the X1 direction.
In the present investigation, to visualize microstructure and texture in the LPBF 316 L steel, the specimen was cross-sectioned so that the surface of interest was coplanar to the X1 and Y1 directions. In the etched cross-section, it was seen that the cell growth direction within this colony changed at the solidification line by 90°. This can be interpreted as a change of growth direction; for example, from [100] to [010] within the same colony. Thus, a colony can be interpreted as a single crystal of a zig-zag shape, with the growth direction changing from [100] to [010] subsequently in each next layer. The EBSD map in Figure 7c confirmed this hypothesis. The zig-zag shape of a colony (colored in, for example, blue) was clearly recognizable. Different shades of blue within this colony corresponded to low-angle misorientations. A reconstruction of the cubic orientations in this colony showed that the whole colony had the same 3D crystallographic orientation through at least four layers.
Nevertheless, the colony cannot grow continuously through an infinite number of layers. The directions X1 and Y1 are coplanar but not orthogonal, while the angle between [100] and [010] is 90°. Due to this, a misorientation between the <100> growth directions and the laser scanning direction accumulates, and finally, another colony will have better conditions to continue growth. This could be a reason as to why LPBF materials show a clear solidification texture (directed solidification of colonies through several layers), while a crystallographic texture (preferable orientation of crystal directions of the bulk sample) is much less pronounced.
Thus, the formation of texture is attributed to the scanning and building strategies, as well as the process-parameters. The formation of the final 3D texture is dependent on the laser scanning directions, and therefore, it could be predicted and controlled if the manufacturing strategy is known. Experimentally, the possibility to control microstructure through adjustments of the scanning strategy and process parameters has been presented for DED Ni-base alloys [34,50] and LPBF Ni- [51,52], and Al-alloys [48].

3.4. Mechanical Properties

Commonly, when compared to conventional wrought material, 316 L steel manufactured by LPBF has higher yield and ultimate tensile strength, but lower ductility. Quite remarkable variations of yield strength (300–600 MPa), ultimate tensile strength (350–650 MPa), and elongation (10–60%) are usually observed [5,6,18,19,20,21,29,36,44,46,47]. Higher strength could be associated with fine structure, high dislocation density, cellular structure, and the presence of nanoparticles. Additionally, tensile characteristics have been found to vary depending on the building direction and manufacturing strategy. A lower elongation in LPBF material is associated with high strength; additionally, porosity and internal defects contribute to a large scatter in elongation values. A summary of the mechanical characteristics of LPBF 316 L steel can be found in [5,6,44].
Figure 8 illustrates the dependence of the hardness of AM and conventional 316 L steel on the inversed square root of primary cell spacing. Hardness values of LPBF 316 L steel have been collected from our own measurements and from the literature [19,22,23]. For a comparison, hardness for 316 L steel manufactured by direct laser deposition was collected from [36,53,54,55,56]. Hardness for conventional and nanoscale 316 L steel was found in [57,58,59]. It can be seen that the experimentally observed data of hardness in AM 316 L steel agreed well with a linearized Hall–Petch dependence for conventional materials with different grain size. Therefore, it is possible to conclude that the primary cell spacing is the key microstructural parameter controlling strength and hardness characteristics in the laser-assisted additive manufactured materials. This is an important observation because the primary cell spacing can be directly controlled through alterations of laser power and laser scanning speed [7].
Although the hardness of LPBF materials can be described quite well by a Hall–Petch relationship, the experimental results had quite a remarkable scatter. It has been experimentally demonstrated that the primary cell spacing is smaller at the bottom of the molten pool and therefore, the hardness measured there is higher [7,36,43]. This is an important factor causing the large scatter of the experimentally measured hardness values. Other factors that influence the hardness of PLBF stainless steels are, for example, the interaction of dislocations with the particles [22,23,25,29], residual stresses, material porosity, and defects. These factors may result in a strengthening or weakening effect, thus increasing spread in the experimentally measured data. For example, a decrease in hardness from 225 to 162 HV10 was observed as porosity increased from 0.38% to about 8.84% [60].

3.5. Thermal Stability

To remove thermal stresses, a stress relieving post-treatment is often required for LPBF objects. The stress relieving temperature of 316 L stainless steel is 700 °C or above [61]. At these temperatures, thermally activated processes affect the microstructure and properties of the material. Recovery processes, which are related to the dynamics of dislocations, involve interaction, annihilation, and non-conservative movement of the dislocations. Recrystallization leads to the migration of grain boundaries and grain growth. In AM 316 L materials, two types of boundaries are observed. The cell boundaries are formed by dislocations. They are dislocation structures rather than regular grain boundaries (Figure 3). The colony boundaries are prior regular high-angle austenite grain boundaries.
The primary cell spacing, as illustrated in Figure 8, governs hardness and strength. Therefore, the stability of the cells has to be directly related to the control of the stability of strength of the AM 316 L material. To investigate the stability of the cellular structures in the present study, a number of isothermal 15 min heat treatments at temperatures in a range of 450–1050 °C were conducted. After the heat treatments, the microstructure of specimens was investigated. Figure 9 shows the microstructures of the AM 316 L material in as-built and heat-treated (15 min at 800 and 900 °C) conditions.
It is seen (Figure 9a,b) that the cell boundaries were still stable after heat treatment at 800 °C. After heat treatment at 900 °C, the cells were no longer observed (Figure 9c). Similar observations of cell stability have been reported in [62,63]. Colonies, in contrast, were quite stable. Even after 15 min at 1050 °C, no remarkable colony growth was observed. These observations were in agreement with the results published in [22,25,64], where recrystallization and grain growth in LPBF 316 L material were observed after annealing for 30–60 min at temperatures between 1060–1400 °C. The experimentally observed recrystallization temperatures of LPBF 316 L steel were higher than those in conventional materials where static recrystallization starts after annealing for 30–60 min at temperatures 750–900 °C [61]. This can be explained by stabilization of the colony boundaries due to the segregation of solute atoms.
The microstructural changes correlated well with changes in the hardness measured after the heat treatments (Figure 10a). After heat treatments below 800 °C, the hardness did not change remarkably. Some decrease in hardness could be associated with the relaxation of the residual stresses, which are usually high in as-built AM materials. It can be seen in Figure 9, that up to 800 °C, the cells were stable. At 850–900 °C, the cells disappeared, and hardness also decreased. After annealing at 1000 °C, the hardness reached values typical for annealed coarse-grained conventional materials [65].
TEM of the annealed specimens carried out in the present investigation showed that the particles had quite high thermal stability and did not change size after heat treatments. Figure 10b illustrates the interaction of dislocations with the particles, confirming possible Orowan looping mechanisms. Similar oxide particles have been suggested to contribute to the hardness and strength of the as-built LPBF 316 [22,23,25,29]. Nevertheless, the present investigation showed that after annealing, the hardness of the LPBF 316 steel was 198 HV, which was lower than the 210–220 HV (95 HRB) mentioned as typical for annealed wrought 316 L steel that does not contain such particles [65]. Therefore, a contribution of the particles in the strengthening effect due to the Orowan looping could be considered as quite insignificant. Instead, the formation of cells in the microstructure is believed to be the main strengthening mechanisms leading to the high hardness and strength values observed in as-built LPBF 316 L stainless steel.

4. Conclusions

  • As-built microstructure in AM 316 L consists of colonies of cells. Boundaries between cells are not regular high-angle grain boundaries, but rather, dislocation structures of 100–300 nm in thickness.
  • The size of the cells in the colonies depends on the manufacturing conditions and may vary even within a single track. The segregation of elements on the cell boundaries is presumably a function of the solidification conditions, and it may vary in AM 316 L manufactured at different laser powers and scanning speeds.
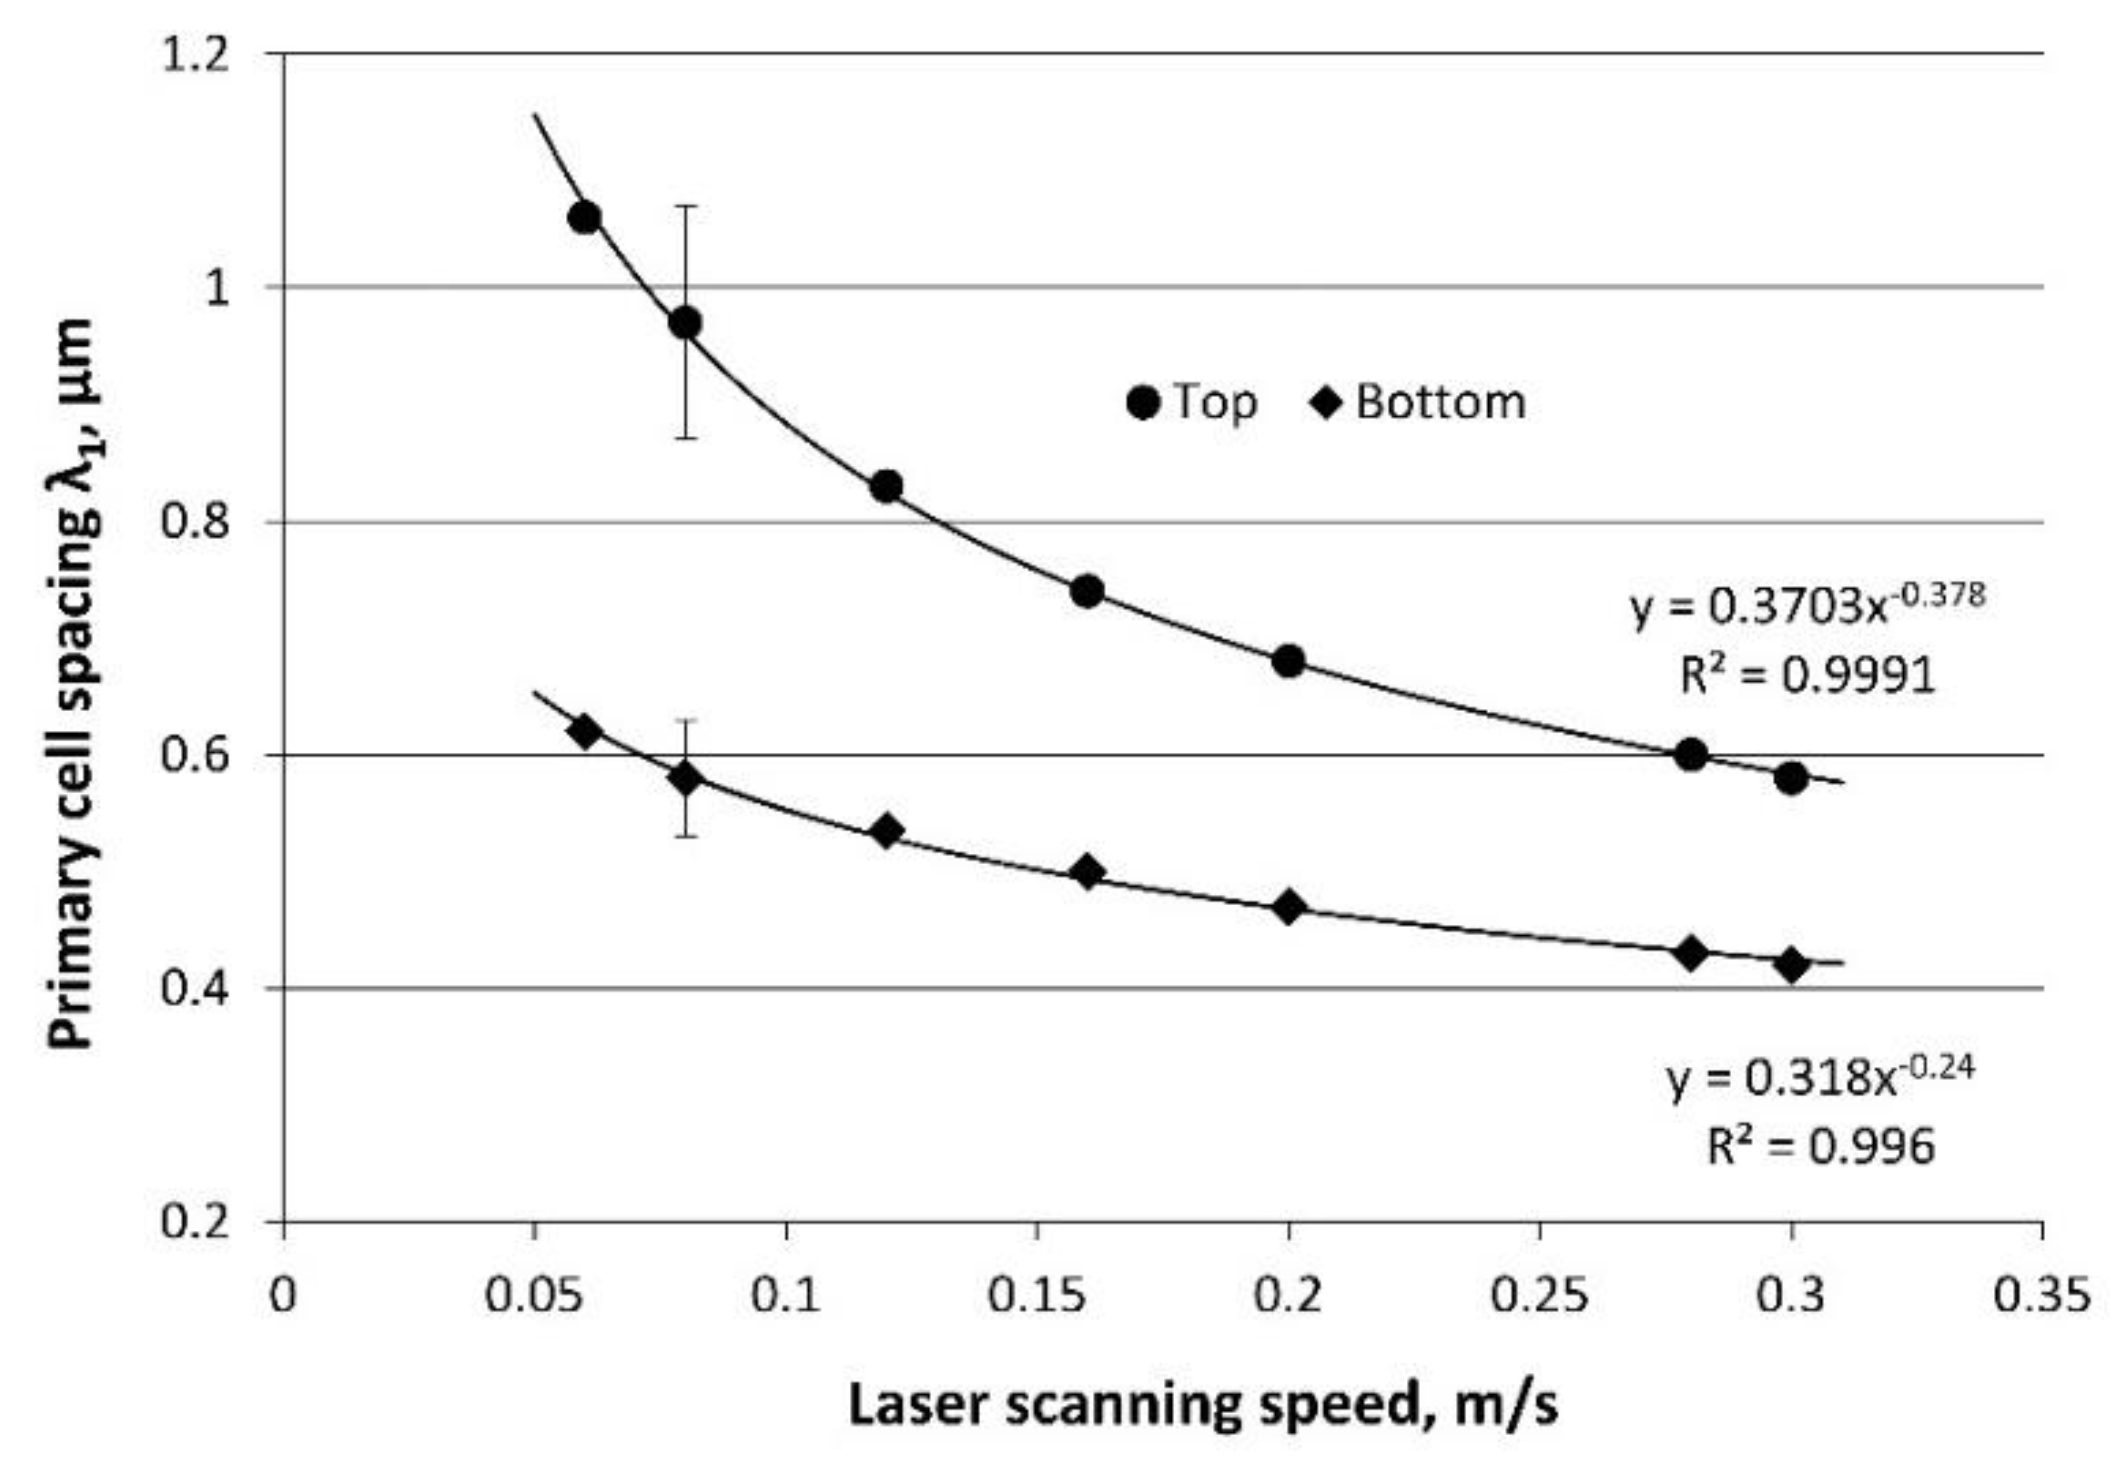
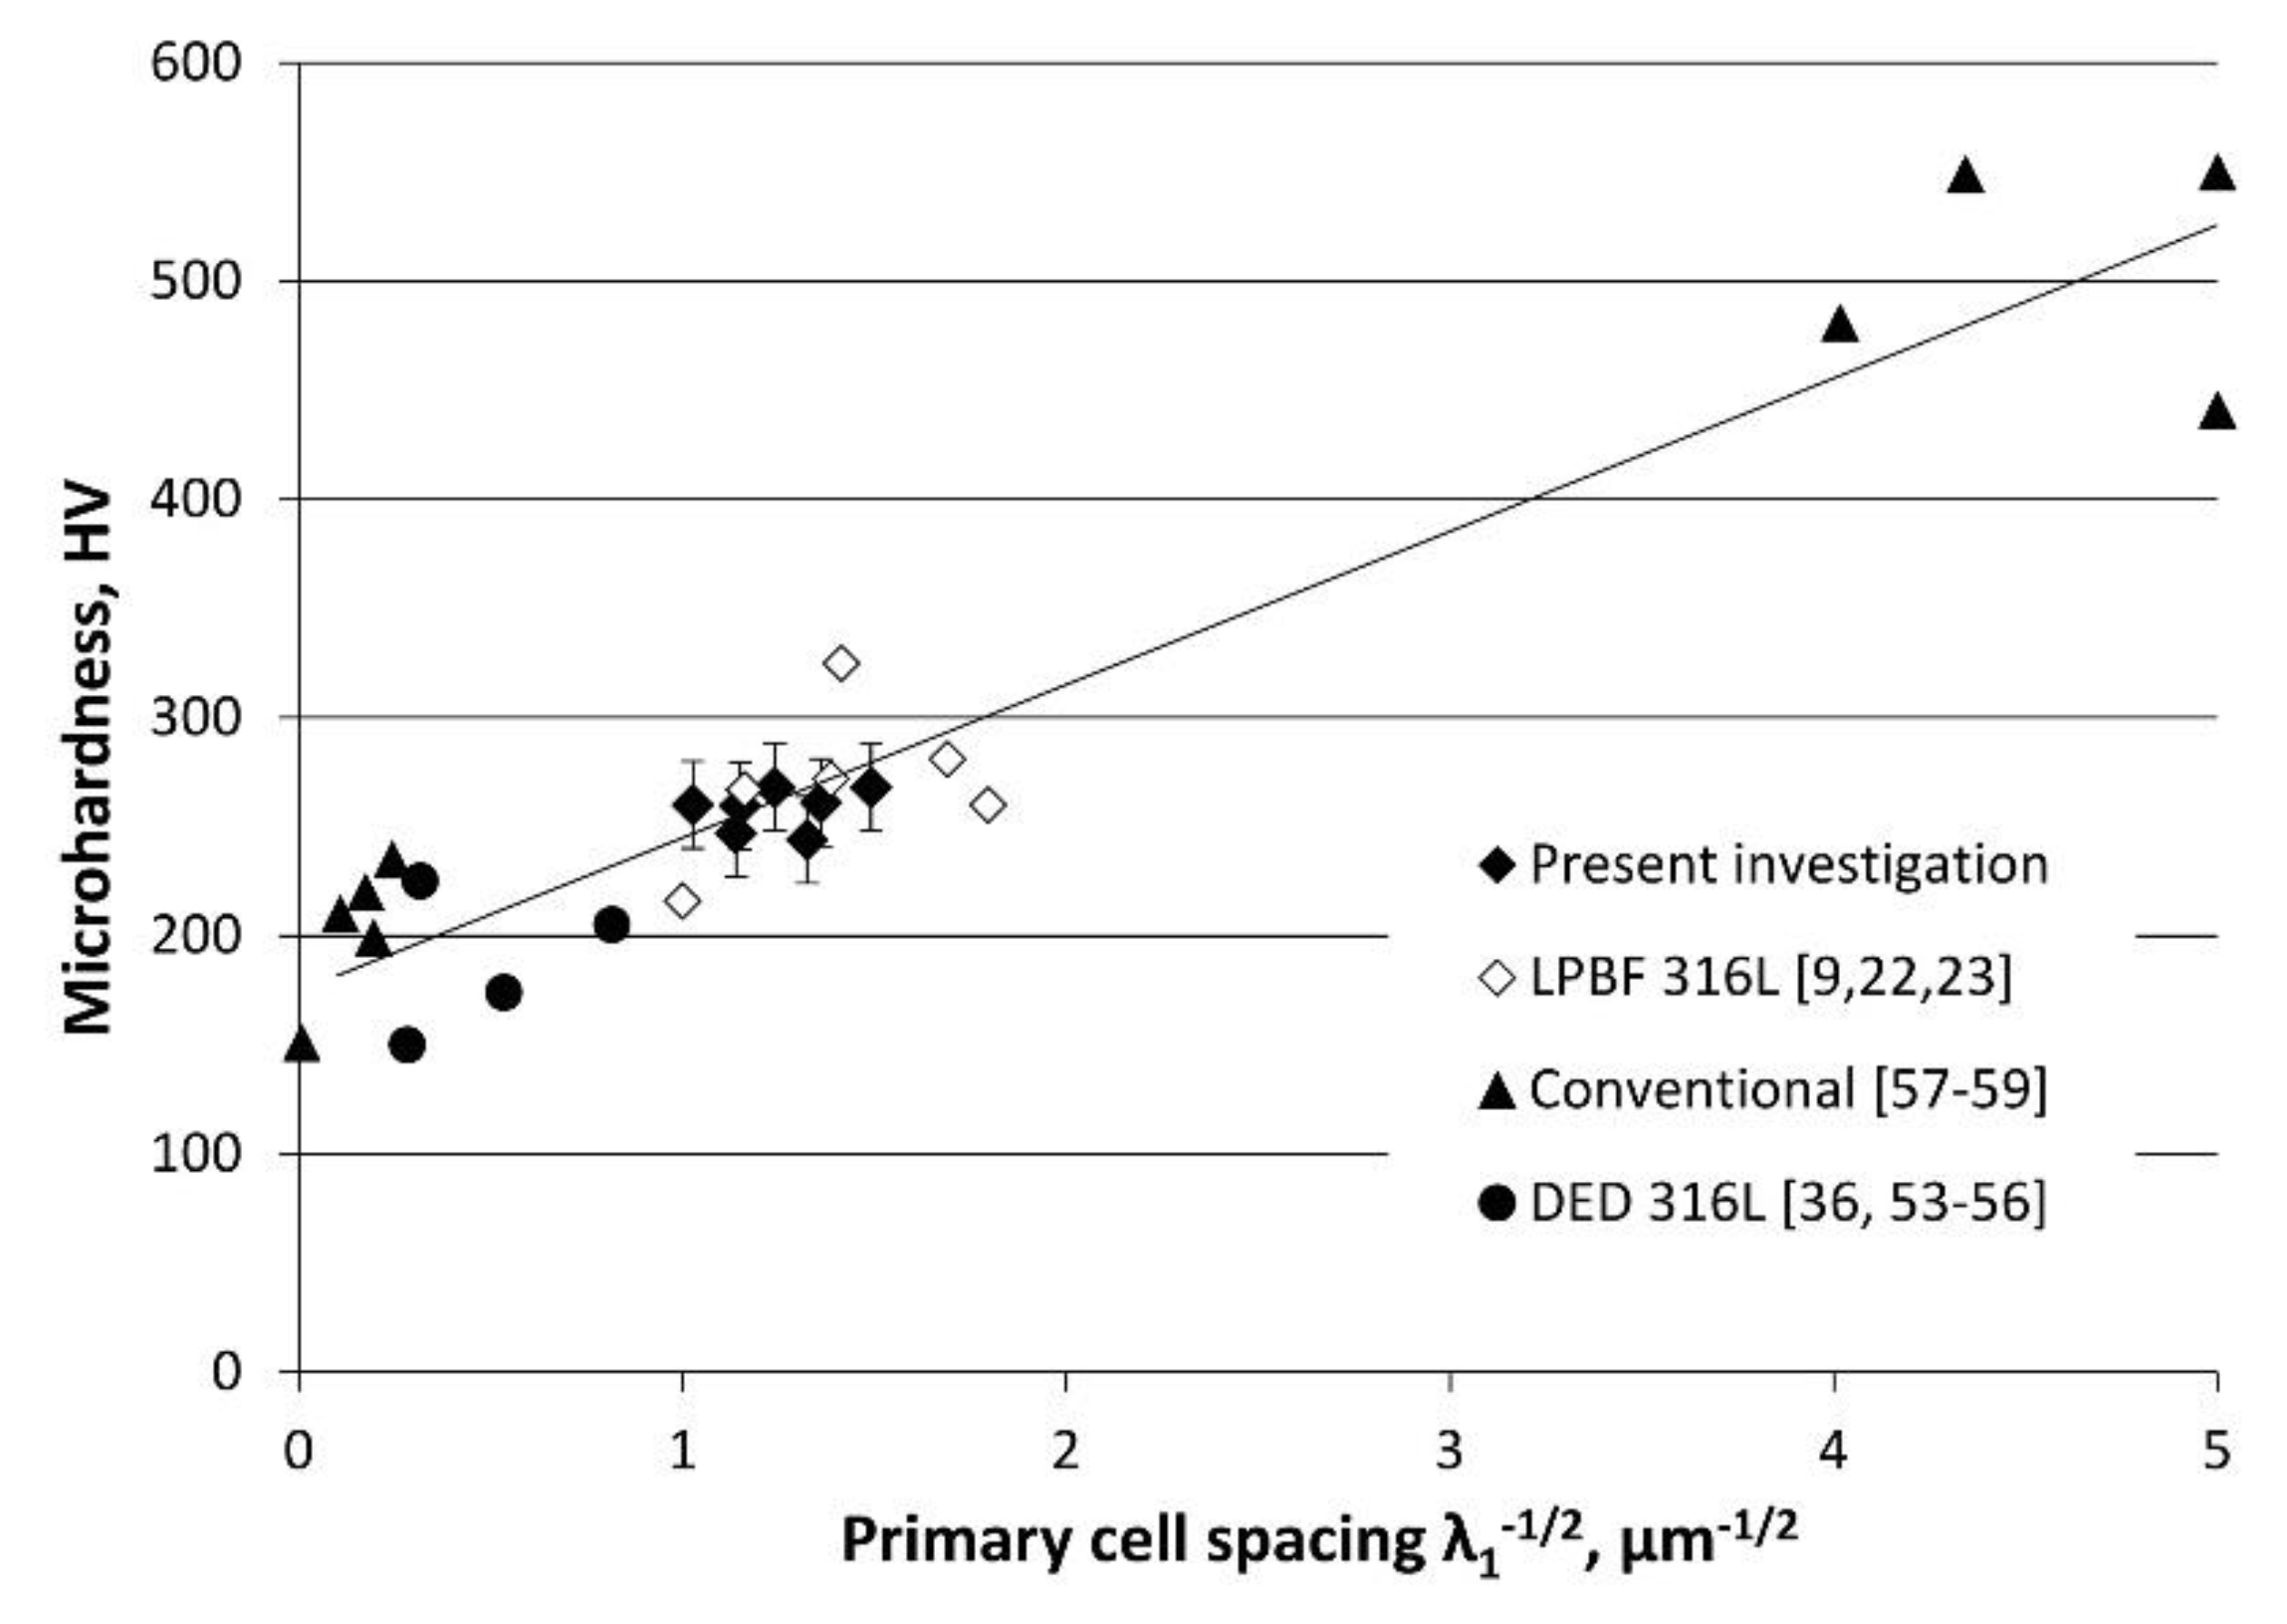
  • Primary cell spacing is the key parameter that controls strength, following the Hall–Petch relationship. In many cases, deviations from the Hall–Petch relationship can be explained by variations of the primary cell spacing through the LPBF material and porosity.
  • Solidification texture is formed by colonies that grew through several layers. The texture was controlled by the manufacturing strategy. This phenomenon provides an opportunity to design the microstructure and anisotropy in the final LPBF 316 L component.
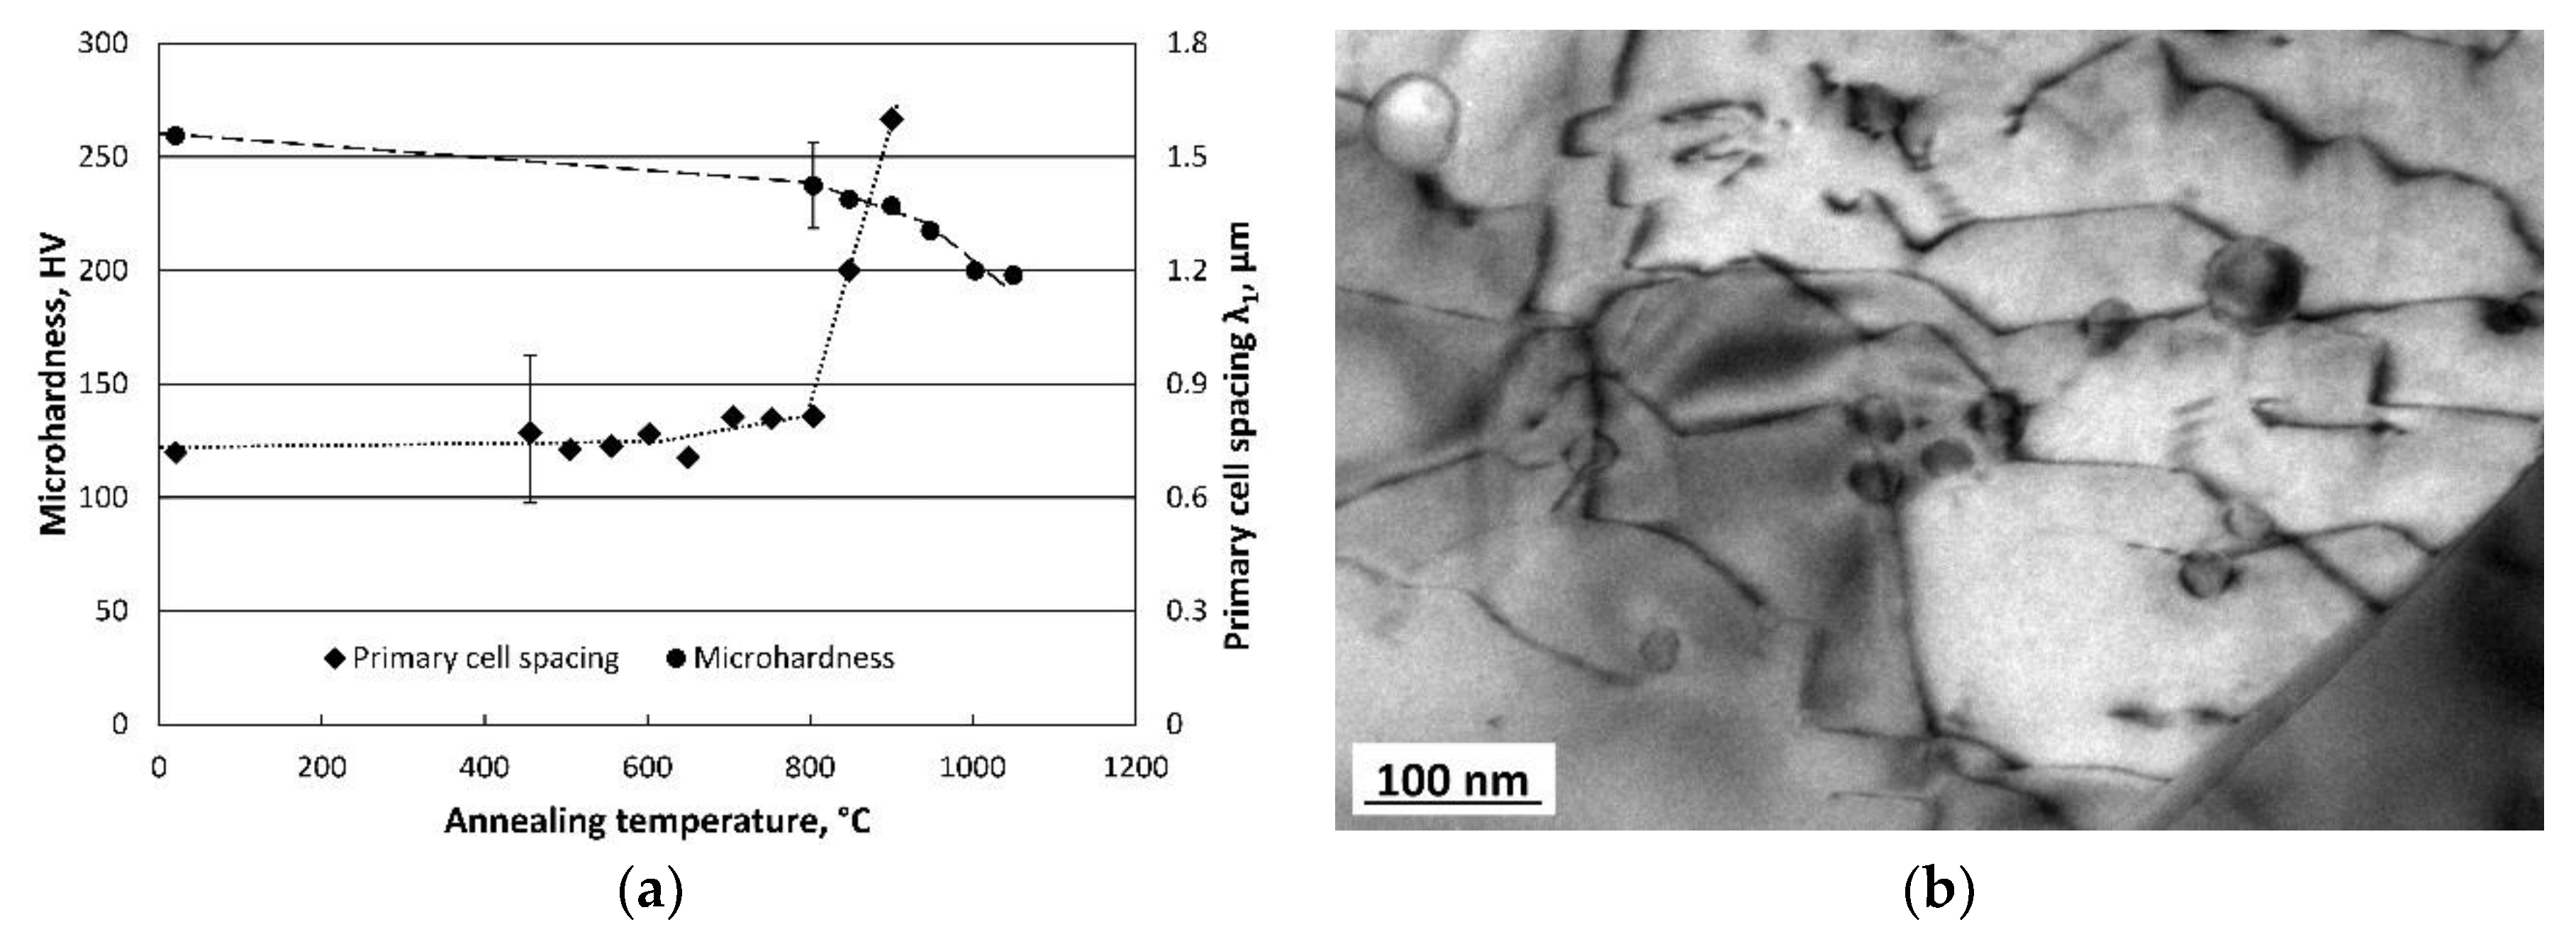
  • Cells within colonies are stable up to 800–900 °C, after that they disappear. The disappearance of cells directly results in a decrease in hardness. Colony growth was not significant until 1050 °C.
  • Nanoscale oxide particles probably form from surface oxide, or due to oxygen pick up during manufacturing. They are stable and do not coalesce or change shape after heat treatment up to 1050 °C. The contribution of these nanoscale particles to hardness of LPBF 316 L material seems to be insignificant, since after heat treatment the hardness of LPBF 316 L steel approached values typical for conventional coarse-grained material.

Author Contributions

All co-authors contributed to the planning and carrying out the experimental part of this study, and preparation of the manuscript. Specific contributions: I.Y. (Igor Yadroitsev) and I.Y. (Ina Yadroitsava)—manufacturing and process optimizations, microscopy; P.K., G.F., K.S.—scanning and transmission electron microscopy including energy dispersive X-ray spectroscopy, and data analysis; M.T. contributed with the APT experiments; and R.P. contributed with the EBSD investigations. All co-authors contributed to the data analysis, current discussions, and preparation of the manuscript.

Funding

The authors thank the South African Research Chairs Initiative of the Department of Science and Technology and National Research Foundation of South Africa (Grant No. 97994), the Collaborative Program in Additive Manufacturing (Contract NoCSIR-NLC-CPAM-15-MOA-CUT-01), Region Värmland, Karlstad University, and the Swedish Agency for Economic and Regional Growth (Grant No20201144) for their financial support of this research.

Conflicts of Interest

The authors declare no conflicts of interest.

References

  1. ISO/ASTM 52900:2015: Additive Manufacturing—General Principles–Technology; ASTM International: West Conshohocken, PA, USA, 2015.
  2. Aboulkhair, N.T.; Everitt, N.M.; Ashcroft, I.; Tuck, C. Reducing porosity in AlSi10Mg parts processed by selective laser melting. Addit. Manuf. 2014, 1, 77–86. [Google Scholar] [CrossRef]
  3. Peng, T.; Chen, C. Influence of energy density on energy demand and porosity of 316L stainless steel fabricated by selective laser melting. Int. J. Precis. Eng. Manuf. Green Technol. 2018, 5, 55–62. [Google Scholar] [CrossRef]
  4. Yadroitsev, I.; Krakhmalev, P.; Yadroitsava, I. Hierarchical design principles of selective laser melting for high quality metallic objects. Addit. Manuf. 2015, 7, 45–56. [Google Scholar] [CrossRef]
  5. DebRoy, T.; Wei, H.L.; Zuback, J.S.; Mukherjee, T.; Elmer, J.W.; Milewski, J.O.; Beese, A.M.; Wilson-Heid, A.; De, A.; Zhang, W. Additive manufacturing of metallic components—Process, structure and properties. Prog. Mater. Sci. 2018, 92, 112–224. [Google Scholar] [CrossRef]
  6. Zhang, D.; Sun, S.; Qiu, D.; Gibson, M.A.; Dargusch, M.S.; Brandt, M.; Qian, M.; Easton, M. Metal Alloys for Fusion-Based Additive Manufacturing. Adv. Eng. Mater. 2018, 20, 1700952. [Google Scholar] [CrossRef]
  7. Yadroitsev, I.; Krakhmalev, P.; Yadroitsava, I.; Johansson, S.; Smurov, I. Energy input effect on morphology and microstructure of selective laser melting single track from metallic powder. J. Mater. Process. Technol. 2013, 213, 606–613. [Google Scholar] [CrossRef]
  8. Amato, K.N.; Gaytan, S.M.; Murr, L.E.; Martinez, E.; Shindo, P.W.; Hernandez, J.; Collins, S.; Medina, F. Microstructures and mechanical behavior of Inconel 718 fabricated by selective laser melting. Acta Mater. 2012, 60, 2229–2239. [Google Scholar] [CrossRef]
  9. Kunze, K.; Etter, T.; Grässlin, J.; Shklover, V. Texture, anisotropy in microstructure and mechanical properties of IN738LC alloy processed by selective laser melting (SLM). Mater. Sci. Eng. A 2015, 620, 213–222. [Google Scholar] [CrossRef]
  10. Van Meensel, K.; Kruth, J.-P.; Van Humbeeck, J.; Dadbakhsh, S.; Van Hooreweder, B.; Van Meensel, K.; Krakhmalev, P.; Yadroitsev, I.; Francis, M. Additive manufacturing for medical applications. In Additive Manufacturing: Materials, Processes, Quantifications and Applications, 1st ed.; Zhang, J., Jung, Y.G., Eds.; Butterworth-Heinemann: Oxford, UK, 2018; pp. 261–309. ISBN 9780128121559. [Google Scholar] [CrossRef]
  11. Wu, J.; Wang, X.Q.; Wang, W.; Attallah, M.M.; Loretto, M.H. Microstructure and strength of selectively laser melted AlSi10Mg. Acta Mater. 2016, 117, 311–320. [Google Scholar] [CrossRef]
  12. Mutua, J.; Nakata, S.; Onda, T.; Chen, Z. Optimization of selective laser melting parameters and influence of post heat treatment on microstructure and mechanical properties of maraging steel. Mater. Des. 2018, 139, 486–497. [Google Scholar] [CrossRef]
  13. Iturrioz, A.; Gil, E.; Petite, M.M.; Garciandia, F.; Mancisidor, A.M.; San Sebastian, M. Selective laser melting of AlSi10Mg alloy: Influence of heat treatment condition on mechanical properties and microstructure. Weld. World 2018, 62, 885–892. [Google Scholar] [CrossRef]
  14. Raghavan, S.; Zhang, B.; Wang, P.; Sun, C.N.; Nai, M.L.S.; Li, T.; Wei, J. Effect of different heat treatments on the microstructure and mechanical properties in selective laser melted INCONEL 718 alloy. Mater. Manuf. Proc. 2017, 32, 1588–1595. [Google Scholar] [CrossRef]
  15. Yadroitsev, I.; Krakhmalev, P.; Yadroitsava, I. Selective laser melting of Ti6Al4V alloy for biomedical applications: Temperature monitoring and microstructural evolution. J. Alloys Compd. 2014, 583, 404–409. [Google Scholar] [CrossRef]
  16. Yadroitsev, I. Selective Laser Melting: Direct Manufacturing of 3D-Objects by Selective Laser Melting of Metal Powders; LAP Lambert Academic Publishing AG & Co KG: Saarbrücken, Germany, 2009; ISBN -3838317947. [Google Scholar]
  17. Yasa, E.; Kruth, J.-P. Microstructural investigation of selective laser melting 316 L stainless steel parts exposed to laser re-melting. Process. Eng. 2011, 19, 389–395. [Google Scholar] [CrossRef]
  18. Niendorf, T.; Leuders, S.; Riemer, A.; Richard, H.A.; Tröster, T.; Schwarze, D. Highly anisotropic steel processed by selective laser melting. Metall. Mater. Trans. B 2013, 44, 794–796. [Google Scholar] [CrossRef]
  19. Wang, D.; Song, C.; Yang, Y.; Bai, Y. Investigation of crystal growth mechanism during selective laser melting and mechanical property characterization of 316L stainless steel parts. Mater. Des. 2016, 100, 291–299. [Google Scholar] [CrossRef]
  20. Bartolomeu, F.; Buciumeanu, M.; Pinto, E.; Alves, N.; Carvalho, O.; Silva, F.S.; Miranda, G. 316L stainless steel mechanical and tribological behavior—A comparison between selective laser melting, hot pressing and conventional casting. Addit. Manuf. 2017, 16, 81–89. [Google Scholar] [CrossRef]
  21. Liverani, E.; Toschi, S.; Ceschinim, L.; Fortunato, A. Effect of selective laser melting (SLM) process parameters on microstructure and mechanical properties of 316L austenitic stainless steel. J. Mater. Process. Technol. 2017, 249, 255–263. [Google Scholar] [CrossRef]
  22. Saeidi, K.; Gao, X.; Zhong, Y.; Shen, Z.J. Hardened austenite steel with columnar sub-grain structure formed by laser melting. Mater. Sci. Eng. A 2015, 625, 221–229. [Google Scholar] [CrossRef]
  23. Sun, Z.; Tan, X.; Tor, S.B.; Yeong, W.Y. Selective laser melting of stainless steel 316L with low porosity and high build rates. Mater. Des. 2016, 104, 197–204. [Google Scholar] [CrossRef]
  24. Yakout, M.; Elbestawi, M.A.; Veldhuis, S.C. On the characterization of stainless steel 316L parts produced by selective laser melting. Int. J. Adv. Manuf. Technol. 2018, 95, 1953–1974. [Google Scholar] [CrossRef]
  25. Yan, F.; Xiong, W.; Faierson, E.J. Grain Structure Control of Additively Manufactured Metallic Materials. Materials 2017, 10, 1260. [Google Scholar] [CrossRef]
  26. Sun, D.; Li, X.; Tan, W. A parametric study on grain structure in selective laser melting process for stainless steel 316L. In Proceedings of the 28th Annual International Solid Freeform Fabrication Symposium—An Additive Manufacturing Conference, Austin, TX, USA, 7–9 August 2017; pp. 342–350. [Google Scholar]
  27. Kou, S. Welding Metallurgy, 2nd ed.; Wiley-Interscience: Hoboken, NJ, USA, 2003; 480p. [Google Scholar]
  28. Krakhmalev, P.; Yadroitsava, I.; Fredriksson, G.; Yadroitsev, I. In situ heat treatment in selective laser melted martensitic AISI 420 stainless steels. Mater. Des. 2015, 87, 380–385. [Google Scholar] [CrossRef]
  29. Zhong, Y.; Liu, L.; Wikman, S.; Cui, D.; Shen, Z. Intragranular cellular segregation network structure strengthening 316L stainless steel prepared by selective laser melting. J. Nucl. Mater. 2016, 470, 170–178. [Google Scholar] [CrossRef]
  30. Chao, Q.; Cruz, V.; Thomas, S.; Birbilis, N.; Collins, P.; Taylor, A.; Hodgson, P.D.; Fabijanic, D. On the enhanced corrosion resistance of a selective laser melted austenitic stainless steel. Scr. Mater. 2017, 141, 94–98. [Google Scholar] [CrossRef]
  31. Kong, D.; Ni, X.; Dong, C.; Zhang, L.; Mana, C.; Yao, J.; Xiao, K.; Li, X. Heat treatment effect on the microstructure and corrosion behavior of 316L stainless steel fabricated by selective laser melting for proton exchange membrane fuel cells. Electrochim. Acta 2018, 276, 293–303. [Google Scholar] [CrossRef]
  32. Hedberg, Y.; Norell, M.; Linhardt, P.; Bergqvist, H.; Odnevall Wallinder, I. Influence of surface oxide characteristics and speciation on corrosion, electrochemical properties and metal release of atomized 316L stainless steel powders. Int. J. Electrochem. Sci. 2012, 7, 11655–11677. [Google Scholar]
  33. Kurz, W.; Fisher, D.J. Dendrite growth at the limit of stability: Tip radius and spacing. Acta Metall. 1981, 29, 11–20. [Google Scholar] [CrossRef]
  34. Wei, H.L.; Mazumder, J.; DebRoy, T. Evolution of solidification texture during additive manufacturing. Sci. Rep. 2015, 5, 16446. [Google Scholar] [CrossRef] [PubMed] [Green Version]
  35. Ocelík, V.; Furár, I.; De Hosson, J.T.M. Microstructure and properties of laser clad coatings studied by orientation imaging microscopy. Acta Mater. 2010, 58, 6763–6772. [Google Scholar] [CrossRef]
  36. Yu, J.; Rombouts, M.; Maes, G. Cracking behavior and mechanical properties of austenitic stainless steel parts produced by laser metal deposition. Mater. Des. 2013, 45, 228–235. [Google Scholar] [CrossRef]
  37. Kurz, W.; Trivedi, R. Rapid solidification processing and microstructure formation. Mater. Sci. Eng. A 1994, 179, 46–51. [Google Scholar] [CrossRef]
  38. Colaço, R.; Vilar, R. Stabilisation of retained austenite in laser surface melted tool steels. Mater. Sci. Eng. A 2004, 385, 123–127. [Google Scholar] [CrossRef]
  39. Hemmati, I.; Ocelik, V.; De Hosson, J.T.M. Microstructural characterization of AISI 431 martensitic stainless steel laser-deposited coatings. J. Mater. Sci. 2011, 46, 3405–3414. [Google Scholar] [CrossRef] [Green Version]
  40. Herlach, D.M. Non-equilibrium solidification of undercooled metallic melts. Metals 2014, 4, 196–234. [Google Scholar] [CrossRef]
  41. Martin, J.H.; Yahata, B.D.; Hundley, J.M.; Mayer, J.A.; Schaedler, T.A.; Pollock, T.M. 3D printing of high-strength aluminium alloys. Nature 2017, 549, 365–369. [Google Scholar] [CrossRef] [PubMed]
  42. Attallah, M.M.; Jennings, R.; Wang, X.; Carter, L.N. Additive manufacturing of Ni-based superalloys: The outstanding issues. MRS Bull. 2016, 41, 758–764. [Google Scholar] [CrossRef]
  43. Liu, Y.; Pang, Z.; Zhang, J. Comparative study on the influence of subsequent thermal cycling on microstructure and mechanical properties of selective laser melted 316L stainless steel. Appl. Phys. A 2017, 123, 688. [Google Scholar] [CrossRef]
  44. Wang, Y.M.; Voisin, T.; McKeown, J.T.; Ye, J.; Calta, N.P.; Li, Z.; Zeng, Z.; Zhang, Y.; Chen, W.; Roehling, T.T.; et al. Additively manufactured hierarchical stainless steels with high strength and ductility. Nat. Mater. 2018, 17, 63–70. [Google Scholar] [CrossRef] [PubMed]
  45. Sundell, G.; Thuvander, M.; Andrén, H.O. Enrichment of Fe and Ni at metal and oxide grain boundaries in corroded Zircaloy-2. Corr. Sci. 2012, 65, 10–12. [Google Scholar] [CrossRef]
  46. Riemer, A.; Leuders, S.; Thöne, M.; Richard, H.A.; Tröster, T.; Niendorf, T. On the fatigue crack growth behavior in 316L stainless steel manufactured by selective laser melting. Eng. Fract. Mech. 2014, 120, 15–25. [Google Scholar] [CrossRef]
  47. Suryawanshi, J.; Prashanth, K.G.; Ramamurty, U. Mechanical behavior of selective laser melted 316L stainless steel. Mater. Sci. Eng. A 2017, 696, 113–121. [Google Scholar] [CrossRef]
  48. Thijs, L.; Kempen, K.; Kruth, J.-P.; Van Humbeeck, J. Fine-sructured aluminium products with controllable texture by selective laser melting of pre-alloyed AlSi10Mg powder. Acta Mater. 2013, 61, 1809–1819. [Google Scholar] [CrossRef] [Green Version]
  49. Thijs, L.; Sistiaga, M.L.M.; Wauthle, R.; Xie, Q.; Kruth, J.-P.; Van Humbeeck, J. Strong morphological and crystallographic texture and resulting yield strength anisotropy in selective laser melted tantalum. Acta Mater. 2013, 61, 4657–4668. [Google Scholar] [CrossRef]
  50. Dinda, G.P.; Dasgupta, A.K.; Mazumder, J. Texture control during laser deposition of nickel-based superalloy. Scr. Mater. 2012, 67, 503–506. [Google Scholar] [CrossRef]
  51. Popovich, V.A.; Borisov, E.V.; Popovich, A.A.; Sufiiarov, V.S.; Masaylo, D.V.; Alzina, L. Functionally graded Inconel 718 processed by additive manufacturing: Crystallographic texture, anisotropy of microstructure and mechanical properties. Mater. Des. 2017, 114, 441–449. [Google Scholar] [CrossRef]
  52. Geiger, F.; Kunze, K.; Etter, T. Tailoring the texture of IN738LC processed by selective laser melting (SLM) by specific scanning strategies. Mater. Sci. Eng. A 2016, 661, 240–246. [Google Scholar] [CrossRef]
  53. Song, J.; Deng, Q.; Chen, C.; Hu, D.; Li, Y. Rebuilding of metal components with laser cladding forming. Appl. Surf. Sci. 2006, 252, 7934–7940. [Google Scholar] [CrossRef]
  54. Majumdar, J.D.; Pinkerton, A.; Liu, Z.; Manna, I.; Li, L. Mechanical and electrochemical properties of multiple-layer diode laser cladding of 316L stainless steel. Appl. Surf. Sci. 2005, 247, 373–377. [Google Scholar] [CrossRef] [Green Version]
  55. Lin, X.; Yue, T.M.; Yang, H.O.; Huang, W.D. Laser rapid forming of SS316L/Rene88DT graded material. Mater. Sci. Eng. A 2005, 391, 325–336. [Google Scholar] [CrossRef]
  56. Zhang, K.; Wang, S.; Liu, W.; Shang, X. Characterization of stainless steel parts by laser metal deposition shaping. Mater. Des. 2014, 55, 104–119. [Google Scholar] [CrossRef]
  57. Chen, X.H.; Lu, J.; Lu, L.; Lu, K. Tensile properties of a nanocrystalline 316L austenitic stainless steel. Scr. Mater. 2005, 52, 1039–1044. [Google Scholar] [CrossRef]
  58. Clement, K.; Marnier, G.; Tabalaiev, K.; Hug, E.; Noudem, J. Spark plasma sintering of ultrafine grained AISI 316L and functional properties characterization. In Proceedings of the 2015 International Conference on Powder Metallurgy & Particulate Materials, San Diego, CA, USA, 17–20 May 2015; Bingert, S.R., Luk, S.H., Eds.; Metal Powder Industries Federation: Princeton, NJ, USA, 2015. [Google Scholar]
  59. Wang, H.; Shuro, I.; Umemoto, M.; Ho-Hung, K.; Todaka, Y. Annealing behavior of nano-crystalline austenitic SUS316L produced by HPT. Mater. Sci. Eng. A 2012, 556, 906–910. [Google Scholar] [CrossRef]
  60. Cherry, J.A.; Davies, H.M.; Mehmood, S.; Lavery, N.P.; Brown, S.G.R.; Sienz, J. Investigation into the effect of process parameters on microstructural and physical properties of 316L stainless steel parts by selective laser melting. Int. J. Adv. Manuf. Technol. 2015, 76, 869–879. [Google Scholar] [CrossRef]
  61. Padilha, A.F.; Plaut, R.L.; Rios, P.R. Annealing of cold-worked austenitic stainless steels. ISIJ Int. 2003, 43, 135–143. [Google Scholar] [CrossRef]
  62. Krakhmalev, P.; Yadroitsava, I.; Fredriksson, G.; Yadroitsev, I. Microstructural and thermal stability of selective laser melted 316L stainless steel single tracks. S. Afr. J. Ind. Eng. 2017, 28, 12–19. [Google Scholar] [CrossRef]
  63. Saeidi, K.; Gao, X.; Lofaj, F.; Kvetková, L.; Shen, Z.J. Transformation of austenite to duplex austenite-ferrite assembly in annealed stainless steel 316L consolidated by laser melting. J. Alloys Compd. 2015, 633, 463–469. [Google Scholar] [CrossRef]
  64. Gray Iii, G.T.; Livescu, V.; Rigg, P.A.; Trujillo, C.P.; Cady, C.M.; Chen, S.R.; Carpenter, J.S.; Lienert, T.J.; Fensin, S.J. Structure/property (constitutive and spallation response) of additively manufactured 316L stainless steel. Acta Mater. 2017, 138, 140–149. [Google Scholar] [CrossRef]
  65. ASM International. Specialty steels and heat-resistant alloys. In ASM Handbook, Volume 1: Properties and Selection: Irons, Steels, and High-Performance Alloys; ASM International: Materials Park, OH, USA, 1990; pp. 755–1006. ISBN 978-0-87170-377-4. [Google Scholar]
Figure 1. (a) Scanning strategy used to manufacture laser powder bed fusion (LPBF) 316 L; (b) microstructure of the LPBF 316 L steel, optical micrograph.
Metals 08 00643 g001
Figure 2. (a) Scanning electron microscopy (SEM) micrograph of the etched cross section of the LPBF 316 L. Colony boundaries are marked by a dashed line; (b) channeling contrast SEM image of a cross section of the LPBF 316 L single track; (c) an electron back-scattering diffraction (EBSD) orientation map of the marked in the (b) region; grains 1, 2, and 3 illustrate the epitaxial nucleation of colonies from the substrate. Reproduced from [7], with permission from Elsevier, 2013.
Metals 08 00643 g002
Figure 3. (a) Bright-field transmission electron microscopy (TEM) image of the cells oriented perpendicular to the observation direction; (b) Bright-field TEM image of the cells oriented parallel to the observation direction, diffraction pattern illustrates the <100> fcc zone axis orientation of the cells; (c) nanoparticles observed in the microstructure of LPBF 316 L steel marked by arrows; and (d) TEM energy dispersive X-ray (EDX) spectra taken from one of the particle illustrated in (c).
Metals 08 00643 g003
Figure 4. Variations of primary cell spacing in dependence on a location within the single track. Adopted from [7], with permission from Elsevier, 2013.
Metals 08 00643 g004
Figure 5. (a) Variation of Fe, Cr, and Si in Specimen 1, box size 15 × 15 × 225 nm3. (b) Variation of Fe, Cr, and Si in Specimen 2, box size 20 × 20 × 225 nm3. The area enriched with Cr is marked with an arrow. (c) TEM image of a needle used for APT investigations; and (d) Cr and Mo 1D profile obtained from Specimen 2.
Metals 08 00643 g005aMetals 08 00643 g005b
Figure 6. (a) EBSD map of the longitudinal cross section with example of lattice orientation of colonies; and (b) EBSD map illustrating high- and low-angle boundaries between and inside colonies. Red color—misorientation < 10°, black color—misorientation > 10°.
Metals 08 00643 g006
Figure 7. (a) Schematic representation of colony growth at the selected building strategy. X0 and Y0 represent the laser scanning directions, X1 and Y1 represent the colony growth directions. The zig-zag line represents change in colony growth direction as the 3D layer-by-layer object is built. (b) Channeling contrast SEM image of the cross section made parallel to the X1 and Y1 directions, as denoted in Figure 1a. The zig-zag pattern is clearly visible. (c) EBSD map taken from the same area as (b). Preferential growth directions <100> are marked with arrows; (d) Etched SEM micrograph illustrating epitaxial nucleation and formation of the solidification texture in LPBF 316 L stainless steel. White arrows correspond to the growth direction of cells within colonies.
Metals 08 00643 g007
Figure 8. Dependence of microhardness of 316 L stainless steel on primary cell spacing and grain size in LPBF and conventional coarse- and nano-grained 316 L steel [19,22,23,36,53,54,55,56,57,58,59].
Metals 08 00643 g008
Figure 9. SEM images illustrating microstructures of LPBF 316 L steel in (a) as-built, and after 15 min annealing, (b) at 800, and (c) at 900 °C.
Metals 08 00643 g009
Figure 10. (a) Changes of primary cell spacing and microhardness of LPBF 316 L stainless steel depending on heat treatment; and (b) bright-field TEM image of the nanoparticles and dislocations after annealing.
Metals 08 00643 g010

